Embed Size (px)
Citation preview
USING BIM TO CALCULATE ACCURATE
BUILDING MATERIAL QUANTITIES
FOR EARLY DESIGN PHASE
LIFE CYCLE ASSESSMENT
BY
BRIAN BERG
Supervisor
Dr Michael Donn
A Thesis
Submitted to the Victoria University of Wellington
In Fulfilment of the Requirements for the Degree of
Master’s of Building Science
Majoring in Sustainable Engineering Systems
Victoria University of Wellington
2014

Using BIM To Calculate Accurate Building Material Quantities For Early Design Phase LCA
Author: Brian Berg
Dedication
To my friends, I appreciate you.
Using BIM To Calculate Accurate Building Material Quantities For Early Design Phase LCA
Author: Brian Berg
ACKNOWLEDGEMENTS
Michael Donn, my supervisor. Thank you.
Liz Root, for going above, and beyond to provide the building case study information, without
which this research would not have been possible. Thank you.
David Dowdell, for your help and most importantly, your patience. Thank you.
Samuel and Haruka, for everything. Thank you.
My morning, afternoon, and anytime in-between coffee crew.
The Building Research Association of New Zealand (BRANZ), thank you for the scholarship
financial support.
The New Zealand Green Building Council, thank you for providing the building case study
information.
Using BIM To Calculate Accurate Building Material Quantities For Early Design Phase LCA
Author: Brian Berg
ABSTRACT
This research simplifies the calculation of the Initial Embodied Energy (iEE) for commercial
office buildings. The result is the improved integration of Life Cycle Assessment (LCA)
assessments of building materials into the early stages of the building design process (sketch
design). This maximises the effectiveness of implementing design solutions to lower a
building’s environmental impact.
This thesis research proposes that building Information Models (BIM) will make calculating
building material quantities easier, to simplify LCA calculations, all to improve their
integration into existing sketch design phase practices, and building design decisions. This is
achieved by developing a methodology for using BIM LCA tools to calculate highly detailed
material quantities from a simple BIM model of sketch design phase building information. This
is methodology is called an Initial Embodied Energy Building Information Model Life Cycle
Assessment Building Performance Sketch (iEE BIM LCA BPS). Using this methodology
calculates iEE results that are accurate, and represent a sufficient proportion (complete) of a
building’s total iEE consumption, making them useful for iEE decision-making.
iEE is one example of a LCA-based indicator that was used to test, and prove the feasibility of
the iEE BIM LCA BPS methodology. Proving this, the research method tests the accuracy
that a BIM model can calculate case study building’s building material quantities. This included
developing; a methodology for how to use the BIM tool Revit to calculate iEE; a functional
definition of an iEE BIM LCA BPS based on the environmental impact, and sketch design
decisions effecting building materials, and elements; and an EE simulation calibration accuracy
assessment methodology, complete with a function definition of the accuracy required of an
iEE simulation to ensure it’s useful for sketch design decision-making.
Two main tests were conducted as part of proving the iEE BIM LCA BPS’ feasibility. Test one
assessed and proved that the iEE BIM LCA BPS model based on sketch design information
does represent a sufficient proportion (complete) of a building’s total iEE consumption, so
Using BIM To Calculate Accurate Building Material Quantities For Early Design Phase LCA
Author: Brian Berg
that are useful for iEE decision-making. This was tested by comparing the building material
quantities from a SOQ (SOQ) produced to a sketch design level of detail (truth model 3), to
an as-built level of detail, defined as current iEE best practices (truth model 1). Subsequent to
proving that the iEE BIM LCA BPS is sufficiently complete, test two assessed if a BIM model
and tool could calculate building material quantities accurately compared to truth model 3.
The outcome was answering the research question of, how detailed does a BIM model need
to be to calculate accurate building material quantities for a building material LCA (LCA)
assessment?
The inference of this thesis research is a methodology for using BIM models to calculate the
iEE of New Zealand commercial office buildings in the early phases of the design process.
The outcome was that a building design team’s current level of sketch design phase
information is sufficiently detailed for sketch design phase iEE assessment. This means, that
iEE and other LCA-based assessment indicators can be integrated into a design team’s
existing design process, practices, and decisions, with no restructuring required.
Using BIM To Calculate Accurate Building Material Quantities For Early Design Phase LCA
Author: Brian Berg
TABLE OF CONTENTS
1 THESIS RESEARCH AIMS AND OBJECTIVES ............................................... 15
1.1 Introduction ................................................................................................................................. 15
1.2 Context, And Problem Statement ......................................................................................... 15
1.3 Research Strategy ....................................................................................................................... 21
1.3.1 The Research Problem, Aim, Question, And Hypothesis ...................................... 21
1.3.2 The Research Scope ......................................................................................................... 22
1.4 Significance Of Study .................................................................................................................. 28
2 CALCULATING ENVIRONMENTAL IMPACT IN THE BUILT
ENVIRONMENT ........................................................................................................ 31
2.1 Chapter Intent ............................................................................................................................. 31
2.2 Calculating And Designing To Reduce A Building’s Environmental Impact ................. 32
2.2.1 What Is Environmental Impact? ..................................................................................... 32
2.2.2 The Building Design Process And Informed Decision-Making .............................. 35
2.2.3 Informed Decision-Making, Building Performance Simulation Tools, And The
Design Process ..................................................................................................................................... 37
2.3 The Problem With Existing Building Material LCA Assessments .................................. 38
2.3.1 Reducing Building Material LCA Calculation Complexity ....................................... 40
2.3.2 LCA Tools For Calculating Building Material Coefficients ..................................... 40
2.3.3 BIM LCA Tools .................................................................................................................. 41
2.4 How Effective Are BIM LCA Tools? ...................................................................................... 43
2.4.1 Are BIM LCA Tools Capable Of Improving Integration? ........................................ 43
2.4.2 BIM LCA Tools, Capable But Used Ineffectively ....................................................... 44
2.5 How To Use BIM LCA Tools Effectively? ............................................................................ 48
2.5.1 The Building Performance Sketch (BPS) ...................................................................... 48
2.5.2 A BIM LCA Building Performance Sketch (BPS) ....................................................... 48
2.5.3 Sketch Design Decision-Making And Simulation Accuracy .................................... 49
2.6 The Problem, Calculating Material Quantities .................................................................... 51
Using BIM To Calculate Accurate Building Material Quantities For Early Design Phase LCA
Author: Brian Berg
2.6.1 Testing Sketch Vs. Detailed Models For Calculating Building Material
Quantities .............................................................................................................................................. 52
2.7 Chapter Inference ...................................................................................................................... 56
3 RESEARCH METHODOLOGY ......................................................................... 57
3.1 Chapter Intent ............................................................................................................................. 57
3.2 Research Design And Objectives ........................................................................................... 58
3.2.1 The Thesis Hypothesis Testing Process ...................................................................... 58
3.2.2 The Relationship Between LCA And EE ..................................................................... 60
3.2.3 Research Variables ............................................................................................................ 63
3.2.4 Research Objectives / Steps ........................................................................................... 65
3.3 Selecting A Research Methodology ....................................................................................... 66
3.3.1 Prevalent Research Methodologies In EE ................................................................... 66
3.3.2 Selected Research Methodology: Single-Case Study ................................................ 68
3.4 Case Study Research Design ................................................................................................... 68
3.4.1 Case Study Description ................................................................................................... 68
3.5 Limitations Of Case Study Research Design ....................................................................... 69
3.5.1 Research Generalisability And Representativeness.................................................. 70
3.5.2 Research Validity ............................................................................................................... 74
3.6 Chapter Inference ...................................................................................................................... 76
4 THE METHODOLOGY OF THE BIM LCA BPS ............................................. 77
4.1 Chapter Intent ............................................................................................................................. 77
4.2 Defining An iEE BIM LCA BPS Model ................................................................................... 78
4.2.1 What To Model For A BIM LCA BPS Of iEE ............................................................ 81
4.3 An iEE Modelling Methodology For Revit ............................................................................ 86
4.3.1 Selecting A Building Material Coefficient Database .................................................. 89
4.3.2 Sketching EE In The Revit BIM Tool ............................................................................ 98
4.4 Chapter Inference .................................................................................................................... 105
5 THE ACCURACY ASSESSMENT FRAMEWORK FOR THE BIM LCA BPS
106
5.1 Chapter Intent ........................................................................................................................... 106
Using BIM To Calculate Accurate Building Material Quantities For Early Design Phase LCA
Author: Brian Berg
5.2 Defining Simulation Accuracy, And Precision .................................................................. 107
5.3 Assessing Simulation Accuracy ............................................................................................. 107
5.4 Existing Calibration Accuracy Assessment ....................................................................... 109
5.5 Developing An EE Calibration Method .............................................................................. 114
5.5.1 Defining The ‘True’ Value Of A Building’s EE Consumption .............................. 114
5.5.2 Defining ‘How Close’ Is Close Enough: EE Maximum Calibration Tolerances
115
5.5.3 The Functional Definition Of EE LCA Calibration Tolerances .......................... 117
5.6 Chapter Inference ................................................................................................................... 119
6 ACCURACY ASSESSMENT RESULTS AND DISCUSSION ....................... 120
6.1 Chapter Intent .......................................................................................................................... 120
6.2 Test One: Is A Sketch Design iEE BPS Assessment Complete Enough? ................... 121
6.2.1 Why Test Completeness? ............................................................................................ 121
6.2.2 Selecting Truth Model EE Material Coefficients ..................................................... 122
6.2.3 Calculating Truth Model Building Material Quantities .......................................... 129
6.2.4 Calculating EE Truth Models ....................................................................................... 133
6.3 Test Two: Does A BIM Model Calculate Accurate iEE BIM LCA BPS Results? ...... 143
6.3.1 A Recap Of The Testing Process: .............................................................................. 143
6.3.2 Pre-Calibration Accuracy Assessment Of The Revit iEE BIM LCA BPS .......... 143
6.3.3 Post Calibration Accuracy Assessment Of The iEE BIM LCA BPS Method ... 148
6.4 Test Three: Is The Revit iEE BIM LCA BPS Model Robust? ......................................... 155
6.4.1 EE & Embodied Carbon Dioxide ................................................................................ 155
6.4.2 Cancellation Errors In The BIM Geometry ............................................................. 157
6.5 Modelled Detail Of The Pre-Calibration Revit iEE BIM BPS ........................................ 158
6.5.1 How Detailed Is The Revit Pre-Calibration BIM Model? ..................................... 159
6.5.2 How Was Revit Used To Construct The iEE BIM BPS? ...................................... 167
7 THESIS CONCLUSIONS ................................................................................. 171
7.1 Conclusions Surrounding The Failings Of BIM LCA Tools .......................................... 171
7.2 Proving The Thesis Hypothesis ............................................................................................ 173
7.2.1 Conclusions: Is A Sketch Design iEE BPS Assessment Complete Enough? ..... 173
Using BIM To Calculate Accurate Building Material Quantities For Early Design Phase LCA
Author: Brian Berg
7.2.2 Conclusions: Does A BIM Model Calculate Accurate iEE BIM LCA BPS Results?
175
7.3 Answering The Thesis Research Question: ...................................................................... 176
7.3.1 How Detailed Is An Accurate iEE BIM LCA BPS Model? ..................................... 176
7.4 iEE And LCA Conclusions Beyond This Research ........................................................... 177
7.5 Key Outputs Of Thesis Research ........................................................................................ 178
7.6 BIM Conclusions Beyond This Research ............................................................................ 179
Level Of Development Specification ................................................................................................. 201
Using BIM To Calculate Accurate Building Material Quantities For Early Design Phase LCA
Author: Brian Berg
LIST OF FIGURES, GRAPHS, AND TABLES
Table 1.2: An Example Of The Relationship Between LCI and LCIA Results ............................... 16
Figure 1.2: BIM Maturity Diagram ............................................................................................................. 19
Table 1.3.2: The BIM LCA BPS Framework Applied To Y.L. Langston & Langston (2012) ....... 27
Table 2.2.1: Building Energy Consumption Throughout The Different Life Cycle Stages.......... 33
Table 2.2.2: Design Phases for Different Building Design Frameworks ......................................... 36
Figure 2.2.3a: Structure of Performance Criteria ................................................................................. 37
Figure 2.2.3b: The MacLeamy Concept ................................................................................................... 38
Figure 2.4.2a: Building Smart Graph Promoting the Advantages of the BIM Concept................ 46
2.5.3: Measures Of Simulation Reliability For Design Decision-Making .......................................... 50
Figure 2.6.1: The Tally BIM LCA Tool’s Example Tutorial Model .................................................... 53
Table 2.6.1: Comparing BIM Level Of Modelled Detail ...................................................................... 54
Table 3.2.2: EE Material Coefficient Calculation Methods ................................................................. 61
Graph 3.2.2: A Comparison of the Different EE Material Coefficient Calculation Methods .... 62
Table 3.2.3a: The Dependent and Independent Variables in Thesis Research Design ................ 63
Table 3.2.3b: The Intervening Variables in Thesis Research Design ................................................ 64
Table 3.2.3c: The Control Variables in Thesis Research Design ...................................................... 64
Table 3.2.3d: The Confounding Variables in Thesis Research Design ............................................. 65
Table 3.2.4: Thesis Research Objectives ................................................................................................. 66
Graph 3.3.1: Research Methodologies Prevent In EE Research ........................................................ 67
Table 3.4.1: Case Study Building Description ........................................................................................ 68
Table 3.5.1a: The New Zealand Commercial Building Stock Classification ................................... 71
Table 3.5.1b: The Built Form Typology of Strata 5 New Zealand Commercial Buildings ......... 72
Table 3.5.1c: Energy Use Intensities For Commercial Buildings ....................................................... 73
Graph 3.5.1: The Relationship between OE and Life Cycle EE for Non-Residential Case Studies
with an EUI < 100kWh/m2. ........................................................................................................................ 74
Table 4.2: The Building Element Distribution of Initial EE .................................................................. 80
Table 4.2.1a: A Framework for Defining the Building Elements Constituting an iEE BIM LCA
BPS .................................................................................................................................................................... 82

Using BIM To Calculate Accurate Building Material Quantities For Early Design Phase LCA
Author: Brian Berg
4.2.1b: The Working Definition of the Decisions and Building Information Available During
Sketch Design ................................................................................................................................................ 84
Table 4.3: The iEE BIM LCA BPS Modelling Process. .......................................................................... 89
Table: 4.3.1b: Quality Assurance Uncertainty Assessment Tools Assessed Against Section
Criteria ............................................................................................................................................................ 92
Table 4.3.2e: Selection Data Quality Indicators for EE Material Coefficients ............................... 95
Table 4.3.2f: EE Material Coefficient Selection Data Quality Pedigree Matrix Tool ................... 97
Figure 4.3.2a: BIM Maturity Diagram ....................................................................................................... 99
Figure 4.3.2b: BIM Tool Revit Modelling Tools ................................................................................... 100
Table 4.3.2a: The Calculated Quantity Information Available Using Revit .................................. 101
Table 4.3.2b: A Solution for the Material Quantity Format Problem ........................................... 101
Table 4.3.2c: UniClass 2.0 Classification Code Structure ................................................................ 103
Table: 4.3.2d: iEE and LCA Results Format Guidelines..................................................................... 104
Figure 5.4: Generalised Simulation Calibration Methodology/Process. ........................................ 111
Table 5.4a: Acceptable Calibration Tolerances .................................................................................. 112
Table 5.4b: Equation for Calculating the Mean Bias Error (MBE). ................................................. 113
Table 5.4c: Equation for Calculating the Coefficient of Variation of Root Square Mean Error
(Cv(RSME)). .................................................................................................................................................. 113
Table 5.3.3a: Accepted Inaccuracies in Building Cost Planning ....................................................... 117
Table 5.3.3b: Functional Definition of Calibration Accuracy and Precision Tolerances........... 119
Table 6.2.2b: Data Indicator Pedigree Matrix Assessment of Alcorn’s Hybrid Process / Input-
output EE coefficients. ............................................................................................................................... 123
Table 6.2.2c: Data Indicator Pedigree Matrix Assessment of Crawford’s Hybrid Input-output /
Process EE coefficients (2004). ................................................................................................................ 124
Table 6.2.2d: Data Indicator Pedigree Matrix Assessment of European LCA Database .......... 125
Graph 6.2.2: Export and Import (NZ$ million) of Selected Building Products in 2011. .......... 127
Table 6.2.2e: EE Building Material Coefficients Used In This Research ........................................ 128
Table 6.2.3: Case Study Building Truth Models 1-3, The Building Materials Assessed ............. 130
Table 6.2.3b: Case Study Building Truth Models 1-3, The Building Elements Assessed .......... 131
Table 6.2.4a: The iEE Results Of Thesis Case Study Building Truth Models............................... 134
Graph 6.2.4a: iEE Material Analysis For Case Study Building Truth Model 1-3 .......................... 135
Table 6.2.4b: Truth Model Calibration Assessment at Material Breakdown Level ................... 136
Table 6.4.2c: Elemental Analysis Of iEE Case Study Building Truth Models 1 And 3 ............... 137
Using BIM To Calculate Accurate Building Material Quantities For Early Design Phase LCA
Author: Brian Berg
Graph 6.2.4b: iEE Elemental Analysis For Case Study Building Truth Models 2 And 3 ............ 137
Table 6.3.2d: iEE Savings From Structural Design Changes ............................................................. 138
Table 6.2.4f: Analysis Of iEE Savings Versus OE Savings ................................................................... 142
Table 6.3.2a: Pre-Calibration Accuracy Assessment at Material Level Analysis ......................... 144
Table 6.3.2b: Pre-Calibration Accuracy Assessment at Elemental Level Analysis ...................... 144
Table 6.3.2d: Difference In Building Materials Heat Strengthened Glass Sheets And Autex
GreenStuff R3.2 Insulation ........................................................................................................................ 145
Graph 6.3.2a: Pre-Calibration iEE BIM LCA BPS Material Analysis ............................................... 146
Graph 6.3.2b: Pre-Calibration iEE BIM LCA BPS Elemental Analysis ............................................ 147
Table 6.3.3a: Post Calibration Accuracy Results of Revit iEE BPS Compared to Truth Model
3 ....................................................................................................................................................................... 148
Graph 6.3.3a: Calibrated iEE BIM LCA BPS Material Analysis ......................................................... 150
Graph 6.3.3b: Calibrated iEE BIM LCA BPS Elemental Analysis ..................................................... 151
Table 6.3.3b: iEE LCA Results Expressed per BIM Object (Revit Family Type) ......................... 153
Table 6.3.3c: iEE LCA Results Expressed per Building Material per BIM Object (Revit family
type) ................................................................................................................................................................ 154
Table 6.3.3d: iEE LCA Results Expressed per Building Element ..................................................... 154
Table 6.4.1a: Revit Calculated iEE Results Using Crawford’s (2004) Hybrid EE Database ...... 156
Table 6.4.1b: Revit Calculated ECO2 Results Using Alcorn’s (2010) Hybrid ECO2
Database ........................................................................................................................................................ 157
Table 6.5.1a: BIM Modelled Detail Of iEE BIM LCA BPS .................................................................. 161
Table 6.5.1b: Modelled Detail Of BIM Objects In The iEE BIM LCA BPS .................................... 163
Table 6.5.1c: The Modelled of the Timber Stud Exterior Wall ...................................................... 165
Figure 6.5.2a: Revit Material Browser .................................................................................................... 168
Figure 6.5.2b: Solutions For Quickly Sketching Detailed BIM Objects ......................................... 169
Figure 6.5.2c: The Modelled Detail of the Double Skin Façade BIM Object ............................... 170
Appendix 4.0 Table 4.2.1a: The Working Definition of the Decisions and Building Information
Available During Sketch Design............................................................................................................... 195
Appendix 4.0 Table 4.2.1a: The Working Definition of the Decisions and Building Information
Available During Sketch Design............................................................................................................... 196
Appendix 4.0 Table 4.2.1a: The Working Definition of the Decisions and Building Information
Available During Sketch Design............................................................................................................... 197
Table 4.3.1a: Sources of Uncertainty and Variability in LCA Data ................................................. 198
Table 4.3.1c: Data Quality Pedigree Matrix ......................................................................................... 199
Using BIM To Calculate Accurate Building Material Quantities For Early Design Phase LCA
Author: Brian Berg
ABBREVIATIONS
BIM – Building Information Model
iBIM – Integrated Building Information Model. This is a level three BIM maturity model
BIM LCA BPS – Building Information Model Life Cycle Assessment Building Performance
Sketch
BPS – Building Performance Sketch
Cv(RSME) – Coefficient of Variation of Root Square Mean Error
DQI – Data Quality Indicator
DQIPM – Data Quality Indicator Pedigree Matrix
ECO2 – Embodied Carbon Dioxide
EDDST – Early Design Decision Support Tool
EE – Embodied Energy
iEE – Initial Embodied Energy
iEE BIM LCA BPS – Initial Embodied Energy Building Information Model Life Cycle
Assessment Building Performance Sketch
EE DQIPM – Embodied Energy Data Quality Indicator Pedigree Matrix
EPD – Environmental Product Declaration
EUI – Energy Use Intensity

Using BIM To Calculate Accurate Building Material Quantities For Early Design Phase LCA
Author: Brian Berg
GFA – Gross Floor Area
IDP – Integrated Design Process
LCA – Life Cycle Assessment
LCI – Life Cycle Inventory
LCIA – Life Cycle Impact Assessment
MBE – Mean Bias Error
NLA – Net Lettable Floor Area
Chapter One: Thesis Research Aims And Objectives
Using BIM To Calculate Accurate Building Material Quantities For Early Design Phase LCA
Author: Brian Berg 15
Chapter One:
1 THESIS RESEARCH AIMS AND OBJECTIVES
1.1 Introduction
How detailed does a Building Information Model (BIM) need to be to calculate accurate
material quantities for a building material Life Cycle Assessment (LCA) assessment?
Answering this question, Initial Embodied Energy (iEE) was used to define, how accurate a
LCA calculation must be for early design phase assessment, and to develop a BIM modelling
methodology to achieve it.
1.2 Context, And Problem Statement
“Every building is potentially immortal”
Stewart Brand (1994, p. 11).
LCA Environmental Framework
Brand (1994) writing in the context of a building’s future adaptability describes the idea that
buildings can last a long time. He touches on a key point; buildings inherently outlive their
original occupants. The minimum lifespan of a commercial office building in New Zealand is
50 years. Therefore, the decisions made during the design process have an environmental
impact that lasts many years.
This increased awareness of a buildings lasting environmental impacts is changing how they
are designed. Life Cycle Assessment (LCA) is an environmental framework that measures
the environmental consumption, and impact of different processes and products, including
buildings. A building LCA measures the environmental impact of all the activities and
processes, throughout the four stages of a building’s lifespan. This is from the (1)
manufacturing of building materials and products; (2) the construction of those materials and
products into a building; through the (3) operation, and maintenance; and finally the (4)
Chapter One: Thesis Research Aims And Objectives
Using BIM To Calculate Accurate Building Material Quantities For Early Design Phase LCA
Author: Brian Berg 16
demolition and disposal processes. The results are described as Life Cycle Indicators (LCI),
and Life Cycle Impact Assessment (LCIA) categories.
LCIs are environmental indicators that measure the environmental consumption of activities
and processes. Whereas, LCIA categories translate the LCI results into a measure of their
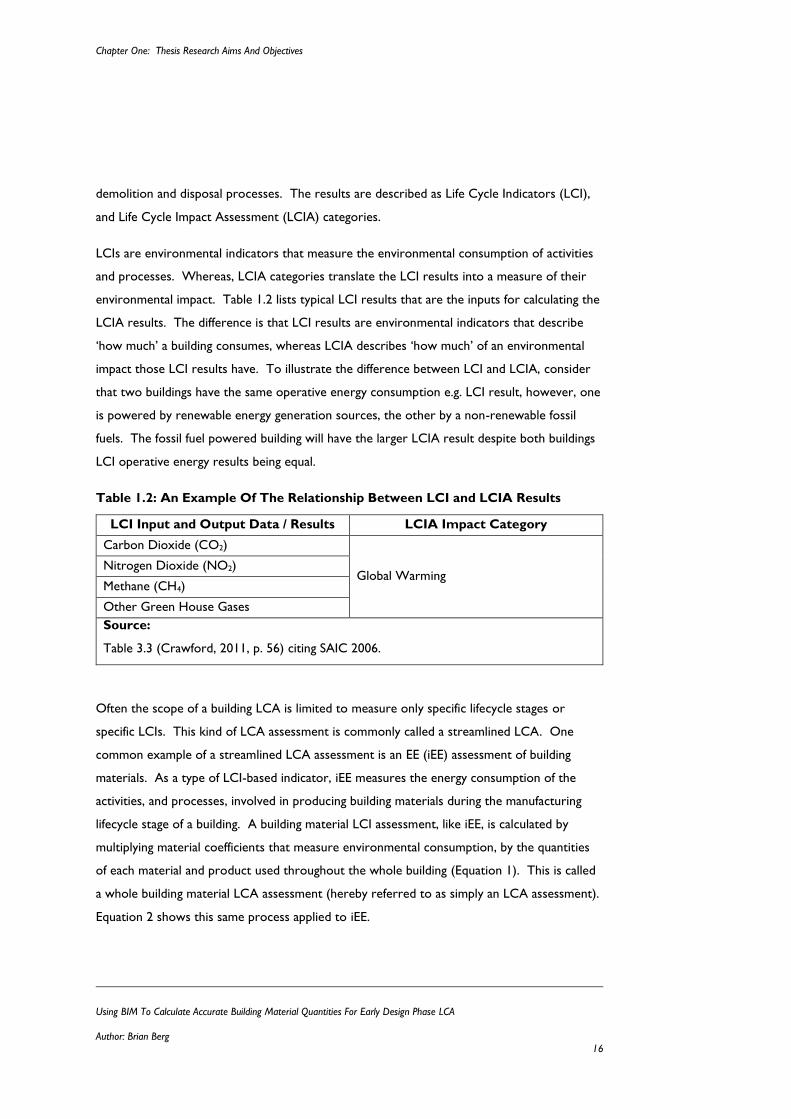
environmental impact. Table 1.2 lists typical LCI results that are the inputs for calculating the
LCIA results. The difference is that LCI results are environmental indicators that describe
‘how much’ a building consumes, whereas LCIA describes ‘how much’ of an environmental
impact those LCI results have. To illustrate the difference between LCI and LCIA, consider
that two buildings have the same operative energy consumption e.g. LCI result, however, one
is powered by renewable energy generation sources, the other by a non-renewable fossil
fuels. The fossil fuel powered building will have the larger LCIA result despite both buildings
LCI operative energy results being equal.
Table 1.2: An Example Of The Relationship Between LCI and LCIA Results
LCI Input and Output Data / Results LCIA Impact Category
Carbon Dioxide (CO2)
Global Warming Nitrogen Dioxide (NO2)
Methane (CH4)
Other Green House Gases
Source:
Table 3.3 (Crawford, 2011, p. 56) citing SAIC 2006.
Often the scope of a building LCA is limited to measure only specific lifecycle stages or
specific LCIs. This kind of LCA assessment is commonly called a streamlined LCA. One
common example of a streamlined LCA assessment is an EE (iEE) assessment of building
materials. As a type of LCI-based indicator, iEE measures the energy consumption of the
activities, and processes, involved in producing building materials during the manufacturing
lifecycle stage of a building. A building material LCI assessment, like iEE, is calculated by
multiplying material coefficients that measure environmental consumption, by the quantities
of each material and product used throughout the whole building (Equation 1). This is called
a whole building material LCA assessment (hereby referred to as simply an LCA assessment).
Equation 2 shows this same process applied to iEE.
Chapter One: Thesis Research Aims And Objectives
Using BIM To Calculate Accurate Building Material Quantities For Early Design Phase LCA
Author: Brian Berg 17
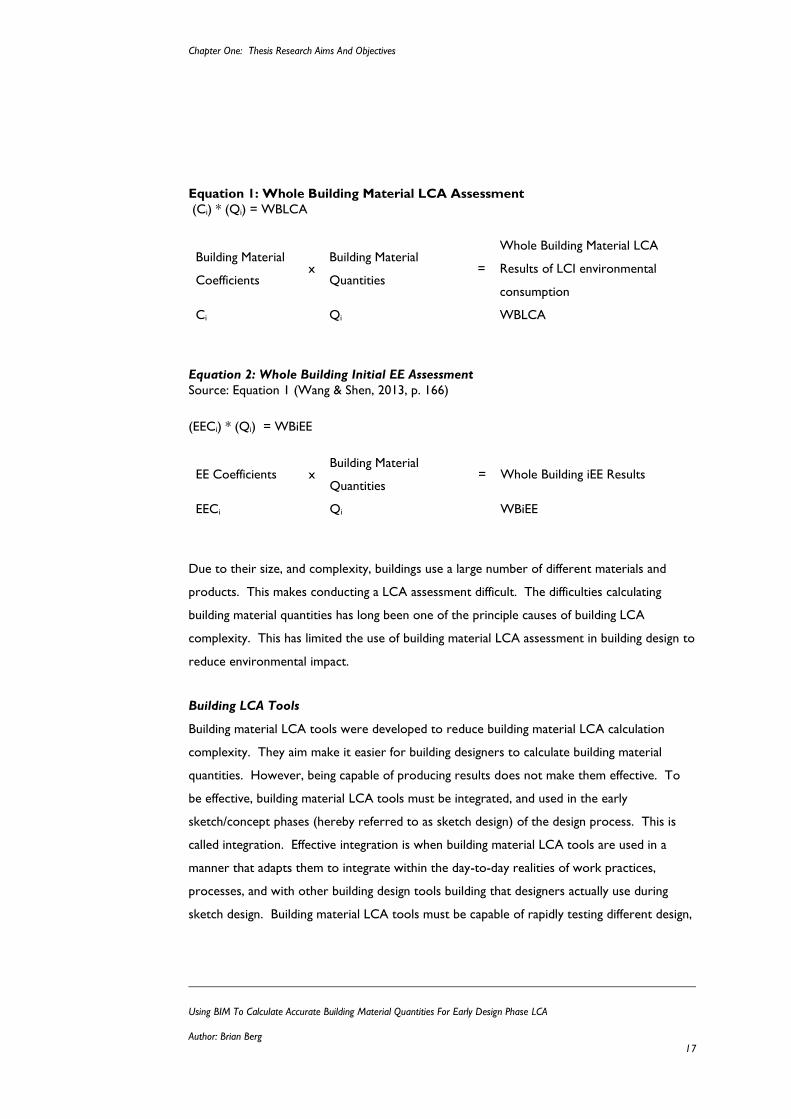
Equation 1: Whole Building Material LCA Assessment
(Ci) * (Qi) = WBLCA
Building Material
Coefficients x
Building Material
Quantities =
Whole Building Material LCA
Results of LCI environmental
consumption
Ci Qi WBLCA
Equation 2: Whole Building Initial EE Assessment
Source: Equation 1 (Wang & Shen, 2013, p. 166)
(EECi) * (Qi) = WBiEE
EE Coefficients x Building Material
Quantities = Whole Building iEE Results
EECi Qi WBiEE
Due to their size, and complexity, buildings use a large number of different materials and
products. This makes conducting a LCA assessment difficult. The difficulties calculating
building material quantities has long been one of the principle causes of building LCA
complexity. This has limited the use of building material LCA assessment in building design to
reduce environmental impact.
Building LCA Tools
Building material LCA tools were developed to reduce building material LCA calculation
complexity. They aim make it easier for building designers to calculate building material
quantities. However, being capable of producing results does not make them effective. To
be effective, building material LCA tools must be integrated, and used in the early
sketch/concept phases (hereby referred to as sketch design) of the design process. This is
called integration. Effective integration is when building material LCA tools are used in a
manner that adapts them to integrate within the day-to-day realities of work practices,
processes, and with other building design tools building that designers actually use during
sketch design. Building material LCA tools must be capable of rapidly testing different design,
Chapter One: Thesis Research Aims And Objectives
Using BIM To Calculate Accurate Building Material Quantities For Early Design Phase LCA
Author: Brian Berg 18
whilst ensuring the simulation results are accurate and trusted enough to enable the design
team to make informed design decisions.
Most existing building LCA tools fail to meet requirements of effective integration. The
difficulties in calculating building material quantities is a primary reason. In response, LCA
tools that utilise a BIM (BIM) were developed. These tools are called BIM LCA tools. BIM is
a technology used by building designers for digitally representing geometric (3D physical), and
non-geometric (functional) information or metadata. It promotes knowledge sharing, and
early design phase building performance assessment to assist design decision-making. This
definition has three ideas; the BIM concept, the BIM tool, and the BIM model.
The BIM Concept For Using BIM LCA Tools
The BIM concept defines how to use a BIM model, a BIM tool is the computer software used
to construct the BIM model, and a BIM model is the 3D digital visualization of building
information produced by the BIM tool. A BIM model consists of BIM objects, and BIM
geometry. BIM objects deal with materials and products at an individual level. A BIM object
is an assembly of these materials to represent a specific construction system. Embedded
within each of BIM object is metadata information such as LCA material coefficients.
Therefore, the information able to be calculated from a BIM model depends on the data
embedded into the BIM objects. BIM geometry is the assembly of all the BIM objects into the
building’s overall form.
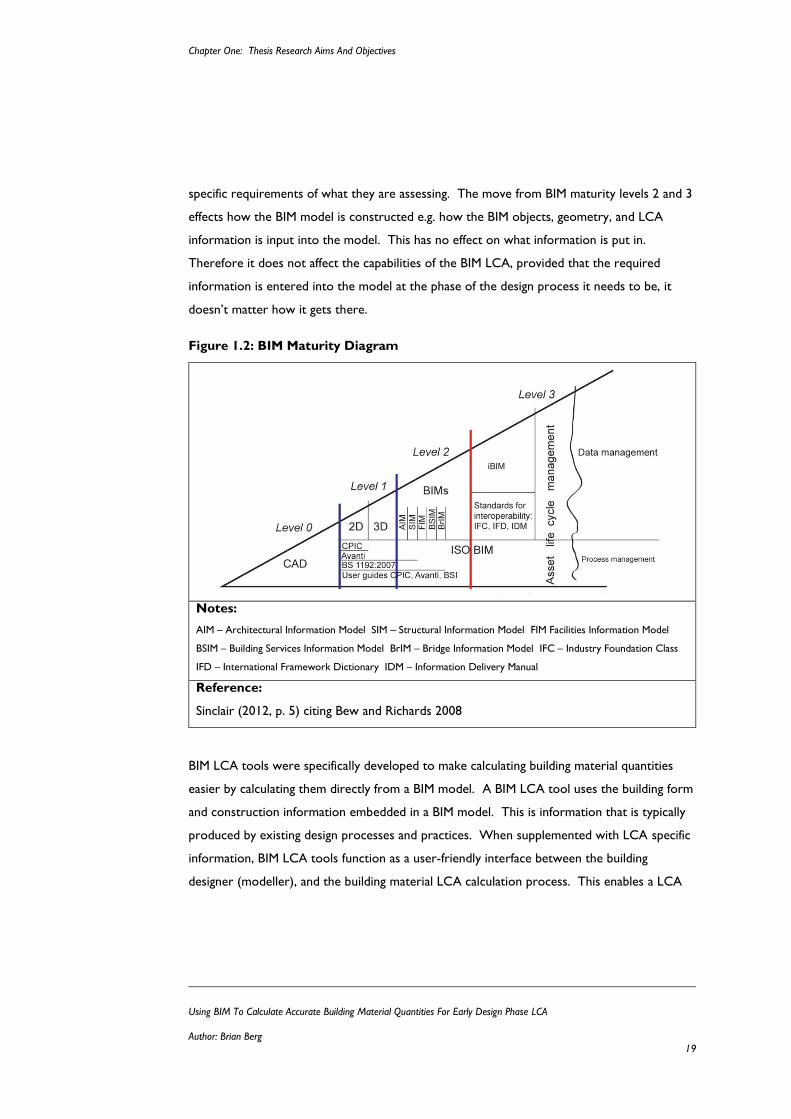
The BIM concept prescribes constructing a very detailed BIM model called a single integrated
BIM model, also known as an Information BIM or Interoperable BIM (iBIM). An iBIM model
has all the design team’s information, for all areas of building performance and building design
embedded using interoperability. This makes it a Level 3 BIM maturity model. The BIM
maturity levels (illustrated in Figure 1.2), describe the level of interoperability a BIM model is
capable of. Ranging from levels 1 to 3, level 1 is 3D CAD. Level 2 has some interoperability
capabilities, but still requires each design member to construct and maintain their own
specific BIM models for their area of building design. At this level, the BIM D’s; 4D (Time)
BIM, 5D (Cost) BIM, and 6D (Facilities Management) BIM are capable information outputs.
From a building performance assessment perspective, often a specific BIM model is required
specialising in energy, daylighting, or LCA. These BIM models are often simplified to the
Chapter One: Thesis Research Aims And Objectives
Using BIM To Calculate Accurate Building Material Quantities For Early Design Phase LCA
Author: Brian Berg 19
specific requirements of what they are assessing. The move from BIM maturity levels 2 and 3
effects how the BIM model is constructed e.g. how the BIM objects, geometry, and LCA
information is input into the model. This has no effect on what information is put in.
Therefore it does not affect the capabilities of the BIM LCA, provided that the required
information is entered into the model at the phase of the design process it needs to be, it
doesn’t matter how it gets there.
Figure 1.2: BIM Maturity Diagram
Notes:
AIM – Architectural Information Model SIM – Structural Information Model FIM Facilities Information Model
BSIM – Building Services Information Model BrIM – Bridge Information Model IFC – Industry Foundation Class
IFD – International Framework Dictionary IDM – Information Delivery Manual
Reference:
Sinclair (2012, p. 5) citing Bew and Richards 2008
BIM LCA tools were specifically developed to make calculating building material quantities
easier by calculating them directly from a BIM model. A BIM LCA tool uses the building form
and construction information embedded in a BIM model. This is information that is typically
produced by existing design processes and practices. When supplemented with LCA specific
information, BIM LCA tools function as a user-friendly interface between the building
designer (modeller), and the building material LCA calculation process. This enables a LCA
Chapter One: Thesis Research Aims And Objectives
Using BIM To Calculate Accurate Building Material Quantities For Early Design Phase LCA
Author: Brian Berg 20
assessment to be conducted using design tools, and practices that building designers already
use and do.
Compared to non-BIM LCA tools, BIM LCA tools allow better integration of the LCA
environmental framework into the design process. They have all the necessary capabilities,
but lack a methodology for how to integrate and use them effectively during sketch design.
The BIM concept is ineffective for this purpose because constructing the required iBIM
models is too time consuming.
The Building Performance Sketch For Using BIM LCA Tools
As a response, to solve the issues with the BIM concept, Donn et al,. (2012) developed the
Building Performance Sketch (BPS). The BPS abandons the BIM concept’s idea of using an
iBIM model to calculate all areas of building performance. Instead, it dictates using one model
to calculate one area of building performance. This means the model can be simpler so that
design iterations can be tested faster, and more easily, without comprising simulation
accuracy. As a result, for each area of building performance, a unique BPS model must be
created that is sufficiently detailed to calculate results that are accurate enough for building
designers to make design decisions. The limitation of using the BPS concept to solve the
methodology issues with BIM LCA tools is that Donn et al,. (2012) did not define what an iEE
BPS is. Missing are definitions for:
The measurable criteria of iEE simulation accuracy for decision-making.
What must building information must be modelled, and how detailed it must be to
produce results that satisfy decision-making simulation accuracy requirements?
Resolving the ineffective integration of BIM LCA tools by developing an iEE BPS focuses on
the relationship between the calculation of building material quantities, the detail of the BIM
model’s objects and geometry, and the overall accuracy of the simulation results. This is
placed in the context of sketch design, where simulations must be quick, easy, but most
importantly accurate. Therefore the problem statement of this research is:
There is a need to define the detailed required of a BIM model to calculate building
material quantities for an accurate building material LCA assessment during sketch
design.
Chapter One: Thesis Research Aims And Objectives
Using BIM To Calculate Accurate Building Material Quantities For Early Design Phase LCA
Author: Brian Berg 21
1.3 Research Strategy
1.3.1 The Research Problem, Aim, Question, And Hypothesis
The building material LCA assessment process is too complex, causing poor and ineffective
integration into building designer’s sketch design processes, practices, and decisions. This has
limited their use of the LCA framework as a design tool for assisting building designers to
lower the environmental impact of building designs (Bribián, Usón, & Scarpellini, 2009;
Crawford, 2011; International Energy Agency, 2004a).
BIM LCA tools have been developed, specifically to resolve these problems of poor
integration of LCA into the design process. They have the requisite capabilities, but this
research argues that they are used incorrectly, which causes excessive modelling time and
effort, resulting in their failure to achieve effective integration. This incorrect use is caused
by not having a robust methodology for how to use them to effectively integrate the LCA
environmental framework for building materials into early concept/sketch design. Lacking a
methodology, one must be developed.
Therefore, the aim of this thesis research is:
To improve the integration of LCA into the early phases of the design process
(sketch design) by developing a methodology for using BIM LCA tools.
The fundamental principle in developing a methodology for the correct usage of BIM LCA
tools is making the calculation process easier, by reducing modelling time, and maintaining
required simulation accuracy for decision-making. Within the BIM LCA calculation process,
constructing the BIM model to calculate building material quantities is the largest contributor
to modelling time. The BIM model must be sufficiently detailed to produce accurate results,
but simple enough to be quickly, and easily constructed. Defining how detailed a BIM model
must be to achieve this, is the critical definition in developing a methodology for the use of
BIM LCA tools that enables their effective into early concept/sketch design.
Therefore, the research question of this thesis is:
Chapter One: Thesis Research Aims And Objectives
Using BIM To Calculate Accurate Building Material Quantities For Early Design Phase LCA
Author: Brian Berg 22
How detailed does a BIM model need to be to calculate accurate building
material quantities for a building material LCA (LCA) assessment?
The Building Research Association of New Zealand (BRANZ), is currently conducting a
research project titled “Whole Building Whole of Life” (WBWL). The project is developing a
type of LCA environmental framework (product category rules) for a New Zealand called
Environment Product Declaration (EPD). The output of this study is a database of LCI
material coefficients for New Zealand building materials, and products. 13 different LCIA,
and 7 different LCI-based environmental indicators have been identified as preferred outputs
to help building designer facilitate sustainable design. However, at this time, the New Zealand
construction industry does not have the building material or product coefficients for each of
the 20 indicators. Developing these indicators, and simultaneously testing the detail required
of a BIM model for each could easily form a thesis for each. Instead, this research focusses
on a single LCI-based indicator, iEE (iEE), to prove the feasibility of using a BIM LCA tool to
produce an accurate LCA-based result.
Therefore, the hypothesis of this thesis is that:
Defining the accuracy required for EE (iEE) simulations, a BIM model of
sketch design detail will calculate building material quantities accurately
enough for a building material LCA assessment.
Testing this hypothesis, the BIM calculated material quantities are compared to a Schedule Of
Quantities (SOQ) that is defined as 100% accurate by normalising them both to iEE values.
The iEE difference between the two is the measure of the BIM model’s simulation accuracy.
If high enough, this proves the BIM calculated material quantities are sufficiently detailed.
1.3.2 The Research Scope
Developing a methodology for how to use BIM LCA tools during sketch design focuses this
thesis research scope on calculating building material quantities. Other problems such as
inaccuracies in LCI material coefficients exist. However, it’s the complexities involved in
calculating building material quantities that is the largest obstacle effecting building designers.
Therefore, this thesis tests the detail required of a BIM model to calculate the accurate
Chapter One: Thesis Research Aims And Objectives
Using BIM To Calculate Accurate Building Material Quantities For Early Design Phase LCA
Author: Brian Berg 23
quantities of building materials using iEE, not on an assessment of the environmental impact
(LCIA), or the sustainability of any one building.
The complexity, and time restrictions of a master’s thesis have prescribed scope restrictions
to this research. These are discussed in the sections.
Initial Embodied Energy And LCA
Limiting the calculation of LCA results to only iEE effects the generalisability of the research
conclusions defining the modelled detail required for a BIM LCA BPS. Different
environmental indicators have different intensities of environmental consumption, and impact
for the same materials. If this thesis hypothesis was tested for a different environmental
indicator, for example Embodied Carbon Dioxide (ECO2), the BIM LCA BPS may require a
different level of modelled detail to achieve simulation accuracy requirements. The
robustness testing in Chapter Section 6.4 assesses this risk to determine if it is a problem.
By using Alcorn’s (2010) database of EE material coefficients, the scope of the resulting iEE
assessment is defined by the scope of the hybrid process/input-output method of measuring
the EE of building materials. This defines the iEE assessment as ‘cradle to (factory) gate’
assessment. All the life-cycle stages outside of the manufacturing phase e.g. construction,
operation, and demolition are excluded. This is a common EE scope exclusion in published
research.
Simulation Accuracy
At the core of BIM LCA integration issues and defining an iEE BPS model is simulation
accuracy. In building performance simulation, accuracy is the measure of ‘how close’
simulation results (values) are to the measured performance of the building in reality. These
measurements of reality are called the ‘true values’. Simulation accuracy is the product of all
the simulation errors in the simulation data inputs, and calculation processes. For building
material LCA assessments, these are errors in the material coefficients, and the material
quantities.
Neither LCA nor iEE have definitions for ‘true value’ or ‘how close’. Chapter Section 5.5.3
defines the ‘true value’ of iEE consumption as the product of the multiplication of hybrid EE
Chapter One: Thesis Research Aims And Objectives
Using BIM To Calculate Accurate Building Material Quantities For Early Design Phase LCA
Author: Brian Berg 24
material coefficients by the building case study’s ‘truth model’ SOQ database. Defining ‘how
close’ is more ambiguous. It is governed by decision-making, building project performance
goals, and the specific design process phase an iEE assessment simulation is being conducted
in. The earlier in the design process, the less accuracy is required, as poorer design
resolution, and the higher likelihood of design changes, both allow fine tuning of the design to
meet performance goals. This thesis research uses the Mean Bias Error (MBE) values
between ±10-20%, and Coefficient of Variation of Root Square Mean Error (Cv(RSME))
values between 15-30% as the metrics for describing, and assessing simulation accuracy, and
precision respectfully. The MBE values are derived from cost planning requirement for
sketch design phase assessment. This is the most appropriate basis for LCA, and iEE. The
Cv(RSME) is from OE calibration.
Truth Model Material Quantities Database
The completeness of the ‘truth model’ database of building material quantities is a scope
limitation. This database is not a complete inventory of every individual material, or building
product used in the final building. It was assembled to a level of completeness to meet
existing best practice standards. Therefore, calibrating the iEE BIM LCA BPS models to
match, defines them as accurate to the current best practice methods for calculating a
building’s material quantities. A study of how detailed building material quantities must be for
an iEE assessment is a separate research question. Answering this question would redefine
established best practices. This is not the aim of this thesis. This thesis’ intent is to make
achieving best practice easier.
BIMs (BIM) And Interoperability
The BIM models developed in this thesis correspond to BIM maturity level 2. A fully
interoperable level 3 BIM model was not required, as project sharing between different
project participants was not needed. Consequently, interoperability supporting BIM
standards such as IFC, and IFD, were not adhered to. Instead the native file structure of the
selected BIM tool, AutoDesk’s Revit 2014 was used. This has no effect on testing the level of
detail required of the BIM model to calculate accurate building material quantities.
Chapter One: Thesis Research Aims And Objectives
Using BIM To Calculate Accurate Building Material Quantities For Early Design Phase LCA
Author: Brian Berg 25
Conclusions drawn from the New Zealand National BIM Survey (Construction Information
Ltd, 2013) state the New Zealand construction industry does not currently use BIM maturity
level 3 BIM models. This thesis’ intent is to develop conclusions that can be used in current
industry practices. As a result, level 3 BIM is not appropriate. Currently the New Zealand
construction industry lacks the tools required to use of level 2 BIM models to their full
capabilities. Lacking are tools and standards such as; an ISO 12006-2 compliant building
classification system; a national BIM standard; a standard defining of BIM level of detail; and a
national BIM library of objects with metadata product information embedded in the BIM
objects. Where necessary to test this thesis hypothesis, has used standards such as the UK’s
UniClass 2.0 (an ISO 12006-2 compliant building classification system), and the USA’s Level of
Development Specification For BIMs (Level of Development Specification, 2013) have been
used.
Design Process
Since no two buildings are the same the unique nature of buildings compared to other mass
produced products, means defining a single design process that describes all building projects
is impossible. Each is different to cater to the unique challenges and performance
requirements of a building. This thesis develops a functional definition of the design process
based on generic building design frameworks such as; the American Institute of Architects
(AIA) (American Institute of Architects (AIA), 2007); the Royal Institute of British Architects
(RIBA) Plan of Work prior to 2013 (Ostime, 2013); and the New Zealand Construction
Industry Council (NZCIC) (New Zealand Construction Institute Council (NZCIC), 2004).
This working definition defines the for this thesis’ methodology the information available at
each phase of the design process.
The design process defines the information about building form, construction, and materials,
at each phase of the design process. This information is used to construct BIM models to
test if the information produced by existing design processes and practices used by the
building design team in the early phases of the design process is detailed enough to produce
an accurate LCA result. This determines at what phase of the design process BIM LCA can
be integrated. As an alternative to defining the design process, accessing the specific building
documentation for each phase to determine the information available at each phase would
Chapter One: Thesis Research Aims And Objectives
Using BIM To Calculate Accurate Building Material Quantities For Early Design Phase LCA
Author: Brian Berg 26
remove this potential error. However, this would not be transferable to other building
projects due to the unique nature of building projects, project design teams.
Using the functional definition of the design process means there will be discrepancies
between the information this thesis has assumed to be available, and the information that is
available in other building projects. This may affect the iEE assessment simulation accuracy
possible at each phase of the design process. Checking the influence of using the functional
definition of design process compared to the actual design process documentation was not
possible due to data restrictions. The original sketch, concept, and developed documentation
were no longer available to construct BIM model representations.
Sketch Model Detail
The BPS concept is a solution to the problem of poor integration of LCA due to excessive
LCA calculation complexity. It directs the development of a method for how to use BIM
LCA tools to construct a BIM model faster, and easier. This is to reduce LCA calculation
complexity, whilst ensuring the simulation results produced are accurate enough for informed
decision-making. This BIM model is called a BIM LCA BPS (BIM LCA BPS) model. A BIM
LCA BPS model is not a fully detailed representation of a whole building. It is simplified to
only include:
The building elements that are influenced by the design decisions that building
designers must make in the early phases of the design process to be effective for
lowering a building’s environmental impact.
The building elements that can be calculated in existing BIM LCA tools. Currently,
neither the BIM LCA tools, IMPACT or Tally, can calculate LCA results for building
services. This is due to a lack of robust and comprehensive LCA data on building
services components (IMPACT, n.d.; KT Innovations, PE International, & AutoDesk,
2014).
This limits the scope of the BIM LCA tool’s LCA assessment to only the building elements
listed in Table 1.3.2. Different researchers have different scopes, and therefore different level
of completeness in their iEE LCA assessments. With no definition of best practice available,
completeness levels can vary considerably. A literature review of published LCA and iEE
Chapter One: Thesis Research Aims And Objectives
Using BIM To Calculate Accurate Building Material Quantities For Early Design Phase LCA
Author: Brian Berg 27
research case studies identified the scope depends on the individual researcher, who often
for practicality reasons excludes certain building elements from the assessment. For example,
the researchers Treloar et al., (2001) and Y. L. Langston & Langston (2012) reported iEE
studies of Australian buildings at an element level breakdown, averaged to 11.7 GJ/m2 and
25.0 GJ/m2 respectfully. The large difference between the two figures is due to differences in
the completeness, and the scope of their respective iEE assessment. Treloar et al., (2001)
states for practicality reasons, only 14 building elements were assessed, compared to Y. L.
Langston & Langston’s (2012) 43. Accounting for these differences, and comparing only the
same building elements, their respective figures are 11.0 GJ/m2 and 12.2 GJ/m2. This
equating to a difference of 9.8%. This is a difference acceptable in areas of building
performance such as operative energy, and cost planning, for what is considered reasonable.
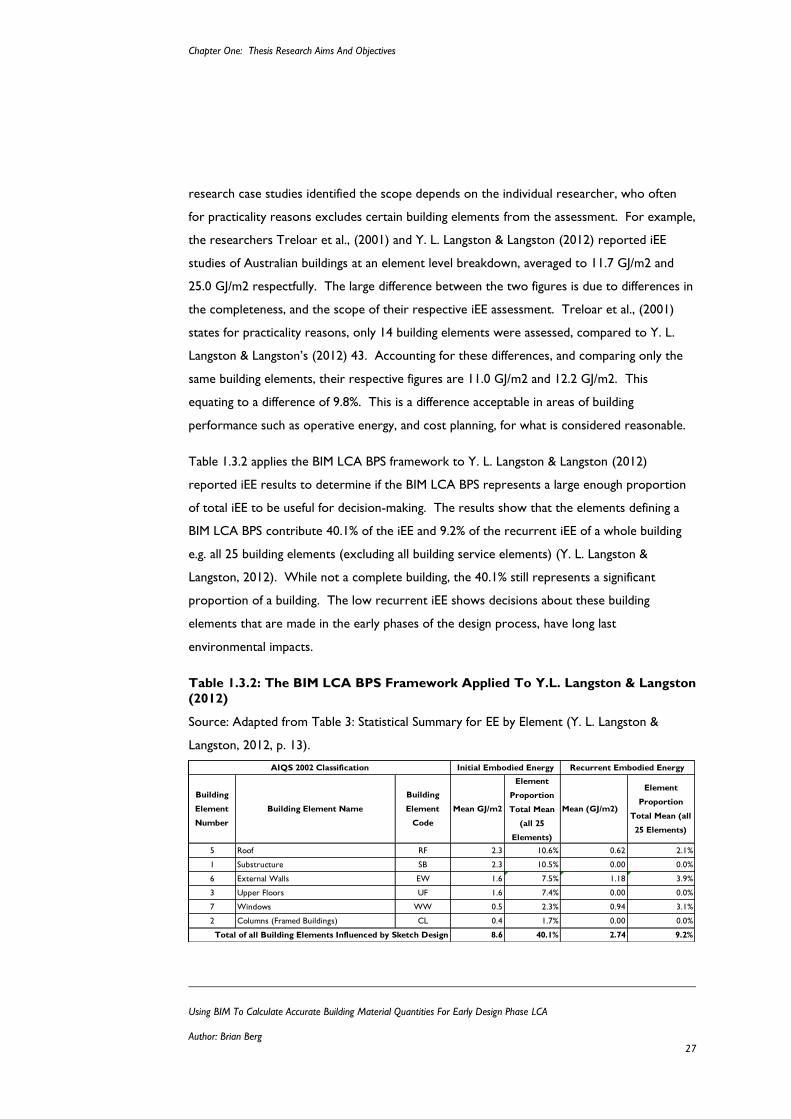
Table 1.3.2 applies the BIM LCA BPS framework to Y. L. Langston & Langston (2012)
reported iEE results to determine if the BIM LCA BPS represents a large enough proportion
of total iEE to be useful for decision-making. The results show that the elements defining a
BIM LCA BPS contribute 40.1% of the iEE and 9.2% of the recurrent iEE of a whole building
e.g. all 25 building elements (excluding all building service elements) (Y. L. Langston &
Langston, 2012). While not a complete building, the 40.1% still represents a significant
proportion of a building. The low recurrent iEE shows decisions about these building
elements that are made in the early phases of the design process, have long last
environmental impacts.
Table 1.3.2: The BIM LCA BPS Framework Applied To Y.L. Langston & Langston
(2012)
Source: Adapted from Table 3: Statistical Summary for EE by Element (Y. L. Langston &
Langston, 2012, p. 13).
Building
Element
Number
Building Element Name
Building
Element
Code
Mean GJ/m2
Element
Proportion
Total Mean
(all 25
Elements)
Mean (GJ/m2)
Element
Proportion
Total Mean (all
25 Elements)
5 Roof RF 2.3 10.6% 0.62 2.1%
1 Substructure SB 2.3 10.5% 0.00 0.0%
6 External Walls EW 1.6 7.5% 1.18 3.9%
3 Upper Floors UF 1.6 7.4% 0.00 0.0%
7 Windows WW 0.5 2.3% 0.94 3.1%
2 Columns (Framed Buildings) CL 0.4 1.7% 0.00 0.0%
8.6 40.1% 2.74 9.2%
Recurrent Embodied Energy
Total of all Building Elements Influenced by Sketch Design
Initial Embodied EnergyAIQS 2002 Classification
Chapter One: Thesis Research Aims And Objectives
Using BIM To Calculate Accurate Building Material Quantities For Early Design Phase LCA
Author: Brian Berg 28
BIM Modelling Time
The measurement, and assessment of BIM modelling time is excluded from this research
scope. Despite being an important factor in the iEE BIM LCA BPS for improving the
integration of LCA into sketch design, modelling time is hugely biased by the individual
modeller’s level of experience with the BIM tool, as well as the complexity of the building
being modelled. The modeller for this thesis research (Brian Berg), has prior experience in
BIM modelling using Graphisoft’s ArchiCAD BIM tool, but none with Revit. This means the
modeller has an understanding of the principles of BIM modelling, but lacks the specific
knowledge of the actual BIM tool (Revit) used for this research. This thesis’ modelling time is
therefore be biased due to his inexperience. This makes it is impossible to draw confident
conclusions of the time required to construct an iEE BIM LCA BPS model from only a single
sample size e.g. one building, and one modeller.
The modelling time savings enabled by the iEE BIM LCA BPS are the reduction in model
detailed required, and the fact that a BIM model produced during sketch design, based on
only the information available at sketch design can produce an accurate iEE or other LCA-
based result. This means that building designers can simply use the BIM models they already
construct for LCA building performance assessment, with very minimal additional modelling
work required.
1.4 Significance Of Study
One intended outcome of this research, is the development of a reliable, and consistent
methodology for calculating accurate building material quantities. Proven through EE
calibration, the iEE BIM LCA BPS method is quality assured to produce material quantities to
a detail equivalent to current best practice methods. On a practical level, the primary
outcome is the definition of the detail required of a BIM model. This definition can be used in
existing BIM LCA tools such as IMPACT (IMPACT, n.d.), and Tally (KT Innovations et al.,
2014). This research identified the problem where not defining the required BIM model
detail limits the effectiveness of these tools to act as Early Design Decision Support Tools
(EDDST). These tools show a BIM model detailed for building construction accuracy. Not
one defined by LCA accuracy as this thesis research does. Constructing the BIM model on
non LCA based research may result in inaccurate simulations, or simulations that take too
Chapter One: Thesis Research Aims And Objectives
Using BIM To Calculate Accurate Building Material Quantities For Early Design Phase LCA
Author: Brian Berg 29
long to be effective as early design phase assessment tools. Evidence from literature review
research supports the identified need for accurate simulation results to improve early design
phase building performance assessment (Bribián et al., 2009; Donn, Selkowitz, & Bordass,
2012).
An immediate application of the developed methodology for using BIM to calculate accurate
building material quantities is the contribution to the BRANZ Whole Building Whole of Life
research project. The contribution to the Whole Building Whole of Life research project is
centred on their second research question: “What would be an appropriate office building
benchmark to provide the reference case for whole building whole of life assessment in New
Zealand?” (Dowdell, 2013, p. 55). Developed using iEE, this methodology is suitable for
calculating material based LCI’s and LCIA for whole building LCA assessments. This is the
methodology for calculating the material quantities of their benchmark buildings.
A secondary outcome of this thesis is a methodology of calculating accurate iEE results in the
early phases of the design process. This is important for minimising a building’s EE
consumption, as once the building is constructed, the iEE consumption is made. Recurring EE
from maintenance and replacement of material is also committed too. This highlights the
importance of making EE informed design decisions early in the design process as their impact
extends to the lifespan of the building.
Despite traditionally being a small part of the building lifecycle energy consumption, EE is
important to sustainable design. Findings from various studies (Ibn-Mohammed, Greenough,
Taylor, Ozawa-Meida, & Acquaye, 2013; Treloar, McCoubrie, Love, & Iyer-Raniga, 1999;
Yung, Lam, & Yu, 2013) have suggested in non-residential commercial office buildings the
contribution of iEE is 10.47 GJ/m2 of Gross Floor Area (GFA). This is approximately 15% of
the total lifecycle energy consumption of a building over 50 years, or the equivalent 7.8 years
of annual operative energy (Yung et al., 2013, p. 49). Researchers often argue that the
construction industry’s move towards low or zero operative energy buildings will make EE
calculations more important (International Energy Agency, 2004b). This is true, where a
building with low, or even zero operational energy, but high iEE may not necessarily be the
best option from an environmental sustainability perspective. However, evidence from
literature (Berggren, Hall, & Wall, 2013) shows that when operative energy consumption is

Chapter One: Thesis Research Aims And Objectives
Using BIM To Calculate Accurate Building Material Quantities For Early Design Phase LCA
Author: Brian Berg 30
lower than 45 kWh/m2 in non-residential commercial office buildings the iEE exceeds 50% of
life cycle energy.
Chapter Two: Calculating Environmental Impact In The Built Environment
Using BIM To Calculate Accurate Building Material Quantities For Early Design Phase LCA
Author: Brian Berg 31
Chapter Two:
2 CALCULATING ENVIRONMENTAL IMPACT
IN THE BUILT ENVIRONMENT
2.1 Chapter Intent
An increasing awareness of the building industry’s environmental impact is driving the shift
towards sustainable building design. This is changing the way the buildings are designed,
constructed, and operated. More than ever, building designers are required to consider the
environmental impact of their design decisions as part of the building design process. With
this change, new tools, and design practices are required to assist building designers in making
design decisions to lower the environmental impact of their building designs. LCA (LCA) is
one method for doing this.
The previous Chapter introduced the background context, and the research strategy of this
thesis. It stated, that due to the poor integration of BIM LCA tools into the early phases of
the design process, LCA is rarely used by building designers. The aim of this Chapter is to
develop a set of requirements, that when satisfied, will ensure LCA is effectively integrated
into the sketch design phase. The information gained from this Chapter will under-pin the
development of a methodology for how to correctly use BIM LCA tools for sketch design
phase building material assessments, making it an effective early design decision support tool
(EDDST).
This Chapter aim will be met by exploring the ideas behind what building designers require of
an early design decision support tool, the building material LCA calculation process, and a
critique of existing BIM LCA tools. Structurally, this Chapter consists of five sections to
meet this Chapter aim. Chapter Section 2.2 examines the measurement, calculation, and
design decisions building designers face as part of the building design process for more
sustainable buildings. Chapter Section 2.3, and 2.4, discuss the problems with the existing
LCA calculation process and the BIM LCA tools that have been developed to solve them.
Chapter Two: Calculating Environmental Impact In The Built Environment
Using BIM To Calculate Accurate Building Material Quantities For Early Design Phase LCA
Author: Brian Berg 32
Subsequently, Chapter Section 2.5, discusses how BIM LCA tools must be used to be
effective, developing a set of requirements with simulation accuracy, and building material
quantities the predominate areas of focus. This is the development of the requirements for
effective integration, and the framework for structuring the methodology for their use.
Finally, Chapter Section 2.6, examines the specific problem of excessive modelling time, for
calculating building material quantities from a BIM model. This leads onto the development of
the research design in Chapter 3.0.
2.2 Calculating And Designing To Reduce A Building’s
Environmental Impact
2.2.1 What Is Environmental Impact?
An environmental impact is a change and the associated consequences to the environment,
caused by the direct activities of the development and production of a product or service
(Sidoroff, 2004b, p. 6). An environmental impact is measured by the environmental indicators
produced as part of an environmental framework (Alcorn, 2010; Crawford, 2011).
Environmental frameworks, such as LCA (LCA), provide a consistent, and comprehensive
system, for measuring and describing the environmental impact caused by the manufacturing,
construction, operation, and demolition activities throughout the life cycle of building
(International Energy Agency, 2004b, p. 1).
The building industry is becoming more aware of the environmental impact of buildings. A
building’s total lifespan is divided into four lifecycle stages separated by system boundaries;
manufacturing, construction, operation, and demolition. In most building LCA studies, the
focus is limited to calculating the environmental impact and indicators of the manufacturing,
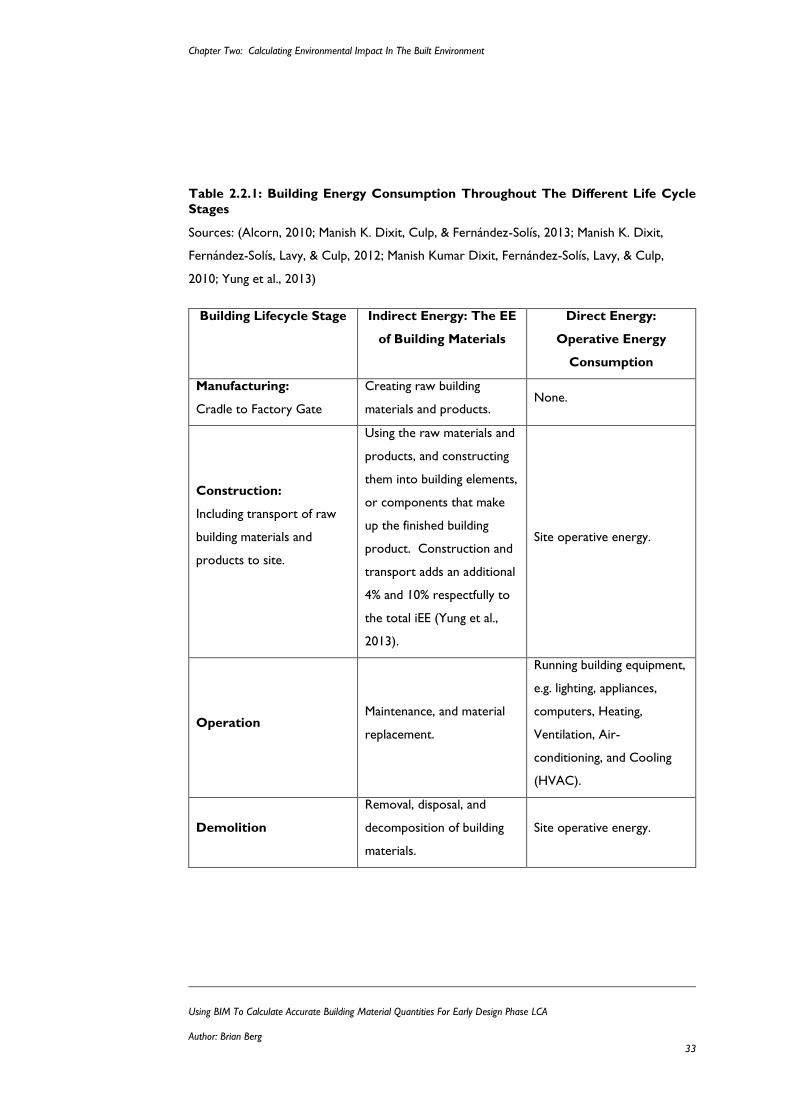
and operational phases. Table 2.2.1 shows throughout the four lifecycle stages the difference
between the indirect energy consumed and sequestered in building materials (EE), and the
direct energy consumption (operative energy).
Chapter Two: Calculating Environmental Impact In The Built Environment
Using BIM To Calculate Accurate Building Material Quantities For Early Design Phase LCA
Author: Brian Berg 33
Table 2.2.1: Building Energy Consumption Throughout The Different Life Cycle
Stages
Sources: (Alcorn, 2010; Manish K. Dixit, Culp, & Fernández-Solís, 2013; Manish K. Dixit,
Fernández-Solís, Lavy, & Culp, 2012; Manish Kumar Dixit, Fernández-Solís, Lavy, & Culp,
2010; Yung et al., 2013)
Building Lifecycle Stage Indirect Energy: The EE
of Building Materials
Direct Energy:
Operative Energy
Consumption
Manufacturing:
Cradle to Factory Gate
Creating raw building
materials and products. None.
Construction:
Including transport of raw
building materials and
products to site.
Using the raw materials and
products, and constructing
them into building elements,
or components that make
up the finished building
product. Construction and
transport adds an additional
4% and 10% respectfully to
the total iEE (Yung et al.,
2013).
Site operative energy.
Operation Maintenance, and material
replacement.
Running building equipment,
e.g. lighting, appliances,
computers, Heating,
Ventilation, Air-
conditioning, and Cooling
(HVAC).
Demolition
Removal, disposal, and
decomposition of building
materials.
Site operative energy.
Chapter Two: Calculating Environmental Impact In The Built Environment
Using BIM To Calculate Accurate Building Material Quantities For Early Design Phase LCA
Author: Brian Berg 34
Embodied And Operative Energy
Embodied Energy (EE) is the energy consumed in all activities necessary to support a process,
and comprises of two primary components, a direct and an indirect component (Baird &
Chan, 1983; Manish Kumar Dixit et al., 2010). In context of the building industry, direct
energy is energy consumed onsite and offsite by processes such as construction,
prefabrication, assembly, transportation and administration. Whereas, indirect energy is the
energy consumed in manufacturing building materials, renovation, refurbishment and the
demolition and disposal of the building materials (Manish Kumar Dixit et al., 2010).
A building’s energy consumption is viewed as the most important environmental indicator,
and subsequently, it is the most commonly reported (International Energy Agency, 2004b, p.
3). Typically, in the majority of the existing building stock, the operational lifecycle stage has,
and continues to have, the largest environmental impact accounting for about half of the total
energy consumed by developed countries (International Energy Agency, 2004b, p. 3).
Depending on a building’s typology characteristics, in commercial office buildings for example,
operative energy can be represent approximately 85% of the total energy at the end of a 50-
year lifespan, with EE accounting for 15% which includes transport 0.5%, and construction
1.3% (Berggren et al., 2013, 2013; Ibn-Mohammed et al., 2013; Treloar et al., 1999; Yung et
al., 2013). Expressed as a number of years of total annual operational energy (approximately
81.7 kWh/m2 GFA), the EE is 7.8 (Yung et al., 2013, p. 49).
Chapter Two: Calculating Environmental Impact In The Built Environment
Using BIM To Calculate Accurate Building Material Quantities For Early Design Phase LCA
Author: Brian Berg 35
2.2.2 The Building Design Process And Informed Decision-Making
The Building Design Process
Design is a process for problem solving, capable of producing an infinite number of different
solutions to a single problem (Haponava & Al-Jibouri, 2010; Lawson, 2006). Building design
frameworks suggest what design decisions to consider, and when those decisions should be
made by to deliver a successful building (Löhnert, Dalkowski, & Sutter, 2003). There are
many different building design frameworks available. Despite their differences, they all are
tools to assist the administration, and management of building projects, to achieve the best
built outcome in regards to the project goals and time, cost and quality (Emmitt, 2007). As
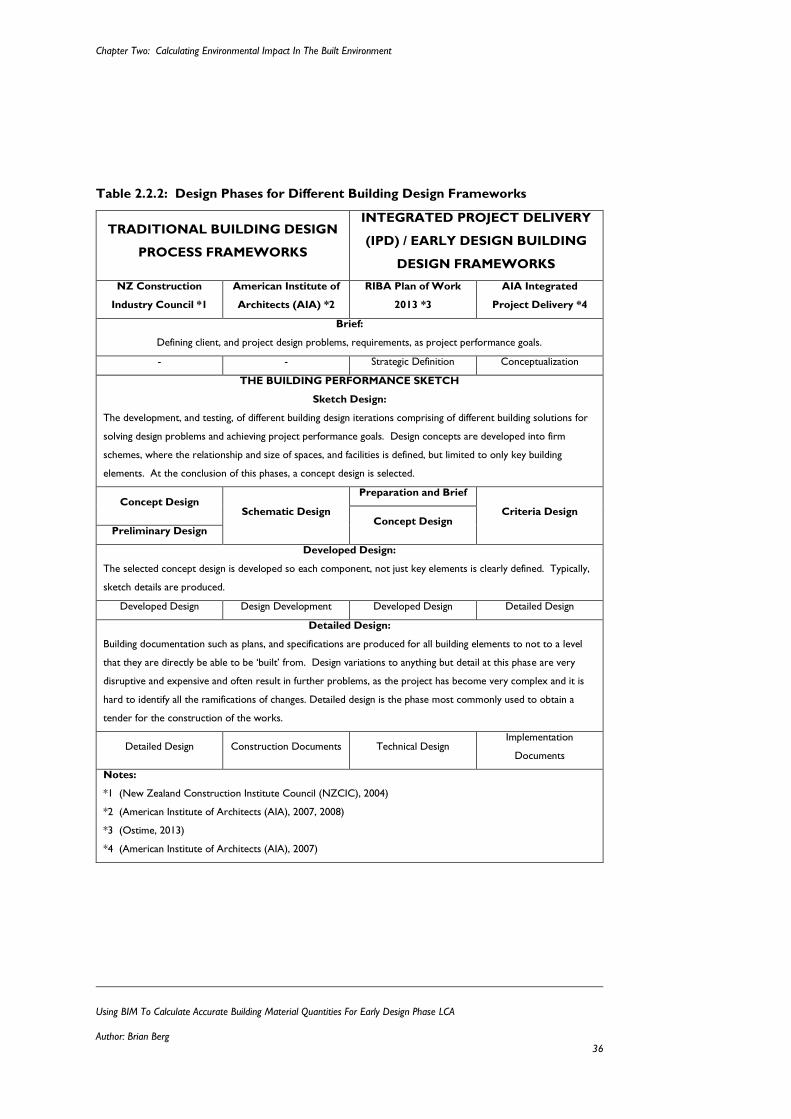
such, they all generally align with one another. Tables 2.2.2 shows this alignment for a sample
collection of different building design frameworks. This presents the working definition used
in this thesis research for describing the building design process, and each design phase.
Chapter Two: Calculating Environmental Impact In The Built Environment
Using BIM To Calculate Accurate Building Material Quantities For Early Design Phase LCA
Author: Brian Berg 36
Table 2.2.2: Design Phases for Different Building Design Frameworks
TRADITIONAL BUILDING DESIGN
PROCESS FRAMEWORKS
INTEGRATED PROJECT DELIVERY
(IPD) / EARLY DESIGN BUILDING
DESIGN FRAMEWORKS
NZ Construction
Industry Council *1
American Institute of
Architects (AIA) *2
RIBA Plan of Work
2013 *3
AIA Integrated
Project Delivery *4
Brief:
Defining client, and project design problems, requirements, as project performance goals.
- - Strategic Definition Conceptualization
THE BUILDING PERFORMANCE SKETCH
Sketch Design:
The development, and testing, of different building design iterations comprising of different building solutions for
solving design problems and achieving project performance goals. Design concepts are developed into firm
schemes, where the relationship and size of spaces, and facilities is defined, but limited to only key building
elements. At the conclusion of this phases, a concept design is selected.
Concept Design Schematic Design
Preparation and Brief
Criteria Design Concept Design
Preliminary Design
Developed Design:
The selected concept design is developed so each component, not just key elements is clearly defined. Typically,
sketch details are produced.
Developed Design Design Development Developed Design Detailed Design
Detailed Design:
Building documentation such as plans, and specifications are produced for all building elements to not to a level
that they are directly be able to be ‘built’ from. Design variations to anything but detail at this phase are very
disruptive and expensive and often result in further problems, as the project has become very complex and it is
hard to identify all the ramifications of changes. Detailed design is the phase most commonly used to obtain a
tender for the construction of the works.
Detailed Design Construction Documents Technical Design Implementation
Documents
Notes:
*1 (New Zealand Construction Institute Council (NZCIC), 2004)
*2 (American Institute of Architects (AIA), 2007, 2008)
*3 (Ostime, 2013)
*4 (American Institute of Architects (AIA), 2007)
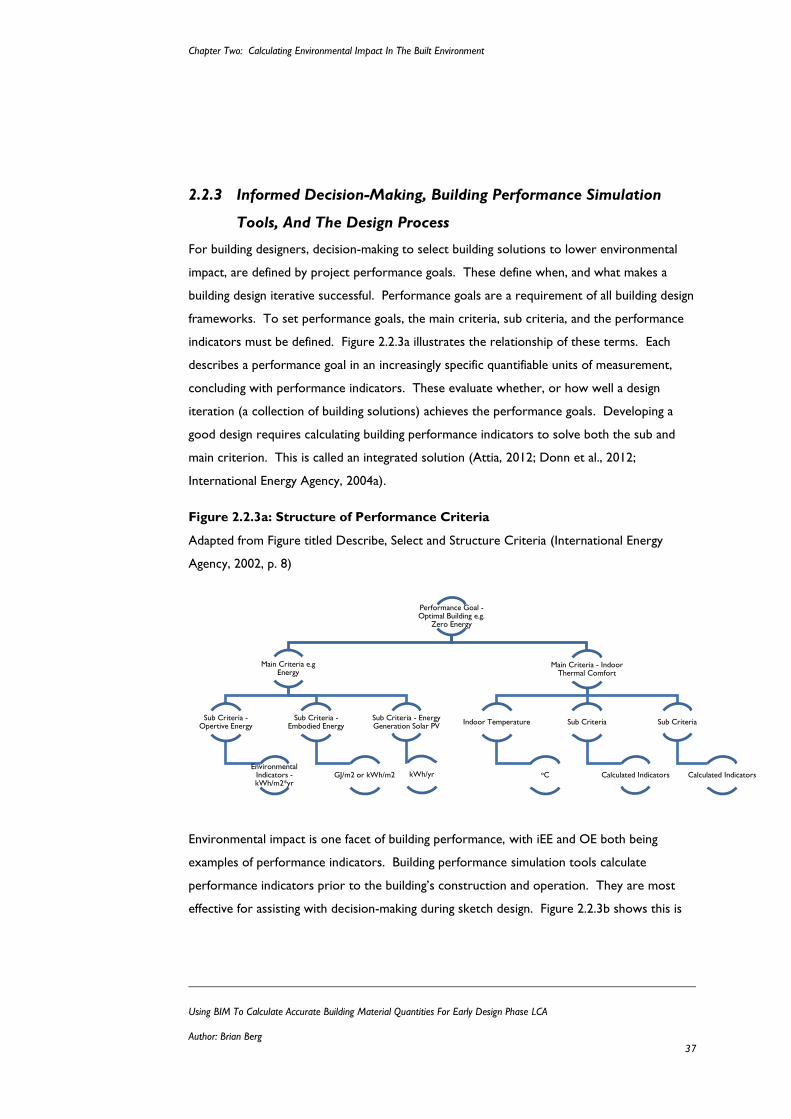
Chapter Two: Calculating Environmental Impact In The Built Environment
Using BIM To Calculate Accurate Building Material Quantities For Early Design Phase LCA
Author: Brian Berg 37
2.2.3 Informed Decision-Making, Building Performance Simulation
Tools, And The Design Process
For building designers, decision-making to select building solutions to lower environmental
impact, are defined by project performance goals. These define when, and what makes a
building design iterative successful. Performance goals are a requirement of all building design
frameworks. To set performance goals, the main criteria, sub criteria, and the performance
indicators must be defined. Figure 2.2.3a illustrates the relationship of these terms. Each
describes a performance goal in an increasingly specific quantifiable units of measurement,
concluding with performance indicators. These evaluate whether, or how well a design
iteration (a collection of building solutions) achieves the performance goals. Developing a
good design requires calculating building performance indicators to solve both the sub and
main criterion. This is called an integrated solution (Attia, 2012; Donn et al., 2012;
International Energy Agency, 2004a).
Figure 2.2.3a: Structure of Performance Criteria
Adapted from Figure titled Describe, Select and Structure Criteria (International Energy
Agency, 2002, p. 8)
Environmental impact is one facet of building performance, with iEE and OE both being
examples of performance indicators. Building performance simulation tools calculate
performance indicators prior to the building’s construction and operation. They are most
effective for assisting with decision-making during sketch design. Figure 2.2.3b shows this is
Performance Goal -Optimal Building e.g.
Zero Energy
Main Criteria e.g Energy
Sub Criteria -Opertive Energy
Environmental Indicators -kWh/m2*yr
Sub Criteria -Embodied Energy
GJ/m2 or kWh/m2
Sub Criteria - Energy Generation Solar PV
kWh/yr
Main Criteria - Indoor Thermal Comfort
Indoor Temperature
oC
Sub Criteria
Calculated Indicators
Sub Criteria
Calculated Indicators
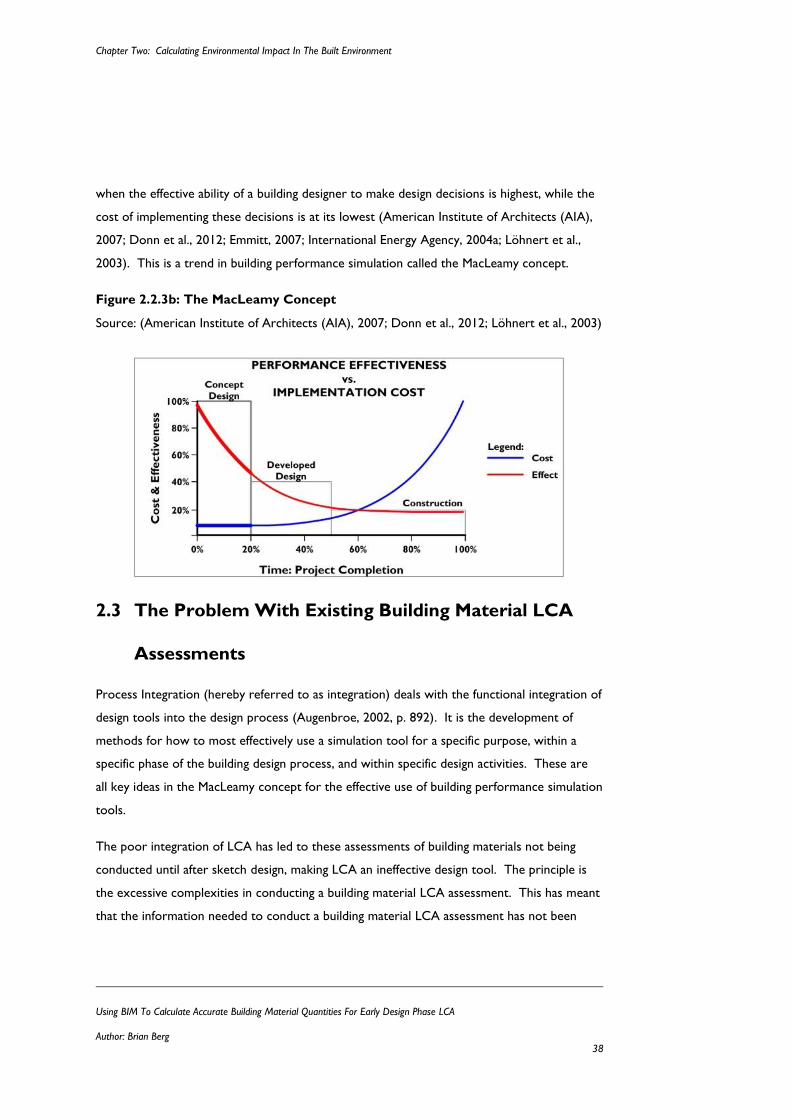
Chapter Two: Calculating Environmental Impact In The Built Environment
Using BIM To Calculate Accurate Building Material Quantities For Early Design Phase LCA
Author: Brian Berg 38
when the effective ability of a building designer to make design decisions is highest, while the
cost of implementing these decisions is at its lowest (American Institute of Architects (AIA),
2007; Donn et al., 2012; Emmitt, 2007; International Energy Agency, 2004a; Löhnert et al.,
2003). This is a trend in building performance simulation called the MacLeamy concept.
Figure 2.2.3b: The MacLeamy Concept
Source: (American Institute of Architects (AIA), 2007; Donn et al., 2012; Löhnert et al., 2003)
2.3 The Problem With Existing Building Material LCA
Assessments
Process Integration (hereby referred to as integration) deals with the functional integration of
design tools into the design process (Augenbroe, 2002, p. 892). It is the development of
methods for how to most effectively use a simulation tool for a specific purpose, within a
specific phase of the building design process, and within specific design activities. These are
all key ideas in the MacLeamy concept for the effective use of building performance simulation
tools.
The poor integration of LCA has led to these assessments of building materials not being
conducted until after sketch design, making LCA an ineffective design tool. The principle is
the excessive complexities in conducting a building material LCA assessment. This has meant
that the information needed to conduct a building material LCA assessment has not been
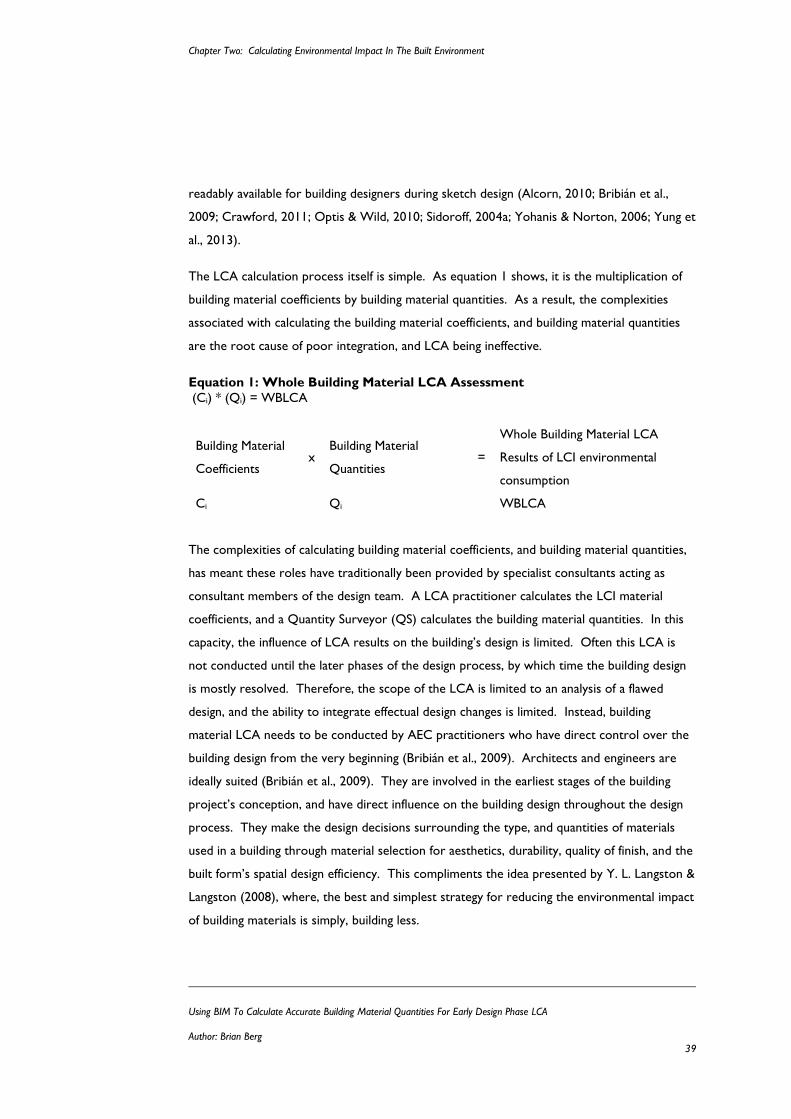
Chapter Two: Calculating Environmental Impact In The Built Environment
Using BIM To Calculate Accurate Building Material Quantities For Early Design Phase LCA
Author: Brian Berg 39
readably available for building designers during sketch design (Alcorn, 2010; Bribián et al.,
2009; Crawford, 2011; Optis & Wild, 2010; Sidoroff, 2004a; Yohanis & Norton, 2006; Yung et
al., 2013).
The LCA calculation process itself is simple. As equation 1 shows, it is the multiplication of
building material coefficients by building material quantities. As a result, the complexities
associated with calculating the building material coefficients, and building material quantities
are the root cause of poor integration, and LCA being ineffective.
Equation 1: Whole Building Material LCA Assessment
(Ci) * (Qi) = WBLCA
Building Material
Coefficients x
Building Material
Quantities =
Whole Building Material LCA
Results of LCI environmental
consumption
Ci Qi WBLCA
The complexities of calculating building material coefficients, and building material quantities,
has meant these roles have traditionally been provided by specialist consultants acting as
consultant members of the design team. A LCA practitioner calculates the LCI material
coefficients, and a Quantity Surveyor (QS) calculates the building material quantities. In this
capacity, the influence of LCA results on the building’s design is limited. Often this LCA is
not conducted until the later phases of the design process, by which time the building design
is mostly resolved. Therefore, the scope of the LCA is limited to an analysis of a flawed
design, and the ability to integrate effectual design changes is limited. Instead, building
material LCA needs to be conducted by AEC practitioners who have direct control over the
building design from the very beginning (Bribián et al., 2009). Architects and engineers are
ideally suited (Bribián et al., 2009). They are involved in the earliest stages of the building
project’s conception, and have direct influence on the building design throughout the design
process. They make the design decisions surrounding the type, and quantities of materials
used in a building through material selection for aesthetics, durability, quality of finish, and the
built form’s spatial design efficiency. This compliments the idea presented by Y. L. Langston &
Langston (2008), where, the best and simplest strategy for reducing the environmental impact
of building materials is simply, building less.
Chapter Two: Calculating Environmental Impact In The Built Environment
Using BIM To Calculate Accurate Building Material Quantities For Early Design Phase LCA
Author: Brian Berg 40
To facilitate architects, and engineers (hereby referred to as the design team) conducting
building material LCA in the early phases of the design process, the complexities of the
calculation process must be reduced. Building material LCA tools are the solution.
However, simply developing building material LCA tools does not ensure they integrate
effectively. Effective integration (hereby referred to simply as integration) into the early
phases of the design process as per the MacLeamy concept, means developing tools that are
adapted to fit within the day-to-day realities of work practices, processes, and into building
design tools building designers actually use (Augenbroe, 1992, 2002; Donn et al., 2012;
International Energy Agency, 2004a). They must be capable of rapidly testing different design
iterations, whilst ensuring the simulation results are accurate and trusted enough to enable
the design team to make informed design decisions to achieve project performance goals
(Augenbroe, 1992, 2002; Donn et al., 2012; International Energy Agency, 2004a)
2.3.1 Reducing Building Material LCA Calculation Complexity
Reducing the complexity of the building material LCA calculation process requires making the
calculation process easier, without comprising simulation accuracy. Existing LCA tools
reduce complexity by making it easier for building designers to access the two inputs in the
building material LCI calculation process (equation 1); building material coefficients, and
building material quantities. This divides LCA tools into two categories; those that focus on
building material coefficients; and those that calculate building material quantities, such as
material coefficient LCA tools; and those that calculate building material quantities and
multiply them by material coefficients. These are called whole building assessment tools.
There are two types, those that are BIM based, and those that are not.
2.3.2 LCA Tools For Calculating Building Material Coefficients
Material coefficient LCA tools calculate LCI and LCIA results of individual building material
and products. They are databases of LCI coefficients for common building materials and
products. They alleviate integration problems by improving the accessibility of building LCI
material coefficients. In the past, conducting a building LCA also required developing the
necessary LCI material coefficients. This limited building LCA to specialist building
researchers. The advent of building material LCA databases removes this requirement. This
Chapter Two: Calculating Environmental Impact In The Built Environment
Using BIM To Calculate Accurate Building Material Quantities For Early Design Phase LCA
Author: Brian Berg 41
makes the calculation process much easier than traditional LCA practices, widening the scope
of use to building designers.
Accuracy and data quality issues are minimised as databases use best practice calculation
methodologies such as the ISO 14040 series, EDP, and quality assurance processes, to
calculate material and product coefficients. However, there are now many different
databases of LCI material coefficients. Factors such as age of the database, and the country of
origin effect the suitability of their use in specific contexts (Huijbregts, 1998; Sidoroff, 2004a;
Weidema & Wesnæs, 1996) making their selection a critical decision building designers must
make. Research has proven that using LCA databases that are do not match the country
where the building materials are produced has a significant impact of the LCA results, and
therefore design decision-making (Nebel, n.d.). The problem exists in current LCA practices,
that there is no tool that assists building designers with making with choice. This is a
contributing cause of excessive LCA calculation complexity. Therefore as part of this thesis
to improve LCA integration into sketch design, a tool for assisting building designers with
making this decision must be developed.
Issues with the material coefficient calculation methods are still debated by LCA researchers.
However, a consensus has been reached, where standard best practice requires a building
designers to simply select and use an appropriate database to access the required material
coefficients for their building designs. In this way, material coefficient LCA tools do not solve
LCA coefficient calculation methodology issues. Instead they remove complexity by
simplifying and organising the calculation process as it pertains to material coefficients (Bribián
et al., 2009; Crawford, 2011).
2.3.3 BIM LCA Tools
BIM LCA tools such as IMPACT (developed by the British Research Establishment (BRE)) and
Tally (developed by KT Innovation’s and supported by PE International and AutoDesk)
(IMPACT, n.d.; KT Innovations et al., 2014) are plugin applications, integrating the Ecoinvest
(IMPACT) and GABI (Tally) material coefficient LCA tools into Autodesk’s Revit BIM tool.
BIM LCA tools were developed to reduce building material LCA calculation complexity by
making the calculation of building material quantities, and the specification of LCI material
Chapter Two: Calculating Environmental Impact In The Built Environment
Using BIM To Calculate Accurate Building Material Quantities For Early Design Phase LCA
Author: Brian Berg 42
coefficients to those quantities easier. Consequently, by integrating building material LCA
into a BIM tool, this enables these calculations to be conducted using design tools building
designers already use, which greatly improves the integration of building material LCA into
the design process.
The calculation of building material quantities using a BIM model and tool to calculate material
quantities is the most important complexity reducing improvement provided by a BIM LCA
tool. The calculation process is the same for any other BIM model with non-geometrical
functional information called metadata embedded within BIM objects. The building designer
constructs the BIM objects, assigns the LCI material coefficients metadata to each material,
and then assembles (modelling) the BIM objects into the building’s overall form to makeup
the BIM geometry (Hjelseth, 2010, p. 280). The BIM objects define which materials and LCI
material coefficients are used in the building, and the BIM geometry, the information for how
much materials and material coefficients are used in the building (IMPACT, n.d.; KT
Innovations et al., 2014). Finally, building material quantities are calculated from the
completed BIM model (e.g. the BIM objects and geometry) and multiplied by the LCI material
coefficient specified using BIM tool’s proprietary material quantities calculation tool. This
process is illustrated in equation 3.
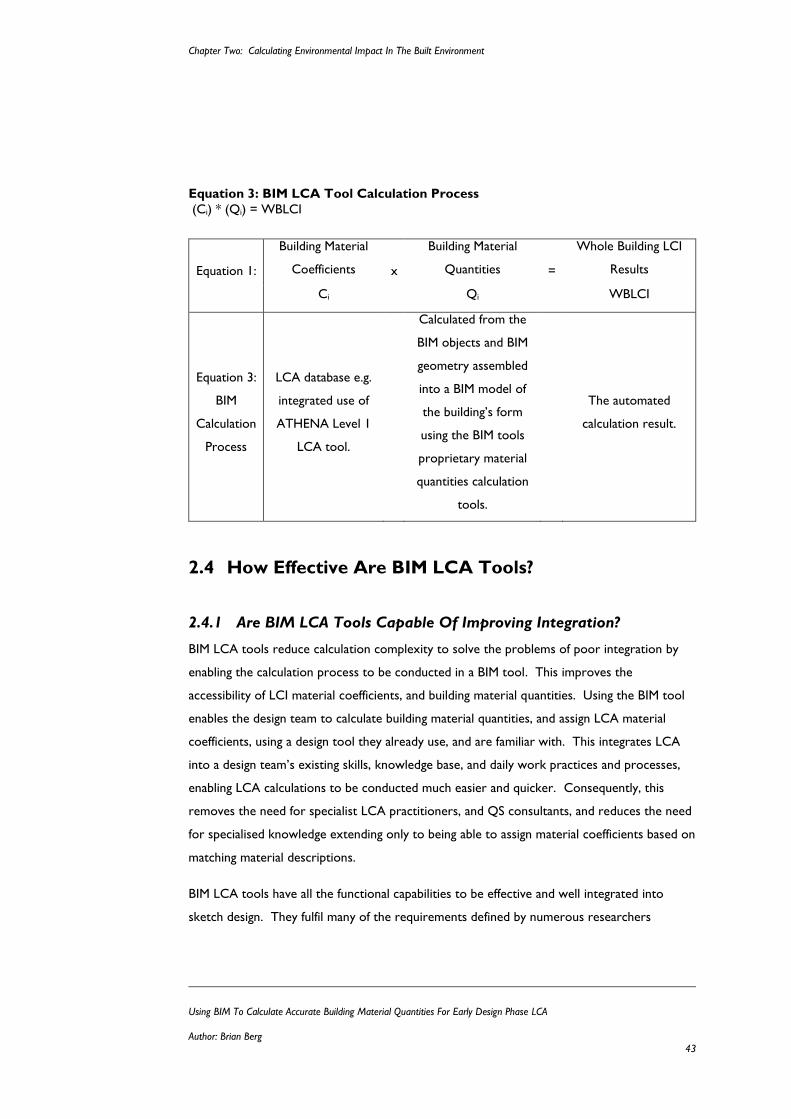
Chapter Two: Calculating Environmental Impact In The Built Environment
Using BIM To Calculate Accurate Building Material Quantities For Early Design Phase LCA
Author: Brian Berg 43
Equation 3: BIM LCA Tool Calculation Process
(Ci) * (Qi) = WBLCI
Equation 1:
Building Material
Coefficients x
Building Material
Quantities =
Whole Building LCI
Results
Ci Qi WBLCI
Equation 3:
BIM
Calculation
Process
LCA database e.g.
integrated use of
ATHENA Level 1
LCA tool.
Calculated from the
BIM objects and BIM
geometry assembled
into a BIM model of
the building’s form
using the BIM tools
proprietary material
quantities calculation
tools.
The automated
calculation result.
2.4 How Effective Are BIM LCA Tools?
2.4.1 Are BIM LCA Tools Capable Of Improving Integration?
BIM LCA tools reduce calculation complexity to solve the problems of poor integration by
enabling the calculation process to be conducted in a BIM tool. This improves the
accessibility of LCI material coefficients, and building material quantities. Using the BIM tool
enables the design team to calculate building material quantities, and assign LCA material
coefficients, using a design tool they already use, and are familiar with. This integrates LCA
into a design team’s existing skills, knowledge base, and daily work practices and processes,
enabling LCA calculations to be conducted much easier and quicker. Consequently, this
removes the need for specialist LCA practitioners, and QS consultants, and reduces the need
for specialised knowledge extending only to being able to assign material coefficients based on
matching material descriptions.
BIM LCA tools have all the functional capabilities to be effective and well integrated into
sketch design. They fulfil many of the requirements defined by numerous researchers
Chapter Two: Calculating Environmental Impact In The Built Environment
Using BIM To Calculate Accurate Building Material Quantities For Early Design Phase LCA
Author: Brian Berg 44
(Augenbroe, 1992, 2002; Donn et al., 2012; International Energy Agency, 2004a) for what
makes design tool effective during sketch design. However, being capable of calculating
results more easily does mean a BIM LCA tool satisfies these requirements. The critical issue
is answering are BIM LCA tools effective at improving integration, is answering; are BIM LCA
tools used correctly so they produce accurate simulation results quickly?
2.4.2 BIM LCA Tools, Capable But Used Ineffectively
The way BIM LCA tools are used, or misused is causing the outstanding issues of poor
integration, and calculation complexity. To date, no research has established if the existing
methods of using BIM LCA tools can produce accurate simulation results. However, an
assessment of whether they satisfy the other requirements of effective integration is possible.
Integrating LCA into BIM also integrates the BIM concept for how to use a BIM tool. The
BIM concept is a form of process integration prescribing how to use BIM tools and models
within the design process (Augenbroe, 2002, p. 892). It advocates using interoperability to
integrate the use of BIM tools and models into the early phases of the design process in
compliance with the ideas the MacLeamy concept.
The interoperability capabilities of the BIM tool and model make this integration possible
(Augenbroe, 2002). BIM interoperability has two facets, technology, and culture. From the
technology perspective, interoperability is the ability of computer programs to communicate
electronic data and information, and to manage the use of this information (Grilo & Jardim-
Goncalves, 2010, p. 525; Jones, 2007, p. 4). The cultural perspective is interpreted differently
as, “the ability to implement and manage collaborative relationships among members of cross-
disciplinary build teams that enables integrated project execution” (Jones, 2007, p. 4).
Although technology based interoperability is an important part of simulation tool integration,
it is still only the means to assist doing what is required (Augenbroe, 2002). The cultural
perspective links the technology that is interoperability, with the need for structuring how,
what, and when to use it within the design process, design activities, and design team. This is
the true integration of BIM into the design process (Augenbroe, 2002). Being BIM capable,
BIM LCA tools are capable of both of these types of integration. The BIM model and tool has
Chapter Two: Calculating Environmental Impact In The Built Environment
Using BIM To Calculate Accurate Building Material Quantities For Early Design Phase LCA
Author: Brian Berg 45
full technology interoperability capabilities, but it is the BIM concept that dictates how to use
the BIM LCA tool.
Arguably, the BIM concept’s interoperability decreases building performance simulation time
by improving knowledge sharing between the design team members through the use of a
single integrated BIM (iBIM) Level 3 maturity model.
The iBIM model reduces simulation time in the iterative testing/improvement or refutation
process (Donn et al., 2012, p. 188). This is the process of creating the initial BIM model of
the building’s design (the conjecture), then testing design solutions, accepting or rejecting
them based on their performance. From the initial BIM conjecture model, all the information
for all building performance assessments can be extracted. Using two-way interoperability,
where communications from either program can be used to change an update the other with
no loss of information (Pazlar & Turk, 2008, p. 378), each building performance conjecture
model can be automatically created for each specific area of building performance, for each
simulation program. This is called a BIM performance ‘view’ (Donn et al., 2012, p. 190).
Iterative analysis of the initial conjecture is conducted in each simulation program identifying
the best design solutions. Completing the two-way interoperability, the best design solution
is uploaded back into the single integrated BIM model. Figure 2.4.2a shows how this shifts
the time in the design process when more effort is required to be spent on early design
rather than later the later phases.
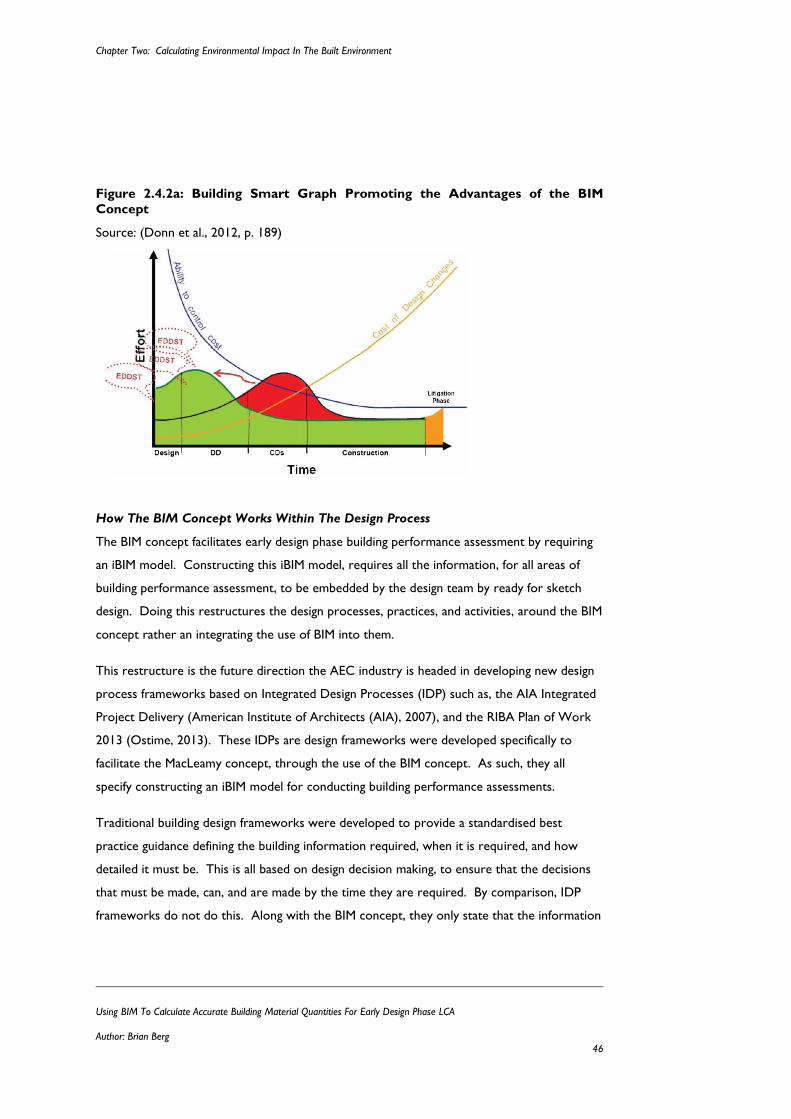
Chapter Two: Calculating Environmental Impact In The Built Environment
Using BIM To Calculate Accurate Building Material Quantities For Early Design Phase LCA
Author: Brian Berg 46
Figure 2.4.2a: Building Smart Graph Promoting the Advantages of the BIM
Concept
Source: (Donn et al., 2012, p. 189)
How The BIM Concept Works Within The Design Process
The BIM concept facilitates early design phase building performance assessment by requiring
an iBIM model. Constructing this iBIM model, requires all the information, for all areas of
building performance assessment, to be embedded by the design team by ready for sketch
design. Doing this restructures the design processes, practices, and activities, around the BIM
concept rather an integrating the use of BIM into them.
This restructure is the future direction the AEC industry is headed in developing new design
process frameworks based on Integrated Design Processes (IDP) such as, the AIA Integrated
Project Delivery (American Institute of Architects (AIA), 2007), and the RIBA Plan of Work
2013 (Ostime, 2013). These IDPs are design frameworks were developed specifically to
facilitate the MacLeamy concept, through the use of the BIM concept. As such, they all
specify constructing an iBIM model for conducting building performance assessments.
Traditional building design frameworks were developed to provide a standardised best
practice guidance defining the building information required, when it is required, and how
detailed it must be. This is all based on design decision making, to ensure that the decisions
that must be made, can, and are made by the time they are required. By comparison, IDP
frameworks do not do this. Along with the BIM concept, they only state that the information
Chapter Two: Calculating Environmental Impact In The Built Environment
Using BIM To Calculate Accurate Building Material Quantities For Early Design Phase LCA
Author: Brian Berg 47
must be available by a certain time in the building design process. Neither provide any
guidance for what information must be embedded into the BIM model to conduct the building
performance assessments they specify as a requirement. Instead, IPD frameworks advocate
creating project specific requirements, or defer to independent BIM standards such as the
BuildingSmart’s Standard of Processes (formerly known as the Information Delivery Manual
or IDM) to specify this information (BuildingSMART UK, n.d.; Hjelseth, 2010).
This is not effective integration. Integration is not just making very detailed information
available earlier in the design process which is what the BIM concept, and IPDs advocate.
The problem is none of these standards define what information, how detailed this
information must be, when it must be available, and how this translates into BIM objects and
geometry. They are simply frameworks for managing the BIM modelling process, not for
doing building performance assessments.
The Ineffectiveness Of The BIM Concept
The promise of BIM is the ability to make design decisions in the early phases of the design
process, through time savings provided by improved sharing of information and knowledge.
However, in practice, this is not true. This ineffectiveness is a failure in the cultural facet of
BIM interoperability caused by the BIM concept, not the technological interoperability
capabilities of BIM tools.
Using an iBIM for sketch design building performance does not save enough time to maximise
the benefits of simulation. This is because constructing the iBIM takes too long (hereby
referred to as BIM modelling time), to the point where, the delivered time savings do not
payback the initial time investment spent constructing it (Donn et al., 2012; Leite, Akcamete,
Akinci, Atasoy, & Kiziltas, 2011).
The cause of excessive BIM modelling time is that too much information is required to be
modelled in the iBIM. This is caused by modellers not knowing what they have to model, or
how detailed the iBIM model has to be at each phase of the design process, for each area of
building performance being assessed. Because of this, a BIM concept for using BIM LCA tools
does not enable effective integration of building performance assessment.
Chapter Two: Calculating Environmental Impact In The Built Environment
Using BIM To Calculate Accurate Building Material Quantities For Early Design Phase LCA
Author: Brian Berg 48
2.5 How To Use BIM LCA Tools Effectively?
2.5.1 The Building Performance Sketch (BPS)
The BIM concept is ineffective for sketch design integration of building performance
assessment because of the excessive modelling time required to construct an iBIM model.
Excessive modelling time is caused by having to construct an iBIM model that has the
required information for all building performance assessments such as, thermal, lighting, and
building material LCA, embedded to calculate accurate results for each.
Simplifying the BIM model will reduce modelling time. This is a rejection of the BIM concept
in favour of the Building Performance Sketch (BPS) concept of integration developed by Donn
et al., (2012). The BPS prescribes using simulation tools more effectively, to examine
different design options quickly, to facilitate design decision-making (Donn et al., 2012). It
advocates constructing a BPS model that is detailed enough to produce simulation results of
one area of building performance, that are accurate enough for decision-making, and no more
(Donn et al., 2012). The result, decreased modelling time and effort, while achieving
simulation accuracy requirements (Donn et al., 2012).
2.5.2 A BIM LCA Building Performance Sketch (BPS)
Applied to BIM LCA tools, the BPS concept satisfies many of the requirements for their
effective integration into sketch design. The BPS concept defines in theory how BIM LCA
tool should be used. However, in practice, it has not being applied to BIM LCA tools. Donn
et al., (2012) developed requirements that act as a guiding framework, but not the specific
details for developing a BPS for BIM LCA tools. Several critical definitions that define what a
BIM LCA BPS is are missing, and must be developed. These are:
How accurate is accurate enough for informed decision-making about building
material LCA simulation results?
What is evidence based decision-making?
What information is needed for a BIM LCA BPS?
Is the information needed available in the early phases of the design process, and to
the level of detail required to produce accurate results?
Chapter Two: Calculating Environmental Impact In The Built Environment
Using BIM To Calculate Accurate Building Material Quantities For Early Design Phase LCA
Author: Brian Berg 49
How does this information translate into a BIM model?
What building materials, and elements, need to be modelled as BIM objects and
geometry in a BIM LCA BPS model?
How does detailed do the BIM objects and geometry of the BIM LCA BPS model
need to be to produce accurate results?
Is BIM LCA BPS results worth doing, e.g. do it produce information that building
designers can use?
These questions are critical to determining if a BIM LCA BPS satisfies the outstanding
requirements of effective integration of:
Can a BIM tools use be adapted to fit within established work practices, and processes, that
building designers actually use during sketch design, whilst ensuring the simulation results are
accurate and trusted enough to enable the design team to make informed design decisions?
2.5.3 Sketch Design Decision-Making And Simulation Accuracy
Good sketch design decisions are critical to a building’s design achieving its performance
goals. A good sketch design decision is one, that despite being based on uncertain building
information, it is the same decision that would have been made if based on the detailed
information available later in the design process (Emmitt, 2010; International Energy Agency,
2004a; Löhnert et al., 2003). Critical to making a good sketch design decision is knowing the
decisions that must be made during sketch design, and those that can be made later in the
design process. Some modifications such as fine tuning, and optimisation of sketch design
decision can be made later in the design process, but to meet performance goals, the
fundamentals of a building’s design that are decided upon at sketch design cannot change
(Augenbroe, 2002, p. 897).
Good decisions about building performance, are based on the performance indicators
calculated by building performance simulation tools. To base decisions on these results, the
building designer must trust them (Attia, 2012, p. 9; Donn, 1999; Hand, Crawley, Donn, &
Lawrie, 2008). Trust is based on measures of simulation reliability presented in Table 2.5.3.
This makes these the critical components in a simulation methodology for achieving effective
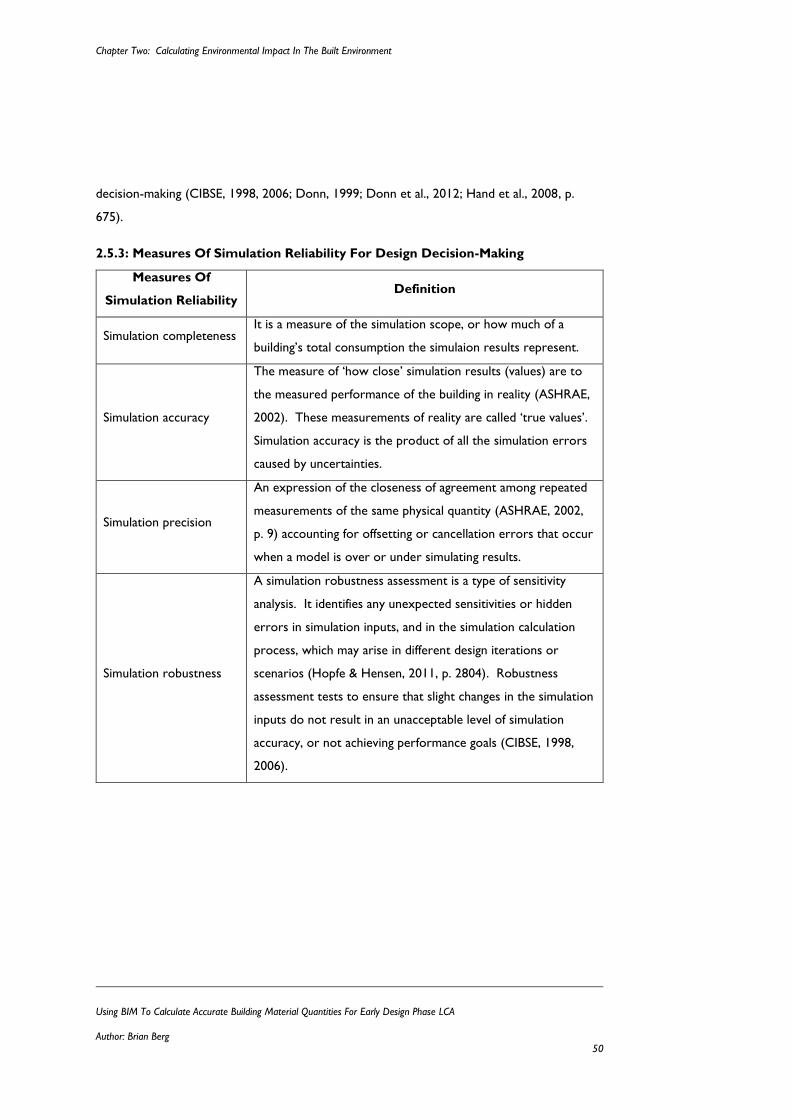
Chapter Two: Calculating Environmental Impact In The Built Environment
Using BIM To Calculate Accurate Building Material Quantities For Early Design Phase LCA
Author: Brian Berg 50
decision-making (CIBSE, 1998, 2006; Donn, 1999; Donn et al., 2012; Hand et al., 2008, p.
675).
2.5.3: Measures Of Simulation Reliability For Design Decision-Making
Measures Of
Simulation Reliability Definition
Simulation completeness It is a measure of the simulation scope, or how much of a
building’s total consumption the simulaion results represent.
Simulation accuracy
The measure of ‘how close’ simulation results (values) are to
the measured performance of the building in reality (ASHRAE,
2002). These measurements of reality are called ‘true values’.
Simulation accuracy is the product of all the simulation errors
caused by uncertainties.
Simulation precision
An expression of the closeness of agreement among repeated
measurements of the same physical quantity (ASHRAE, 2002,
p. 9) accounting for offsetting or cancellation errors that occur
when a model is over or under simulating results.
Simulation robustness
A simulation robustness assessment is a type of sensitivity
analysis. It identifies any unexpected sensitivities or hidden
errors in simulation inputs, and in the simulation calculation
process, which may arise in different design iterations or
scenarios (Hopfe & Hensen, 2011, p. 2804). Robustness
assessment tests to ensure that slight changes in the simulation
inputs do not result in an unacceptable level of simulation
accuracy, or not achieving performance goals (CIBSE, 1998,
2006).
Chapter Two: Calculating Environmental Impact In The Built Environment
Using BIM To Calculate Accurate Building Material Quantities For Early Design Phase LCA
Author: Brian Berg 51
2.6 The Problem, Calculating Material Quantities
The root cause of ineffective integration is simulation complexity, and poor simulation
accuracy. A common difficulty with any building performance simulation is assessing the
required simulation inputs that are project specific. These are inputs that vary from building
to building, such as building form, and location.
A building material LCA assessment only has two simulation inputs; LCI material coefficients,
and building material quantities. LCI material coefficients are not project specific. They are
standard inputs in any LCI or LCA calculation, meaning, they are not calculated to specifically
for a single building project. BIM LCA tools have an inbuilt database of material coefficients.
This makes the access and management of these data inputs easier for building designers,
removing many of the complexity causing problems involving the LCA material coefficients.
Discussed in Chapter Section 2.3.1, these are the accuracy, data quality, and selection of the
most appropriate LCA database for a specific building project.
In contrast to LCI material coefficients, building material quantities are project specific. They
are a LCA simulation input the building designer must calculate specifically for every building
design. The current method for their calculation is to employ a QS to produce a SOQ
(SOQ). This has not changed over the last 30 years since Baird and Chan (1983) were one
the first to use it to analyse the distribution of EE throughout a building. A SOQ, also
referred to as a bill of materials, is an itemised list of the building works, and materials
required to construct a building. Produced for cost planning purposes, a SOQ is sufficiently
detailed to achieve cost estimation requirements range from ±20% for concept design, to
±2% for detailed design ((Holm, Schaufelberger, Griffin, & Cole, 2005) cited in
(Samphaongoen, 2010)), rather than LCA requirements. Calculated through measurement
from the post design contract documentation e.g. contract drawings and specifications
(Ashworth, Hogg, & Higgs, 2007; Emmitt, 2007; Ferry, Brandon, Ferry, & Kirkham, 2007; C.
A. Langston, 2005), a complete SOQ can only be produced late in the design process,
typically after the competition of the detailed design phases (refer to Table 2.2.2 for a
definition of design phases) of the project for the start of the tender period (Brook, 2004;
Ferry et al., 2007).
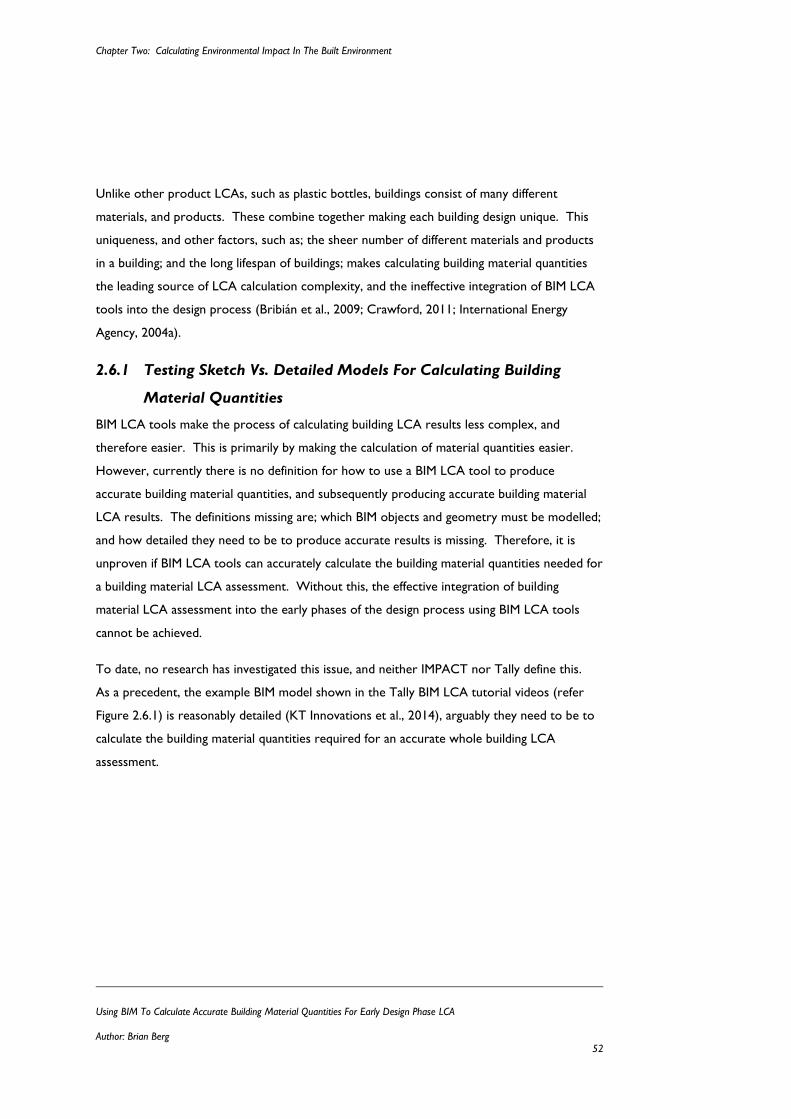
Chapter Two: Calculating Environmental Impact In The Built Environment
Using BIM To Calculate Accurate Building Material Quantities For Early Design Phase LCA
Author: Brian Berg 52
Unlike other product LCAs, such as plastic bottles, buildings consist of many different
materials, and products. These combine together making each building design unique. This
uniqueness, and other factors, such as; the sheer number of different materials and products
in a building; and the long lifespan of buildings; makes calculating building material quantities
the leading source of LCA calculation complexity, and the ineffective integration of BIM LCA
tools into the design process (Bribián et al., 2009; Crawford, 2011; International Energy
Agency, 2004a).
2.6.1 Testing Sketch Vs. Detailed Models For Calculating Building
Material Quantities
BIM LCA tools make the process of calculating building LCA results less complex, and
therefore easier. This is primarily by making the calculation of material quantities easier.
However, currently there is no definition for how to use a BIM LCA tool to produce
accurate building material quantities, and subsequently producing accurate building material
LCA results. The definitions missing are; which BIM objects and geometry must be modelled;
and how detailed they need to be to produce accurate results is missing. Therefore, it is
unproven if BIM LCA tools can accurately calculate the building material quantities needed for
a building material LCA assessment. Without this, the effective integration of building
material LCA assessment into the early phases of the design process using BIM LCA tools
cannot be achieved.
To date, no research has investigated this issue, and neither IMPACT nor Tally define this.
As a precedent, the example BIM model shown in the Tally BIM LCA tutorial videos (refer
Figure 2.6.1) is reasonably detailed (KT Innovations et al., 2014), arguably they need to be to
calculate the building material quantities required for an accurate whole building LCA
assessment.
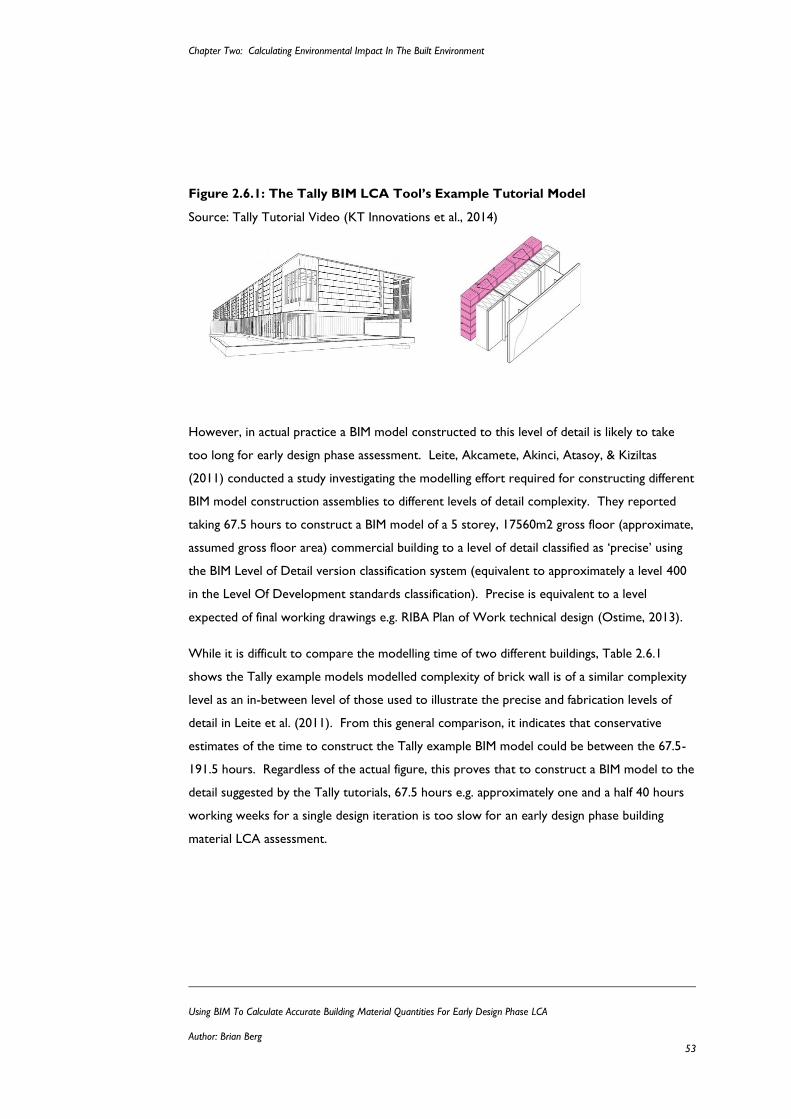
Chapter Two: Calculating Environmental Impact In The Built Environment
Using BIM To Calculate Accurate Building Material Quantities For Early Design Phase LCA
Author: Brian Berg 53
Figure 2.6.1: The Tally BIM LCA Tool’s Example Tutorial Model
Source: Tally Tutorial Video (KT Innovations et al., 2014)
However, in actual practice a BIM model constructed to this level of detail is likely to take
too long for early design phase assessment. Leite, Akcamete, Akinci, Atasoy, & Kiziltas
(2011) conducted a study investigating the modelling effort required for constructing different
BIM model construction assemblies to different levels of detail complexity. They reported
taking 67.5 hours to construct a BIM model of a 5 storey, 17560m2 gross floor (approximate,
assumed gross floor area) commercial building to a level of detail classified as ‘precise’ using
the BIM Level of Detail version classification system (equivalent to approximately a level 400
in the Level Of Development standards classification). Precise is equivalent to a level
expected of final working drawings e.g. RIBA Plan of Work technical design (Ostime, 2013).
While it is difficult to compare the modelling time of two different buildings, Table 2.6.1
shows the Tally example models modelled complexity of brick wall is of a similar complexity
level as an in-between level of those used to illustrate the precise and fabrication levels of
detail in Leite et al. (2011). From this general comparison, it indicates that conservative
estimates of the time to construct the Tally example BIM model could be between the 67.5-
191.5 hours. Regardless of the actual figure, this proves that to construct a BIM model to the
detail suggested by the Tally tutorials, 67.5 hours e.g. approximately one and a half 40 hours
working weeks for a single design iteration is too slow for an early design phase building
material LCA assessment.
Tally Example Model
Reference:
Tally information sourced from website tutorial videos (KT Innovations et al., 2014).
Tally Example Model
Reference:
Tally information sourced from website tutorial videos (KT Innovations et al., 2014).
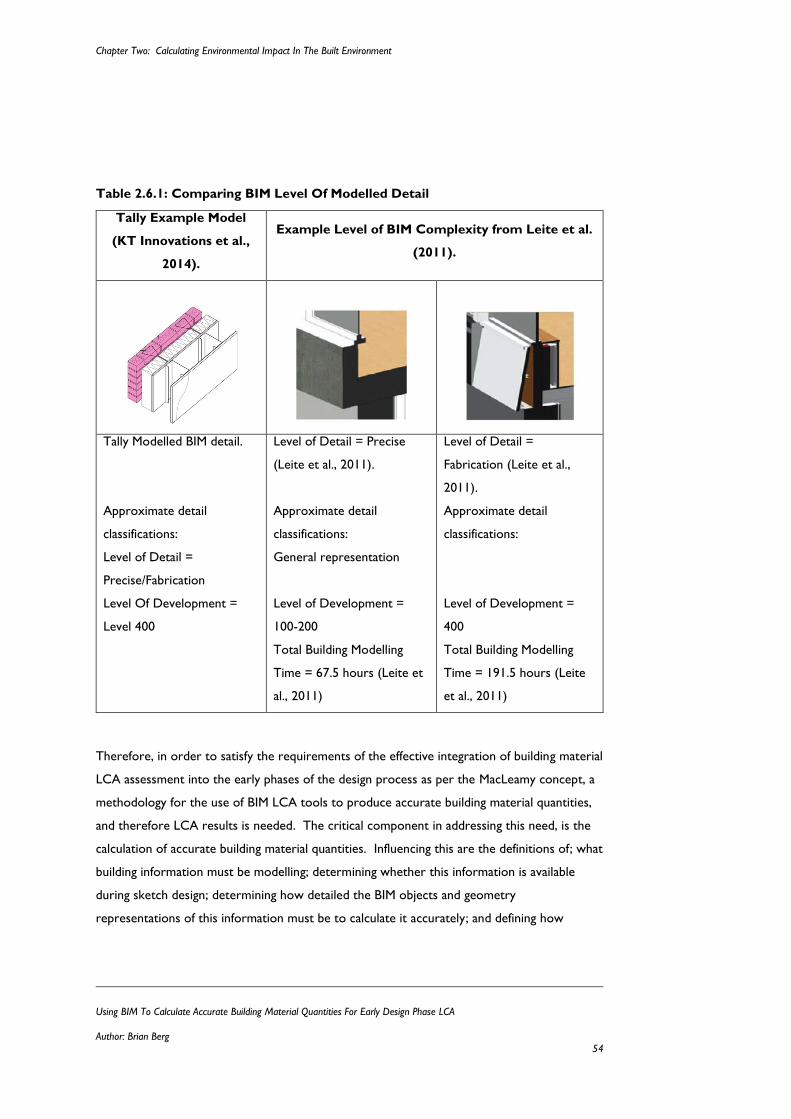
Chapter Two: Calculating Environmental Impact In The Built Environment
Using BIM To Calculate Accurate Building Material Quantities For Early Design Phase LCA
Author: Brian Berg 54
Table 2.6.1: Comparing BIM Level Of Modelled Detail
Tally Example Model
(KT Innovations et al.,
2014).
Example Level of BIM Complexity from Leite et al.
(2011).
Tally Modelled BIM detail.
Approximate detail
classifications:
Level of Detail =
Precise/Fabrication
Level Of Development =
Level 400
Level of Detail = Precise
(Leite et al., 2011).
Approximate detail
classifications:
General representation
Level of Development =
100-200
Total Building Modelling
Time = 67.5 hours (Leite et
al., 2011)
Level of Detail =
Fabrication (Leite et al.,
2011).
Approximate detail
classifications:
Level of Development =
400
Total Building Modelling
Time = 191.5 hours (Leite
et al., 2011)
Therefore, in order to satisfy the requirements of the effective integration of building material
LCA assessment into the early phases of the design process as per the MacLeamy concept, a
methodology for the use of BIM LCA tools to produce accurate building material quantities,
and therefore LCA results is needed. The critical component in addressing this need, is the
calculation of accurate building material quantities. Influencing this are the definitions of; what
building information must be modelling; determining whether this information is available
during sketch design; determining how detailed the BIM objects and geometry
representations of this information must be to calculate it accurately; and defining how
Chapter Two: Calculating Environmental Impact In The Built Environment
Using BIM To Calculate Accurate Building Material Quantities For Early Design Phase LCA
Author: Brian Berg 55
accurate is accurate enough so that building designers can make informed design decisions.
These formulate the hypothesis of this thesis research where;
By defining the accuracy required for iEE simulations, a BIM model appropriately detailed for
sketch design phase assessment will calculate building material quantities accurately enough
for whole building LCA.
Quantifying differences in BIM modelled detail is conducted by expressing the differences in
the calculated material quantities normalised into environmental impacts e.g. LCI or LCIA
indicators. This research is positioned in the context of the New Zealand construction
industry. Therefore, the most complete and robust (to current best practices) LCI based
material indicators currently available are the EE (EE) and Embodied Carbon Dioxide (ECO2)
published by Alcorn (2010). This focuses the study to the calculation of the LCI sustainable
indicator of EE at a whole building level.
The impact of basing this research in the context of the New Zealand construction industry is
that neither IMPACT nor Tally’s respective LCI databases, Ecoinvest or Gabi, are New
Zealand specific. Research has proven that using two databases instead of New Zealand
specific material coefficients has a significant impact of the detailed analysis and design
recommendations (Nebel, n.d.). Nebel (n.d.) concluded, that when conducting an LCA
assessment to achieve very strict building performance goals e.g. high levels of simulation
accuracy, or for to represent locally manufactured building products or materials produced
by specific manufactures, the generic material coefficients from international LCA database,
Ecoinvest or Gabi, should not be based within the New Zealand context.
This means neither tool can be used in this research. Using a country specific LCI databases
is important, as depending on a countries energy mix, and technology for producing building
materials and products including which are produced overseas and imported, different
building materials will have a greater proportional environmental impact. This will therefore
require them to be modelled to a greater level of detail. Excluded from using these tools, a
methodology is required for using a Level 2 BIM maturity model and BIM tool to calculate
building material quantities for the purposes of an EE assessment. This is required prior to
addressing the need to define the detailed required of a BIM model to calculate building
Chapter Two: Calculating Environmental Impact In The Built Environment
Using BIM To Calculate Accurate Building Material Quantities For Early Design Phase LCA
Author: Brian Berg 56
material quantities for a best practice compliant EE assessment in the early phases of the
design process as one example of a whole building LCA assessment.
2.7 Chapter Inference
BIM LCA tools were developed in response to the problem of excessive calculation
complexity, and the ineffective integration of LCA into the early phases of the design process.
Critiquing their use, this chapter concluded they are technical capable of producing results,
but are currently being used incorrectly, consequently not satisfying the requirements of
effective integration. The specific cause was identified as excessive modelling time brought on
by the BIM concept’s single integrated BIM model, and the lack of a best practice method for
how to conducting an accurate sketch design phase LCA assessment which defined:
What building material information i.e. individual materials, and their quantities, must
be modelled?
How detailed the BIM model must be to represent and calculate it?
Lacking these definitions, the BIM concept advocates modelling every aspect of the building in
the highest level of detail possible during each phase of the design process. As a result,
instead of resolving the problem that LCA remains unused by most building designers, it was
found that the current BIM concept contributes to it. In respect to meeting the requirements
of effective integration, the BIM concept is fundamentally is flawed. Therefore, to realise the
thesis aim, an alternative methodology concept must be applied to BIM LCA tools. The BPS
concept (BPS) developed by Donn et al., (2012) was identified as the most appropriate. Being
derived from the requirements of effective integration, developing a BIM LCA BPS would
achieve effective integration of LCA into sketch design. However, a critique of the BPS
framework concluded that it too lacked the same specific details as the BIM concept for
definitions the best practice methods of how to conducting an accurate sketch design phase
LCA assessment. Translated, these became the thesis hypothesis, whereby, defining the
accuracy required for iEE simulations, a BIM model of sketch design detail will calculate
building material quantities accurately enough for a building material LCA assessment.
Chapter Three: Research Methodology
Using BIM To Calculate Accurate Building Material Quantities For Early Design Phase LCA
Author: Brian Berg 57
Chapter Three:
3 RESEARCH METHODOLOGY
3.1 Chapter Intent
This thesis addresses the problem that:
The current methods of using Building Information (BIM) LCA (LCA) tools do
not enable the effective integration of the LCA environmental framework for
building materials into the early phases of the design process.
Solving this problem, a methodology for the correct usage of BIM LCA tools must be
developed. A successful methodology is one where, the requirements of effective integration
are satisfied. This is achieved by reducing modelling time, whilst maintaining the simulation
accuracy. Within the BIM LCA calculation process, constructing the BIM model to calculate
building material quantities is the largest contributor to modelling time. Defining how
detailed a BIM model must be to produce accurate enough results, is the critical definition in
developing a successful methodology for the use of BIM LCA tools. This requires answering
the research question of:
How detailed does a BIM model need to be to calculate accurate building
material quantities for a building material LCA assessment?
This research focusses on iEE (iEE), to prove the feasibility of using a BIM LCA tool to
produce an accurate LCA-based result, answering the research question, and solving the
research aim. EE (iEE) is a LCI-based indicator, commonly calculated as part of a larger LCA
building study. Using iEE as one example of a LCA result, this Chapter describes the design
of the thesis’ research methodology for testing the hypothesis that:
Chapter Three: Research Methodology
Using BIM To Calculate Accurate Building Material Quantities For Early Design Phase LCA
Author: Brian Berg 58
Defining the accuracy required for EE (iEE) simulations, a BIM model of sketch
design detail will calculate building material quantities accurately enough for a
building material LCA assessment.
3.2 Research Design And Objectives
3.2.1 The Thesis Hypothesis Testing Process
This thesis addresses the problem that the integration of LCA framework into the sketch
design phase of the design process is ineffective. This has been an obstacle limiting building
design team’s use of the LCA framework as a design tool for reducing a building’s
environmental impact. Chapter 2.0 identified that excessive calculation complexities,
specifically those involving the calculation of accurate building material quantities, are a leading
cause.
While numerous LCA tools, such as BIM LCA tools like IMPACT and Tally, have been
developed to resolve this problem, they remain ineffective. The gap in LCA knowledge this
thesis fulfils is the development of a methodology for using BIM LCA tools, to ensure they
quickly, and easily, calculate accurate building material quantities so they can be effectively
integrated into sketch design. The outcome of this methodology is an iEE BPS model. This is
a simplified BIM model, constructed from sketch design information that reduces reducing
modelling time, and effort. This thesis’ hypothesis specifically tests if the iEE BPS model is
sufficiently detailed to calculate building material quantities for an accurate building material
LCA assessment.
The research design to test the hypothesis is centred on 3 key ideas. Firstly, what is an iEE
sketch design phase BIM model? This is answered by defining which building elements can,
and must be modelled to incorporate iEE results into sketch design phase design decisions?
As well as, how detailed can they be modelled using the building information available at
sketch design? The outcome is the definition of an iEE BIM LCA BPS model. Secondly, does
the iEE BIM LCA BPS model calculate enough of a buildings total iEE to be effective for
informed decision-making? Thirdly, is the iEE BIM LCA BPS model sufficiently detailed be to
produce iEE results accurate enough for informed decision-making. This defines if the iEE
BIM LCA BPS model is sufficiently detailed.
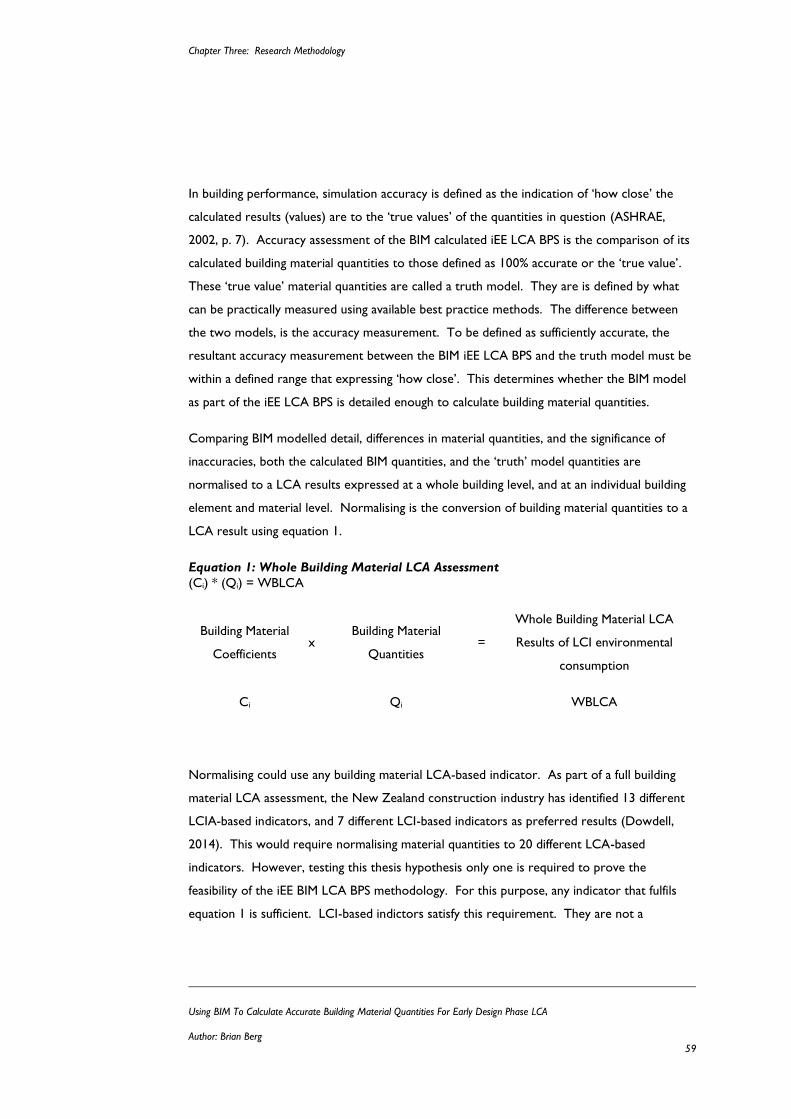
Chapter Three: Research Methodology
Using BIM To Calculate Accurate Building Material Quantities For Early Design Phase LCA
Author: Brian Berg 59
In building performance, simulation accuracy is defined as the indication of ‘how close’ the
calculated results (values) are to the ‘true values’ of the quantities in question (ASHRAE,
2002, p. 7). Accuracy assessment of the BIM calculated iEE LCA BPS is the comparison of its
calculated building material quantities to those defined as 100% accurate or the ‘true value’.
These ‘true value’ material quantities are called a truth model. They are is defined by what
can be practically measured using available best practice methods. The difference between
the two models, is the accuracy measurement. To be defined as sufficiently accurate, the
resultant accuracy measurement between the BIM iEE LCA BPS and the truth model must be
within a defined range that expressing ‘how close’. This determines whether the BIM model
as part of the iEE LCA BPS is detailed enough to calculate building material quantities.
Comparing BIM modelled detail, differences in material quantities, and the significance of
inaccuracies, both the calculated BIM quantities, and the ‘truth’ model quantities are
normalised to a LCA results expressed at a whole building level, and at an individual building
element and material level. Normalising is the conversion of building material quantities to a
LCA result using equation 1.
Equation 1: Whole Building Material LCA Assessment
(Ci) * (Qi) = WBLCA
Building Material
Coefficients x
Building Material
Quantities =
Whole Building Material LCA
Results of LCI environmental
consumption
Ci Qi WBLCA
Normalising could use any building material LCA-based indicator. As part of a full building
material LCA assessment, the New Zealand construction industry has identified 13 different
LCIA-based indicators, and 7 different LCI-based indicators as preferred results (Dowdell,
2014). This would require normalising material quantities to 20 different LCA-based
indicators. However, testing this thesis hypothesis only one is required to prove the
feasibility of the iEE BIM LCA BPS methodology. For this purpose, any indicator that fulfils
equation 1 is sufficient. LCI-based indictors satisfy this requirement. They are not a
Chapter Three: Research Methodology
Using BIM To Calculate Accurate Building Material Quantities For Early Design Phase LCA
Author: Brian Berg 60
complete building material LCA assessment, as they only measure environmental
consumption (LCI results), not environmental impact (LCIA results). The weighting factors
that convert LCI environmental consumption results into LCIA result measuring
environmental impact results are not applied. LCA assessment of this scope are commonly
called streamlined LCAs. EE (EE) is one example, and has been selected for this thesis
research.
Selection was determined by data availability. Alcorn’s (2010) hybrid process/input-output EE
database is the only source of LCA data specific to New Zealand that is currently available
that uses a current best practice calculation method. This is significant as, hybrid EE
calculation methods are the best practice measurement method of the EE of building
materials, making them integral part of the ‘true value’ definition of EE simulation accuracy.
3.2.2 The Relationship Between LCA And EE
EE is one type of LCI-based indicator that is commonly calculated as part of a larger building
LCA assessment. It is the sum of energy consumption, in all the activities necessary to in a
process, such as creating a building material like concrete. EE comprises of direct and
indirect components (Baird & Chan, 1983; Manish Kumar Dixit et al., 2010). In the building
industry, direct energy is energy consumed onsite and offsite, by processes such as,
construction, prefabrication, assembly, transportation and administration. Indirect energy is
the energy consumed in manufacturing building materials, renovation, refurbishment and the
demolition and disposal of the building materials (Manish Kumar Dixit et al., 2010). The EE of
building materials is the direct and indirect energy consumption during the manufacturing
building lifecycle stage only. This is frequently referred to as a ‘cradle to factory gate’ LCA
assessment.
An EE Calculation: The Calculation Methods Of Building Material Coefficients
Commonly referred to as a calculation, EE material coefficients are actually measurements of
direct and indirect energy consumption. The complexity, detail, and number of inputs and
outputs included in a coefficient depends on the definition and scope of the iEE study.
Typically, this includes the energy consumption of the direct inputs and outputs of the
manufacturing process, and all the inputs and outputs upstream of the material’s
manufacturing stage (Crawford, 2011, p. 91). Upstream describes the process throughout a
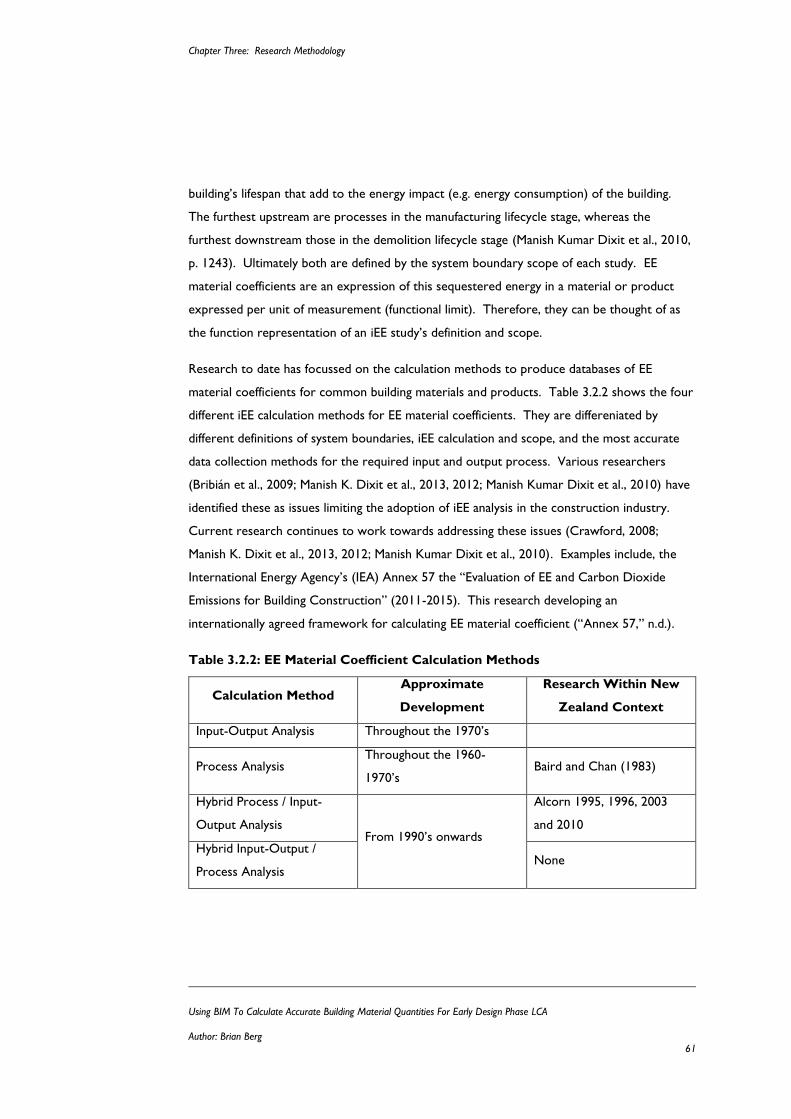
Chapter Three: Research Methodology
Using BIM To Calculate Accurate Building Material Quantities For Early Design Phase LCA
Author: Brian Berg 61
building’s lifespan that add to the energy impact (e.g. energy consumption) of the building.
The furthest upstream are processes in the manufacturing lifecycle stage, whereas the
furthest downstream those in the demolition lifecycle stage (Manish Kumar Dixit et al., 2010,
p. 1243). Ultimately both are defined by the system boundary scope of each study. EE
material coefficients are an expression of this sequestered energy in a material or product
expressed per unit of measurement (functional limit). Therefore, they can be thought of as
the function representation of an iEE study’s definition and scope.
Research to date has focussed on the calculation methods to produce databases of EE
material coefficients for common building materials and products. Table 3.2.2 shows the four
different iEE calculation methods for EE material coefficients. They are differeniated by
different definitions of system boundaries, iEE calculation and scope, and the most accurate
data collection methods for the required input and output process. Various researchers
(Bribián et al., 2009; Manish K. Dixit et al., 2013, 2012; Manish Kumar Dixit et al., 2010) have
identified these as issues limiting the adoption of iEE analysis in the construction industry.
Current research continues to work towards addressing these issues (Crawford, 2008;
Manish K. Dixit et al., 2013, 2012; Manish Kumar Dixit et al., 2010). Examples include, the
International Energy Agency’s (IEA) Annex 57 the “Evaluation of EE and Carbon Dioxide
Emissions for Building Construction” (2011-2015). This research developing an
internationally agreed framework for calculating EE material coefficient (“Annex 57,” n.d.).
Table 3.2.2: EE Material Coefficient Calculation Methods
Calculation Method Approximate
Development
Research Within New
Zealand Context
Input-Output Analysis Throughout the 1970’s
Process Analysis Throughout the 1960-
1970’s Baird and Chan (1983)
Hybrid Process / Input-
Output Analysis From 1990’s onwards
Alcorn 1995, 1996, 2003
and 2010
Hybrid Input-Output /
Process Analysis None
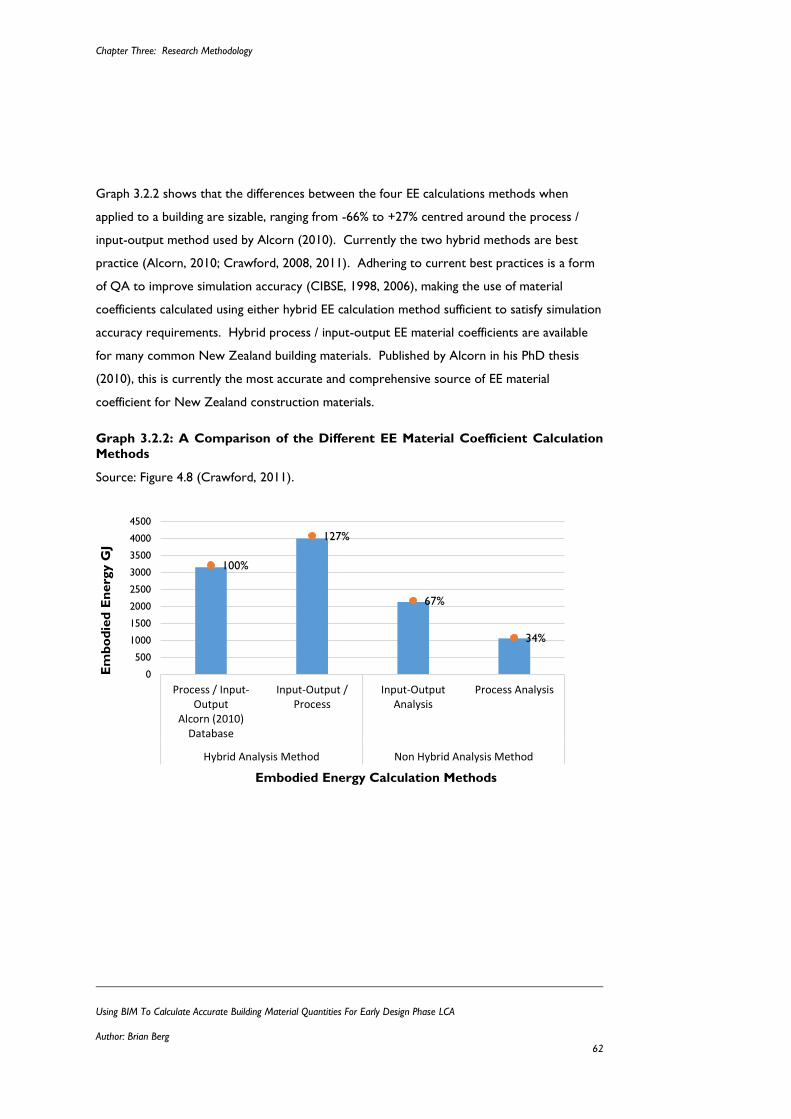
Chapter Three: Research Methodology
Using BIM To Calculate Accurate Building Material Quantities For Early Design Phase LCA
Author: Brian Berg 62
Graph 3.2.2 shows that the differences between the four EE calculations methods when
applied to a building are sizable, ranging from -66% to +27% centred around the process /
input-output method used by Alcorn (2010). Currently the two hybrid methods are best
practice (Alcorn, 2010; Crawford, 2008, 2011). Adhering to current best practices is a form
of QA to improve simulation accuracy (CIBSE, 1998, 2006), making the use of material
coefficients calculated using either hybrid EE calculation method sufficient to satisfy simulation
accuracy requirements. Hybrid process / input-output EE material coefficients are available
for many common New Zealand building materials. Published by Alcorn in his PhD thesis
(2010), this is currently the most accurate and comprehensive source of EE material
coefficient for New Zealand construction materials.
Graph 3.2.2: A Comparison of the Different EE Material Coefficient Calculation
Methods
Source: Figure 4.8 (Crawford, 2011).
100%
127%
67%
34%
0%
20%
40%
60%
80%
100%
120%
140%
0
500
1000
1500
2000
2500
3000
3500
4000
4500
Process / Input-Output
Alcorn (2010)Database
Input-Output /Process
Input-OutputAnalysis
Process Analysis
Hybrid Analysis Method Non Hybrid Analysis Method
Axi
s Ti
tle
Em
bo
die
d E
nerg
y G
J
Embodied Energy Calculation Methods
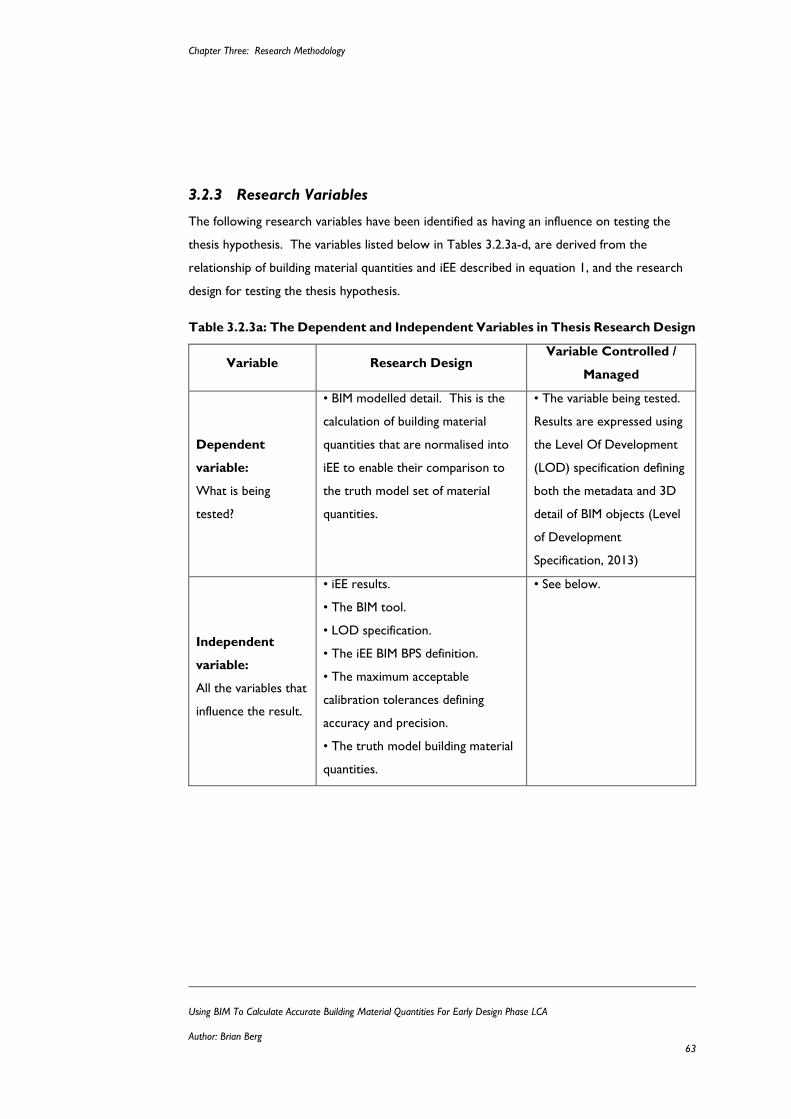
Chapter Three: Research Methodology
Using BIM To Calculate Accurate Building Material Quantities For Early Design Phase LCA
Author: Brian Berg 63
3.2.3 Research Variables
The following research variables have been identified as having an influence on testing the
thesis hypothesis. The variables listed below in Tables 3.2.3a-d, are derived from the
relationship of building material quantities and iEE described in equation 1, and the research
design for testing the thesis hypothesis.
Table 3.2.3a: The Dependent and Independent Variables in Thesis Research Design
Variable Research Design Variable Controlled /
Managed
Dependent
variable:
What is being
tested?
• BIM modelled detail. This is the
calculation of building material
quantities that are normalised into
iEE to enable their comparison to
the truth model set of material
quantities.
• The variable being tested.
Results are expressed using
the Level Of Development
(LOD) specification defining
both the metadata and 3D
detail of BIM objects (Level
of Development
Specification, 2013)
Independent
variable:
All the variables that
influence the result.
• iEE results.
• The BIM tool.
• LOD specification.
• The iEE BIM BPS definition.
• The maximum acceptable
calibration tolerances defining
accuracy and precision.
• The truth model building material
quantities.
• See below.
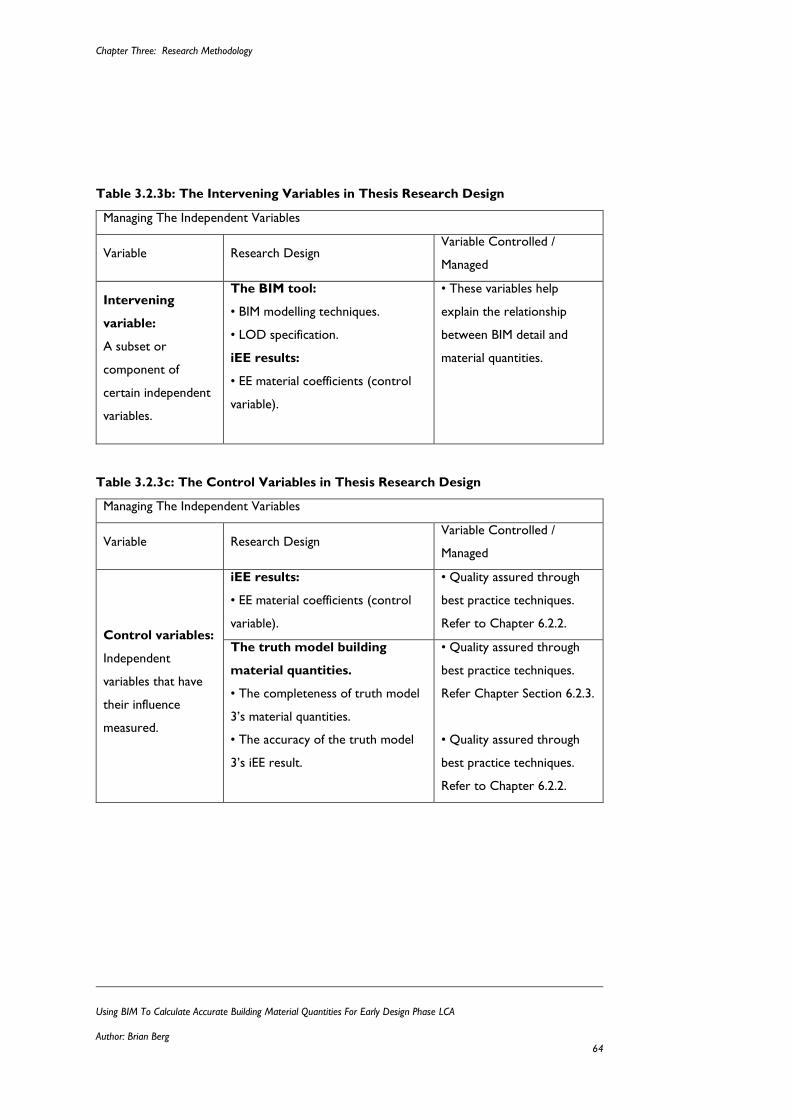
Chapter Three: Research Methodology
Using BIM To Calculate Accurate Building Material Quantities For Early Design Phase LCA
Author: Brian Berg 64
Table 3.2.3b: The Intervening Variables in Thesis Research Design
Managing The Independent Variables
Variable Research Design Variable Controlled /
Managed
Intervening
variable:
A subset or
component of
certain independent
variables.
The BIM tool:
• BIM modelling techniques.
• LOD specification.
iEE results:
• EE material coefficients (control
variable).
• These variables help
explain the relationship
between BIM detail and
material quantities.
Table 3.2.3c: The Control Variables in Thesis Research Design
Managing The Independent Variables
Variable Research Design Variable Controlled /
Managed
Control variables:
Independent
variables that have
their influence
measured.
iEE results:
• EE material coefficients (control
variable).
• Quality assured through
best practice techniques.
Refer to Chapter 6.2.2.
The truth model building
material quantities.
• The completeness of truth model
3’s material quantities.
• The accuracy of the truth model
3’s iEE result.
• Quality assured through
best practice techniques.
Refer Chapter Section 6.2.3.
• Quality assured through
best practice techniques.
Refer to Chapter 6.2.2.
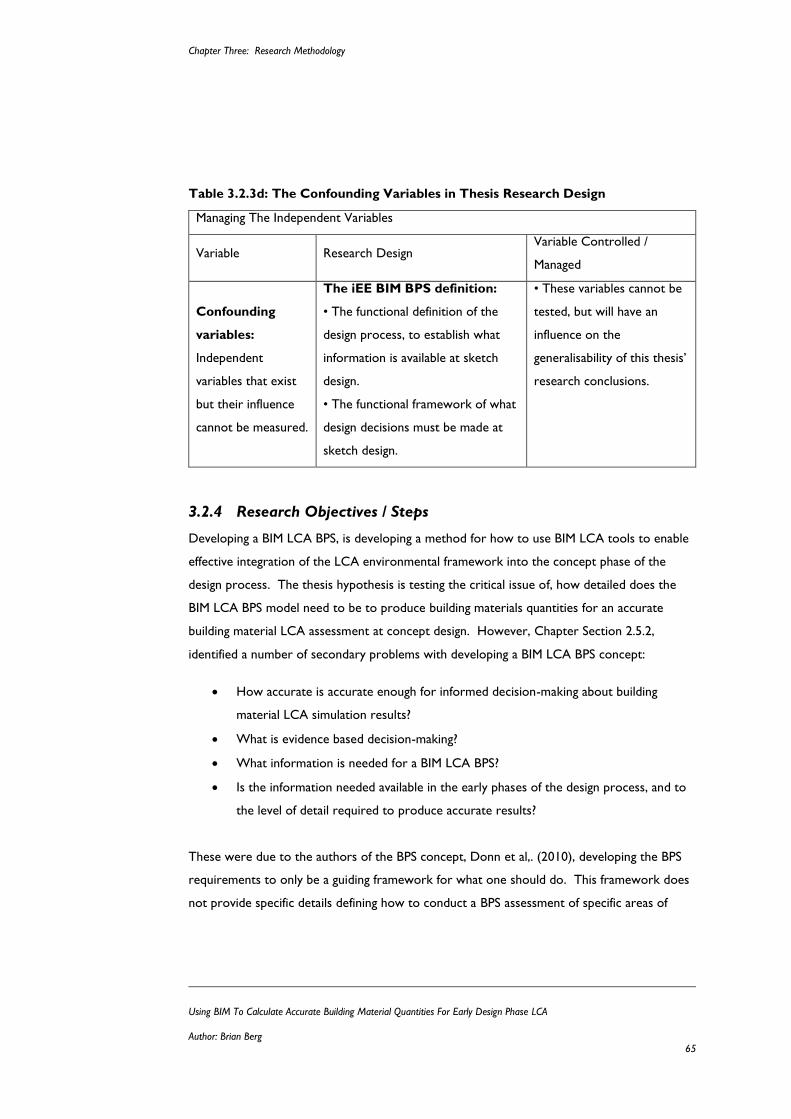
Chapter Three: Research Methodology
Using BIM To Calculate Accurate Building Material Quantities For Early Design Phase LCA
Author: Brian Berg 65
Table 3.2.3d: The Confounding Variables in Thesis Research Design
Managing The Independent Variables
Variable Research Design Variable Controlled /
Managed
Confounding
variables:
Independent
variables that exist
but their influence
cannot be measured.
The iEE BIM BPS definition:
• The functional definition of the
design process, to establish what
information is available at sketch
design.
• The functional framework of what
design decisions must be made at
sketch design.
• These variables cannot be
tested, but will have an
influence on the
generalisability of this thesis’
research conclusions.
3.2.4 Research Objectives / Steps
Developing a BIM LCA BPS, is developing a method for how to use BIM LCA tools to enable
effective integration of the LCA environmental framework into the concept phase of the
design process. The thesis hypothesis is testing the critical issue of, how detailed does the
BIM LCA BPS model need to be to produce building materials quantities for an accurate
building material LCA assessment at concept design. However, Chapter Section 2.5.2,
identified a number of secondary problems with developing a BIM LCA BPS concept:
How accurate is accurate enough for informed decision-making about building
material LCA simulation results?
What is evidence based decision-making?
What information is needed for a BIM LCA BPS?
Is the information needed available in the early phases of the design process, and to
the level of detail required to produce accurate results?
These were due to the authors of the BPS concept, Donn et al,. (2010), developing the BPS
requirements to only be a guiding framework for what one should do. This framework does
not provide specific details defining how to conduct a BPS assessment of specific areas of
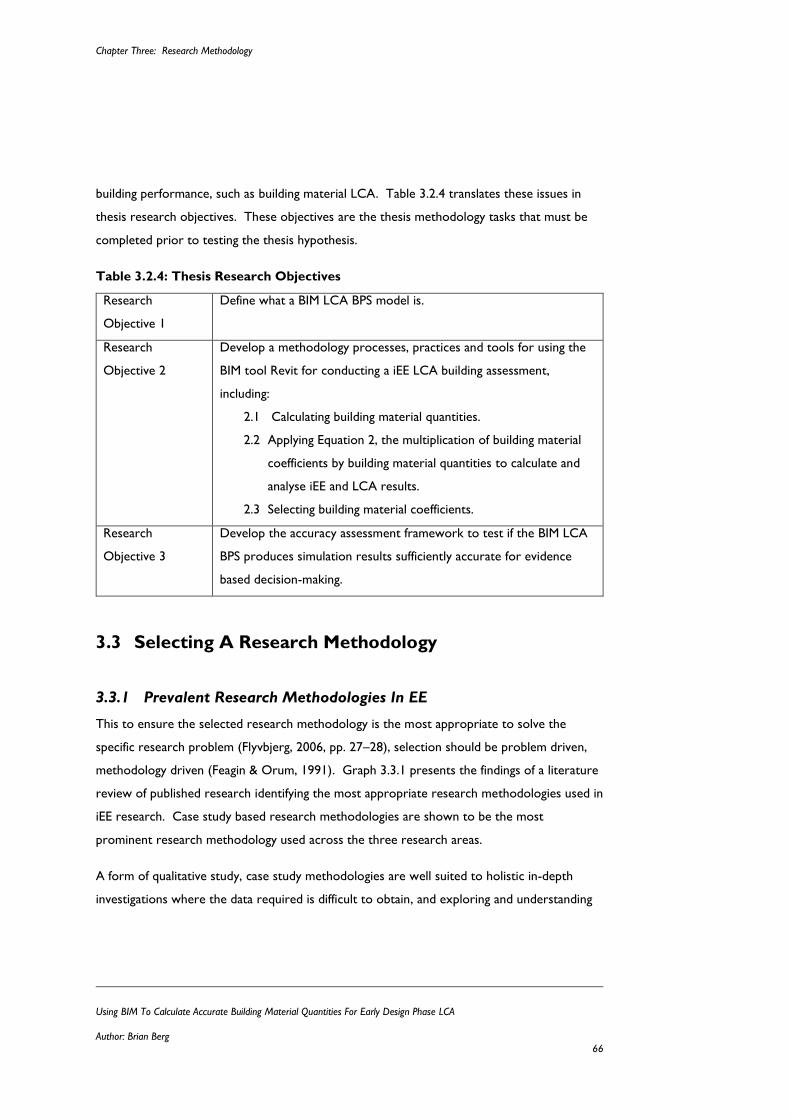
Chapter Three: Research Methodology
Using BIM To Calculate Accurate Building Material Quantities For Early Design Phase LCA
Author: Brian Berg 66
building performance, such as building material LCA. Table 3.2.4 translates these issues in
thesis research objectives. These objectives are the thesis methodology tasks that must be
completed prior to testing the thesis hypothesis.
Table 3.2.4: Thesis Research Objectives
Research
Objective 1
Define what a BIM LCA BPS model is.
Research
Objective 2
Develop a methodology processes, practices and tools for using the
BIM tool Revit for conducting a iEE LCA building assessment,
including:
2.1 Calculating building material quantities.
2.2 Applying Equation 2, the multiplication of building material
coefficients by building material quantities to calculate and
analyse iEE and LCA results.
2.3 Selecting building material coefficients.
Research
Objective 3
Develop the accuracy assessment framework to test if the BIM LCA
BPS produces simulation results sufficiently accurate for evidence
based decision-making.
3.3 Selecting A Research Methodology
3.3.1 Prevalent Research Methodologies In EE
This to ensure the selected research methodology is the most appropriate to solve the
specific research problem (Flyvbjerg, 2006, pp. 27–28), selection should be problem driven,
methodology driven (Feagin & Orum, 1991). Graph 3.3.1 presents the findings of a literature
review of published research identifying the most appropriate research methodologies used in
iEE research. Case study based research methodologies are shown to be the most
prominent research methodology used across the three research areas.
A form of qualitative study, case study methodologies are well suited to holistic in-depth
investigations where the data required is difficult to obtain, and exploring and understanding
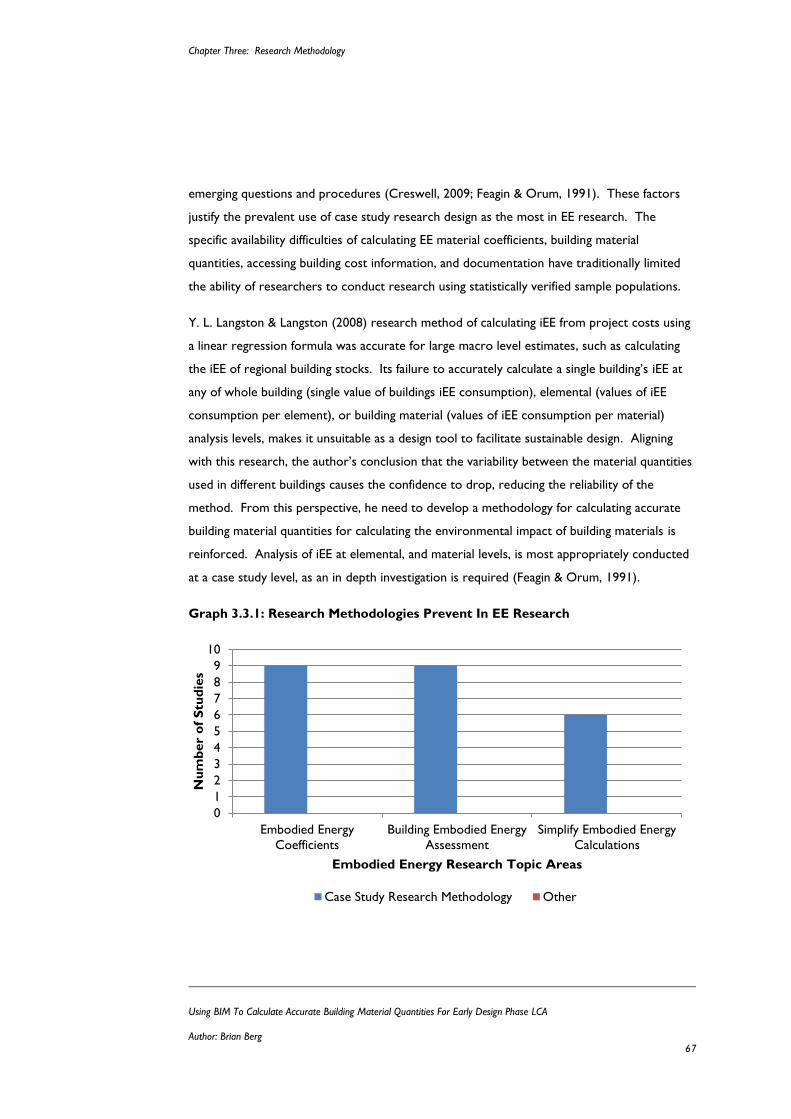
Chapter Three: Research Methodology
Using BIM To Calculate Accurate Building Material Quantities For Early Design Phase LCA
Author: Brian Berg 67
emerging questions and procedures (Creswell, 2009; Feagin & Orum, 1991). These factors
justify the prevalent use of case study research design as the most in EE research. The
specific availability difficulties of calculating EE material coefficients, building material
quantities, accessing building cost information, and documentation have traditionally limited
the ability of researchers to conduct research using statistically verified sample populations.
Y. L. Langston & Langston (2008) research method of calculating iEE from project costs using
a linear regression formula was accurate for large macro level estimates, such as calculating
the iEE of regional building stocks. Its failure to accurately calculate a single building’s iEE at
any of whole building (single value of buildings iEE consumption), elemental (values of iEE
consumption per element), or building material (values of iEE consumption per material)
analysis levels, makes it unsuitable as a design tool to facilitate sustainable design. Aligning
with this research, the author’s conclusion that the variability between the material quantities
used in different buildings causes the confidence to drop, reducing the reliability of the
method. From this perspective, he need to develop a methodology for calculating accurate
building material quantities for calculating the environmental impact of building materials is
reinforced. Analysis of iEE at elemental, and material levels, is most appropriately conducted
at a case study level, as an in depth investigation is required (Feagin & Orum, 1991).
Graph 3.3.1: Research Methodologies Prevent In EE Research
0
1
2
3
4
5
6
7
8
9
10
Embodied Energy
Coefficients
Building Embodied Energy
Assessment
Simplify Embodied Energy
Calculations
Nu
mb
er
of
Stu
die
s
Embodied Energy Research Topic Areas
Case Study Research Methodology Other
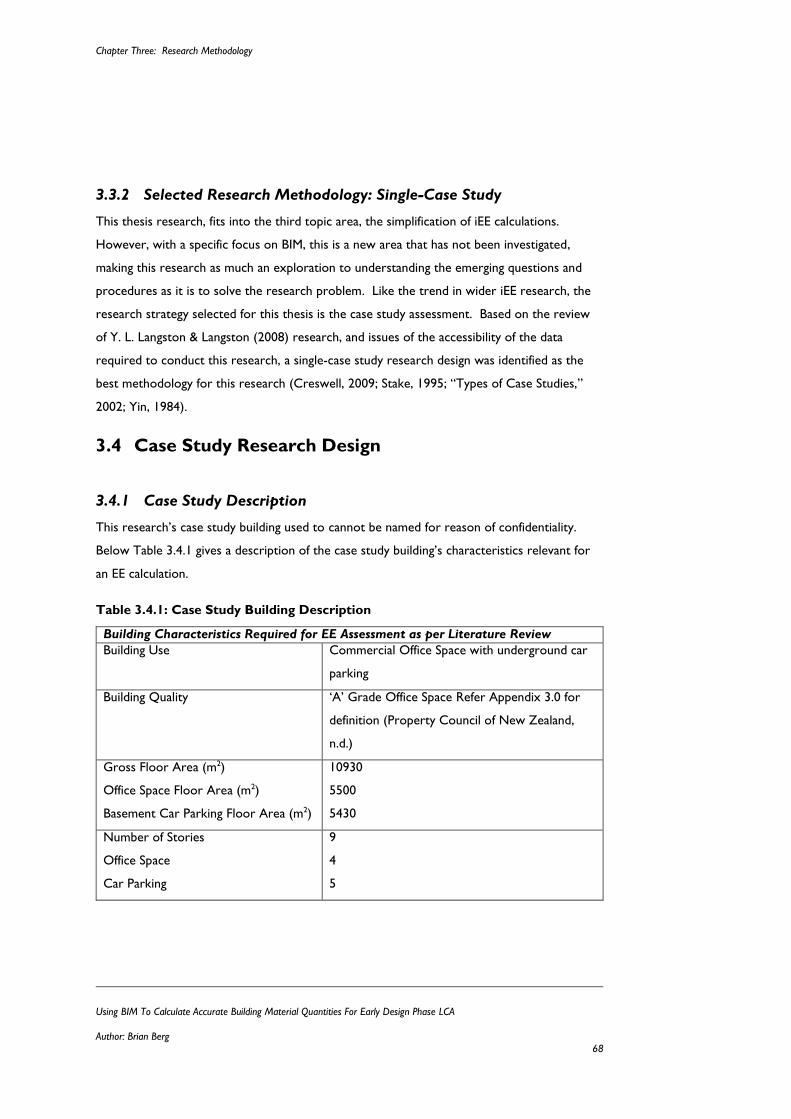
Chapter Three: Research Methodology
Using BIM To Calculate Accurate Building Material Quantities For Early Design Phase LCA
Author: Brian Berg 68
3.3.2 Selected Research Methodology: Single-Case Study
This thesis research, fits into the third topic area, the simplification of iEE calculations.
However, with a specific focus on BIM, this is a new area that has not been investigated,
making this research as much an exploration to understanding the emerging questions and
procedures as it is to solve the research problem. Like the trend in wider iEE research, the
research strategy selected for this thesis is the case study assessment. Based on the review
of Y. L. Langston & Langston (2008) research, and issues of the accessibility of the data
required to conduct this research, a single-case study research design was identified as the
best methodology for this research (Creswell, 2009; Stake, 1995; “Types of Case Studies,”
2002; Yin, 1984).
3.4 Case Study Research Design
3.4.1 Case Study Description
This research’s case study building used to cannot be named for reason of confidentiality.
Below Table 3.4.1 gives a description of the case study building’s characteristics relevant for
an EE calculation.
Table 3.4.1: Case Study Building Description
Building Characteristics Required for EE Assessment as per Literature Review
Building Use Commercial Office Space with underground car
parking
Building Quality ‘A’ Grade Office Space Refer Appendix 3.0 for
definition (Property Council of New Zealand,
n.d.)
Gross Floor Area (m2)
Office Space Floor Area (m2)
Basement Car Parking Floor Area (m2)
10930
5500
5430
Number of Stories
Office Space
Car Parking
9
4
5
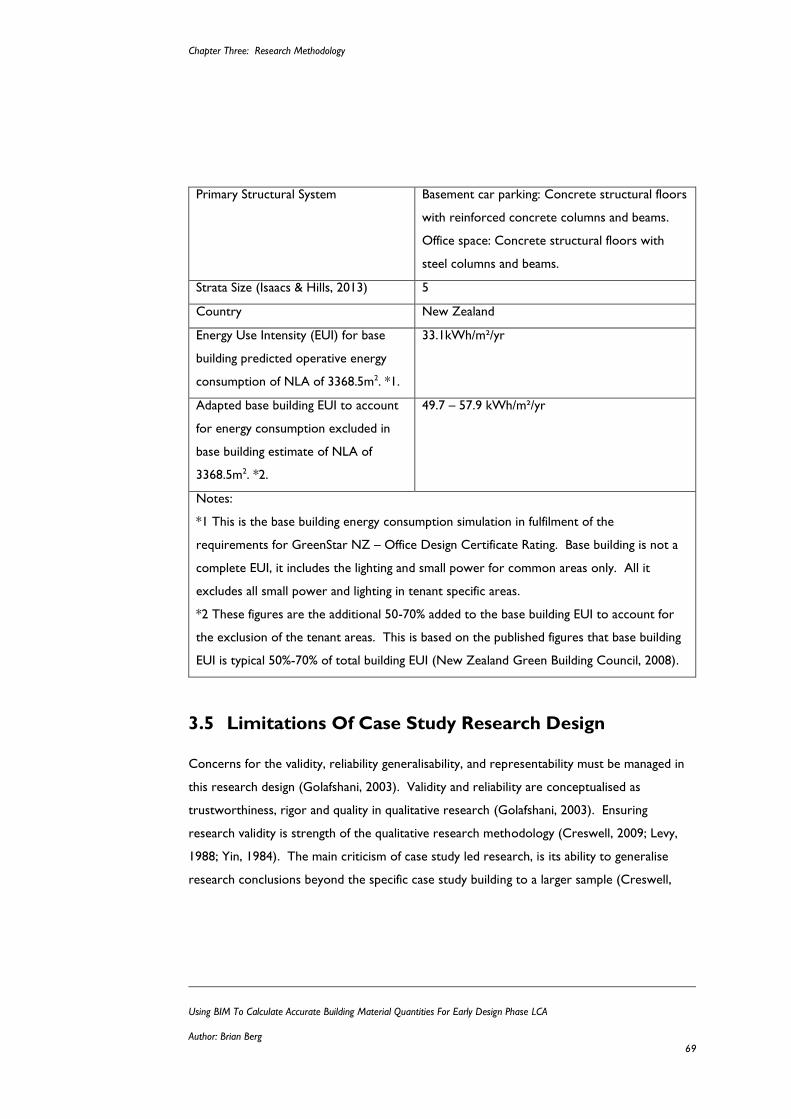
Chapter Three: Research Methodology
Using BIM To Calculate Accurate Building Material Quantities For Early Design Phase LCA
Author: Brian Berg 69
Primary Structural System Basement car parking: Concrete structural floors
with reinforced concrete columns and beams.
Office space: Concrete structural floors with
steel columns and beams.
Strata Size (Isaacs & Hills, 2013) 5
Country New Zealand
Energy Use Intensity (EUI) for base
building predicted operative energy
consumption of NLA of 3368.5m2. *1.
33.1kWh/m²/yr
Adapted base building EUI to account
for energy consumption excluded in
base building estimate of NLA of
3368.5m2. *2.
49.7 – 57.9 kWh/m²/yr
Notes:
*1 This is the base building energy consumption simulation in fulfilment of the
requirements for GreenStar NZ – Office Design Certificate Rating. Base building is not a
complete EUI, it includes the lighting and small power for common areas only. All it
excludes all small power and lighting in tenant specific areas.
*2 These figures are the additional 50-70% added to the base building EUI to account for
the exclusion of the tenant areas. This is based on the published figures that base building
EUI is typical 50%-70% of total building EUI (New Zealand Green Building Council, 2008).
3.5 Limitations Of Case Study Research Design
Concerns for the validity, reliability generalisability, and representability must be managed in
this research design (Golafshani, 2003). Validity and reliability are conceptualised as
trustworthiness, rigor and quality in qualitative research (Golafshani, 2003). Ensuring
research validity is strength of the qualitative research methodology (Creswell, 2009; Levy,
1988; Yin, 1984). The main criticism of case study led research, is its ability to generalise
research conclusions beyond the specific case study building to a larger sample (Creswell,
Chapter Three: Research Methodology
Using BIM To Calculate Accurate Building Material Quantities For Early Design Phase LCA
Author: Brian Berg 70
2009; Flyvbjerg, 2006). The following Chapter Sections of 3.5 manage these issues for this
thesis research.
3.5.1 Research Generalisability And Representativeness
While the ability to make generalisations from this single case study is limited, Flyvbjerg, Levy,
Tellis and Yin (2006; 1988; 1997; 1984) argue it is possible to make generalisations from a
single case study, but it depends on the type of generalisations you want to make. Case study
research is effective in confirming or challenge existing theories, for revelatory cases of an
issue previously inaccessible, or represent a ‘unique’ or ‘extreme case’. This thesis research
is investigating a new iEE and LCA research area, making it revelatory.
The generalisability of this research was increased by case study selection (Flyvbjerg, 2006).
The typology of the case study building, and the nature of iEE allows the case study building
to be representative of both the existing commercial office building stock and for new/future
construction of the same typology for the following reasons:
Based on building typology, Tables 3.5.1a and 3.5.1b show that the case study
building’s typology matches many of the building typology parameters and sub
parameters.
The case study building is an a ‘green’ or low energy commercial office building,
reflective of the rising trend in new and future building design.
Whole building EE does not change significantly between the buildings typical of the
existing building stock and ‘green’ low energy buildings.
The case study matching of construction typologies dominant of the existing strata 4 building
stock; being an extreme example of ‘green’ low energy building design; and the fact that EE
does not change significantly as a building’s operative energy consumption is lowered; all
mean the selected case study building is a good representation of the existing building stock
and the current and future trends in building design. The following sections discuss in detail
how this is achieved.
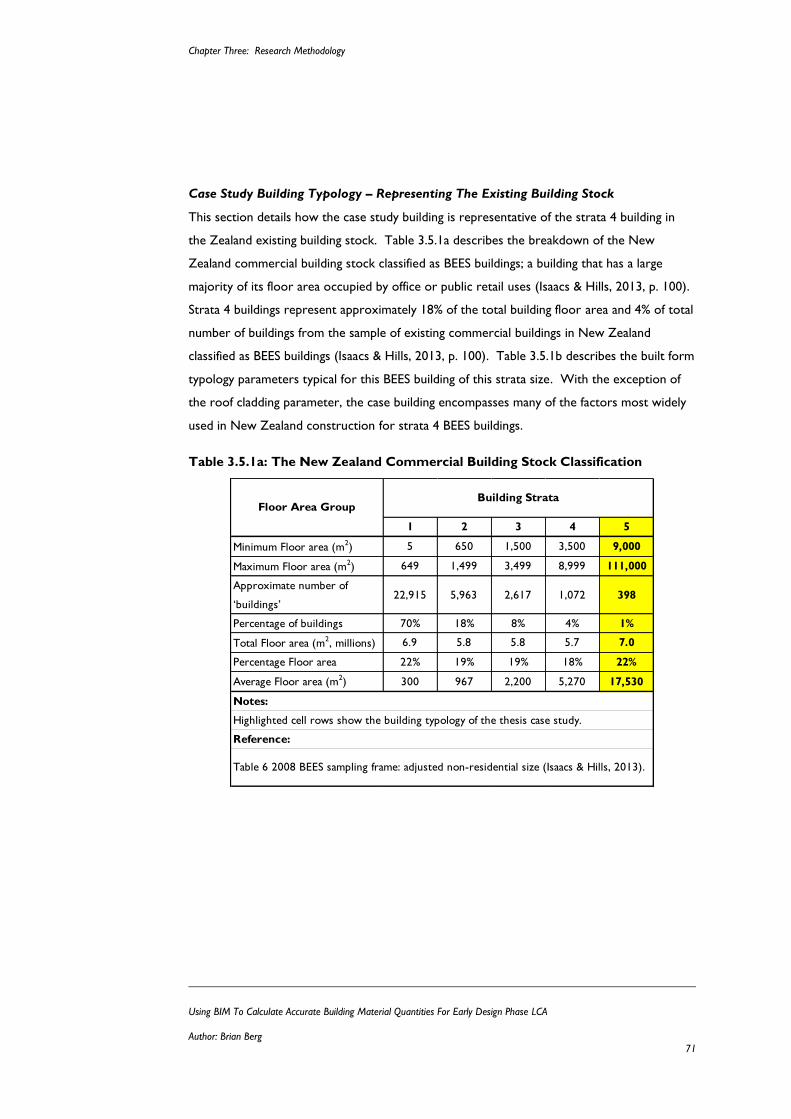
Chapter Three: Research Methodology
Using BIM To Calculate Accurate Building Material Quantities For Early Design Phase LCA
Author: Brian Berg 71
Case Study Building Typology – Representing The Existing Building Stock
This section details how the case study building is representative of the strata 4 building in
the Zealand existing building stock. Table 3.5.1a describes the breakdown of the New
Zealand commercial building stock classified as BEES buildings; a building that has a large
majority of its floor area occupied by office or public retail uses (Isaacs & Hills, 2013, p. 100).
Strata 4 buildings represent approximately 18% of the total building floor area and 4% of total
number of buildings from the sample of existing commercial buildings in New Zealand
classified as BEES buildings (Isaacs & Hills, 2013, p. 100). Table 3.5.1b describes the built form
typology parameters typical for this BEES building of this strata size. With the exception of
the roof cladding parameter, the case building encompasses many of the factors most widely
used in New Zealand construction for strata 4 BEES buildings.
Table 3.5.1a: The New Zealand Commercial Building Stock Classification
1 2 3 4 5
Minimum Floor area (m2) 5 650 1,500 3,500 9,000
Maximum Floor area (m2) 649 1,499 3,499 8,999 111,000
Approximate number of
‘buildings’22,915 5,963 2,617 1,072 398
Percentage of buildings 70% 18% 8% 4% 1%
Total Floor area (m2, millions) 6.9 5.8 5.8 5.7 7.0
Percentage Floor area 22% 19% 19% 18% 22%
Average Floor area (m2) 300 967 2,200 5,270 17,530
Floor Area Group
Notes:
Highlighted cell rows show the building typology of the thesis case study.
Reference:
Table 6 2008 BEES sampling frame: adjusted non-residential size (Isaacs & Hills, 2013).
Building Strata
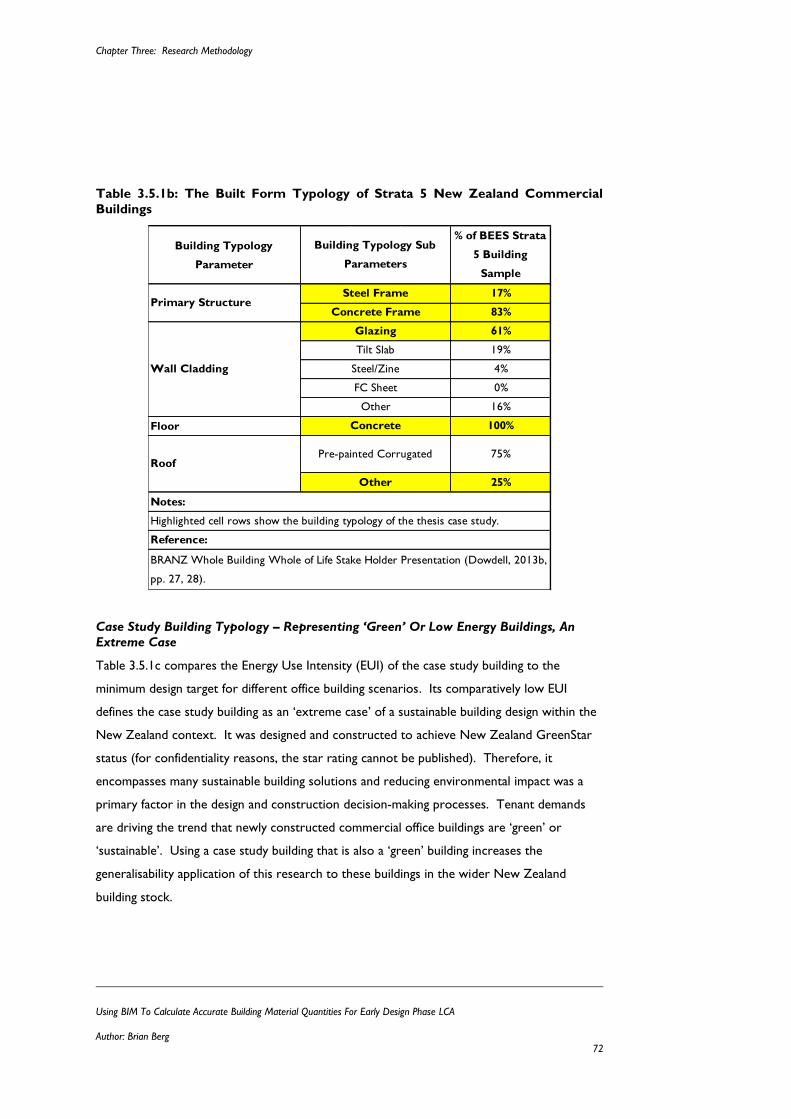
Chapter Three: Research Methodology
Using BIM To Calculate Accurate Building Material Quantities For Early Design Phase LCA
Author: Brian Berg 72
Table 3.5.1b: The Built Form Typology of Strata 5 New Zealand Commercial
Buildings
Case Study Building Typology – Representing ‘Green’ Or Low Energy Buildings, An
Extreme Case
Table 3.5.1c compares the Energy Use Intensity (EUI) of the case study building to the
minimum design target for different office building scenarios. Its comparatively low EUI
defines the case study building as an ‘extreme case’ of a sustainable building design within the
New Zealand context. It was designed and constructed to achieve New Zealand GreenStar
status (for confidentiality reasons, the star rating cannot be published). Therefore, it
encompasses many sustainable building solutions and reducing environmental impact was a
primary factor in the design and construction decision-making processes. Tenant demands
are driving the trend that newly constructed commercial office buildings are ‘green’ or
‘sustainable’. Using a case study building that is also a ‘green’ building increases the
generalisability application of this research to these buildings in the wider New Zealand
building stock.
Building Typology
Parameter
Floor
Reference:
BRANZ Whole Building Whole of Life Stake Holder Presentation (Dowdell, 2013b,
pp. 27, 28).
0%
16%
100%
75%
25%
Notes:
% of BEES Strata
5 Building
Sample
17%
83%
61%
19%
4%
Building Typology Sub
Parameters
Steel Frame
Concrete Frame
Glazing
Tilt Slab
Steel/Zine
FC Sheet
Other
Concrete
Pre-painted Corrugated
Other
Highlighted cell rows show the building typology of the thesis case study.
Primary Structure
Wall Cladding
Roof
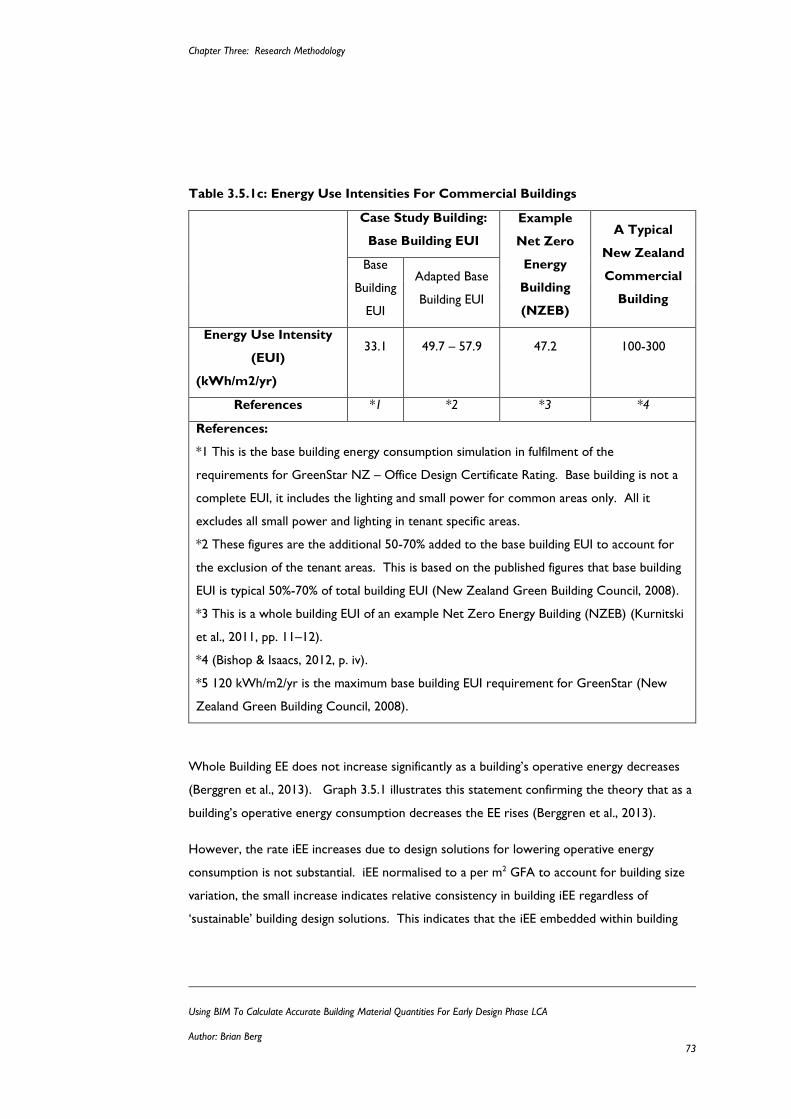
Chapter Three: Research Methodology
Using BIM To Calculate Accurate Building Material Quantities For Early Design Phase LCA
Author: Brian Berg 73
Table 3.5.1c: Energy Use Intensities For Commercial Buildings
Case Study Building:
Base Building EUI
Example
Net Zero
Energy
Building
(NZEB)
A Typical
New Zealand
Commercial
Building
Base
Building
EUI
Adapted Base
Building EUI
Energy Use Intensity
(EUI)
(kWh/m2/yr)
33.1
49.7 – 57.9
47.2
100-300
References *1 *2 *3 *4
References:
*1 This is the base building energy consumption simulation in fulfilment of the
requirements for GreenStar NZ – Office Design Certificate Rating. Base building is not a
complete EUI, it includes the lighting and small power for common areas only. All it
excludes all small power and lighting in tenant specific areas.
*2 These figures are the additional 50-70% added to the base building EUI to account for
the exclusion of the tenant areas. This is based on the published figures that base building
EUI is typical 50%-70% of total building EUI (New Zealand Green Building Council, 2008).
*3 This is a whole building EUI of an example Net Zero Energy Building (NZEB) (Kurnitski
et al., 2011, pp. 11–12).
*4 (Bishop & Isaacs, 2012, p. iv).
*5 120 kWh/m2/yr is the maximum base building EUI requirement for GreenStar (New
Zealand Green Building Council, 2008).
Whole Building EE does not increase significantly as a building’s operative energy decreases
(Berggren et al., 2013). Graph 3.5.1 illustrates this statement confirming the theory that as a
building’s operative energy consumption decreases the EE rises (Berggren et al., 2013).
However, the rate iEE increases due to design solutions for lowering operative energy
consumption is not substantial. iEE normalised to a per m2 GFA to account for building size
variation, the small increase indicates relative consistency in building iEE regardless of
‘sustainable’ building design solutions. This indicates that the iEE embedded within building
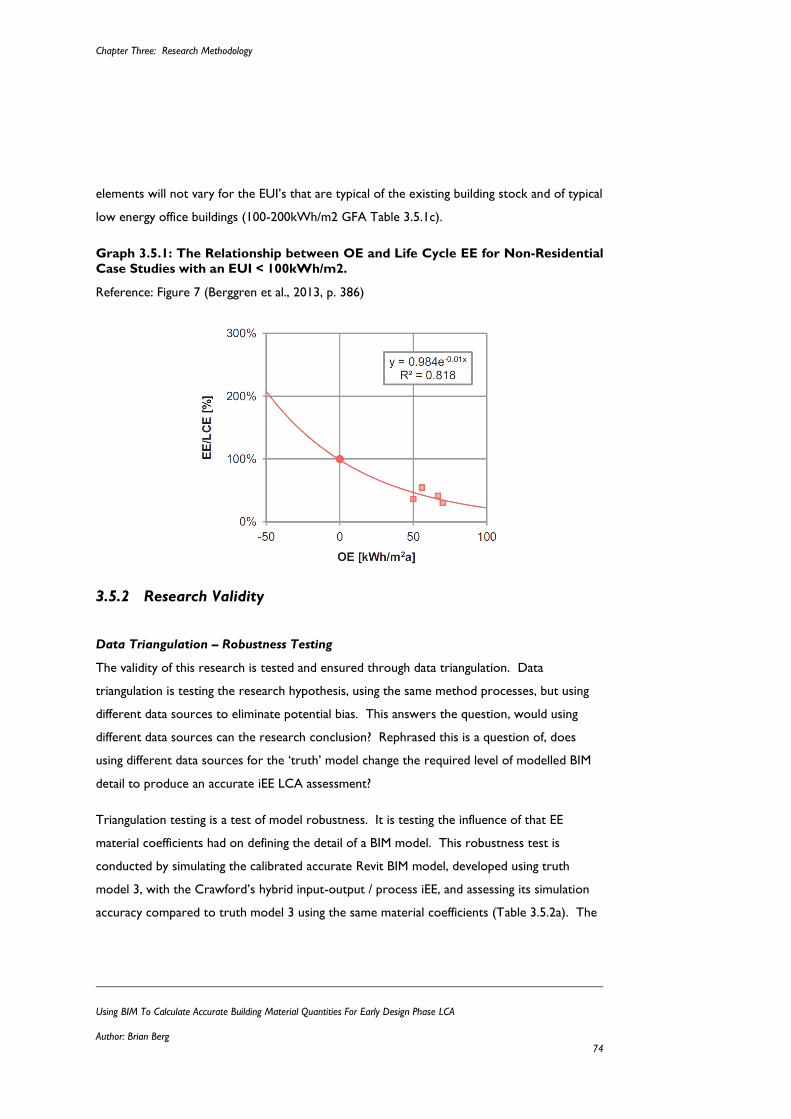
Chapter Three: Research Methodology
Using BIM To Calculate Accurate Building Material Quantities For Early Design Phase LCA
Author: Brian Berg 74
elements will not vary for the EUI’s that are typical of the existing building stock and of typical
low energy office buildings (100-200kWh/m2 GFA Table 3.5.1c).
Graph 3.5.1: The Relationship between OE and Life Cycle EE for Non-Residential
Case Studies with an EUI < 100kWh/m2.
Reference: Figure 7 (Berggren et al., 2013, p. 386)
3.5.2 Research Validity
Data Triangulation – Robustness Testing
The validity of this research is tested and ensured through data triangulation. Data
triangulation is testing the research hypothesis, using the same method processes, but using
different data sources to eliminate potential bias. This answers the question, would using
different data sources can the research conclusion? Rephrased this is a question of, does
using different data sources for the ‘truth’ model change the required level of modelled BIM
detail to produce an accurate iEE LCA assessment?
Triangulation testing is a test of model robustness. It is testing the influence of that EE
material coefficients had on defining the detail of a BIM model. This robustness test is
conducted by simulating the calibrated accurate Revit BIM model, developed using truth
model 3, with the Crawford’s hybrid input-output / process iEE, and assessing its simulation
accuracy compared to truth model 3 using the same material coefficients (Table 3.5.2a). The
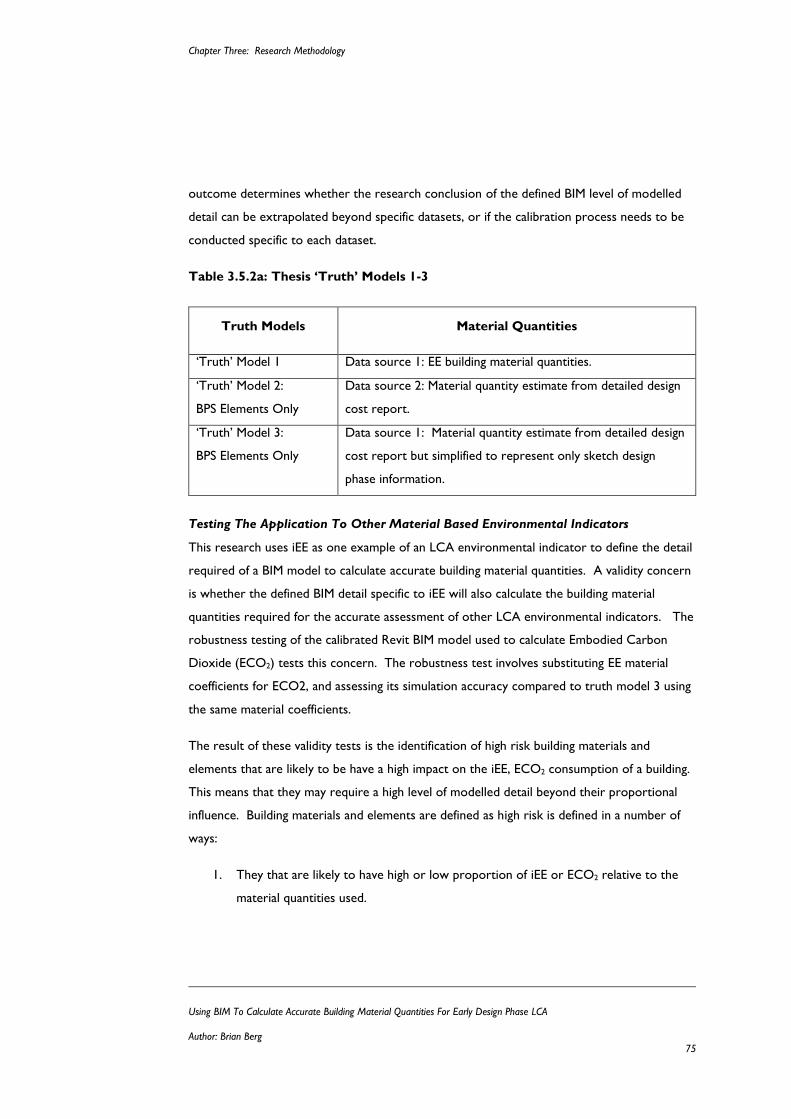
Chapter Three: Research Methodology
Using BIM To Calculate Accurate Building Material Quantities For Early Design Phase LCA
Author: Brian Berg 75
outcome determines whether the research conclusion of the defined BIM level of modelled
detail can be extrapolated beyond specific datasets, or if the calibration process needs to be
conducted specific to each dataset.
Table 3.5.2a: Thesis ‘Truth’ Models 1-3
Testing The Application To Other Material Based Environmental Indicators
This research uses iEE as one example of an LCA environmental indicator to define the detail
required of a BIM model to calculate accurate building material quantities. A validity concern
is whether the defined BIM detail specific to iEE will also calculate the building material
quantities required for the accurate assessment of other LCA environmental indicators. The
robustness testing of the calibrated Revit BIM model used to calculate Embodied Carbon
Dioxide (ECO2) tests this concern. The robustness test involves substituting EE material
coefficients for ECO2, and assessing its simulation accuracy compared to truth model 3 using
the same material coefficients.
The result of these validity tests is the identification of high risk building materials and
elements that are likely to be have a high impact on the iEE, ECO2 consumption of a building.
This means that they may require a high level of modelled detail beyond their proportional
influence. Building materials and elements are defined as high risk is defined in a number of
ways:
1. They that are likely to have high or low proportion of iEE or ECO2 relative to the
material quantities used.
Truth Models Material Quantities
‘Truth’ Model 1 Data source 1: EE building material quantities.
‘Truth’ Model 2:
BPS Elements Only
Data source 2: Material quantity estimate from detailed design
cost report.
‘Truth’ Model 3:
BPS Elements Only
Data source 1: Material quantity estimate from detailed design
cost report but simplified to represent only sketch design
phase information.
Chapter Three: Research Methodology
Using BIM To Calculate Accurate Building Material Quantities For Early Design Phase LCA
Author: Brian Berg 76
2. They that are likely to be highly influenced by other design decisions. Therefore
they are likely to change substantially across different design iterations.
3. Their iEE and ECO2 results vary significantly adversely influencing simulation
accuracy.
3.6 Chapter Inference
This Chapter developed the research design for testing this thesis’ hypothesis. It covered the
formulation of research objectives, the selection of the case study methodology, case study
description, and the control of research design limitations. The developed research
objectives require developing quality assurance tools, and processes for improving, and
accessing the simulation accuracy of iEE LCA assessments. These form a critical component
for developing an iEE BIM LCA BPS methodology for using BIM LCA tools effectively for
informed decision-making.
Chapter Four: The Methodology Of The BIM LCA BPS
Using BIM To Calculate Accurate Building Material Quantities For Early Design Phase LCA
Author: Brian Berg 77
Chapter Four:
4 THE METHODOLOGY OF THE BIM LCA BPS
4.1 Chapter Intent
The previous chapters defined the need for an Initial EE BIM LCA BPS (iEE BIM LCA BPS) to
satisfy the requirements to effectively integrate the LCA assessment of building materials into
sketch design phase activities. Critically, it identified that the calculation of accurate building
material quantities, and the lack of a methodology for how to use BIM LCA tools are an
obstacle limiting the use of LCA in the design process.
The aim of this chapter is to develop the solutions for fulfilling research objectives one and
two. Chapter Section 4.2 fulfils research objective one. This is developing a functional
definition what the iEE BIM LCA BPS model is, and how detailed it can be at sketch design.
Chapter Section 4.3 addresses research objective two. This is the development of the
methodology for translating the iEE BIM LCA BPS function definition into a BIM model. This
includes selecting the most appropriate EE material coefficient database, and developing a
method for how to use Revit to calculate a building design’s material quantities, and then
multiply them by their respective EE material coefficients to produce an iEE assessment
result. The information gained from fulfilling these two research objectives, will be used in
testing the thesis hypothesis, to determine how detailed the BIM objects and geometry
constituting the iEE BIM LCA PBS model needs to be to calculate accurate LCA-based results.
Following this chapter, Chapter 5.0 develops the simulation accuracy assessment framework
used in the thesis hypothesis for testing the iEE BIM LCA BPS methodology developed in
Chapter 4.0. The hypothesis tests if, the iEE BIM LCA BPS methodology can calculate
accurate LCA-based results of the environmental impact of building materials from sketch
design level information quickly, and easily, to satisfy the requirements of effective integration.
Chapter Four: The Methodology Of The BIM LCA BPS
Using BIM To Calculate Accurate Building Material Quantities For Early Design Phase LCA
Author: Brian Berg 78
4.2 Defining An iEE BIM LCA BPS Model
As Chapter Section 2.4 concluded, the BPS is only a framework for how to use a simulation
tool. It dictates in general terms what a simulation tool must deliver, e.g. fast and easy early
design phase informed decision-making about building performance. However, for iEE, and
LCA assessments using BIM LCA tools it lacks the specific requirements that defining how to
do achieve this. One omission, is a definition of what an iEE BIM LCA BPS model is. Since a
BPS model accesses only a one area of building performance at a time, its model is different
for each building performance area, and each simulation tool. These differences change what
simulation related building information must be modelled, including the level of detail
required. For iEE, the building information to calculate material quantities is what must be
defined. Therefore, defining which building elements, and materials, must be in an iEE BIM
LCA BPS model for accurate simulation results during sketch design is the first research
objective for developing an iEE BIM LCA BPS methodology.
The Problem: No Definition Of What Must Be Modelled
Existing research has developed methods for calculating of building material quantities to
reduce LCA complexity. These are a precedent for defining an iEE BIM LCA BPS model.
These methods have all aimed to reduce the number of different material, and building
elements that are calculated by developing rules based on the following parameters:
Material weight, if the weight of a material is more than 1% of whole building weight
or the use of the material is ranked in the highest 10 materials for the building (Jiao,
Lloyd, & Wakes, 2012, p. 22).
The material’s cost, and EE intensity, if the material has large influence even if
sometimes it does not account for a large proportion of whole building (Jiao et al.,
2012, p. 22).
The reported findings from other published case studies that identify the building
elements (Y. L. Langston & Langston, 2012; Treloar, Fay, et al., 2001), and materials
that contribute the majority of the total iEE (Kofoworola & Gheewala, 2009, p.
1079).
Chapter Four: The Methodology Of The BIM LCA BPS
Using BIM To Calculate Accurate Building Material Quantities For Early Design Phase LCA
Author: Brian Berg 79
These rules appear to be reasonable modelling assumptions, and are part of what defines
current best practice LCA iEE assessment methods. However, they are a function of a larger
problem. Despite being the best practice method for calculating building material quantities,
there is no definition for how detailed, or complete, a SOQ must be to conduct an accurate
LCA assessment such as iEE.
The extent of this problem is evident in the large discrepancies between published iEE results
by different researchers. A literature review of published LCA and iEE research case studies
identified that the completeness of an iEE assessments depends on the individual researcher,
who often for practicality reasons excludes certain building elements. Table 4.2 compares
Treloar et al., (2001) and Y. L. Langston & Langston (2012) reported iEE studies at an element
level breakdown, 11.7 GJ/m2 and 25.0 GJ/m2 respectfully. The large difference between
these two figures is due to differences in the completeness, and scope of their respective iEE
assessment. Treloar et al., (2001) states that for practicality reasons, the scope of their
assessment was limited to only 14 building elements. By comparison, Y. L. Langston &
Langston (2012) assessed 43 building elements. Accounting for these scope differences by
comparing only the same building elements, their respective iEE values are 11.0 GJ/m2 and
12.2 GJ/m2, equating to a difference of 9.8%. This is a difference that would be considered
reasonable in areas of building performance such as operative energy, and cost planning.
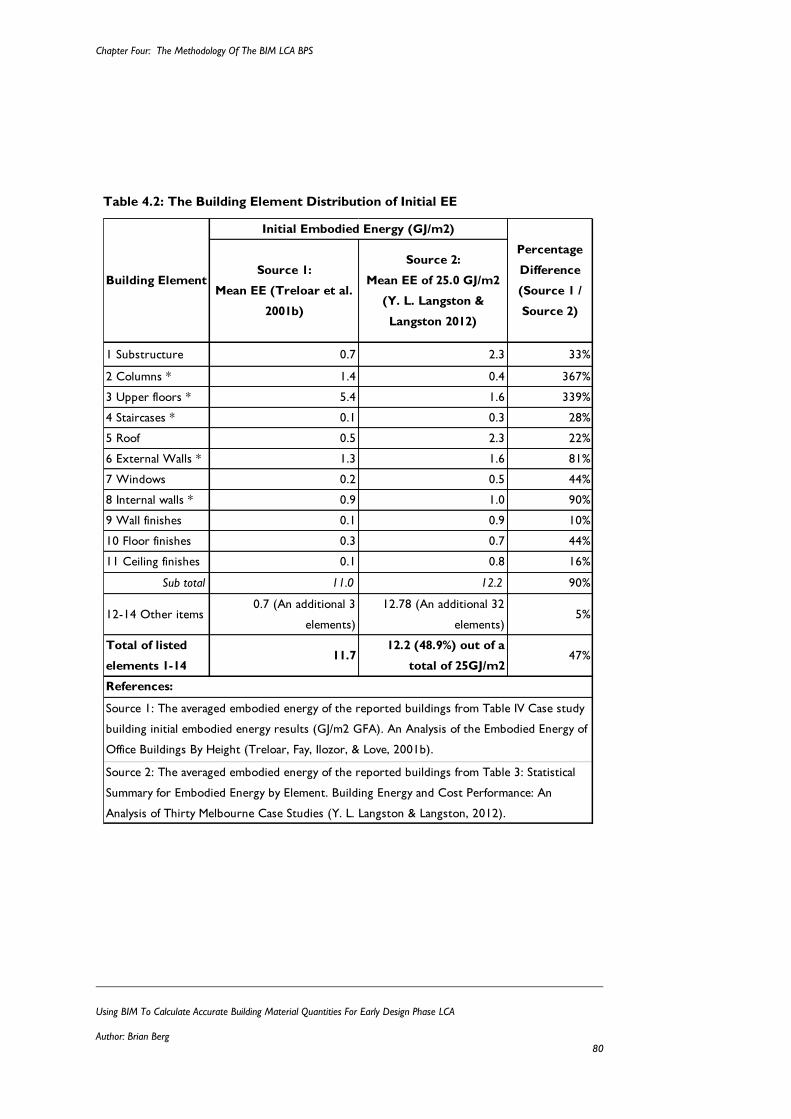
Chapter Four: The Methodology Of The BIM LCA BPS
Using BIM To Calculate Accurate Building Material Quantities For Early Design Phase LCA
Author: Brian Berg 80
Table 4.2: The Building Element Distribution of Initial EE
Source 1:
Mean EE (Treloar et al.
2001b)
Source 2:
Mean EE of 25.0 GJ/m2
(Y. L. Langston &
Langston 2012)
1 Substructure 0.7 2.3 33%
2 Columns * 1.4 0.4 367%
3 Upper floors * 5.4 1.6 339%
4 Staircases * 0.1 0.3 28%
5 Roof 0.5 2.3 22%
6 External Walls * 1.3 1.6 81%
7 Windows 0.2 0.5 44%
8 Internal walls * 0.9 1.0 90%
9 Wall finishes 0.1 0.9 10%
10 Floor finishes 0.3 0.7 44%
11 Ceiling finishes 0.1 0.8 16%
Sub total 11.0 12.2 90%
12-14 Other items0.7 (An additional 3
elements)
12.78 (An additional 32
elements)5%
Total of listed
elements 1-1411.7
12.2 (48.9%) out of a
total of 25GJ/m247%
Percentage
Difference
(Source 1 /
Source 2)
References:
Source 1: The averaged embodied energy of the reported buildings from Table IV Case study
building initial embodied energy results (GJ/m2 GFA). An Analysis of the Embodied Energy of
Office Buildings By Height (Treloar, Fay, Ilozor, & Love, 2001b).
Source 2: The averaged embodied energy of the reported buildings from Table 3: Statistical
Summary for Embodied Energy by Element. Building Energy and Cost Performance: An
Analysis of Thirty Melbourne Case Studies (Y. L. Langston & Langston, 2012).
Initial Embodied Energy (GJ/m2)
Building Element
Chapter Four: The Methodology Of The BIM LCA BPS
Using BIM To Calculate Accurate Building Material Quantities For Early Design Phase LCA
Author: Brian Berg 81
The Problem Applied To The BPS Concept
The impact of having no definition for what must be modelled is that building designers don’t
know what they have to model to produce simulation results that are accurate enough for
design decision-making. The main issue is the completeness of the iEE LCA assessment.
How complete does it need to be? Does every individual material, down to the number of
bolts, washers, and nuts need to be estimated and included to be accurate enough? These
are research questions that need to be answered. However, they are not the focus of this
thesis research, and are therefore outside its scope. Instead, a BPS aims to make the existing
best practice methods easier, not to redefine what they are.
Therefore, applied the iEE BIM LCA BPS, the aim is to easily deliver a SOQ level of material
detail, and completeness, based on the information building designers required to make
informed design decisions during the sketch design. The BPS concept achieves this by
reducing the modelled complexity of the iEE BIM LCA BPS model. This means the issue of
completeness becomes a question of whether iEE BIM LCA BPS model is sufficiently detailed
for sketch design phase decision-making.
4.2.1 What To Model For A BIM LCA BPS Of iEE
To date, no research has investigated how to calculate building material quantities in the early
phases of the design process from sketch design phase information, to a level of detail
equivalent to a detailed design SOQ, which produces an accurate LCA or iEE assessment.
Lacking standardised requirements, or guidance, for which building elements and materials
must be modelled, there is no definition for which building elements and materials must be
modelled for a BIM LCA BPS of iEE. Therefore, one must be developed. Table 4.2.1a detail
questions provide a framework for identifying the building elements that must be modelled in
an iEE LCA BIM BPS. These comes from the BPS framework developed by Donn et al.,
(2012), and the requirements specific to building material iEE LCA assessments.
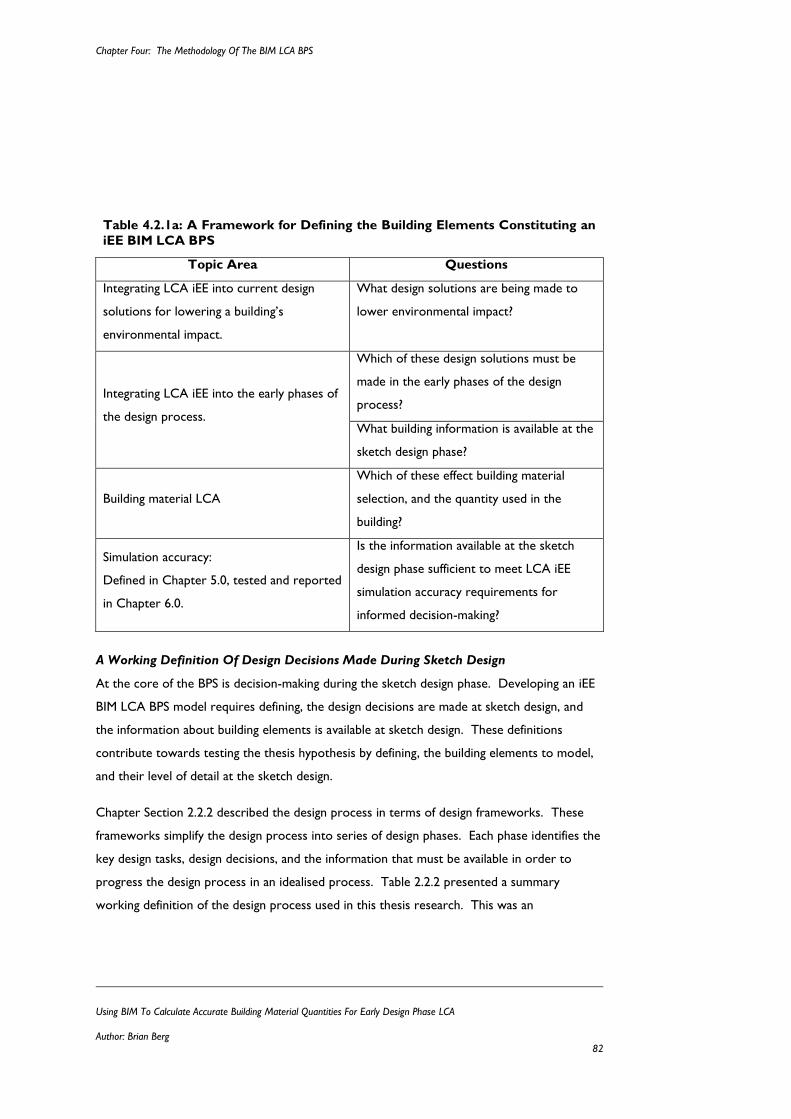
Chapter Four: The Methodology Of The BIM LCA BPS
Using BIM To Calculate Accurate Building Material Quantities For Early Design Phase LCA
Author: Brian Berg 82
Table 4.2.1a: A Framework for Defining the Building Elements Constituting an
iEE BIM LCA BPS
Topic Area Questions
Integrating LCA iEE into current design
solutions for lowering a building’s
environmental impact.
What design solutions are being made to
lower environmental impact?
Integrating LCA iEE into the early phases of
the design process.
Which of these design solutions must be
made in the early phases of the design
process?
What building information is available at the
sketch design phase?
Building material LCA
Which of these effect building material
selection, and the quantity used in the
building?
Simulation accuracy:
Defined in Chapter 5.0, tested and reported
in Chapter 6.0.
Is the information available at the sketch
design phase sufficient to meet LCA iEE
simulation accuracy requirements for
informed decision-making?
A Working Definition Of Design Decisions Made During Sketch Design
At the core of the BPS is decision-making during the sketch design phase. Developing an iEE
BIM LCA BPS model requires defining, the design decisions are made at sketch design, and
the information about building elements is available at sketch design. These definitions
contribute towards testing the thesis hypothesis by defining, the building elements to model,
and their level of detail at the sketch design.
Chapter Section 2.2.2 described the design process in terms of design frameworks. These
frameworks simplify the design process into series of design phases. Each phase identifies the
key design tasks, design decisions, and the information that must be available in order to
progress the design process in an idealised process. Table 2.2.2 presented a summary
working definition of the design process used in this thesis research. This was an
Chapter Four: The Methodology Of The BIM LCA BPS
Using BIM To Calculate Accurate Building Material Quantities For Early Design Phase LCA
Author: Brian Berg 83
amalgamation of the AIA, NZCIC, and RIBA design process framework documents (American
Institute of Architects (AIA), 2008; New Zealand Construction Institute Council (NZCIC),
2004; Ostime, 2013). Using these documents, and their supporting design documentation
checklists, a detailed description of what design decisions are made during sketch design
phase, and the information available about each building element at this time in the project
was defined (refer to Appendix 4.0 Tables 4.2.1a). This information was defined as a
confounding variable in Table 3.2.3d, and therefore must be controlled.
Table 4.2.1b presents an example of the larger sample of information available in Appendix
4.0 Tables 4.2.1a. These tables are organised by a rough division of building elemental
groupings:
General Interior Closure
Site Transportation Systems
Foundation and Substructure Mechanical Systems
Superstructure Electrical and Lighting Systems
Exterior Closure Equipment
Roof
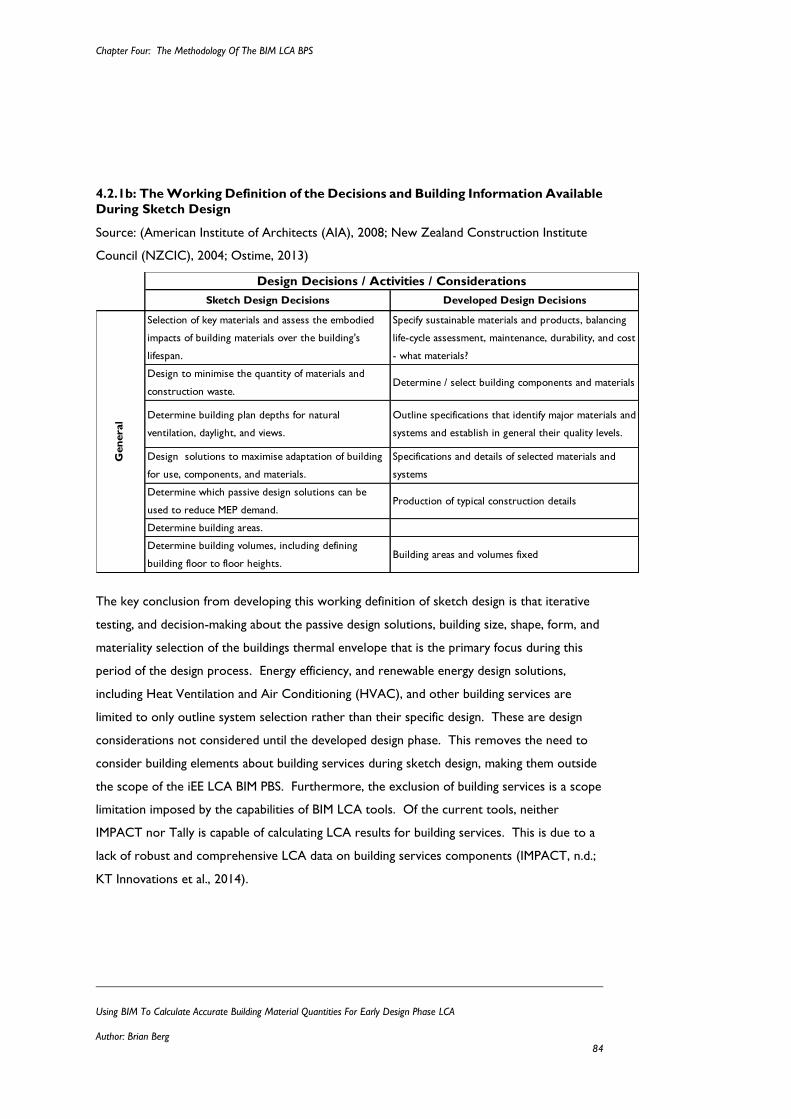
Chapter Four: The Methodology Of The BIM LCA BPS
Using BIM To Calculate Accurate Building Material Quantities For Early Design Phase LCA
Author: Brian Berg 84
4.2.1b: The Working Definition of the Decisions and Building Information Available
During Sketch Design
Source: (American Institute of Architects (AIA), 2008; New Zealand Construction Institute
Council (NZCIC), 2004; Ostime, 2013)
The key conclusion from developing this working definition of sketch design is that iterative
testing, and decision-making about the passive design solutions, building size, shape, form, and
materiality selection of the buildings thermal envelope that is the primary focus during this
period of the design process. Energy efficiency, and renewable energy design solutions,
including Heat Ventilation and Air Conditioning (HVAC), and other building services are
limited to only outline system selection rather than their specific design. These are design
considerations not considered until the developed design phase. This removes the need to
consider building elements about building services during sketch design, making them outside
the scope of the iEE LCA BIM PBS. Furthermore, the exclusion of building services is a scope
limitation imposed by the capabilities of BIM LCA tools. Of the current tools, neither
IMPACT nor Tally is capable of calculating LCA results for building services. This is due to a
lack of robust and comprehensive LCA data on building services components (IMPACT, n.d.;
KT Innovations et al., 2014).
Sketch Design Decisions Developed Design Decisions
Selection of key materials and assess the embodied
impacts of building materials over the building's
lifespan.
Specify sustainable materials and products, balancing
life-cycle assessment, maintenance, durability, and cost
- what materials?
Design to minimise the quantity of materials and
construction waste.Determine / select building components and materials
Determine building plan depths for natural
ventilation, daylight, and views.
Outline specifications that identify major materials and
systems and establish in general their quality levels.
Design solutions to maximise adaptation of building
for use, components, and materials.
Specifications and details of selected materials and
systems
Determine which passive design solutions can be
used to reduce MEP demand.Production of typical construction details
Determine building areas.
Determine building volumes, including defining
building floor to floor heights.Building areas and volumes fixed
Design Decisions / Activities / Considerations
Gen
eral
Chapter Four: The Methodology Of The BIM LCA BPS
Using BIM To Calculate Accurate Building Material Quantities For Early Design Phase LCA
Author: Brian Berg 85
The limitation of using this literature review technique to define the design process, sketch
design decisions, and the information available at sketch design, is that it is not project
specific. This may mean there are discrepancies between what this thesis has assumed to be
available during sketch design, and what is actually available in real building projects. This risk
is mitigated by the unique nature of buildings, where no two are ever the same. Basing the
definition of sketch design information off of an idealised, and industry recommended
approach for building design, means the developed BPS is more suitable for being used on
building projects other than this thesis case study.
The AIA, and RIBA frameworks were selected because of their strong architectural focus.
However, there is a risk that they are potentially biased towards the design activities of
architects, and are not specific to the New Zealand construction industry. This risk is
controlled by the inclusion of NZCIC’s design framework and its design documentation
guidelines. This is an independent institute, comprising of the New Zealand Institute of
Architects (NZIA), and the Institute of Professional Engineers of New Zealand (IPENZ) as
contributing members. The design documentation guidelines they published include separate
documents specifically for architecture, electrical, fire protection, HVAC, hydraulic, and
structural design activities. This helps to reduce the risk of any bias towards architectural
design.
The Definition of A BIM LCA BPS Of iEE
Table 4.2.1c presents a refined list of the building elements that must be modelled in an iEE
BIM LCA BPS. This is the fulfilment of the first research objective, and confounding variable
in the research design. This list was formulated by translating the decisions and information
made during sketch design, and assessing whether they influence the selection of building
materials, and/or their quantities. Table 4.2.1c also shows the alignment of the two
classification systems that are referenced throughout this thesis:
Y. L. Langston & Langston (2012) reports iEE results using the Australian Institute of
Quantity Surveyors (AIQS) Australian Cost Management Manual Volume 1.
The iEE BIM LCA BPS results are reported using the UniClass 2.0 Elemental
classification table. The reasoning for selection is discussed in Chapter Section 4.3.
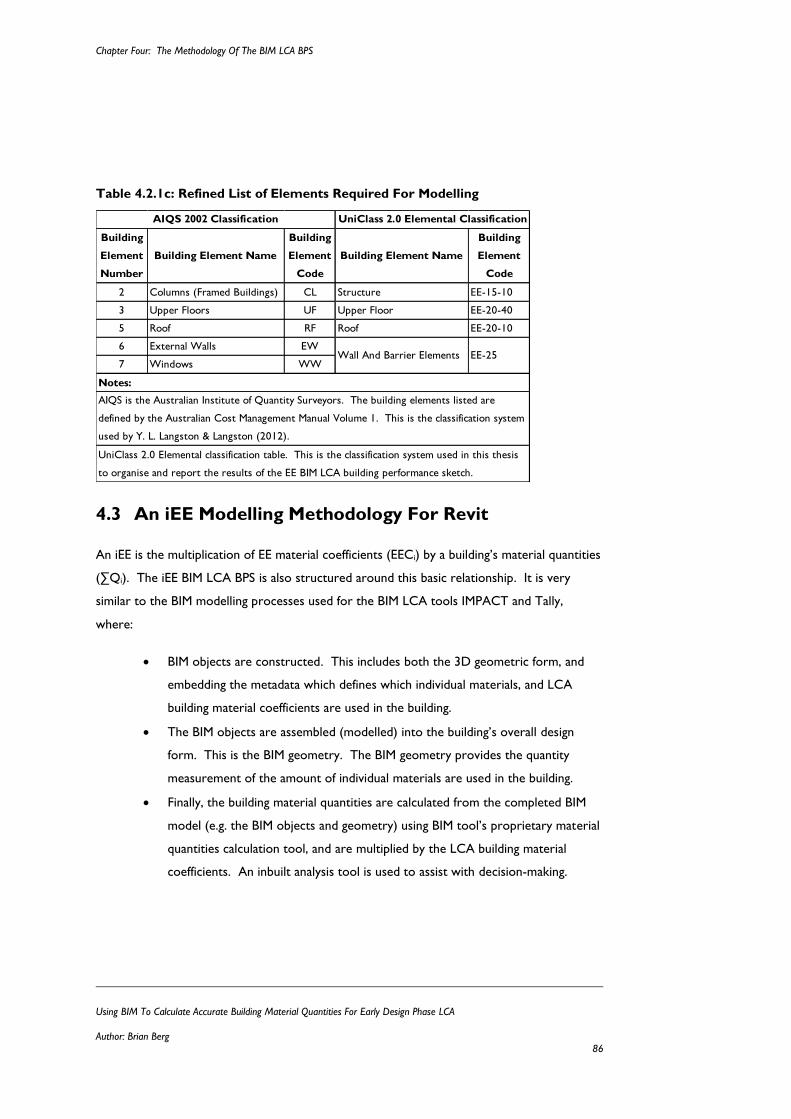
Chapter Four: The Methodology Of The BIM LCA BPS
Using BIM To Calculate Accurate Building Material Quantities For Early Design Phase LCA
Author: Brian Berg 86
Table 4.2.1c: Refined List of Elements Required For Modelling
4.3 An iEE Modelling Methodology For Revit
An iEE is the multiplication of EE material coefficients (EECi) by a building’s material quantities
(∑Qi). The iEE BIM LCA BPS is also structured around this basic relationship. It is very
similar to the BIM modelling processes used for the BIM LCA tools IMPACT and Tally,
where:
BIM objects are constructed. This includes both the 3D geometric form, and
embedding the metadata which defines which individual materials, and LCA
building material coefficients are used in the building.
The BIM objects are assembled (modelled) into the building’s overall design
form. This is the BIM geometry. The BIM geometry provides the quantity
measurement of the amount of individual materials are used in the building.
Finally, the building material quantities are calculated from the completed BIM
model (e.g. the BIM objects and geometry) using BIM tool’s proprietary material
quantities calculation tool, and are multiplied by the LCA building material
coefficients. An inbuilt analysis tool is used to assist with decision-making.
Building
Element
Number
Building Element Name
Building
Element
Code
Building Element Name
Building
Element
Code
2 Columns (Framed Buildings) CL Structure EE-15-10
3 Upper Floors UF Upper Floor EE-20-40
5 Roof RF Roof EE-20-10
6 External Walls EW
7 Windows WW
UniClass 2.0 Elemental classification table. This is the classification system used in this thesis
to organise and report the results of the EE BIM LCA building performance sketch.
UniClass 2.0 Elemental ClassificationAIQS 2002 Classification
Notes:
AIQS is the Australian Institute of Quantity Surveyors. The building elements listed are
defined by the Australian Cost Management Manual Volume 1. This is the classification system
used by Y. L. Langston & Langston (2012).
Wall And Barrier Elements EE-25
Chapter Four: The Methodology Of The BIM LCA BPS
Using BIM To Calculate Accurate Building Material Quantities For Early Design Phase LCA
Author: Brian Berg 87
The iEE BIM LCA BPS calculation process differs from IMPACT and Tally. These tools have
inbuilt interfaces, and embedded databases of LCA building material coefficients within
AutoDesk’s Revit BIM tool. However, as these databases, Ecoinvest and Gabi, are not New
Zealand specific, neither of these tools can be used for this thesis research. Therefore a
generic methodology that achieves the same result must be developed. This is the fulfilment
of the second research objective, parts 1-3:
Research Objective 2: Develop a methodology processes, practices and tools for using the
BIM tool Revit for conducting an iEE LCA assessment, including:
2.1 Selecting building material coefficients.
2.2 Calculating building material quantities.
2.3 Applying Equation 2, the multiplication of building material coefficients by building
material quantities to calculate and analyse EE results.
This Chapter Section details the development of this methodology. The methodology works
on the same principles as IMPACT and Tally, where:
3D BIM objects are constructed with the building material metadata embedded.
A BIM model using these BIM objects is constructed, this is the iEE BIM LCA BPS
model defined in Chapter Section 4.2.1.
Revit’s proprietary material calculators are used to generate a complete list of every
building material, and their quantities.
At this point, the process diverges. IMPACT and Tally have the inbuilt results analysis tools,
that multiple the building material coefficients by the calculated building material quantities.
They do this directly within Revit. The iEE BIM LCA BPS methodology does not have this
capability. Instead, an Excel spreadsheet has been created specifically for this thesis research
to fulfil this function. Hereby referred to as the LCA results analysis spreadsheet, it includes
the necessary tools for the analysis of LCA and EE results. The final modelling stage in the
iEE BIM LCA BPS calculation process is:
Chapter Four: The Methodology Of The BIM LCA BPS
Using BIM To Calculate Accurate Building Material Quantities For Early Design Phase LCA
Author: Brian Berg 88
The Revit calculated building material quantities are exported as a text file (TAB
Delimited), and then imported into the LCA results analysis spreadsheet. Within
this spreadsheet, the database of building material coefficients is stored (in this
research, Alcorn’s EE hybrid process/input-out). Automated Excel calculation
formulas are used to multiply the imported building material quantities by the
building material coefficients, which are automatically analysed.
Table 4.3 presents the iEE BIM LCA BPS calculation process as three distinct modelling
stages. The following Chapter Sections of 4.3 discuss the development of this process, and
the key decisions building designers must make. These decision include:
Selecting an appropriate EE database of building material coefficients
The process of using Revit to create the iEE BIM LCA BPS model, and calculate iEE.
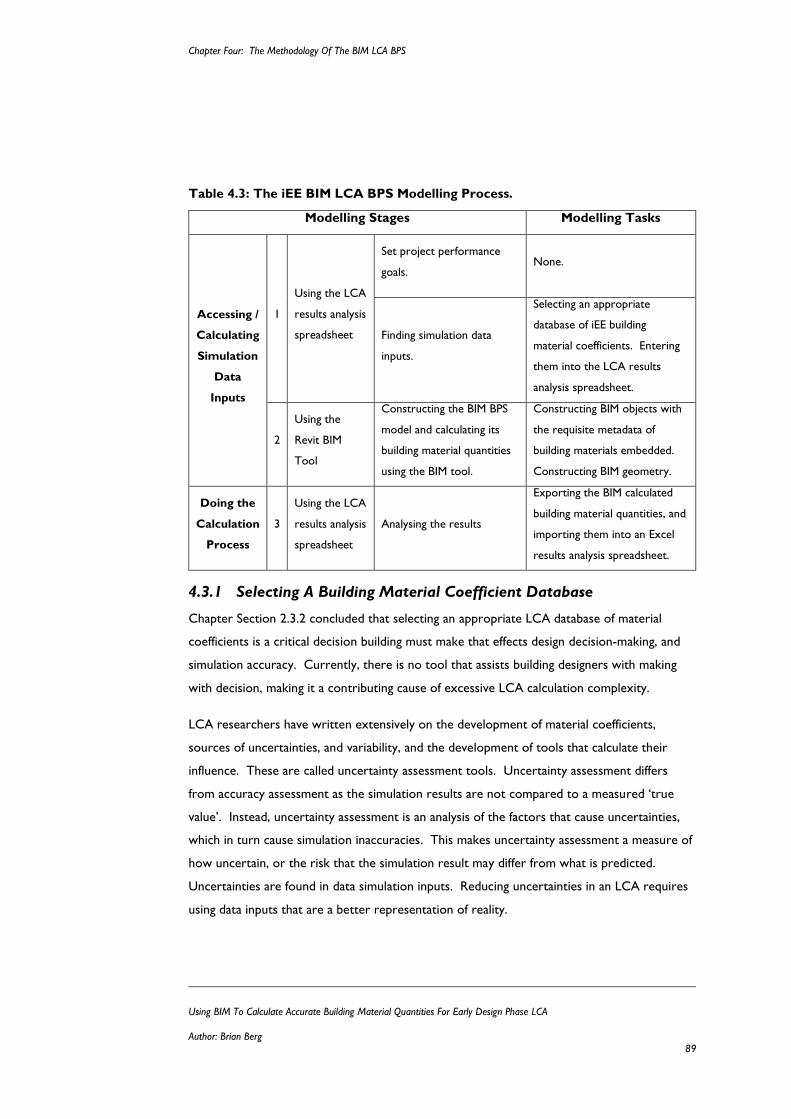
Chapter Four: The Methodology Of The BIM LCA BPS
Using BIM To Calculate Accurate Building Material Quantities For Early Design Phase LCA
Author: Brian Berg 89
Table 4.3: The iEE BIM LCA BPS Modelling Process.
Modelling Stages Modelling Tasks
Accessing /
Calculating
Simulation
Data
Inputs
1
Using the LCA
results analysis
spreadsheet
Set project performance
goals.
None.
Finding simulation data
inputs.
Selecting an appropriate
database of iEE building
material coefficients. Entering
them into the LCA results
analysis spreadsheet.
2
Using the
Revit BIM
Tool
Constructing the BIM BPS
model and calculating its
building material quantities
using the BIM tool.
Constructing BIM objects with
the requisite metadata of
building materials embedded.
Constructing BIM geometry.
Doing the
Calculation
Process
3
Using the LCA
results analysis
spreadsheet
Analysing the results
Exporting the BIM calculated
building material quantities, and
importing them into an Excel
results analysis spreadsheet.
4.3.1 Selecting A Building Material Coefficient Database
Chapter Section 2.3.2 concluded that selecting an appropriate LCA database of material
coefficients is a critical decision building must make that effects design decision-making, and
simulation accuracy. Currently, there is no tool that assists building designers with making
with decision, making it a contributing cause of excessive LCA calculation complexity.
LCA researchers have written extensively on the development of material coefficients,
sources of uncertainties, and variability, and the development of tools that calculate their
influence. These are called uncertainty assessment tools. Uncertainty assessment differs
from accuracy assessment as the simulation results are not compared to a measured ‘true
value’. Instead, uncertainty assessment is an analysis of the factors that cause uncertainties,
which in turn cause simulation inaccuracies. This makes uncertainty assessment a measure of
how uncertain, or the risk that the simulation result may differ from what is predicted.
Uncertainties are found in data simulation inputs. Reducing uncertainties in an LCA requires
using data inputs that are a better representation of reality.
Chapter Four: The Methodology Of The BIM LCA BPS
Using BIM To Calculate Accurate Building Material Quantities For Early Design Phase LCA
Author: Brian Berg 90
However, very little research has focussed on the development of uncertainty assessment
tools specifically building designers to evaluate different iEE databases based on the sources of
uncertainty and variability (refer to Appendix 4.0 Table 4.3.1a).
Uncertainity Assessment Tools For Selecting EE Material Coefficient Databases
To assist building designers assessing uncertainty, and variability, various LCA uncertainty
assessment tools have been developed.
Uncertainty assessment tools can be classified into two categories; qualitative or quantitative.
Qualitative tools assess data quality against a criteria, usually with a simple scoring system.
The Data Quality Indicator Pedigree Matrix (DQIPM) is one example (Weidema & Wesnæs,
1996). By comparison, quantitative tools calculate the size and impact of data input
uncertainties. This is called operationalizing uncertainties.
Various researchers have written extensively on the limitations with the existing LCA
uncertainty assessment tools (Björklund, 2002; Heijungs & Huijbregts, 2004; Huijbregts, 1998;
Ross, Evans, & Webber, 2002). Table 4.3.1b takes these limitations, and formulates them into
a set of criteria for selecting the most appropriate existing LCA uncertainty assessment tools
and process for the iEE BIM LCA BPS. Two types of assessment tools, quantitative statistical
tools, and the qualitative DQIPM tool are assessed.
Table 4.3.1b shows, that the DQIPM is the most appropriate tool for assessing the
uncertainties in EE material coefficients for the purpose of early design phase EE assessments,
and the iEE BIM LCA BPS. This selection was due to statistical quantitative uncertainty tools
failing criteria 3, 5, and 9. They all require an uncertainty assessment tool be easy to use,
simple, and to produce results quickly which are easily understood by the design team.
Failing these criteria means that statistical tools do not achieve the fundamental purpose of
the BPS; to help facilitate better decision-making by improving model insight (understanding
and confidence in the results) through improved simulation accuracy. To achieve this,
complex operationalization of uncertainties is not necessary. Björklund (2002) acknowledges
this, and concludes that while traditionally simple tools such as qualitative DQIPM have been
dismissed for not being accurate or detailed enough, they may well be the best tool because
they are simple enough to actually be used.
Chapter Four: The Methodology Of The BIM LCA BPS
Using BIM To Calculate Accurate Building Material Quantities For Early Design Phase LCA
Author: Brian Berg 91
The results of Table 4.3.1b are evidence supporting Björklund’s (2002) conclusion. By default
this meant selecting the DQIPM uncertainty assessment tool. Despite being better suited for
sketch design assessment, it failed the 9th criteria. However, when the DQIPM tool is used in
junction with an accuracy assessment tool, the effects of the model input uncertainties, and
error causing inaccuracies are expressed as inaccuracy compared to ‘true’ value figures.
Provided simulation uncertainties are reduced and the simulation result are within accepted
accuracy requirements, the need for the DQIPM tool to comply with this criteria by actually
calculating each uncertainty value is mitigated.
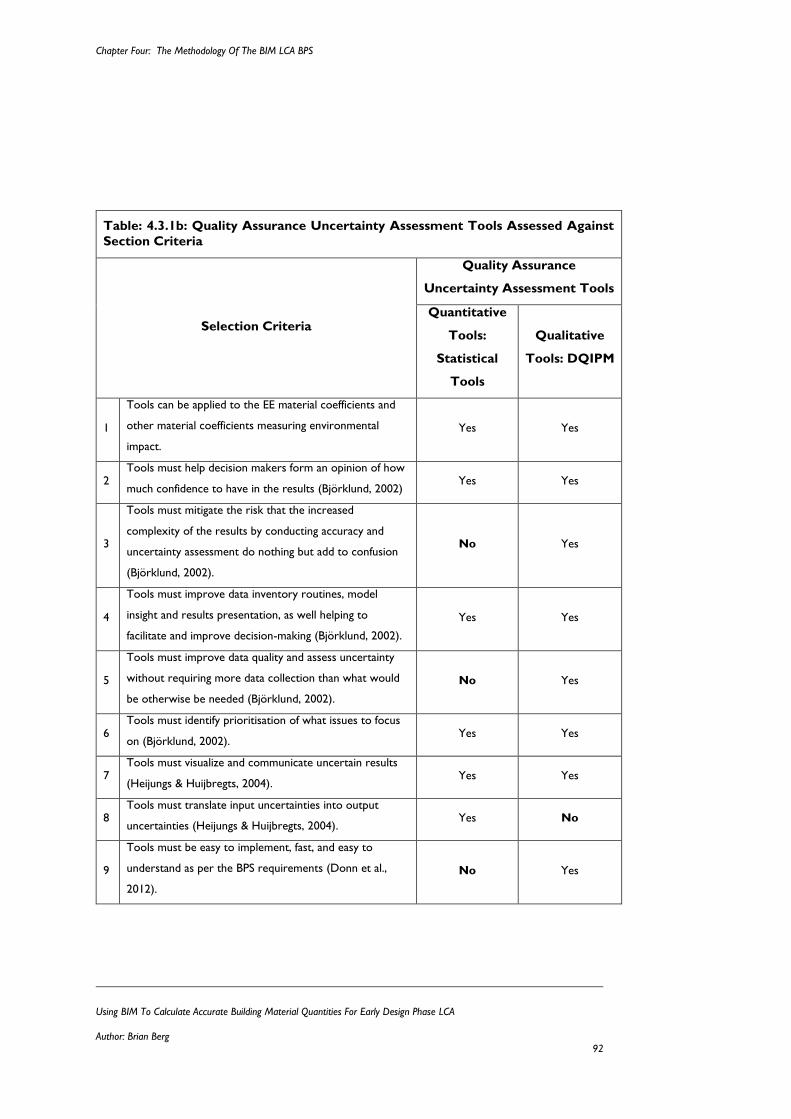
Chapter Four: The Methodology Of The BIM LCA BPS
Using BIM To Calculate Accurate Building Material Quantities For Early Design Phase LCA
Author: Brian Berg 92
Table: 4.3.1b: Quality Assurance Uncertainty Assessment Tools Assessed Against
Section Criteria
Selection Criteria
Quality Assurance
Uncertainty Assessment Tools
Quantitative
Tools:
Statistical
Tools
Qualitative
Tools: DQIPM
1
Tools can be applied to the EE material coefficients and
other material coefficients measuring environmental
impact.
Yes Yes
2 Tools must help decision makers form an opinion of how
much confidence to have in the results (Björklund, 2002) Yes Yes
3
Tools must mitigate the risk that the increased
complexity of the results by conducting accuracy and
uncertainty assessment do nothing but add to confusion
(Björklund, 2002).
No Yes
4
Tools must improve data inventory routines, model
insight and results presentation, as well helping to
facilitate and improve decision-making (Björklund, 2002).
Yes Yes
5
Tools must improve data quality and assess uncertainty
without requiring more data collection than what would
be otherwise be needed (Björklund, 2002).
No Yes
6 Tools must identify prioritisation of what issues to focus
on (Björklund, 2002). Yes Yes
7 Tools must visualize and communicate uncertain results
(Heijungs & Huijbregts, 2004). Yes Yes
8 Tools must translate input uncertainties into output
uncertainties (Heijungs & Huijbregts, 2004). Yes No
9
Tools must be easy to implement, fast, and easy to
understand as per the BPS requirements (Donn et al.,
2012).
No Yes
Chapter Four: The Methodology Of The BIM LCA BPS
Using BIM To Calculate Accurate Building Material Quantities For Early Design Phase LCA
Author: Brian Berg 93
The Data Quality Indicator Pedigree Matrix LCA Uncertainty Assessment Tool
Weidema and Wesnæs (1996) original DQIPM tool for LCA (refer Appendix 4.0 Tables
4.3.1c and 4.3.1d) is used in uncertainty analysis to quickly express the intangible qualitative
descriptions in a quantitative assessment result format. Ciroth (2009, p. 1586) sums this up
succinctly as; the “basic aim is to come from [a] qualitative description of relevant aspects of an
object of study to quantitative figures assessing these aspects. The matrix thus is a tool for
quantification of qualitative assessment descriptions”. Using the pedigree matrix, data is scored
across 5 data quality indicators (columns, Table 4.3.2e describes these five different data
quality indicators) against the quantification criteria (rows) from 1 to 5. A score of 1
represents the best quality data, whereas a 5 is the lowest quality data. (Ciroth, 2009; Wang
& Shen, 2013). In practice, according to previous studies ((Wang & Shen, 2013) citing Junnila
and Horvath, 2003; Maurice et. Al., 2000) scores of 2 and 3 represent “acceptable data
quality” and “fair data quality”.
These numerical scores are only indicative. They do not calculate uncertainty or represent a
certain amount of data quality. Their purpose is to easily survey the data quality to point at
possibilities for improvements in data quality, and to trace back sources of uncertainty
(Weidema & Wesnæs, 1996, p. 169). Used in the iEE BIM LCA BPS, the DQIPM helps to
compare different data sources by describing which aspects of data quality will influence the
accuracy, and reliability of the result. The end result is the identification of which data source
of EE material coefficients are the best representation of reality for the subject building.
Therefore, it is not critical what the numerical description is, as long as the designers
consider all the DQIs, and are consistent in their assessment, and the process results in
choosing the right dataset.
Developing An EE Pedigree Matrix
Weidema & Wesnæs’s (1996, p. 169) original DQIPM was developed to assist in the
development of LCA material coefficients by making data quality assessment easier. This was
to more easily identify the possible areas for improving the quality of the data inputs, and to
trace uncertainties back to their sources.
The iEE BIM LCA BPS does not require this same comprehensive data quality assessment
provided by Weidema & Wesnæs’s (1996, p. 169) original DQIPM. Instead, to assist building
Chapter Four: The Methodology Of The BIM LCA BPS
Using BIM To Calculate Accurate Building Material Quantities For Early Design Phase LCA
Author: Brian Berg 94
designers in the selection of the most appropriate EE material coefficient databases, building
designers only need to be aware of the main factors causing uncertainties, and select a
database that minimises these as much as practically possible. They do not need to know or
understand uncertainties to a depth of detail that is required to develop, or alter the value of
these material coefficients. This is outside the scope of an iEE BIM LCA BPS, and their
knowledge. Therefore there is a need to adapt Weidema & Wesnæs’s (1996, p. 169) original
DQIPM to meet these specific requirements in fulfilment of this thesis’s research objective
2.1. This is an important part of reducing the calculation complexity of LCA, and improving
its integration into sketch deign.
Table 4.3.2e details the DQI that must be assessed in the selection of an EE material
coefficient database. These derive from the identified sources of uncertainty and variability
presented in Appendix 4.0 Table 4.3.2c. They have been simplified down to only assess
information about EE material coefficients that is easily understood, and readily available for
building designers. Evident by their alignment with both Weidema & Wesnæs’s Data Quality
Indicators and the identified sources of uncertainty and variability (Appendix 4.0 Table 4.3.2c),
the selected data quality indicators for EE material coefficients cover most causes of data
uncertainty.
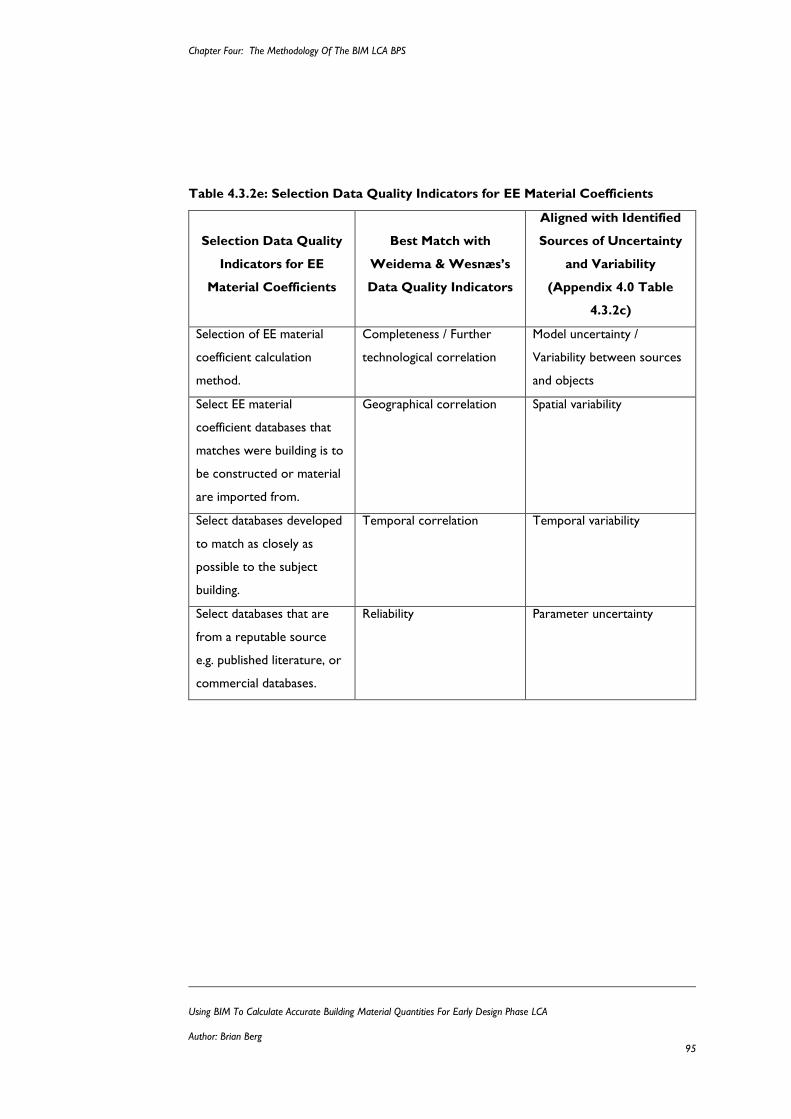
Chapter Four: The Methodology Of The BIM LCA BPS
Using BIM To Calculate Accurate Building Material Quantities For Early Design Phase LCA
Author: Brian Berg 95
Table 4.3.2e: Selection Data Quality Indicators for EE Material Coefficients
Selection Data Quality
Indicators for EE
Material Coefficients
Best Match with
Weidema & Wesnæs’s
Data Quality Indicators
Aligned with Identified
Sources of Uncertainty
and Variability
(Appendix 4.0 Table
4.3.2c)
Selection of EE material
coefficient calculation
method.
Completeness / Further
technological correlation
Model uncertainty /
Variability between sources
and objects
Select EE material
coefficient databases that
matches were building is to
be constructed or material
are imported from.
Geographical correlation Spatial variability
Select databases developed
to match as closely as
possible to the subject
building.
Temporal correlation Temporal variability
Select databases that are
from a reputable source
e.g. published literature, or
commercial databases.
Reliability Parameter uncertainty
Chapter Four: The Methodology Of The BIM LCA BPS
Using BIM To Calculate Accurate Building Material Quantities For Early Design Phase LCA
Author: Brian Berg 96
Table 4.3.2f shows the EE DQIPM tool. The selection of the indicator scores is derived from
the issues specific for EE material coefficients. These are:
Data Quality Indicator A: Defined as best practice in EE assessments, the hybrid EE
coefficients are the currently the most complete EE calculation method for measuring the EE
of materials. The scoring order was based on Graph 3.2.2 (Crawford, 2011).
Data Quality Indicator B: This criteria was taken from Weidema & Wesnæs’s (1996, p.
169) original DQIPM. It has been adapted to suit EE, where best practice defines that
material coefficients are either country specific or they are not. When a database value is not
available for your specific country, a best as possible match must be selected. Looking at the
importation of building material to see where the majority come from, or using a global
average is feasible alternative. Also consider the countries energy mix of renewable and non-
renewable energy generation. Countries with high non-renewable energy generation will
have higher EE material coefficients (Alcorn, 2010; Nebel, n.d.).
Data Quality Indicator C: This criteria was taken from Weidema & Wesnæs’s (1996, p.
169) original DQIPM. As EE is a part of an LCA the criteria is translatable. The crucial
assessment is the use of technology and the countries energy generation mix between
renewable and non-renewable sources (Alcorn, 2010; Nebel, n.d.).
Data Quality Indicator D: Defined by best practice EE assessment methods used by
building researcher, the EE coefficients must have been developed from a reputable source.
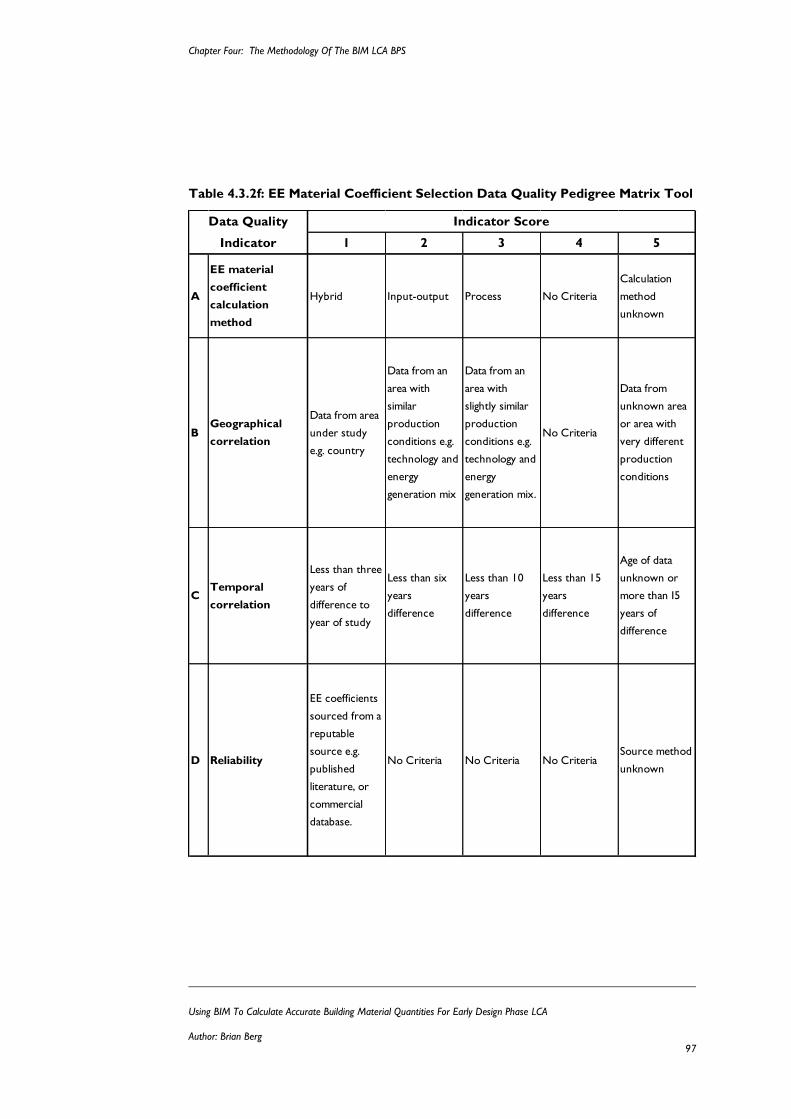
Chapter Four: The Methodology Of The BIM LCA BPS
Using BIM To Calculate Accurate Building Material Quantities For Early Design Phase LCA
Author: Brian Berg 97
Table 4.3.2f: EE Material Coefficient Selection Data Quality Pedigree Matrix Tool
1 2 3 4 5
A
EE material
coefficient
calculation
method
Hybrid Input-output Process No Criteria
Calculation
method
unknown
BGeographical
correlation
Data from area
under study
e.g. country
Data from an
area with
similar
production
conditions e.g.
technology and
energy
generation mix
Data from an
area with
slightly similar
production
conditions e.g.
technology and
energy
generation mix.
No Criteria
Data from
unknown area
or area with
very different
production
conditions
CTemporal
correlation
Less than three
years of
difference to
year of study
Less than six
years
difference
Less than 10
years
difference
Less than 15
years
difference
Age of data
unknown or
more than I5
years of
difference
D Reliability
EE coefficients
sourced from a
reputable
source e.g.
published
literature, or
commercial
database.
No Criteria No Criteria No CriteriaSource method
unknown
Data Quality
Indicator
Indicator Score
Chapter Four: The Methodology Of The BIM LCA BPS
Using BIM To Calculate Accurate Building Material Quantities For Early Design Phase LCA
Author: Brian Berg 98
4.3.2 Sketching EE In The Revit BIM Tool
Having fulfilled the research objectives 1 and 2.1, this Chapter Section addresses research
objectives 2.2, and 2.3; the calculation of building material quantities, and iEE from a BIM
model. The outcome is the methodology that is going to be used for testing the thesis
hypothesis.
BIM Interoperability
Developing an iEE BIM LCA BPS BIM model requires defining what type of BIM model is
required. The different types of BIM models are defined by the different levels of BIM
technology interoperability. The level of interoperability is related to the maturity level of
the BIM model (illustrated in Figure 4.3.2a). BIM level 1 is 3D CAD, therefore it is not
capable of interoperability. Level 2 BIM maturity models is not an iBIM model. Instead all
members of the design team produce and maintain their own BIM models before importing
through interoperability one another’s BIM model when required. At this level, the BIM D’s;
4D (Time) BIM, 5D (Cost) BIM, and 6D (Facilities Management) BIM are capable information
outputs (Sinclair, 2012). Level 3 BIM maturity models are a iBIM models that contains all the
information required to conduct multiple performance assessments (Donn et al., 2012, p.
188). This is the same information present in the 4D-6D Level 2 BIM models, just embedded
in one model from the projects inception. Interoperability through standards such as IFC is
required to do this (Pazlar & Turk, 2008, p. 378).
The move from BIM maturity Levels 2 and 3 effects how the BIM model is constructed, by
effecting how the BIM objects, geometry, and LCA information is embedded into the BIM
model. However, this has no effect on what information is required, or the models
calculation capabilities. Therefore, either a BIM maturity Level 2 or 3 BIM model can be used
for an iEE BIM LCA BPS model. Provided the required information is embedded into the
model for sketch design, it doesn’t matter how it gets there.
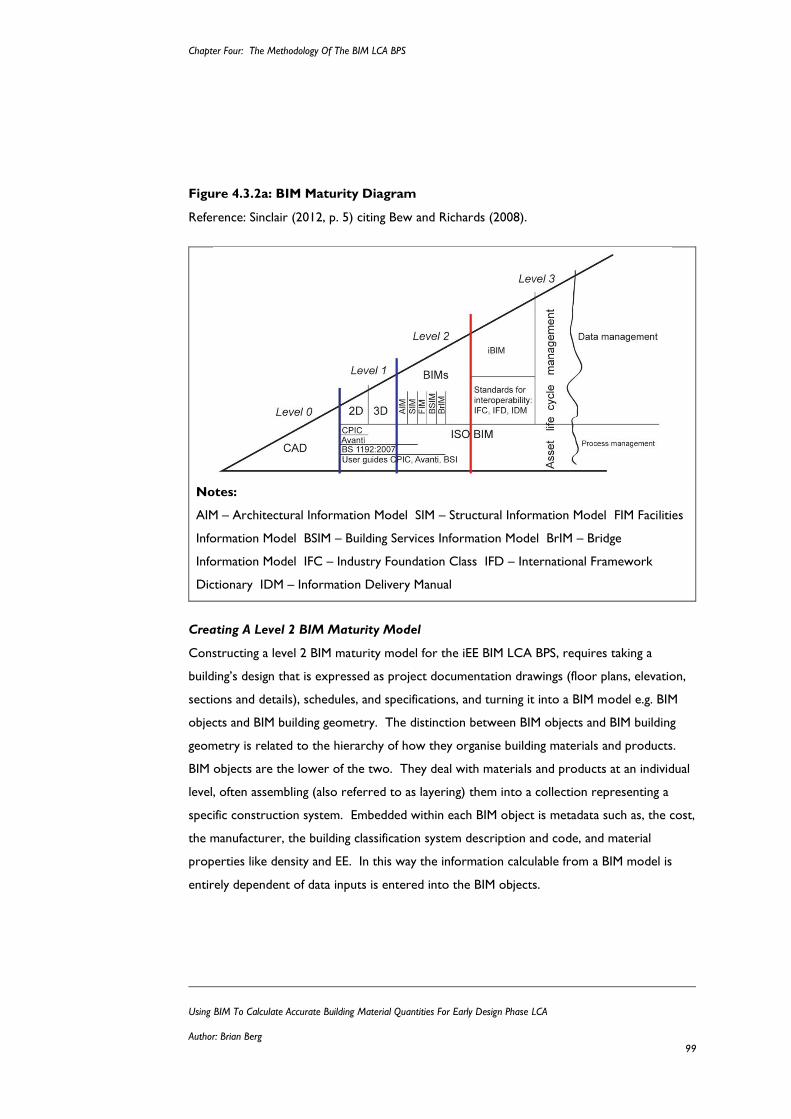
Chapter Four: The Methodology Of The BIM LCA BPS
Using BIM To Calculate Accurate Building Material Quantities For Early Design Phase LCA
Author: Brian Berg 99
Figure 4.3.2a: BIM Maturity Diagram
Reference: Sinclair (2012, p. 5) citing Bew and Richards (2008).
Notes:
AIM – Architectural Information Model SIM – Structural Information Model FIM Facilities
Information Model BSIM – Building Services Information Model BrIM – Bridge
Information Model IFC – Industry Foundation Class IFD – International Framework
Dictionary IDM – Information Delivery Manual
Creating A Level 2 BIM Maturity Model
Constructing a level 2 BIM maturity model for the iEE BIM LCA BPS, requires taking a
building’s design that is expressed as project documentation drawings (floor plans, elevation,
sections and details), schedules, and specifications, and turning it into a BIM model e.g. BIM
objects and BIM building geometry. The distinction between BIM objects and BIM building
geometry is related to the hierarchy of how they organise building materials and products.
BIM objects are the lower of the two. They deal with materials and products at an individual
level, often assembling (also referred to as layering) them into a collection representing a
specific construction system. Embedded within each BIM object is metadata such as, the cost,
the manufacturer, the building classification system description and code, and material
properties like density and EE. In this way the information calculable from a BIM model is
entirely dependent of data inputs is entered into the BIM objects.
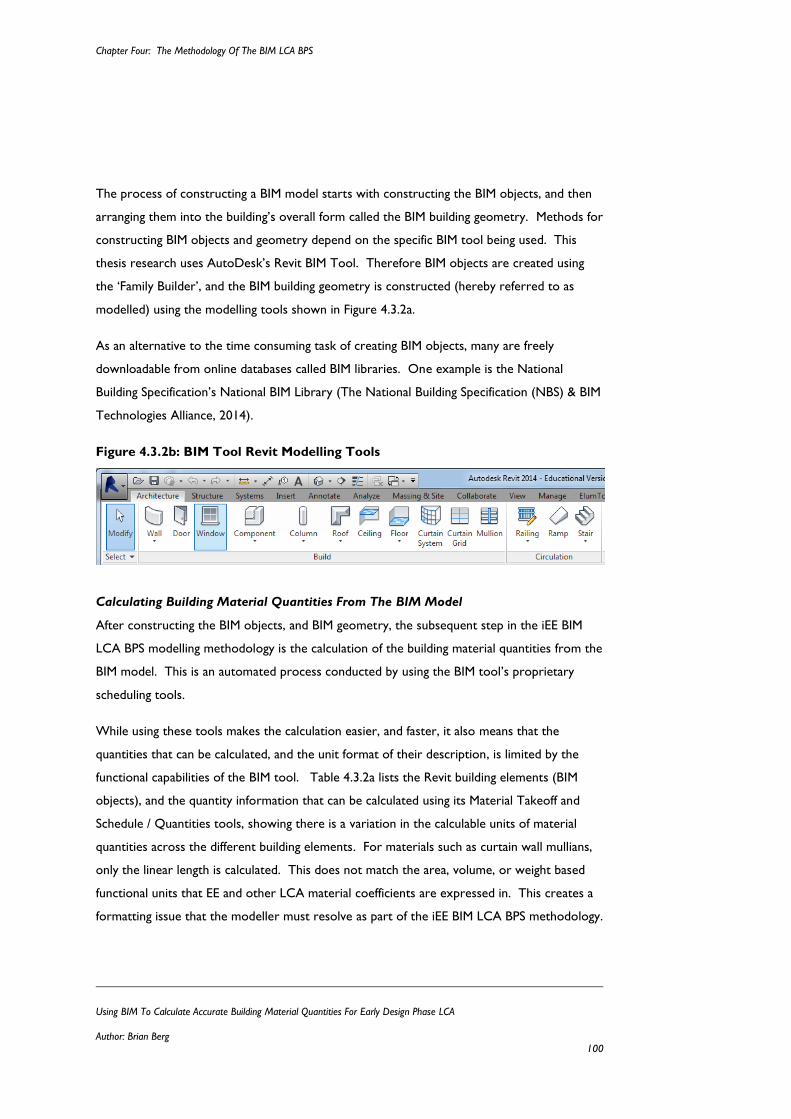
Chapter Four: The Methodology Of The BIM LCA BPS
Using BIM To Calculate Accurate Building Material Quantities For Early Design Phase LCA
Author: Brian Berg 100
The process of constructing a BIM model starts with constructing the BIM objects, and then
arranging them into the building’s overall form called the BIM building geometry. Methods for
constructing BIM objects and geometry depend on the specific BIM tool being used. This
thesis research uses AutoDesk’s Revit BIM Tool. Therefore BIM objects are created using
the ‘Family Builder’, and the BIM building geometry is constructed (hereby referred to as
modelled) using the modelling tools shown in Figure 4.3.2a.
As an alternative to the time consuming task of creating BIM objects, many are freely
downloadable from online databases called BIM libraries. One example is the National
Building Specification’s National BIM Library (The National Building Specification (NBS) & BIM
Technologies Alliance, 2014).
Figure 4.3.2b: BIM Tool Revit Modelling Tools
Calculating Building Material Quantities From The BIM Model
After constructing the BIM objects, and BIM geometry, the subsequent step in the iEE BIM
LCA BPS modelling methodology is the calculation of the building material quantities from the
BIM model. This is an automated process conducted by using the BIM tool’s proprietary
scheduling tools.
While using these tools makes the calculation easier, and faster, it also means that the
quantities that can be calculated, and the unit format of their description, is limited by the
functional capabilities of the BIM tool. Table 4.3.2a lists the Revit building elements (BIM
objects), and the quantity information that can be calculated using its Material Takeoff and
Schedule / Quantities tools, showing there is a variation in the calculable units of material
quantities across the different building elements. For materials such as curtain wall mullians,
only the linear length is calculated. This does not match the area, volume, or weight based
functional units that EE and other LCA material coefficients are expressed in. This creates a
formatting issue that the modeller must resolve as part of the iEE BIM LCA BPS methodology.
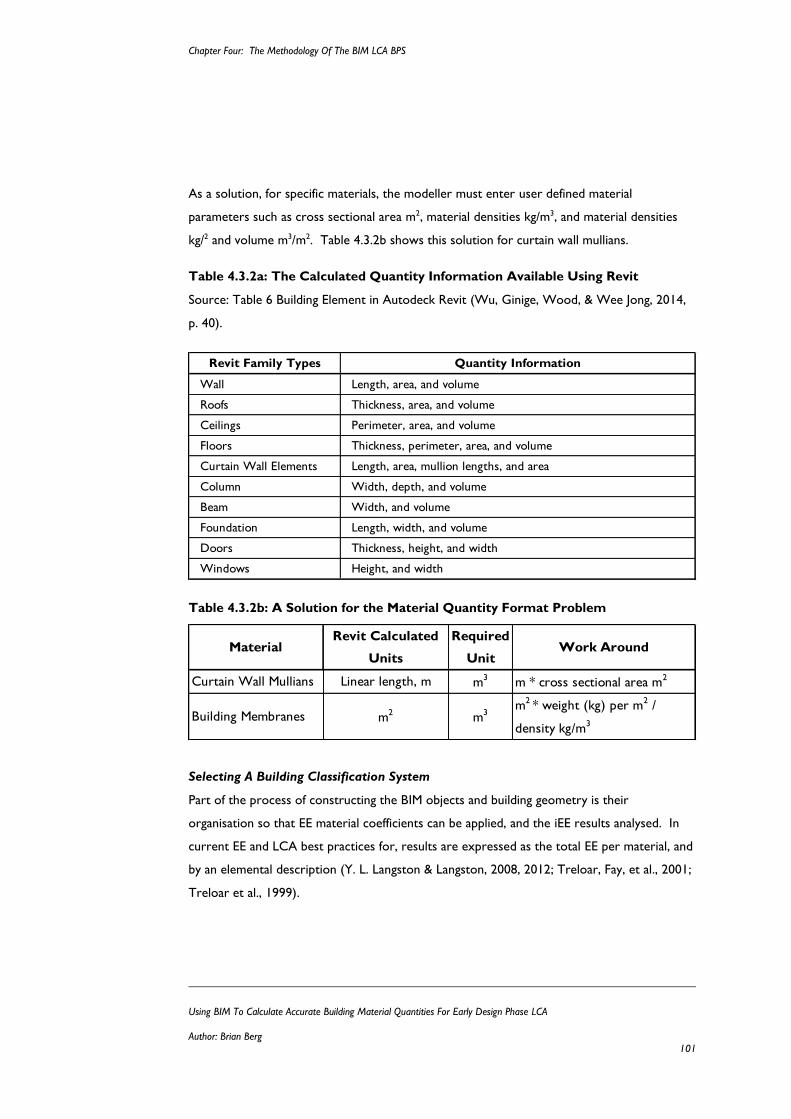
Chapter Four: The Methodology Of The BIM LCA BPS
Using BIM To Calculate Accurate Building Material Quantities For Early Design Phase LCA
Author: Brian Berg 101
As a solution, for specific materials, the modeller must enter user defined material
parameters such as cross sectional area m2, material densities kg/m3, and material densities
kg/2 and volume m3/m2. Table 4.3.2b shows this solution for curtain wall mullians.
Table 4.3.2a: The Calculated Quantity Information Available Using Revit
Source: Table 6 Building Element in Autodeck Revit (Wu, Ginige, Wood, & Wee Jong, 2014,
p. 40).
Table 4.3.2b: A Solution for the Material Quantity Format Problem
Selecting A Building Classification System
Part of the process of constructing the BIM objects and building geometry is their
organisation so that EE material coefficients can be applied, and the iEE results analysed. In
current EE and LCA best practices for, results are expressed as the total EE per material, and
by an elemental description (Y. L. Langston & Langston, 2008, 2012; Treloar, Fay, et al., 2001;
Treloar et al., 1999).
Revit Family Types Quantity Information
Wall Length, area, and volume
Roofs Thickness, area, and volume
Ceilings Perimeter, area, and volume
Floors Thickness, perimeter, area, and volume
Curtain Wall Elements Length, area, mullion lengths, and area
Column Width, depth, and volume
Beam Width, and volume
Foundation Length, width, and volume
Doors Thickness, height, and width
Windows Height, and width
MaterialRevit Calculated
Units
Required
UnitWork Around
Curtain Wall Mullians Linear length, m m3
m * cross sectional area m2
Building Membranes m2
m3
m2 * weight (kg) per m
2 /
density kg/m3
Chapter Four: The Methodology Of The BIM LCA BPS
Using BIM To Calculate Accurate Building Material Quantities For Early Design Phase LCA
Author: Brian Berg 102
Building classification systems are used to provide a standard definition for this organisation
using standardised name, and code system for describing data and information, and its
relationship to other items. Used within the iEE BIM LCA BPS methodology, a classification
name and code must be applied to each material that makes up a BIM object, and to each BIM
object that forms the BIM geometry. Within Revit this is best applied as a ‘Family Type
Parameter’. The outcome is a list of building material quantities that lists for each material,
the name and identification code of that material, and the structural and/or construction
system’s name and identification code it is part of.
Currently, a large number of different manual building classification systems exist within the
AEC industry. Many were developed to be country specific. Due to this diversity,
coordination between the different classification systems is poor. This is an area of building
research currently been investigated, with improvements in integration needed to keep pace
with the increasing international trade of building materials, and the use of BIM. ISO 12006-2
is an international standard that was developed to improve the coordination between the
multitudes of different classification systems used worldwide. This ISO standard is a
framework for structuring building classification systems. It functions to standardise the
structuring, labelling terminology, and definitions for manual classification systems
(International Standards Organisation, 2001). This splits manual classification systems into
two groups; those that are aligned with ISO 12006-2 e.g. UniClass 2.0 and OmniClass, and
those that are not e.g. CI/SfB, CAWS, CBI, MasterFormat, UniFormat, and AIQS (Lou &
Goulding, 2008). First published in 2001, ISO 12006-2 has largely influenced the future
development of manual classification systems; to the point where those not aligned are be
reviewed, or phase out and replaced by those that are. For example, CAWS (the European
classification system New Zealand’s CBI is based on) and UniClass 1.4 are being replaced by
the UK’s UniClass 2.0, while in the USA MasterFormat and UniFormat are being replaced by
OmniClass.
In line with this trend in classification system development, the system selected for the iEE
BIM LCA BPS must be aligned with ISO 12006-2, and be compatible with BIM modelling
systems. This narrows the options to the OmniClass, and UniClass 2.0. For this thesis,
UniClass 2.0 was selected. Unlike OmniClass, it has a consistent coding system which makes
it easier to integrate into BIM. As Table 4.3.2d shows, UniClass 2.0 consistently uses 3 levels
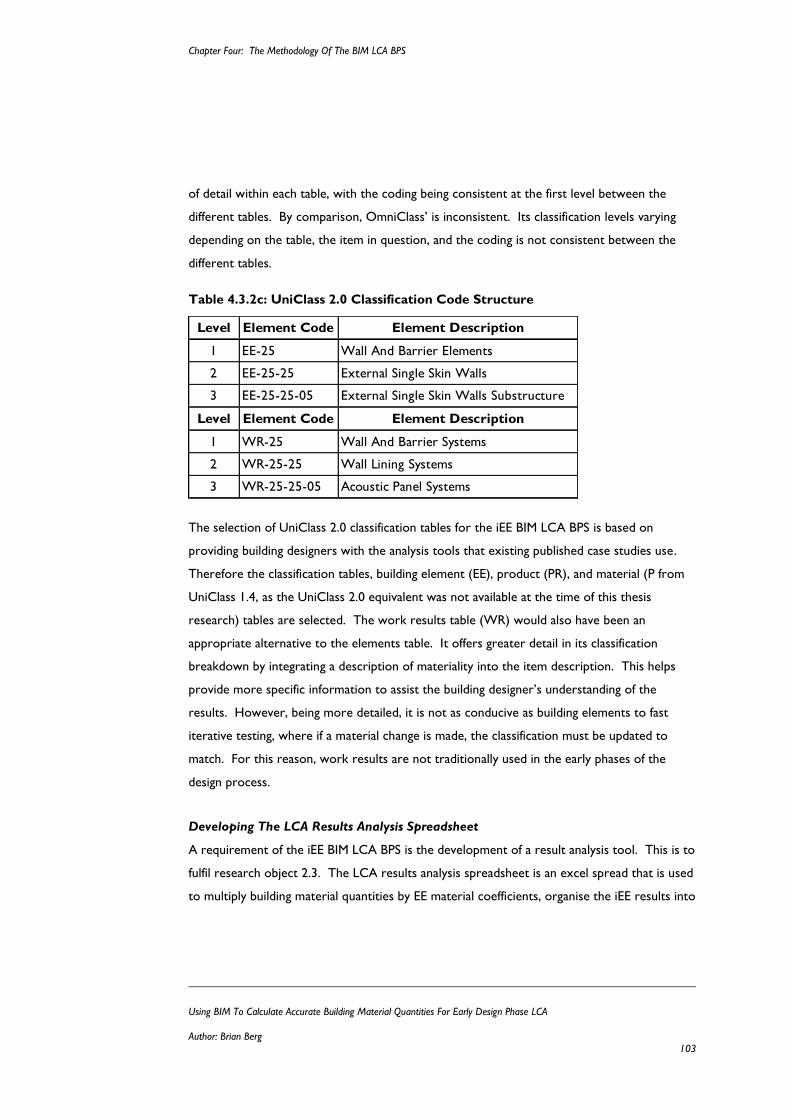
Chapter Four: The Methodology Of The BIM LCA BPS
Using BIM To Calculate Accurate Building Material Quantities For Early Design Phase LCA
Author: Brian Berg 103
of detail within each table, with the coding being consistent at the first level between the
different tables. By comparison, OmniClass’ is inconsistent. Its classification levels varying
depending on the table, the item in question, and the coding is not consistent between the
different tables.
Table 4.3.2c: UniClass 2.0 Classification Code Structure
The selection of UniClass 2.0 classification tables for the iEE BIM LCA BPS is based on
providing building designers with the analysis tools that existing published case studies use.
Therefore the classification tables, building element (EE), product (PR), and material (P from
UniClass 1.4, as the UniClass 2.0 equivalent was not available at the time of this thesis
research) tables are selected. The work results table (WR) would also have been an
appropriate alternative to the elements table. It offers greater detail in its classification
breakdown by integrating a description of materiality into the item description. This helps
provide more specific information to assist the building designer’s understanding of the
results. However, being more detailed, it is not as conducive as building elements to fast
iterative testing, where if a material change is made, the classification must be updated to
match. For this reason, work results are not traditionally used in the early phases of the
design process.
Developing The LCA Results Analysis Spreadsheet
A requirement of the iEE BIM LCA BPS is the development of a result analysis tool. This is to
fulfil research object 2.3. The LCA results analysis spreadsheet is an excel spread that is used
to multiply building material quantities by EE material coefficients, organise the iEE results into
Level Element Code Element Description
1 EE-25 Wall And Barrier Elements
2 EE-25-25 External Single Skin Walls
3 EE-25-25-05 External Single Skin Walls Substructure
Level Element Code Element Description
1 WR-25 Wall And Barrier Systems
2 WR-25-25 Wall Lining Systems
3 WR-25-25-05 Acoustic Panel Systems
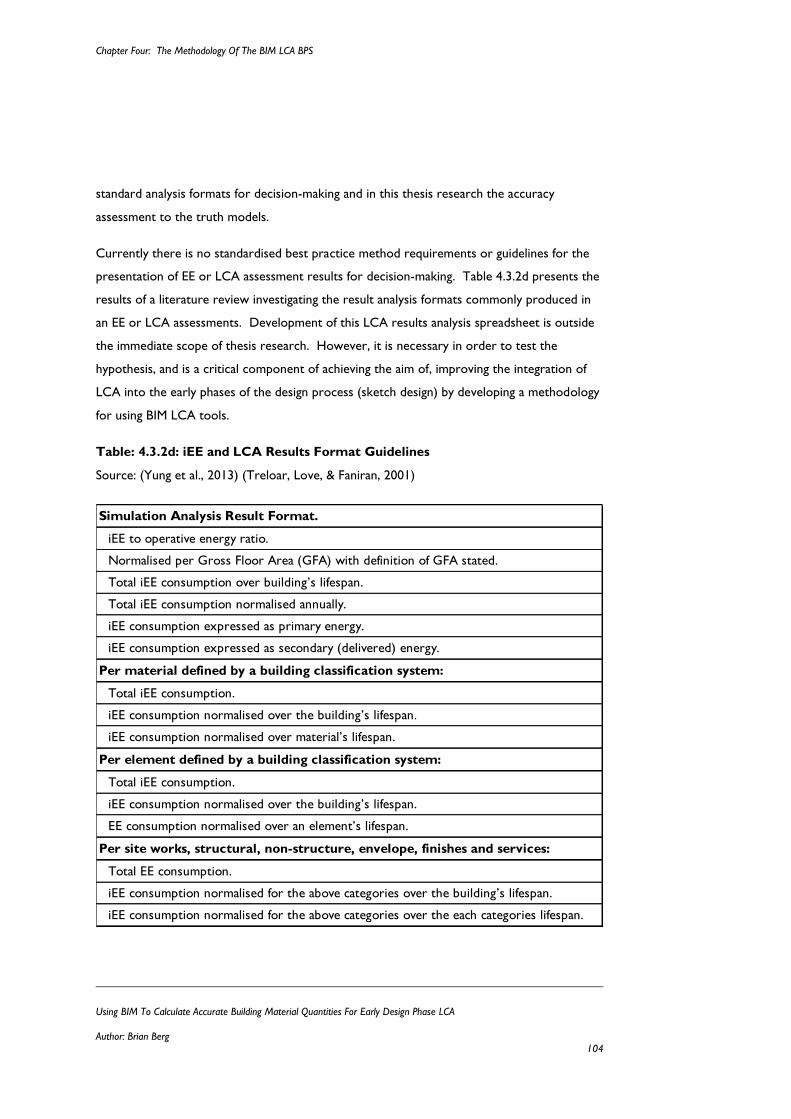
Chapter Four: The Methodology Of The BIM LCA BPS
Using BIM To Calculate Accurate Building Material Quantities For Early Design Phase LCA
Author: Brian Berg 104
standard analysis formats for decision-making and in this thesis research the accuracy
assessment to the truth models.
Currently there is no standardised best practice method requirements or guidelines for the
presentation of EE or LCA assessment results for decision-making. Table 4.3.2d presents the
results of a literature review investigating the result analysis formats commonly produced in
an EE or LCA assessments. Development of this LCA results analysis spreadsheet is outside
the immediate scope of thesis research. However, it is necessary in order to test the
hypothesis, and is a critical component of achieving the aim of, improving the integration of
LCA into the early phases of the design process (sketch design) by developing a methodology
for using BIM LCA tools.
Table: 4.3.2d: iEE and LCA Results Format Guidelines
Source: (Yung et al., 2013) (Treloar, Love, & Faniran, 2001)
Simulation Analysis Result Format.
iEE to operative energy ratio.
Normalised per Gross Floor Area (GFA) with definition of GFA stated.
Total iEE consumption over building’s lifespan.
Total iEE consumption normalised annually.
iEE consumption expressed as primary energy.
iEE consumption expressed as secondary (delivered) energy.
Per material defined by a building classification system:
Total iEE consumption.
iEE consumption normalised over the building’s lifespan.
iEE consumption normalised over material’s lifespan.
Per element defined by a building classification system:
Total iEE consumption.
iEE consumption normalised over the building’s lifespan.
EE consumption normalised over an element’s lifespan.
Per site works, structural, non-structure, envelope, finishes and services:
Total EE consumption.
iEE consumption normalised for the above categories over the building’s lifespan.
iEE consumption normalised for the above categories over the each categories lifespan.
Chapter Four: The Methodology Of The BIM LCA BPS
Using BIM To Calculate Accurate Building Material Quantities For Early Design Phase LCA
Author: Brian Berg 105
4.4 Chapter Inference
The BPS (BPS) only provided a framework for how to use building performance simulation
tools in a manner that achieved the requirements of effective integration. Lacking were the
specific requirements defining what a BPS is for a specific area of building performance, such
as iEE. This limitation formulated research objectives one and two, where an iEE BIM LCA
BPS must be defined, and a methodology for how to use Revit to conduct one must be
developed. This chapter fulfils these two research objectives. The subsequent chapter,
Chapter 5.0, develops the accuracy assessment framework for testing the feasibility of this
chapter’s developed iEE BIM LCA BPS methodology.
Chapter Five: The Accuracy Assessment Framework For The BIM LCA BPS
Using BIM To Calculate Accurate Building Material Quantities For Early Design Phase LCA
Author: Brian Berg 106
Chapter Five:
5 THE ACCURACY ASSESSMENT
FRAMEWORK FOR THE BIM LCA BPS
5.1 Chapter Intent
The previous chapter addressed research objectives one, and two, and developed a
methodology for the Initial EE BIM LCA BPS (iEE BIM LCA BPS). The aim of this
methodology is to satisfy the requirements to effectively integrate the LCA assessment of
building materials into the early phases of the design process. However, it is currently only a
conceptual process, the iEE BIM LCA BPS methodology must be tested to prove that is can
produce accurate LCA-based simulation results to satisfy the requirement of effective
integration.
As chapters 2.0 and 3.0 concluded, there are no methods for assessing the accuracy of a
whole building EE or LCA simulation process. The aim of this chapter is to fulfil the third
research objective, and develop an EE simulation calibration accuracy assessment
methodology. Chapter Sections 5.2 and 5.3 define simulation accuracy assessment, and the
need to develop functional definitions for the critical terms of ‘how close’, and ‘true value’ for
EE and LCA simulation. Chapter Sections 5.4 and 5.5 develop the EE simulation calibration
accuracy assessment methodology, defining these terms.
Following this chapter, Chapter 6.0 uses the outcomes from the two methodology
development chapters, 4.0 and 5.0, to test the thesis hypothesis. This is to determine if, the
iEE BIM LCA BPS methodology can calculate accurate LCA-based results of the
environmental impact of building materials from sketch design level information quickly, and
easily, to satisfy the requirements of effective integration.
Chapter Five: The Accuracy Assessment Framework For The BIM LCA BPS
Using BIM To Calculate Accurate Building Material Quantities For Early Design Phase LCA
Author: Brian Berg 107
5.2 Defining Simulation Accuracy, And Precision
In building performance, simulation accuracy is defined as the indication of ‘how close’
calculated results (values) are to their ‘true value’ measured in reality (ASHRAE, 2002, p. 7).
This difference between simulated results and true values is caused by simulation errors. This
makes simulation accuracy a measure of the cumulative effects of all the simulation errors.
Simulation uncertainty relates to a lack of knowledge surrounding the simulation data inputs.
Uncertainties occur when no data of information is available, or if available it is wrong, or
ambiguous (Heijungs & Huijbregts, 2004, p. 2). This lack of knowledge means there is an
increased risk of simulation errors causing simulation inaccuracies.
Simulation precision is an expression of the closeness of agreement among repeated
measurements of the same physical quantity (ASHRAE, 2002, p. 9). It accounts for offsetting
or cancellation errors that occur when a model is over (when results are above their true
value) or under (when results are below their true value) simulating results. These are error
that are not identified by accuracy assessment, making simulation precision an important
compliment to simulation accuracy assessment.
Simulation robustness is a measure of the reliability of simulation results (Hopfe & Hensen,
2011, p. 2800). A simulation robustness assessment is a type of sensitivity analysis. It
identifies any unexpected sensitivities or hidden errors in simulation inputs, and in the
simulation calculation process, which may arise in different design iterations or scenarios
(Hopfe & Hensen, 2011, p. 2804). Robustness assessment tests to ensure that slight changes
in the simulation inputs do not result in an unacceptable level of simulation accuracy, or not
achieving performance goals (CIBSE, 1998, 2006).
5.3 Assessing Simulation Accuracy
Simulation accuracy assessment is the process of comparing simulation results to a true value,
using a set of criteria that define the maximum acceptable tolerances that express how close
(or accurate) is close enough. The result of this simulation accuracy assessment is the
measurement of the margin of error in the simulation. This margin of error is the cumulative
effect of all the simulation inaccuracies, caused by simulation uncertainties and errors. The
Chapter Five: The Accuracy Assessment Framework For The BIM LCA BPS
Using BIM To Calculate Accurate Building Material Quantities For Early Design Phase LCA
Author: Brian Berg 108
cumulative effects of simulation inaccuracies caused by uncertainties, and errors, against a
defined ‘true’ value, and evaluated against a defined maximum acceptable tolerance for
measuring the margin of error between simulated results and the ‘true’ value. In LCA and EE
research, past research has been focussed on the development of material coefficients, and
their accuracy and uncertainty assessment methods and tools. This research has been
conducted at two levels of the calculation process, an individual material level, and a whole
building level:
At an individual level material level, the development of uncertainity assessment
methods and tools is specific for the material coefficients. For EE, these tools
assessed the individual data inputs used in the calculation method for developing the
EE material coefficients.
A whole building level assessment assesses the impact of using inappropriate EE
material coefficients. Wang & Shen (2013) developed quality assurance methods and
tools for assessing the potential impact EE material coefficients formulated from
generic data, or from databases not specific to the subject country have on the
accuracy of the result. Critically, they do not advocate the level of inaccuracy when
the simulation results are no longer suitable for decision-making.
Both of these research levels, extend only to material coefficient and the assessment of their
uncertainty. To date, there is no method for assessing the accuracy of a LCA assessment that
is the result of multiplying building material coefficients by building material quantities. This is
a gap in LCA research that this thesis’ third research objective is fulfilling.
Looking to other areas of building performance for precedence, Operative Energy (OE)
simulation calibration is a comprehensive form the accuracy assessment used in building
design. It is a method of assessing, and ensuring simulations meet predefined accuracy
requirements. Critically, it extends beyond determining the deviation of simulation results
compared to their ‘true value’, to include specifying, how far this margin of error can be,
while still facilitating informed decision-making (ASHRAE, 2002, p. 7). This makes calibration
the most comprehensive, and best practice method of accuracy assessment for accessing
simulation accuracy in building performance.
Chapter Five: The Accuracy Assessment Framework For The BIM LCA BPS
Using BIM To Calculate Accurate Building Material Quantities For Early Design Phase LCA
Author: Brian Berg 109
5.4 Existing Calibration Accuracy Assessment
Simulation calibration can only be used in building performance when measured data e.g. a
truth model, is available. This makes it unsuitable for new building design, but ideal for testing
this thesis’ hypothesis. In the iEE BIM LCA BPS methodology, the need for a calibration
accuracy assessment is driven by the following reasons:
Uncertainty assessment tools are not available for reducing simulation inaccuracies in
the material quantity simulation inputs. Therefore any uncertainties and errors in
this data cannot be reduced, or removed, prior to simulation. This means they are
integrated into the calculation result. Therefore they must be dealt with as part of
simulation accuracy assessment. To be effective, the iEE BIM LCA BPS must satisfy
all the requirements for effective integration outlined in Chapter Section 2.3.
Simulation calibration is used in this thesis research to define information building
designers must model, so that they model only enough information, to a level of
detail, that is necessary to calculate accurate iEE results for basing informed design
decisions on. Critically, this requires defining how accurate is accurate enough?
To date no research has applied simulation calibration LCA or EE assessments. Therefore,
one must be developed. OE simulation calibration provides the basis for achieving this thesis
research objective.
There are many different OE simulation calibration available (Bensouda, 2004, p. 5).
However, in essence, they all work towards the same premise. This is assessing the accuracy
of an OE model, and making changes to reduce its uncertainties, and errors, to improve its
accuracy a level that meets the maximum acceptable calibration tolerances. These maximum
acceptable calibration tolerances are set by project specific requirements, or by governing
standards such as, the American Society of Heating, Refrigerating and Air-Conditioning
Engineers (ASHRAE) Guideline 14 Measurement of Energy and Demand Savings (ASHRAE,
2002) (hereby referred to as ASHRAE Guideline 14:2002). ASHRAE Guideline 14:2002, and
documents that specifying achieving its compliance, such as the United States Department Of
Energy’s M&V Guidelines: Measurement and Verification for Federal Energy Projects Version
3.0 (US DOE, 2008) (hereby referred to as M&V Guideline 3.0 2008), are primarily focussed
Chapter Five: The Accuracy Assessment Framework For The BIM LCA BPS
Using BIM To Calculate Accurate Building Material Quantities For Early Design Phase LCA
Author: Brian Berg 110
on setting the requirements and acceptable means, for the measurement and calculation of
the energy savings achieved by energy conservation measures, and building design solutions.
In both documents, calibrated simulation is one means of achieving compliance (Raftery,
Keane, & Costa, 2009, p. 1199).
One method of simulation calibration was developed by Raftery et al. (2009). Figure 5.4
shows their calibration methodology. This is divided into two stages, pre-simulation and post
simulation. Pre-simulation calibration is the processes of assembling the building information,
and data, required to conduct an OE simulation. The critical aspect of this stage is removing
or reducing simulation uncertainties, and errors, before they are made. This involves
conducting Quality Assurances (QA). Current best practice QA methods, and tools, are
defined by documents such as CIBSE AM11 Building Energy and Environmental Modelling
(CIBSE Applications Manual 11) (CIBSE, 1998), and CIBSE Guide A: Environmental Design
(CIBSE, 2006). Often as-built information or real building data is stipulated as a requirement
for modelling assumptions. This is to ensure the model represents the real OE performance
is as close as possible.
Post simulation calibration involves comparing the simulated results to the actual building
performance measurements e.g. constitute the truth model. Following this, adjustment are
made to the model to make to meet the established maximum acceptable calibration
tolerances. Once met, the model can be declared as calibrated. The most important
component of the post calibration methodology is the definition of the maximum acceptable
calibration tolerances.
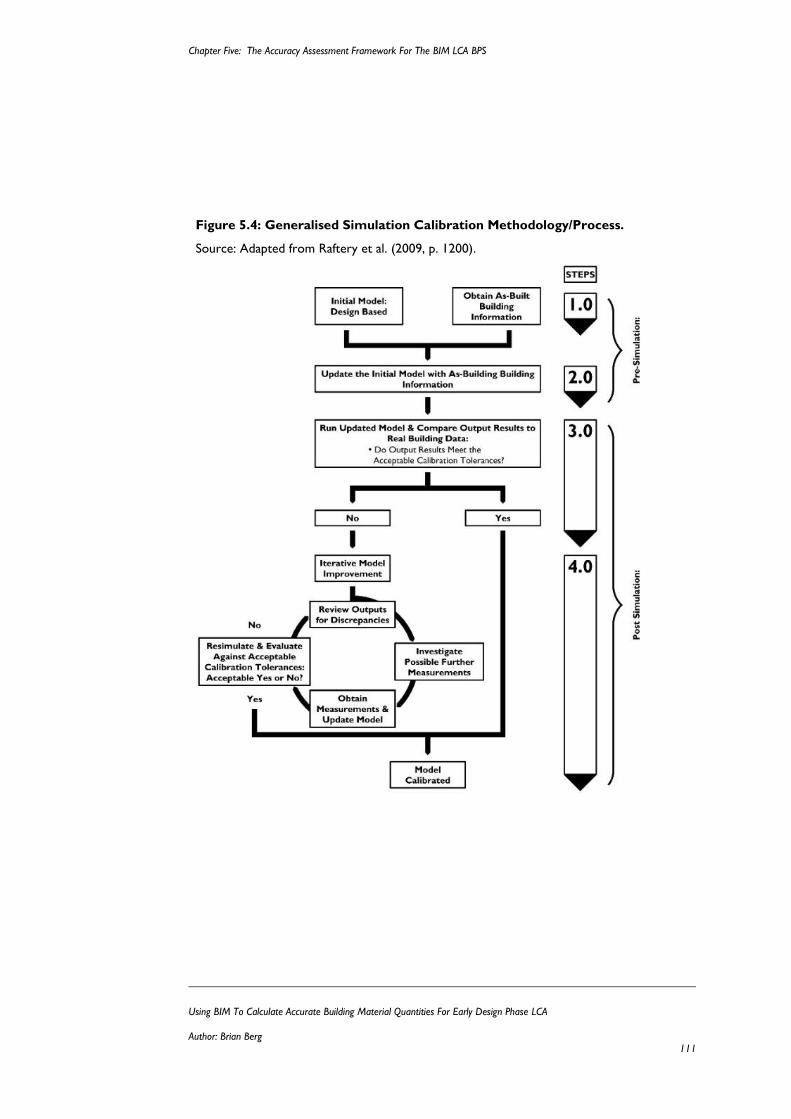
Chapter Five: The Accuracy Assessment Framework For The BIM LCA BPS
Using BIM To Calculate Accurate Building Material Quantities For Early Design Phase LCA
Author: Brian Berg 111
Figure 5.4: Generalised Simulation Calibration Methodology/Process.
Source: Adapted from Raftery et al. (2009, p. 1200).
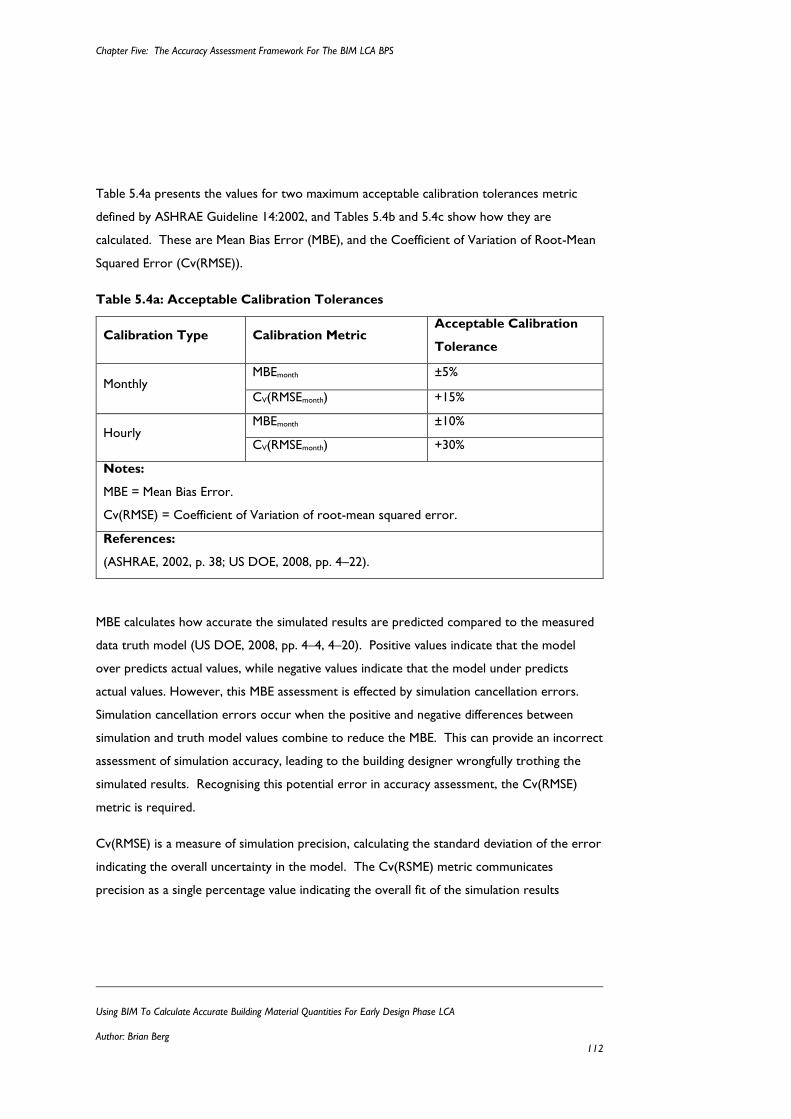
Chapter Five: The Accuracy Assessment Framework For The BIM LCA BPS
Using BIM To Calculate Accurate Building Material Quantities For Early Design Phase LCA
Author: Brian Berg 112
Table 5.4a presents the values for two maximum acceptable calibration tolerances metric
defined by ASHRAE Guideline 14:2002, and Tables 5.4b and 5.4c show how they are
calculated. These are Mean Bias Error (MBE), and the Coefficient of Variation of Root-Mean
Squared Error (Cv(RMSE)).
Table 5.4a: Acceptable Calibration Tolerances
Calibration Type Calibration Metric Acceptable Calibration
Tolerance
Monthly MBEmonth ±5%
CV(RMSEmonth) +15%
Hourly MBEmonth ±10%
CV(RMSEmonth) +30%
Notes:
MBE = Mean Bias Error.
Cv(RMSE) = Coefficient of Variation of root-mean squared error.
References:
(ASHRAE, 2002, p. 38; US DOE, 2008, pp. 4–22).
MBE calculates how accurate the simulated results are predicted compared to the measured
data truth model (US DOE, 2008, pp. 4–4, 4–20). Positive values indicate that the model
over predicts actual values, while negative values indicate that the model under predicts
actual values. However, this MBE assessment is effected by simulation cancellation errors.
Simulation cancellation errors occur when the positive and negative differences between
simulation and truth model values combine to reduce the MBE. This can provide an incorrect
assessment of simulation accuracy, leading to the building designer wrongfully trothing the
simulated results. Recognising this potential error in accuracy assessment, the Cv(RMSE)
metric is required.
Cv(RMSE) is a measure of simulation precision, calculating the standard deviation of the error
indicating the overall uncertainty in the model. The Cv(RSME) metric communicates
precision as a single percentage value indicating the overall fit of the simulation results
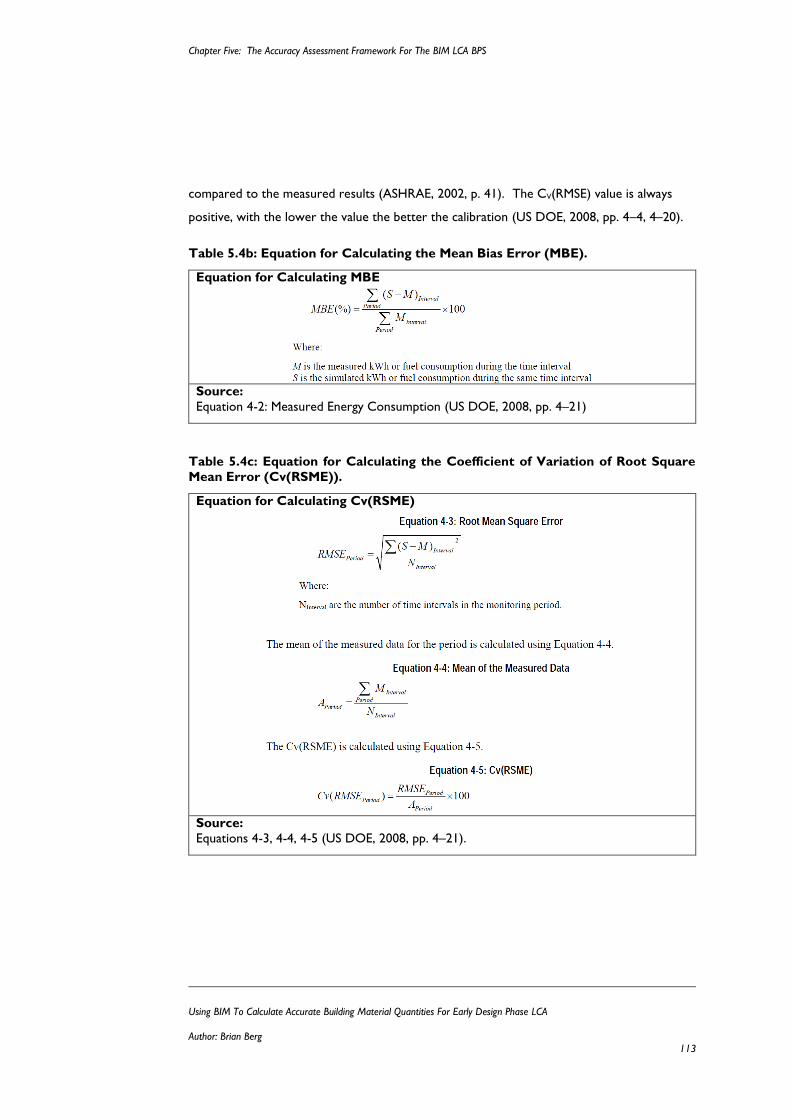
Chapter Five: The Accuracy Assessment Framework For The BIM LCA BPS
Using BIM To Calculate Accurate Building Material Quantities For Early Design Phase LCA
Author: Brian Berg 113
compared to the measured results (ASHRAE, 2002, p. 41). The CV(RMSE) value is always
positive, with the lower the value the better the calibration (US DOE, 2008, pp. 4–4, 4–20).
Table 5.4b: Equation for Calculating the Mean Bias Error (MBE).
Equation for Calculating MBE
Source:
Equation 4-2: Measured Energy Consumption (US DOE, 2008, pp. 4–21)
Table 5.4c: Equation for Calculating the Coefficient of Variation of Root Square
Mean Error (Cv(RSME)).
Equation for Calculating Cv(RSME)
Source:
Equations 4-3, 4-4, 4-5 (US DOE, 2008, pp. 4–21).
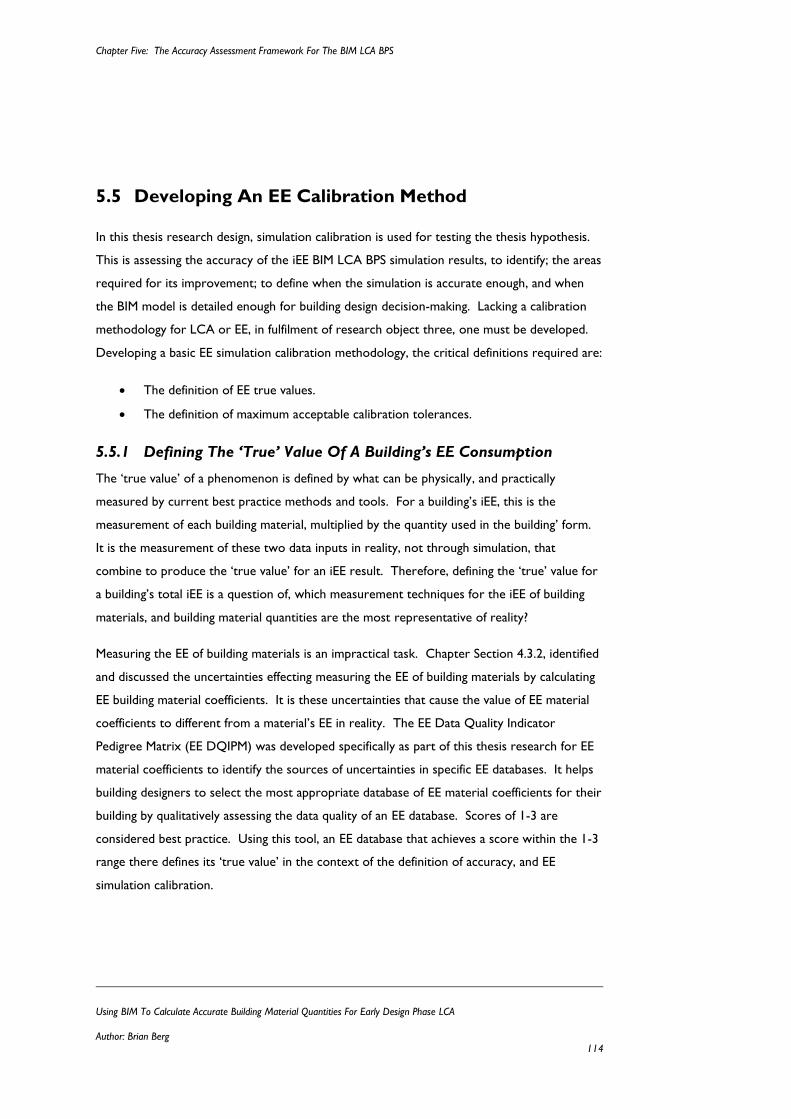
Chapter Five: The Accuracy Assessment Framework For The BIM LCA BPS
Using BIM To Calculate Accurate Building Material Quantities For Early Design Phase LCA
Author: Brian Berg 114
5.5 Developing An EE Calibration Method
In this thesis research design, simulation calibration is used for testing the thesis hypothesis.
This is assessing the accuracy of the iEE BIM LCA BPS simulation results, to identify; the areas
required for its improvement; to define when the simulation is accurate enough, and when
the BIM model is detailed enough for building design decision-making. Lacking a calibration
methodology for LCA or EE, in fulfilment of research object three, one must be developed.
Developing a basic EE simulation calibration methodology, the critical definitions required are:
The definition of EE true values.
The definition of maximum acceptable calibration tolerances.
5.5.1 Defining The ‘True’ Value Of A Building’s EE Consumption
The ‘true value’ of a phenomenon is defined by what can be physically, and practically
measured by current best practice methods and tools. For a building’s iEE, this is the
measurement of each building material, multiplied by the quantity used in the building’ form.
It is the measurement of these two data inputs in reality, not through simulation, that
combine to produce the ‘true value’ for an iEE result. Therefore, defining the ‘true’ value for
a building’s total iEE is a question of, which measurement techniques for the iEE of building
materials, and building material quantities are the most representative of reality?
Measuring the EE of building materials is an impractical task. Chapter Section 4.3.2, identified
and discussed the uncertainties effecting measuring the EE of building materials by calculating
EE building material coefficients. It is these uncertainties that cause the value of EE material
coefficients to different from a material’s EE in reality. The EE Data Quality Indicator
Pedigree Matrix (EE DQIPM) was developed specifically as part of this thesis research for EE
material coefficients to identify the sources of uncertainties in specific EE databases. It helps
building designers to select the most appropriate database of EE material coefficients for their
building by qualitatively assessing the data quality of an EE database. Scores of 1-3 are
considered best practice. Using this tool, an EE database that achieves a score within the 1-3
range there defines its ‘true value’ in the context of the definition of accuracy, and EE
simulation calibration.
Chapter Five: The Accuracy Assessment Framework For The BIM LCA BPS
Using BIM To Calculate Accurate Building Material Quantities For Early Design Phase LCA
Author: Brian Berg 115
Measuring the building material quantities used in a constructed building is similarly
impractical. A building design is not finalised until after the construction lifecycle stage. Once
completed, it is impractical to deconstruct the building and measure the volume quantities of
each material used. Like the EE material coefficients, the ‘true value’ of building material
quantities is defined by the best current method of measurement. Chapter Section 2.6
defined this as a SOQ (SOQ). Therefore, a list of building material quantities, measured or
calculated, to a level of detail equivalent to a SOQ defines its ‘true value’ in the context of the
definition of accuracy, and EE simulation calibration.
5.5.2 Defining ‘How Close’ Is Close Enough: EE Maximum Calibration
Tolerances
In simulation calibration accuracy assessment, the definition of ‘how close’ simulation results
must be to their ‘true value’ in reality, is defined by the maximum acceptable calibration
tolerances. Developing an iEE BIM LCA BPS calibration methodology requires developing a
functional definition for calibration tolerances specifically for iEE. In the wider perspective of
this thesis research, the definition of these calibration tolerances define how accurate, and
therefore, how detailed the BIM model needs to be calculate accurate building material
quantities.
Due to the differences between EE and OE, defining EE maximum calibration tolerances is
not simply using those reported by ASHRAE Guideline 14:2002 (ASHRAE, 2002). It is
unknown whether the ASHRAE Guideline 14:2002 figures were developed through research
experimentation in calibration case studies, or because they were simply convenient statistical
metrics and their values seemed sensible. Regardless, contemporary research has proven
them to be appropriate. Bensouda (2004) supports the ASHRAE Guideline 14:2002
maximum calibration tolerances, stating that, “[modelling] efforts have been quite successful
in achieving simulated results that agreed with the measured consumption, typically to less
than 5% on an annual basis. Agreement within 5-10% has often been achieved on a monthly
basis, and sometimes on a daily basis” (Bensouda, 2004, p. 5). Further evidence supporting
their suitability is demonstrated by examining the level of accuracy an OE simulation must
function to, relative to the annual OE savings achieved by Energy Conservation Measures
(ECMs). For example, Kim (2010), investigating the ECMs of building envelopes, and
Chapter Five: The Accuracy Assessment Framework For The BIM LCA BPS
Using BIM To Calculate Accurate Building Material Quantities For Early Design Phase LCA
Author: Brian Berg 116
reported that “increasing the external wall insulation by 60% will reduce the total building’s
energy consumption by 1.5% for high-rise buildings and 1.4% for low-rise buildings” (Kim,
2010, p. 72). This is a relatively small reduction in a building’s annual OE consumption. The
risk is that if the OE simulation is not operating at a high enough level of accuracy and
precision, these OE savings would have been lost in the margin of error called the
performance gap.
Defining Criteria For Selecting Ee Maximum Acceptable Calibration Tolerances
Lacking EE or LCA simulation calibration research equivalent to Bensoudas (2004), it is
unknown whether the ASHRAE Guideline 14:2002 maximum acceptable calibration tolerance
values are suitable for testing this thesis’ hypothesis. While ASHRAE Guideline 14:2002 gives
no guidance for defining these values, other calibration standards do. The M&V Guideline 3.0
2008 states that, whenever project specific calibration tolerances are required, that “specific
calibration goals should be set for each project based on the appropriate level of effort […]”
(US DOE, 2008, pp. 4–20). Critiquing this statement, the key idea is that calibration goals
should be based on an “appropriate level of effort”. An ‘appropriate level of effort’ refers the
effort level required to calibrate a model. This statement acts as a criteria, functioning to
ensure that the values set defining the maximum acceptable calibration tolerance are
reasonable. This brings forward the question of, what can be considered a reasonable level of
effort for EE or LCA simulation calibration.
Reasonable accuracy requirements can be defined as those that are not overly strict, or too
lenient, compared to modelling time constraints, decision-making, and performance goals. In
the context of this thesis research, the terms ‘reasonable’ and ‘appropriate’ for EE calibration,
are defined by how the iEE and LCA are calculated, and what the results are too be used for.
The iEE BIM LCA BPS produces results for iterative testing of design decisions in the early
phases of the design process. This simulation must be conducted quickly, and easily, to
produce simulation results that are accurate enough to allow building designers to make
informed design decisions (Donn et al., 2012, p. 203). Therefore the defined values for EE
maximum acceptable calibration tolerances must integrate into this process, so they help
achieve an iEE BIM LCA BPS, rather than act as an obstacle to it. These statements formulate
the criteria for defining the value, but do not define it.
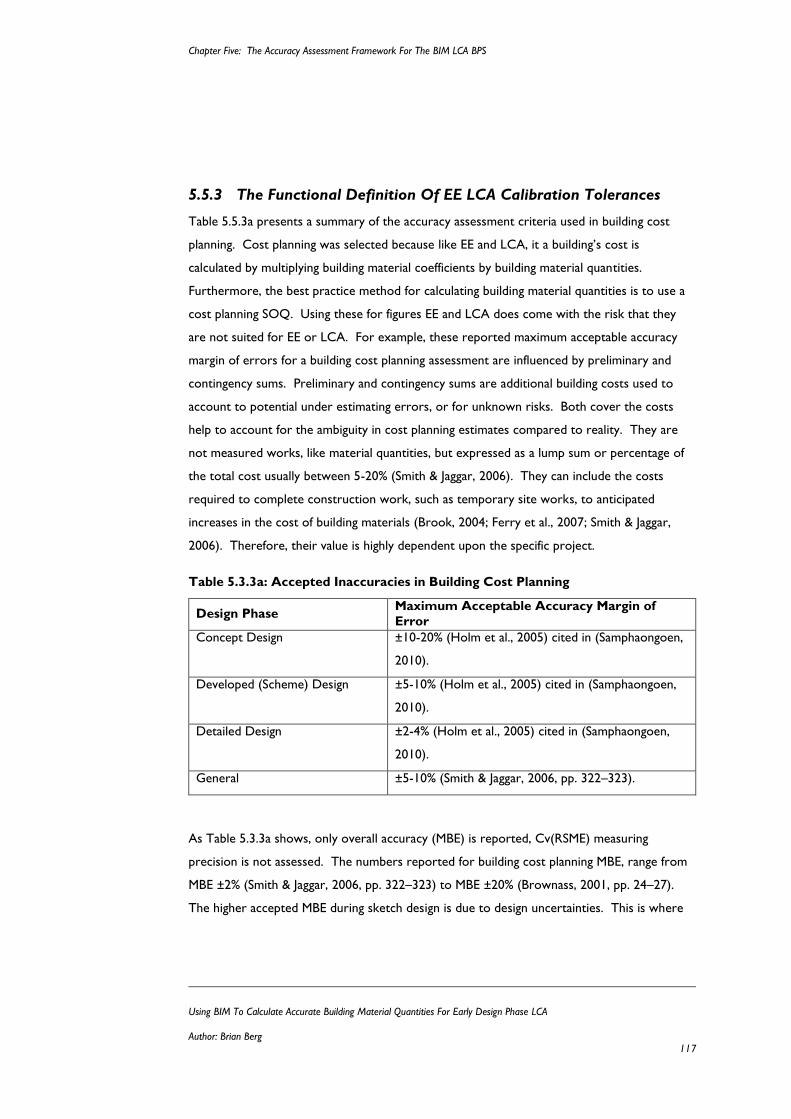
Chapter Five: The Accuracy Assessment Framework For The BIM LCA BPS
Using BIM To Calculate Accurate Building Material Quantities For Early Design Phase LCA
Author: Brian Berg 117
5.5.3 The Functional Definition Of EE LCA Calibration Tolerances
Table 5.5.3a presents a summary of the accuracy assessment criteria used in building cost
planning. Cost planning was selected because like EE and LCA, it a building’s cost is
calculated by multiplying building material coefficients by building material quantities.
Furthermore, the best practice method for calculating building material quantities is to use a
cost planning SOQ. Using these for figures EE and LCA does come with the risk that they
are not suited for EE or LCA. For example, these reported maximum acceptable accuracy
margin of errors for a building cost planning assessment are influenced by preliminary and
contingency sums. Preliminary and contingency sums are additional building costs used to
account to potential under estimating errors, or for unknown risks. Both cover the costs
help to account for the ambiguity in cost planning estimates compared to reality. They are
not measured works, like material quantities, but expressed as a lump sum or percentage of
the total cost usually between 5-20% (Smith & Jaggar, 2006). They can include the costs
required to complete construction work, such as temporary site works, to anticipated
increases in the cost of building materials (Brook, 2004; Ferry et al., 2007; Smith & Jaggar,
2006). Therefore, their value is highly dependent upon the specific project.
Table 5.3.3a: Accepted Inaccuracies in Building Cost Planning
Design Phase Maximum Acceptable Accuracy Margin of
Error
Concept Design ±10-20% (Holm et al., 2005) cited in (Samphaongoen,
2010).
Developed (Scheme) Design ±5-10% (Holm et al., 2005) cited in (Samphaongoen,
2010).
Detailed Design ±2-4% (Holm et al., 2005) cited in (Samphaongoen,
2010).
General ±5-10% (Smith & Jaggar, 2006, pp. 322–323).
As Table 5.3.3a shows, only overall accuracy (MBE) is reported, Cv(RSME) measuring
precision is not assessed. The numbers reported for building cost planning MBE, range from
MBE ±2% (Smith & Jaggar, 2006, pp. 322–323) to MBE ±20% (Brownass, 2001, pp. 24–27).
The higher accepted MBE during sketch design is due to design uncertainties. This is where
Chapter Five: The Accuracy Assessment Framework For The BIM LCA BPS
Using BIM To Calculate Accurate Building Material Quantities For Early Design Phase LCA
Author: Brian Berg 118
the lower design resolution causes the high likelihood of significant changes later in the design
process. By comparison, the lowering acceptance of inaccuracy reflected in MBE decreasing
through the design process reflects the increasing level of design resolution, and design detail
from sketch to detailed design. Because the design is more resolved, and of greater detail, it
can be calculated more accurately.
Table 5.3.3b presents the selected maximum acceptable calibration tolerances for this thesis
research. The value MBETotal ±20.0% was selected based on the cost planning simulation
accuracy requirements for the concept (sketch) design phase. This MBETotal ±20.0% is also
used in the M&V Guideline 3.0 2008, where ECMs above a 20% reduction in the annual OE
use do not require a calibration simulation model to calculate their value. With no guidance
from other areas of building performance for precision Cv(RSME) requirements, the ASHRAE
Guideline 14:2002 have been retained.
These selected calibration tolerances for EE are only a functional definition. Like the
development of the OE ASHRAE Guideline 14:2002 calibration tolerances, these are only
based on what logically is an ‘appropriate level of effort’ for EE. In practice, modellers need
to select EE calibration tolerances appropriate to their projects based on the decision-making
requirements they set in their performance goals defining the lowest acceptable ECM
allowable. In the same way that subsequent calibration studies have confirmed the
appropriateness of the ASHRAE Guideline 14:2002 tolerances for OE, an outcome of this
thesis research will be determining if the values defined by this research are suitable for EE
and LCA beyond this thesis research.
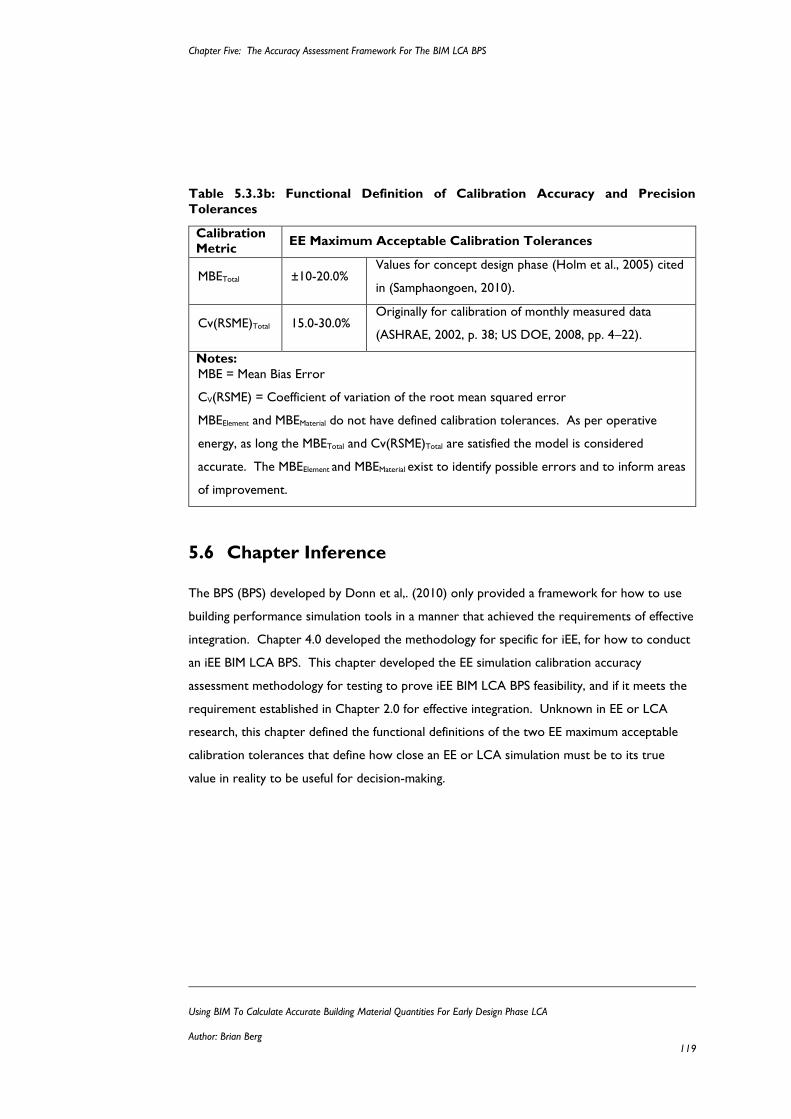
Chapter Five: The Accuracy Assessment Framework For The BIM LCA BPS
Using BIM To Calculate Accurate Building Material Quantities For Early Design Phase LCA
Author: Brian Berg 119
Table 5.3.3b: Functional Definition of Calibration Accuracy and Precision
Tolerances
Calibration
Metric EE Maximum Acceptable Calibration Tolerances
MBETotal ±10-20.0% Values for concept design phase (Holm et al., 2005) cited
in (Samphaongoen, 2010).
Cv(RSME)Total 15.0-30.0% Originally for calibration of monthly measured data
(ASHRAE, 2002, p. 38; US DOE, 2008, pp. 4–22).
Notes:
MBE = Mean Bias Error
CV(RSME) = Coefficient of variation of the root mean squared error
MBEElement and MBEMaterial do not have defined calibration tolerances. As per operative
energy, as long the MBETotal and Cv(RSME)Total are satisfied the model is considered
accurate. The MBEElement and MBEMaterial exist to identify possible errors and to inform areas
of improvement.
5.6 Chapter Inference
The BPS (BPS) developed by Donn et al,. (2010) only provided a framework for how to use
building performance simulation tools in a manner that achieved the requirements of effective
integration. Chapter 4.0 developed the methodology for specific for iEE, for how to conduct
an iEE BIM LCA BPS. This chapter developed the EE simulation calibration accuracy
assessment methodology for testing to prove iEE BIM LCA BPS feasibility, and if it meets the
requirement established in Chapter 2.0 for effective integration. Unknown in EE or LCA
research, this chapter defined the functional definitions of the two EE maximum acceptable
calibration tolerances that define how close an EE or LCA simulation must be to its true
value in reality to be useful for decision-making.
Chapter Six: Accuracy Assessment Results And Discussion
Using BIM To Calculate Accurate Building Material Quantities For Early Design Phase LCA
Author: Brian Berg 120
Chapter Six:
6 ACCURACY ASSESSMENT RESULTS AND
DISCUSSION
6.1 Chapter Intent
This Chapter tests the thesis hypothesis, that by defining the accuracy required for iEE (iEE)
simulations, a BIM model of sketch design detail will calculate building material quantities
accurately enough for a building material LCA assessment.
This uses both the iEE BIM LCA BPS methodology, and the EE calibration accuracy
assessment framework developed in Chapter 4.0, and 5.0 to test four main ideas. Chapter
Section 6.2, tests whether the information available at sketch design is sufficient to calculate
enough of a building’s total iEE to be able to be useful as a design tool for lowering a building
design’s environmental impact. This is a test of the iEE LCA BIM BPS’s determining if a
building design that has been simplified to make the calculation easier, and faster, is still
detailed enough to produce useful results. The iEE results from this test, become the iEE
truth models used in the EE calibration accuracy assessment of the Revit iEE BIM LCA BPS
modelling methodology. The second test, covered in Chapter Sections 6.3 to 6.5, uses these
iEE truth model to determine if a BIM model can produce iEE results that are accurate
enough for informed decision-making. Specifically this is an assessment of the modelled
detailed required of the BIM objects, and geometry, to produce accurate material quantities.
This Chapter is followed by Chapter 7.0, which presents the conclusions to the discussions of
these thesis hypothesis testing results in the wider context of LCA research, and the building
industry.
Chapter Six: Accuracy Assessment Results And Discussion
Using BIM To Calculate Accurate Building Material Quantities For Early Design Phase LCA
Author: Brian Berg 121
6.2 Test One: Is A Sketch Design iEE BPS Assessment
Complete Enough?
6.2.1 Why Test Completeness?
This first test, assesses the completeness of an iEE LCA BPS definition. This is one part of the
solution to the thesis research problem, that; building material LCA assessments are too
complex, requiring too much time and effort to be expended for effective integration during
sketch design. Calculating building materials was identified as a primary cause of these
problems. As a solution, the iEE LCA BPS is a simplified representation of a building’s design.
It includes only the building elements that are required for an iEE assessment during sketch
design, and no more. The simplification process that defines what must be modelled, uses
the framework developed in Chapter Section 4.2. This framework is based which building
elements are being influenced, or conversely, influencing the design decisions made during
sketch design.
Despite being successful in reducing the modelling time, and effort required for a building
material LCA, the BPS must prove to be sufficiently detailed e.g. complete, to be effective as a
design tool for reducing environmental impact. This completeness assessment, determines
whether an iEE LCA BPS is sufficiently detailed for decision-making about design iterations to
lower the environmental impact of a building design.
This completeness assessment has two parts, tests 1.1, and 1.2. Test 1.1, compares truth
models 1 and 2. Truth model 1 is a full building iEE assessment constructed from an as-built
SOQ (SOQ). This is the ‘true value’ iEE figure for a full building design. Truth model 2 is an
iEE LCA BPS constructed from a SOQ of the information available at detailed design.
Comparing these two truth models, test 1.1 answers the following questions:
Research question 1.1a: How much of a building’s total iEE does an iEE LCA BPS
represent?
Research question 1.1b: Is this enough to be useful for decision-making to lower
environmental impact?
Chapter Six: Accuracy Assessment Results And Discussion
Using BIM To Calculate Accurate Building Material Quantities For Early Design Phase LCA
Author: Brian Berg 122
Test 1.2 compares truth models 2 and 3. Truth model 3 is the iEE LCA BPS constructed
from a SOQ produced from information available during sketch design only. This is the ‘true
value’ iEE figure for the building elements constituting the iEE BPS model. Comparing truth
models 2 and 3, test 1.2 answers the following question:
Research question 1.2: Is the information available at sketch design detailed enough
to produce accurate iEE results?
Prior to these tests, the iEE values for each truth model must be calculated. This is the
multiplication of EE material coefficients by each truth models respective material quantities.
To function as truth models in calibration accuracy assessment, each truth model must be
compliant with the current iEE best practice calculation methods. The subsequent Chapter
Sections, 6.2.2 and 6.2.3, discuss this process.
6.2.2 Selecting Truth Model EE Material Coefficients
Selecting an appropriate database of EE building material coefficients is a critical decision
building designers must make. Selection is based on data uncertainty and variability causes,
such as age of data, country of origin, and the scope of the calculation method. Some tools
exist to help with this selection, but they require specialist knowledge of LCA framework
beyond the capabilities of the building design team, or they are too time consuming for sketch
design. Chapter Section 2.3.2 concluded that no research currently addresses the need to
assist building designers with this decision. This informed a component of second research
objective, where as part of developing the methodology for using the BIM tool Revit to
calculate iEE, a tool must be developed to make it easier for building designers to select the
most appropriate database of EE material coefficients for their iEE assessment. Fulfilling this
objective, Chapter Section 4.3.2 details the development of the EE Data Quality Indicator
Pedigree Matrix (EE DQIPM).
This Chapter Section applies the EE DQIPM to the thesis case study building testing its
reliability compared to the produced by Weidema & Wesnæs’ (1996) original DQIPM. If the
EE DQIPM produces a mean aggregated score that results in the same decision (selection of
iEE database) as Weidema & Wesnæs’ (1996) DQIPM, it passes the reliability test.
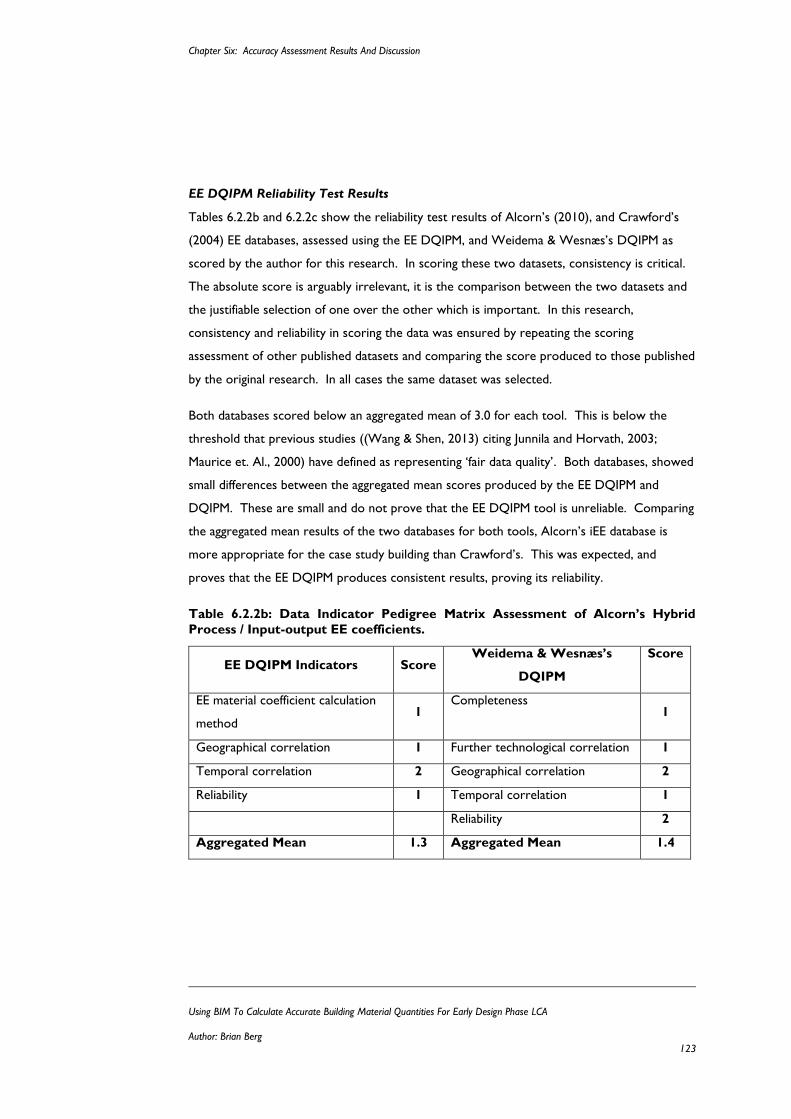
Chapter Six: Accuracy Assessment Results And Discussion
Using BIM To Calculate Accurate Building Material Quantities For Early Design Phase LCA
Author: Brian Berg 123
EE DQIPM Reliability Test Results
Tables 6.2.2b and 6.2.2c show the reliability test results of Alcorn’s (2010), and Crawford’s
(2004) EE databases, assessed using the EE DQIPM, and Weidema & Wesnæs’s DQIPM as
scored by the author for this research. In scoring these two datasets, consistency is critical.
The absolute score is arguably irrelevant, it is the comparison between the two datasets and
the justifiable selection of one over the other which is important. In this research,
consistency and reliability in scoring the data was ensured by repeating the scoring
assessment of other published datasets and comparing the score produced to those published
by the original research. In all cases the same dataset was selected.
Both databases scored below an aggregated mean of 3.0 for each tool. This is below the
threshold that previous studies ((Wang & Shen, 2013) citing Junnila and Horvath, 2003;
Maurice et. Al., 2000) have defined as representing ‘fair data quality’. Both databases, showed
small differences between the aggregated mean scores produced by the EE DQIPM and
DQIPM. These are small and do not prove that the EE DQIPM tool is unreliable. Comparing
the aggregated mean results of the two databases for both tools, Alcorn’s iEE database is
more appropriate for the case study building than Crawford’s. This was expected, and
proves that the EE DQIPM produces consistent results, proving its reliability.
Table 6.2.2b: Data Indicator Pedigree Matrix Assessment of Alcorn’s Hybrid
Process / Input-output EE coefficients.
EE DQIPM Indicators Score Weidema & Wesnæs’s
DQIPM
Score
EE material coefficient calculation
method 1
Completeness 1
Geographical correlation 1 Further technological correlation 1
Temporal correlation 2 Geographical correlation 2
Reliability 1 Temporal correlation 1
Reliability 2
Aggregated Mean 1.3 Aggregated Mean 1.4
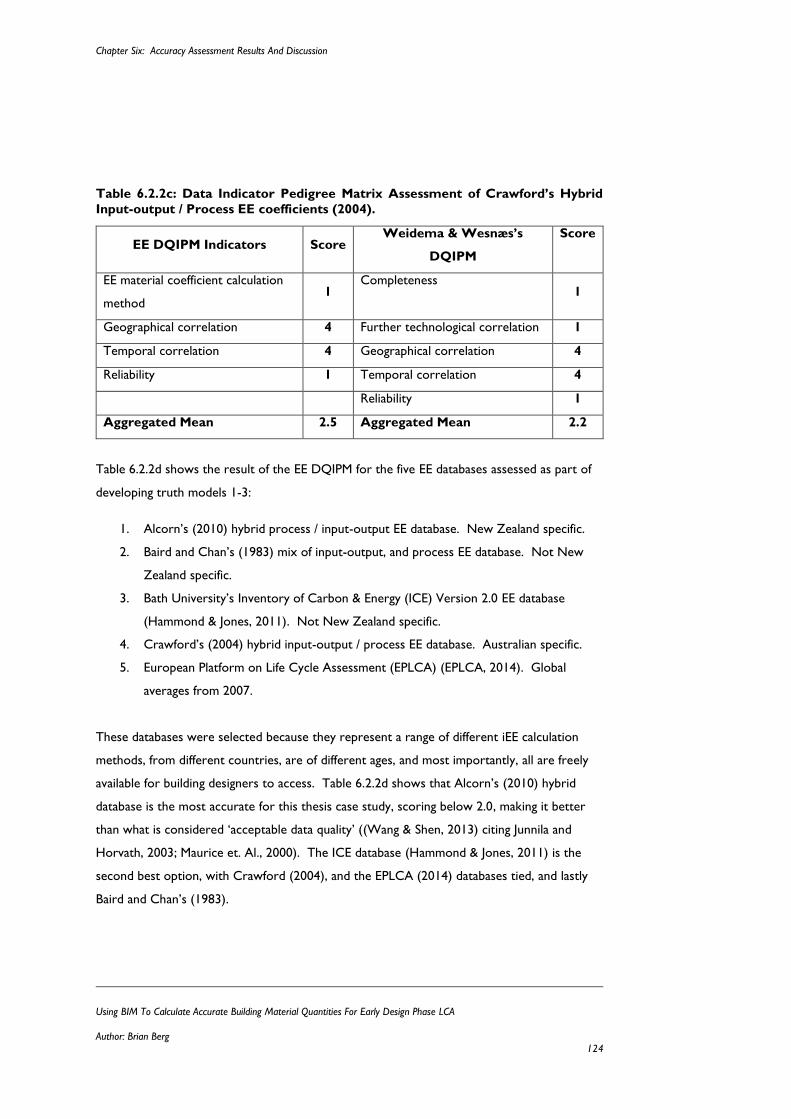
Chapter Six: Accuracy Assessment Results And Discussion
Using BIM To Calculate Accurate Building Material Quantities For Early Design Phase LCA
Author: Brian Berg 124
Table 6.2.2c: Data Indicator Pedigree Matrix Assessment of Crawford’s Hybrid
Input-output / Process EE coefficients (2004).
EE DQIPM Indicators Score Weidema & Wesnæs’s
DQIPM
Score
EE material coefficient calculation
method 1
Completeness 1
Geographical correlation 4 Further technological correlation 1
Temporal correlation 4 Geographical correlation 4
Reliability 1 Temporal correlation 4
Reliability 1
Aggregated Mean 2.5 Aggregated Mean 2.2
Table 6.2.2d shows the result of the EE DQIPM for the five EE databases assessed as part of
developing truth models 1-3:
1. Alcorn’s (2010) hybrid process / input-output EE database. New Zealand specific.
2. Baird and Chan’s (1983) mix of input-output, and process EE database. Not New
Zealand specific.
3. Bath University’s Inventory of Carbon & Energy (ICE) Version 2.0 EE database
(Hammond & Jones, 2011). Not New Zealand specific.
4. Crawford’s (2004) hybrid input-output / process EE database. Australian specific.
5. European Platform on Life Cycle Assessment (EPLCA) (EPLCA, 2014). Global
averages from 2007.
These databases were selected because they represent a range of different iEE calculation
methods, from different countries, are of different ages, and most importantly, all are freely
available for building designers to access. Table 6.2.2d shows that Alcorn’s (2010) hybrid
database is the most accurate for this thesis case study, scoring below 2.0, making it better
than what is considered ‘acceptable data quality’ ((Wang & Shen, 2013) citing Junnila and
Horvath, 2003; Maurice et. Al., 2000). The ICE database (Hammond & Jones, 2011) is the
second best option, with Crawford (2004), and the EPLCA (2014) databases tied, and lastly
Baird and Chan’s (1983).
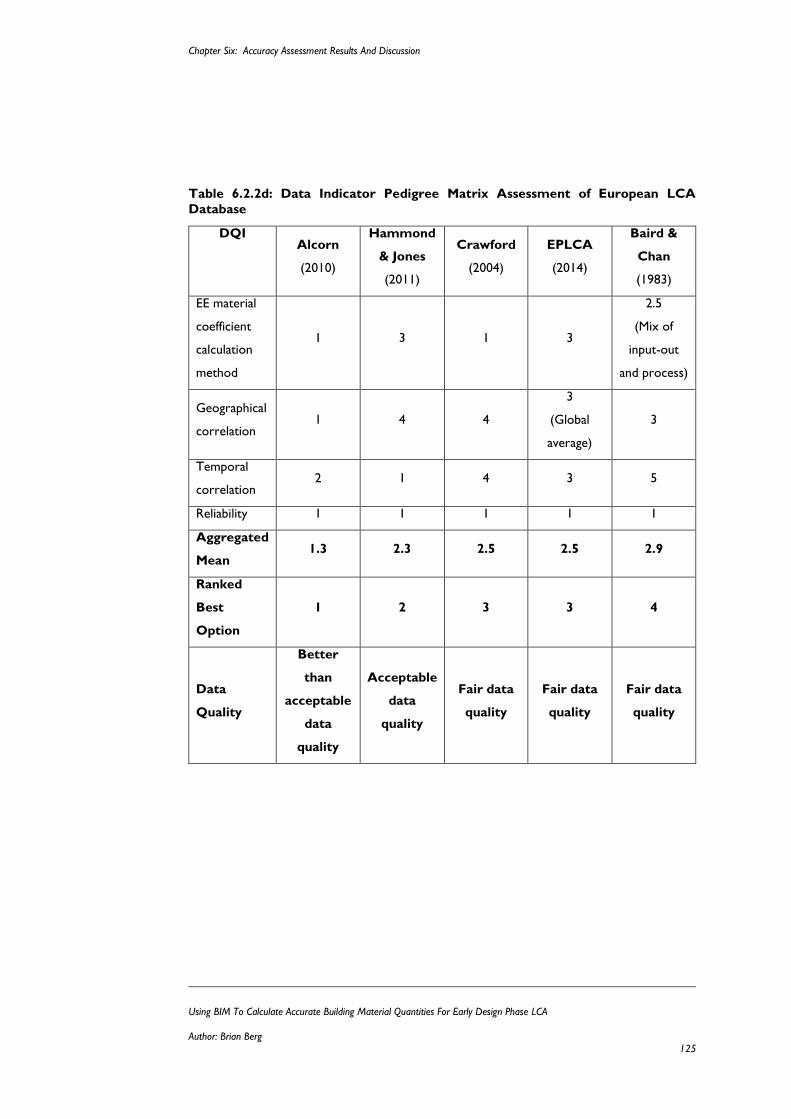
Chapter Six: Accuracy Assessment Results And Discussion
Using BIM To Calculate Accurate Building Material Quantities For Early Design Phase LCA
Author: Brian Berg 125
Table 6.2.2d: Data Indicator Pedigree Matrix Assessment of European LCA
Database
DQI Alcorn
(2010)
Hammond
& Jones
(2011)
Crawford
(2004)
EPLCA
(2014)
Baird &
Chan
(1983)
EE material
coefficient
calculation
method
1 3 1 3
2.5
(Mix of
input-out
and process)
Geographical
correlation 1 4 4
3
(Global
average)
3
Temporal
correlation 2 1 4 3 5
Reliability 1 1 1 1 1
Aggregated
Mean 1.3 2.3 2.5 2.5 2.9
Ranked
Best
Option
1 2 3 3 4
Data
Quality
Better
than
acceptable
data
quality
Acceptable
data
quality
Fair data
quality
Fair data
quality
Fair data
quality
Chapter Six: Accuracy Assessment Results And Discussion
Using BIM To Calculate Accurate Building Material Quantities For Early Design Phase LCA
Author: Brian Berg 126
Discussion Of EE DQIPM Reliability Test Results
The iEE DQI PM is a qualitative data uncertainty assessment tool. It does not calculate the
size of data uncertainties, or simulation errors. Instead, it minimises uncertainties, and their
subsequent simulation errors before they are multiplied by the material quantities and
embedded into iEE result causing an inaccuracy. Critically, it prevents inaccuracies, it does
not operationalise their impact. The scores produced are only indicative to help compare
different datasets to determine which will be the best representation of reality, and therefore
be more accurate. Consequently, the numerical description of each DQI category is not
critical, as long as the assessor considers all four DQIs, is consistent in their assessment, and
that the end result facilitates choosing the right dataset.
Comparing the EE DQIPM to Weidema & Wesnæs’s DQIPM was a quality assurance test.
Tables 6.2.2c and 6.2.2b show that the two methods conducted in the context of this thesis
context produce similar, and consistent results. This proves the EE DQIPM to be reliable.
The limitation is that this is only an indicative test. More research must be conducted in the
future development of the EE DQIPM tool. However, for this thesis, it meets the
requirements of reducing simulation uncertainties in the pre-simulation stage of iEE
calibration accuracy assessment.
Table 6.2.2d showed that Alcorn’s (2010) hybrid database is the most accurate for this thesis
case study, and Baird and Chan’s (1983) database is the least accurate. This proves it is
better for New Zealand building designers to use these international EE databases, rather
than the older, more outdated database published by Baird and Chan (1983). This was
expected. Unexpected were the results for the other four databases. The ICE database
(Hammond & Jones, 2011) is the next best choice. It is interesting that the Crawford and
EPLCA database scores are tied. Table 6.2.2e shows the EE material coefficient values
(where available) for each database, for the materials without a material coefficients in
Alcorn’s (2010) database. Comparing the only materials with values for Crawford and
EPLCA, Crawford’s Non-Recycled Steel EE coefficient is 351% higher than the value published
by the EPLCA. Selecting either of one of these two coefficients will have a large impact on a
building’s iEE results. Therefore, this material needs to be considered specifically, not just
based on the overall EE DQIPM database scores. This illustrates the limitation of the EE
DQIPM. It is only suitable as an overview for evaluating iEE databases, and indicating which is
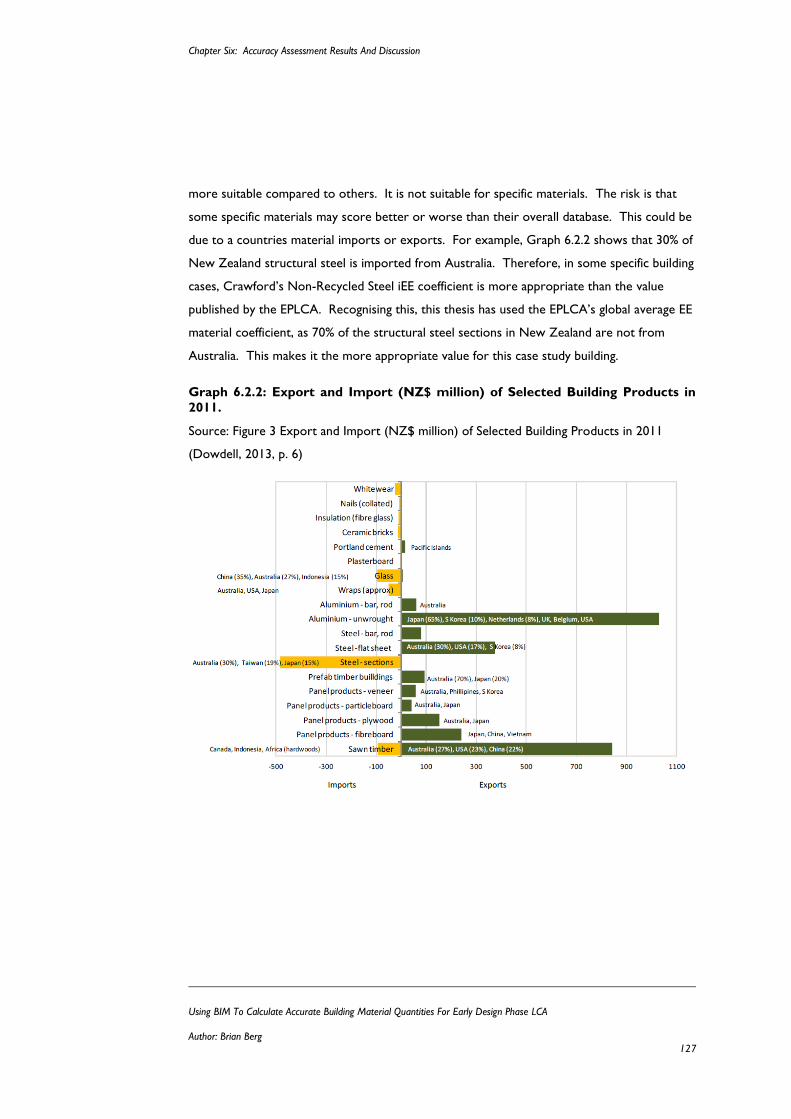
Chapter Six: Accuracy Assessment Results And Discussion
Using BIM To Calculate Accurate Building Material Quantities For Early Design Phase LCA
Author: Brian Berg 127
more suitable compared to others. It is not suitable for specific materials. The risk is that
some specific materials may score better or worse than their overall database. This could be
due to a countries material imports or exports. For example, Graph 6.2.2 shows that 30% of
New Zealand structural steel is imported from Australia. Therefore, in some specific building
cases, Crawford’s Non-Recycled Steel iEE coefficient is more appropriate than the value
published by the EPLCA. Recognising this, this thesis has used the EPLCA’s global average EE
material coefficient, as 70% of the structural steel sections in New Zealand are not from
Australia. This makes it the more appropriate value for this case study building.
Graph 6.2.2: Export and Import (NZ$ million) of Selected Building Products in
2011.
Source: Figure 3 Export and Import (NZ$ million) of Selected Building Products in 2011
(Dowdell, 2013, p. 6)
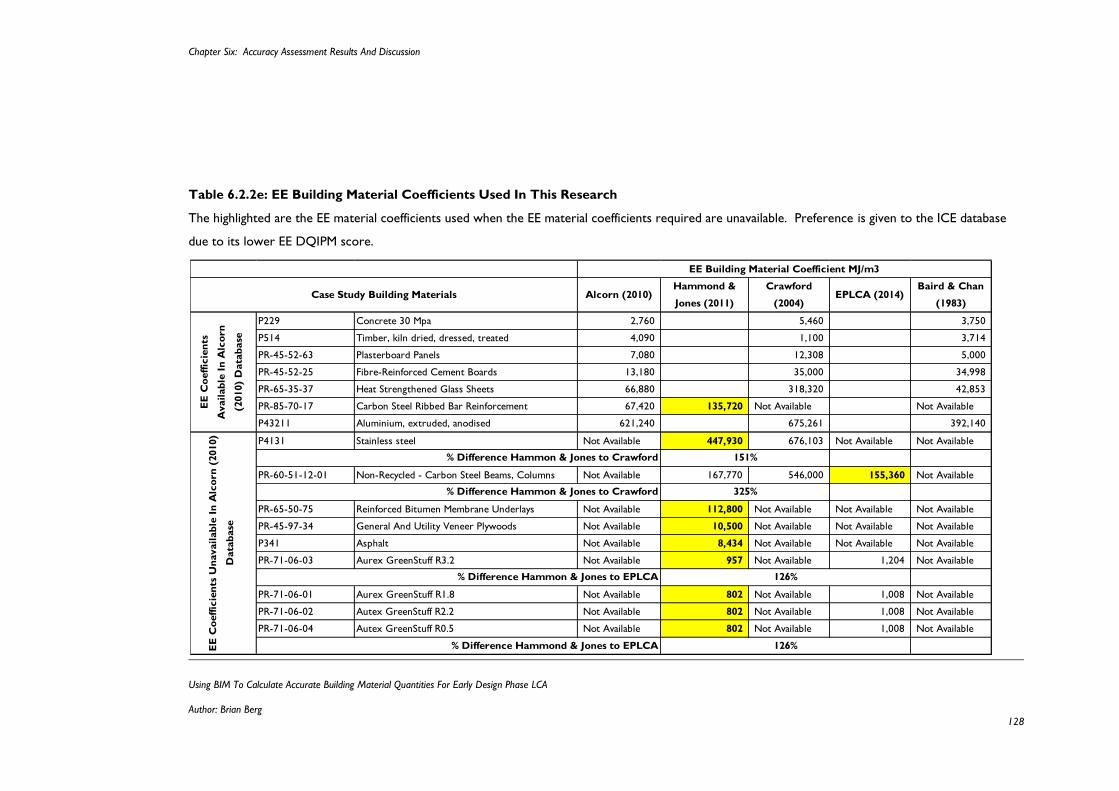
Chapter Six: Accuracy Assessment Results And Discussion
Using BIM To Calculate Accurate Building Material Quantities For Early Design Phase LCA
Author: Brian Berg 128
Table 6.2.2e: EE Building Material Coefficients Used In This Research
The highlighted are the EE material coefficients used when the EE material coefficients required are unavailable. Preference is given to the ICE database
due to its lower EE DQIPM score.
Alcorn (2010)Hammond &
Jones (2011)
Crawford
(2004)EPLCA (2014)
Baird & Chan
(1983)
P229 Concrete 30 Mpa 2,760 5,460 3,750
P514 Timber, kiln dried, dressed, treated 4,090 1,100 3,714
PR-45-52-63 Plasterboard Panels 7,080 12,308 5,000
PR-45-52-25 Fibre-Reinforced Cement Boards 13,180 35,000 34,998
PR-65-35-37 Heat Strengthened Glass Sheets 66,880 318,320 42,853
PR-85-70-17 Carbon Steel Ribbed Bar Reinforcement 67,420 135,720 Not Available Not Available
P43211 Aluminium, extruded, anodised 621,240 675,261 392,140
P4131 Stainless steel Not Available 447,930 676,103 Not Available Not Available
PR-60-51-12-01 Non-Recycled - Carbon Steel Beams, Columns Not Available 167,770 546,000 155,360 Not Available
PR-65-50-75 Reinforced Bitumen Membrane Underlays Not Available 112,800 Not Available Not Available Not Available
PR-45-97-34 General And Utility Veneer Plywoods Not Available 10,500 Not Available Not Available Not Available
P341 Asphalt Not Available 8,434 Not Available Not Available Not Available
PR-71-06-03 Aurex GreenStuff R3.2 Not Available 957 Not Available 1,204 Not Available
PR-71-06-01 Aurex GreenStuff R1.8 Not Available 802 Not Available 1,008 Not Available
PR-71-06-02 Autex GreenStuff R2.2 Not Available 802 Not Available 1,008 Not Available
PR-71-06-04 Autex GreenStuff R0.5 Not Available 802 Not Available 1,008 Not Available
126%% Difference Hammond & Jones to EPLCA
EE Building Material Coefficient MJ/m3
151%% Difference Hammon & Jones to Crawford
% Difference Hammon & Jones to Crawford 325%
Case Study Building Materials
EE
Co
eff
icie
nts
Avail
ab
le I
n A
lco
rn
(2010)
Data
base
EE
Co
eff
icie
nts
Un
avail
ab
le I
n A
lco
rn
(2010)
Data
base
% Difference Hammon & Jones to EPLCA 126%
Chapter Six: Accuracy Assessment Results And Discussion
Using BIM To Calculate Accurate Building Material Quantities For Early Design Phase LCA
Author: Brian Berg 129
The Application To Testing The Thesis Hypothesis
The iEE building material coefficients are defined as a control variable in this thesis’ research
design for testing the hypothesis. This makes them a critical data input in the truth models,
and calibration accuracy assessment. The control variable is managed by the use of the EE
DQIPM tool to ensure the most accurate material coefficients are selected. The limitation is
that these are only as accurate as the current best practice methods of measuring iEE can
allow. It is inevitable that differences between the truth model EE material coefficients, and
their value in reality will exist. For a building designer, aiming to lower environmental impact
this is important. However, this impact on testing the thesis hypothesis is limited. As long as
the same EE material coefficients are used consistently between the truth models, and Revit
models, these inaccuracies are equal, and cancel out. Therefore, any difference between the
results is caused by differences in the building material quantities.
6.2.3 Calculating Truth Model Building Material Quantities
The data of material quantities for the each truth model was not calculated as part of this
thesis. It was independently calculated by the case study building design team as part of the
design process. The detail and completeness of each truth model’s material quantities is
different:
Truth model 1 is a full building iEE assessment constructed from an as-built SOQ
(SOQ).
Truth model 2 is the iEE BPS model constructed from a SOQ produced from the
information available at detailed design.
Truth model 3 is the iEE BPS model constructed from a SOQ produced from the
information available at sketch design only.
Truth models 2 and 3 have had the iEE LCA BPS simplification framework (developed in
Chapter Section 4.2) applied, defining what which building elements must be assessed for a
sketch design phase iEE LCA assessment. Table 6.2.3a lists the building materials assessed in
each of the three truth models. Table 6.2.3b lists the building elements these materials are
part of for truth models 2 and 3.
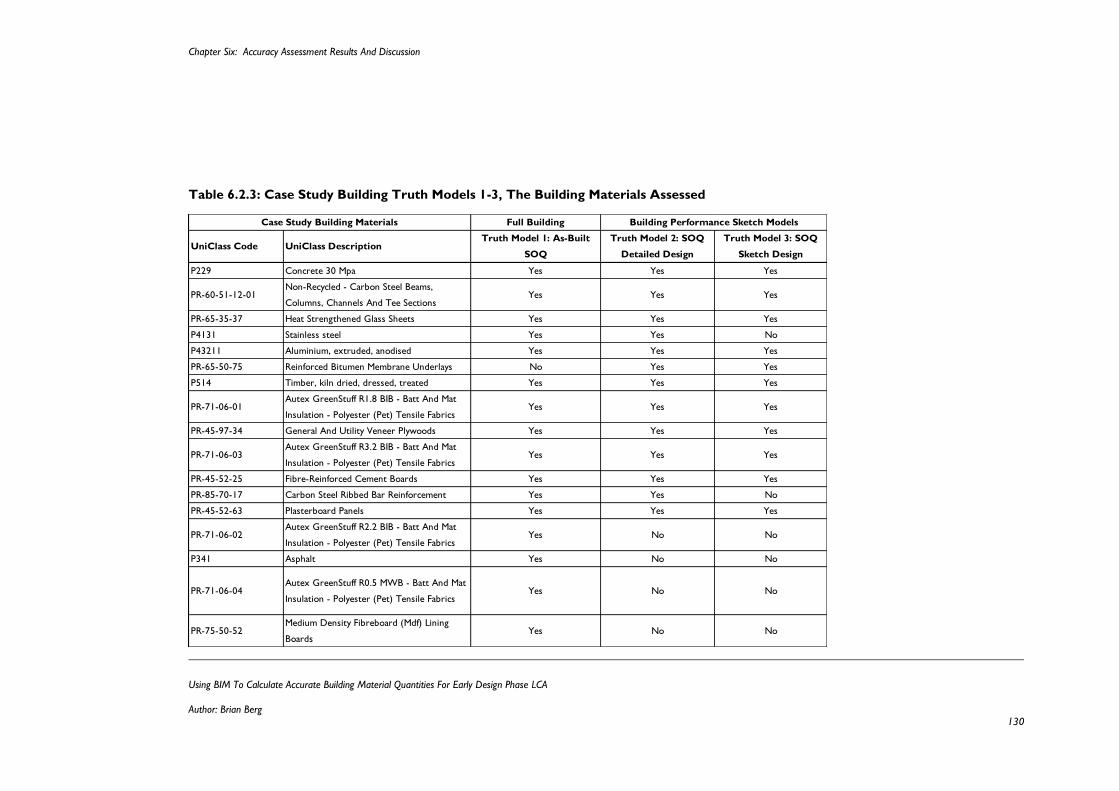
Chapter Six: Accuracy Assessment Results And Discussion
Using BIM To Calculate Accurate Building Material Quantities For Early Design Phase LCA
Author: Brian Berg 130
Table 6.2.3: Case Study Building Truth Models 1-3, The Building Materials Assessed
Full Building
UniClass Code UniClass DescriptionTruth Model 1: As-Built
SOQ
Truth Model 2: SOQ
Detailed Design
Truth Model 3: SOQ
Sketch Design
P229 Concrete 30 Mpa Yes Yes Yes
PR-60-51-12-01Non-Recycled - Carbon Steel Beams,
Columns, Channels And Tee SectionsYes Yes Yes
PR-65-35-37 Heat Strengthened Glass Sheets Yes Yes Yes
P4131 Stainless steel Yes Yes No
P43211 Aluminium, extruded, anodised Yes Yes Yes
PR-65-50-75 Reinforced Bitumen Membrane Underlays No Yes Yes
P514 Timber, kiln dried, dressed, treated Yes Yes Yes
PR-71-06-01Autex GreenStuff R1.8 BIB - Batt And Mat
Insulation - Polyester (Pet) Tensile FabricsYes Yes Yes
PR-45-97-34 General And Utility Veneer Plywoods Yes Yes Yes
PR-71-06-03Autex GreenStuff R3.2 BIB - Batt And Mat
Insulation - Polyester (Pet) Tensile FabricsYes Yes Yes
PR-45-52-25 Fibre-Reinforced Cement Boards Yes Yes Yes
PR-85-70-17 Carbon Steel Ribbed Bar Reinforcement Yes Yes No
PR-45-52-63 Plasterboard Panels Yes Yes Yes
PR-71-06-02Autex GreenStuff R2.2 BIB - Batt And Mat
Insulation - Polyester (Pet) Tensile FabricsYes No No
P341 Asphalt Yes No No
PR-71-06-04Autex GreenStuff R0.5 MWB - Batt And Mat
Insulation - Polyester (Pet) Tensile FabricsYes No No
PR-75-50-52Medium Density Fibreboard (Mdf) Lining
BoardsYes No No
Case Study Building Materials Building Performance Sketch Models
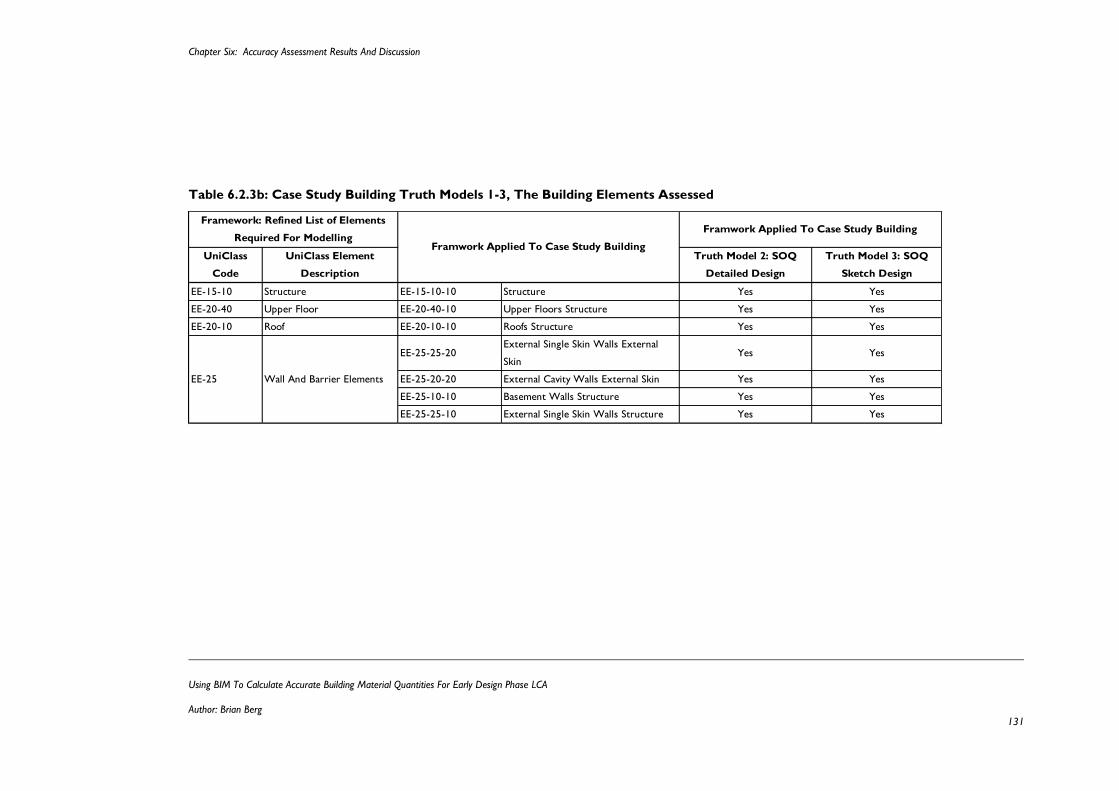
Chapter Six: Accuracy Assessment Results And Discussion
Using BIM To Calculate Accurate Building Material Quantities For Early Design Phase LCA
Author: Brian Berg 131
Table 6.2.3b: Case Study Building Truth Models 1-3, The Building Elements Assessed
UniClass
Code
UniClass Element
Description
Truth Model 2: SOQ
Detailed Design
Truth Model 3: SOQ
Sketch Design
EE-15-10 Structure EE-15-10-10 Structure Yes Yes
EE-20-40 Upper Floor EE-20-40-10 Upper Floors Structure Yes Yes
EE-20-10 Roof EE-20-10-10 Roofs Structure Yes Yes
EE-25-25-20External Single Skin Walls External
SkinYes Yes
EE-25-20-20 External Cavity Walls External Skin Yes Yes
EE-25-10-10 Basement Walls Structure Yes Yes
EE-25-25-10 External Single Skin Walls Structure Yes Yes
EE-25 Wall And Barrier Elements
Framework: Refined List of Elements
Required For ModellingFramwork Applied To Case Study Building
Framwork Applied To Case Study Building
Chapter Six: Accuracy Assessment Results And Discussion
Using BIM To Calculate Accurate Building Material Quantities For Early Design Phase LCA
Author: Brian Berg 132
Discussion:
The truth model building material quantities are the defining information that formulate truth
models 1-3. This makes them a critical data input in the truth models, and calibration
accuracy assessment. The detail of the material quantities in each truth model defines how
detailed the BIM model representation must be. Therefore, the reliability, and the
trustworthiness of this data is critical to testing the thesis hypothesis. These material
quantities were not calculated as part of this thesis. They were developed as part of the case
study building’s project documentation. Consequently, they were subject to the quality
assurance processes used by the building design team. This means they are considered
reliable, complete, and therefore accurate enough to test this thesis’ hypothesis.
Their reliability was ensured through the quality assurance systems of the firm and project
team. Reliability assessment as part of this research compared the final contract sum to the
detailed design estimate (detailed design cost figures include the material quantities from data
source 2). The minus 9.6% difference is less than the ±15% acceptable margin of error
(Bownass, 2001, p. 25) for the developed design (scheme design) phase of the design process.
The margin of error drops further to -2.8% if the developed design contingency percentage
sum is added to the final contract cost. This means the detailed design estimate is within
established and recognised industry practices ensures reliability of the data.
While accurate enough to test this thesis’ hypothesis, there are limitations with this data
beyond this thesis research. These limitations are centred on the reliability, and
completeness of the data quantities. Their reliability, and completeness is defined by building
cost planning best practices for measuring building material quantities, not building material
LCA-based indicators such as iEE. This means these databases were developed to be
accurate enough for cost planning, not LCA. This produces the risk that there is an unknown
amount of environmental impact not being assessed in a LCA using this data. For example,
does a SOQ for LCA need to itemise material quantities to a level of detail accounting for
fixings, such as, nuts, bolts, and washers? This is significantly more detailed than best practice
cost planning. This highlights the need for future research to define which building materials
should be modelled based on iEE and LCA accuracy, not cost planning.
Chapter Six: Accuracy Assessment Results And Discussion
Using BIM To Calculate Accurate Building Material Quantities For Early Design Phase LCA
Author: Brian Berg 133
In this thesis research, this limitation is minimised by the thesis’ research scope, where the
aim is to make the calculation building materials easier, to a level of detail and accuracy
equivalent to current best practice standards e.g. cost planning SOQ. In this case, the
material quantities for truth models 1 and 2 are suitable.
6.2.4 Calculating EE Truth Models
The purpose of this Chapter Section is to present the truth model results required to assess
the calibration accuracy of the BIM models, and answering the research questions:
Research question 1.1a: How much of a building’s total iEE does an iEE LCA BPS
represent?
Research question 1.1b: Is this enough to be useful for decision-making to lower
environmental impact?
Research question 1.2: Is the information available at sketch design detailed enough
to produce accurate iEE results?
EE Truth Model Results:
The iEE truth models results are the end result of the multiplication of EE material
coefficients selected in Chapter Section 6.2.2, by building material quantities accessed in
Chapter Section 6.2.3. Table 6.2.4a shows the results for each of the three truth models
using Alcorn’s hybrid iEE database, supplemented where required by the ICE (Hammond &
Jones, 2011), and EPLCA iEE databases (EPLCA, 2014).
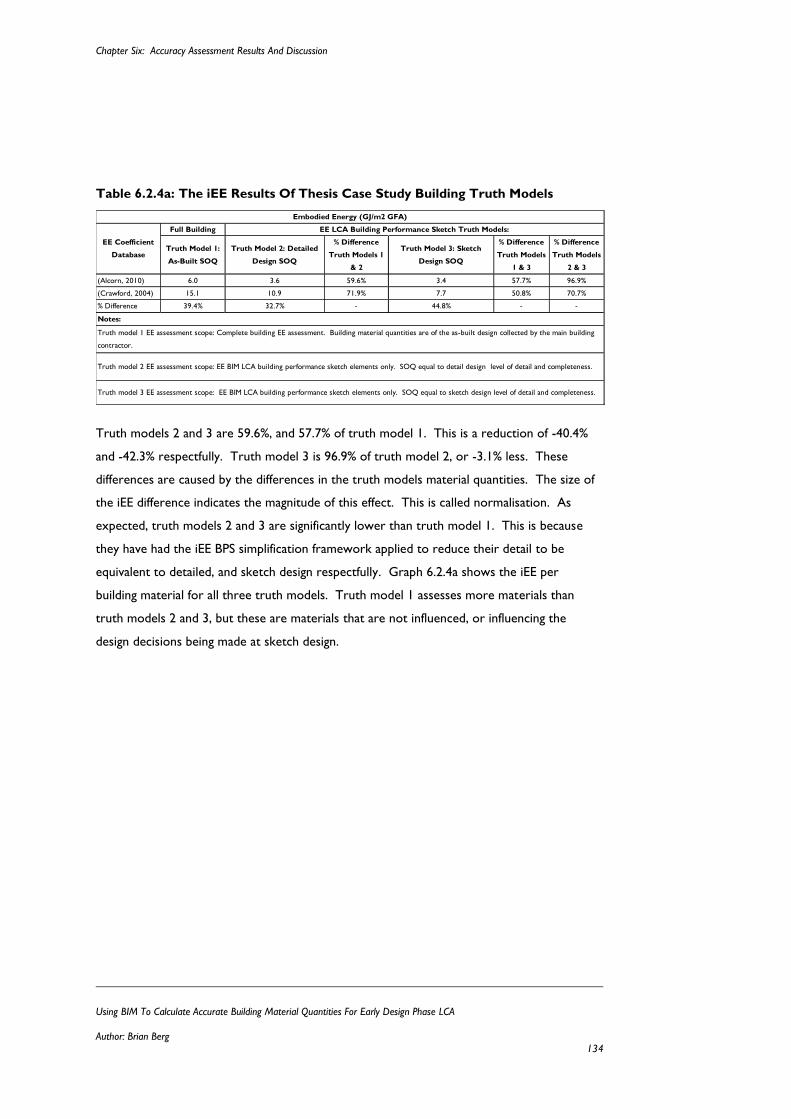
Chapter Six: Accuracy Assessment Results And Discussion
Using BIM To Calculate Accurate Building Material Quantities For Early Design Phase LCA
Author: Brian Berg 134
Table 6.2.4a: The iEE Results Of Thesis Case Study Building Truth Models
Truth models 2 and 3 are 59.6%, and 57.7% of truth model 1. This is a reduction of -40.4%
and -42.3% respectfully. Truth model 3 is 96.9% of truth model 2, or -3.1% less. These
differences are caused by the differences in the truth models material quantities. The size of
the iEE difference indicates the magnitude of this effect. This is called normalisation. As
expected, truth models 2 and 3 are significantly lower than truth model 1. This is because
they have had the iEE BPS simplification framework applied to reduce their detail to be
equivalent to detailed, and sketch design respectfully. Graph 6.2.4a shows the iEE per
building material for all three truth models. Truth model 1 assesses more materials than
truth models 2 and 3, but these are materials that are not influenced, or influencing the
design decisions being made at sketch design.
Full Building
Truth Model 1:
As-Built SOQ
Truth Model 2: Detailed
Design SOQ
% Difference
Truth Models 1
& 2
Truth Model 3: Sketch
Design SOQ
% Difference
Truth Models
1 & 3
% Difference
Truth Models
2 & 3
(Alcorn, 2010) 6.0 3.6 59.6% 3.4 57.7% 96.9%
(Crawford, 2004) 15.1 10.9 71.9% 7.7 50.8% 70.7%
% Difference 39.4% 32.7% - 44.8% - -
EE Coefficient
Database
Truth model 3 EE assessment scope: EE BIM LCA building performance sketch elements only. SOQ equal to sketch design level of detail and completeness.
Embodied Energy (GJ/m2 GFA)
EE LCA Building Performance Sketch Truth Models:
Notes:
Truth model 1 EE assessment scope: Complete building EE assessment. Building material quantities are of the as-built design collected by the main building
contractor.
Truth model 2 EE assessment scope: EE BIM LCA building performance sketch elements only. SOQ equal to detail design level of detail and completeness.
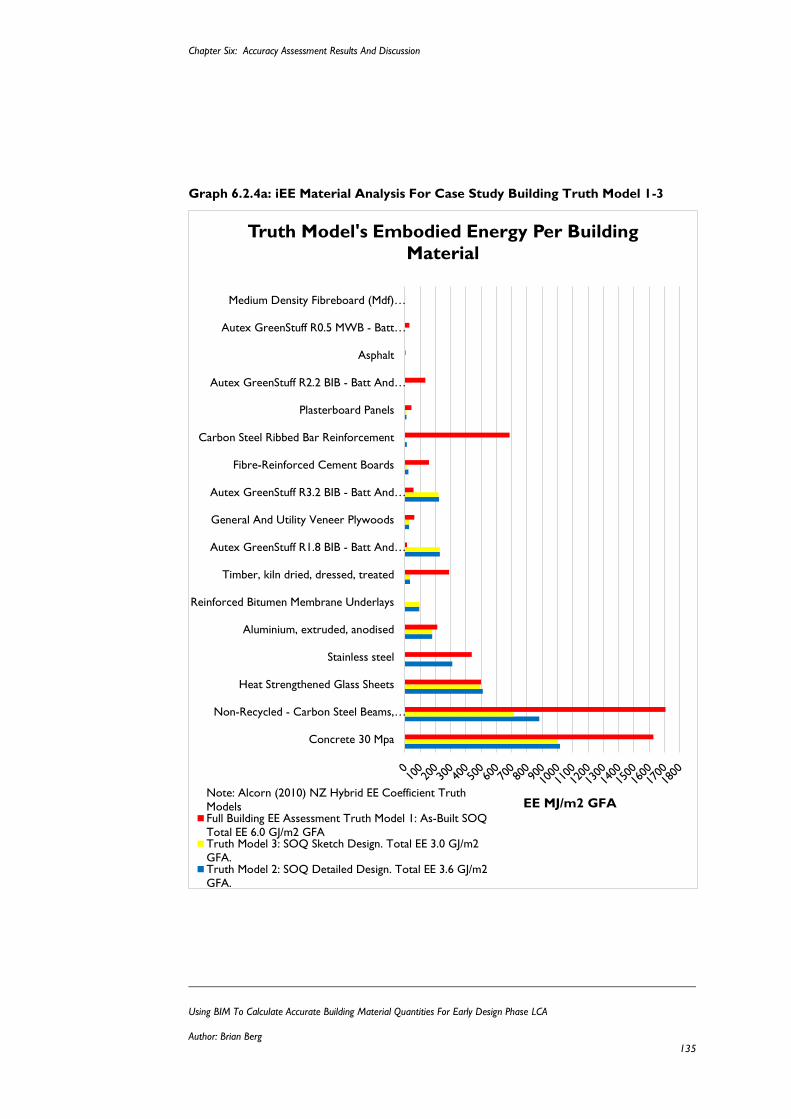
Chapter Six: Accuracy Assessment Results And Discussion
Using BIM To Calculate Accurate Building Material Quantities For Early Design Phase LCA
Author: Brian Berg 135
Graph 6.2.4a: iEE Material Analysis For Case Study Building Truth Model 1-3
Concrete 30 Mpa
Non-Recycled - Carbon Steel Beams,…
Heat Strengthened Glass Sheets
Stainless steel
Aluminium, extruded, anodised
Reinforced Bitumen Membrane Underlays
Timber, kiln dried, dressed, treated
Autex GreenStuff R1.8 BIB - Batt And…
General And Utility Veneer Plywoods
Autex GreenStuff R3.2 BIB - Batt And…
Fibre-Reinforced Cement Boards
Carbon Steel Ribbed Bar Reinforcement
Plasterboard Panels
Autex GreenStuff R2.2 BIB - Batt And…
Asphalt
Autex GreenStuff R0.5 MWB - Batt…
Medium Density Fibreboard (Mdf)…
EE MJ/m2 GFA
Truth Model's Embodied Energy Per Building
Material
Note: Alcorn (2010) NZ Hybrid EE Coefficient Truth
ModelsFull Building EE Assessment Truth Model 1: As-Built SOQ
Total EE 6.0 GJ/m2 GFATruth Model 3: SOQ Sketch Design. Total EE 3.0 GJ/m2
GFA.Truth Model 2: SOQ Detailed Design. Total EE 3.6 GJ/m2
GFA.
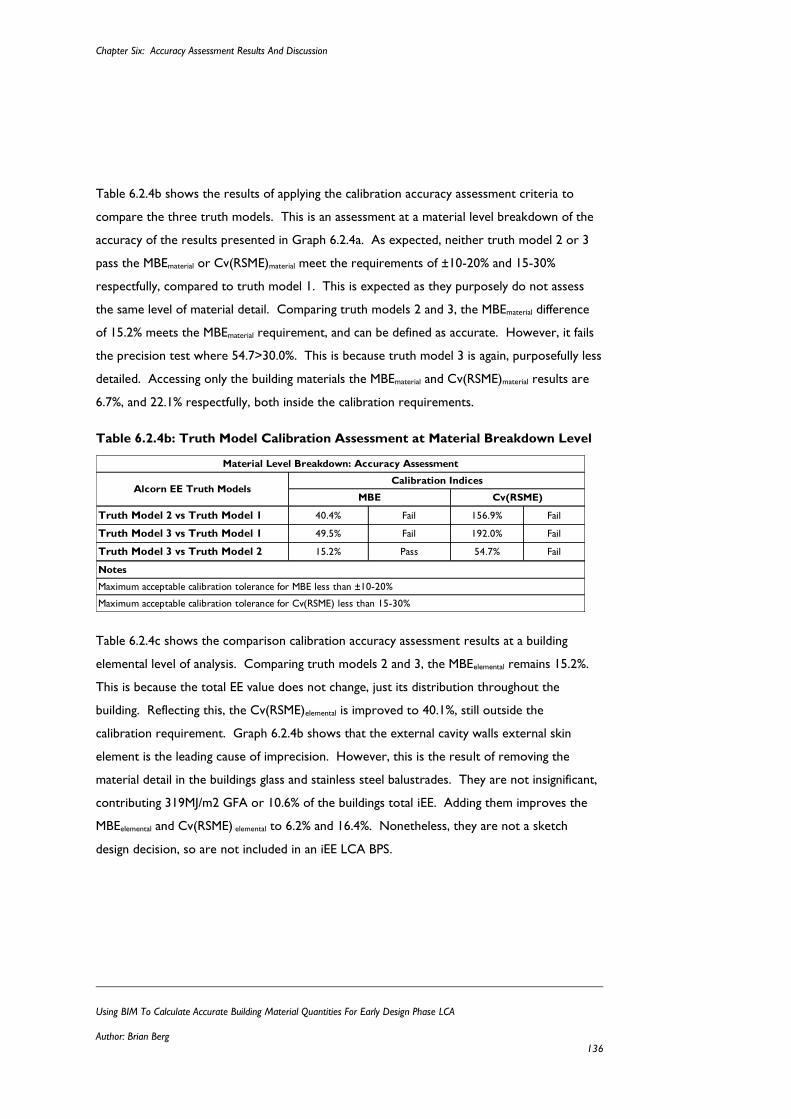
Chapter Six: Accuracy Assessment Results And Discussion
Using BIM To Calculate Accurate Building Material Quantities For Early Design Phase LCA
Author: Brian Berg 136
Table 6.2.4b shows the results of applying the calibration accuracy assessment criteria to
compare the three truth models. This is an assessment at a material level breakdown of the
accuracy of the results presented in Graph 6.2.4a. As expected, neither truth model 2 or 3
pass the MBEmaterial or Cv(RSME)material meet the requirements of ±10-20% and 15-30%
respectfully, compared to truth model 1. This is expected as they purposely do not assess
the same level of material detail. Comparing truth models 2 and 3, the MBEmaterial difference
of 15.2% meets the MBEmaterial requirement, and can be defined as accurate. However, it fails
the precision test where 54.7>30.0%. This is because truth model 3 is again, purposefully less
detailed. Accessing only the building materials the MBEmaterial and Cv(RSME)material results are
6.7%, and 22.1% respectfully, both inside the calibration requirements.
Table 6.2.4b: Truth Model Calibration Assessment at Material Breakdown Level
Table 6.2.4c shows the comparison calibration accuracy assessment results at a building
elemental level of analysis. Comparing truth models 2 and 3, the MBEelemental remains 15.2%.
This is because the total EE value does not change, just its distribution throughout the
building. Reflecting this, the Cv(RSME)elemental is improved to 40.1%, still outside the
calibration requirement. Graph 6.2.4b shows that the external cavity walls external skin
element is the leading cause of imprecision. However, this is the result of removing the
material detail in the buildings glass and stainless steel balustrades. They are not insignificant,
contributing 319MJ/m2 GFA or 10.6% of the buildings total iEE. Adding them improves the
MBEelemental and Cv(RSME) elemental to 6.2% and 16.4%. Nonetheless, they are not a sketch
design decision, so are not included in an iEE LCA BPS.
Truth Model 2 vs Truth Model 1 40.4% Fail 156.9% Fail
Truth Model 3 vs Truth Model 1 49.5% Fail 192.0% Fail
Truth Model 3 vs Truth Model 2 15.2% Pass 54.7% Fail
Maximum acceptable calibration tolerance for MBE less than ±10-20%
Maximum acceptable calibration tolerance for Cv(RSME) less than 15-30%
Material Level Breakdown: Accuracy Assessment
Alcorn EE Truth ModelsMBE Cv(RSME)
Calibration Indices
Notes
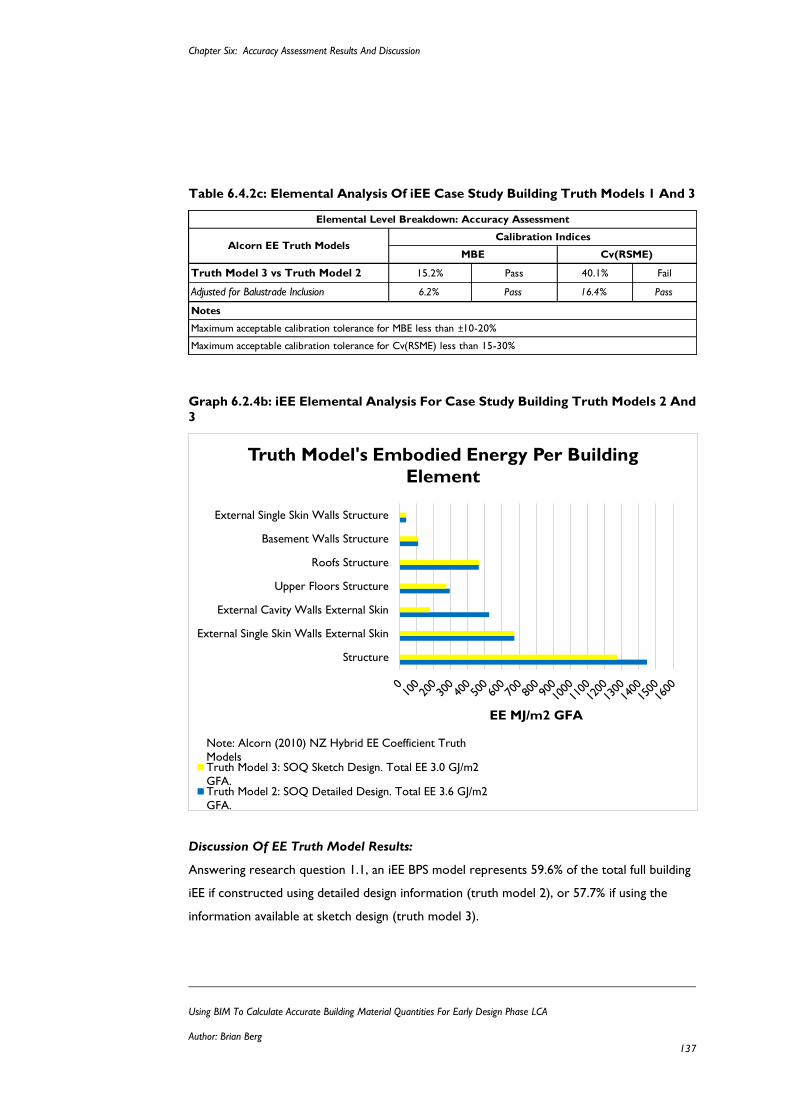
Chapter Six: Accuracy Assessment Results And Discussion
Using BIM To Calculate Accurate Building Material Quantities For Early Design Phase LCA
Author: Brian Berg 137
Table 6.4.2c: Elemental Analysis Of iEE Case Study Building Truth Models 1 And 3
Graph 6.2.4b: iEE Elemental Analysis For Case Study Building Truth Models 2 And
3
Discussion Of EE Truth Model Results:
Answering research question 1.1, an iEE BPS model represents 59.6% of the total full building
iEE if constructed using detailed design information (truth model 2), or 57.7% if using the
information available at sketch design (truth model 3).
Truth Model 3 vs Truth Model 2 15.2% Pass 40.1% Fail
Adjusted for Balustrade Inclusion 6.2% Pass 16.4% Pass
Notes
Maximum acceptable calibration tolerance for MBE less than ±10-20%
Maximum acceptable calibration tolerance for Cv(RSME) less than 15-30%
Elemental Level Breakdown: Accuracy Assessment
Alcorn EE Truth ModelsCalibration Indices
MBE Cv(RSME)
Structure
External Single Skin Walls External Skin
External Cavity Walls External Skin
Upper Floors Structure
Roofs Structure
Basement Walls Structure
External Single Skin Walls Structure
EE MJ/m2 GFA
Truth Model's Embodied Energy Per Building
Element
Note: Alcorn (2010) NZ Hybrid EE Coefficient Truth
ModelsTruth Model 3: SOQ Sketch Design. Total EE 3.0 GJ/m2
GFA.Truth Model 2: SOQ Detailed Design. Total EE 3.6 GJ/m2
GFA.
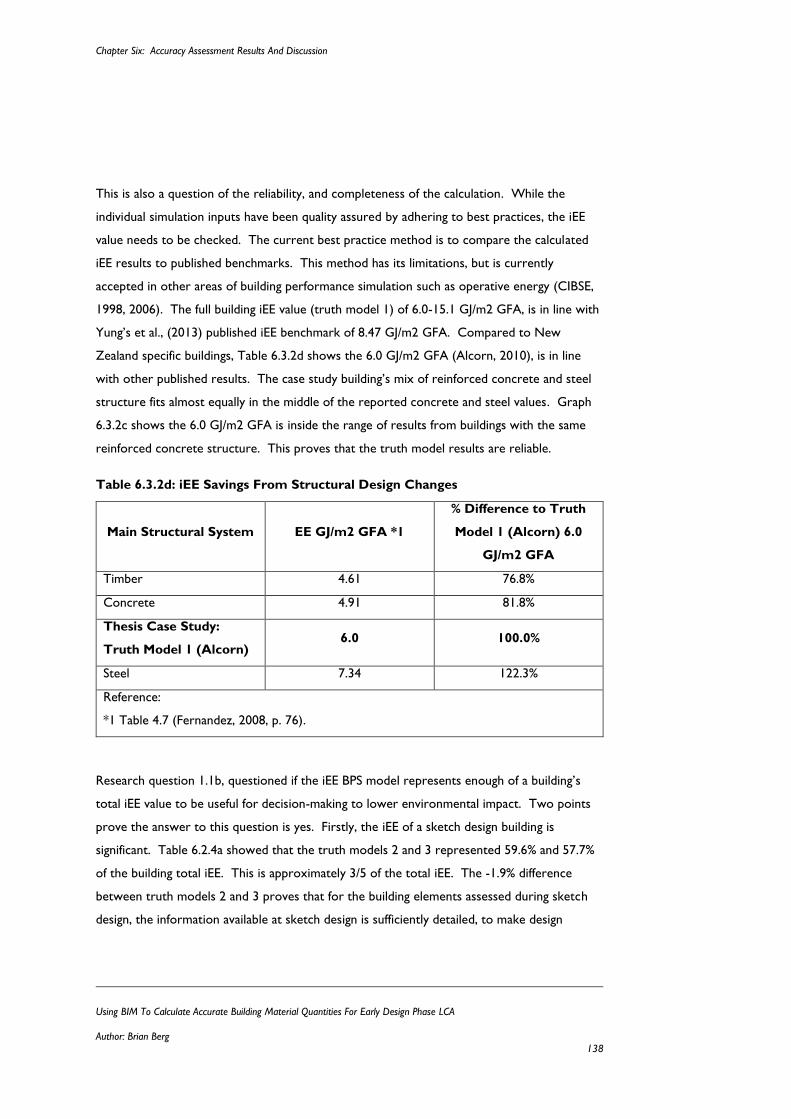
Chapter Six: Accuracy Assessment Results And Discussion
Using BIM To Calculate Accurate Building Material Quantities For Early Design Phase LCA
Author: Brian Berg 138
This is also a question of the reliability, and completeness of the calculation. While the
individual simulation inputs have been quality assured by adhering to best practices, the iEE
value needs to be checked. The current best practice method is to compare the calculated
iEE results to published benchmarks. This method has its limitations, but is currently
accepted in other areas of building performance simulation such as operative energy (CIBSE,
1998, 2006). The full building iEE value (truth model 1) of 6.0-15.1 GJ/m2 GFA, is in line with
Yung’s et al., (2013) published iEE benchmark of 8.47 GJ/m2 GFA. Compared to New
Zealand specific buildings, Table 6.3.2d shows the 6.0 GJ/m2 GFA (Alcorn, 2010), is in line
with other published results. The case study building’s mix of reinforced concrete and steel
structure fits almost equally in the middle of the reported concrete and steel values. Graph
6.3.2c shows the 6.0 GJ/m2 GFA is inside the range of results from buildings with the same
reinforced concrete structure. This proves that the truth model results are reliable.
Table 6.3.2d: iEE Savings From Structural Design Changes
Main Structural System EE GJ/m2 GFA *1
% Difference to Truth
Model 1 (Alcorn) 6.0
GJ/m2 GFA
Timber 4.61 76.8%
Concrete 4.91 81.8%
Thesis Case Study:
Truth Model 1 (Alcorn) 6.0 100.0%
Steel 7.34 122.3%
Reference:
*1 Table 4.7 (Fernandez, 2008, p. 76).
Research question 1.1b, questioned if the iEE BPS model represents enough of a building’s
total iEE value to be useful for decision-making to lower environmental impact. Two points
prove the answer to this question is yes. Firstly, the iEE of a sketch design building is
significant. Table 6.2.4a showed that the truth models 2 and 3 represented 59.6% and 57.7%
of the building total iEE. This is approximately 3/5 of the total iEE. The -1.9% difference
between truth models 2 and 3 proves that for the building elements assessed during sketch
design, the information available at sketch design is sufficiently detailed, to make design
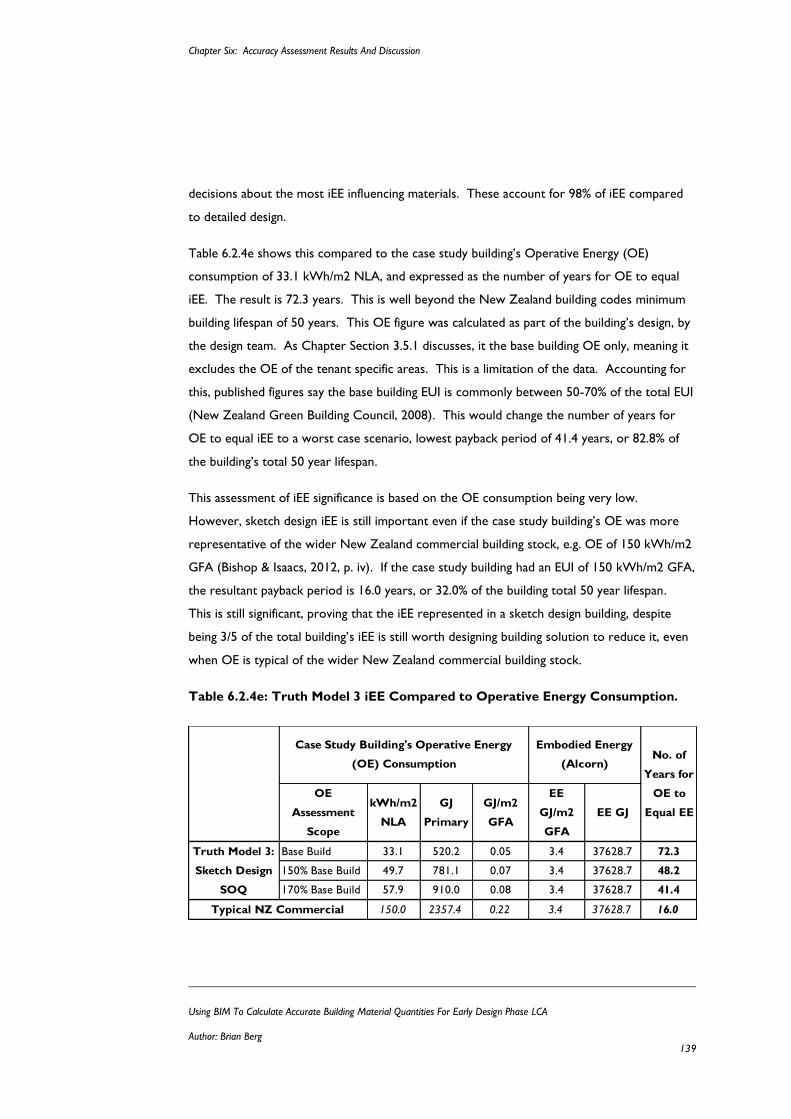
Chapter Six: Accuracy Assessment Results And Discussion
Using BIM To Calculate Accurate Building Material Quantities For Early Design Phase LCA
Author: Brian Berg 139
decisions about the most iEE influencing materials. These account for 98% of iEE compared
to detailed design.
Table 6.2.4e shows this compared to the case study building’s Operative Energy (OE)
consumption of 33.1 kWh/m2 NLA, and expressed as the number of years for OE to equal
iEE. The result is 72.3 years. This is well beyond the New Zealand building codes minimum
building lifespan of 50 years. This OE figure was calculated as part of the building’s design, by
the design team. As Chapter Section 3.5.1 discusses, it the base building OE only, meaning it
excludes the OE of the tenant specific areas. This is a limitation of the data. Accounting for
this, published figures say the base building EUI is commonly between 50-70% of the total EUI
(New Zealand Green Building Council, 2008). This would change the number of years for
OE to equal iEE to a worst case scenario, lowest payback period of 41.4 years, or 82.8% of
the building’s total 50 year lifespan.
This assessment of iEE significance is based on the OE consumption being very low.
However, sketch design iEE is still important even if the case study building’s OE was more
representative of the wider New Zealand commercial building stock, e.g. OE of 150 kWh/m2
GFA (Bishop & Isaacs, 2012, p. iv). If the case study building had an EUI of 150 kWh/m2 GFA,
the resultant payback period is 16.0 years, or 32.0% of the building total 50 year lifespan.
This is still significant, proving that the iEE represented in a sketch design building, despite
being 3/5 of the total building’s iEE is still worth designing building solution to reduce it, even
when OE is typical of the wider New Zealand commercial building stock.
Table 6.2.4e: Truth Model 3 iEE Compared to Operative Energy Consumption.
Base Build 33.1 520.2 0.05 3.4 37628.7 72.3
150% Base Build 49.7 781.1 0.07 3.4 37628.7 48.2
170% Base Build 57.9 910.0 0.08 3.4 37628.7 41.4
150.0 2357.4 0.22 3.4 37628.7 16.0
Truth Model 3:
Sketch Design
SOQ
Typical NZ Commercial
GJ/m2
GFA
No. of
Years for
OE to
Equal EE
OE
Assessment
Scope
Embodied Energy
(Alcorn)
Case Study Building's Operative Energy
(OE) Consumption
EE
GJ/m2
GFA
EE GJkWh/m2
NLA
GJ
Primary
Chapter Six: Accuracy Assessment Results And Discussion
Using BIM To Calculate Accurate Building Material Quantities For Early Design Phase LCA
Author: Brian Berg 140
The second point answering research question 1.1b, is proving that sketch design decisions
made to lower iEE are significant enough to be useful. This is a comparison of the energy
savings that can be achieved by iEE reductions compared to OE reductions. For example,
Cole and Kernan (1996, p. 310) proved that changing a building’s man structural system from
steel and concrete to timber, can reduce iEE by 5% and 13% respectfully. Table 6.2.4f shows
the results of using these savings applied to the case study building. These 5% and 13% iEE
savings expressed as the number of OE (33.1 kWh/m2 GFA base build EUI) years of 3.6 and
9.4 respectfully. For a worst case scenario where the EUI is 170% of the base build, these
saving are 2.1 and 5.4 years. This is still a significant saving. This is further emphasised
compared to OE savings. Kim (2010, p. 72) investigating the cost effectiveness of building
envelope design changes to lower OE, reported a single largest OE reduction of 8.0% when
decreasing the U-value of the windows by 60%. Using this saving reduction, Table 6.2.4f
shows the results applied to the case study building. An 8% OE (base build EUI) saving takes
45.2 years to equal the saving achieved by changing the building structure from concrete to
timber, and 117.5 years from steel to timber. For a worst case scenario OE (170% base
build) the payback periods are 25.8 and 67.2 year. Still a significant part of a 50 building
design life.
This is only an example for a single design change. The cumulative effect of OE directed
energy conversation design changes has a significantly higher scope to lower a building’s total
energy consumption. Indeed, in Net Zero Energy Building’s (NZEB) EUI’s are been reported
around 47.2 kWh/m2 GFA (Kurnitski et al., 2011, pp. 11–12). Compared to the typical New
Zealand commercial building EUI (assumed 150kWh/m2 (Bishop & Isaacs, 2012, p. iv)), this is
a 68.5% reduction. iEE will never be zero, as it always takes energy to build. However, this
analysis proves that the design decisions made during sketch design are significant enough to
matter.
Answering research question 1.2, the information available at sketch design is detailed enough
to produce accurate iEE results. This is proved by comparing truth models 2 and 3. Their
low difference -1.9%, and the MBE accuracy assessment results of 15.2% is less than the
calibration accuracy requirement of 20%, proving this conclusion. The failure of precision
accuracy is caused by the simplification of the material quantities. Therefore, it was expected
to be imprecise. Accounting for this, by removing the materials not accessed in both truth
Chapter Six: Accuracy Assessment Results And Discussion
Using BIM To Calculate Accurate Building Material Quantities For Early Design Phase LCA
Author: Brian Berg 141
models 2 and 3, e.g. the stainless steel in the balustrades, and the carbon steel ribbed bar
reinforcement in the reinforced concrete, neither of which are required or available during
sketch design, the Cv(RSME) material reduces to 22.1%, with a MBE material of 6.7%. This is
reflected at an elemental analysis level, where the Cv(RSME) element improved from 40.1% to
15.4%, and the MBEelemental improved from 15.2% to 5.8%. This analysis of the change in
simulation precision, highlights the risk in its assessment. At elemental level, truth model 3
almost passed the calibration requirement of <30.0%, whereas, at material level it was not
even close. The conclusion from this, is that the Cv(RSME) results of a building material LCA
must be analysed, and pass at both analysis material and analysis levels.
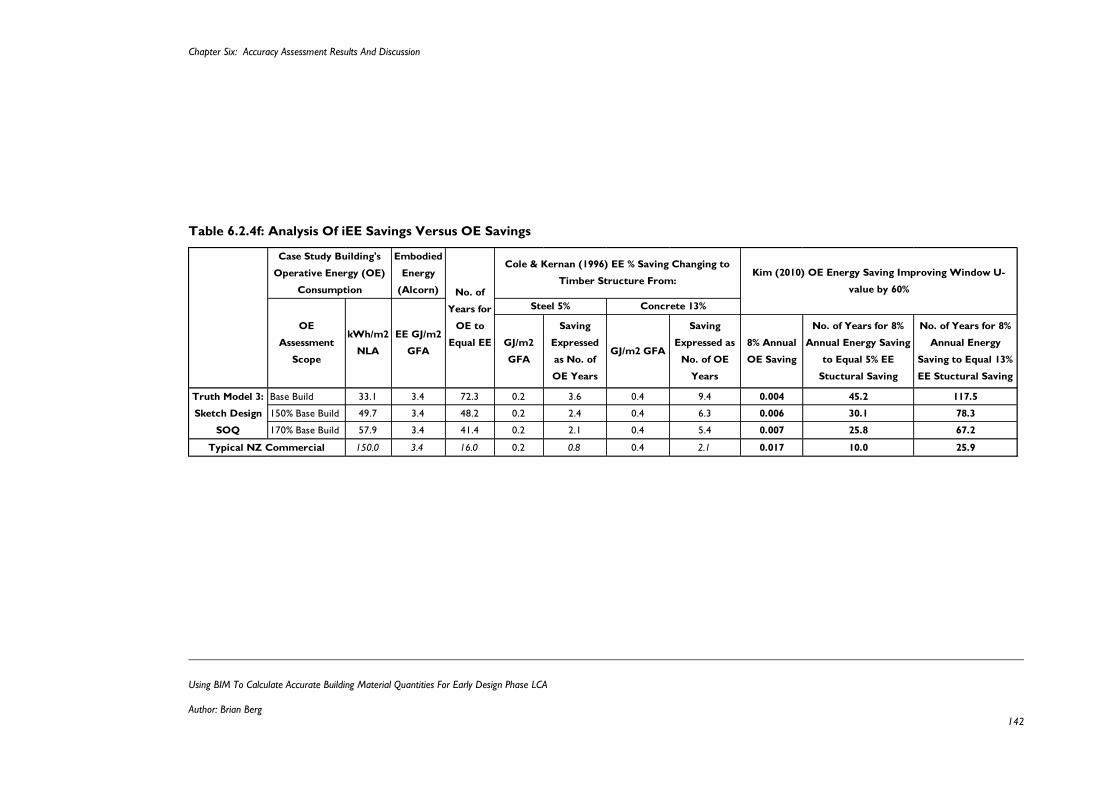
Chapter Six: Accuracy Assessment Results And Discussion
Using BIM To Calculate Accurate Building Material Quantities For Early Design Phase LCA
Author: Brian Berg 142
Table 6.2.4f: Analysis Of iEE Savings Versus OE Savings
GJ/m2
GFA
Saving
Expressed
as No. of
OE Years
GJ/m2 GFA
Saving
Expressed as
No. of OE
Years
8% Annual
OE Saving
No. of Years for 8%
Annual Energy Saving
to Equal 5% EE
Stuctural Saving
No. of Years for 8%
Annual Energy
Saving to Equal 13%
EE Stuctural Saving
Base Build 33.1 3.4 72.3 0.2 3.6 0.4 9.4 0.004 45.2 117.5
150% Base Build 49.7 3.4 48.2 0.2 2.4 0.4 6.3 0.006 30.1 78.3
170% Base Build 57.9 3.4 41.4 0.2 2.1 0.4 5.4 0.007 25.8 67.2
150.0 3.4 16.0 0.2 0.8 0.4 2.1 0.017 10.0 25.9
Kim (2010) OE Energy Saving Improving Window U-
value by 60%
Truth Model 3:
Sketch Design
SOQ
Typical NZ Commercial
Steel 5%
Cole & Kernan (1996) EE % Saving Changing to
Timber Structure From:
Concrete 13%
No. of
Years for
OE to
Equal EE
OE
Assessment
Scope
Embodied
Energy
(Alcorn)
Case Study Building's
Operative Energy (OE)
Consumption
EE GJ/m2
GFA
kWh/m2
NLA
Chapter Six: Accuracy Assessment Results And Discussion
Using BIM To Calculate Accurate Building Material Quantities For Early Design Phase LCA
Author: Brian Berg 143
6.3 Test Two: Does A BIM Model Calculate Accurate iEE
BIM LCA BPS Results?
6.3.1 A Recap Of The Testing Process:
Test two is testing the thesis hypothesis that, by defining the accuracy required for iEE
simulations, a BIM model of sketch design detail will calculate building material quantities
accurately enough for a building material LCA assessment. To test this hypothesis, building
materials calculated from the iEE BIM LCA BPS model using Revit, are compared to truth
model 3’s material quantities (presented in Graphs 6.2.4a and 6.2.4b). Both sets of material
quantities are normalised to an iEE value. This is to determine the accuracy of the BIM model
calculated material quantities compared to truth model 3, and to investigate the influence, and
significance, of any simulation inaccuracies.
This testing process is conducted in two stages, pre-calibration, and post calibration. Pre-
calibration is the accuracy assessment of Revit calculated material quantities constructed
prior to their comparison to the truth model. This means they are not biased by the truth
model, and is a recreation of the modelling process that the building design team would
follow for designing new buildings. The calibration accuracy assessment, identifies the areas
and causes of simulation inaccuracies. Post-calibration is the result of making alterations to
the BIM model to satisfy the EE maximum acceptable calibration tolerances if not achieved in
pre-calibration.
6.3.2 Pre-Calibration Accuracy Assessment Of The Revit iEE BIM LCA
BPS
Results: Is The Revit iEE BIM LCA BPS Accuarte Enough?
The iEE value of the Revit iEE BIM LCA BPS is 3.4 GJ/m2 GFA. Compared to truth model 3’s
3.0 GJ/m2 GFA, this is a +13.3% difference. Tables 6.3.2a and 6.3.2b, show that the Revit
model representation of an iEE BIM LCA BPS achieves the accuracy MBE accuracy
requirements of being <±10-20% compared to both truth models 2 and 3, at both a material,
and elemental level of analysis. However, the iEE BIM LCA BPS fails the Cv(RSME) precision
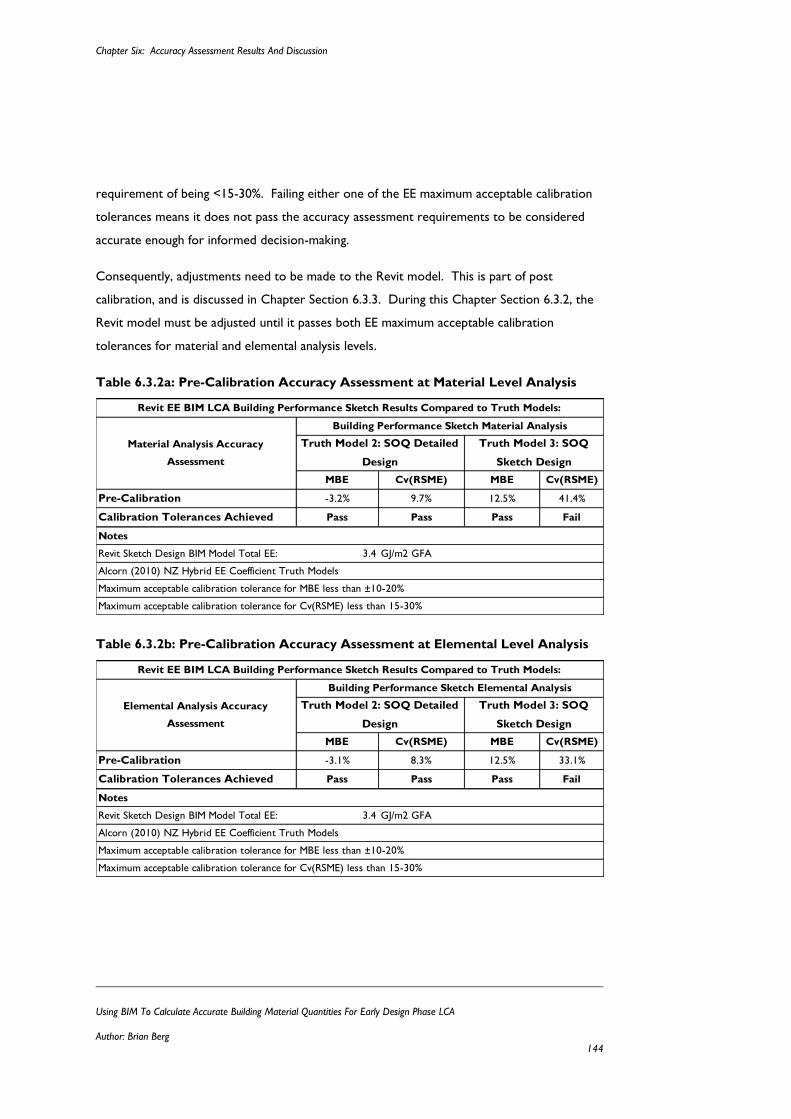
Chapter Six: Accuracy Assessment Results And Discussion
Using BIM To Calculate Accurate Building Material Quantities For Early Design Phase LCA
Author: Brian Berg 144
requirement of being <15-30%. Failing either one of the EE maximum acceptable calibration
tolerances means it does not pass the accuracy assessment requirements to be considered
accurate enough for informed decision-making.
Consequently, adjustments need to be made to the Revit model. This is part of post
calibration, and is discussed in Chapter Section 6.3.3. During this Chapter Section 6.3.2, the
Revit model must be adjusted until it passes both EE maximum acceptable calibration
tolerances for material and elemental analysis levels.
Table 6.3.2a: Pre-Calibration Accuracy Assessment at Material Level Analysis
Table 6.3.2b: Pre-Calibration Accuracy Assessment at Elemental Level Analysis
MBE Cv(RSME) MBE Cv(RSME)
Pre-Calibration -3.2% 9.7% 12.5% 41.4%
Calibration Tolerances Achieved Pass Pass Pass Fail
Revit Sketch Design BIM Model Total EE: 3.4
Revit EE BIM LCA Building Performance Sketch Results Compared to Truth Models:
Building Performance Sketch Material Analysis
Notes
Material Analysis Accuracy
Assessment
Maximum acceptable calibration tolerance for MBE less than ±10-20%
Maximum acceptable calibration tolerance for Cv(RSME) less than 15-30%
Alcorn (2010) NZ Hybrid EE Coefficient Truth Models
GJ/m2 GFA
Truth Model 2: SOQ Detailed
Design
Truth Model 3: SOQ
Sketch Design
MBE Cv(RSME) MBE Cv(RSME)
Pre-Calibration -3.1% 8.3% 12.5% 33.1%
Calibration Tolerances Achieved Pass Pass Pass Fail
Revit Sketch Design BIM Model Total EE: 3.4
Notes
GJ/m2 GFA
Alcorn (2010) NZ Hybrid EE Coefficient Truth Models
Maximum acceptable calibration tolerance for MBE less than ±10-20%
Maximum acceptable calibration tolerance for Cv(RSME) less than 15-30%
Revit EE BIM LCA Building Performance Sketch Results Compared to Truth Models:
Elemental Analysis Accuracy
Assessment
Building Performance Sketch Elemental Analysis
Truth Model 2: SOQ Detailed
Design
Truth Model 3: SOQ
Sketch Design
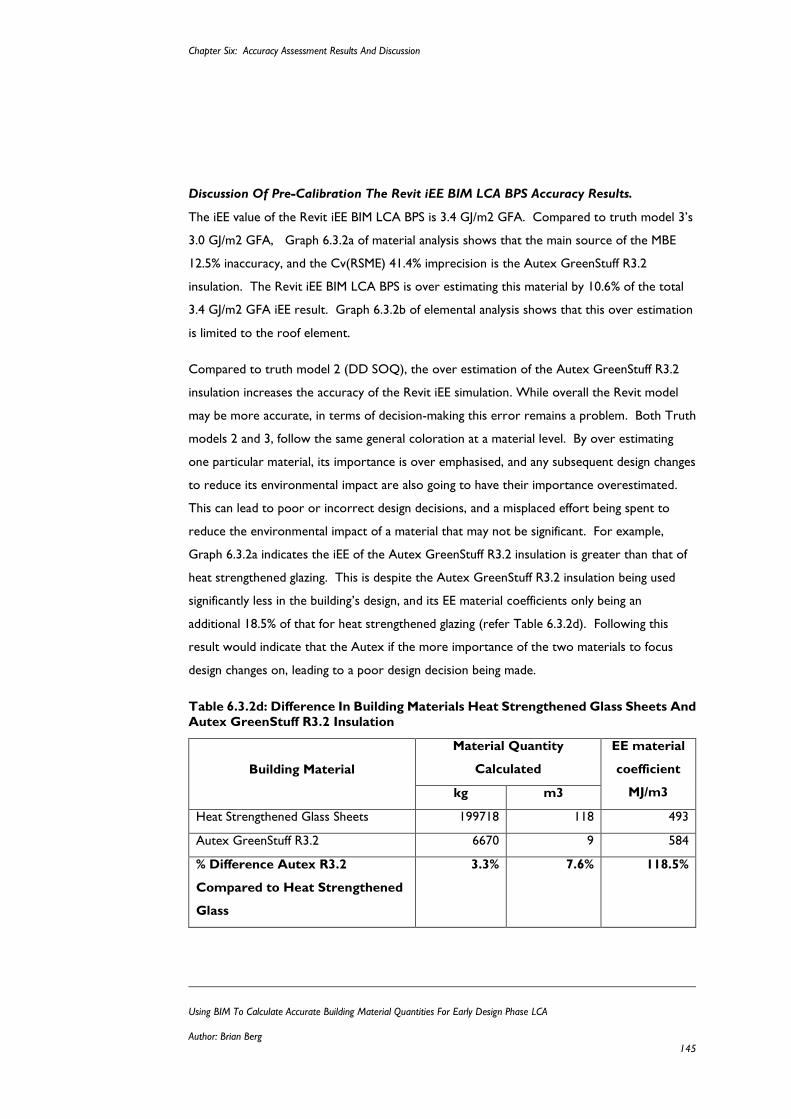
Chapter Six: Accuracy Assessment Results And Discussion
Using BIM To Calculate Accurate Building Material Quantities For Early Design Phase LCA
Author: Brian Berg 145
Discussion Of Pre-Calibration The Revit iEE BIM LCA BPS Accuracy Results.
The iEE value of the Revit iEE BIM LCA BPS is 3.4 GJ/m2 GFA. Compared to truth model 3’s
3.0 GJ/m2 GFA, Graph 6.3.2a of material analysis shows that the main source of the MBE
12.5% inaccuracy, and the Cv(RSME) 41.4% imprecision is the Autex GreenStuff R3.2
insulation. The Revit iEE BIM LCA BPS is over estimating this material by 10.6% of the total
3.4 GJ/m2 GFA iEE result. Graph 6.3.2b of elemental analysis shows that this over estimation
is limited to the roof element.
Compared to truth model 2 (DD SOQ), the over estimation of the Autex GreenStuff R3.2
insulation increases the accuracy of the Revit iEE simulation. While overall the Revit model
may be more accurate, in terms of decision-making this error remains a problem. Both Truth
models 2 and 3, follow the same general coloration at a material level. By over estimating
one particular material, its importance is over emphasised, and any subsequent design changes
to reduce its environmental impact are also going to have their importance overestimated.
This can lead to poor or incorrect design decisions, and a misplaced effort being spent to
reduce the environmental impact of a material that may not be significant. For example,
Graph 6.3.2a indicates the iEE of the Autex GreenStuff R3.2 insulation is greater than that of
heat strengthened glazing. This is despite the Autex GreenStuff R3.2 insulation being used
significantly less in the building’s design, and its EE material coefficients only being an
additional 18.5% of that for heat strengthened glazing (refer Table 6.3.2d). Following this
result would indicate that the Autex if the more importance of the two materials to focus
design changes on, leading to a poor design decision being made.
Table 6.3.2d: Difference In Building Materials Heat Strengthened Glass Sheets And
Autex GreenStuff R3.2 Insulation
Building Material
Material Quantity
Calculated
EE material
coefficient
MJ/m3 kg m3
Heat Strengthened Glass Sheets 199718 118 493
Autex GreenStuff R3.2 6670 9 584
% Difference Autex R3.2
Compared to Heat Strengthened
Glass
3.3% 7.6% 118.5%
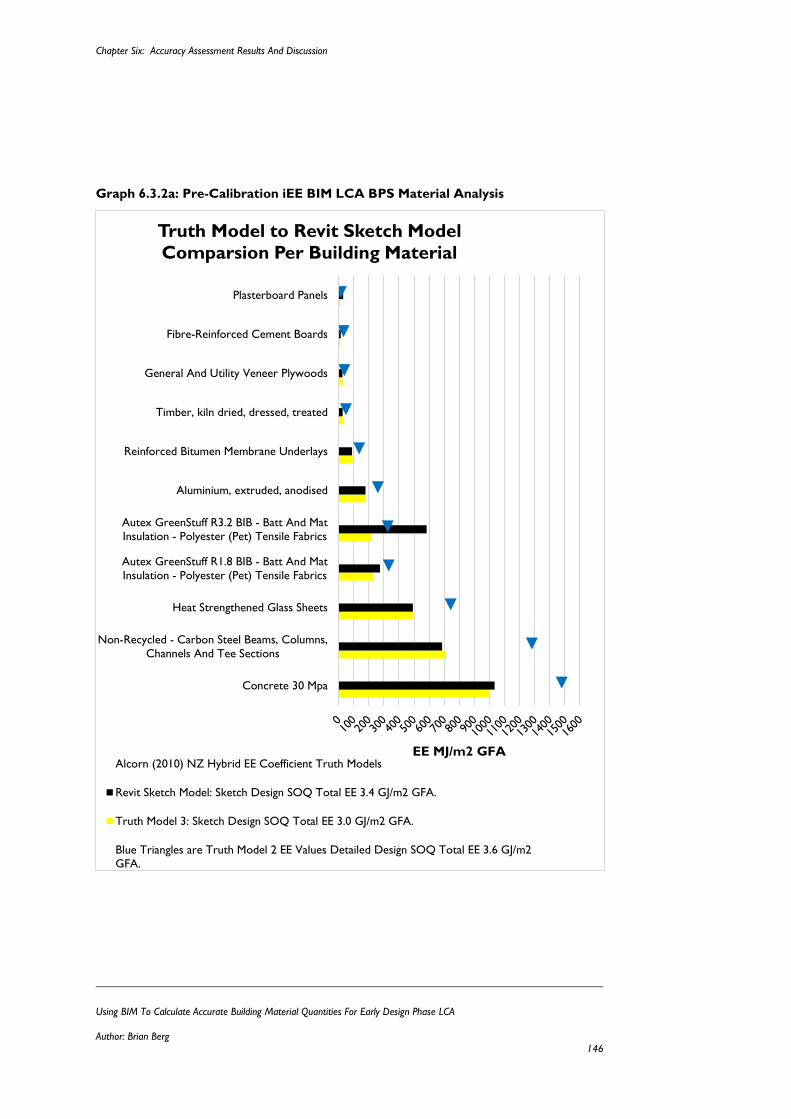
Chapter Six: Accuracy Assessment Results And Discussion
Using BIM To Calculate Accurate Building Material Quantities For Early Design Phase LCA
Author: Brian Berg 146
Graph 6.3.2a: Pre-Calibration iEE BIM LCA BPS Material Analysis
Concrete 30 Mpa
Non-Recycled - Carbon Steel Beams, Columns,
Channels And Tee Sections
Heat Strengthened Glass Sheets
Autex GreenStuff R1.8 BIB - Batt And Mat
Insulation - Polyester (Pet) Tensile Fabrics
Autex GreenStuff R3.2 BIB - Batt And Mat
Insulation - Polyester (Pet) Tensile Fabrics
Aluminium, extruded, anodised
Reinforced Bitumen Membrane Underlays
Timber, kiln dried, dressed, treated
General And Utility Veneer Plywoods
Fibre-Reinforced Cement Boards
Plasterboard Panels
EE MJ/m2 GFA
Truth Model to Revit Sketch Model
Comparsion Per Building Material
Alcorn (2010) NZ Hybrid EE Coefficient Truth Models
Revit Sketch Model: Sketch Design SOQ Total EE 3.4 GJ/m2 GFA.
Truth Model 3: Sketch Design SOQ Total EE 3.0 GJ/m2 GFA.
Blue Triangles are Truth Model 2 EE Values Detailed Design SOQ Total EE 3.6 GJ/m2
GFA.
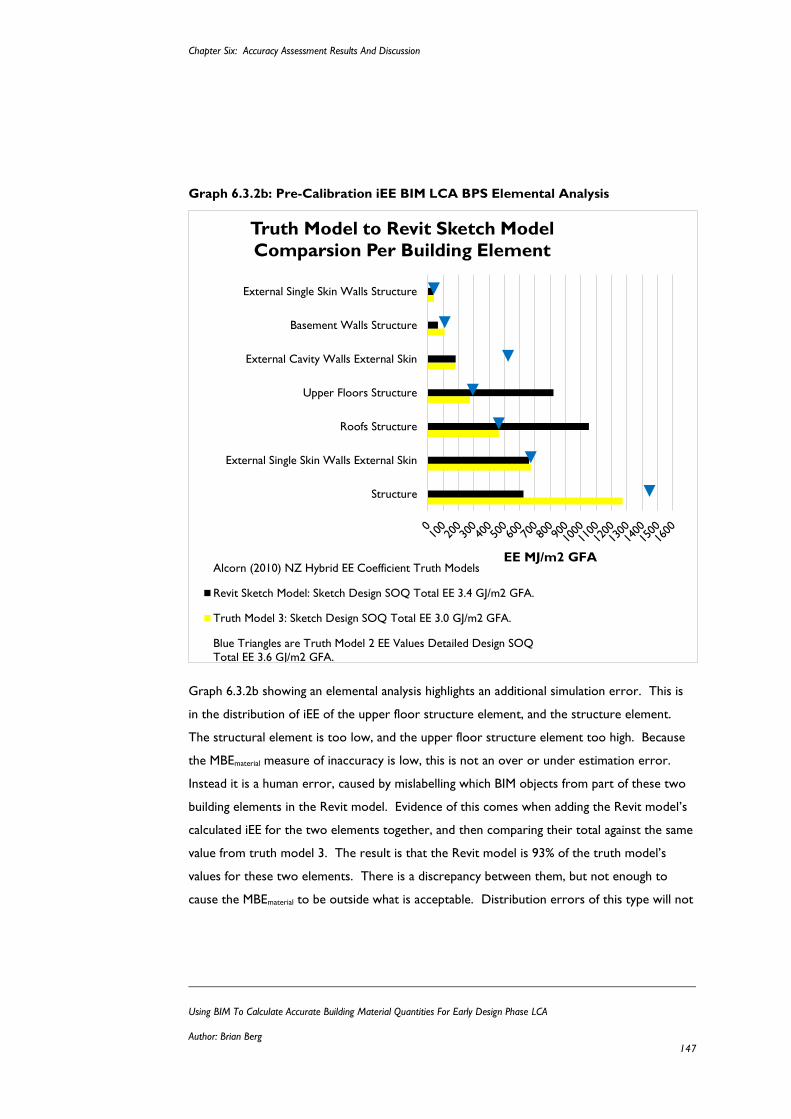
Chapter Six: Accuracy Assessment Results And Discussion
Using BIM To Calculate Accurate Building Material Quantities For Early Design Phase LCA
Author: Brian Berg 147
Graph 6.3.2b: Pre-Calibration iEE BIM LCA BPS Elemental Analysis
Graph 6.3.2b showing an elemental analysis highlights an additional simulation error. This is
in the distribution of iEE of the upper floor structure element, and the structure element.
The structural element is too low, and the upper floor structure element too high. Because
the MBEmaterial measure of inaccuracy is low, this is not an over or under estimation error.
Instead it is a human error, caused by mislabelling which BIM objects from part of these two
building elements in the Revit model. Evidence of this comes when adding the Revit model’s
calculated iEE for the two elements together, and then comparing their total against the same
value from truth model 3. The result is that the Revit model is 93% of the truth model’s
values for these two elements. There is a discrepancy between them, but not enough to
cause the MBEmaterial to be outside what is acceptable. Distribution errors of this type will not
Structure
External Single Skin Walls External Skin
Roofs Structure
Upper Floors Structure
External Cavity Walls External Skin
Basement Walls Structure
External Single Skin Walls Structure
EE MJ/m2 GFA
Truth Model to Revit Sketch Model
Comparsion Per Building Element
Alcorn (2010) NZ Hybrid EE Coefficient Truth Models
Revit Sketch Model: Sketch Design SOQ Total EE 3.4 GJ/m2 GFA.
Truth Model 3: Sketch Design SOQ Total EE 3.0 GJ/m2 GFA.
Blue Triangles are Truth Model 2 EE Values Detailed Design SOQ
Total EE 3.6 GJ/m2 GFA.
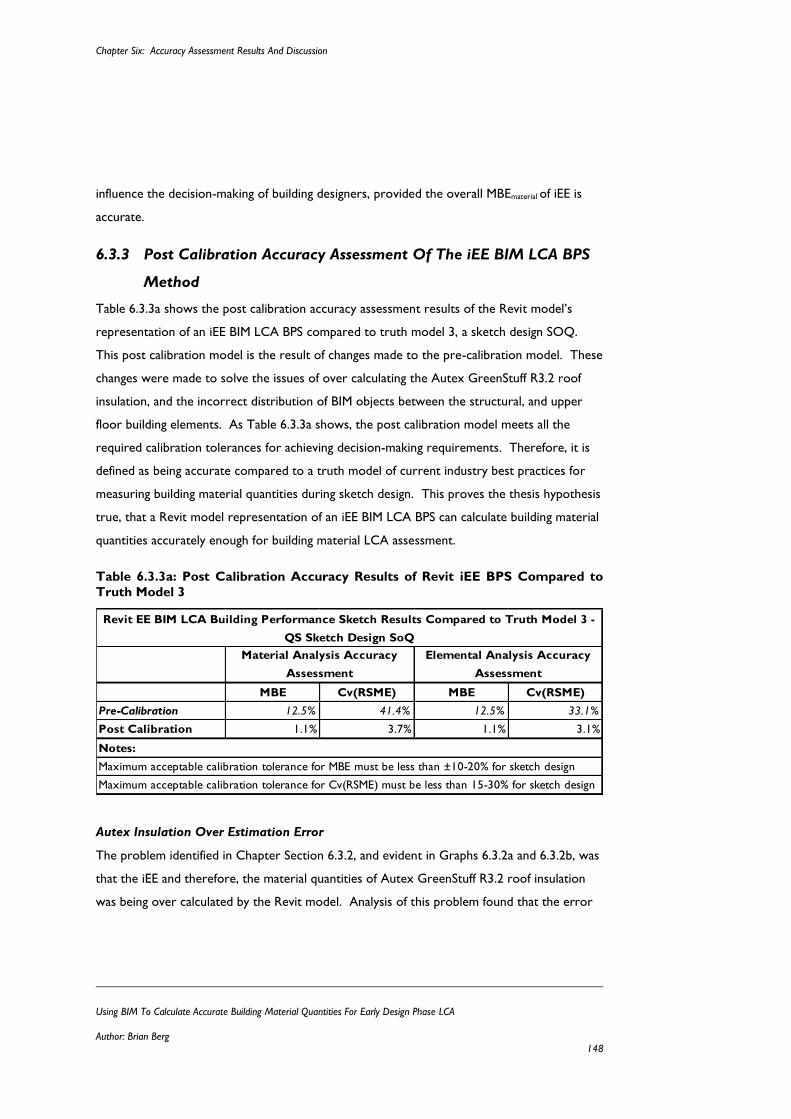
Chapter Six: Accuracy Assessment Results And Discussion
Using BIM To Calculate Accurate Building Material Quantities For Early Design Phase LCA
Author: Brian Berg 148
influence the decision-making of building designers, provided the overall MBEmaterial of iEE is
accurate.
6.3.3 Post Calibration Accuracy Assessment Of The iEE BIM LCA BPS
Method
Table 6.3.3a shows the post calibration accuracy assessment results of the Revit model’s
representation of an iEE BIM LCA BPS compared to truth model 3, a sketch design SOQ.
This post calibration model is the result of changes made to the pre-calibration model. These
changes were made to solve the issues of over calculating the Autex GreenStuff R3.2 roof
insulation, and the incorrect distribution of BIM objects between the structural, and upper
floor building elements. As Table 6.3.3a shows, the post calibration model meets all the
required calibration tolerances for achieving decision-making requirements. Therefore, it is
defined as being accurate compared to a truth model of current industry best practices for
measuring building material quantities during sketch design. This proves the thesis hypothesis
true, that a Revit model representation of an iEE BIM LCA BPS can calculate building material
quantities accurately enough for building material LCA assessment.
Table 6.3.3a: Post Calibration Accuracy Results of Revit iEE BPS Compared to
Truth Model 3
Autex Insulation Over Estimation Error
The problem identified in Chapter Section 6.3.2, and evident in Graphs 6.3.2a and 6.3.2b, was
that the iEE and therefore, the material quantities of Autex GreenStuff R3.2 roof insulation
was being over calculated by the Revit model. Analysis of this problem found that the error
MBE Cv(RSME) MBE Cv(RSME)
Pre-Calibration 12.5% 41.4% 12.5% 33.1%
Post Calibration 1.1% 3.7% 1.1% 3.1%
Material Analysis Accuracy
Assessment
Elemental Analysis Accuracy
Assessment
Revit EE BIM LCA Building Performance Sketch Results Compared to Truth Model 3 -
QS Sketch Design SoQ
Notes:
Maximum acceptable calibration tolerance for MBE must be less than ±10-20% for sketch design
Maximum acceptable calibration tolerance for Cv(RSME) must be less than 15-30% for sketch design

Chapter Six: Accuracy Assessment Results And Discussion
Using BIM To Calculate Accurate Building Material Quantities For Early Design Phase LCA
Author: Brian Berg 149
was caused by a human error in the LCA results analysis spreadsheet, not due to a Revit
modelling error. Both the volume and area material quantities for the Autex GreenStuff R3.2
roof insulation were being calculated and used in the iEE assessment. Removing the area
calculated iEE, the Revit model’s iEE value reduced to approximately -5.0% of truth model 3.
Evident in Graphs 6.3.3a and 6.3.3b, which show the distribution of iEE for both material and
elemental analysis, this corrected the simulation error. The -5.0% is accounted for by the
Revit model’s roof BIM objects being modelled slightly smaller than the truth model. The
difference between their areas is 5%. This is an error in the modelled BIM geometry.
However, it is insignificant. A 5% increase in roof area translates to a 200mm (approximate)
increase in the roof overhang. With a total roof perimeter of 325m, this is a very easy
modelling error to make, and an insignificant one, as the 5% difference in iEE translates to less
than 1% of the total iEE value of 3.0 GJ/m2 GFA.
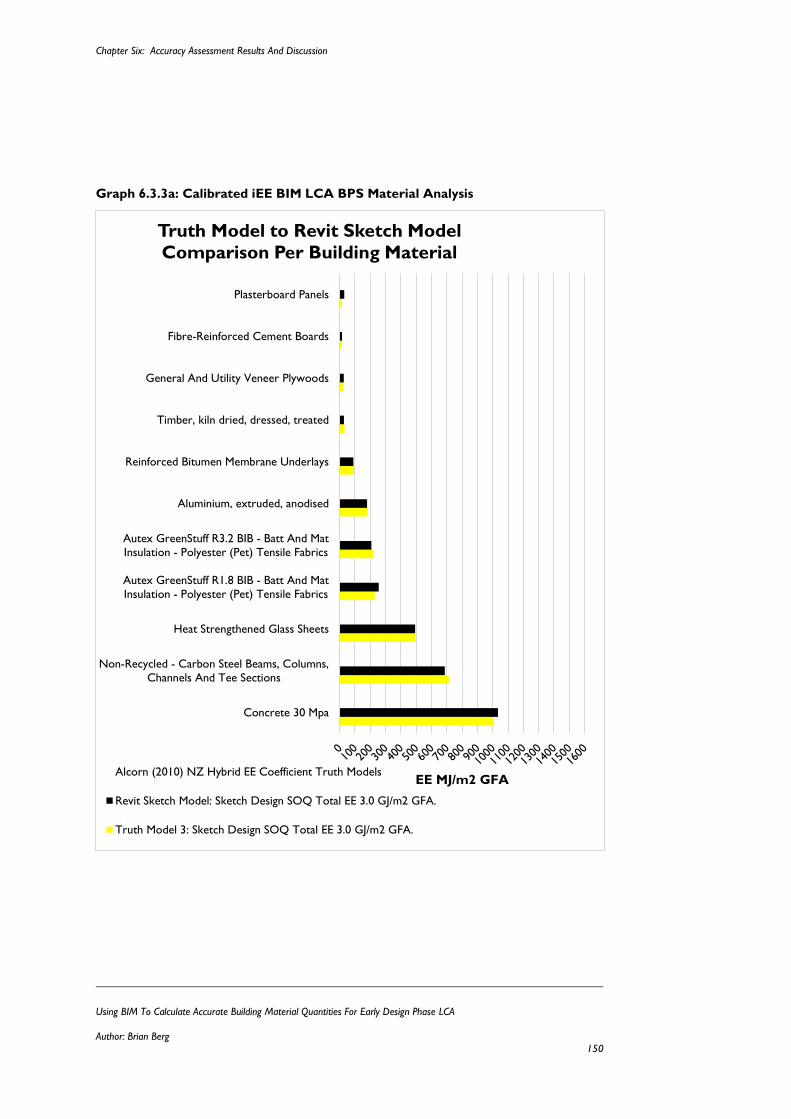
Chapter Six: Accuracy Assessment Results And Discussion
Using BIM To Calculate Accurate Building Material Quantities For Early Design Phase LCA
Author: Brian Berg 150
Graph 6.3.3a: Calibrated iEE BIM LCA BPS Material Analysis
Concrete 30 Mpa
Non-Recycled - Carbon Steel Beams, Columns,
Channels And Tee Sections
Heat Strengthened Glass Sheets
Autex GreenStuff R1.8 BIB - Batt And Mat
Insulation - Polyester (Pet) Tensile Fabrics
Autex GreenStuff R3.2 BIB - Batt And Mat
Insulation - Polyester (Pet) Tensile Fabrics
Aluminium, extruded, anodised
Reinforced Bitumen Membrane Underlays
Timber, kiln dried, dressed, treated
General And Utility Veneer Plywoods
Fibre-Reinforced Cement Boards
Plasterboard Panels
EE MJ/m2 GFA
Truth Model to Revit Sketch Model
Comparison Per Building Material
Alcorn (2010) NZ Hybrid EE Coefficient Truth Models
Revit Sketch Model: Sketch Design SOQ Total EE 3.0 GJ/m2 GFA.
Truth Model 3: Sketch Design SOQ Total EE 3.0 GJ/m2 GFA.
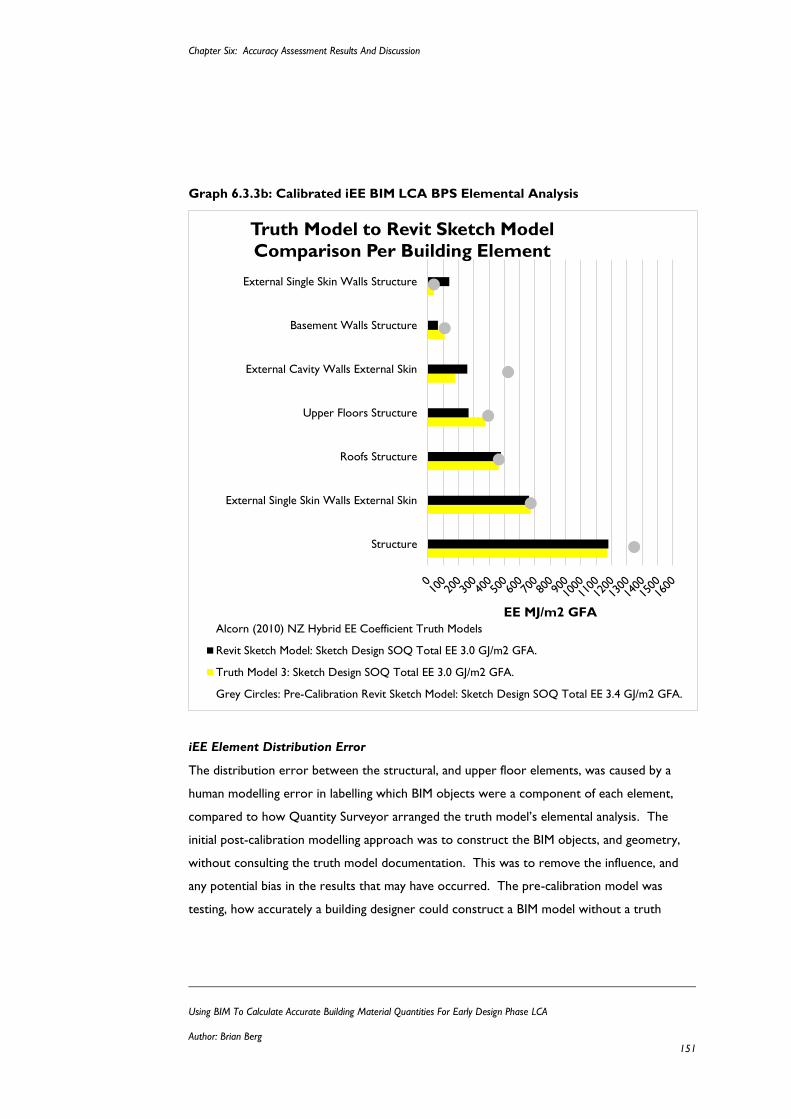
Chapter Six: Accuracy Assessment Results And Discussion
Using BIM To Calculate Accurate Building Material Quantities For Early Design Phase LCA
Author: Brian Berg 151
Graph 6.3.3b: Calibrated iEE BIM LCA BPS Elemental Analysis
iEE Element Distribution Error
The distribution error between the structural, and upper floor elements, was caused by a
human modelling error in labelling which BIM objects were a component of each element,
compared to how Quantity Surveyor arranged the truth model’s elemental analysis. The
initial post-calibration modelling approach was to construct the BIM objects, and geometry,
without consulting the truth model documentation. This was to remove the influence, and
any potential bias in the results that may have occurred. The pre-calibration model was
testing, how accurately a building designer could construct a BIM model without a truth
Structure
External Single Skin Walls External Skin
Roofs Structure
Upper Floors Structure
External Cavity Walls External Skin
Basement Walls Structure
External Single Skin Walls Structure
EE MJ/m2 GFA
Truth Model to Revit Sketch Model
Comparison Per Building Element
Alcorn (2010) NZ Hybrid EE Coefficient Truth Models
Revit Sketch Model: Sketch Design SOQ Total EE 3.0 GJ/m2 GFA.
Truth Model 3: Sketch Design SOQ Total EE 3.0 GJ/m2 GFA.
Grey Circles: Pre-Calibration Revit Sketch Model: Sketch Design SOQ Total EE 3.4 GJ/m2 GFA.
Chapter Six: Accuracy Assessment Results And Discussion
Using BIM To Calculate Accurate Building Material Quantities For Early Design Phase LCA
Author: Brian Berg 152
model. This was recreating the scenario building designers would encounter in the design of
new buildings. This was used to test the thesis hypothesis, and answer the question of
whether a Revit BIM model of sketch design detail could calculate building material quantities
accurately enough for building material LCA assessment. The post-calibration changes to the
Revit model, were the reassignment, and reclassification of the BIM objects to match the
truth model. This did not influence the Revit models iEE values, but corrected the elemental
distribution error. This is evident in Graphs 6.3.3a and 6.3.3b, which show an improved
distribution of iEE for both material and elemental analysis. They show that the post
calibration Revit model is better correlated with truth model 3, compared to the pre-
calibration, represented by the grey circle markers.
Graphs 6.3.3b, still shows some distribution differences between the wall and floor elements.
Again this is due to differences in the organisation of the elemental classification, not Revit
calculation errors. There will always be some differences of this type. This is due to the way
BIM tools organise their information. Revit BIM objects are organised by family types.
Within each family type, there are contributing materials. The elemental classification of BIM
objects is assigned to that family type, and applied to all the material within it. In many cases
this will differ from the way a SOQ adhering to a standard method of measurement is
organised.
For iEE, and LCA assessments, this distribution issue does not reduce the decision-making
ability of building designers. Provided the building designer can; locate within which specific
BIM objects the respective materials that will contribute the largest reduction in iEE; and can
apply and test design solutions, while maintaining sufficient accuracy, whether the iEE is in one
element or another is not important.
Instead, for iEE and LCA assessments, it is critical that both the material level accuracy, and
precision requirements are achieved. These are the results that determine if the modelling
errors are occurring. Critically the elemental analysis, helps to identify where simulation
errors are located. Therefore, a finding of this research has been that iEE results should be
presented at material, and elemental level as per standard practices. But also specifically for
BIM analysis by:
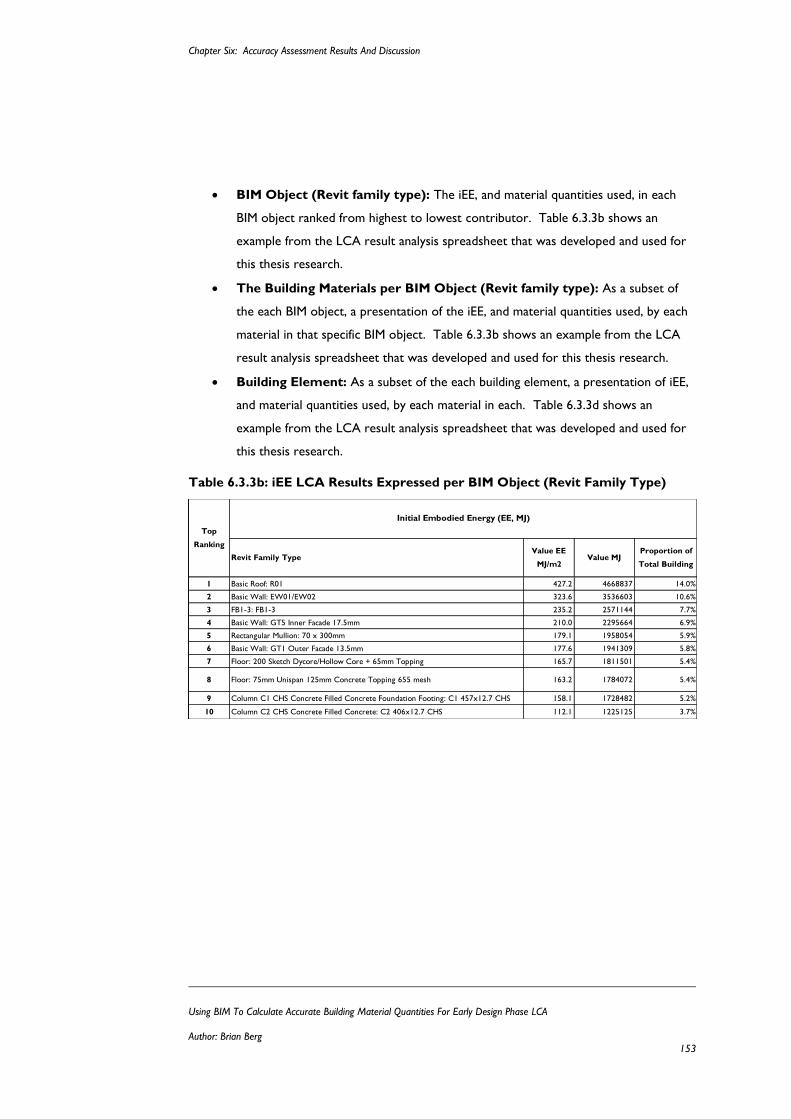
Chapter Six: Accuracy Assessment Results And Discussion
Using BIM To Calculate Accurate Building Material Quantities For Early Design Phase LCA
Author: Brian Berg 153
BIM Object (Revit family type): The iEE, and material quantities used, in each
BIM object ranked from highest to lowest contributor. Table 6.3.3b shows an
example from the LCA result analysis spreadsheet that was developed and used for
this thesis research.
The Building Materials per BIM Object (Revit family type): As a subset of
the each BIM object, a presentation of the iEE, and material quantities used, by each
material in that specific BIM object. Table 6.3.3b shows an example from the LCA
result analysis spreadsheet that was developed and used for this thesis research.
Building Element: As a subset of the each building element, a presentation of iEE,
and material quantities used, by each material in each. Table 6.3.3d shows an
example from the LCA result analysis spreadsheet that was developed and used for
this thesis research.
Table 6.3.3b: iEE LCA Results Expressed per BIM Object (Revit Family Type)
Revit Family TypeValue EE
MJ/m2Value MJ
Proportion of
Total Building
1 Basic Roof: R01 427.2 4668837 14.0%
2 Basic Wall: EW01/EW02 323.6 3536603 10.6%
3 FB1-3: FB1-3 235.2 2571144 7.7%
4 Basic Wall: GT5 Inner Facade 17.5mm 210.0 2295664 6.9%
5 Rectangular Mullion: 70 x 300mm 179.1 1958054 5.9%
6 Basic Wall: GT1 Outer Facade 13.5mm 177.6 1941309 5.8%
7 Floor: 200 Sketch Dycore/Hollow Core + 65mm Topping 165.7 1811501 5.4%
8 Floor: 75mm Unispan 125mm Concrete Topping 655 mesh 163.2 1784072 5.4%
9 Column C1 CHS Concrete Filled Concrete Foundation Footing: C1 457x12.7 CHS 158.1 1728482 5.2%
10 Column C2 CHS Concrete Filled Concrete: C2 406x12.7 CHS 112.1 1225125 3.7%
Initial Embodied Energy (EE, MJ)
Top
Ranking
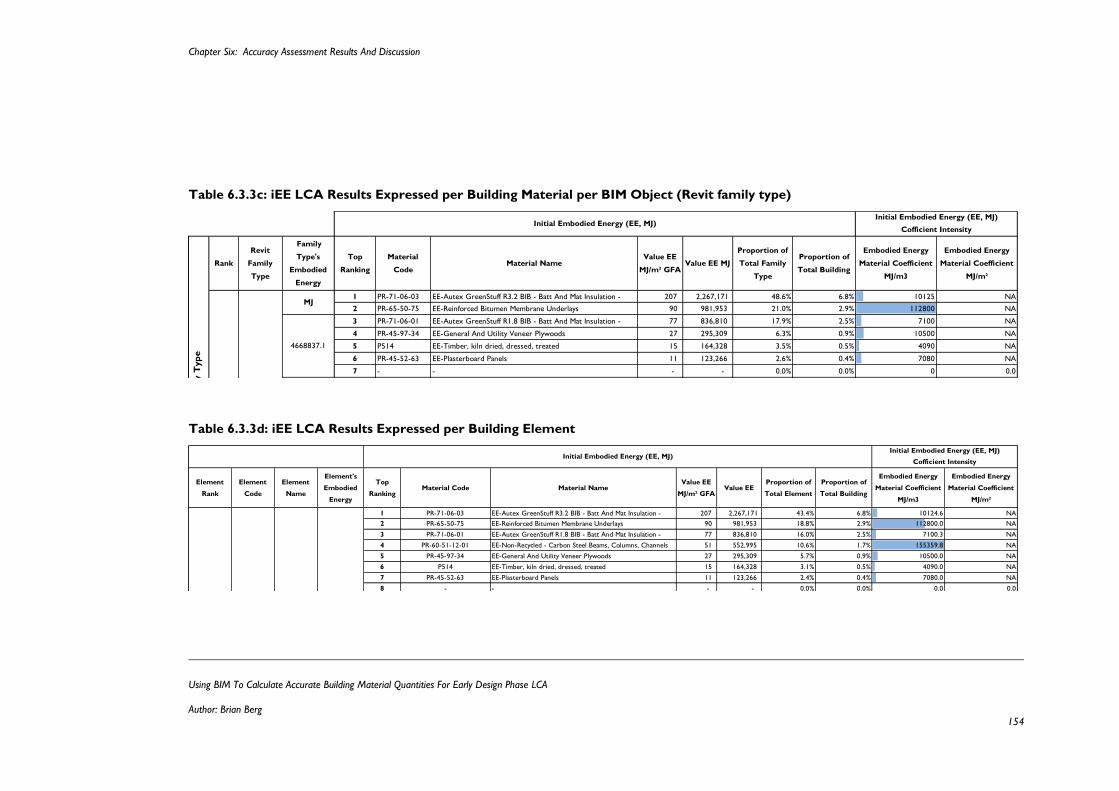
Chapter Six: Accuracy Assessment Results And Discussion
Using BIM To Calculate Accurate Building Material Quantities For Early Design Phase LCA
Author: Brian Berg 154
Table 6.3.3c: iEE LCA Results Expressed per Building Material per BIM Object (Revit family type)
Table 6.3.3d: iEE LCA Results Expressed per Building Element
Rank
Family
Type's
Embodied
Energy
Top
Ranking
Material
CodeMaterial Name
Value EE
MJ/m² GFAValue EE MJ
Proportion of
Total Family
Type
Proportion of
Total Building
Embodied Energy
Material Coefficient
MJ/m3
Embodied Energy
Material Coefficient
MJ/m²
1 PR-71-06-03 EE-Autex GreenStuff R3.2 BIB - Batt And Mat Insulation - 207 2,267,171 48.6% 6.8% 10125 NA
2 PR-65-50-75 EE-Reinforced Bitumen Membrane Underlays 90 981,953 21.0% 2.9% 112800 NA
3 PR-71-06-01 EE-Autex GreenStuff R1.8 BIB - Batt And Mat Insulation - 77 836,810 17.9% 2.5% 7100 NA
4 PR-45-97-34 EE-General And Utility Veneer Plywoods 27 295,309 6.3% 0.9% 10500 NA
5 P514 EE-Timber, kiln dried, dressed, treated 15 164,328 3.5% 0.5% 4090 NA
6 PR-45-52-63 EE-Plasterboard Panels 11 123,266 2.6% 0.4% 7080 NA
7 - - - - 0.0% 0.0% 0 0.0
8 - - - - 0.0% 0.0% 0 0.0
9 - - - - 0.0% 0.0% 0 0.0
10 - - - - 0.0% 0.0% 0 0.0
11 - - - - 0.0% 0.0% 0 0.0
12 - - - - 0.0% 0.0% 0 0.0
13 - - - - 0.0% 0.0% 0 0.0
14 - - - - 0.0% 0.0% 0 0.0
15 - - - - 0.0% 0.0% 0 0.0
16 - - - - 0.0% 0.0% 0 0.0
17 - - - - 0.0% 0.0% 0 0.0
18 - - - - 0.0% 0.0% 0 0.0
19 - - - - 0.0% 0.0% 0 0.0
20 - - - - 0.0% 0.0% 0 0.0
427 4,668,837 100.0% 14.0%TOTAL
1
MJ
Aut
oma
Return from the Revit Family Type
Analysis Dashboard for Embodied Initial Embodied Energy (EE, MJ)
Initial Embodied Energy (EE, MJ)
Revit
Family
Type
Basic Roof:
R01
Cofficient Intensity
4668837.1
MJ/m2 GFA
2.7
Proportion
to Total
0%
Revit
Fam
ily T
yp
e
Element
Rank
Element
Code
Element
Name
Element's
Embodied
Energy
Top
RankingMaterial Code Material Name
Value EE
MJ/m² GFAValue EE
Proportion of
Total Element
Proportion of
Total Building
Embodied Energy
Material Coefficient
MJ/m3
Embodied Energy
Material Coefficient
MJ/m²
1 PR-71-06-03 EE-Autex GreenStuff R3.2 BIB - Batt And Mat Insulation - 207 2,267,171 43.4% 6.8% 10124.6 NA
2 PR-65-50-75 EE-Reinforced Bitumen Membrane Underlays 90 981,953 18.8% 2.9% 112800.0 NA
3 PR-71-06-01 EE-Autex GreenStuff R1.8 BIB - Batt And Mat Insulation - 77 836,810 16.0% 2.5% 7100.3 NA
4 PR-60-51-12-01 EE-Non-Recycled - Carbon Steel Beams, Columns, Channels 51 552,995 10.6% 1.7% 155359.8 NA
5 PR-45-97-34 EE-General And Utility Veneer Plywoods 27 295,309 5.7% 0.9% 10500.0 NA
6 P514 EE-Timber, kiln dried, dressed, treated 15 164,328 3.1% 0.5% 4090.0 NA
7 PR-45-52-63 EE-Plasterboard Panels 11 123,266 2.4% 0.4% 7080.0 NA
8 - - - - 0.0% 0.0% 0.0 0.0
9 - - - - 0.0% 0.0% 0.0 0.0
10 - - - - 0.0% 0.0% 0.0 0.0
11 - - - - 0.0% 0.0% 0.0 0.0
12 - - - - 0.0% 0.0% 0.0 0.0
13 - - - - 0.0% 0.0% 0.0 0.0
14 - - - - 0.0% 0.0% 0.0 0.0
15 - - - - 0.0% 0.0% 0.0 0.0
16 - - - - 0.0% 0.0% 0.0 0.0
17 - - - - 0.0% 0.0% 0.0 0.0
18 - - - - 0.0% 0.0% 0.0 0.0
19 - - - - 0.0% 0.0% 0.0 0.0
20 - - - - 0.0% 0.0% 0.0 0.0
TOTAL Embodied Energy for Level 3 478 5,221,832 100.0% 15.7%
Cofficient Intensity
Return from the Elemental Analysis Dashboard for
Embodied EnergyInitial Embodied Energy (EE, MJ)
Initial Embodied Energy (EE, MJ)
Roofs
Structure52218323 EE-20-10-10
Chapter Six: Accuracy Assessment Results And Discussion
Using BIM To Calculate Accurate Building Material Quantities For Early Design Phase LCA
Author: Brian Berg 155
6.4 Test Three: Is The Revit iEE BIM LCA BPS Model
Robust?
6.4.1 EE & Embodied Carbon Dioxide
The Revit iEE BIM LCA BPS was proven to meet the calibration accuracy requirements using
Alcorn’s (2010) hybrid process / input-out EE calculated material coefficients. This proved
for one example of an LCA assessment result the methodology is feasible. This Chapter
Section tests the applicability of using the Revit iEE BIM LCA BPS modelling method for EE
databases for countries other than New Zealand, and for different LCA-based indicators
beyond EE.
This robustness test normalises the post calibration Revit model’s material quantities using
two different material databases. Firstly, to Crawford’s (2004) hybrid input-output / process
EE dataset, and secondly, to Alcorn’s (2010) hybrid process / input-output Embodied Carbon
Dioxide (ECO2) dataset. Tables 6.4.1a and 6.4.1b show the post calibration results for the
Crawford’s iEE, and Alcorn’s ECO2 post calibration Revit model. These results show strong
model simulation robustness, as in both datasets the Revit model achieved the maximum
acceptable calibration tolerance requirements. However, both showed greater inaccuracies
than the Alcorn iEE post calibration model. This is because in each data set the
environmental intensities for each material are different. This means, any over, or under
estimations and their impact on cancellation errors in the material quantities, when
normalised have a different level of impact on the overall simulation accuracy. Concrete 30
Mpa for example, has a much higher ECO2 intensity than its iEE. That is why it represents
56% of the total ECO2, compared to 33% of the Alcorn iEE, and 19% for Crawford’s iEE.
The results highlighted several key attributes of building materials, and elements that classify
them as ‘high risk’, as they are likely to be have a high impact on the iEE, ECO2 consumption
of a building. ‘High risk’ means that they may require a high level of modelled detail beyond
their proportional influence. Building materials and elements are defined as high risk is
defined in a number of ways:
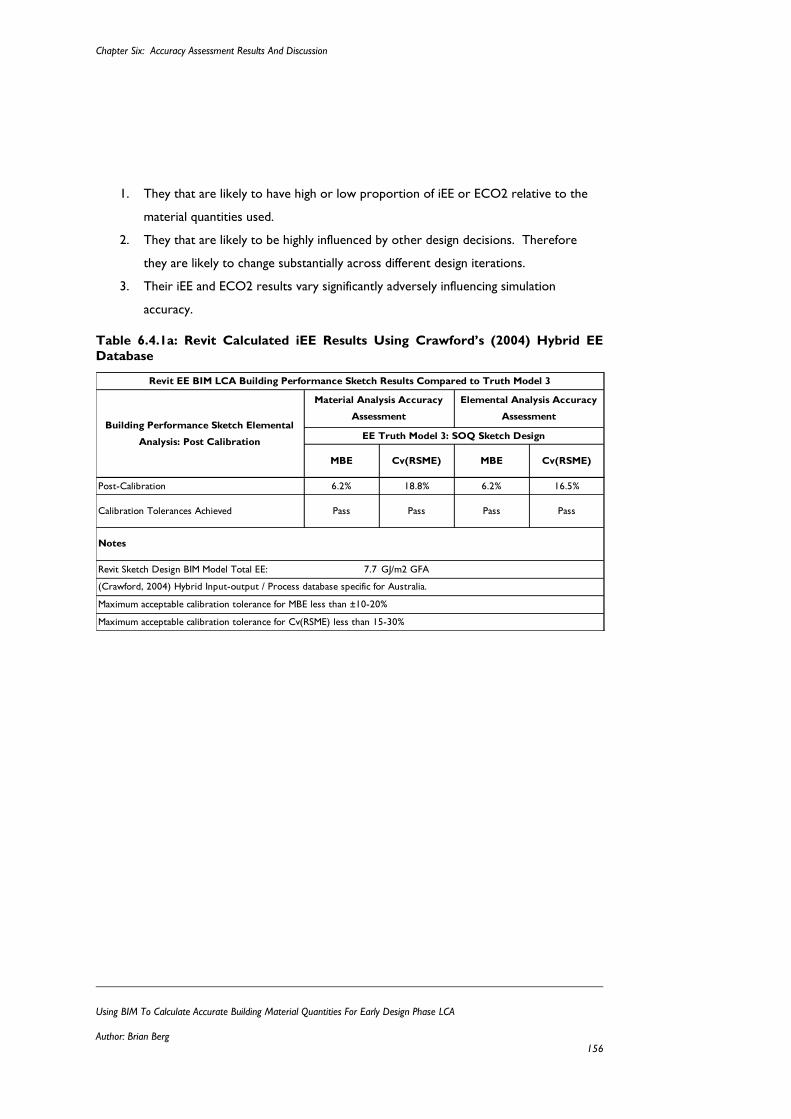
Chapter Six: Accuracy Assessment Results And Discussion
Using BIM To Calculate Accurate Building Material Quantities For Early Design Phase LCA
Author: Brian Berg 156
1. They that are likely to have high or low proportion of iEE or ECO2 relative to the
material quantities used.
2. They that are likely to be highly influenced by other design decisions. Therefore
they are likely to change substantially across different design iterations.
3. Their iEE and ECO2 results vary significantly adversely influencing simulation
accuracy.
Table 6.4.1a: Revit Calculated iEE Results Using Crawford’s (2004) Hybrid EE
Database
MBE Cv(RSME) MBE Cv(RSME)
Post-Calibration 6.2% 18.8% 6.2% 16.5%
Calibration Tolerances Achieved Pass Pass Pass Pass
Revit Sketch Design BIM Model Total EE: 7.7 GJ/m2 GFA
Revit EE BIM LCA Building Performance Sketch Results Compared to Truth Model 3
Building Performance Sketch Elemental
Analysis: Post Calibration
Material Analysis Accuracy
Assessment
Elemental Analysis Accuracy
Assessment
EE Truth Model 3: SOQ Sketch Design
Maximum acceptable calibration tolerance for MBE less than ±10-20%
Maximum acceptable calibration tolerance for Cv(RSME) less than 15-30%
Notes
(Crawford, 2004) Hybrid Input-output / Process database specific for Australia.
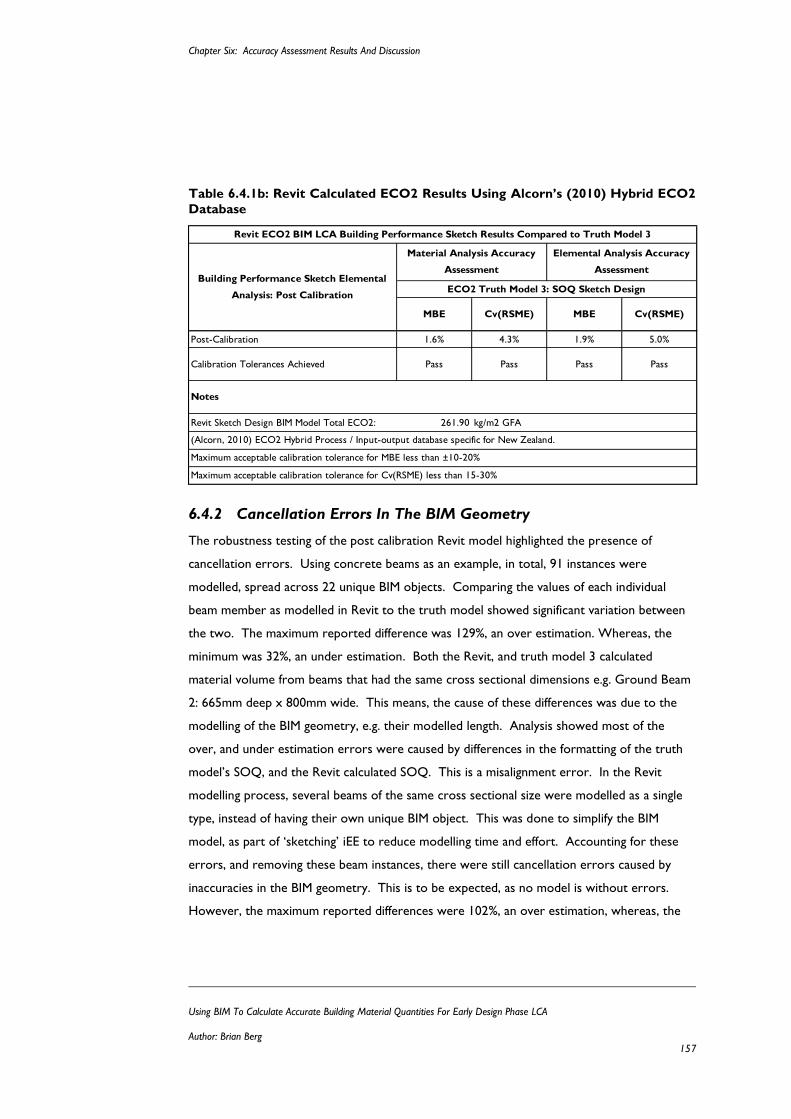
Chapter Six: Accuracy Assessment Results And Discussion
Using BIM To Calculate Accurate Building Material Quantities For Early Design Phase LCA
Author: Brian Berg 157
Table 6.4.1b: Revit Calculated ECO2 Results Using Alcorn’s (2010) Hybrid ECO2
Database
6.4.2 Cancellation Errors In The BIM Geometry
The robustness testing of the post calibration Revit model highlighted the presence of
cancellation errors. Using concrete beams as an example, in total, 91 instances were
modelled, spread across 22 unique BIM objects. Comparing the values of each individual
beam member as modelled in Revit to the truth model showed significant variation between
the two. The maximum reported difference was 129%, an over estimation. Whereas, the
minimum was 32%, an under estimation. Both the Revit, and truth model 3 calculated
material volume from beams that had the same cross sectional dimensions e.g. Ground Beam
2: 665mm deep x 800mm wide. This means, the cause of these differences was due to the
modelling of the BIM geometry, e.g. their modelled length. Analysis showed most of the
over, and under estimation errors were caused by differences in the formatting of the truth
model’s SOQ, and the Revit calculated SOQ. This is a misalignment error. In the Revit
modelling process, several beams of the same cross sectional size were modelled as a single
type, instead of having their own unique BIM object. This was done to simplify the BIM
model, as part of ‘sketching’ iEE to reduce modelling time and effort. Accounting for these
errors, and removing these beam instances, there were still cancellation errors caused by
inaccuracies in the BIM geometry. This is to be expected, as no model is without errors.
However, the maximum reported differences were 102%, an over estimation, whereas, the
MBE Cv(RSME) MBE Cv(RSME)
Post-Calibration 1.6% 4.3% 1.9% 5.0%
Calibration Tolerances Achieved Pass Pass Pass Pass
Revit Sketch Design BIM Model Total ECO2: 261.90 kg/m2 GFA
Revit ECO2 BIM LCA Building Performance Sketch Results Compared to Truth Model 3
Building Performance Sketch Elemental
Analysis: Post Calibration
Material Analysis Accuracy
Assessment
Elemental Analysis Accuracy
Assessment
ECO2 Truth Model 3: SOQ Sketch Design
Maximum acceptable calibration tolerance for MBE less than ±10-20%
Maximum acceptable calibration tolerance for Cv(RSME) less than 15-30%
Notes
(Alcorn, 2010) ECO2 Hybrid Process / Input-output database specific for New Zealand.
Chapter Six: Accuracy Assessment Results And Discussion
Using BIM To Calculate Accurate Building Material Quantities For Early Design Phase LCA
Author: Brian Berg 158
minimum was 68%, an under estimation. These averaged to be a 2.5% under estimation error
by the Revit model, which is an insignificant modelling error.
Expressing these estimation differences as modelled BIM geometry, these range from being a
maximum of 683mm too long, to 375mm too short. This is well within acceptable model
discrepancies for BIM geometry modelling during sketch design, where the building form is
still subject to design uncertainties. Additionally, their impact when considered in the overall
context of the building’s total iEE is insignificant. This averaged out across all total beam
lengths to be less than 1%. This finding is supported by the total iEE of the all concrete
beams in the building, as their total iEE (Alcorn) values were 115.4 MJ/m2 GFA and 116.6
MJ/m2 GFA for the truth model, and the post calibration Revit model respectfully. This
equates to only a -1.0% difference between the two, proving the over and under estimation
errors effectively cancel one another out and are not a concern to simulation accuracy.
Overall, the modelling of BIM geometry in the iEE BIM LCA BPS methodology is far less
precise than typical BIM or CAD drawing conventions during detailed design. This the cause
of a 4.3% combined cancellation error in the building material analysis of the 3.0 GJ/m2 GFA
post calibration model. However, as no individual material had an error greater than 1.0%,
and the robustness testing proved that imprecise modelling of BIM geometry causing
cancellation errors was not a notable influence on simulation accuracy, this is not cause
simulation errors that effect the iEE BIM LCA BIM BPS suitability for decision-making.
6.5 Modelled Detail Of The Pre-Calibration Revit iEE
BIM BPS
Chapter Section 6.3.1 proved that the building information defined within an iEE LCA BPS
model is sufficiently detailed e.g. complete enough, to be effective as a design tool for
reducing environmental impact. Chapter Sections 6.3.2 and 6.3.3 have proven, that a Revit
representation of an iEE BIM LCA BPS can calculate building material quantities accurately.
Together, these two sections prove this thesis’ hypothesis to be true, and that is satisfies the
thesis’ aim of, developing a methodology for how to use a BIM LCA tool (Revit) correctly to
enable its effective integration into sketch design.
Chapter Six: Accuracy Assessment Results And Discussion
Using BIM To Calculate Accurate Building Material Quantities For Early Design Phase LCA
Author: Brian Berg 159
This Chapter Section, answers the research question for this thesis of, how detailed does the
Revit BIM model need to be to calculate accurate building material quantities for a building
material LCA (LCA) assessment?
6.5.1 How Detailed Is The Revit Pre-Calibration BIM Model?
Overall BIM Model Detail
To date, there is no standard practice for communicating the level of detail/development for
a BIM model at whole building level that enables a fair comparison of one BIM model’s detail
to another. Leite et al., (2011) faced this issue in their research investigating BIM modelling
effort, and modelling time relative to BIM modelled detail. The author’s followed standard
convention, and published their results of complexity based around the total number of BIM
objects used in their models. However, this approach lacks an expression of the building’s
size, which effects BIM geometry detail and complexity, and for LCA purposes, an expression
of the number of building materials being assessed. This is currently a gap in BIM research.
Recognising this gap, an expression of the total number of building materials being assessed is
an important parameter in a metric for communicating BIM model complexity for LCA
purposes. Table 6.5.1a presents a sample of metrics used to communicate BIM model
complexity. Many of these were developed for this thesis research, but may have an
application in wider BIM research if specifically tested and verified to be proven effective.
Comparing research results of BIM model complexity from Leite et al., (2011), to the pre-
calibration iEE Revit BIM LCA BPS model, the Revit model’s detail is almost equal between
the authors precise, and fabrication level of detail models. Comparing the total number of
BIM objects, the difference to the pre-calibration Revit BIM model is 66%, (-34%), and 233%
(+33), for the respective precise, and fabrication levels of detail. It was outside the scope of
this research to measure the time spent constructing the pre-calibration Revit BIM model,
however, as an approximate estimate is that it is similar to the 67.5 hours required by the
precise level of detail. Although, this was influenced by the modeller (Brian Berg) having to
use the Revit BIM tool for the first time, and the trial and error approach in developing an iEE
calculation methodology.

Chapter Six: Accuracy Assessment Results And Discussion
Using BIM To Calculate Accurate Building Material Quantities For Early Design Phase LCA
Author: Brian Berg 160
Leite et al., (2011) concluded that modelled time and effort, was directly linked to the
number of total BIM objects used in the BIM model. This is a combination of the time taken
to construct the BIM objects, and geometry. By comparison, for iEE purposes, this research
found that creating the BIM objects and embedding the necessary metadata, such as the
material, and building classification system codes, and descriptions, were the most time
intensive activities. Constructing the BIM geometry, was the easier, and therefore faster task
in the modelling process. This conclusion aligns with the wider research in iEE, where
reducing the number different building materials being accessed is the single most common
calculation complexity reduction technique used by building LCA researchers.
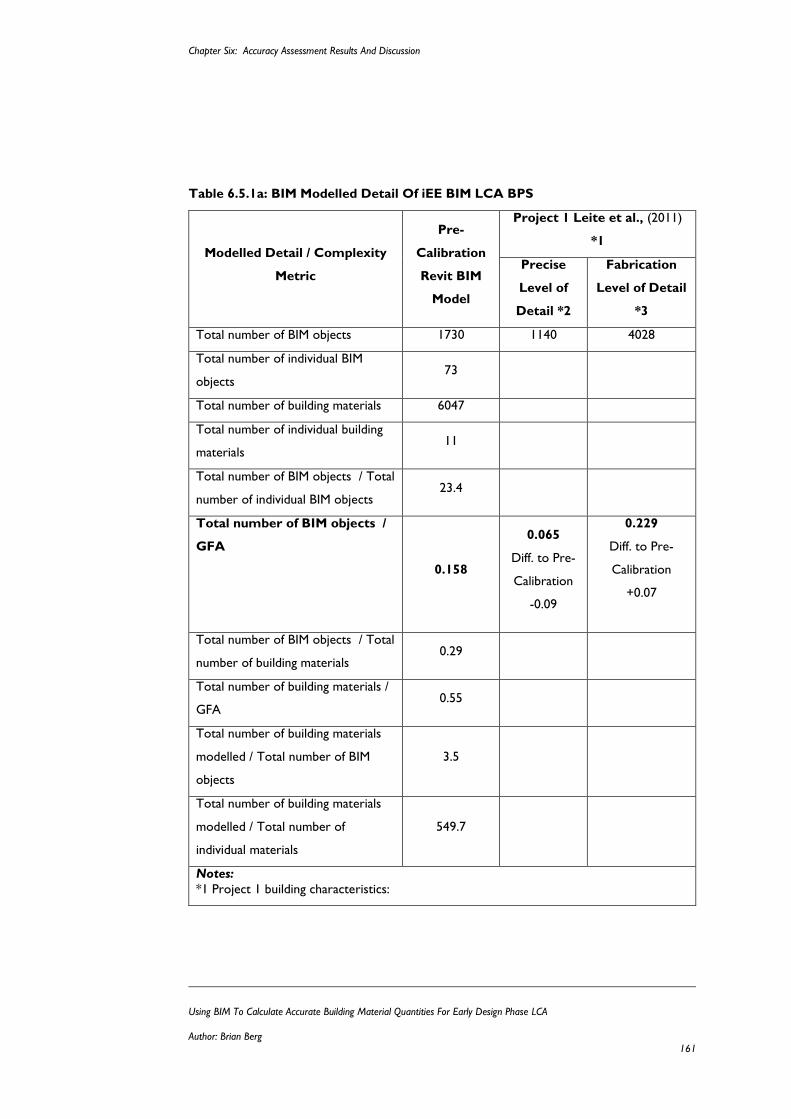
Chapter Six: Accuracy Assessment Results And Discussion
Using BIM To Calculate Accurate Building Material Quantities For Early Design Phase LCA
Author: Brian Berg 161
Table 6.5.1a: BIM Modelled Detail Of iEE BIM LCA BPS
Modelled Detail / Complexity
Metric
Pre-
Calibration
Revit BIM
Model
Project 1 Leite et al., (2011)
*1
Precise
Level of
Detail *2
Fabrication
Level of Detail
*3
Total number of BIM objects 1730 1140 4028
Total number of individual BIM
objects 73
Total number of building materials 6047
Total number of individual building
materials 11
Total number of BIM objects / Total
number of individual BIM objects 23.4
Total number of BIM objects /
GFA
0.158
0.065
Diff. to Pre-
Calibration
-0.09
0.229
Diff. to Pre-
Calibration
+0.07
Total number of BIM objects / Total
number of building materials 0.29
Total number of building materials /
GFA 0.55
Total number of building materials
modelled / Total number of BIM
objects
3.5
Total number of building materials
modelled / Total number of
individual materials
549.7
Notes:
*1 Project 1 building characteristics:
Chapter Six: Accuracy Assessment Results And Discussion
Using BIM To Calculate Accurate Building Material Quantities For Early Design Phase LCA
Author: Brian Berg 162
Project 1 Building GFA 189,000 sq ft, converted to 17558.7m2.
5 storey commercial office building.
Building elements modelled limited to foundations, external walls (brick veneer,
curtain wall), main structure (steel column and beams), and roof.
*2 Precise level of detail is equivalent to a best match 100-200 Level Of Development
*3 Fabrication level of detail is equivalent to a best match 400 Level Of Development
BIM Object Detail
For data confidentiality reasons, the identity of the case study building used in this research
must remain anonymous. This limits the use of visual imagery to describe the BIM modelled
detail required to produce an accurate pre-calibration Revit iEE BIM LCA BPS. As a solution,
the BIM Level Of Development (LOD) specification (Level of Development Specification,
2013) is used. This describes the detail of the specific BIM objects used in the Revit iEE BIM
LCA BPS model using an international specification, which is now a specified standard in the
newly developed New Zealand BIM Handbook specification (The Building and & Construction
Productivity Partnership, 2014).
Table 6.5.1b presents a breakdown of the 74 different BIM objects into 17 categories. The
remaining 57 BIM objects are simply different size variations of these 17 BIM objects. For
example, there were 18 different rectangular concrete beams, all modelled to a LOD of 200.
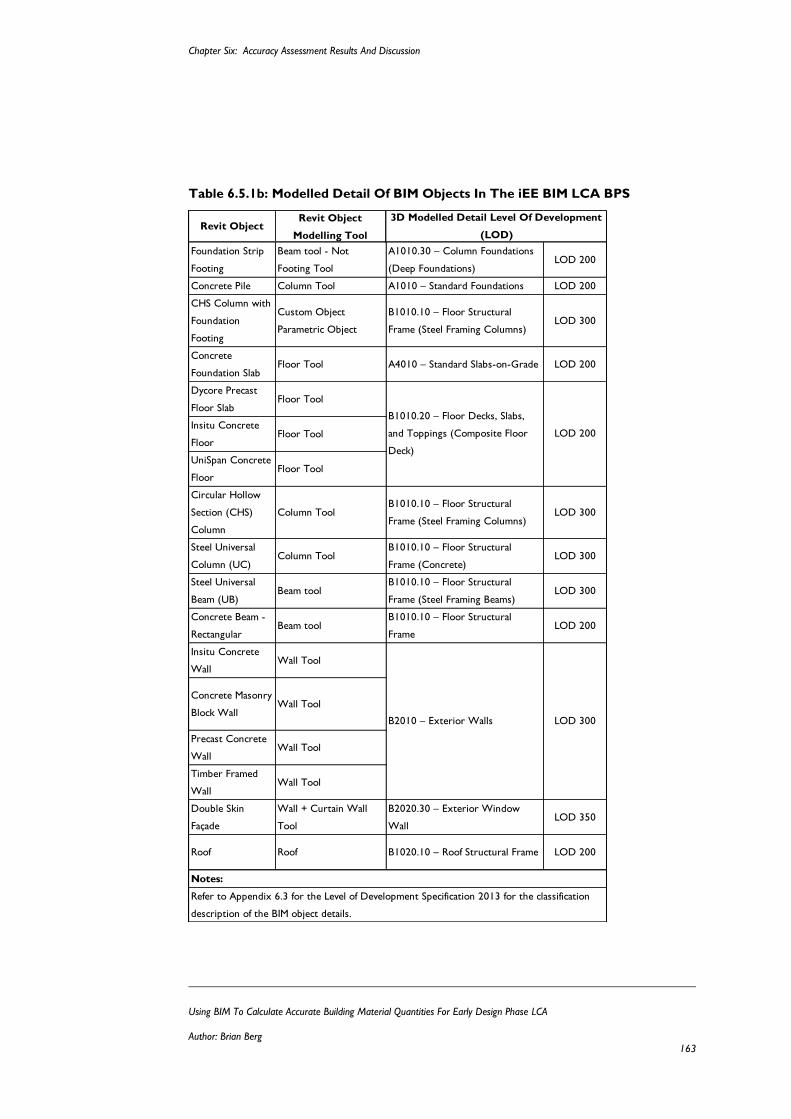
Chapter Six: Accuracy Assessment Results And Discussion
Using BIM To Calculate Accurate Building Material Quantities For Early Design Phase LCA
Author: Brian Berg 163
Table 6.5.1b: Modelled Detail Of BIM Objects In The iEE BIM LCA BPS
Revit ObjectRevit Object
Modelling Tool
Foundation Strip
Footing
Beam tool - Not
Footing Tool
A1010.30 – Column Foundations
(Deep Foundations)LOD 200
Concrete Pile Column Tool A1010 – Standard Foundations LOD 200
CHS Column with
Foundation
Footing
Custom Object
Parametric Object
B1010.10 – Floor Structural
Frame (Steel Framing Columns)LOD 300
Concrete
Foundation SlabFloor Tool A4010 – Standard Slabs-on-Grade LOD 200
Dycore Precast
Floor SlabFloor Tool
Insitu Concrete
FloorFloor Tool
UniSpan Concrete
FloorFloor Tool
Circular Hollow
Section (CHS)
Column
Column ToolB1010.10 – Floor Structural
Frame (Steel Framing Columns)LOD 300
Steel Universal
Column (UC)Column Tool
B1010.10 – Floor Structural
Frame (Concrete)LOD 300
Steel Universal
Beam (UB)Beam tool
B1010.10 – Floor Structural
Frame (Steel Framing Beams)LOD 300
Concrete Beam -
RectangularBeam tool
B1010.10 – Floor Structural
FrameLOD 200
Insitu Concrete
WallWall Tool
Concrete Masonry
Block WallWall Tool
Precast Concrete
WallWall Tool
Timber Framed
WallWall Tool
Double Skin
Façade
Wall + Curtain Wall
Tool
B2020.30 – Exterior Window
WallLOD 350
Roof Roof B1020.10 – Roof Structural Frame LOD 200
Notes:
Refer to Appendix 6.3 for the Level of Development Specification 2013 for the classification
description of the BIM object details.
B1010.20 – Floor Decks, Slabs,
and Toppings (Composite Floor
Deck)
B2010 – Exterior Walls
3D Modelled Detail Level Of Development
(LOD)
LOD 200
LOD 300
Chapter Six: Accuracy Assessment Results And Discussion
Using BIM To Calculate Accurate Building Material Quantities For Early Design Phase LCA
Author: Brian Berg 164
Overall the Revit iEE BIM LCA BPS model is predominantly a mix of BIM objects constructed
to a LOD 200 or 300. This classification is based on their 3D modelled information. The key
difference between LOD 200, and 300, is that LOD 200 is a representation of a generic
system. A LOD 200 BIM object is constructed from approximate dimensions, and therefore
can only calculate approximate material quantities. Some metadata is embedded, but this is
not a consistent requirement across all LOD 200 BIM objects (Level of Development
Specification, 2013, p. 10). By comparison, LOD 300 BIM objects represent specific systems,
and are constructed from specific dimensions, and they all must have metadata embedded
(Level of Development Specification, 2013, p. 10).
An iEE BIM LCA BPS sits between LOD level 200 and 300. A LOD 200 is not detailed
enough because it does not specify the detail required of 3D information to calculate building
the many different material quantities that are present in a single BIM object. A LOD 200
object is suitable for homogeneous single material layers such as, concrete walls, or concrete
beams. It is not suitable for homogeneous construction systems with multiple homogeneous
material layers, or for non-homogeneous material layers such as timber studs. In these cases
BIM objects must be modelled to a LOD of 300. Furthermore, the specification of metadata
is essential for conducting an iEE assessment, such as, material and element classification
system codes, and descriptions, is not a consistent requirement in LOD 200 BIM objects. A
LOD 300 BIM object does achieve this requirement. Visually, LOD suitability for the iEE BIM
LCA BPS is best illustrated by a wall BIM object. This example is presented in Table 6.5.1c.
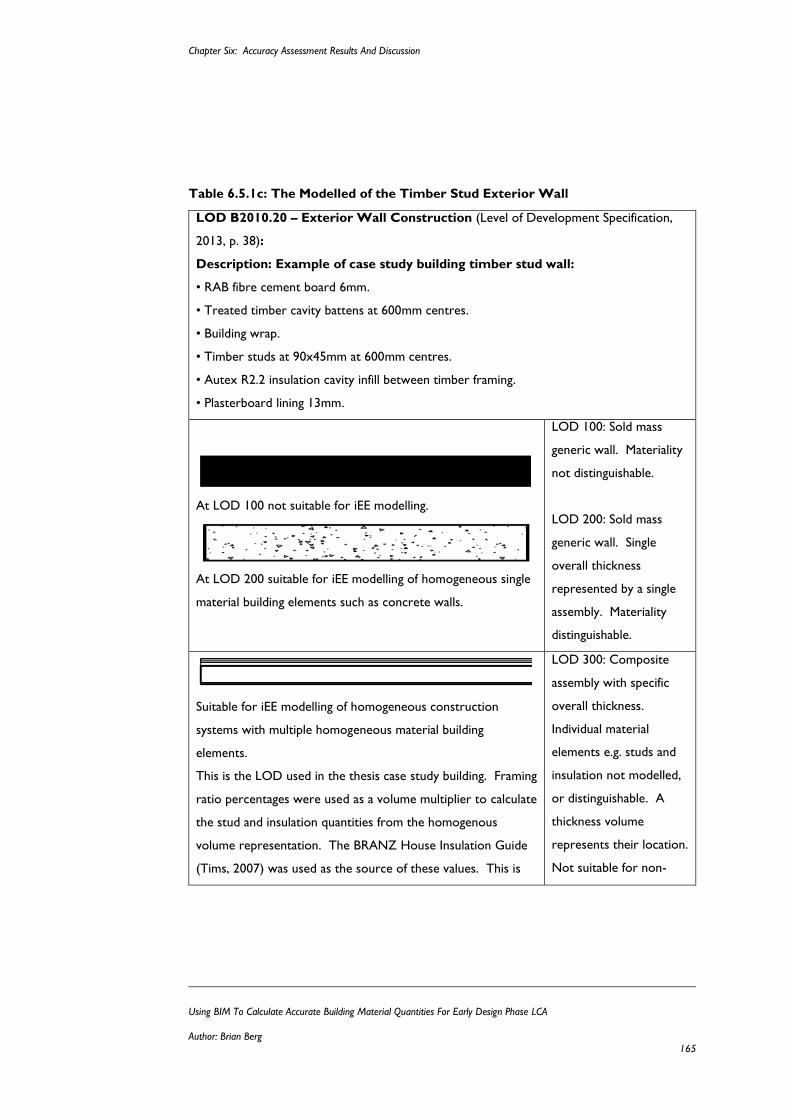
Chapter Six: Accuracy Assessment Results And Discussion
Using BIM To Calculate Accurate Building Material Quantities For Early Design Phase LCA
Author: Brian Berg 165
Table 6.5.1c: The Modelled of the Timber Stud Exterior Wall
LOD B2010.20 – Exterior Wall Construction (Level of Development Specification,
2013, p. 38):
Description: Example of case study building timber stud wall:
• RAB fibre cement board 6mm.
• Treated timber cavity battens at 600mm centres.
• Building wrap.
• Timber studs at 90x45mm at 600mm centres.
• Autex R2.2 insulation cavity infill between timber framing.
• Plasterboard lining 13mm.
At LOD 100 not suitable for iEE modelling.
At LOD 200 suitable for iEE modelling of homogeneous single
material building elements such as concrete walls.
LOD 100: Sold mass
generic wall. Materiality
not distinguishable.
LOD 200: Sold mass
generic wall. Single
overall thickness
represented by a single
assembly. Materiality
distinguishable.
Suitable for iEE modelling of homogeneous construction
systems with multiple homogeneous material building
elements.
This is the LOD used in the thesis case study building. Framing
ratio percentages were used as a volume multiplier to calculate
the stud and insulation quantities from the homogenous
volume representation. The BRANZ House Insulation Guide
(Tims, 2007) was used as the source of these values. This is
LOD 300: Composite
assembly with specific
overall thickness.
Individual material
elements e.g. studs and
insulation not modelled,
or distinguishable. A
thickness volume
represents their location.
Not suitable for non-
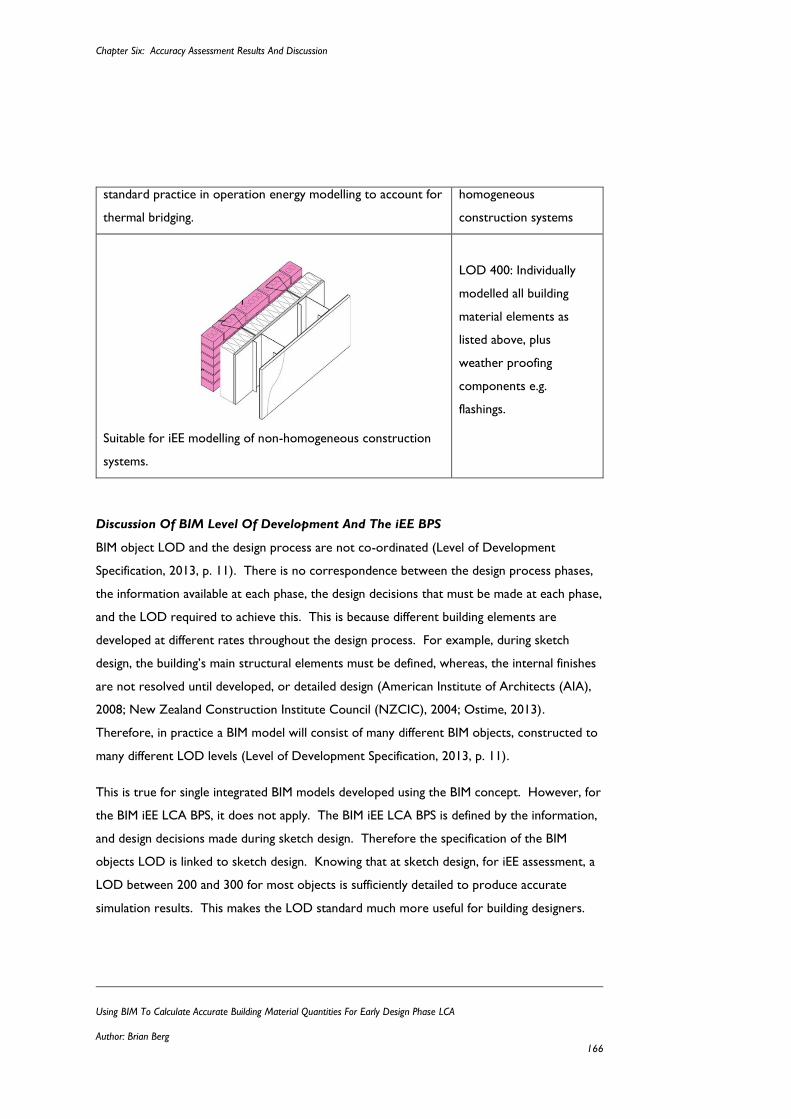
Chapter Six: Accuracy Assessment Results And Discussion
Using BIM To Calculate Accurate Building Material Quantities For Early Design Phase LCA
Author: Brian Berg 166
standard practice in operation energy modelling to account for
thermal bridging.
homogeneous
construction systems
Suitable for iEE modelling of non-homogeneous construction
systems.
LOD 400: Individually
modelled all building
material elements as
listed above, plus
weather proofing
components e.g.
flashings.
Discussion Of BIM Level Of Development And The iEE BPS
BIM object LOD and the design process are not co-ordinated (Level of Development
Specification, 2013, p. 11). There is no correspondence between the design process phases,
the information available at each phase, the design decisions that must be made at each phase,
and the LOD required to achieve this. This is because different building elements are
developed at different rates throughout the design process. For example, during sketch
design, the building’s main structural elements must be defined, whereas, the internal finishes
are not resolved until developed, or detailed design (American Institute of Architects (AIA),
2008; New Zealand Construction Institute Council (NZCIC), 2004; Ostime, 2013).
Therefore, in practice a BIM model will consist of many different BIM objects, constructed to
many different LOD levels (Level of Development Specification, 2013, p. 11).
This is true for single integrated BIM models developed using the BIM concept. However, for
the BIM iEE LCA BPS, it does not apply. The BIM iEE LCA BPS is defined by the information,
and design decisions made during sketch design. Therefore the specification of the BIM
objects LOD is linked to sketch design. Knowing that at sketch design, for iEE assessment, a
LOD between 200 and 300 for most objects is sufficiently detailed to produce accurate
simulation results. This makes the LOD standard much more useful for building designers.
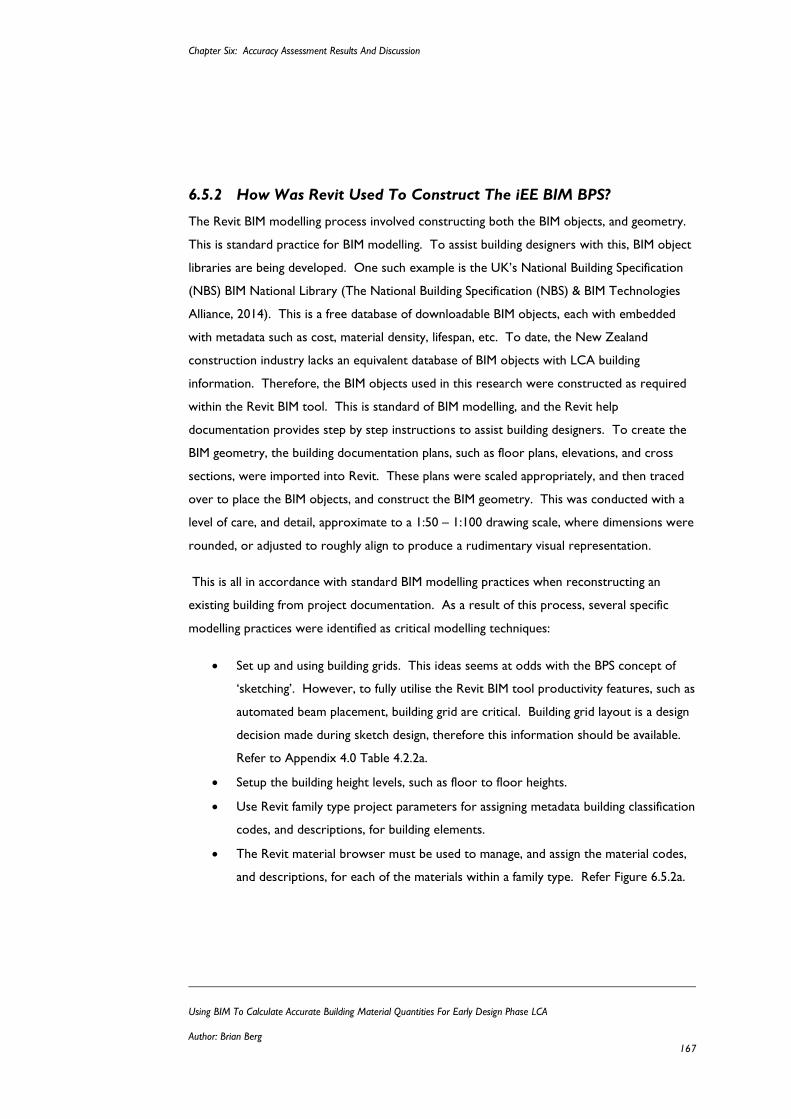
Chapter Six: Accuracy Assessment Results And Discussion
Using BIM To Calculate Accurate Building Material Quantities For Early Design Phase LCA
Author: Brian Berg 167
6.5.2 How Was Revit Used To Construct The iEE BIM BPS?
The Revit BIM modelling process involved constructing both the BIM objects, and geometry.
This is standard practice for BIM modelling. To assist building designers with this, BIM object
libraries are being developed. One such example is the UK’s National Building Specification
(NBS) BIM National Library (The National Building Specification (NBS) & BIM Technologies
Alliance, 2014). This is a free database of downloadable BIM objects, each with embedded
with metadata such as cost, material density, lifespan, etc. To date, the New Zealand
construction industry lacks an equivalent database of BIM objects with LCA building
information. Therefore, the BIM objects used in this research were constructed as required
within the Revit BIM tool. This is standard of BIM modelling, and the Revit help
documentation provides step by step instructions to assist building designers. To create the
BIM geometry, the building documentation plans, such as floor plans, elevations, and cross
sections, were imported into Revit. These plans were scaled appropriately, and then traced
over to place the BIM objects, and construct the BIM geometry. This was conducted with a
level of care, and detail, approximate to a 1:50 – 1:100 drawing scale, where dimensions were
rounded, or adjusted to roughly align to produce a rudimentary visual representation.
This is all in accordance with standard BIM modelling practices when reconstructing an
existing building from project documentation. As a result of this process, several specific
modelling practices were identified as critical modelling techniques:
Set up and using building grids. This ideas seems at odds with the BPS concept of
‘sketching’. However, to fully utilise the Revit BIM tool productivity features, such as
automated beam placement, building grid are critical. Building grid layout is a design
decision made during sketch design, therefore this information should be available.
Refer to Appendix 4.0 Table 4.2.2a.
Setup the building height levels, such as floor to floor heights.
Use Revit family type project parameters for assigning metadata building classification
codes, and descriptions, for building elements.
The Revit material browser must be used to manage, and assign the material codes,
and descriptions, for each of the materials within a family type. Refer Figure 6.5.2a.
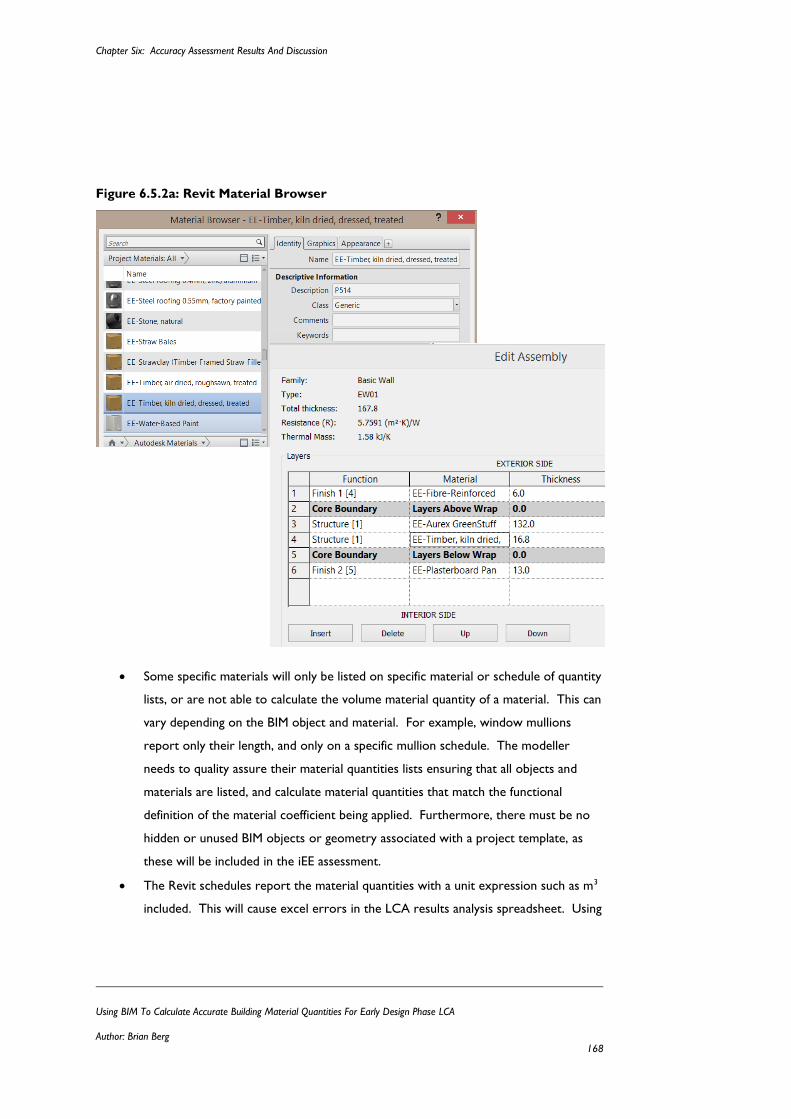
Chapter Six: Accuracy Assessment Results And Discussion
Using BIM To Calculate Accurate Building Material Quantities For Early Design Phase LCA
Author: Brian Berg 168
Figure 6.5.2a: Revit Material Browser
Some specific materials will only be listed on specific material or schedule of quantity
lists, or are not able to calculate the volume material quantity of a material. This can
vary depending on the BIM object and material. For example, window mullions
report only their length, and only on a specific mullion schedule. The modeller
needs to quality assure their material quantities lists ensuring that all objects and
materials are listed, and calculate material quantities that match the functional
definition of the material coefficient being applied. Furthermore, there must be no
hidden or unused BIM objects or geometry associated with a project template, as
these will be included in the iEE assessment.
The Revit schedules report the material quantities with a unit expression such as m3
included. This will cause excel errors in the LCA results analysis spreadsheet. Using
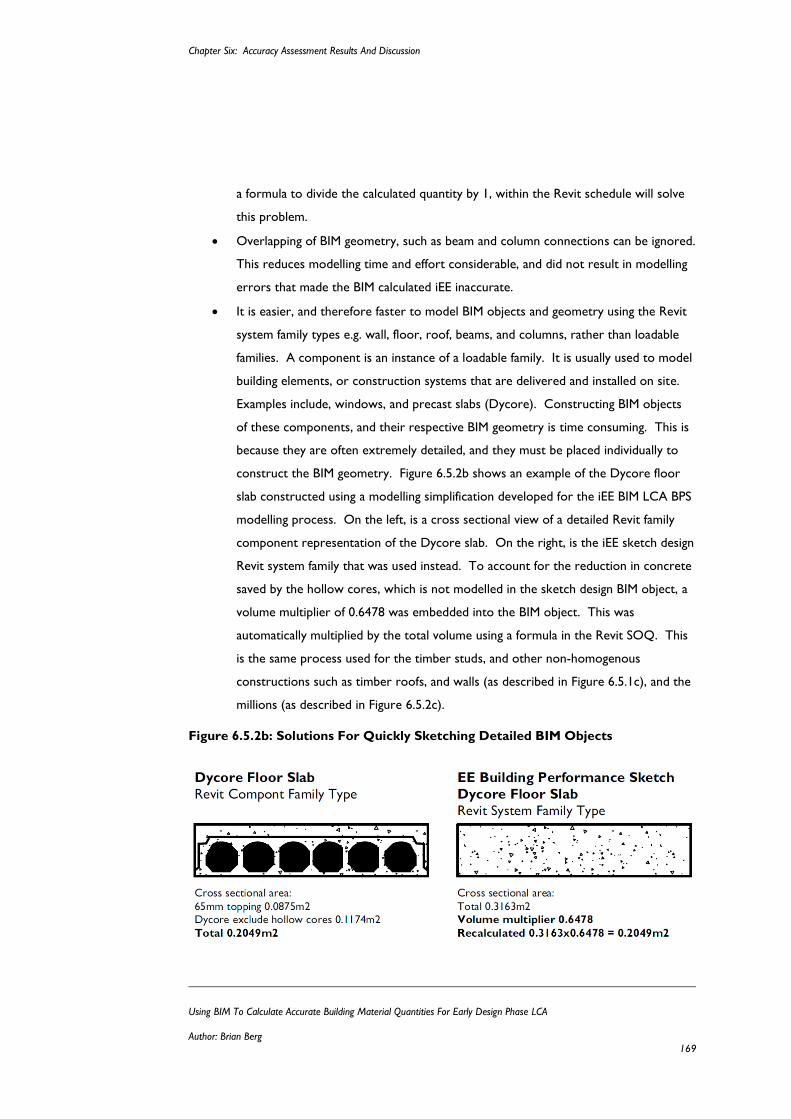
Chapter Six: Accuracy Assessment Results And Discussion
Using BIM To Calculate Accurate Building Material Quantities For Early Design Phase LCA
Author: Brian Berg 169
a formula to divide the calculated quantity by 1, within the Revit schedule will solve
this problem.
Overlapping of BIM geometry, such as beam and column connections can be ignored.
This reduces modelling time and effort considerable, and did not result in modelling
errors that made the BIM calculated iEE inaccurate.
It is easier, and therefore faster to model BIM objects and geometry using the Revit
system family types e.g. wall, floor, roof, beams, and columns, rather than loadable
families. A component is an instance of a loadable family. It is usually used to model
building elements, or construction systems that are delivered and installed on site.
Examples include, windows, and precast slabs (Dycore). Constructing BIM objects
of these components, and their respective BIM geometry is time consuming. This is
because they are often extremely detailed, and they must be placed individually to
construct the BIM geometry. Figure 6.5.2b shows an example of the Dycore floor
slab constructed using a modelling simplification developed for the iEE BIM LCA BPS
modelling process. On the left, is a cross sectional view of a detailed Revit family
component representation of the Dycore slab. On the right, is the iEE sketch design
Revit system family that was used instead. To account for the reduction in concrete
saved by the hollow cores, which is not modelled in the sketch design BIM object, a
volume multiplier of 0.6478 was embedded into the BIM object. This was
automatically multiplied by the total volume using a formula in the Revit SOQ. This
is the same process used for the timber studs, and other non-homogenous
constructions such as timber roofs, and walls (as described in Figure 6.5.1c), and the
millions (as described in Figure 6.5.2c).
Figure 6.5.2b: Solutions For Quickly Sketching Detailed BIM Objects
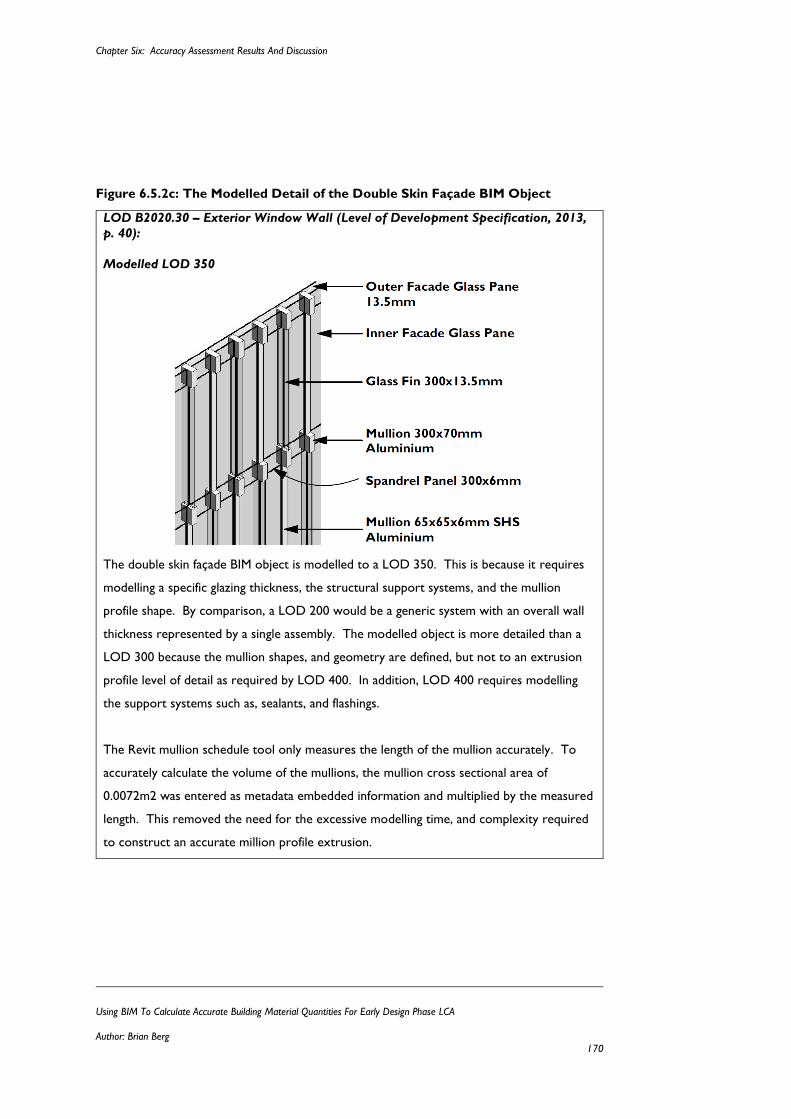
Chapter Six: Accuracy Assessment Results And Discussion
Using BIM To Calculate Accurate Building Material Quantities For Early Design Phase LCA
Author: Brian Berg 170
Figure 6.5.2c: The Modelled Detail of the Double Skin Façade BIM Object
LOD B2020.30 – Exterior Window Wall (Level of Development Specification, 2013,
p. 40):
Modelled LOD 350
The double skin façade BIM object is modelled to a LOD 350. This is because it requires
modelling a specific glazing thickness, the structural support systems, and the mullion
profile shape. By comparison, a LOD 200 would be a generic system with an overall wall
thickness represented by a single assembly. The modelled object is more detailed than a
LOD 300 because the mullion shapes, and geometry are defined, but not to an extrusion
profile level of detail as required by LOD 400. In addition, LOD 400 requires modelling
the support systems such as, sealants, and flashings.
The Revit mullion schedule tool only measures the length of the mullion accurately. To
accurately calculate the volume of the mullions, the mullion cross sectional area of
0.0072m2 was entered as metadata embedded information and multiplied by the measured
length. This removed the need for the excessive modelling time, and complexity required
to construct an accurate million profile extrusion.
Chapter Seven: Thesis Conclusions
Using BIM To Calculate Accurate Building Material Quantities For Early Design Phase LCA
Author: Brian Berg 171
Chapter Seven:
7 THESIS CONCLUSIONS
7.1 Conclusions Surrounding The Failings Of BIM LCA
Tools
This thesis research aimed to improve the integration of LCA into the early phases of the
design process (sketch design) by developing a methodology for using BIM LCA tools quickly,
easily, and accurately. The intent is to increase building designers using them as a sketch
design phase design tool for lowering the environmental impact of building’s design. This
thesis explored a fundamental issue causing excessive complexities when conducting a
building material LCA assessments, the calculation of accurate building material quantities.
Within the context of BIM LCA tools, this posed the research question of:
“How detailed does a BIM model need to be to calculate accurate LCA (LCA) results?”
BIM (BIM) LCA tools were developed to solve the problems associated with the LCA
calculation complexities, specifically those involved in calculating building material quantities.
Research has proven that BIM LCA tools do reduce calculation complexity, and that they do
have the request technical capabilities to produce LCA results. However, this thesis found
no research that has investigated if BIM LCA tools can do this, while fulfilling requirements
that ensure its integration into sketch design is effective. Such requirements are well
documented, and stipulate that design tools must be:
Developed to fit within the day-to-day realities of work practices, processes, and
into building design tools building designers actually use.
Capable of rapidly testing a multitude of different design iterations, whilst ensuring
the simulation results are accurate, and trusted enough to enable the design team to
make informed design decisions to achieve their project’s performance goals.
Chapter Seven: Thesis Conclusions
Using BIM To Calculate Accurate Building Material Quantities For Early Design Phase LCA
Author: Brian Berg 172
A critique of the existing BIM LCA tools, IMPACT, and Tally, concluded that the current
methodology focusing them, the BIM concept’s single integrated BIM model, did not satisfy
the requirements of effective integration. The specific cause is that it takes too long to
construct a single integrated BIM model. As a result, by the time the model is completed, the
building design process has progressed beyond the sketch design phase, and therefore, the
time in the building design process when design changes for lowering environmental impact
can most effectively be tested, and implemented. The primary cause of this excessive BIM
modelling time is that there is no defined best practice method for how to conducting an
accurate sketch design phase LCA assessment. Absent, are definitions for:
What building material information e.g. individual materials, and their quantities,
must be modelled?
How detailed the BIM model must be to represent, and calculate the required
building material information?
Lacking these definitions, the BIM concept advocates modelling every aspect of the building’s
design in the highest level of detail possible, during each phase of the design process. As a
result, instead of resolving the problem that LCA remains unused by building designers, this
thesis research concluded that the current BIM concept methodology contributes to it.
In respect to meeting the requirements of effective integration, the BIM concept is
fundamentally is flawed. Therefore, to realise this thesis’ aim, an alternative methodology
concept had to be applied to BIM LCA tools. The BPS concept (BPS) developed by Donn et
al., (2012) is the most appropriate. Being derived from the requirements of effective
integration, developing a BIM LCA BPS would achieve effective integration of LCA into sketch
design. However, a critique of the BPS framework concluded that, like the BIM concept, it
also lacked the same specific details and definitions of a best practice method dictating how to
conducting an accurate sketch design phase LCA assessment. Translated, this informed the
thesis results hypothesis, whereby, defining the accuracy required for EE (EE) simulations, a
BIM model of sketch design detail will calculate building material quantities accurately enough
for a building material LCA assessment.
Chapter Seven: Thesis Conclusions
Using BIM To Calculate Accurate Building Material Quantities For Early Design Phase LCA
Author: Brian Berg 173
7.2 Proving The Thesis Hypothesis
Testing the thesis hypothesis involved using the BIM tool Revit, to calculate building material
quantities, and normalise them to an iEE result so they are comparable to a truth model SOQ
(SOQ). This enabled the accuracy of the simulation to be tested, to determine if the BIM
model is sufficiently detailed to calculate these results accurately enough.
Testing this hypothesis, three methodology research objectives had to be fulfilled, and then
tested. This are discussed below in Chapter Sections 7.2.1 and 7.2.2. The outcome of this
process, concluded that the BIM LCA BPS methodology does fulfil the thesis aim of enabling
the effective integration of LCA into sketch design. Evidence of this comes from the three
hypothesis tests conducted in Chapter 6.0, and discussed below.
7.2.1 Conclusions: Is A Sketch Design iEE BPS Assessment Complete
Enough?
The first hypothesis test was of the completeness of a sketch design iEE LCA BPS. This
tested determined that the sketch design iEE LCA BPS assesses enough of a building’s total
iEE to be useful for sustainable building design, and that it is detailed enough to produce
accurate results.
The iEE LCA BPS is made up of the roof, substructure, wall and barrier, upper floor, and
substructure building elements. These are the elements that influence, or are influenced, by
the most important design decisions that must be considered if the building is to be designed
to have the lowest environmental impact possible. Traditionally, these changes have been
passive design solutions for reducing Operative Energy (OE) consumption, not iEE. Such
changes can severely alter the building’s form, and function. Therefore, to be effective, they
must be designed, iteratively tested, and resolved during sketch design. The case study
building iEE results showed that an iEE LCA BPS of detailed design information represents 3.6
GJ/m2 GFA, or 59.6% of the fully detailed as-built SOQ (SOQ) iEE assessment. This means
that the design decisions made for OE during sketch design, also impact on the majority of a
building’s total iEE.
Chapter Seven: Thesis Conclusions
Using BIM To Calculate Accurate Building Material Quantities For Early Design Phase LCA
Author: Brian Berg 174
The importance of iEE is also greatly underestimated in building design. Typically reported as
accounting for 7.8 years of total annual OE, approximately 81.7 kWh/m2 GFA (Yung et al.,
2013, p. 49). The initial iEE of this case study showed that the 3.6 GJ/m2 GFA equates to
between 41.4 years, for an EUI of 33.1 kWh/m2 NLA, and 72.3 years, for an EUI of 57.9
kWh/m2 NLA, of annual OE. This is between 5.3 and 9.3 times greater than what is
commonly accepted as typical for existing office buildings. This reinforces the obvious
relationship that as a building’s OE consumption is reduced, the importance of iEE increases.
The conclusion reached from this research, is that building designers must consider iEE as
part of the design decision-making process, as it is far more important than commonly
believed. Even if the OE of this thesis’ case study building’s EUI were to be to the New
Zealand average EUI of 150 kWh/m2 GFA for commercial buildings, the iEE would equate to
16.0 years’ of annual OE consumption. This is still a significant proportion of a building’s 50
year design life.
The level of influence iEE design changes have on a building is also under appreciated.
Changing structural systems from concrete to timber is one common iEE design solution.
Typically, this reduces iEE by 13%. Applied to this thesis case study building’s OE worst case
payback scenario of 57.9 kWh/m2 NLA, this equates to between 5.4 years of OE, or 2.1
years for New Zealand average commercial building EUI. Compared to an OE design
solution, a 60% U-Value improvement (reducing the U-vale) in window façade design, is
reported as achieving an 8% annual OE saving. This would take 25.9 years to equal the iEE
structural design change, even if the OE was equal to the New Zealand average commercial
building EUI. For the case study building’s actual OE, this is 67.2 years. The conclusion
reached from this, is that while the total scope of OE design solutions will have the greater
influence on reducing environmental impact, iEE needs to be jointly considered. Even in
buildings designed to existing building stock EUI levels, iEE is important. When the average
commercial building design’s OE EUI’s decreases towards levels common of Net Zero Energy
Buildings (NZEB), 47.2 kWh/m2 GFA, like this thesis case study building, iEE is going to
become even more significant.
Having redefined the importance of iEE in sustainable building design, making it easier, by
making it faster for building designers to accurately calculate it becomes even more
important. The iEE BPS of detailed design information was proven to represents enough iEE
Chapter Seven: Thesis Conclusions
Using BIM To Calculate Accurate Building Material Quantities For Early Design Phase LCA
Author: Brian Berg 175
to be useful for building design decision-making. However, this is based on information not
available until after these decisions must be made. This thesis research, examined if sketch
design information could also be complete enough. The iEE LCA BPS of sketch design
information represented 3.0 GJ/m2 GFA, or 57.7% of the fully detailed as-built SOQ (SOQ)
iEE assessment. This was only a 1.9% reduction compared to the iEE LCA BPS of detailed
design information. The significance being that only 1.9% less, is that only 1.9% of the
required iEE information is lost if conducting this this assessment during sketch design, when
the results can be most effectively implemented. For building designers, this proves they can
conduct detailed enough iEE assessments of the most influential design decisions during
sketch design, using the design processes and practices they already use do, and use. This is
possible because their current design process produces the requisite building information
when required, and to the level of detail required. Therefore, all they require is the BIM LCA
tool, complete with a BPS methodology defining how detailed the BIM model must be to
calculate these results, while making the assessment easier, and faster.
7.2.2 Conclusions: Does A BIM Model Calculate Accurate iEE BIM LCA
BPS Results?
The second hypothesis test was of the methodology for using the BIM tool Revit, and if it
could calculate the iEE LCA BPS sketch design results accurately. The critical component in
this test was how detailed did the Revit BIM model need to be?
This was tested by using the iEE simulation calibration accuracy assessment framework. The
iEE BIM LCA BPS was considered accurate if the material and elemental analysis results for
MBE and Cv(RSME) were below the range of ±10-20%, and 15-30% respectfully.
The pre-calibration BIM model passed the decision-making simulation accuracy requirements
with an MBE accuracy of 12.5%, but it failed the Cv(RSME) precision requirements. Failure
was due to human error, and differences in the formatting between the Revit calculated
results and the truth model. These were errors easily corrected, and unlikely to impact on a
building designer using this method. The post calibration BIM model with these corrections
passed both maximum acceptable calibration metrics with an MBE of +1.1%, and Cv(RSME) of
3.7% and 3.1% for material and elemental analysis. This proves the thesis hypothesis true,
whereby defining the EE simulation accuracy requirements as MBE ±10-20%, and Cv(RSME)
Chapter Seven: Thesis Conclusions
Using BIM To Calculate Accurate Building Material Quantities For Early Design Phase LCA
Author: Brian Berg 176
15-30%, a BIM model of sketch design detail is sufficiently detailed to calculate the building
material quantities accurately enough to satisfy them, and be used for building material LCA
assessments.
The pre-calibration iEE BIM model was constructed by tracing over the project
documentation. Care was taken to ensure the truth model 3 results did not influence this
modelling process, to recreate the fact that building designers will not have access to a truth
model when designing a new building. As per standard sketch design modelling practices, the
BIM model was constructed ignoring overlapping geometry, such as beam and column joins,
and the BIM geometry roughly constructed to an approximate ±50mm to ±100mm in
rounding of member lengths, and spacing. This is much less precise than typical BIM or CAD
drawing conventions during detailed design, which did cause a combined cancellation error in
the building material analysis of 4.3% of the total 3.0 GJ/m2 GFA in the post calibration
model. However, no individual material had an error greater than 1.0%, and the robustness
tests proved that the imprecise modelling of BIM geometry that caused cancellation errors
were not an influence on simulation accuracy that detracted from the building designer’s
ability to make design decisions.
To produce accurate iEE results from an iEE BIM LCA BPS model requires no more
additional information, or modelling effort than building designers already have and do during
sketch design. The conclusion reached, is that building designers can easily use their existing
sketch design modelling processes, and practices for creating BIM models, to produced
accurate iEE results during sketch design.
7.3 Answering The Thesis Research Question:
7.3.1 How Detailed Is An Accurate iEE BIM LCA BPS Model?
Having proved that a BIM model, and the Revit BIM tool can calculate accurate building
material quantities that can be used for a building material LCA assessment, answering the
research question is the description of how detailed the pre and post calibration iEE BIM LCA
BPS model were. Due to data confidentiality reasons, the identity of the case study building
must remain anonymous. This meant that specific images cannot be used to answer this
question. Therefore, using the BIMFORUM’S 2013 Level Of Development (LOD)
Chapter Seven: Thesis Conclusions
Using BIM To Calculate Accurate Building Material Quantities For Early Design Phase LCA
Author: Brian Berg 177
specification, the BIM objects constituting the iEE BIM LCA BPS model are mix of
predominantly LOD 200 and 300. The double skin façade is the exception, requiring a LOD
of 350.
Overall the BIM model had 73 unique BIM objects, constituting a BIM geometry of 1730 total
BIM object instances. Compared to research conducted Leite et al., (2011), the iEE BIM LCA
BPS model is a detail equivalent to the middle of their definitions, precise, and fabrication
detail levels. This is significantly less detailed than the LOD 400 BIM object shown in the
tutorial for the BIM LCA tool Tally. The conclusion reached is that building designers do not
have to construct a BIM model as detailed as the Tally tutorial indicates for calculating iEE or
other LCA-based indicators. This has the effect of reducing modelling time, and effort, and
makes the LCA calculation process easier.
7.4 iEE And LCA Conclusions Beyond This Research
Having no definitive definition for the level of detail a SOQ must be for EE or LCA
assessment, there is a risk that significant variation exits between building projects. This may
have an influence on the completeness testing, and suitability of the iEE BIM LCA BPS to
represent enough of a building’s total iEE to be useful. As a quality assurance check, the iEE
BIM LCA BPS simplification framework was applied to case study results published by Y. L.
Langston & Langston (2012). The iEE BIM LCA BPS represented 40.1% of the total iEE. This
was a reduction of 17.6% compared to the thesis case study building. This 40.1% is still a
significant proportion, proving outside this thesis research case study that conducting an iEE
assessment during sketch design is worth doing.
This conclusion highlighted the need for building researchers to define based on LCA-based
indicators, the detail a SOQ must be to produce accurate results. This thesis research has
adhered to existing best practices, and defined them as the truth models. This means the
methodology for using BIM tools to calculate accurate iEE results is limited to calculating
results that are accurate to current best practices that are based on cost planning, not iEE or
LCA.
Lacking a defined assessment criteria for iEE or LCA simulation accuracy, one had to be
developed to test this thesis’ hypothesis. The critical component of the iEE calibration
Chapter Seven: Thesis Conclusions
Using BIM To Calculate Accurate Building Material Quantities For Early Design Phase LCA
Author: Brian Berg 178
accuracy assessment framework is the definition of how close is close enough? This is
expressed by the maximum acceptable calibration tolerances, MBE for accuracy, and
Cv(RSME) for precision. The values for these two metrics were derived from cost planning,
and OE respectfully. They are only a working definition used to conduct this research. Their
values were selected based on the calibration accuracy assessment guidelines set by the
United States Department Of Energy (US DOE) M&V Guidelines (2008, pp. 4–20) that
suggests that whenever project specific calibration tolerances are required, that “specific
calibration goals should be set for each project based on the appropriate level of effort […]”.
Based on the results of this research, the conclusion can be made that both the MBE, and
Cv(RSME) values selected, ±10-20%, and 15-30%, are too lenient. The iEE BIM LCA BPS by
its very definition equals an appropriate level of modelling effort, and it calculated both the
MBE and Cv(RSME) metrics below 5%. This suggests that 5% may be a more appropriate
value for both MBE and Cv(RSME) for EE or LCA accuracy assessment. However, further
research is required to substantiate this conclusion.
7.5 Key Outputs Of Thesis Research
The following items are a list of the tools, and the definitions that were developed as part of
this research to assist building designers in conducting an iEE assessment.
The EE Data Quality Indicator Pedigree Matrix for assisting building designers in the
selection of the most appropriate iEE databases.
A methodology for using the BIM Too Revit for calculating LCA-based indicators
without the need for specialist software, such as the BIM LCA tools IMPACT, and
Tally. This removes the need for building designers to purchase this additional
software.
The LCA results analysis spreadsheet. This is a Microsoft Excel document that
automate the multiplication of building material coefficients by building material
quantities, and organises the results for analysis.
The iEE benchmark database for commercial office buildings classified by building
structural system. This assists in both the quality assurance of iEE simulation results,
and the setting of iEE performance goals.
Chapter Seven: Thesis Conclusions
Using BIM To Calculate Accurate Building Material Quantities For Early Design Phase LCA
Author: Brian Berg 179
The definition of iEE maximum acceptable calibration tolerances defining iEE
simulation accuracy, where MBE <±10-20%, and Cv(RMSE) <15-20%.
The definition of iEE best practice modelling practices. For EE material coefficients,
best practice is defined as either of the two EE hybrid coefficient calculation
methods. For estimating building material quantities, best practice is defined as a
SOQ based on cost planning.
7.6 BIM Conclusions Beyond This Research
The use of BIM was a critical component to this thesis research. The results proved that a
BIM model can be used for LCA assessments of building materials. However, it highlighted a
number of gaps in current BIM practices within the New Zealand construction industry.
Compared to the United Kingdom, and the United States of America, the New Zealand
construction industry is far behind in the research, development, implementation, and use of
BIM. However, the 2013 National BIM Survey identified that the construction industry’s use
of BIM is forecasted to increase significantly in 1-5 years’ time. The following four
conclusions are recommendations for the development of BIM support systems that the New
Zealand construction industry must developed for BIM to be used successful in New Zealand.
Firstly, the New Zealand construction industry lacks the support tools necessary for using a
BIM model effectively. The most time consuming component of the iEE BIM LCA BPS
modelling process was constructing the 73 unique BIM objects. Not limited to their 3D form,
this included finding, and embedding the necessary metadata, e.g. the material and element
building classification codes and descriptions. The New Zealand construction industry needs
a free national BIM library of BIM objects, which have the necessary metadata embedded
from manufacturers for building products, and materials. The UK’s NBS National BIM Library
is one precedent to consider.
Secondly, underpinning all BIM modelling is a building classification system. This is used in
BIM objects, BIM geometry, the analysis of results such as cost, and LCA indicators, and the
organisation of building specifications and BIM object libraries. The New Zealand
construction industry currently uses the Co-ordinated Building Information (CBI) system.
This is based on the now superseded European CAWS (Common Arrangement of Work
Chapter Seven: Thesis Conclusions
Using BIM To Calculate Accurate Building Material Quantities For Early Design Phase LCA
Author: Brian Berg 180
Sections) building classification system, which has been replaced by the redeveloped UniClass
(UniClass 2.0). UniClass 2.0 is compliant with ISO 12006. The ISO 12006 standard was
developed to standardise international building classification systems, to improve the sharing
of building information between countries. This is particularly important for New Zealand,
with its high volume of building related imports, and exports. The New Zealand construction
industry needs to develop an ISO 12006 compliant building classification system for this, and
to use BIM effectively. Internationally, the UK and USA are already doing this, developing
their respective UniClass 2.0, and OmniClass building classification systems.
Thirdly, the current methods of describing BIM modelled detail need to be improved. The
BIMFORUMS LOD specification is an adequate starting point. However, to be truly useful
for building designers, LOD requirements for BIM objects must be aligned to the
requirements of the design process, and the specific requirements for building performance
simulation. For example, the iEE LCA BPS method has defined that to produce an accurate
iEE result, a BIM model of sketch design information must consist of BIM objects with a LOD
of 200-300, that constitute the BIM geometry for the roof, substructure, wall and barrier,
upper floor, and substructure building elements. Developing an equivalent set of BIM best
practice modelling guidelines for other areas of building performance is needed.
The final issue of BIM interoperability. BIM interoperability encompasses both cultural, and
technology concepts. The cultural concepts defines how the design team works,
communicates, and shares building information, e.g. how to use the BIM tool and model. In
contrast, the technology concept is simply the means for making cultural BIM interoperability
possible. A conclusion from this research, is that this definition is misunderstood within the
New Zealand construction industry. Commonly interoperability is just thought of as file
sharing, and IFC models. Those that do use BIM models, and tools do not embrace the full
cultural concept of BIM which is where the true potential of BIM lies. The main problem, is
that to be truly effective, the information required of a BIM model needs to be better defined.
The current standard practice of constructing a fully detailed iBIMis not used by the New
Zealand construction industry, and is likely to never be standard practice. This is because
constructing these models is too time consuming for them to be effective. Instead, by
defining what information must be in a BIM model, for a specific purpose, as the iEE BIM LCA
BPS methodology did, BIM will be far more useful for the construction industry.
Using BIM To Calculate Accurate Building Material Quantities For Early Design Phase LCA
Author: Brian Berg 181
WORKS CITED
Alcorn, A. (2010). Global Sustainability and the New Zealand House (PhD Thesis). Victoria
University of Wellington, Wellington New Zealand.
American Institute of Architects (AIA). (2007). Integrated Project Delivery: A Guide.
American Institute of Architects (AIA). Retrieved from
http://www.aia.org/about/initiatives/AIAS076981
American Institute of Architects (AIA). (2008). The Architect’s Handbook of Professional Practice
(14th Edition). New Jersey U.S.A: John Wiley & Sons Inc.
Annex 57: “Evaluation of Embodied energy and Carbon Dioxide Emissions for Building
Construction.” (n.d.). Retrieved January 22, 2014, from http://www.annex57.org/
ASHRAE. (2002). ASHRAE Guideline 14-2002: Measurement of Energy and Demand Savings.
ASHRAE Standards Committee. Retrieved from
https://gaia.lbl.gov/people/ryin/public/Ashrae_guideline14-
2002_Measurement%20of%20Energy%20and%20Demand%20Saving%20.pdf
Ashworth, A., Hogg, K., & Higgs, C. (2007). Willis’ Practice and procedure for the Quantity
Surveyor (12th Edition). Oxford England: Blackwell Publishing Ltd.
Attia, S. (2012). A Tool for Design Decision Making: Zero Energy Residential Buildings in Hot Humid
Climates (PhD Thesis). Louvain School of Engineering, Louvain-La-Neuve, Belgium.
Retrieved from
http://www.google.co.nz/url?sa=t&rct=j&q=&esrc=s&source=web&cd=5&cad=rja&ve
d=0CD8QFjAE&url=http%3A%2F%2Fwww.bwk.tue.nl%2Fbps%2Fhensen%2Fteam%2

Using BIM To Calculate Accurate Building Material Quantities For Early Design Phase LCA
Author: Brian Berg 182
Fpast%2FAttia.pdf&ei=GkwBU63HDOWUiAeq94DoAw&usg=AFQjCNG6dBahNNl
4CDbHL8ppFcK4Nh35Gg&sig2=G72mwGBrx0SOItV0fyJjqw&bvm=bv.61535280,d.a
Gc
Augenbroe, G. (1992). Integrated building performance evaluation in the early design stages.
Building and Environment, 27(2), 149 – 161. http://doi.org/10.1016/0360-
1323(92)90019-L
Augenbroe, G. (2002). Trends in building simulation. Building and Environment, 37(8–9), 891–
902. http://doi.org/10.1016/S0360-1323(02)00041-0
Baird, G., & Chan, S. A. (1983). Energy Cost of Houses and Light Construction (No. 76).
Wellington New Zealand: School of Architecture , Victoria University of Wellington.
Bensouda, N. (2004). Extending and formalizing the energy signature method for calibrating
simulations and illustrating with application for three California climates (Master’s Thesis).
Texas A&M University, Texas USA. Retrieved from
http://repository.tamu.edu/bitstream/handle/1969.1/1080/etd-tamu-2004B-MEEN-
Bensouda-2.pdf?sequence=1
Berggren, B., Hall, M., & Wall, M. (2013). LCE analysis of buildings – Taking the step towards
Net Zero Energy Buildings. Energy and Buildings, 62(0), 381–391.
http://doi.org/10.1016/j.enbuild.2013.02.063
Bishop, R., & Isaacs, N. (2012). Building Energy End-use Study (BEES) Year 5: Energy use outliers
(No. SR277/3). Wellington New Zealand: BRANZ. Retrieved from
http://www.branz.co.nz/cms_show_download.php?id=18e079430fb7917f536ee7488b
865d7ababceab4
Björklund, A. E. (2002). Survey of approaches to improve reliability in LCA. The International
Journal of Life Cycle Assessment, 7(2), 64–72.
Using BIM To Calculate Accurate Building Material Quantities For Early Design Phase LCA
Author: Brian Berg 183
Bownass, D. (2001). Building Services Design Methodology: A Practical Guide. London: Spon Press.
Brand, S. (1994). How buildings learn: What happens after they’re built. London: Phoenix
Illustrated.
Bribián, I. Z., Usón, A. A., & Scarpellini, S. (2009). Life cycle assessment in buildings: State-of-
the-art and simplified {LCA} methodology as a complement for building certification.
Building and Environment, 44(12), 2510 – 2520.
http://doi.org/10.1016/j.buildenv.2009.05.001
Brook, M. (2004). Estimating and Tendering for Construction Work (Third Edition). England:
Elsevier Ltd.
Brownass, D. (2001). Building Services Design Methodology: A Practical Guide. New York U.S.A:
Spon Press.
BuildingSMART UK. (n.d.). buildingSMART United Kingdom & Ireland: Products. Retrieved
January 28, 2014, from http://www.buildingsmart.org.uk/about
CIBSE. (1998). CIBSE AM11 Building Energy and Environmental Modelling (CIBSE Applications
Manual 11). England: Chartered Institution of Building Services Engineers (CIBSE).
CIBSE. (2006). CIBSE Guide A: Environmental Design (7th Edition). England: Chartered
Institution of Building Services Engineers (CIBSE).
Ciroth, A. (2009). Cost data quality considerations for eco-efficiency measures. Ecological
Economics, 68(6), 1583–1590. http://doi.org/10.1016/j.ecolecon.2008.08.005
Cole, R. J., & Kernan, P. C. (1996). Life-cycle energy use in office buildings. Building and
Environment, 31(4), 307 – 317. http://doi.org/10.1016/0360-1323(96)00017-0
Construction Information Ltd. (2013). New Zealand National BIM Survey Report 2013.
Retrieved from http://www.masterspec.co.nz/news/reports-1243.htm
Using BIM To Calculate Accurate Building Material Quantities For Early Design Phase LCA
Author: Brian Berg 184
Crawford, R. (2004). Using input-output data in life cycle inventory analysis (DPhil Thesis). Deakin
University, Geelong Australia.
Crawford, R. (2008). Validation of a hybrid life-cycle inventory analysis method. Journal of
Environmental Management, 88(3), 496–506.
http://doi.org/10.1016/j.jenvman.2007.03.024
Crawford, R. (2011). Life cycle assessment in the built environment. Abingdon Oxon, England:
Spoon Press.
Creswell, J. W. (2009). Research Design Qualitative, Quantitative, and Mixed Methods Approaches
(Third Edition). New Delhi, India: Sage Publications Inc.
Dixit, M. K., Culp, C. H., & Fernández-Solís, J. L. (2013). System boundary for embodied
energy in buildings: A conceptual model for definition. Renewable and Sustainable
Energy Reviews, 21, 153–164. http://doi.org/10.1016/j.rser.2012.12.037
Dixit, M. K., Fernández-Solís, J. L., Lavy, S., & Culp, C. H. (2010). Identification of parameters
for embodied energy measurement: A literature review. Energy and Buildings, 42(8),
1238–1247. http://doi.org/10.1016/j.enbuild.2010.02.016
Dixit, M. K., Fernández-Solís, J. L., Lavy, S., & Culp, C. H. (2012). Need for an embodied
energy measurement protocol for buildings: A review paper. Renewable and
Sustainable Energy Reviews, 16(6), 3730–3743.
http://doi.org/10.1016/j.rser.2012.03.021
Donn, M. (1999). Quality assurance simulation and the real world. In Conf. Proc. IBPSA’99
Buildings Simulation (pp. 1139–146). Citeseer. Retrieved from
http://citeseerx.ist.psu.edu/viewdoc/download?doi=10.1.1.121.2017&rep=rep1&type=
Using BIM To Calculate Accurate Building Material Quantities For Early Design Phase LCA
Author: Brian Berg 185
Donn, M., Selkowitz, S., & Bordass, B. (2012). The Building Performance Sketch. Building
Research & Information, 40(2), 186–208.
http://doi.org/10.1080/09613218.2012.655070
Dowdell, D. (2013). Application of Environmental Profiling to Whole Building Whole of Life
Assessment – A Plan for New Zealand. Wellington New Zealand: BRANZ.
Dowdell, D. (2014). Study Report (Draft): New Zealand Whole Building Whole of Life Framework:
Life Cycle Assessment-based Indicators: For Consultation (Draft No. SR 293 (2014)).
Wellington New Zealand: BRANZ. Retrieved from
http://www.branz.co.nz/cms_show_download.php?id=11af33c627ad42a02e5c6e62b5
d4a9cfb280efca
Emmitt, S. (2007). Design Management for Architects. Oxford England: Blackwell Publishing Ltd.
Emmitt, S. (2010). Managing Interdisciplinary Projects: A Primer for Architecture, Engineering and
Construction. Oxon, Canada: Spon Press.
EPLCA. (2014). The European Platform On Life Cycle Assessment. Retrieved August 20,
2014, from http://eplca.jrc.ec.europa.eu/
Feagin, J. R., & Orum, A. M. (1991). A Case for the Case Study. (G. Sjoberg, Ed.). Chapel Hill,
North Carolina: University of North Carolina Press.
Fernandez, N. P. (2008). The influence of construction materials on life-cycle energy use and carbon
dioxide emissions of medium size commercial buildings (Master’s Thesis). Victoria
Univeristy of Wellington, Wellington New Zealand.
Ferry, D. J., Brandon, P. S., Ferry, J. D., & Kirkham, R. J. (2007). Ferr and Brandon’s Cost
Planning of Buildings (8th Edition). Oxford England: Blackwell Publishing Ltd.
Flyvbjerg, B. (2006). Five Misunderstandings About Case-Study Research. Qualitative Inquiry,
12(2), 219–245. http://doi.org/10.1177/1077800405284363
Using BIM To Calculate Accurate Building Material Quantities For Early Design Phase LCA
Author: Brian Berg 186
Golafshani, N. (2003). Understanding Reliability and Validity in Qualitative Research. The
Qualitative Report, 8(4), 597–607.
Grilo, A., & Jardim-Goncalves, R. (2010). Value proposition on interoperability of BIM and
collaborative working environments. Building Information Modeling and Collaborative
Working Environments, 19(5), 522–530. http://doi.org/10.1016/j.autcon.2009.11.003
Hammond, G., & Jones, C. (2011). Inventory of Carbon & Energy (ICE) Version 2.0.
University of Bath. Retrieved from https://www.circularecology.com/ice-
database.html#.UxUo8IUZGQw
Hand, J. W., Crawley, D. B., Donn, M., & Lawrie, L. K. (2008). Improving non-geometric data
available to simulation programs. Part Special: Building Performance Simulation, 43(4),
674–685. http://doi.org/10.1016/j.buildenv.2006.06.022
Haponava, T., & Al-Jibouri, S. (2010). Establishing influence of design process performance on
end-project goals in construction using process-based model. Benchmarking: An
International Journal, 17(5), 657–676. http://doi.org/10.1108/14635771011076425
Heijungs, R., & Huijbregts, M. A. (2004). A review of approaches to treat uncertainty in LCA.
In iEMSs 2004 International Congress:“ Complexity and Integrated Resources
Management.” Osnabrueck, Germany. Retrieved from
http://www.iemss.org/iemss2004/pdf/lca/heijarev.pdf
Hjelseth, E. (2010). Exchange of relevant information in BIM-objects defined by the Life cycle
Information Model (LIM). Architectural Engineering and Design Management, 6, 279–
287.
Holm, L., Schaufelberger, J. E., Griffin, D., & Cole, T. (2005). Construction Cost Estimating:
Process and Practices (First). Pearson Education.
Using BIM To Calculate Accurate Building Material Quantities For Early Design Phase LCA
Author: Brian Berg 187
Hopfe, C. J., & Hensen, J. L. M. (2011). Uncertainty analysis in building performance simulation
for design support. Energy and Buildings, 43(10), 2798–2805.
http://doi.org/10.1016/j.enbuild.2011.06.034
Huijbregts, M. A. (1998). Application of uncertainty and variability in LCA. The International
Journal of Life Cycle Assessment, 3(5), 273–280.
Ibn-Mohammed, T., Greenough, R., Taylor, S., Ozawa-Meida, L., & Acquaye, A. (2013).
Operational vs. embodied emissions in buildings—A review of current trends. Energy
and Buildings, 66, 232–245. http://doi.org/10.1016/j.enbuild.2013.07.026
IMPACT. (n.d.). IMPACT: Integrated Material Profile And Costing Tool. Retrieved January 29,
2014, from http://www.impactwba.com/index.jsp
International Energy Agency. (2002). International Energy Agency: Solar Heating and Cooling
Programme Task 23 Optimization of Solar Energy Use in Large Buildings: Subtask C
Tools for Trade-Off Analysis: Multi-Criteria Decision-Making MCDM-23: A Method
for Specifying and Prioritising Criteria and Goals in Design. (D. Balcomb, I. Andresen,
& A. G. Hestnes, Eds.). Retrieved from http://archive.iea-
shc.org/publications/downloads/MCDM_booklet.pdf
International Energy Agency. (2004a). International Energy Agency: Annex 31 Energy-Related
Environmental Impact of Buildings: Decision-Making Framework (International Energy
Agency Annex 31: Energy-Related Environmental Impact of Buildings). Canada:
Canada Mortgage and Housing Corporation.
International Energy Agency. (2004b). International Energy Agency: Annex 31 Energy-Related
Environmental Impact of Buildings: Environmental Framework (International Energy
Agency Annex 31: Energy-Related Environmental Impact of Buildings). Canada:
Canada Mortgage and Housing Corporation.
Using BIM To Calculate Accurate Building Material Quantities For Early Design Phase LCA
Author: Brian Berg 188
International Standards Organisation. (2001). ISO 12006-2: Building Construction -
Organisation of Information About Construction Work - Part 2: Framework for
Classification of Information. International Standards Organisation.
Isaacs, N., & Hills, A. (2013). Understanding the New Zealand non-domestic building stock.
Building Research & Information, 42(1), 95–108.
http://doi.org/10.1080/09613218.2013.831274
Jiao, Y., Lloyd, C. R., & Wakes, S. J. (2012). The relationship between total embodied energy
and cost of commercial buildings. Energy and Buildings, 52(0), 20–27.
http://doi.org/10.1016/j.enbuild.2012.05.028
Jones, S. A. (2007). Interoperability SmartMarket Report. (J. E. Gudgel, Ed.). McGraw-Hill
Construction. Retrieved from
http://www.aia.org/aiaucmp/groups/aia/documents/pdf/aias077485.pdf
Kim, D. (2010). Optimizing Cost Effective Energy Conservation Measures For Building
Envelope. Energy Engineering, 107(3), 70–80.
http://doi.org/10.1080/01998591009709877
Kofoworola, O. F., & Gheewala, S. H. (2009). Life cycle energy assessment of a typical office
building in Thailand. Energy and Buildings, 41(10), 1076 – 1083.
http://doi.org/10.1016/j.enbuild.2009.06.002
KT Innovations, PE International, & AutoDesk. (2014). Tally Environmental Impact Tool.
Retrieved April 3, 2014, from http://choosetally.com/
Kurnitski, J., Allard, F., Braham, D., Goeders, G., Heiselberg, P., Jagemar, L., … Railio, J.
(2011). How to define nearly net zero energy buildings NZEB. REHVA Journal, 48(3),
6–12.
Using BIM To Calculate Accurate Building Material Quantities For Early Design Phase LCA
Author: Brian Berg 189
Langston, C. (2012). The role of coordinate-based decision-making in the evaluation of
sustainable built environments. Construction Management and Economics, 31(1), 62–77.
http://doi.org/10.1080/01446193.2012.738920
Langston, C. A. (2005). Life-Cost Approach to building Evaluation (First Edition). Australia:
University of New South Wales Press Ltd.
Langston, Y. L., & Langston, C. A. (2008). Reliability of building embodied energy modelling:
an analysis of 30 Melbourne case studies. Construction Management and Economics,
26(2), 147–160. http://doi.org/10.1080/01446190701716564
Langston, Y. L., & Langston, C. A. (2012). Building energy and cost performance: An analysis
of thirty Melbourne case studies. Australasian Journal of Construction Economics and
Building, 7(1), 1–18.
Lawson, B. (2006). How Designers Think: The Design Process Demystified (Fourth Edition).
Oxford England: Architectural Press.
Leite, F., Akcamete, A., Akinci, B., Atasoy, G., & Kiziltas, S. (2011). Analysis of modeling effort
and impact of different levels of detail in building information models. Automation in
Construction, 20(5), 601–609. http://doi.org/10.1016/j.autcon.2010.11.027
Level of Development Specification. (2013, August). Level of Development Specification For
Building Information Models. BIMForum.
Levy, S. J. (1988). Information Technologies in Universities: An Institutional Case Study. Northern
Arizona University.
Löhnert, G., Dalkowski, A., & Sutter, W. (2003). Integrated Design Process: A Guideline for
Sustainable and Solar-Optimised Building Design (Design Guide) (p. 62). Berlin / Zug:
International Energy Agency.
Using BIM To Calculate Accurate Building Material Quantities For Early Design Phase LCA
Author: Brian Berg 190
Lou, E. C. W., & Goulding, J. S. (2008). Building and Construction Classification Systems.
Architectural Engineering and Design Management, 4(3), 206–220.
http://doi.org/10.3763/aedm.2008.0079
Nebel, B. (n.d.). Is It Valid To Use International Data In New Zealand LCA Studies?. Rotorua, New
Zealand: Sicon. Retrieved from
http://www.google.co.nz/url?sa=t&rct=j&q=&esrc=s&source=web&cd=1&cad=rja&ua
ct=8&ved=0CBwQFjAA&url=http%3A%2F%2Fwww.branz.co.nz%2Fcms_show_dow
nload.php%3Fid%3D0fb692aafd30348c96dbf730a68cac0ccdcfb77e&ei=kjQaVMDWG
Yy8uATg3oHQCw&usg=AFQjCNE-
ArkRDtLMUB8FTfimpxMi4rTC5A&sig2=jq5q1yy4W4lchISmzLe1fQ&bvm=bv.750972
01,d.c2E
New Zealand Construction Institute Council (NZCIC). (2004). New Zealand Construction
Institute Council (NZCIC) Design Documentation Guidelines. New Zealand
Construction Institute Council (NZCIC). Retrieved from http://www.nzcic.co.nz/
New Zealand Green Building Council. (2008). Technical Manual: Green Star NZ – Office Design
& Built (Version 1). New Zealand: New Zealand Green Building Council.
Optis, M., & Wild, P. (2010). Inadequate documentation in published life cycle energy reports
on buildings. The International Journal of Life Cycle Assessment, 15(7), 644–651.
http://doi.org/10.1007/s11367-010-0203-4
Ostime, N. (2013). RIBA Job Book (9th Edition). London: RIBA Publishing.
Pazlar, T., & Turk, Ž. (2008). Interoperability in practice: geometric data exchance using the
IFC standard. ITcon, 13(Case Studies of BIM use), 362–380.
Property Council of New Zealand. (n.d.). Quality Grading Matrix and Retial Classifications.
Retrieved from http://www.propertynz.co.nz/index.asp?pageID=2145860546
Using BIM To Calculate Accurate Building Material Quantities For Early Design Phase LCA
Author: Brian Berg 191
Raftery, P., Keane, M., & Costa, A. (2009). Calibration of a detailed simulation model to
energy monitoring system data: a methodology and case study. In Proceedings of the
11th IBPSA Conference, Glasgow, UK.
Ross, S., Evans, D., & Webber, M. (2002). How LCA studies deal with uncertainty. The
International Journal of Life Cycle Assessment, 7(1), 47–52.
Samphaongoen, P. (2010). A Visual Approach to Construction Cost Estimating (Master’s Thesis).
Marquette University, Wisconsin, U.S.A.
Sidoroff, S. (2004a). International Energy Agency: Annex 31 Energy-Related Environmental Impact of
Buildings: Data Needs and Sources (International Energy Agency Annex 31: Energy-
Related Environmental Impact of Buildings). Canada: Canada Mortgage and Housing
Corporation.
Sidoroff, S. (2004b). International Energy Agency: Annex 31 Energy-Related Environmental Impact
of Buildings: Glossary (International Energy Agency Annex 31: Energy-Related
Environmental Impact of Buildings). Canada: Canada Mortgage and Housing
Corporation.
Sinclair, D. (Ed.). (2012). BIM Overlay to the RIBA Outline Plan of Work. RIBA Publishing.
Smith, J., & Jaggar, D. M. (2006). Building Cost Planning for the Design Team (2 Edition).
Routledge.
Stake, R. E. (1995). The Art of Case Study Research. Thousand Oaks, California: Sage
Publications Ltd.
Tellis, W. (1997). Application of a Case Study Methodology. The Qualitative Report, 3(3).
The Building and, & Construction Productivity Partnership. (2014). New Zealand BIM
Handbook. BIM Acceleration Committee. Retrieved from
www.buildingvalue.co.nz/BIM-in-NZ
Using BIM To Calculate Accurate Building Material Quantities For Early Design Phase LCA
Author: Brian Berg 192
The National Building Specification (NBS), & BIM Technologies Alliance. (2014). NBS National
BIM Library. Retrieved March 4, 2014, from http://www.nationalbimlibrary.com/
Tims, G. (2007). House Insulation Guide. (T. Pringle, Ed.) (Third Edition). Wellington New
Zealand: BRANZ.
Treloar, G. J., Fay, R., Ilozor, B., & Love, P. E. D. (2001). An analysis of the embodied energy
of office buildings by height. Facilities, 19(5/6), 204–214.
Treloar, G. J., Love, P. E., & Faniran, O. O. (2001). Improving the reliability of embodied
energy methods for project life-cycle decision making. Logistics Information
Management, 14(5/6), 303–318.
Treloar, G. J., McCoubrie, A., Love, P. E. D., & Iyer-Raniga, U. (1999). Embodied energy
analysis of fixtures, fittings and furniture in office buildings. Facilities, 17(11), 403–410.
Types of Case Studies. (2002). In Embedded Case Study Methods (pp. 9–15). Thousand Oaks,
California, USA: Sage Publications Inc.
US DOE. (2008). M&V Guidelines: Measurement and Verification for Federal Energy Projects
Version 3.0. U.S. Department of Energy Federal Energy Management Program.
Retrieved from http://www1.eere.energy.gov/femp/pdfs/mv_guidelines.pdf
Wang, E., & Shen, Z. (2013). A hybrid Data Quality Indicator and statistical method for
improving uncertainty analysis in LCA of complex system – application to the whole-
building embodied energy analysis. Journal of Cleaner Production, 43, 166–173.
http://doi.org/10.1016/j.jclepro.2012.12.010
Weidema, B. P., & Wesnæs, M. S. (1996). Data quality management for life cycle
inventories—an example of using data quality indicators. Journal of Cleaner Production,
4(3–4), 167–174. http://doi.org/10.1016/S0959-6526(96)00043-1
Using BIM To Calculate Accurate Building Material Quantities For Early Design Phase LCA
Author: Brian Berg 193
Wu, S., Ginige, K., Wood, G., & Wee Jong, S. (2014). How Can Building Information Modelling
(BIM) Support The New Rules of Measurement (NRM1). London: Royal Institution of
Chartered Surveyors (RICS).
Yin, R. K. (1984). Case Study Research: Design and Methods (1st ed.). Newbury Park, California:
Sage Publications Ltd.
Yohanis, Y. G., & Norton, B. (2006). Including embodied energy considerations at the
conceptual stage of building design. Proceedings of the Institution of Mechanical
Engineers, 220(3), 271–288.
Yung, P., Lam, K. C., & Yu, C. (2013). An audit of life cycle energy analyses of buildings.
Habitat International, 39(0), 43 – 54. http://doi.org/10.1016/j.habitatint.2012.10.003
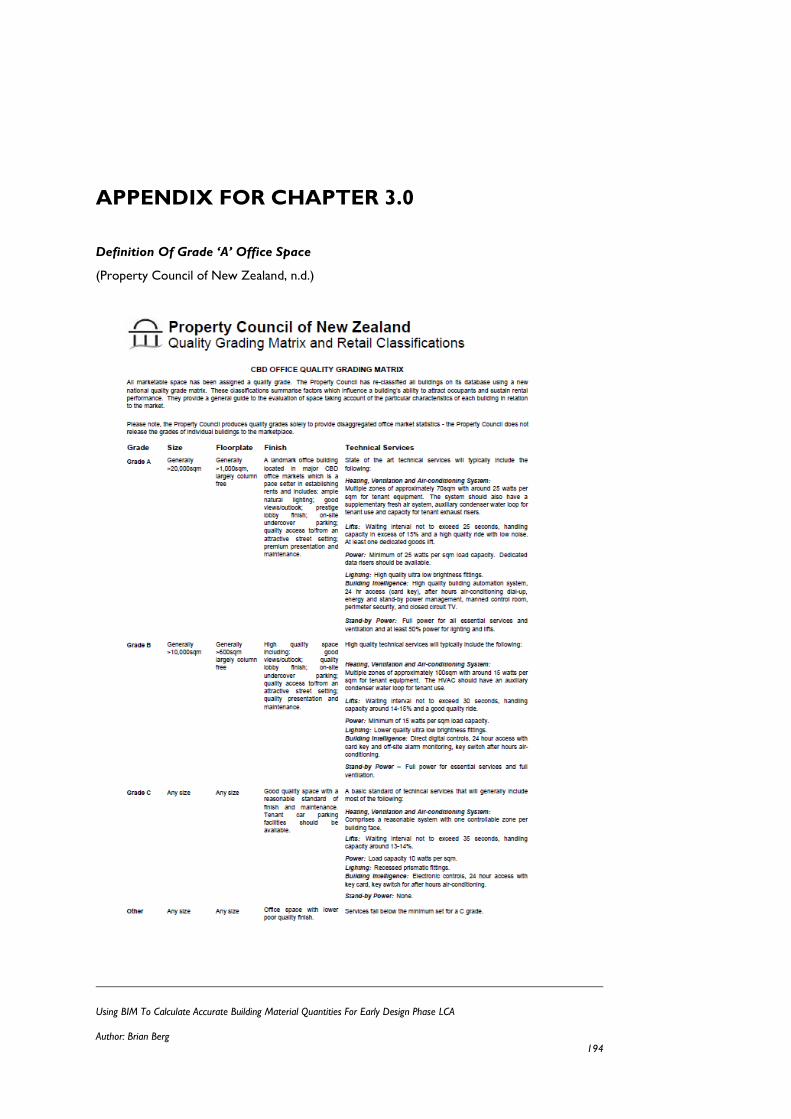
Using BIM To Calculate Accurate Building Material Quantities For Early Design Phase LCA
Author: Brian Berg 194
APPENDIX FOR CHAPTER 3.0
Definition Of Grade ‘A’ Office Space
(Property Council of New Zealand, n.d.)
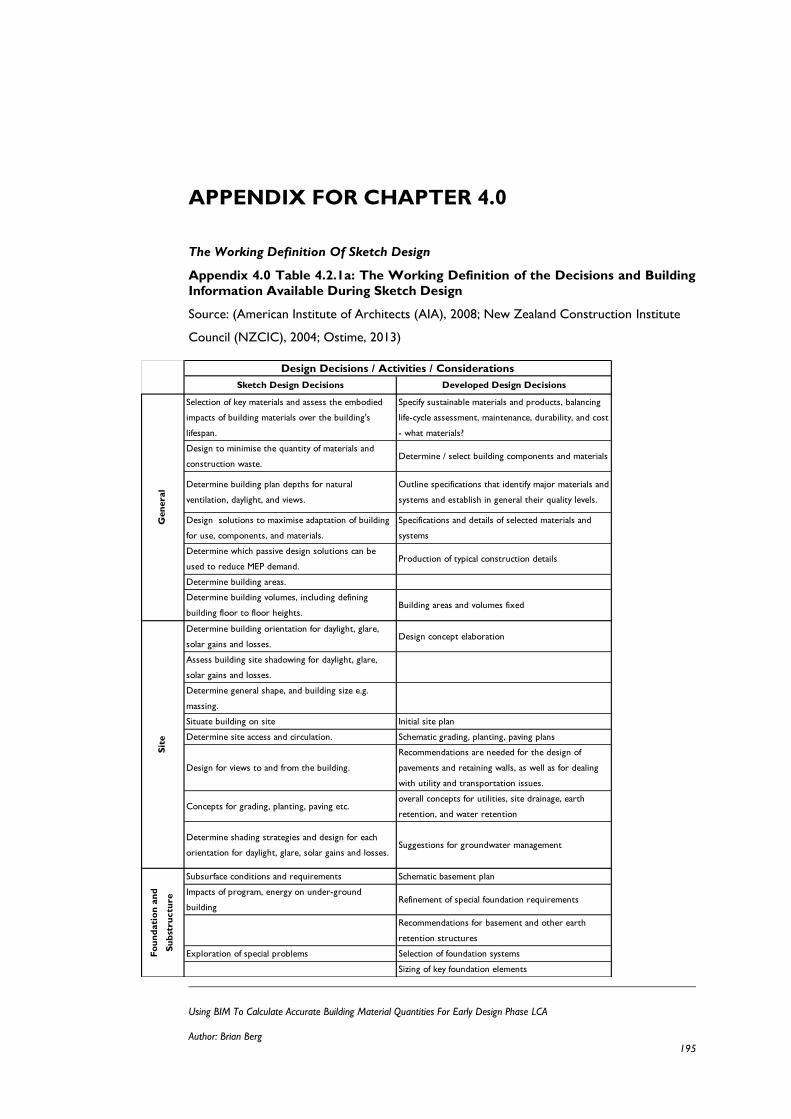
Using BIM To Calculate Accurate Building Material Quantities For Early Design Phase LCA
Author: Brian Berg 195
APPENDIX FOR CHAPTER 4.0
The Working Definition Of Sketch Design
Appendix 4.0 Table 4.2.1a: The Working Definition of the Decisions and Building
Information Available During Sketch Design
Source: (American Institute of Architects (AIA), 2008; New Zealand Construction Institute
Council (NZCIC), 2004; Ostime, 2013)
Sketch Design Decisions Developed Design Decisions
Selection of key materials and assess the embodied
impacts of building materials over the building's
lifespan.
Specify sustainable materials and products, balancing
life-cycle assessment, maintenance, durability, and cost
- what materials?
Design to minimise the quantity of materials and
construction waste.Determine / select building components and materials
Determine building plan depths for natural
ventilation, daylight, and views.
Outline specifications that identify major materials and
systems and establish in general their quality levels.
Design solutions to maximise adaptation of building
for use, components, and materials.
Specifications and details of selected materials and
systems
Determine which passive design solutions can be
used to reduce MEP demand.Production of typical construction details
Determine building areas.
Determine building volumes, including defining
building floor to floor heights.Building areas and volumes fixed
Determine building orientation for daylight, glare,
solar gains and losses.Design concept elaboration
Assess building site shadowing for daylight, glare,
solar gains and losses.
Determine general shape, and building size e.g.
massing.
Situate building on site Initial site plan
Determine site access and circulation. Schematic grading, planting, paving plans
Design for views to and from the building.
Recommendations are needed for the design of
pavements and retaining walls, as well as for dealing
with utility and transportation issues.
Concepts for grading, planting, paving etc.overall concepts for utilities, site drainage, earth
retention, and water retention
Determine shading strategies and design for each
orientation for daylight, glare, solar gains and losses.Suggestions for groundwater management
Subsurface conditions and requirements Schematic basement plan
Impacts of program, energy on under-ground
buildingRefinement of special foundation requirements
Recommendations for basement and other earth
retention structures
Exploration of special problems Selection of foundation systems
Sizing of key foundation elements
Design Decisions / Activities / Considerations
Gen
eral
Sit
eF
ou
nd
ati
on
an
d
Su
bst
ru
ctu
re
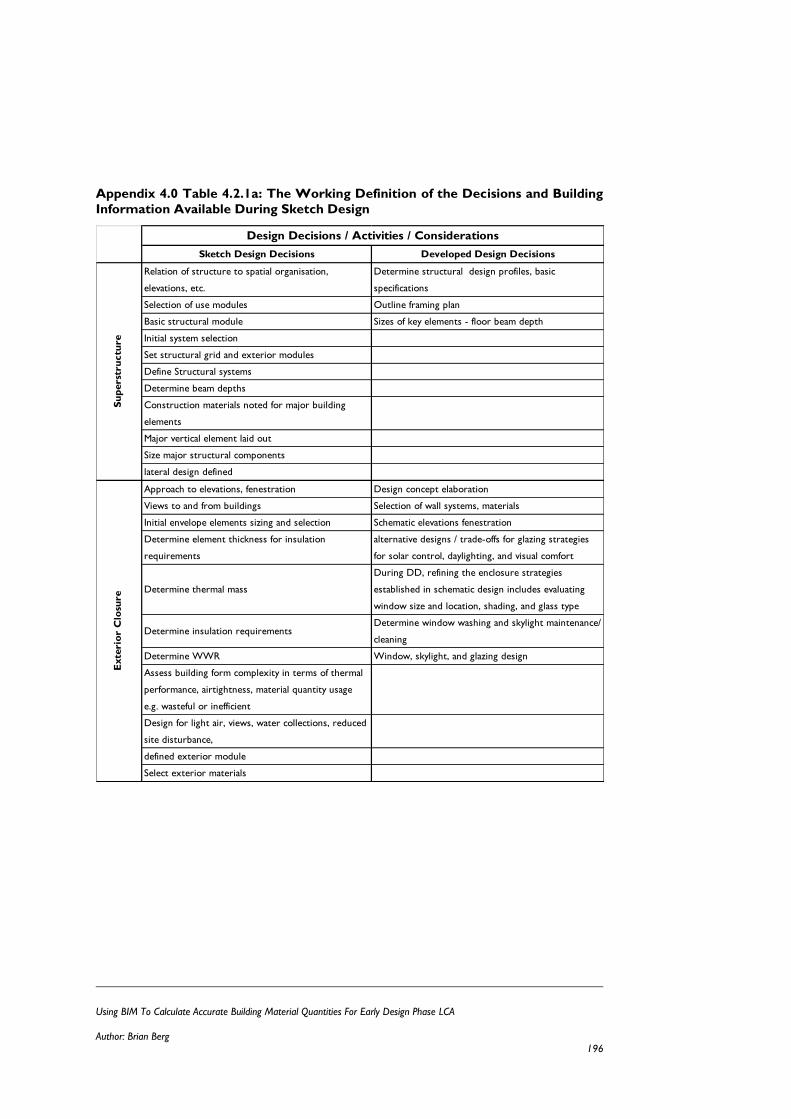
Using BIM To Calculate Accurate Building Material Quantities For Early Design Phase LCA
Author: Brian Berg 196
Appendix 4.0 Table 4.2.1a: The Working Definition of the Decisions and Building
Information Available During Sketch Design
Sketch Design Decisions Developed Design Decisions
Relation of structure to spatial organisation,
elevations, etc.
Determine structural design profiles, basic
specifications
Selection of use modules Outline framing plan
Basic structural module Sizes of key elements - floor beam depth
Initial system selection
Set structural grid and exterior modules
Define Structural systems
Determine beam depths
Construction materials noted for major building
elements
Major vertical element laid out
Size major structural components
lateral design defined
Approach to elevations, fenestration Design concept elaboration
Views to and from buildings Selection of wall systems, materials
Initial envelope elements sizing and selection Schematic elevations fenestration
Determine element thickness for insulation
requirements
alternative designs / trade-offs for glazing strategies
for solar control, daylighting, and visual comfort
Determine thermal mass
During DD, refining the enclosure strategies
established in schematic design includes evaluating
window size and location, shading, and glass type
Determine insulation requirementsDetermine window washing and skylight maintenance/
cleaning
Determine WWR Window, skylight, and glazing design
Assess building form complexity in terms of thermal
performance, airtightness, material quantity usage
e.g. wasteful or inefficient
Design for light air, views, water collections, reduced
site disturbance,
defined exterior module
Select exterior materials
Exte
rio
r C
losu
re
Su
perst
ru
ctu
re
Design Decisions / Activities / Considerations
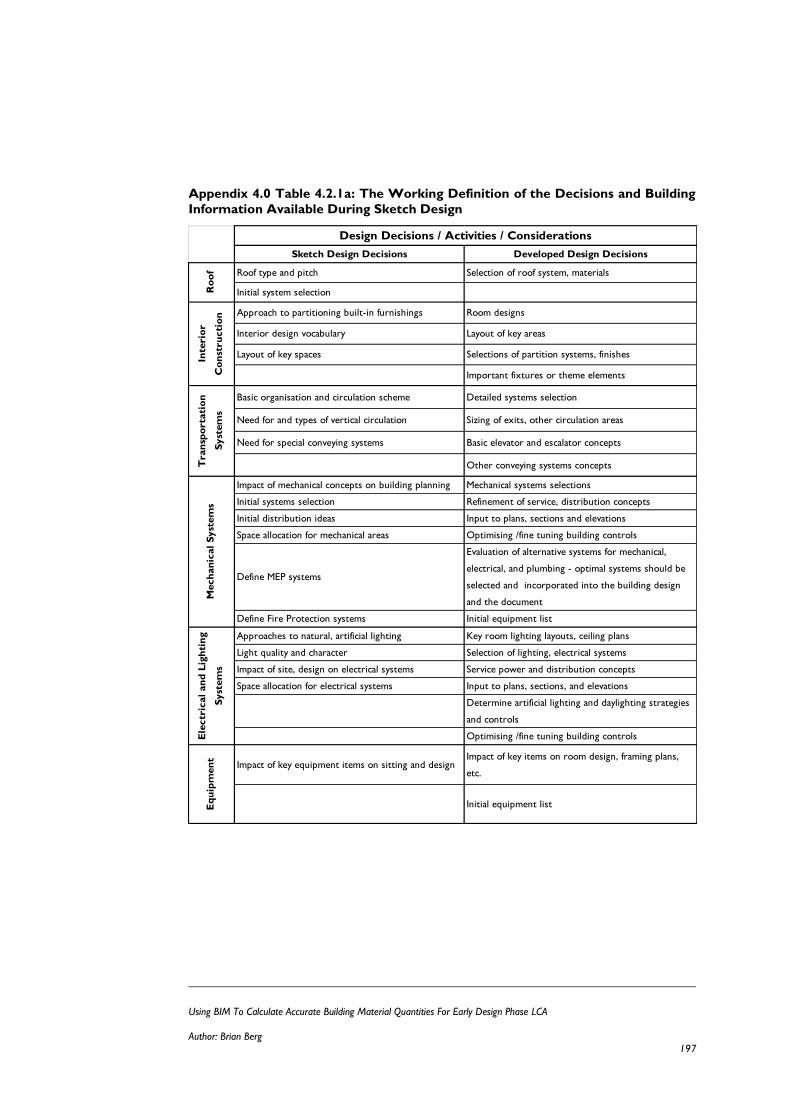
Using BIM To Calculate Accurate Building Material Quantities For Early Design Phase LCA
Author: Brian Berg 197
Appendix 4.0 Table 4.2.1a: The Working Definition of the Decisions and Building
Information Available During Sketch Design
Sketch Design Decisions Developed Design Decisions
Roof type and pitch Selection of roof system, materials
Initial system selection
Approach to partitioning built-in furnishings Room designs
Interior design vocabulary Layout of key areas
Layout of key spaces Selections of partition systems, finishes
Important fixtures or theme elements
Basic organisation and circulation scheme Detailed systems selection
Need for and types of vertical circulation Sizing of exits, other circulation areas
Need for special conveying systems Basic elevator and escalator concepts
Other conveying systems concepts
Impact of mechanical concepts on building planning Mechanical systems selections
Initial systems selection Refinement of service, distribution concepts
Initial distribution ideas Input to plans, sections and elevations
Space allocation for mechanical areas Optimising /fine tuning building controls
Define MEP systems
Evaluation of alternative systems for mechanical,
electrical, and plumbing - optimal systems should be
selected and incorporated into the building design
and the document
Define Fire Protection systems Initial equipment list
Approaches to natural, artificial lighting Key room lighting layouts, ceiling plans
Light quality and character Selection of lighting, electrical systems
Impact of site, design on electrical systems Service power and distribution concepts
Space allocation for electrical systems Input to plans, sections, and elevations
Determine artificial lighting and daylighting strategies
and controls
Optimising /fine tuning building controls
Impact of key equipment items on sitting and designImpact of key items on room design, framing plans,
etc.
Initial equipment list
Design Decisions / Activities / Considerations
Ele
ctr
ical
an
d L
igh
tin
g
Syst
em
sE
qu
ipm
en
tR
oo
fIn
terio
r
Co
nst
ru
cti
on
Tran
spo
rta
tio
n
Syst
em
sM
ech
an
ical
Syst
em
s
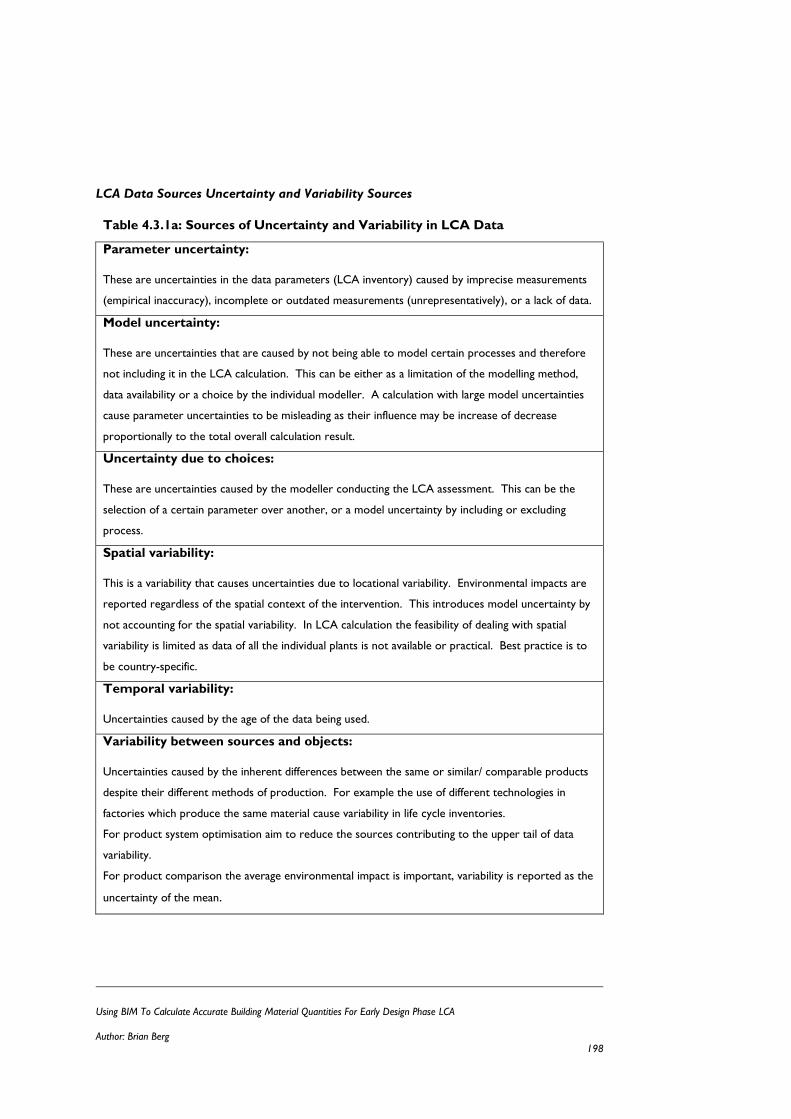
Using BIM To Calculate Accurate Building Material Quantities For Early Design Phase LCA
Author: Brian Berg 198
LCA Data Sources Uncertainty and Variability Sources
Table 4.3.1a: Sources of Uncertainty and Variability in LCA Data
Parameter uncertainty:
These are uncertainties in the data parameters (LCA inventory) caused by imprecise measurements
(empirical inaccuracy), incomplete or outdated measurements (unrepresentatively), or a lack of data.
Model uncertainty:
These are uncertainties that are caused by not being able to model certain processes and therefore
not including it in the LCA calculation. This can be either as a limitation of the modelling method,
data availability or a choice by the individual modeller. A calculation with large model uncertainties
cause parameter uncertainties to be misleading as their influence may be increase of decrease
proportionally to the total overall calculation result.
Uncertainty due to choices:
These are uncertainties caused by the modeller conducting the LCA assessment. This can be the
selection of a certain parameter over another, or a model uncertainty by including or excluding
process.
Spatial variability:
This is a variability that causes uncertainties due to locational variability. Environmental impacts are
reported regardless of the spatial context of the intervention. This introduces model uncertainty by
not accounting for the spatial variability. In LCA calculation the feasibility of dealing with spatial
variability is limited as data of all the individual plants is not available or practical. Best practice is to
be country-specific.
Temporal variability:
Uncertainties caused by the age of the data being used.
Variability between sources and objects:
Uncertainties caused by the inherent differences between the same or similar/ comparable products
despite their different methods of production. For example the use of different technologies in
factories which produce the same material cause variability in life cycle inventories.
For product system optimisation aim to reduce the sources contributing to the upper tail of data
variability.
For product comparison the average environmental impact is important, variability is reported as the
uncertainty of the mean.
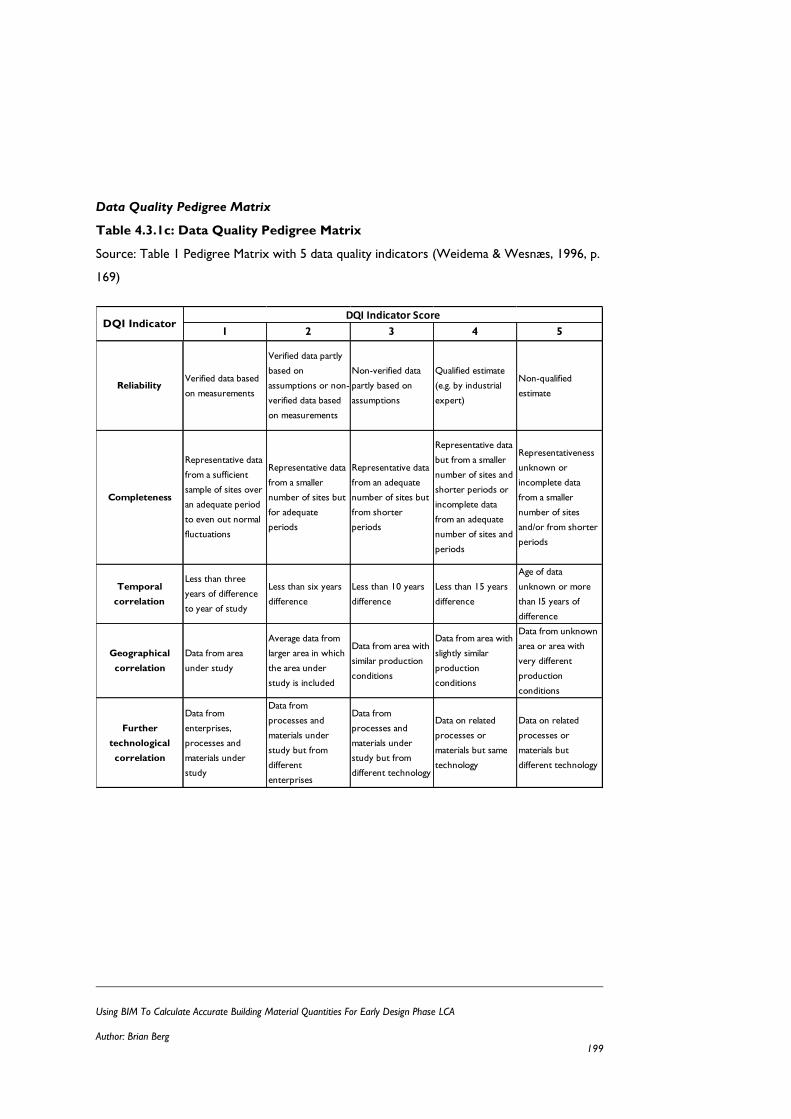
Using BIM To Calculate Accurate Building Material Quantities For Early Design Phase LCA
Author: Brian Berg 199
Data Quality Pedigree Matrix
Table 4.3.1c: Data Quality Pedigree Matrix
Source: Table 1 Pedigree Matrix with 5 data quality indicators (Weidema & Wesnæs, 1996, p.
169)
1 2 3 4 5
ReliabilityVerified data based
on measurements
Verified data partly
based on
assumptions or non-
verified data based
on measurements
Non-verified data
partly based on
assumptions
Qualified estimate
(e.g. by industrial
expert)
Non-qualified
estimate
Completeness
Representative data
from a sufficient
sample of sites over
an adequate period
to even out normal
fluctuations
Representative data
from a smaller
number of sites but
for adequate
periods
Representative data
from an adequate
number of sites but
from shorter
periods
Representative data
but from a smaller
number of sites and
shorter periods or
incomplete data
from an adequate
number of sites and
periods
Representativeness
unknown or
incomplete data
from a smaller
number of sites
and/or from shorter
periods
Temporal
correlation
Less than three
years of difference
to year of study
Less than six years
difference
Less than 10 years
difference
Less than 15 years
difference
Age of data
unknown or more
than I5 years of
difference
Geographical
correlation
Data from area
under study
Average data from
larger area in which
the area under
study is included
Data from area with
similar production
conditions
Data from area with
slightly similar
production
conditions
Data from unknown
area or area with
very different
production
conditions
Further
technological
correlation
Data from
enterprises,
processes and
materials under
study
Data from
processes and
materials under
study but from
different
enterprises
Data from
processes and
materials under
study but from
different technology
Data on related
processes or
materials but same
technology
Data on related
processes or
materials but
different technology
DQI Indicator ScoreDQI Indicator
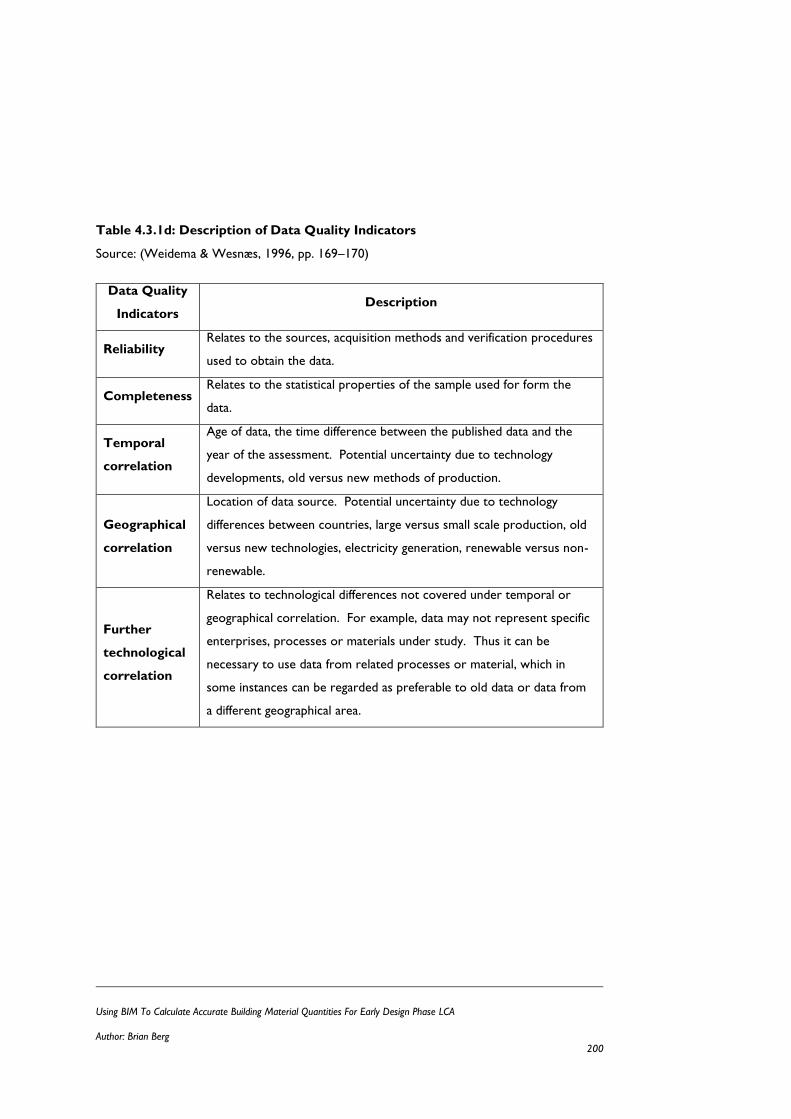
Using BIM To Calculate Accurate Building Material Quantities For Early Design Phase LCA
Author: Brian Berg 200
Table 4.3.1d: Description of Data Quality Indicators
Source: (Weidema & Wesnæs, 1996, pp. 169–170)
Data Quality
Indicators Description
Reliability Relates to the sources, acquisition methods and verification procedures
used to obtain the data.
Completeness Relates to the statistical properties of the sample used for form the
data.
Temporal
correlation
Age of data, the time difference between the published data and the
year of the assessment. Potential uncertainty due to technology
developments, old versus new methods of production.
Geographical
correlation
Location of data source. Potential uncertainty due to technology
differences between countries, large versus small scale production, old
versus new technologies, electricity generation, renewable versus non-
renewable.
Further
technological
correlation
Relates to technological differences not covered under temporal or
geographical correlation. For example, data may not represent specific
enterprises, processes or materials under study. Thus it can be
necessary to use data from related processes or material, which in
some instances can be regarded as preferable to old data or data from
a different geographical area.
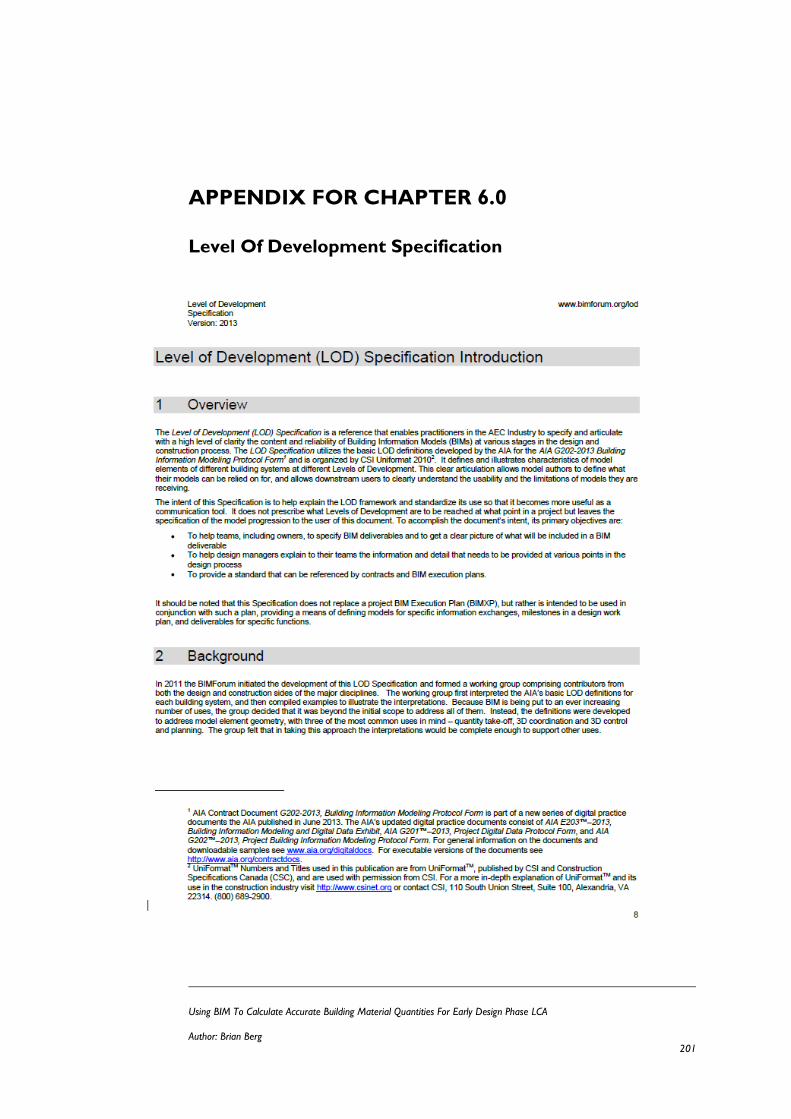
Using BIM To Calculate Accurate Building Material Quantities For Early Design Phase LCA
Author: Brian Berg 201
APPENDIX FOR CHAPTER 6.0
Level Of Development Specification
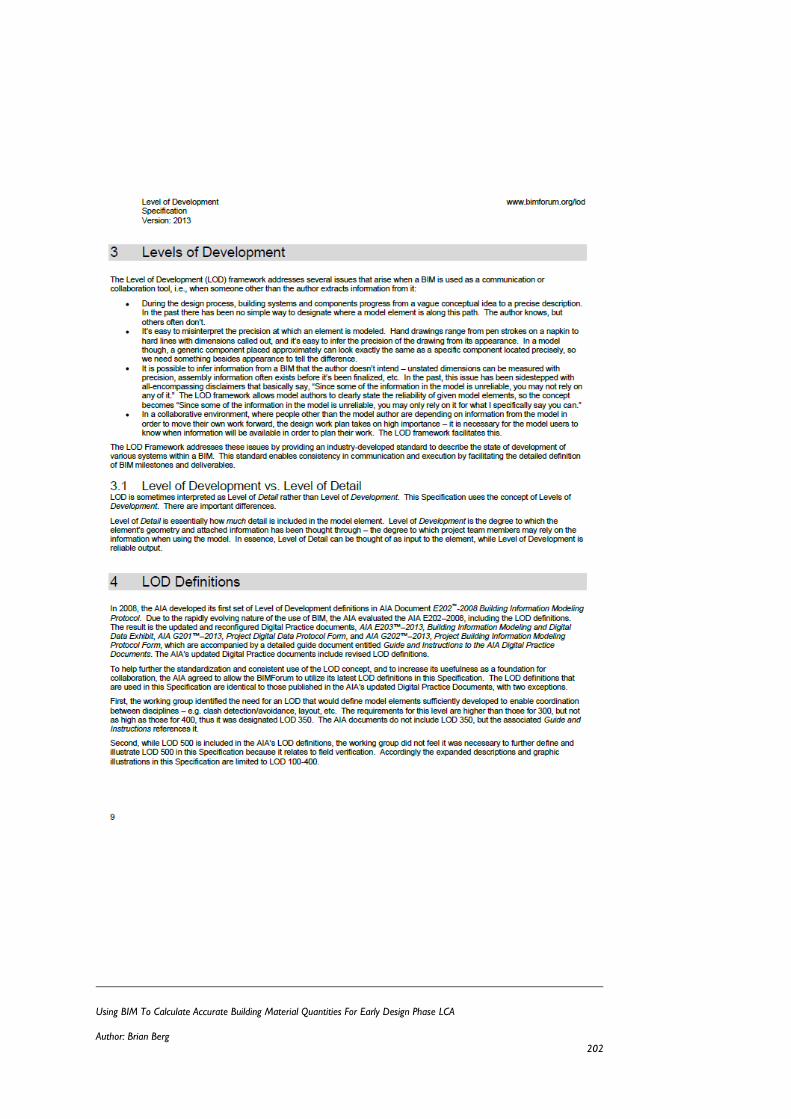
Using BIM To Calculate Accurate Building Material Quantities For Early Design Phase LCA
Author: Brian Berg 202
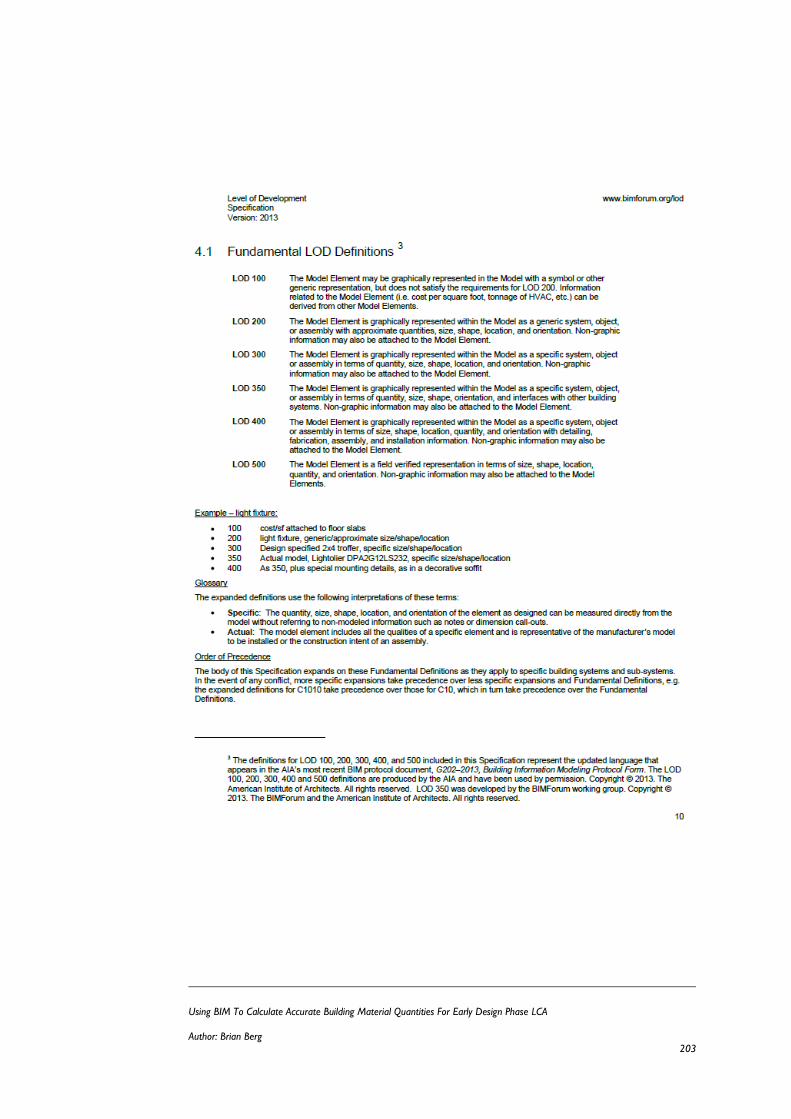
Using BIM To Calculate Accurate Building Material Quantities For Early Design Phase LCA
Author: Brian Berg 203

Using BIM To Calculate Accurate Building Material Quantities For Early Design Phase LCA
Author: Brian Berg 204
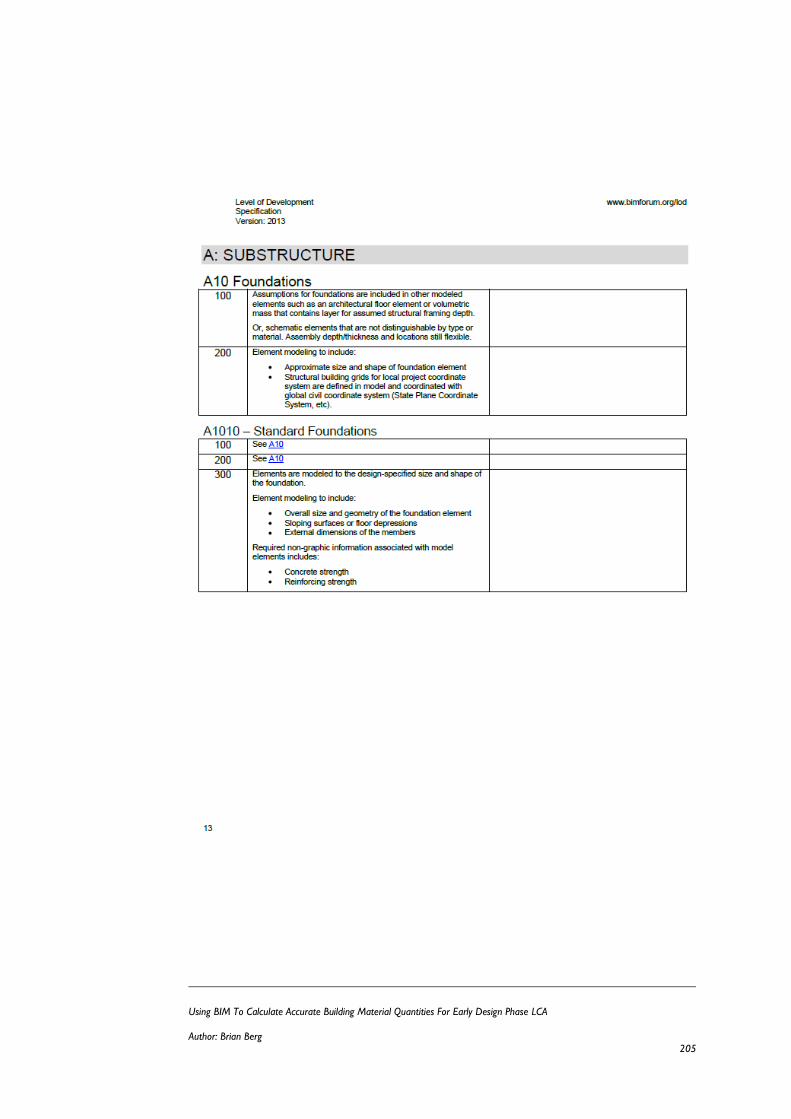
Using BIM To Calculate Accurate Building Material Quantities For Early Design Phase LCA
Author: Brian Berg 205
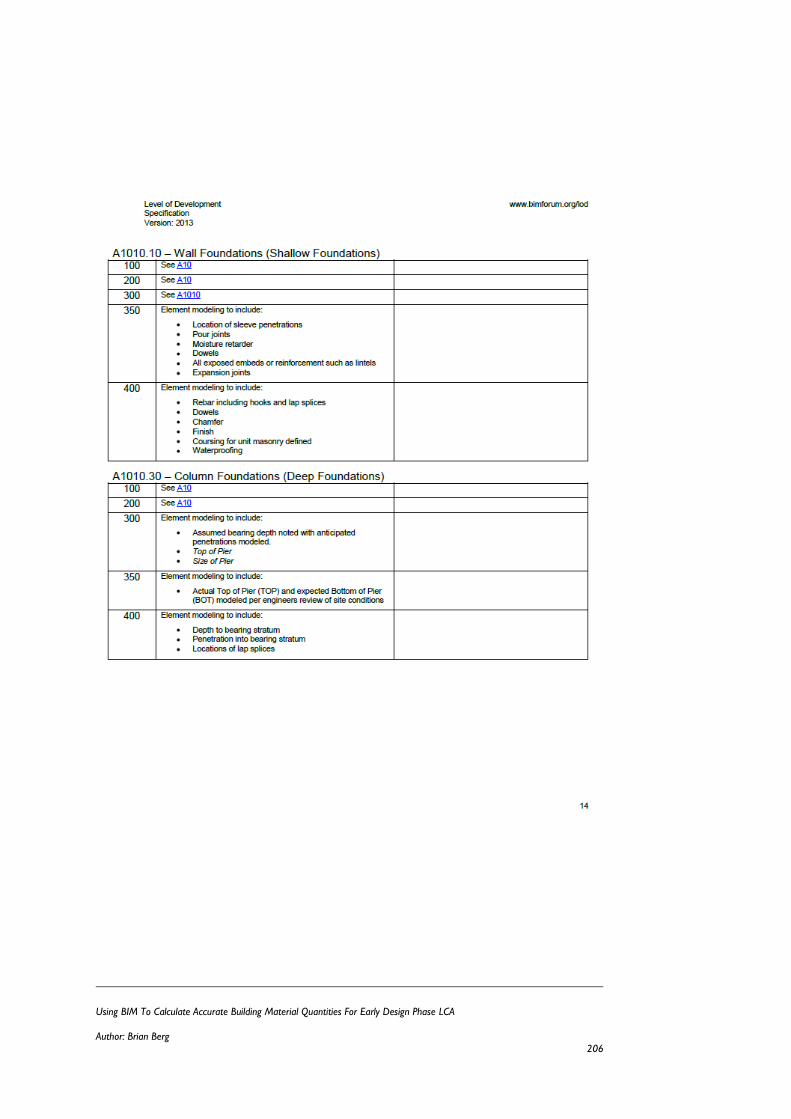
Using BIM To Calculate Accurate Building Material Quantities For Early Design Phase LCA
Author: Brian Berg 206
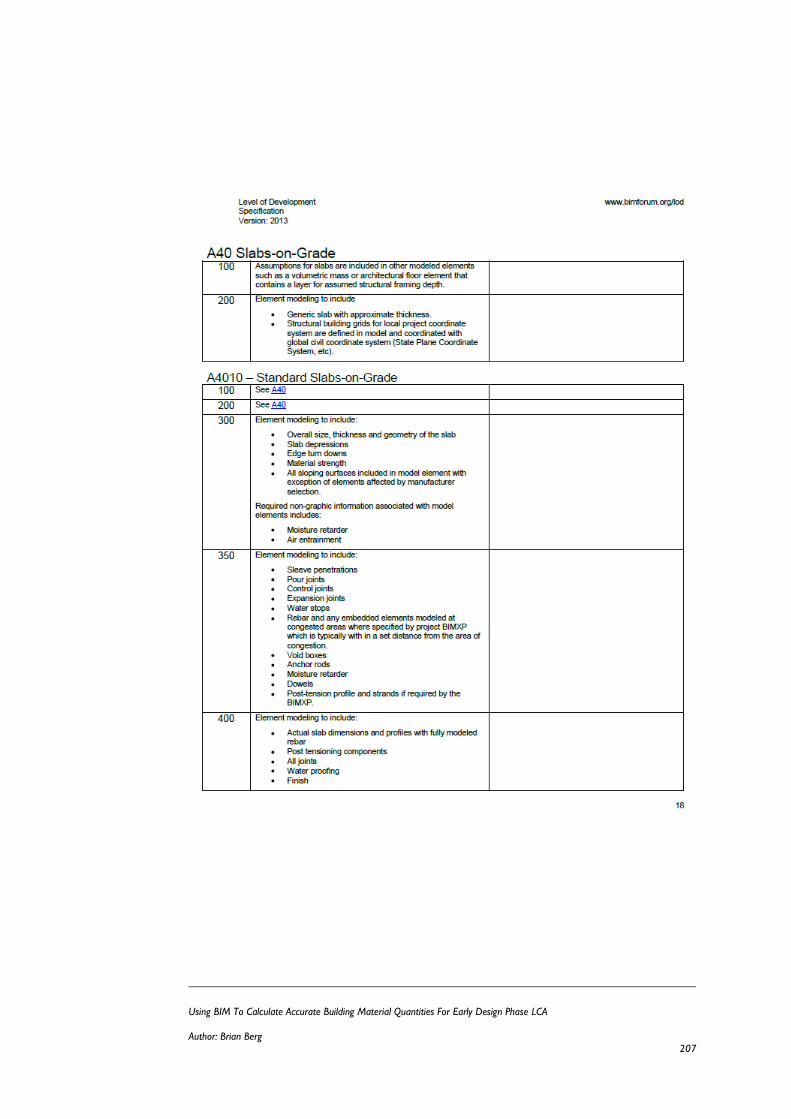
Using BIM To Calculate Accurate Building Material Quantities For Early Design Phase LCA
Author: Brian Berg 207
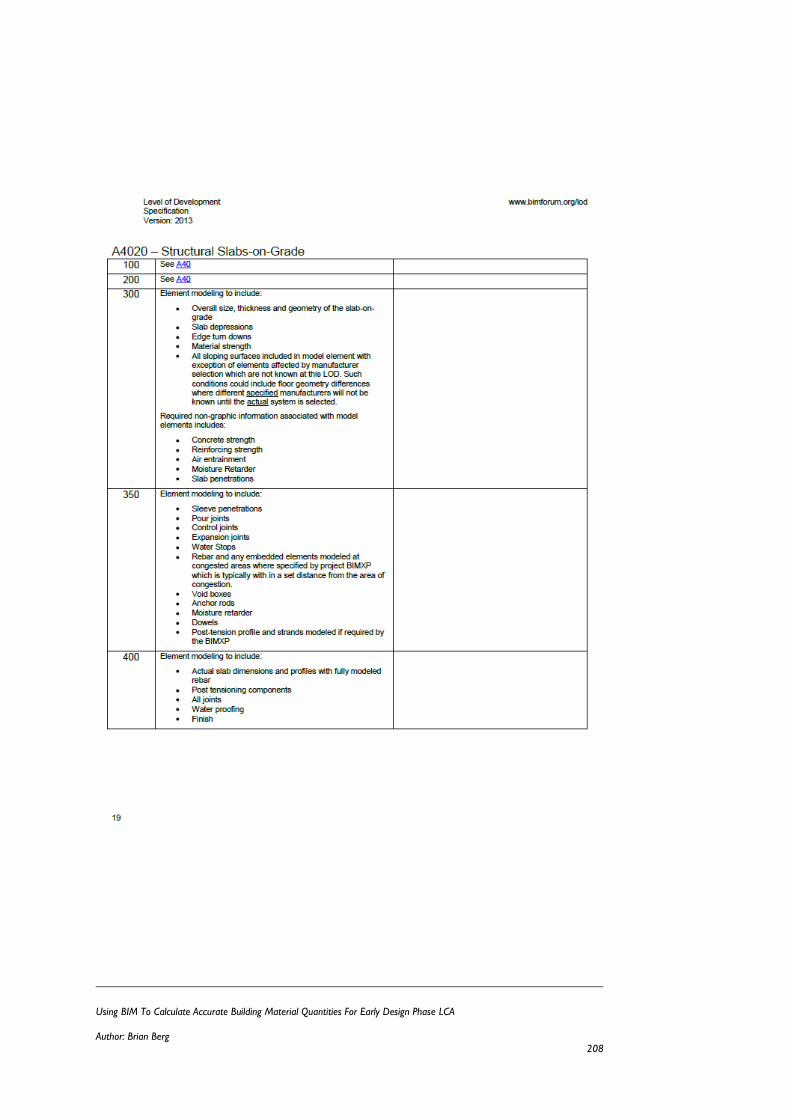
Using BIM To Calculate Accurate Building Material Quantities For Early Design Phase LCA
Author: Brian Berg 208
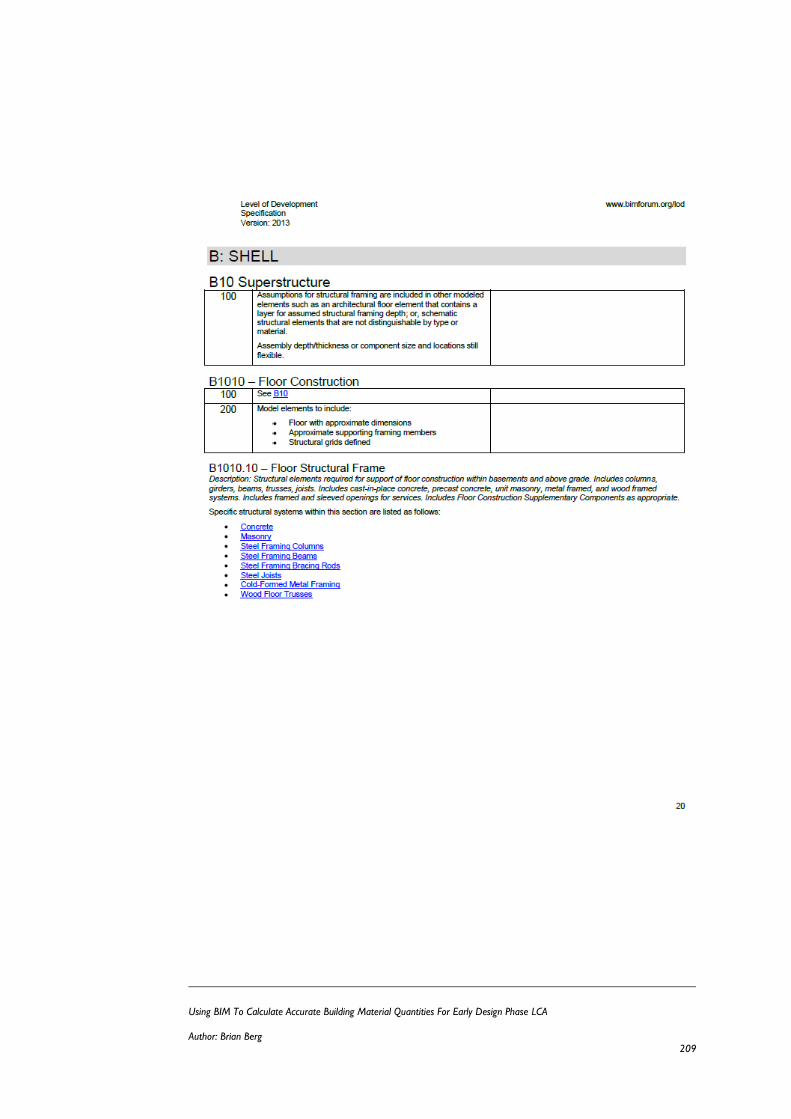
Using BIM To Calculate Accurate Building Material Quantities For Early Design Phase LCA
Author: Brian Berg 209
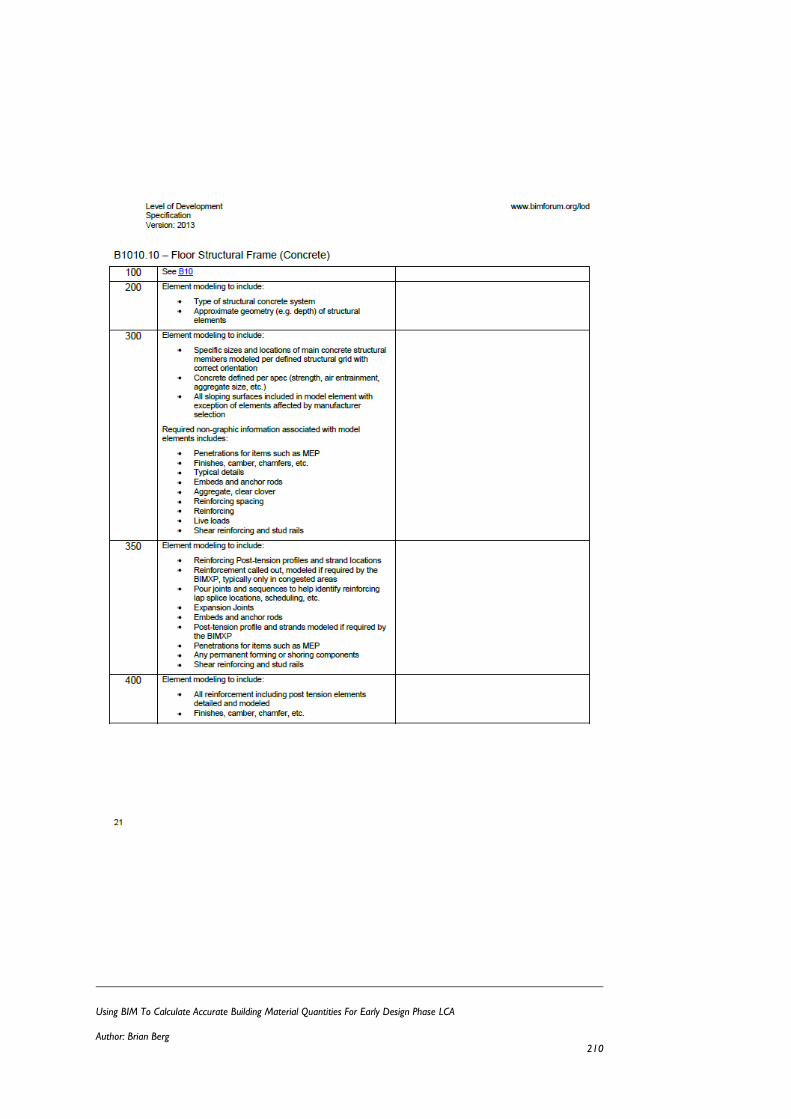
Using BIM To Calculate Accurate Building Material Quantities For Early Design Phase LCA
Author: Brian Berg 210
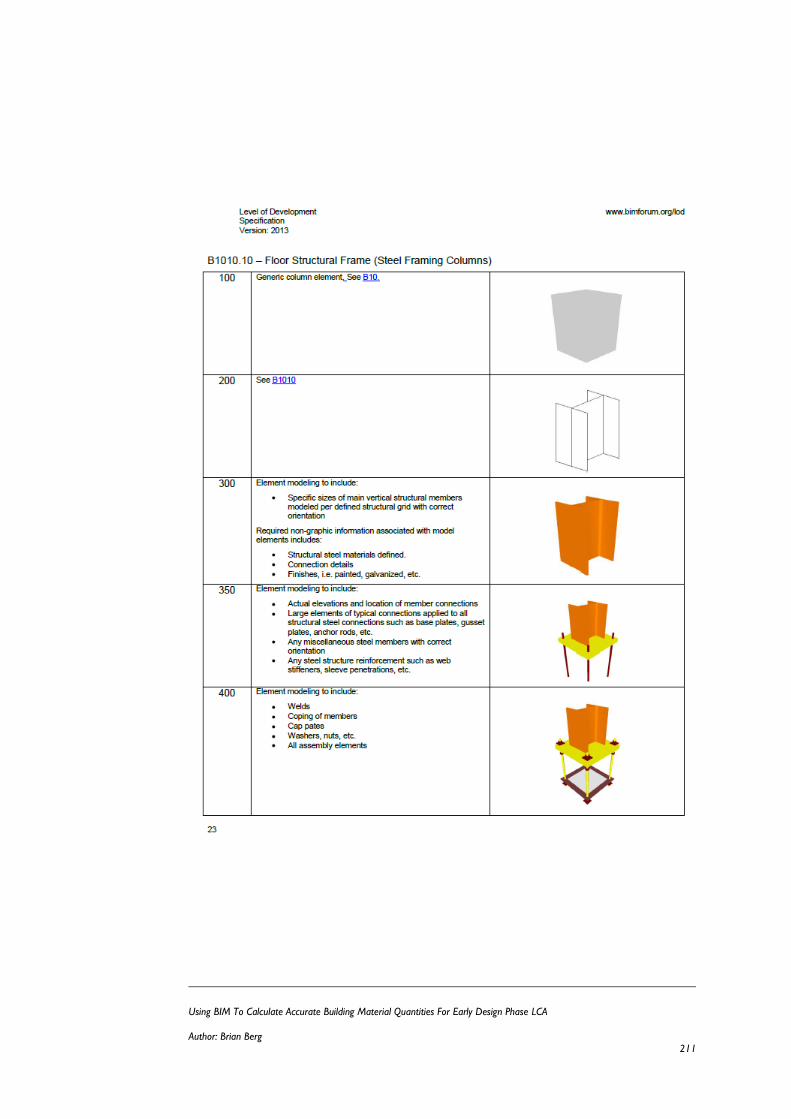
Using BIM To Calculate Accurate Building Material Quantities For Early Design Phase LCA
Author: Brian Berg 211
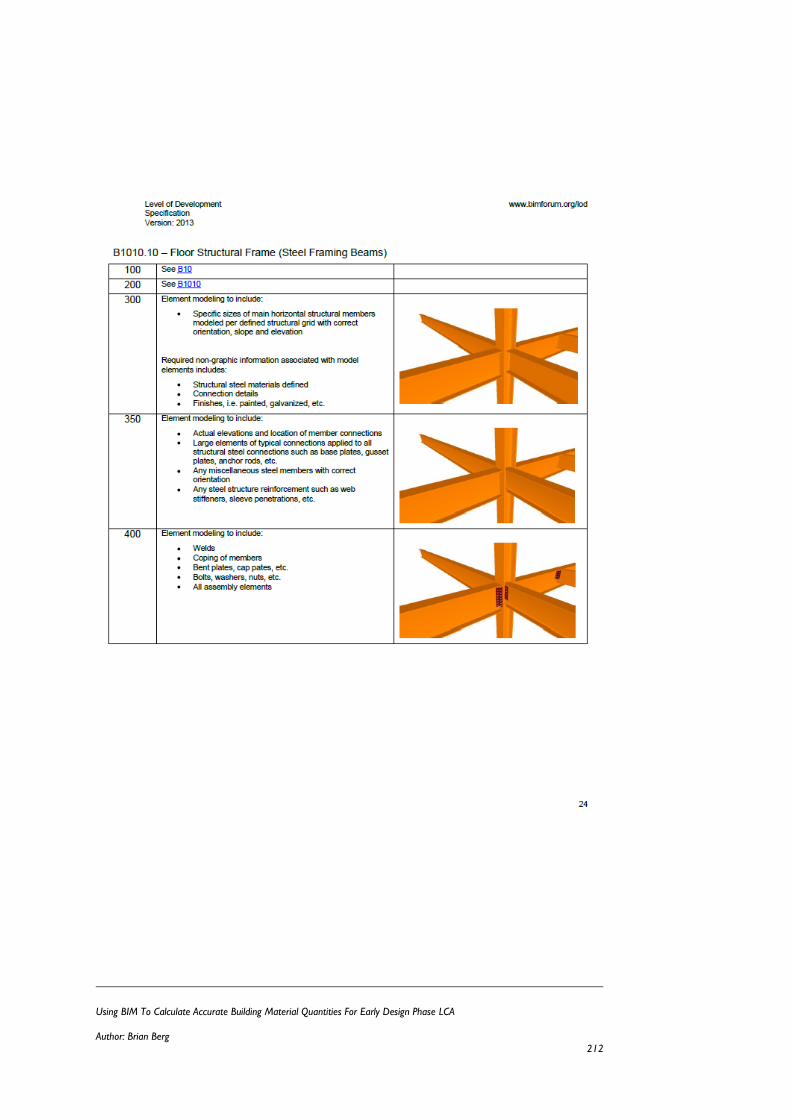
Using BIM To Calculate Accurate Building Material Quantities For Early Design Phase LCA
Author: Brian Berg 212
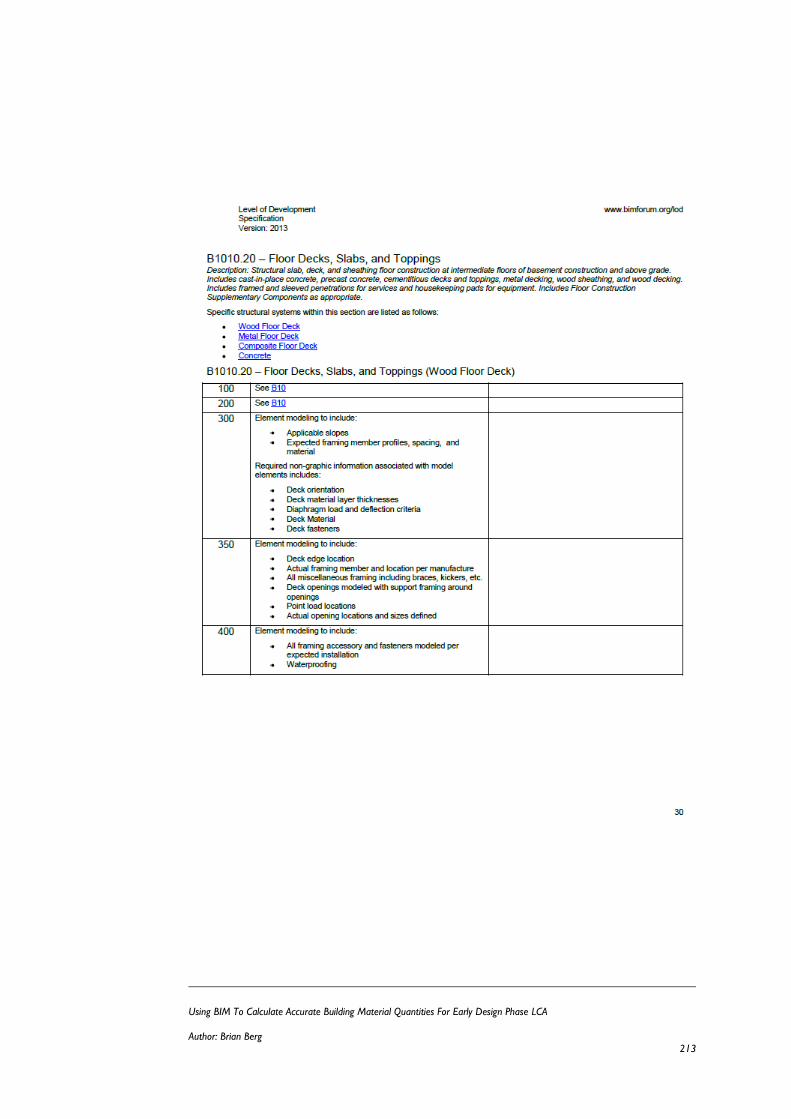
Using BIM To Calculate Accurate Building Material Quantities For Early Design Phase LCA
Author: Brian Berg 213
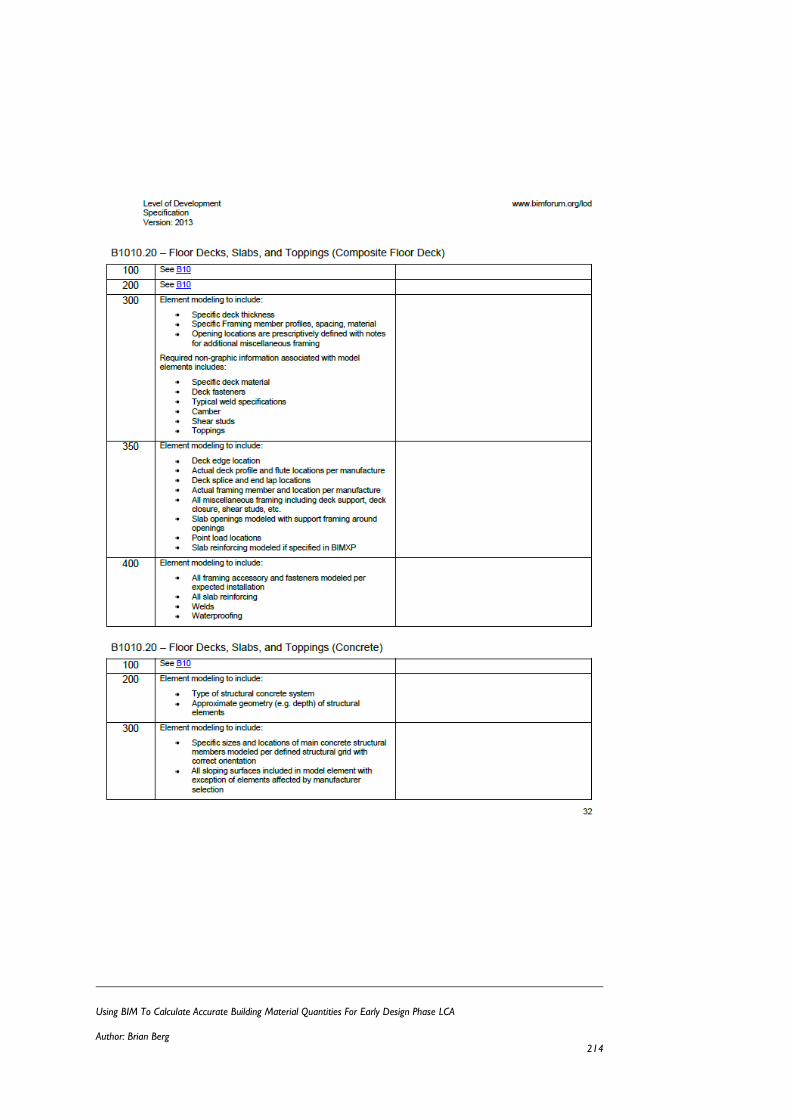
Using BIM To Calculate Accurate Building Material Quantities For Early Design Phase LCA
Author: Brian Berg 214
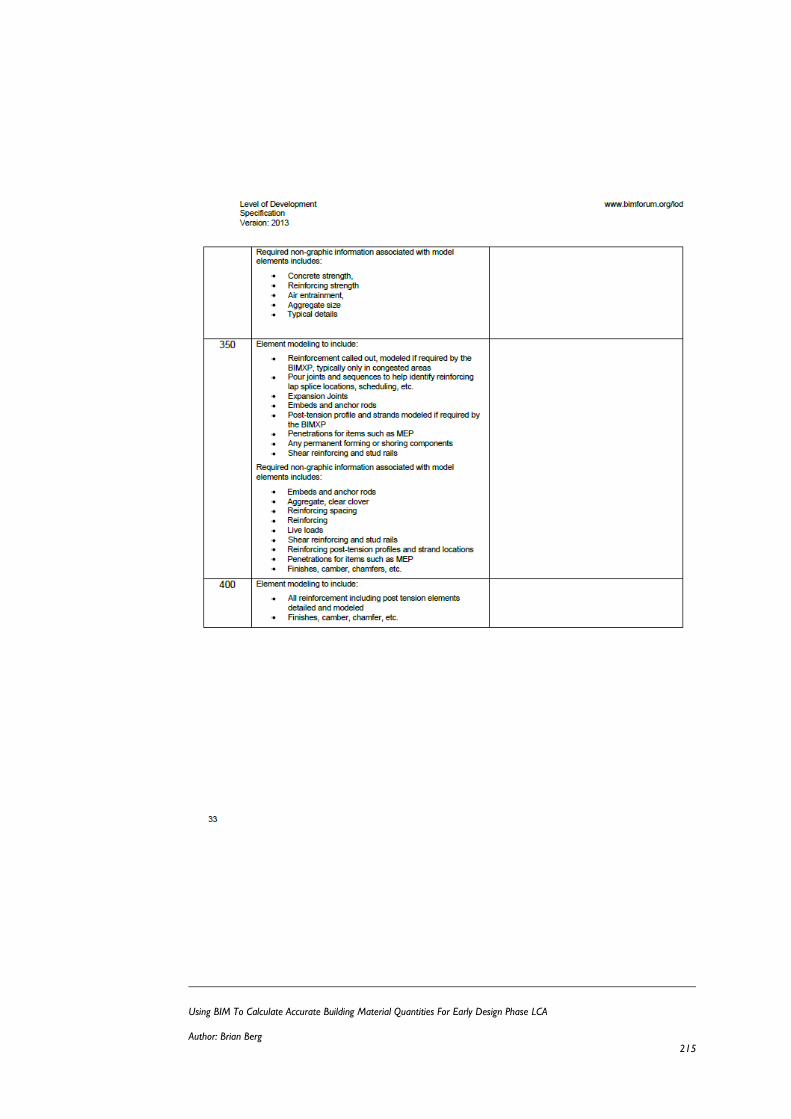
Using BIM To Calculate Accurate Building Material Quantities For Early Design Phase LCA
Author: Brian Berg 215
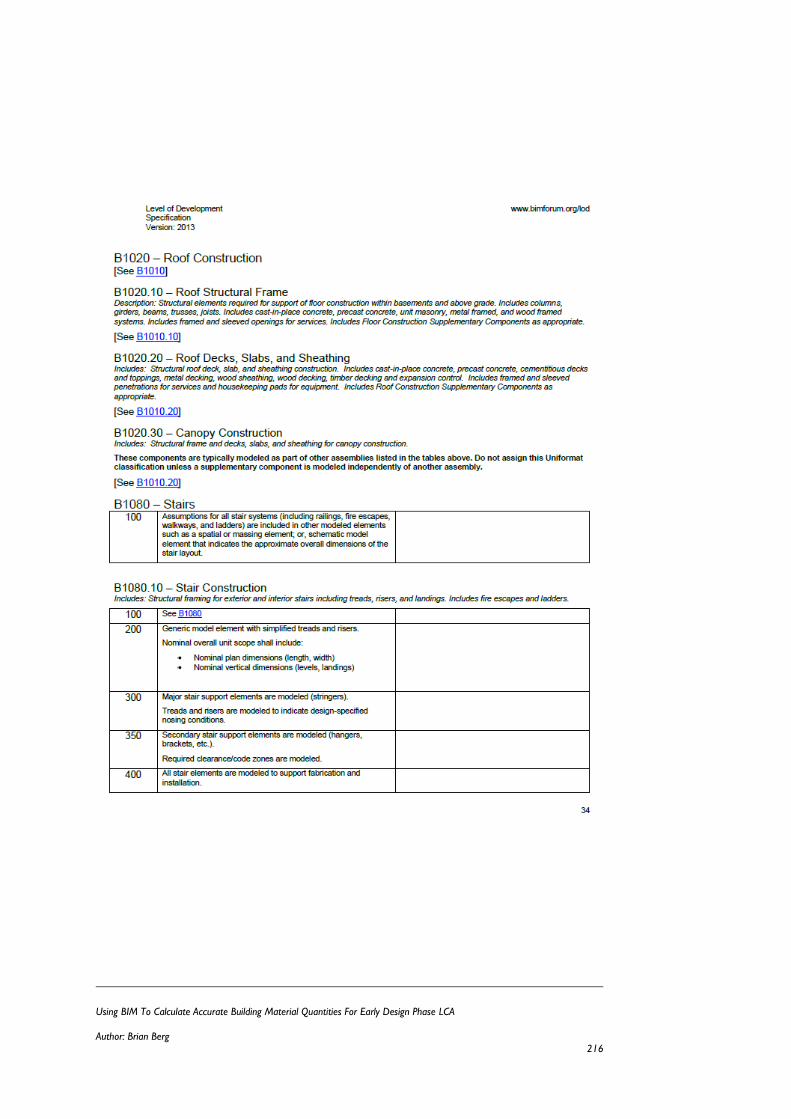
Using BIM To Calculate Accurate Building Material Quantities For Early Design Phase LCA
Author: Brian Berg 216
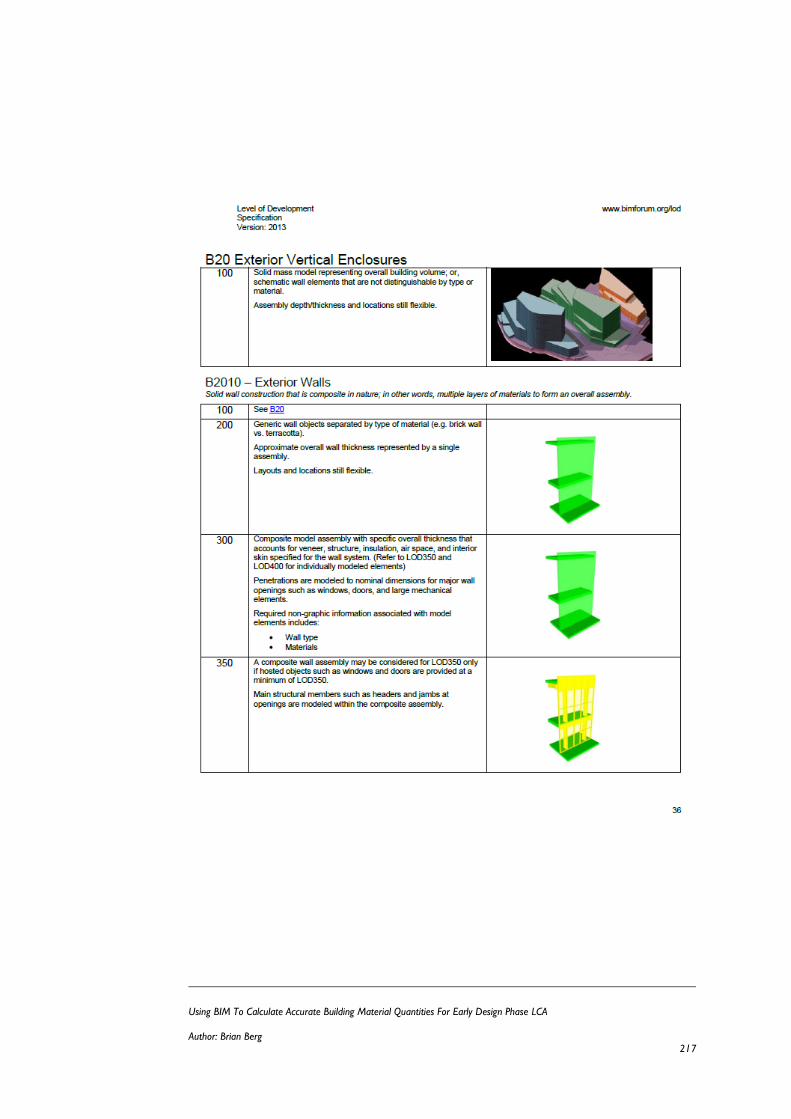
Using BIM To Calculate Accurate Building Material Quantities For Early Design Phase LCA
Author: Brian Berg 217
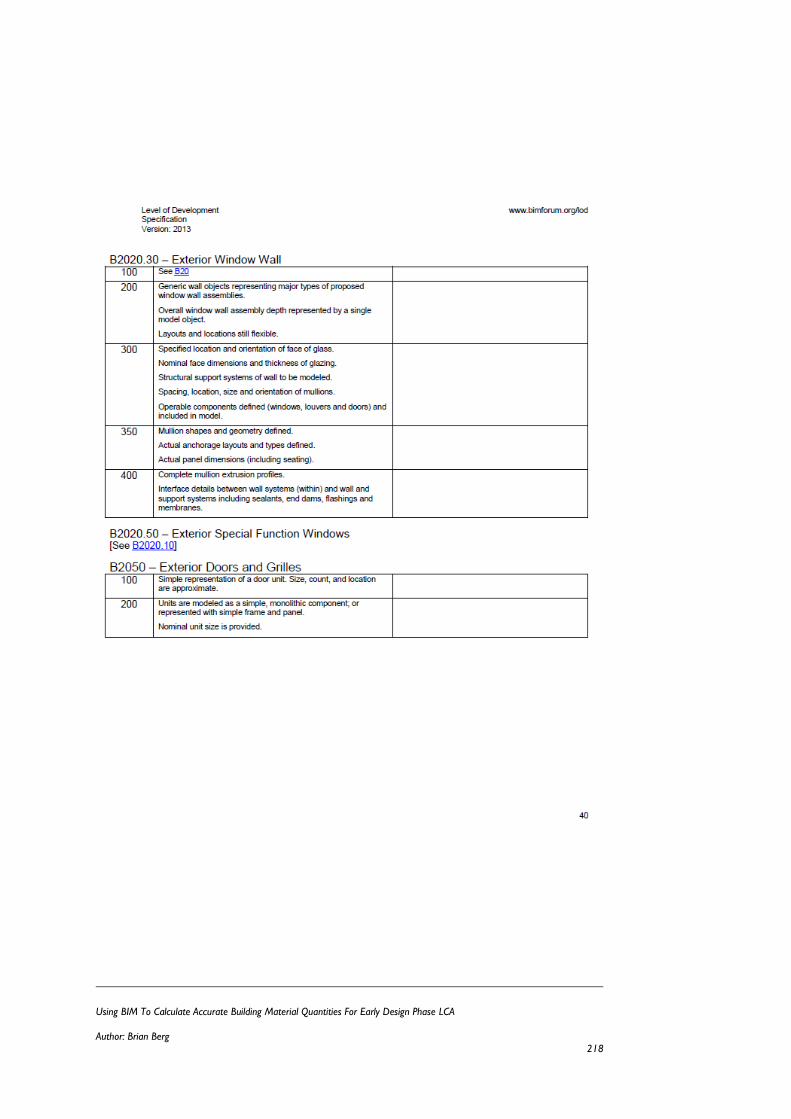
Using BIM To Calculate Accurate Building Material Quantities For Early Design Phase LCA
Author: Brian Berg 218