Embed Size (px)
Citation preview

INTtWNATIONAL JOURNAL kOR NUMERICAL AND ANALYTICAL METHODS IN GEOMECHANICS, VOL 20, 101-1 17 (1996)
USING DYNAMIC PHOTOELASTICITY TO EVALUATE THE INFLUENCE OF PARTING PLANES ON STRESS WAVES
INTERACTING WITH STOPES A. DAEHNKE
CSlR Mining Technology, Rock Engineering. PO Box 91230, Auckland Park 2006, New Zealand
A N D
H P. ROSSMANITH A N D R. E. KNASMILLNER
lnstifure of Mechanics. Technical University of Vienna, Wiedner Hauptstr. 8-101325. A-1040 Vienna. Austria
SUMMARY
Dynamic photoelasticity is used as a means for visualizing the complex interaction process between elastic waves and geometrical discontinuities. The photoelastic experiments are back-analysed by the dynamic finite difference program WAVE, and the code is assessed in terms of its accuracy and modelling capabilities. Three model geometries are investigated: (i) a stope situated within a homogeneous medium; (ii) a stope surrounded by softened material, the interface between the softened and bulk material being bonded and (iii) a stope situated within softened material, with a non-cohesive material interface. Prominent waves resulting from the diffraction, refraction and reflection of incident waves, as well as normalized dynamic stress intensifi- cation factors at the stope face, stope back area and along the hanging-wall skin are analysed in this study.
The parting planes are found to reflect a portion of the incident energy and thus shield the stope. However, a non-cohesive parting plane traps energy within the hanging-wall beam, and any shielding benefits are negated. WAVE has been proven to model accurately the diffraction, refraction and reflection of stress waves in a homogeneous medium and the interaction with cohesive and non-cohesive interfaces separating two material types.
KEY WOWDS: dynamic photoelasticity; strcss wavcs; WAVE; stress wave modelling
INTRODUCTION
In South African deep level gold mining, rockburst and rockfall related accidents account for approximately 40 per cent' of the fatalities. Due to high geological and mining-induced stresses, sudden shear can occur on planes of weakness, and the resulting seismic waves which interact with mining excavations can, in many cases, trigger rockbursts and rockfalls. To reduce the fatality rate and continue mining a t ever increasing depths, it is necessary to spend considerable effort on investigations dealing with mining related seismicity. The interactions of stress waves with stopes are investigated in this study.
Theoretical aspects of wave propagation and the interaction of stress waves with discontinui- ties such as cracks and the interface between two dissimilar media have been investigated in numerous studies. Amongst them Achenbach,' B rekhov~k ikh ,~ Rinehart; Borejko ef and Fokkema6 have concentrated on the geophysical aspects of wave interaction with geometrical discontinuities.
In spite of the large number of available theoretical analyses, it is difficult to obtain quantitative information of wave interaction in terms of stress magnitudes of real wave pulses. Of the few
CCC 0363-906 1/96/020 10 1-1 7 a 1996 by John Wiley & Sons, Ltd. Received 5 April 1995 Reoised 25 July I995

102 A. DAEHNKE et al.
experimental analyses that have been conducted, dynamic photoelasticity has been used success- fully in two-dimensional models. The photoelastic technique offers full-field visualization and gives wave characteristics and numerical data for dynamic processes. Information is obtained about instantaneous wave location and stress wave amplitude distribution over the entire region of interest and allows qualitative and quantitative interpretation of the complicated behaviour associated with stress wave interaction with discontinuities. The photoelastic technique has been used by Rossmanith and Knasmillner' and Rossmanith and Fourneya to investigate the effect of interfaces and interface cracks on wave propagation. Rossmanith and Knasmillner' also analysed the spalling, break-up and separation of layers due to an oblique incident stress wave.
This study concentrates on the application of the photoelastic method to investigate stress wave interactions with a stope and the effects of propagating waves on a cohesive and non- cohesive parting plane separating the rock massif from the stope hanging-wall beam. The dynamic finite difference program WAVE'" is used to back-analyse the photoelastic experiments. The purpose of the numerical investigation is to estimate the accuracy of the WAVE analyses when modelling stress waves propagating through layered media.
PROBLEM DEFINITION
The gold mined in South Africa occurs typically in tabular ore deposits. Narrow stopes give access to the reef, and the interaction between the mining excavations and the geological and
BLAST SOURCE
ET STIFFER ARALDITE B
STIFFER AR*LDKE B
Figure 1 . Typical mining geometry in South African gold mine (after Adams et a/."); also shown is the simplified model used for the photoelastic experiments

DYNAMIC PHOTOELASTICITY 103
dead-weight stresses leads to stress concentrations in the stope vicinity. The high stresses generate mining induced fractures. These can be broadly classified into two types: shear fractures which can penetrate up to 6 m into the hanging wall and footwall, and shorter extension fractures. Bedding or parting planes are stope-parallel geological features which are planes of weakness offering little or no cohesion.
Other geological planes of weakness such as faults and the interface between dykes and the rock massif are loaded by mining induced stresses, and sudden rupture can occur. Seismic waves, generated by the sudden rupture, interact with mining excavations, in some cases triggering rockbursts and rockfalls.
Figure 1 shows an idealized stope and some geological and mining induce features, namely bedding planes (l), shear fractures (2) and extension fractures (3) (Reference 11). Also shown is the idealized stope model used in this study. A horizontal slot, representing the stope, is cut into a strip of bi-refringent material (Makrolon) with a lower impedance than the Araldite B bi- refringent material. The Makrolon represents the heavily fractured, and thus softer, hanging wall and footwall beam, whilst the stiffer Araldite B models the surrounding rock massif.
The interface between Makrolon and Araldite B is either glued or left unglued, thereby representing either a cohesive or non-cohesive parting plane.
Mining induced seismicity is usually associated with shear type events. However, no experi- mental technique exists currently to generate shear type events in photoelastic models. In this study, stress waves are initiated by a point blast source, located in the hanging wall so that the blast induced waves travel through the fractured hanging-wall rock and interact with the stope.
EXPERIMENTAL PROCEDURE
Dynamic photoelasticity, in conjunction with high-speed photography, has been used to analyse the interaction between stress waves and an open slot. The modelling techniques of dynamic photoelasticity are well documented and detailed descriptions can be found in References 12and 13.
The plane models are cut from 6 mm thick plate. Two types of bi-refringent materials are used, namely Makrolon and Araldite B. The material properties of Makrolon and Araldite B are presented in Table 1. The material properties were established in previous unpublished work conducted by Knasmillner and Rossmanith at the Technical University of Vienna. Values of Young’s modulus and Poisson’s ratio were calculated by measuring the propagation velocities of longitudinal and transverse waves.
Using circularly polarized monochromatic light, optical interference of the bi-refringent mater- ial produces isochromatic fringe patterns, where an isochromatic contour is a line of equal
Table 1. Material properties of Makrolon and Araldite B
Makrolon Araldite B
P-wave speed 1795 m/s 2004 m/s 1156 m/s cs S-wave speed 900 m/s
CR Rayleigh-wave speed 855 m/s 1105 m/s E Young’s modulus 2.98 G Pa 4.49 GPa V Poisson’s ratio 0 4 9 033 P Material density 1230 kg/m3 1260 kg/m3 fo Material fringe value 18.75 MPa mm/fringe 1012 MPamm/fringe
CP

104 A. DAEHNKE rt a/ .
maximum shear stress. The order of interference N is related to the state of stress in the model by the stress-optic law, 0, - n2 = N f , / h (Reference 12), where 0, and g2 are the principal stresses, fo is the material fringe value and h is the model thickness.
Wave propagation through three model geometries (Models A, B and C) was investigated. All three models were cut to a rectangular shape with the length of the horizontal side equal to 408 mm and the vertical side 361 mm. A 5 mm wide, 150 mm long horizontal crack, representing a mining stope, was cut into the centre ofeach model. A 4 mm diameter hole was drilled 50 mm to one side and 75 mm above the centreline of the stope, and this hole was packed with PETN (pentaerythritol tetranitrate) explosive.
Stress waves were initiated by detonating 50 mg of PETN. This type of explosive is suitable for the dynamic loading of photoelastic models because the resultant stress pulse has a short rise time ( f 5 ps) with a mean pulse width of 15 ps. The explosive is packed in a 4 mm diameter borehole, and a pressure containment device prevents combustion gases venting. The denotation is triggered by a 2 k V DC voltage pulse.
Model A was constructed from Araldite B and was used to investigate the stress wave interaction with the stope in a homogeneous medium. Model B included of 45mm wide Makrolon layer in the model centre, the interface between the Makrolon and the Araldite B being bonded with U H U Plus Endfest 300 epoxy glue and allowed to set of 24 h. The glued interface represents a cohesive bedding plane, while the 20 mm Makrolon layer above and below the stope represents the fracture softened hanging wall and footwall beam. Model C consists of the same elements as Model B, however the interface between the Araldite B and Makrolon was not bonded, to allow the wave interaction with a non-cohesive bedding plane to be investigated. Figure 2 illustrates the geometrics of models A, B and C.
The models were placed in a rigid frame and the boundaries loaded by hydraulic jacks capable of applying 16 kN vertically and horizontally. To represent the geological stresses at depth, the models were loaded to 5.8 kN in the vertical direction and 3.0 kN in the horizontal direction, giving a k ratio of approximately 0-5. These were the maximum loads the models could sustain without becoming unstable and buckling, and without exceeding the elastic limit of the material when the static pre-stress was superimposed with the dynamic stress waves.
A Cranz -Schardin14 type multiple spark gap camera was used to record the dynamic fringe patterns. The camera is triggered by denotation of the explosive and the exposure of the first negative occurs after a selected delay period. Twenty four frames were recorded at discrete times during the dynamic event at a framing rate of 220,000 frames per second. A short exposure time of 200ns is necessary to record sharp photographic images of moving fringe pat terns.
NUMERICAL ANALYSIS PROCEDURE
The analysis of actual stress pulses was used to evaluate the dynamic finite difference program WAVE in terms of its accuracy and modelling capabilities. WAVE is a program that models wave propagation in a two- or three-dimensional elastic medium. Second-order interlaced finite difference equations are used on an orthogonal grid with uniform grid spacing. WAVE has the ability to model grid-based dislocations which can represent faults and tabular stopes, as well as incorporating various material properties.
WAVE analyses were completed in two steps: during Step 1, the stress field was applied to the model, and the program cycled until the velocities in the finite difference mesh were low enough ( < 1 per cent of velocities generated by blast waves) to accurately approximate equilibrium. In Step 2, a point source generated stress waves which interacted with the stope and parting planes.

DYNAMIC PHOTOELASTICITY
Araldite B
P M a k r o l o n
Araldite B
105
G l u e d
Model A:
Araldite B n
P M a krolo n
Araldite B
I) Araldite B .
IJ n 1" e d
Model B:
Model C:
Steps 1 and 2 were superimposed on each other in order to obtain the total elastodynamic behaviour.
The WAVE blast source was tailored such that the resulting far field stress pulse approximated the stress amplitude, pulse period and pulse shape of the stress wave propagating through the photoelastic models. Two-dimensional WAVE models are analysed in plane strain, whereas the photoelastic models are assumed to represent plane stress. The material properties used by the numerical analyses were determined by converting the material properties by Araldite B and Makrolon from a plane stress application to plane strain."
The non-cohesive interfaces were modelled with zero cohesion and with interface friction angles ranging from 0" to 30". Waves refracted and reflected by interfaces modelled with a 10" friction angle proved to correlate closest with the waves observed in the experiments.
The numerical models were discretized with a mesh consisting of 400 x 360 elements (element dimension: 1 mm x 1 mm), and the models were analysed on a 50 MHz 486 computer. Step 1 required approximately 8- 10 h run time, whereas to model the blast waves propagating across the area of interest (Step 2) required & 30 CPU minutes.

106 A. DAEHNKE et a/ .
PHOTOELASTIC AND NUMERICAL RESULTS
When investigating wave propagation in a two-dimensional plane, four wave types need to be considered. The longitudinal wave propagates at a velocity (c,) almost twice that of the transverse wave (cS). The propagation velocities c, and c, can be expressed in terms of Young’s modulus (E), density ( p ) and Poisson’s ratio ( v ) :
c, = \i” p ( l - v 2 ) ’
The absence of normal and shear tractions at a free boundary gives rise to additional stress waves: surface Rayleigh waves and von Schmidt or Headwaves.
When elastic waves interact with geometrical discontinuities or impedance mismatch zones, reflection, refraction and diffraction occur. To identify wave types clearly, the following notation is adopted: longitudinal, transverse, von Schmidt and Rayleigh waves are referred to as P, S, V and R waves, respectively. Reflected waves are labelled with subscript r, refracted (transmitted) waves are given the subscript t and diffracted waves are described by d. Waves reflected from the stope are given the additional subscript s. Thus, the S-wave generated by the reflection, at the stope of the incident P-wave is labelled S,,P. Diffracted waves are labelled with a superscript indicating the slot tip a or b at which they are diffracted. Subscripts + or - used in conjunction with the Rayleigh or von Schmidt waves, indicate whether the waves propagate along the top or bottom edge of the slot, respectively.
The interaction of waves with geometric discontinuities results in complicated wave patterns generated by the superposition of incident, diffracted, reflected and refracted waves. In many cases, most of the waves predicted by theory cannot be identified directly in photoelastic patterns, however the presence of the waves can be deduced from disturbances caused in the fringe pattern of other waves. To help identify some of the weaker waves, each of the photographs describing photoelastic fringes presented in this section will be accompanied by a diagram showing the theoretical wave pattern at that time instant. Longitudinal waves are indicated by solid lines, shear waves by dashed lines and von Schmidt waves by dash-dot-dash lines.
The leading black line of a stress wave is of fringe order N = 0.5. Due to the slope of the wave stress profile, this line does not represent the true wave front which is positioned just ahead of the first half order fringe. As the slope of the stress profile is different for the various wave types, and also depends on the extent to which the wave has attenuated, i t is difficult to estimate the exact position of the wave front. For this reason, the positions of the theoretical waves are demarcated by their maxima and not by their wave fronts.
Model A : Stope in a homogeneous medium
After applying the preload, Model A was loaded explosively and the resulting dynamic fringe pattern was recorded by the exposure of 24 photographs. One photograph exposed 92 p s after detonation is chosen to highlight prominent features of the wave interactions with a stope. Figure 3(a) displays the photoelastic fringe patterns and the corresponding theoretical wave pattern is given by Figure 3(b).
The incident P-wave has propagated 60 per cent along the stope hanging wall. The comparat- ively weak incident shear wave, generated by cracking at the blast hole, is just interacting with stope tip a, creating a stress concentration which can be identified by the pseudo-caustic at the bottom left-hand corner of the slot. The pseudo-caustic is formed by nesting of fringes beyond resolution power of the high-speed photographic system. The incident P-wave has attenuated to

DYNAMIC PHOTOELASTICITY 107
Figure 3(a). Model A: Photoelastic fringe pattern 92 ps after detonation
Figure 3(b). Model A: Theoretical stress wave maxima 92 /IS after detonation
Figure 3(c). A snapshot in time of isochromatic contours generated by a WAVE analysis 92 ps after blast source activation

108 A. DAEHNKE et d.
a maximum fringe value of 7, however at the point of reflection at the slot of fringe number increases to 11. During reflection at the slot, most of the incident P-wave energy is converted to a prominent shear wave (S,,P). Effects such as fringe islands and the bending of fringes indicate the presence of diffracted P-(PiP) and S- (S:P) waves. The characteristic wave shape of the Rayleigh wave is apparent in the footwall and five fringe lines can be discerned in the subsurface peak. Fringes indicating a von Schmidt wave at asin(c,/c,) = 35" to the stope between P i p and Si P can be identified.
Figure 3(c) shows the isochromatic pattern generated by WAVE 92 p s after source activation. The WAVE analysis compares very well with the photoelastic results and isochromatic lines indicating the S,,P, diffracted P-(P,"P) and S-(S:P) waves, Rayleigh (R) and von Schmidt (V) waves can be identified. The various waves types are identified in Figure 3(c).
Model B: Stope i n a softened layer with cohesive boundary
Figure 4(a) depicts the photoelastic fringes 95 p s after detonation in Model B, and Figure 4(b) gives the theoretical stress wave maxima. Most of the incident P-wave energy is refracted in the form of a P-wave (PIP) across the Araldite B .Makrolon interface, and the energy of the refracted P-wave is converted to a shear wave (S,,P, P) as reflection occurs at the hanging wall surface. Due to the slight acoustical impedance mismatch between Araldite B and Makrolon, i.e.
, only slight bending of the P- and S-waves occurs as the waves propagate from one medium to the next. The epoxy bond between the two bi-refringent material types is not separated by the tensile components of the stress waves, and fringe lines progress smoothly from one material into the next. Fringe patterns indicating Rayleigh and von Schmidt waves can easily be identified by comparing Figure *a) with qb).
Figure 4(c) shows the isochromatic pattern generated by WAVE 95 p s after source activation. The overall ischromatic WAVE contours compare well with the photoelastic results, and isochromatics indicating the S,P, P,P, S,,P,P as well as Schmidt waves can be identified.
Araldilc B = 1.14 (PCp)Makrolon (Pep)
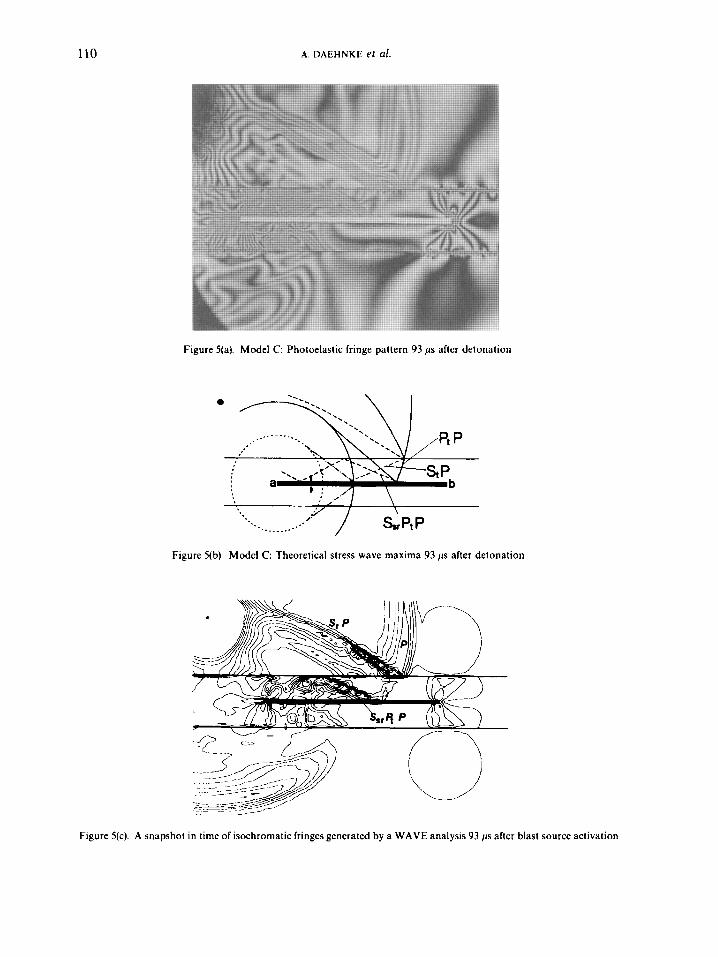
Model C: Stope is a softened layer with non-cohesiue boundary
The frame chosen to describe wave interaction in Model C was exposed 93 ps after detonation (Figure 5(a) describes the photoelastic fringes, and Figure 5(b) gives the theoretical wave positions). The energy of the incident P-wave has been partitioned into reflected P- and S-waves, and refracted P- and S-waves. Traces of all four of these wave types are apparent in the photograph, however the most prominent are the SrP and PIP wave. As in the photographs describing the fringes of Models A and B, the formation of a strong shear wave due to the reflection of the transmitted P-wave (S,, PIP) is visible. The S,,P, P wave is reflected at the Araldite B/Makrolon interface and the energy is redirected back towards the stope in the form of a S,Ssr PI P and PrSs, P, P wave.
The wave pattern of Model C is quite different to that of Model B. The non-cohesive boundary traps energy in the form of reflected shear waves, whereas the cohesive boundary transmitted most of the shear wave energy. This is an important effect which will influence the dynamic hanging-wall behaviour.
The isochromatic contours calculated by WAVE 93 p s after sourcc activation for Model C are displayed in Figure 5(c). Prominent wave types consistent with the photoelastic results are a strong shear wave reflected by the material interface (SrP), the reflection of the transmitted P-wave at the stope (S,,P1P) , and the high density of reflected waves within the hanging-wall beam. By comparing Figures 5(a) and 5(c), it is evident that the isochromatic contours calculated

DYNAMIC PHOTOELASTICITY 109
Figurc qa). Model B: Photoelastic fringe pattern 95 pi after detonation
Figure
P., P, P S.,Pt P
qb). Model B: Theoretical stress wave maxima 95 pi after detonation
Figure qc) . A snapshot in time of isochromatic fringes generated by a WAVE analysis 95 ps after blast, source activation
110 A. I IAEHNKE et al.
Figure 5(a). Model C: Photoelastic fringe pattern 93 /is after detonation
Figure 5(b). Model C: Theoretical stress wave maxima 93 p after detonation
Figure 5(c). A snapshot in time of isochromatic fringes generated by a WAVE analysis 93 /is after blast sourcc activation

DYNAMIC PHOTOEI.ASTICITY 111
by the numerical analysis correlate closely to the actual contours observed in the photoelastic experiments.
ANALYSIS OF RESULTS
High dynamic stresses in the rock immediately adjacent to the stope are critical as they can initiate rockbursts and rockfalls which endanger human life and disrupt mining operations. In this study, the dynamic stresses are analysed in the following three critical zones: (i) the stope face, (ii) the back face, and (iii) the hangingwall skin. By plotting the isochromatic fringe order distribution along the surface of the critical zones, the dynamic stresses can be determined, and the effect of cohesive and non-cohesive bedding planes can be evaluated. To allow a direct comparison of the stress magnitudes in the critical zones of the three models, the fringe orders are normalized relative to the peak stress propagated within the incident P-wave.
At free boundaries, the principal stress normal to the boundary is zero. Since the fringe order distribution is determined along the surface of the critical zones, the fringe order is directly proportional to the non-zero principal stress which acts parallel to the boundary. The stress-optic law is used to calculate the non-zero principal stress o?;;' which consists of a static and a dynamic component. As the static and dynamic components also act along the boundary,
atotal - static + adynamic 112 - O.l/Z 1/2
The dynamic stress component along the free boundary due to the incident waves can thus be calculated by subtracting the static stress from the total stress; both the static and total stresses can be calculated by means of the stress-optic law.
Stope face
In many of the photographs depicting the isochromatic fringes, the top and bottom corners of the stope face are obscured by pseudo-caustics, thus making it impossible to estimate the fringe density. It is only possible to count the fringe order at the centre of the stope face, and Figure 6 shows a graph of the normalized intensification factor at the stope face centre versus time after detonation.
The P-wave interacts with the stope face approximately 40 p s after detonation (vertical line 1). The stope faces of Models A and B are subjected to similar stress intensification, as the bonded Araldite B and Markrolon interface transmits most of its incident P-wave energy. For Model C, the first frame was only exposed 59 ps after detonation, thus making it impossible to establish the peak stress intensification factor due to the incident P-wave. The P-wave reflected by the left-hand model boundary interacts with the stope face 112 p s after detonation (line 3).
Back face
As was the case with the stope face analysis, the intensification factor in the back area of the stope is calculated at the face centre. Figure 7 shows the intensification factor versus time after detonation for the three experimental models.
In Models A and B, the intensification factor increases as the P-wave interacts with the stope end. For Model A, this occurs at 107 ps , whereas in the case of Model B, the arrival of the P-wave pulse is delayed due to the slower hanging-wall material (arrival time of P IP = 118 ps) . In Model C, the factor increase is delayed even longer because very little energy is transmitted by the

112
1 -
0.8
0.6
0.4
0.2
-0.2 -0.4
A. DAEHNKE el a/.
1 2 3 :
.
7
- . .. :
o & 7
I 1 I I ,
Stope Face Centre (tip a)
I ModelA Model6 -ModelCI
Figure6. Dynamic intensification factor at stope face centre: (1) P-wave arrival time, (2) S-wave arrival and (3) P, boundary P arrival, i.e. the arrival of the P-wave reflected from the left-hand model boundary
Stope Back Face Centre (tip b)
Intensification Factor 0.6
1 2 3 4
0.4 1 j
-0.4 I I , , I I I I , I 1 1 1 1 1 1
100 120 140 160 180 200
Time after Detonation (micro sec.) 1 -Model A Model 6 - - Model C I
Figure 7. Dynamic stress intensification factor at stope back face centre: ( I ) P-wave arrival time in Model A, (2) P,P arrival time in Model B. (3) S.,P,P arrival time in Model C and (4) pcak Rayleigh wave stresses in Model A.

DYNAMIC PHOTOELASTICITY 113
incident P-wave striking the Araldite B-Makrolon interface at a shallow angle. Thus, the first wave to interact with the stope end is S,,P,P.
At 204ps, the stope end of Model A experiences a large stress intensification due to the Rayleigh wave. It is difficult to establish if the Rayleigh waves propagating in Models B and C also generate high stresses, as in the case of Model B, the last frame was exposed after 210 ps and in Model C, although capturing photographic recordings up to 241 ps , the fringe patterns were not clear enough to allow meaningful interpretations. In two dimensions Rayleigh surface waves attenuate more slowly than body waves,16 and therefore it is expected that the highest stress intensification in the back area of the stope is due to the Rayleigh wave.
Aside from the stress induced by the Rayleigh wave, the peak stress intensification factors of Models B and C are 58 and 74 per cent higher than in Model A.
Hanging-wall skin
The procedure followed to calculate the normalized stress intensification factor at the face centres is repeated along the hanging-wall skin. It is instructive to plot the stress in three- dimensional form. The two horizontal co-ordinate axes represent hanging-wall position (X-axis) and time (Y-axis), and the vertical axis represents normalized stress. Figures 8 ,9 and 10 give the three-dimensional plots for the normalized hanging-wall skin stress of models A, B and C, respectively. Also shown are the equivalent three-dimensional plots of normalized hanging-wall stress versus stope position and time as calculated by WAVE.
A third-order interpolation function in space and time was applied to the data generating the carpet plots of the experimental and numerical models. The interpolation function was integrated along the stope from 0 to 150 m and in time from 60 to 129 ps , thus yielding an energy measure describing the influence of cohesive and non-cohesive parting planes. Due to the different attenuation rates and pulse widths, the energy measure of the photoelastic model cannot be compared directly to the numerical model, however a direct comparison is possible between Models A, B and C.
The carpet plots of normalized hanging-wall skin stress along the stope versus time for Models A, B and C are summarized below:
Model A: The most prominent feature of the photoelastic and WAVE carpet plots is a ridge of high stresses propagating along the hanging-wall at the point where the incident P-wave is reflected. Both plots exhibit the surface isotropic point (zero stress) bounded by the leading and trailing surface peak of the Rayleigh wave propagating at just under half the P-wave speed. A more detailed description of the stress distribution within a Rayleigh wave can be found in Reference 17.
Model B: The stress peak at the point of reflection of the P,P wave is less than the stress generated by the reflection of the incident P-wave in Model A, due to a portion of the incident energy being reflected by the Araldite B-Makrolon interface and thus the P,P wave is of lower magnitude. Stresses propagating behind the reflection point are due to Rayleigh and von Schmidt waves, and comparatively low magnitude S,S,,P, P and P,S,,P, P waves which are reflected by the material interface back towards the stope. Both the photoelastic and WAVE carpet plots exhibit these features, however in the numerical model, less energy is present behind the reflection point of the PIP wave. In the photoelastic case, the total energy between 60 and 129 p s is 76 per cent of the hanging-wall energy in Model A, whilst in the numerical model the total energy is 70 per cent of Model A.

I14 A. DAEHNKE et a/.
Figure @a). Photoelastic experiments - normalized stress along the hanging-wall skin for Model A
Figure 8(b). WAVE-normalized hanging-wall stress as a function of time for Model A
The cohesive parting plane reflects a portion of the incident energy, the waves reflected by the stope arc transmitted back into the bulk material, and thus it is expected that the total hanging-wall energy is less in Model B than in Model A. Model C: The incident P-wave energy refracted across the interface decreases as the angle of incidence increases (measured from vertical), and thus the stress at the P, P wave reflection point decreases with increasing distance along the hanging-wall. In both the photoelastic and numerical

DYNAMIC PHOTOELASTICIN 115
Figure 9(a). Photoelastic experiments- -normalized stress along the hanging-wall skin for Model B
Figure 9(b). WAVE - normalized hanging-wall stress as a function of time for Model B
cases, most of the refracted incident energy is reflected by the stope in the form of a shear (S,,P, P), which is reflected at the Araldite B-Makrolon material interface and redirected back towards the stope. The high stresses propagating behind the P,P wave ridge shown in Figures 1qa) and 1qb) are due to waves reflected by the material interface back towards the stope.

116 A. DAEHNKE et al.
Figure lqa) . Photoelastic experiments - normalized stress along the hanging-wall skin for Model C
Figure Iqb). WAVE-normalized hanging-wall stress as a function of time for Model C
The total energy along the hanging-wall skin in Model C is 96 per cent of Model A in the experimental case, and 92 per cent of Model A in the numerical Model. In Model C, a portion of the incident energy is reflected by the material interface, however the non-cohesive parting plane traps reflected waves in the hanging-wall beam, and the total hanging-wall skin energy of Model C is similar to the energy of Model A.

DY NAMlC PHOTOELASTICITY I17
CONCLUSIONS
Dynamic photoelasticity is a useful experimental technique for visualizing complex stope-wave interactions and obtaining quantitative information in terms of stress magnitudes of real wave pulses. The experimental technique is one of the few means available for judging the quality of numerical simulations of dynamic behaviour. The dynamic finite difference program WAVE has been proven to model accurately the diffraction, refraction and reflection of stress waves in a homogeneous medium and the interaction of waves across cohesive and non-cohesive interfaces separating two material types.
The experimental and numerical work described here has demonstrated that parting planes reflect a portion of the incident energy and thus shield the stope. A cohesive parting plane allows stress waves reflected by the stope to reenter the surrounding material. However, a non-cohesive parting plane traps energy within the hanging-wall beam, thereby negating any shielding benefits associated with parting planes.
This work is limited by the simplified and idealized nature of the model geometries analysed. Further investigations are currently conducted, using dynamic photoelasticity, on the wave interactions in more complicated model geometries incorporating discontinuities representing shear fractures, and the dynamic extension of the shear fractures due to blast induced stress waves is investigated.
ACKNOWLEDGEMENTS
The authors would like to express their sincere thanks to the Department of Mineral and Energy Affairs for permission to publish, and to J. A. L. Napier and E. Siebrits for their excellent co-operation and assistance. The use of the facilities of the Photomechanics Laboratory of the technical University of Vienna during the course of this work is kindly acknowledged.
REFERENCES
1. R. Heunis, ‘The development of rock-burst control strategies for South African gold mines’, J.S. Afr. fnst. Min.
2. J. D. Achenbach, Wave Propagation in Elastic Solids, North-Holland, Amsterdam, 1973. 3. L. M. Brekhovskikh, Waves in Layered Media, Academic Press, New York, 1960. 4. J. S. Rinehart, Stress Transients in Solds, HyperDynamics, Santa Fe, New Mexico, 1975. 5. P. Borejko, H. P. Rossmanith and Y. Z. Wei, ‘Stress waves in layered rocks’, Acta Mech. 92, 175 181 (1992). 6. J. T. Fokkema, ‘Reflection and transmission of elastic waves by spatially periodic interface between two solids
7. H. P. Rossmanith and R. E. Knasmillner, ‘Application of photomechanics to studies of fracture in jointed rock’, in
8. H. P. Rossmanith and W. L. Fourney, ‘Fracture initiation and stress wave diffraction at cracked interfaces in layered
9. H. P. Rossmanith and R. E. Knasmillner, ‘Spallation, break-up and separation of layers by oblique stress-wave
Metall., 80, 139.-149 (1980).
(Numerical results for the sinusoidal interface)’, Wave Motion, 3, 33-48 (1981).
Rossmanith (ed.). Mechanics of Jointed and Faulted Rock, Balkema, Rotterdam, 1990, pp. 285-293.
media. 1. Brittle/brittle transition’, Rock Mech.. 14, 209-233 (1982).
incidence’, in Rock Fragmentation by Blasting, LuleA, Sweden, 1983. 10. M. W. Hildyard, Personal communication, CSlR MiningTek, Rock Engineering, 1994. 1 I . G. R. Adams, A. J. Jager and C. Roering, ‘Investigation of rock fractures around deep-level gold mine stopes’, Proc
12. J. W. Dally and W. F. Riley. Experimental Stress Analysis, McGraw-Hill, New York, 1978. 13. H. P. Rossmanith and W. L. Fourney, Ruck Fracture Mechanics, Springer, Wien-New York. 1983. 14. C. Cranz and H. Schardin, ‘Kinematographie auf ruhendem Film und mit extrem hoher Bildfrequenz’, Zei t s j : Physik,
15. R. E. D. Bishop, ‘On dynamical problems of plane stress and plane strain’ Quart. J. Mech. Appl. Math., 6 , 25&254
16. K. F. Graff, Wave Motion in Elastic Solids, Clarendon Press, Oxford, 1975. 17. H. P. Rossmanith, ‘Fracture initiation by Rayleigh-wave diffraction’, Theoret. Appl. Fracture Mech., 1, 257-269
22nd U S . Sym. Ruck Mech., 1981, pp. 213 218.
56, 147 ( 1 929).
(1953).
(1984).


![1989] A Federal Parting ofthe Ways A FEDERAL PARTING OF](https://img.pdfslide.net/doc/110x75/6263dec7bc1ba81b00013dd7/1989-a-federal-parting-ofthe-ways-a-federal-parting-of-.jpg)