Embed Size (px)
Citation preview
Finger Lakes Health Systems Agency
Using ED and Readmissions Data to Develop Strategies that Reduce Cost and Improve Care
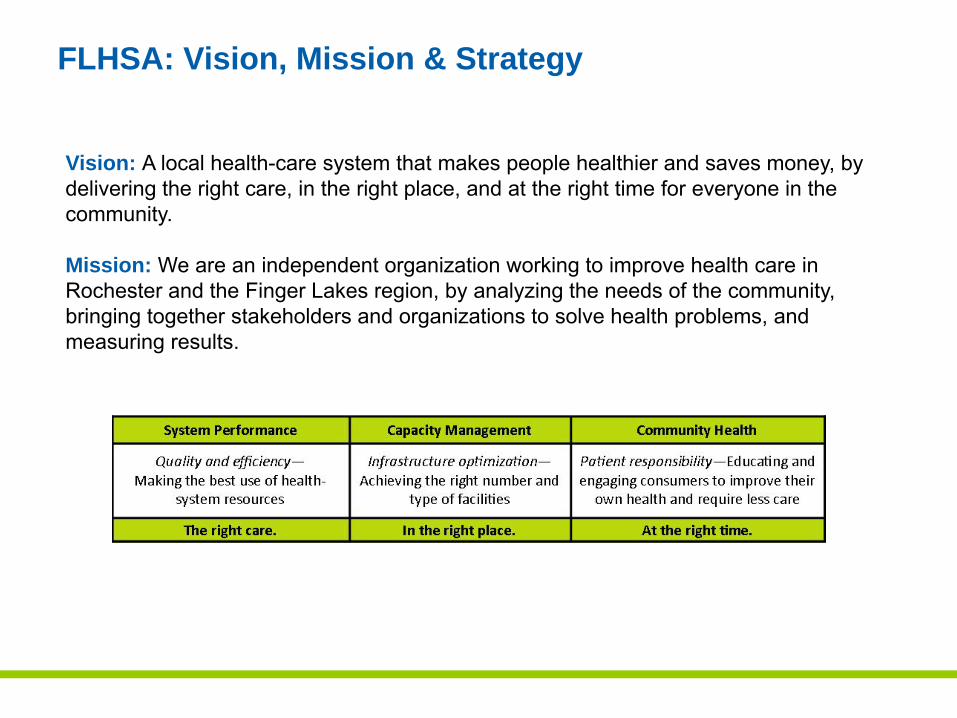
Vision: A local health-care system that makes people healthier and saves money, by delivering the right care, in the right place, and at the right time for everyone in the community.
Mission: We are an independent organization working to improve health care in Rochester and the Finger Lakes region, by analyzing the needs of the community, bringing together stakeholders and organizations to solve health problems, and measuring results.
FLHSA: Vision, Mission & Strategy
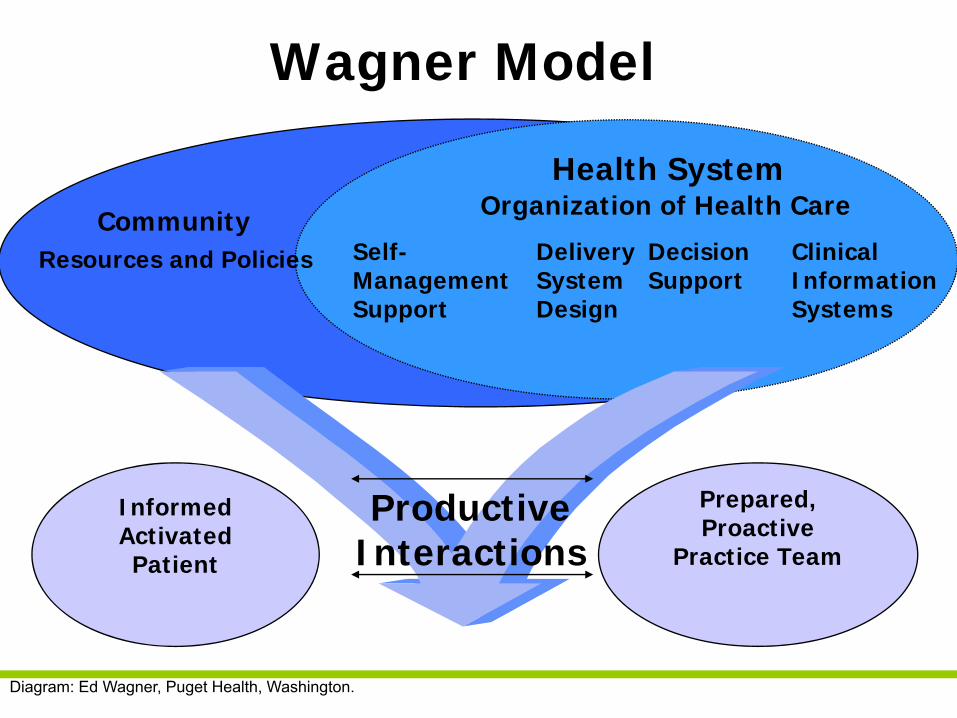
Community Resources and Policies
Health SystemOrganization of Health Care
Self-Management Support
Delivery System Design
Decision Support
Clinical Information Systems
Informed Activated Patient
Prepared, Proactive
Practice Team
Wagner Model
ProductiveInteractions
Diagram: Ed Wagner, Puget Health, Washington.
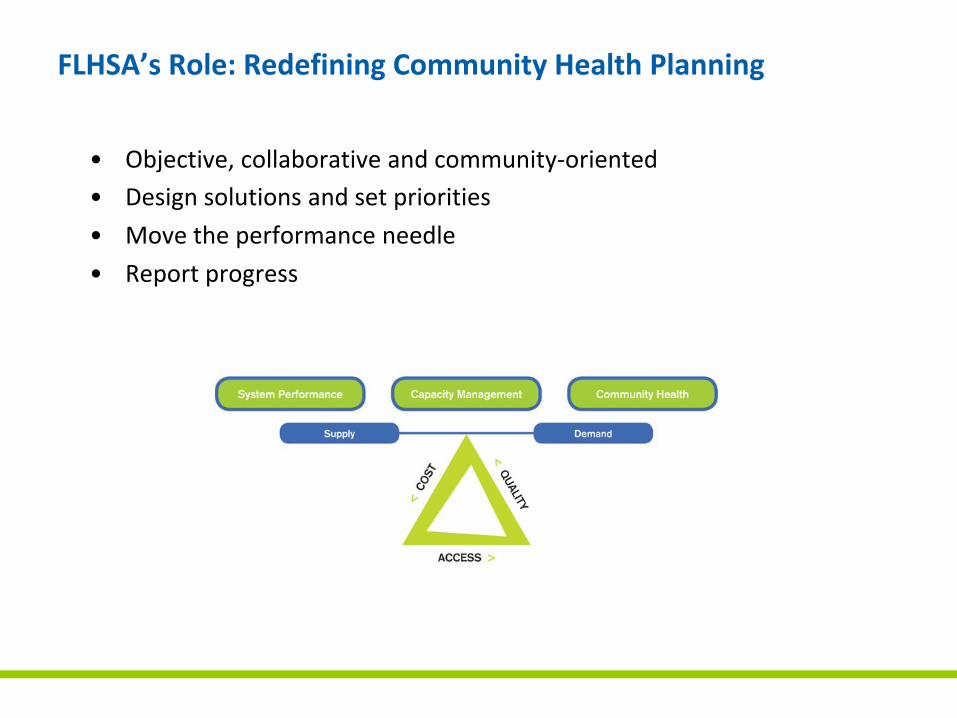
FLHSA’s Role: Redefining Community Health Planning
• Objective, collaborative and community‐oriented • Design solutions and set priorities
• Move the performance needle
• Report progress
Data Analysis on Hospital Capacity
• Characteristics of High Performing Health Systems– Rochester Region Comparisons
– Use rates
• Impact of utilization drivers on future capacity requirements– Population and Demographics
• Disparities
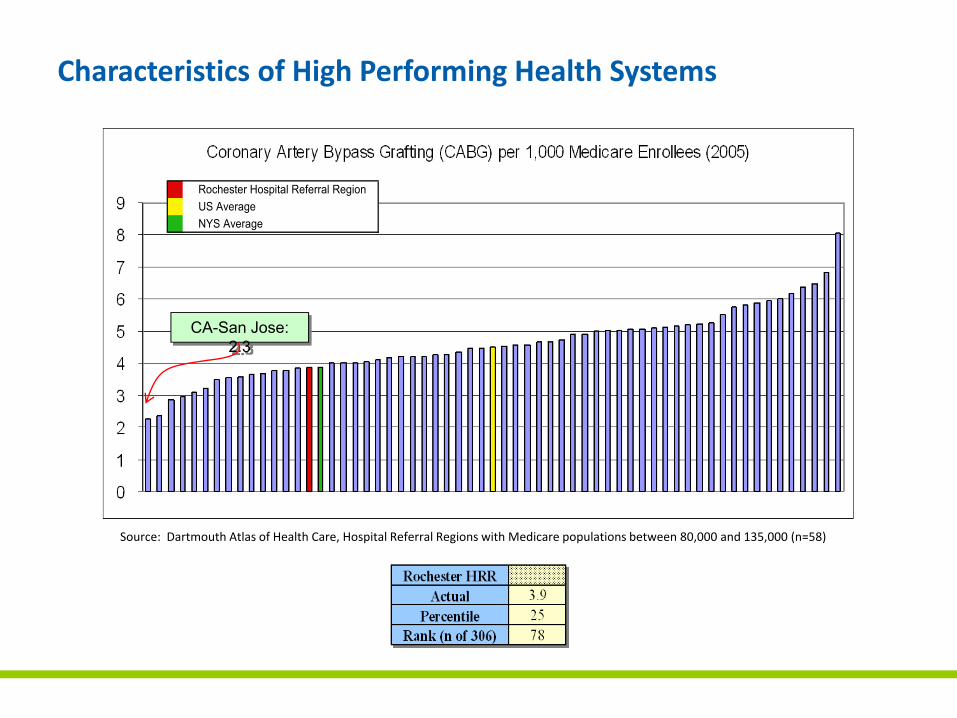
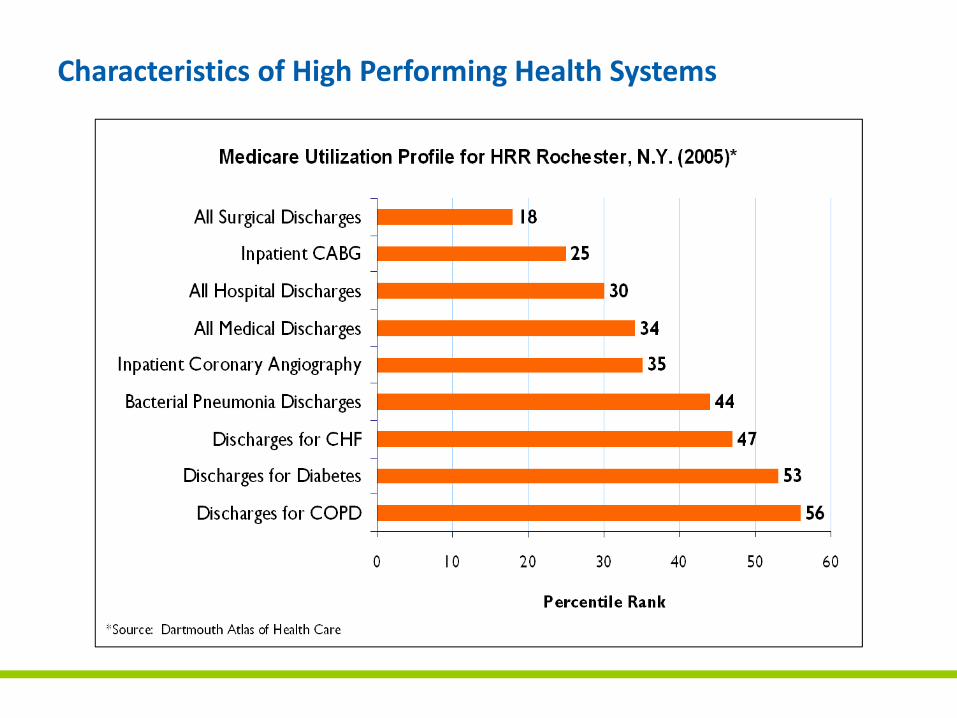
Characteristics of High Performing Health Systems
Source: Dartmouth Atlas of Health Care, Hospital Referral Regions with Medicare populations between 80,000 and 135,000 (n=58)
CA-San Jose: 2.3
Rochester Hospital Referral RegionUS AverageNYS Average
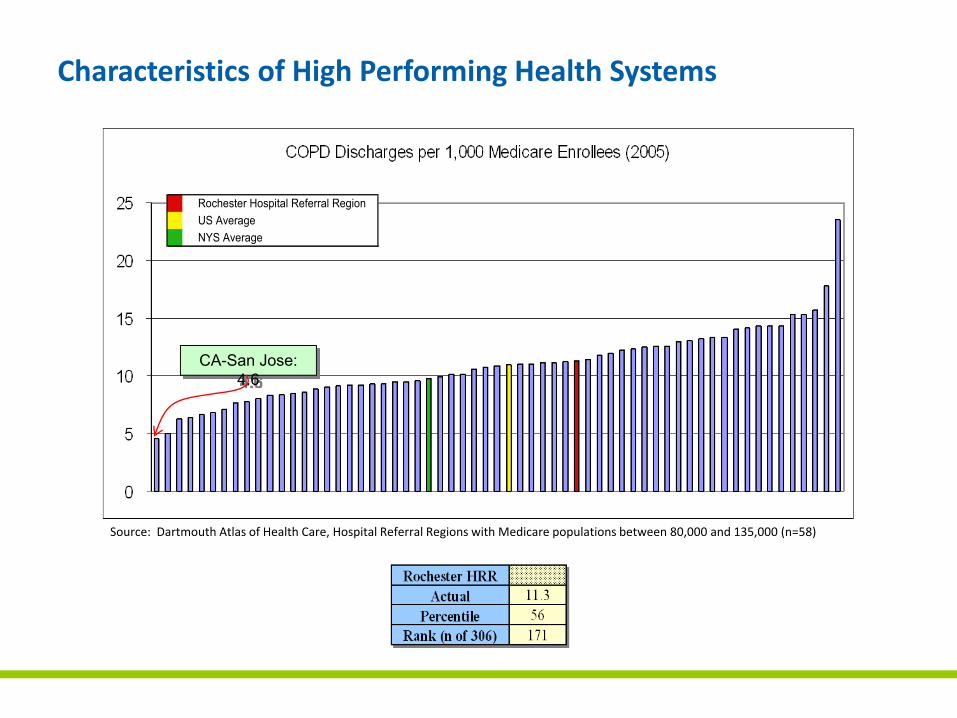
CA-San Jose: 4.6
Rochester Hospital Referral RegionUS AverageNYS Average
Source: Dartmouth Atlas of Health Care, Hospital Referral Regions with Medicare populations between 80,000 and 135,000 (n=58)
Characteristics of High Performing Health Systems
Characteristics of High Performing Health Systems
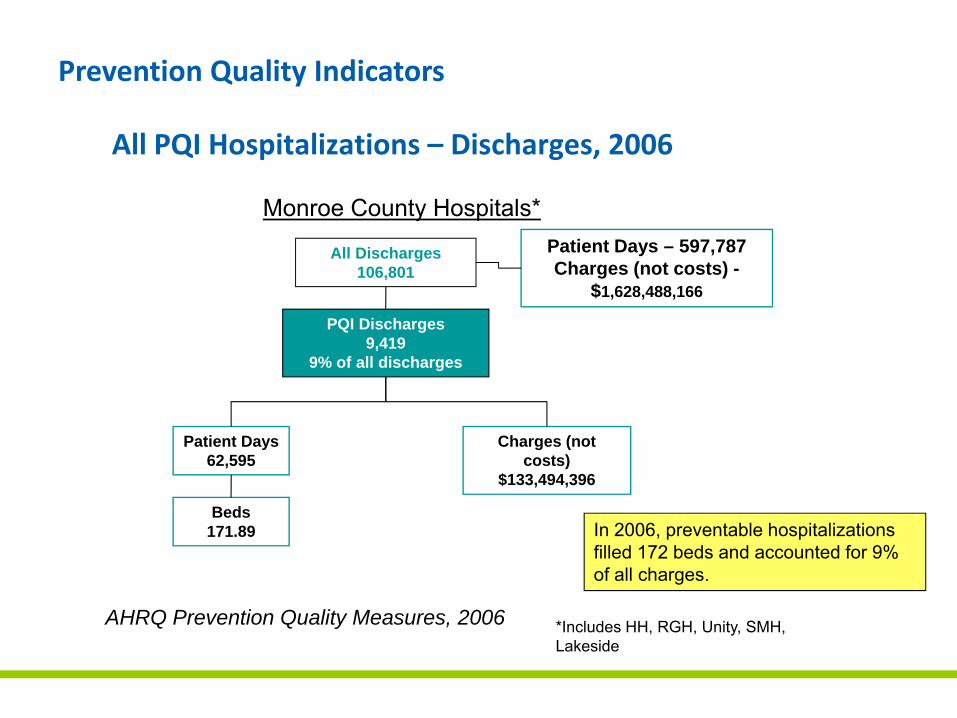
All PQI Hospitalizations – Discharges, 2006
AHRQ Prevention Quality Measures, 2006 *Includes HH, RGH, Unity, SMH, Lakeside
Monroe County Hospitals*
All Discharges106,801
PQI Discharges9,419
9% of all discharges
Patient Days62,595
Charges (not costs)
$133,494,396
Beds171.89
Patient Days – 597,787Charges (not costs) -
$1,628,488,166
In 2006, preventable hospitalizations filled 172 beds and accounted for 9% of all charges.
Prevention Quality Indicators
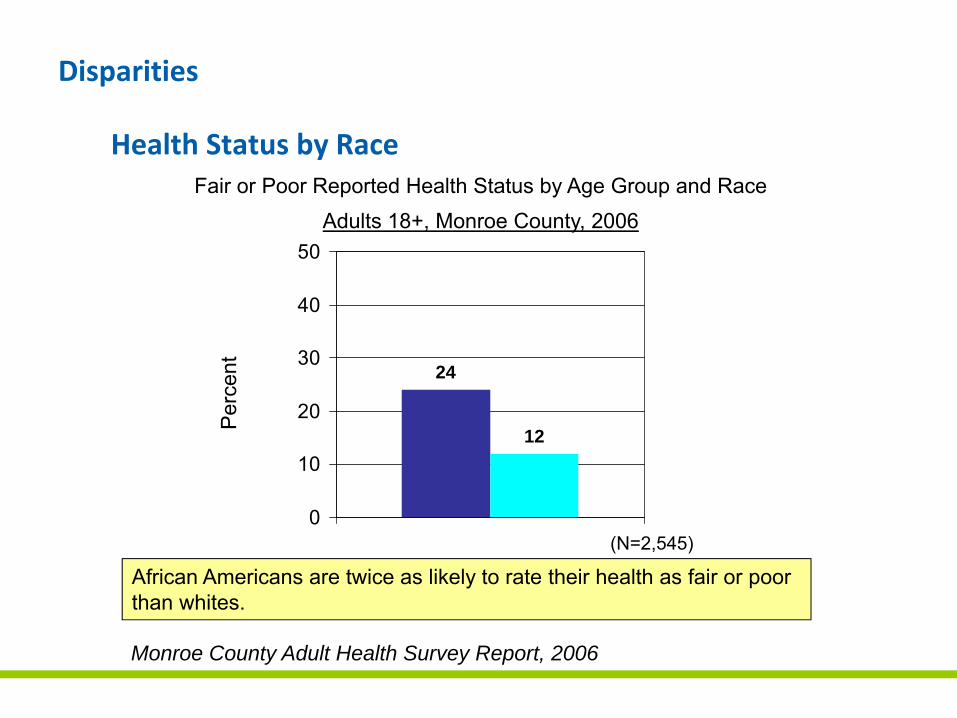
Health Status by Race
24
12
0
10
20
30
40
50
Monroe County Adult Health Survey Report, 2006
Fair or Poor Reported Health Status by Age Group and RaceAdults 18+, Monroe County, 2006
(N=2,545)
African Americans are twice as likely to rate their health as fair or poor than whites.
Per
cent
Disparities
0 500 1000 1500 2000 2500Annual AvgYPLL / 100,000 Age-Sex Adj
Chronic Liver Disease
HIV
Diabetes
Cerebrovascular Diseases
Homicide
Peri-natal Conditions
Heart Disease
Cancer
White non-Latino
Latino
African American
Finger Lakes Region Rate per 100,000
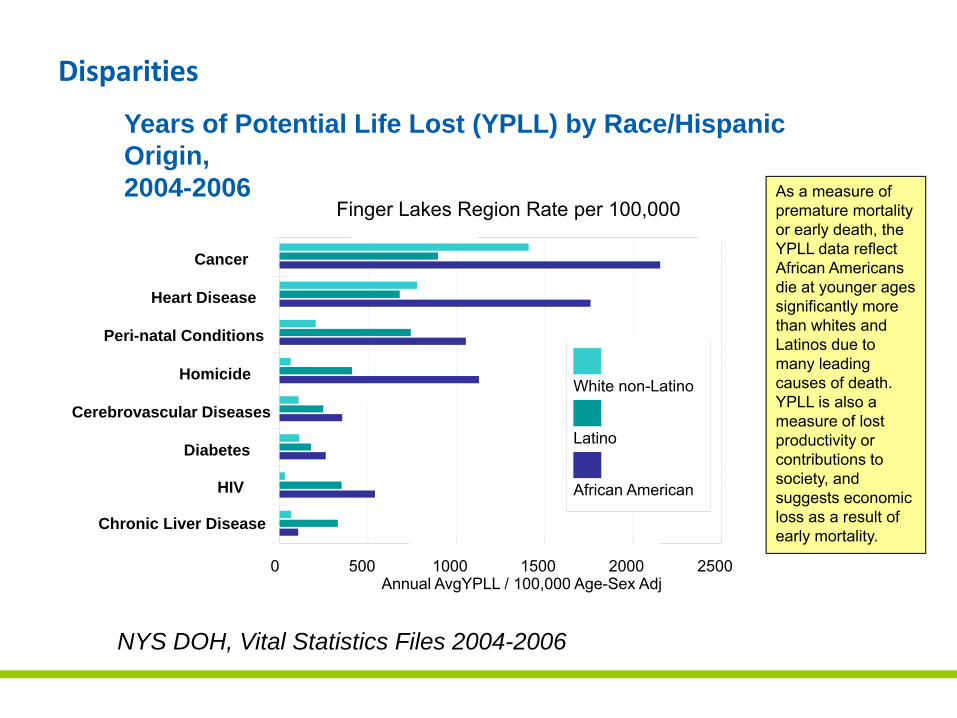
Years of Potential Life Lost (YPLL) by Race/Hispanic Origin, 2004-2006
NYS DOH, Vital Statistics Files 2004-2006
As a measure of premature mortality or early death, the YPLL data reflect African Americans die at younger ages significantly more than whites and Latinos due to many leading causes of death. YPLL is also a measure of lost productivity or contributions to society, and suggests economic loss as a result of early mortality.
Disparities
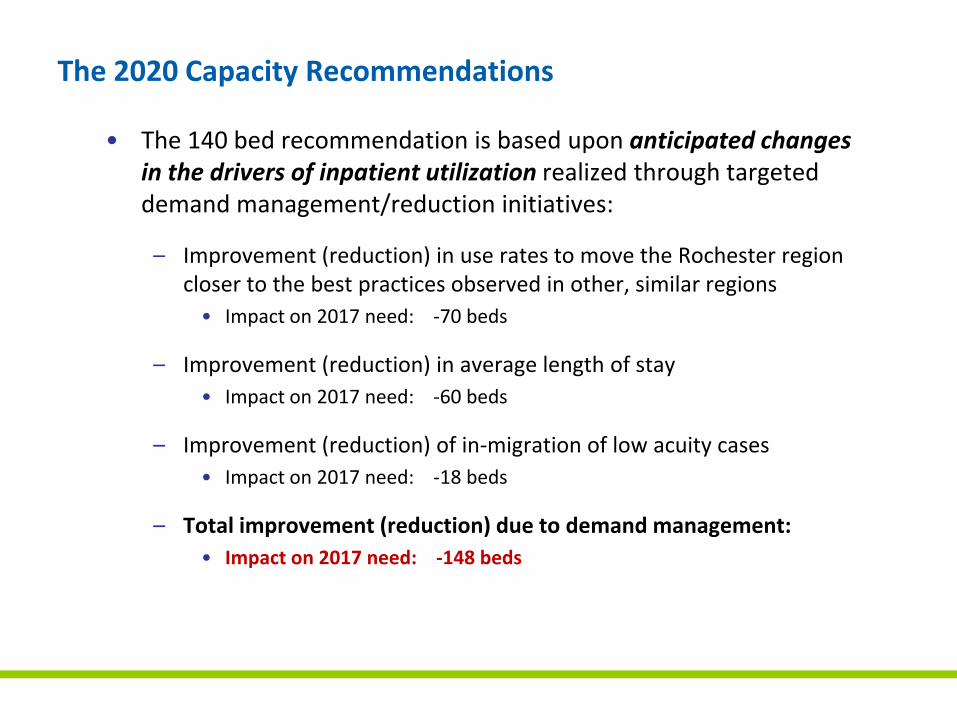
The 2020 Capacity Recommendations
• The 140 bed recommendation is based upon anticipated changes in the drivers of inpatient utilization realized through targeted demand management/reduction initiatives:
– Improvement (reduction) in use rates to move the Rochester region closer to the best practices observed in other, similar regions• Impact on 2017 need: ‐70 beds
– Improvement (reduction) in average length of stay• Impact on 2017 need: ‐60 beds
– Improvement (reduction) of in‐migration of low acuity cases• Impact on 2017 need: ‐18 beds
– Total improvement (reduction) due to demand management:• Impact on 2017 need: ‐148 beds
Why This Is Important
If inpatient demand at the three Rochester systems is not able to be
reduced, the new capacity recommended by the 2020 Commission
and approved by the NYSDOH will be insufficient to meet the needs
of the region when it becomes available
Community Investment Goals
To catalyze change in the regional health care system
• In order to drive these changes, the Commission created specific goals for the community
– A decrease of 15% in the number of low acuity (non‐urgent) visits to emergency rooms
– A decrease of 25% in the number of admissions for Ambulatory Sensitive Conditions that are manageable in outpatient settings
– A decrease of 20% in the number of low acuity admissions to Monroe County hospitals of residents from outlying communities
Community Investment Recommendations
To address the establishment of collaborative initiatives on community‐wide issues
• Understanding that such changes are not under the control of any one institution or stakeholder group, the Commission recommended collaborative approaches to achieving the community goals
– Hospitals, payers and other community stakeholders will develop and initiate processes and programs in response to the goals
– Resources will be obtained commensurate with the scope of the initiatives related to these recommendations to ensure their long‐term success
– Community stakeholders will engage collaboratively to address community‐wide issues
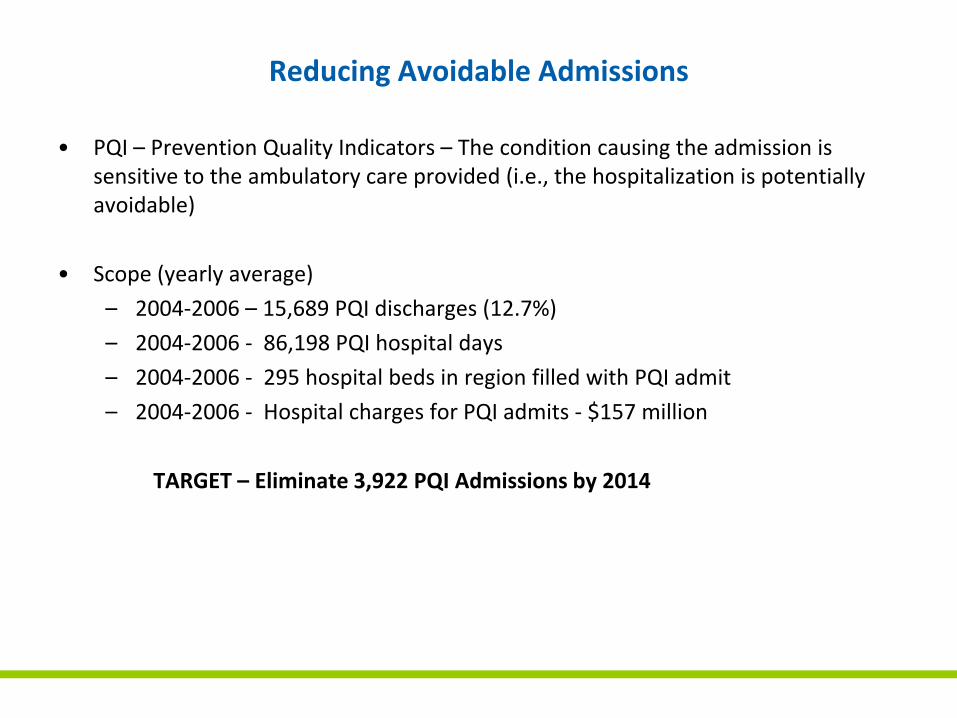
Reducing Avoidable Admissions
• PQI – Prevention Quality Indicators – The condition causing the admission is sensitive to the ambulatory care provided (i.e., the hospitalization is potentially avoidable)
• Scope (yearly average)
– 2004‐2006 – 15,689 PQI discharges (12.7%)
– 2004‐2006 ‐ 86,198 PQI hospital days
– 2004‐2006 ‐ 295 hospital beds in region filled with PQI admit
– 2004‐2006 ‐ Hospital charges for PQI admits ‐ $157 million
TARGET – Eliminate 3,922 PQI Admissions by 2014
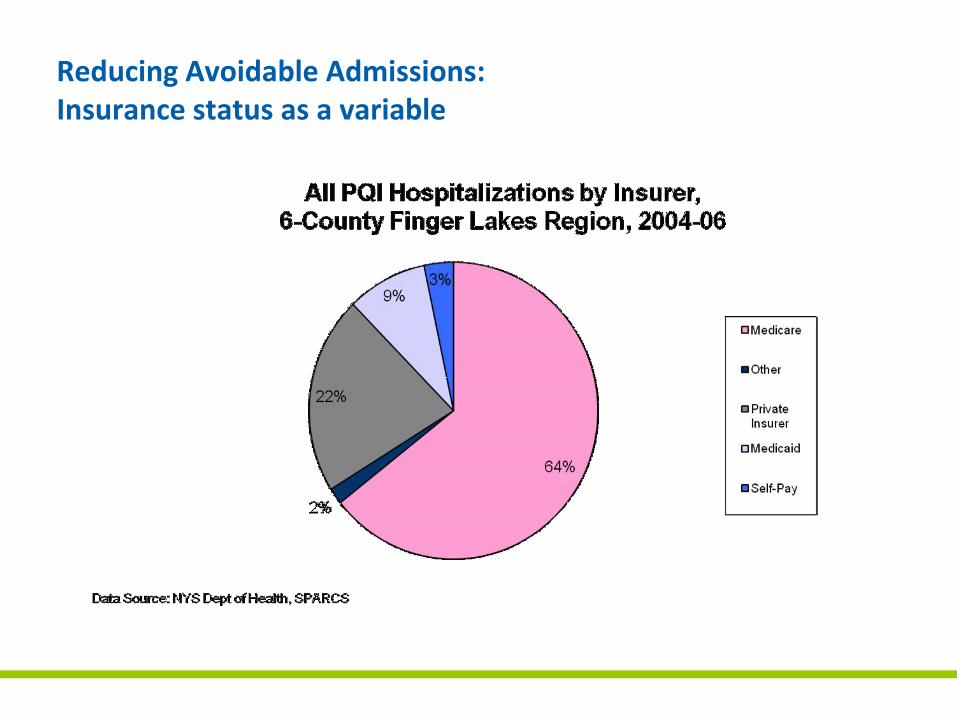
Reducing Avoidable Admissions:Insurance status as a variable
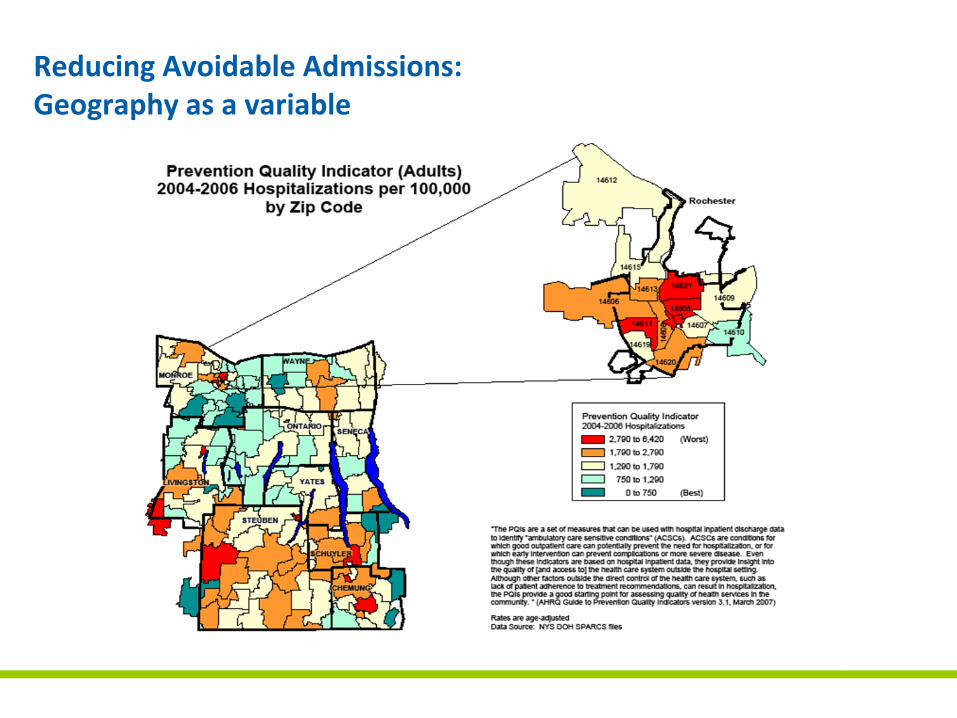
Reducing Avoidable Admissions: Geography as a variable
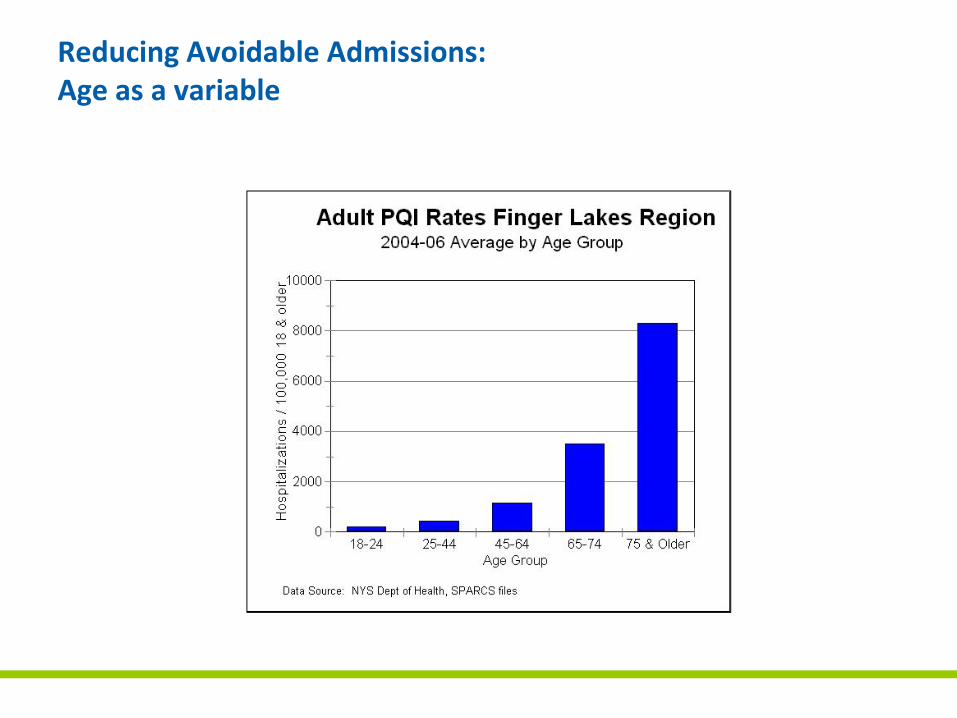
Reducing Avoidable Admissions: Age as a variable
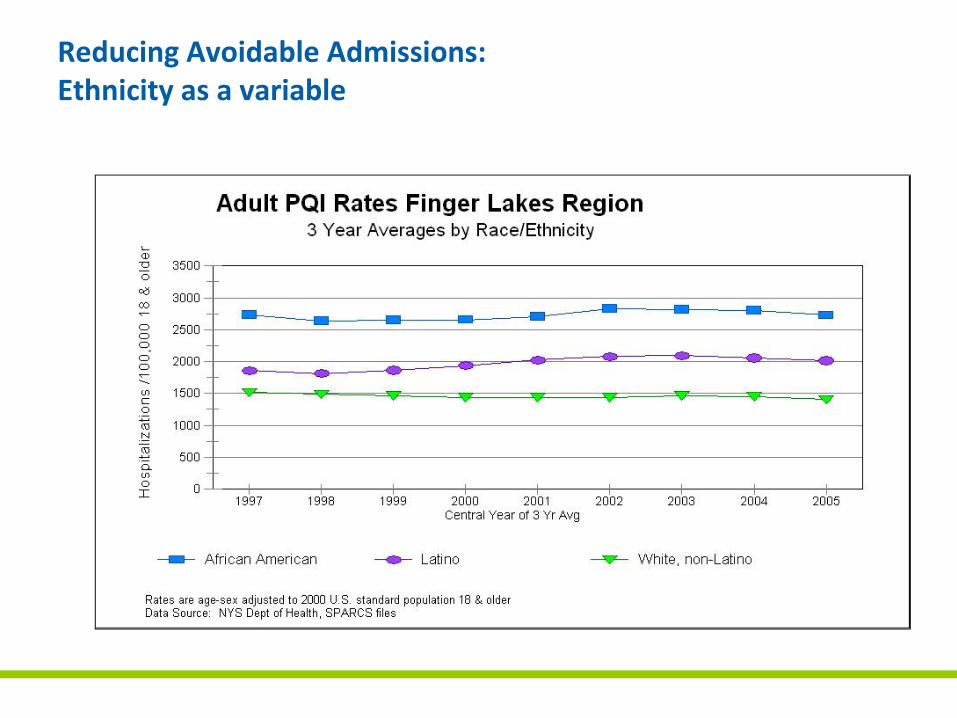
Reducing Avoidable Admissions:Ethnicity as a variable
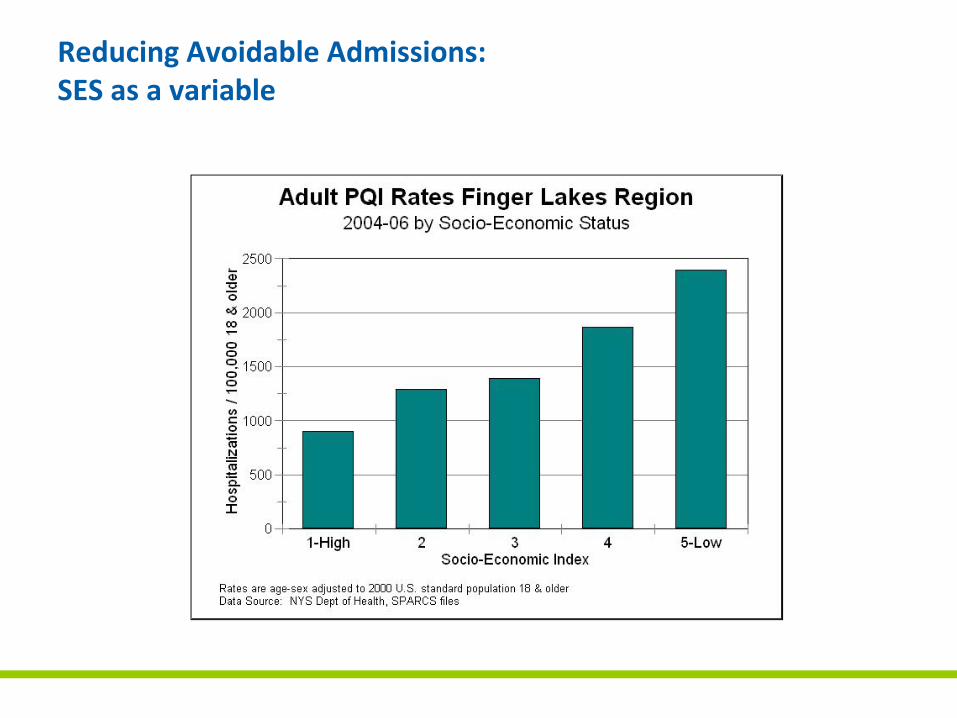
Reducing Avoidable Admissions: SES as a variable
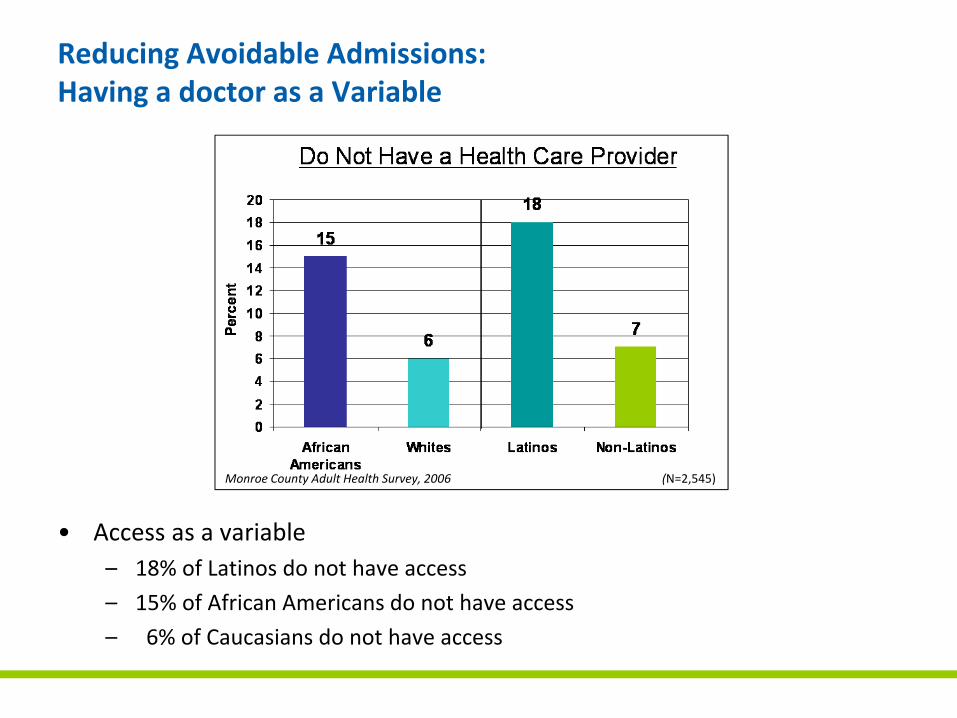
• Access as a variable– 18% of Latinos do not have access
– 15% of African Americans do not have access
– 6% of Caucasians do not have access
Reducing Avoidable Admissions:Having a doctor as a Variable
Monroe County Adult Health Survey, 2006 (N=2,545)
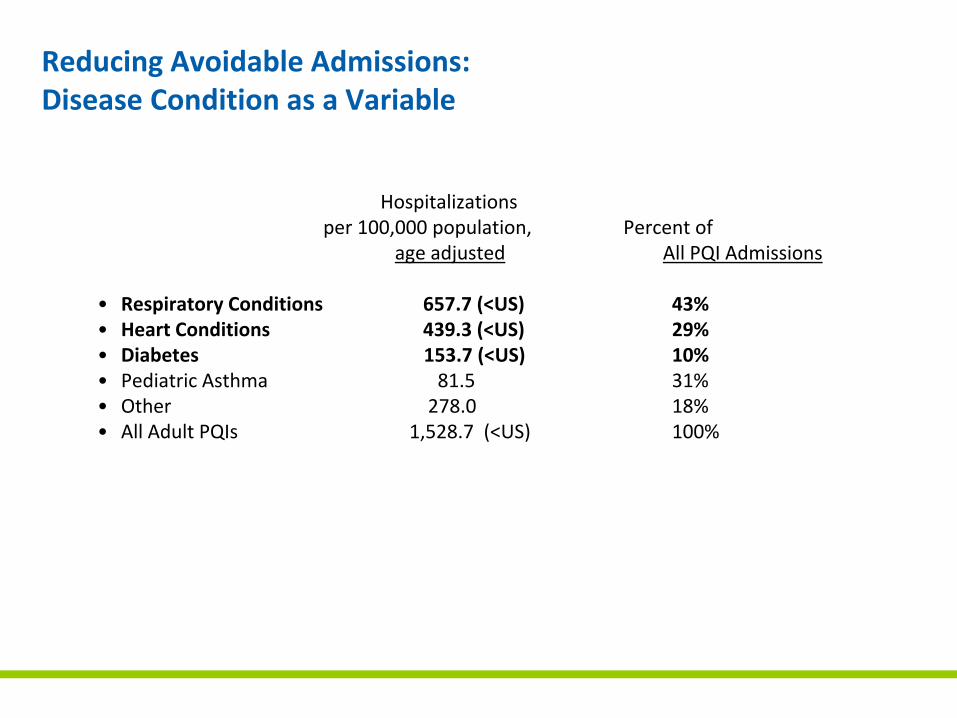
Reducing Avoidable Admissions:Disease Condition as a Variable
Hospitalizationsper 100,000 population, Percent of
age adjusted All PQI Admissions
• Respiratory Conditions 657.7 (<US) 43%• Heart Conditions 439.3 (<US) 29%• Diabetes 153.7 (<US) 10%• Pediatric Asthma 81.5 31%• Other 278.0 18%• All Adult PQIs 1,528.7 (<US) 100%
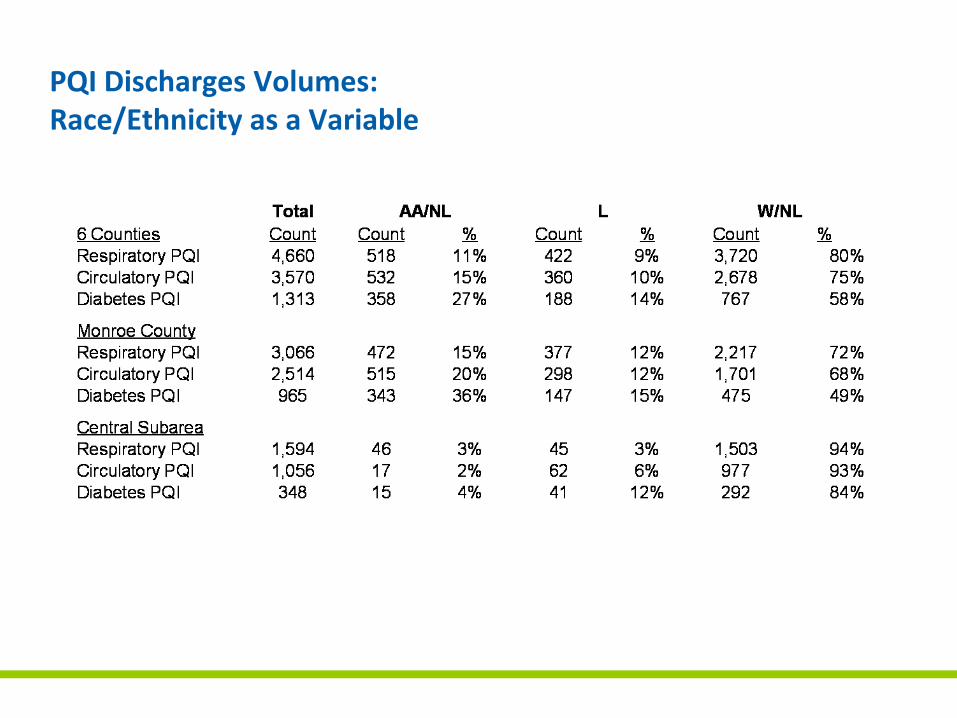
PQI Discharges Volumes: Race/Ethnicity as a Variable
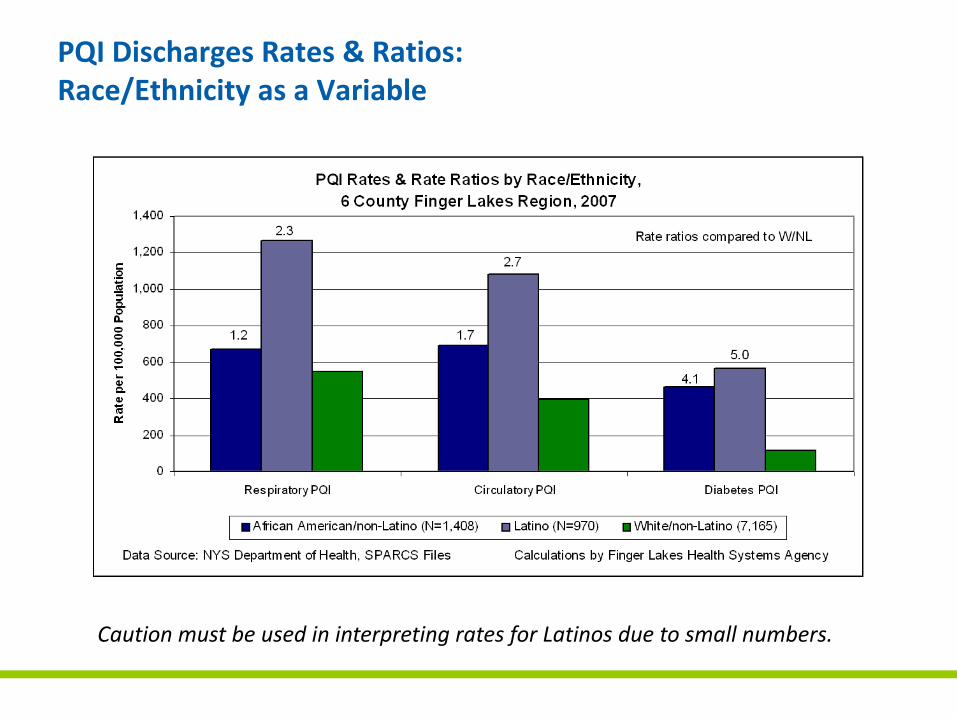
PQI Discharges Rates & Ratios:Race/Ethnicity as a Variable
Caution must be used in interpreting rates for Latinos due to small numbers.
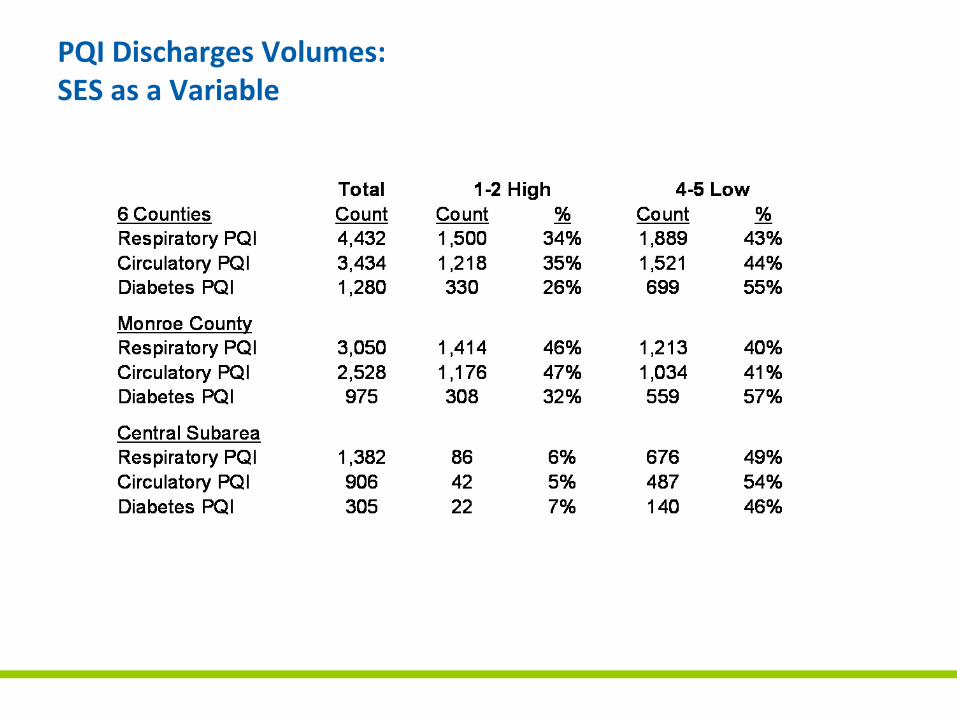
PQI Discharges Volumes: SES as a Variable
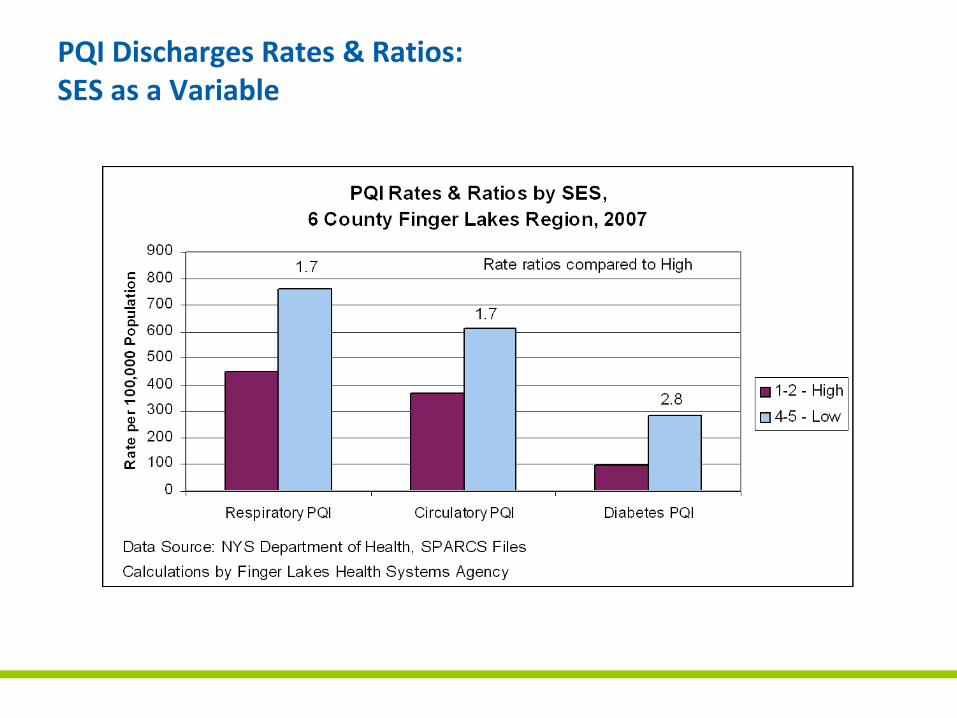
PQI Discharges Rates & Ratios:SES as a Variable
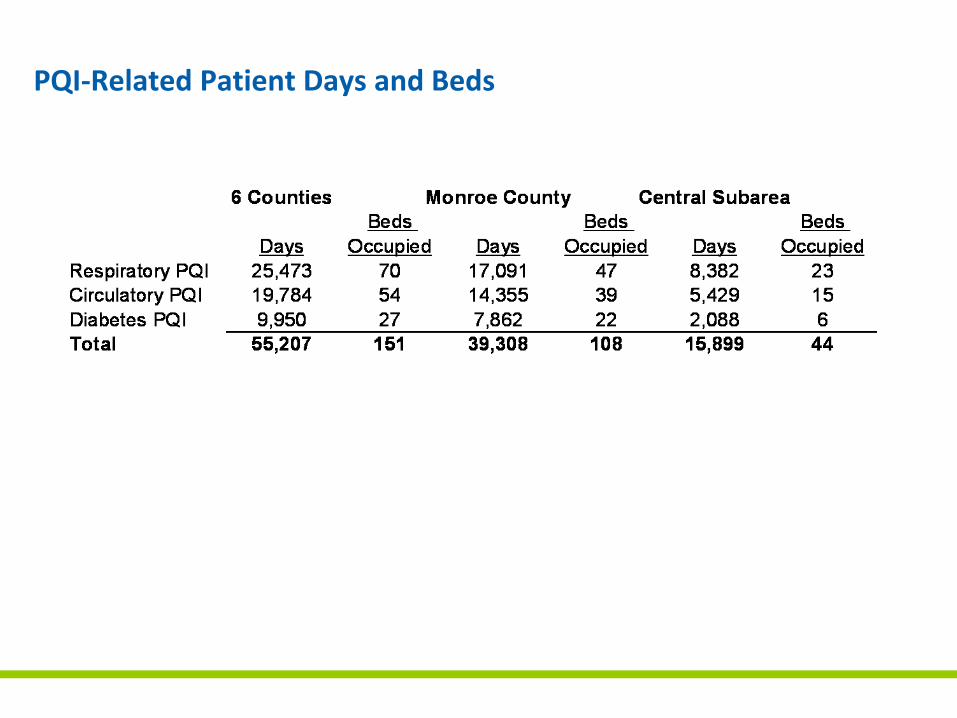
PQI‐Related Patient Days and Beds
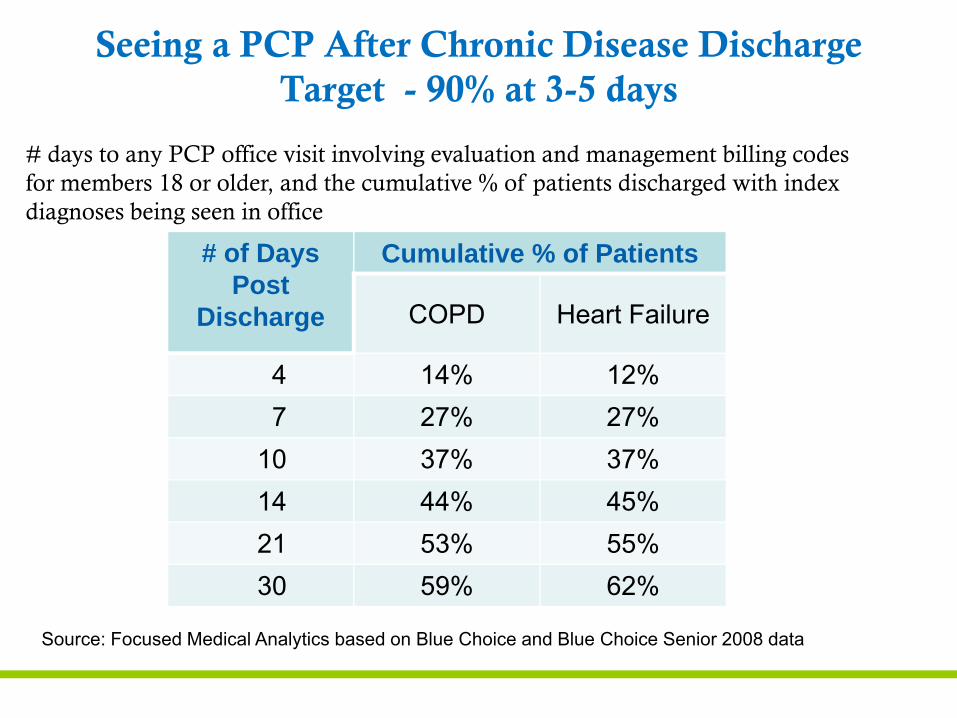
# of Days Post
Discharge
Cumulative % of Patients
COPD Heart Failure
4 14% 12%7 27% 27%
10 37% 37%14 44% 45%21 53% 55%30 59% 62%
Seeing a PCP After Chronic Disease DischargeTarget - 90% at 3-5 days
# days to any PCP office visit involving evaluation and management billing codes for members 18 or older, and the cumulative % of patients discharged with index diagnoses being seen in office
Source: Focused Medical Analytics based on Blue Choice and Blue Choice Senior 2008 data
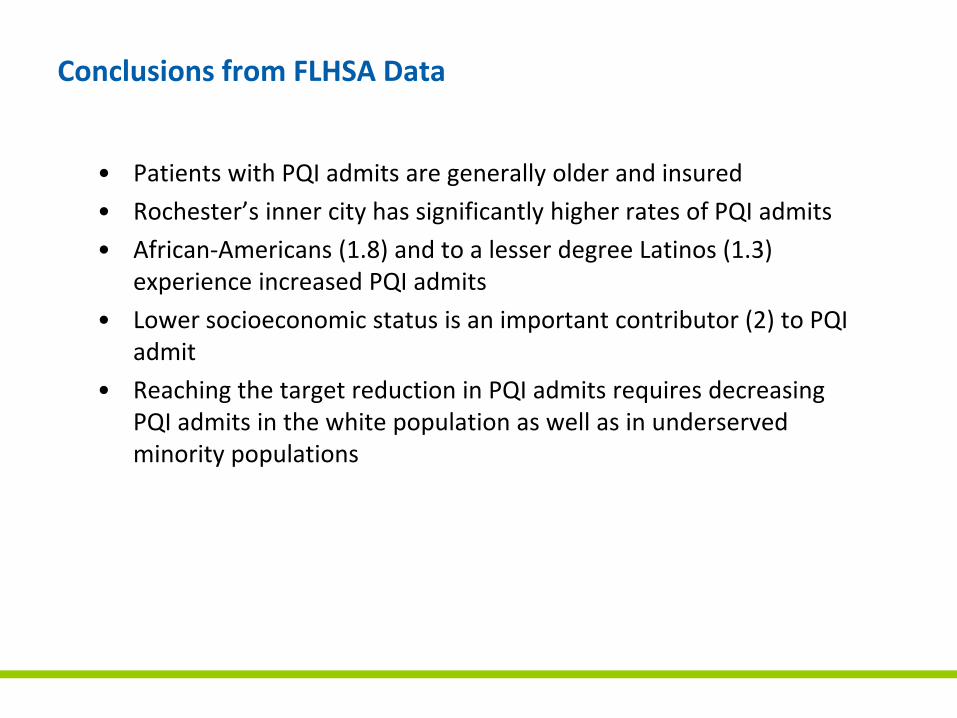
Conclusions from FLHSA Data
• Patients with PQI admits are generally older and insured
• Rochester’s inner city has significantly higher rates of PQI admits
• African‐Americans (1.8) and to a lesser degree Latinos (1.3) experience increased PQI admits
• Lower socioeconomic status is an important contributor (2) to PQI admit
• Reaching the target reduction in PQI admits requires decreasing PQI admits in the white population as well as in underserved minority populations
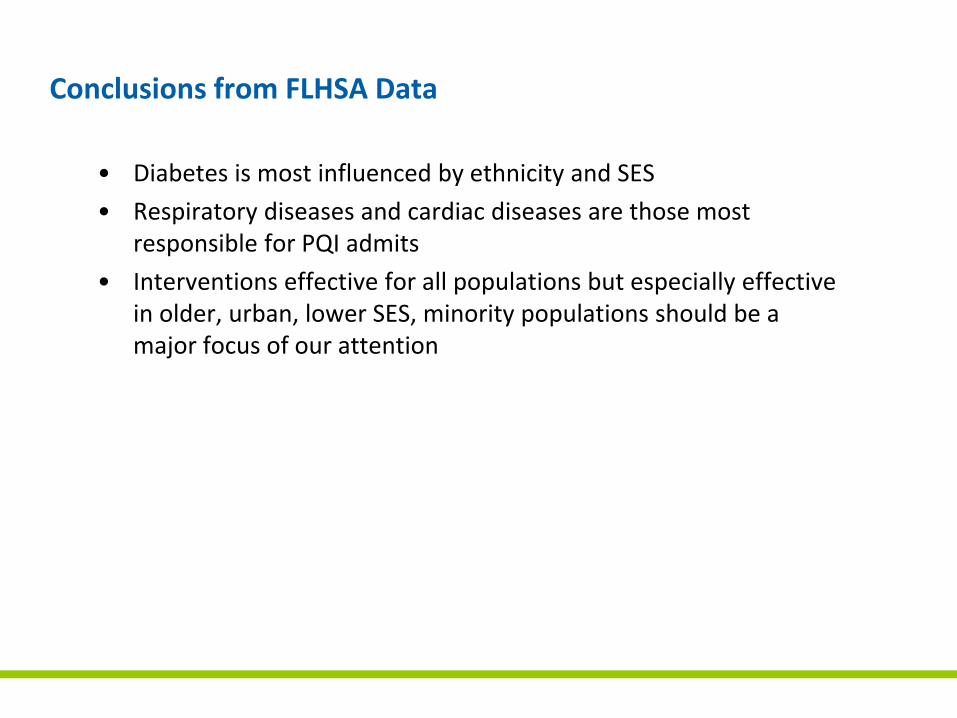
Conclusions from FLHSA Data
• Diabetes is most influenced by ethnicity and SES
• Respiratory diseases and cardiac diseases are those most responsible for PQI admits
• Interventions effective for all populations but especially effective in older, urban, lower SES, minority populations should be a major focus of our attention
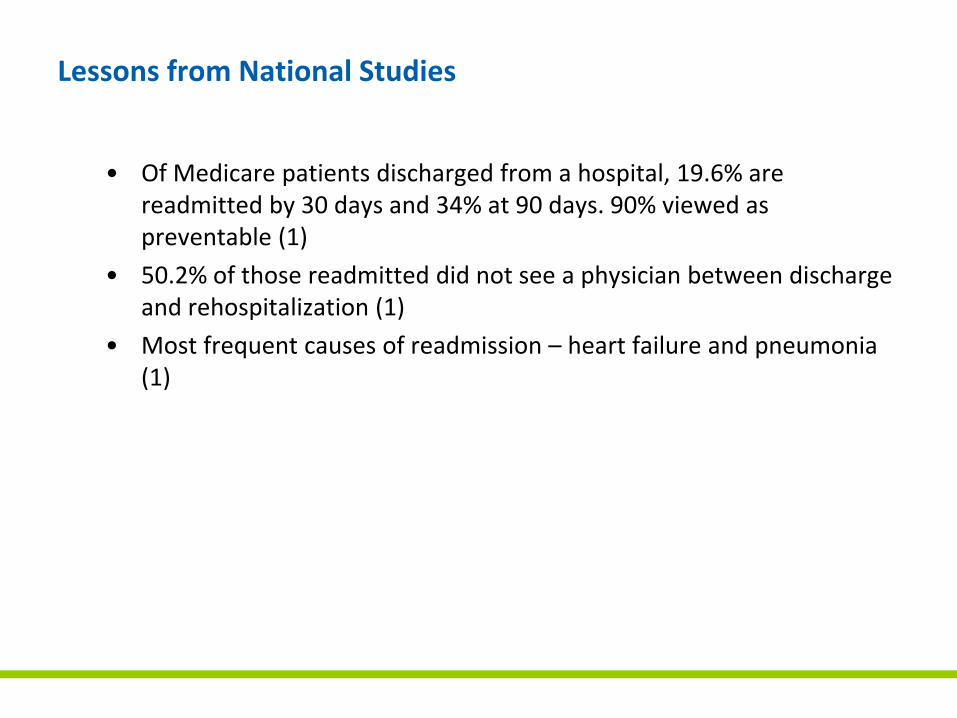
Lessons from National Studies
• Of Medicare patients discharged from a hospital, 19.6% are readmitted by 30 days and 34% at 90 days. 90% viewed as preventable (1)
• 50.2% of those readmitted did not see a physician between discharge and rehospitalization (1)
• Most frequent causes of readmission – heart failure and pneumonia (1)
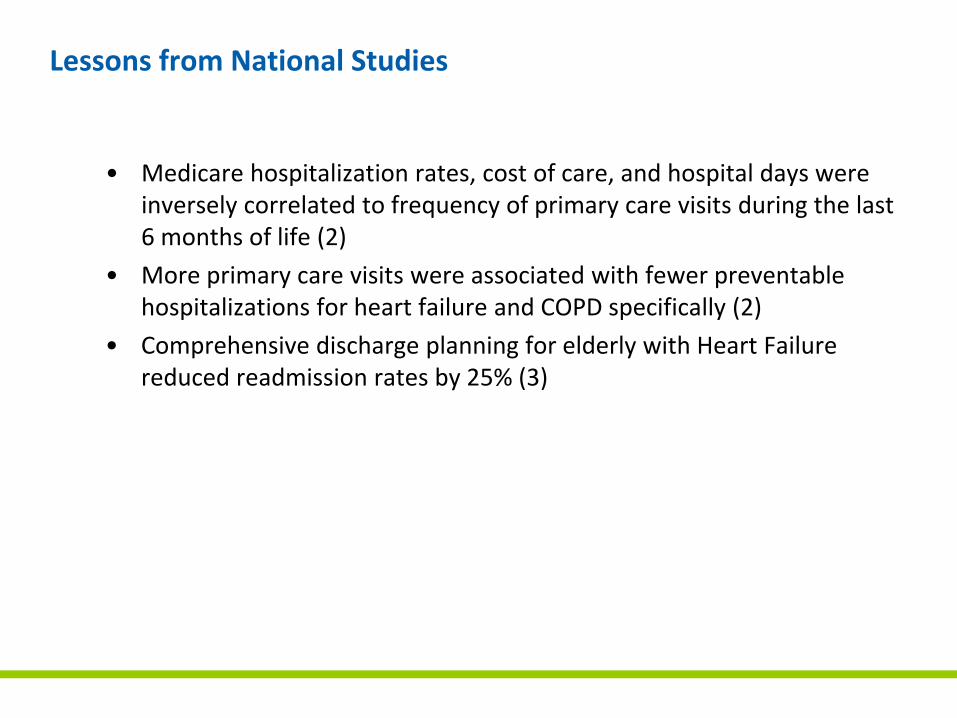
Lessons from National Studies
• Medicare hospitalization rates, cost of care, and hospital days were inversely correlated to frequency of primary care visits during the last 6 months of life (2)
• More primary care visits were associated with fewer preventable hospitalizations for heart failure and COPD specifically (2)
• Comprehensive discharge planning for elderly with Heart Failure reduced readmission rates by 25% (3)
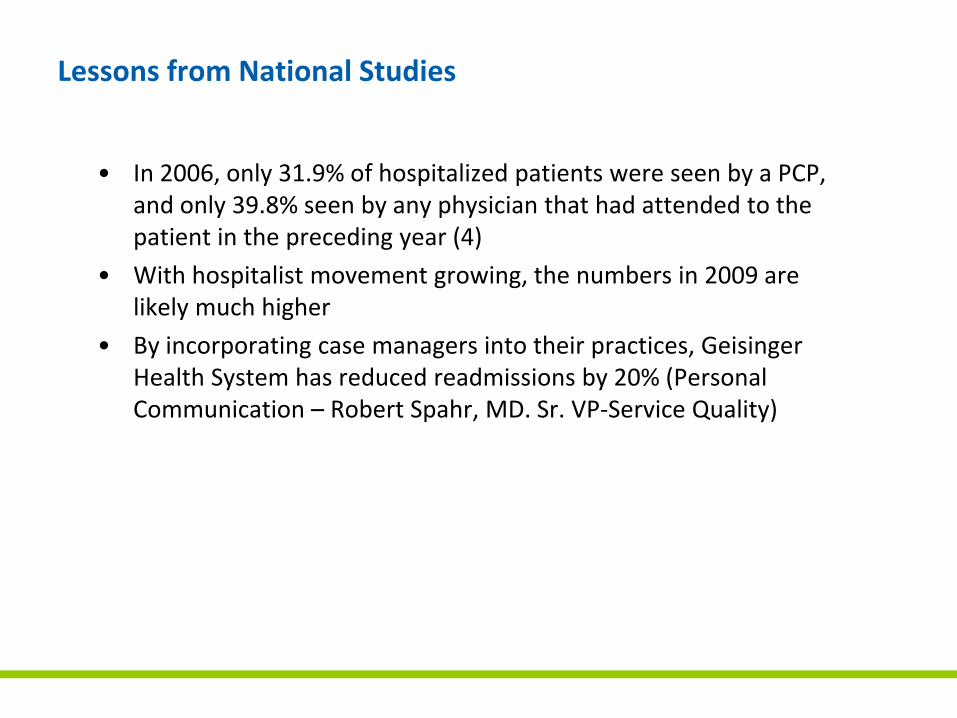
Lessons from National Studies
• In 2006, only 31.9% of hospitalized patients were seen by a PCP, and only 39.8% seen by any physician that had attended to the patient in the preceding year (4)
• With hospitalist movement growing, the numbers in 2009 are likely much higher
• By incorporating case managers into their practices, Geisinger Health System has reduced readmissions by 20% (Personal Communication – Robert Spahr, MD. Sr. VP‐Service Quality)
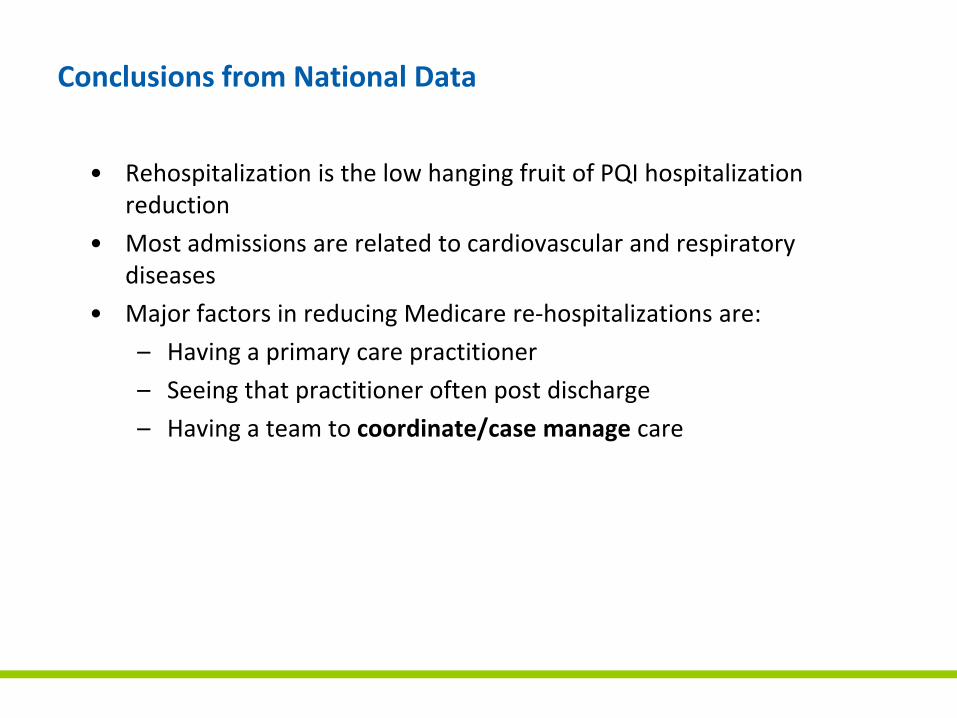
Conclusions from National Data
• Rehospitalization is the low hanging fruit of PQI hospitalization reduction
• Most admissions are related to cardiovascular and respiratory diseases
• Major factors in reducing Medicare re‐hospitalizations are:
– Having a primary care practitioner
– Seeing that practitioner often post discharge
– Having a team to coordinate/case manage care
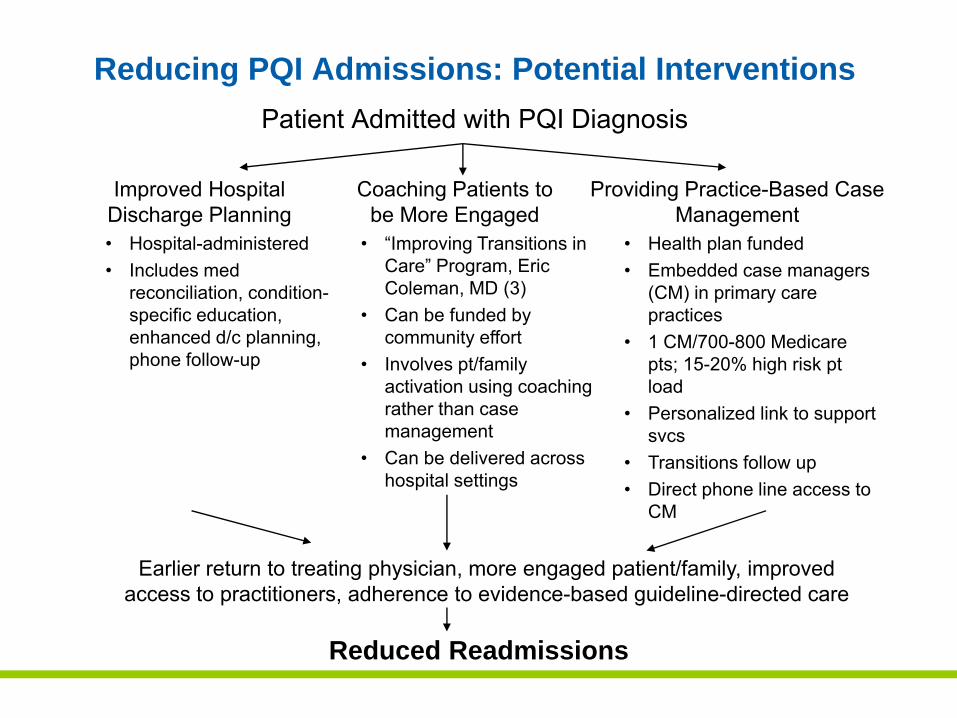
Earlier return to treating physician, more engaged patient/family, improved access to practitioners, adherence to evidence-based guideline-directed care
Reducing PQI Admissions: Potential InterventionsPatient Admitted with PQI Diagnosis
Improved Hospital Discharge Planning
Coaching Patients to be More Engaged
Providing Practice-Based Case Management
Reduced Readmissions
• Hospital-administered• Includes med
reconciliation, condition-specific education, enhanced d/c planning, phone follow-up
• “Improving Transitions in Care” Program, Eric Coleman, MD (3)
• Can be funded by community effort
• Involves pt/family activation using coaching rather than case management
• Can be delivered across hospital settings
• Health plan funded• Embedded case managers
(CM) in primary care practices
• 1 CM/700-800 Medicare pts; 15-20% high risk pt load
• Personalized link to support svcs
• Transitions follow up• Direct phone line access to
CM
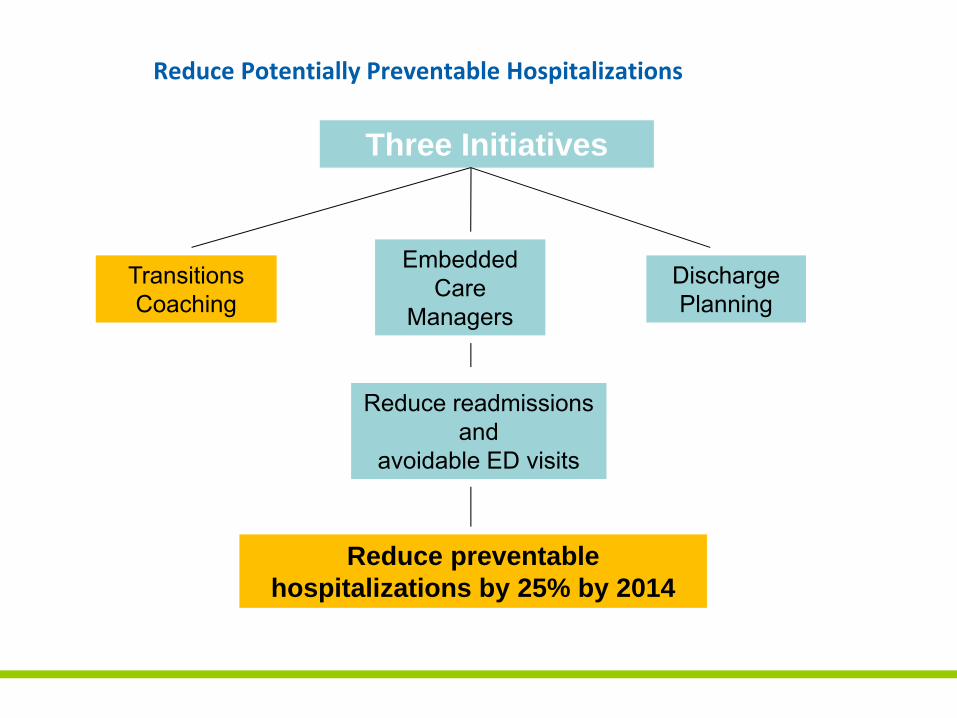
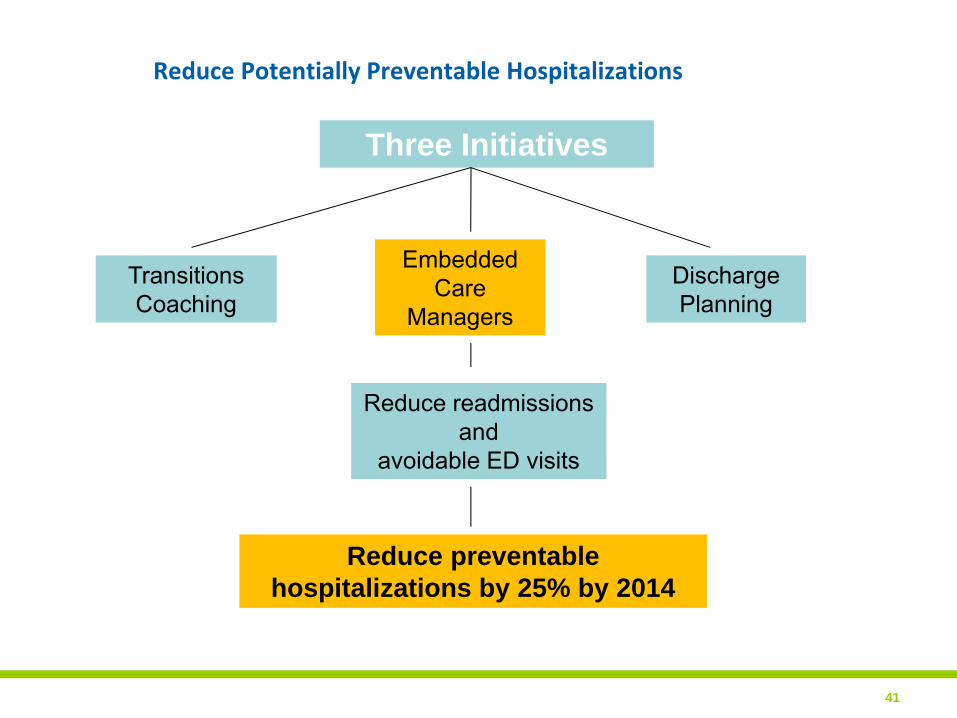
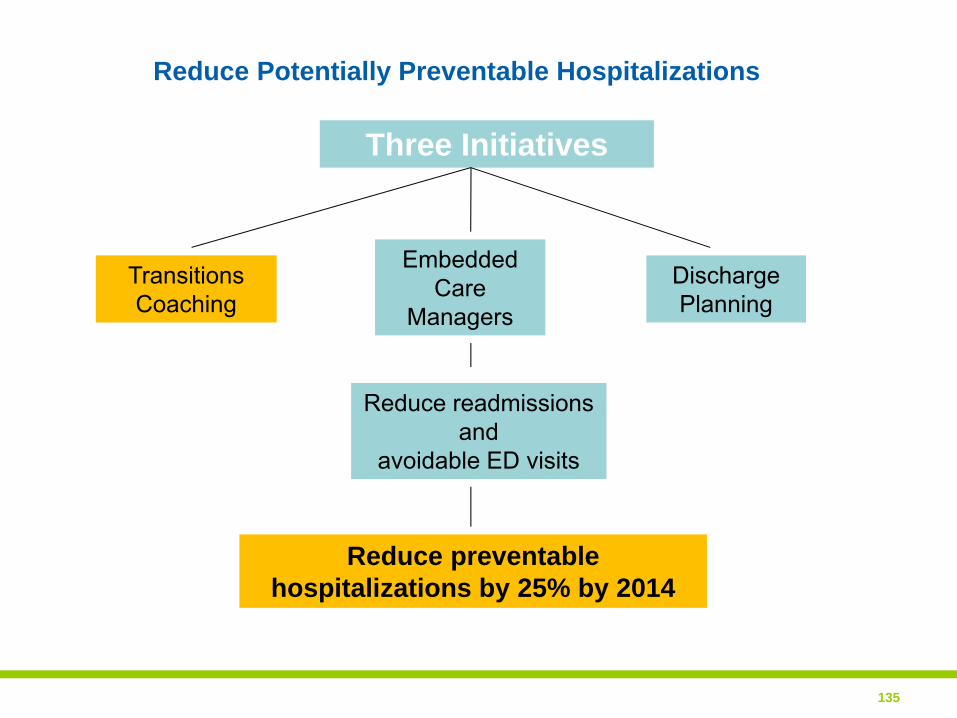
Reduce Potentially Preventable Hospitalizations
Three Initiatives
Discharge Planning
Embedded Care
Managers
Transitions Coaching
Reduce readmissions and
avoidable ED visits
Reduce preventable hospitalizations by 25% by 2014
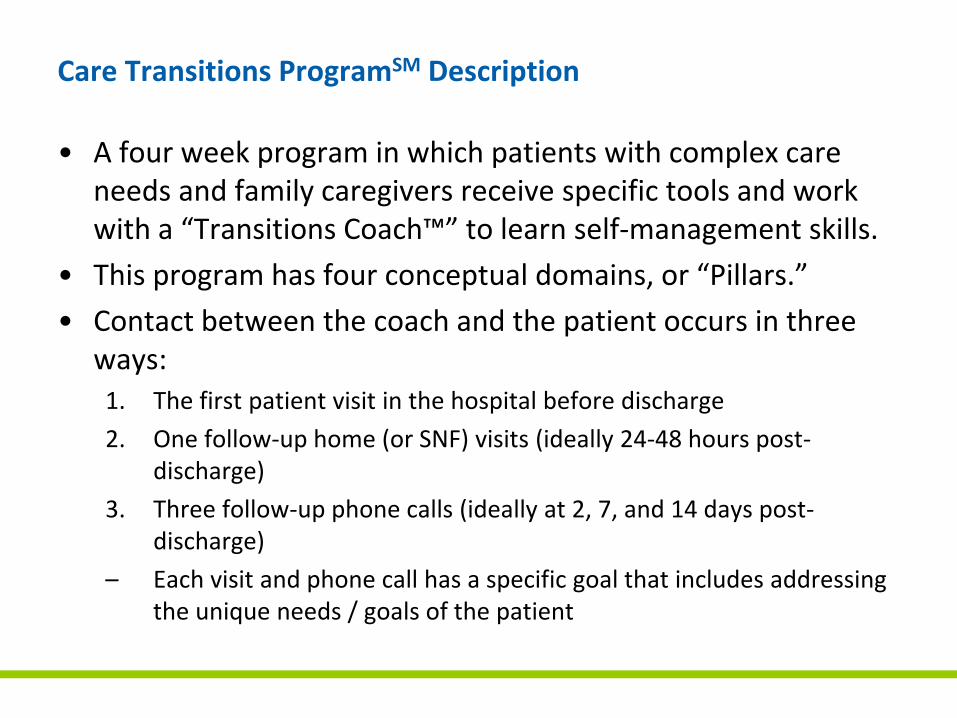
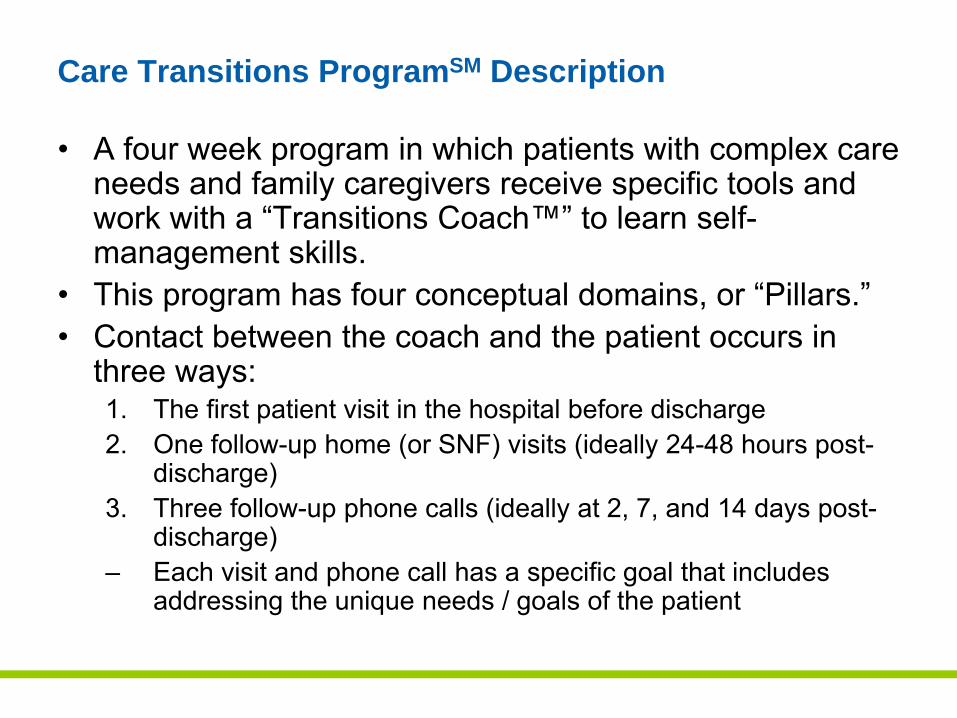
Care Transitions ProgramSM Description
• A four week program in which patients with complex care needs and family caregivers receive specific tools and work with a “Transitions Coach™” to learn self‐management skills.
• This program has four conceptual domains, or “Pillars.”
• Contact between the coach and the patient occurs in three ways:1. The first patient visit in the hospital before discharge
2. One follow‐up home (or SNF) visits (ideally 24‐48 hours post‐discharge)
3. Three follow‐up phone calls (ideally at 2, 7, and 14 days post‐discharge)
– Each visit and phone call has a specific goal that includes addressing the unique needs / goals of the patient
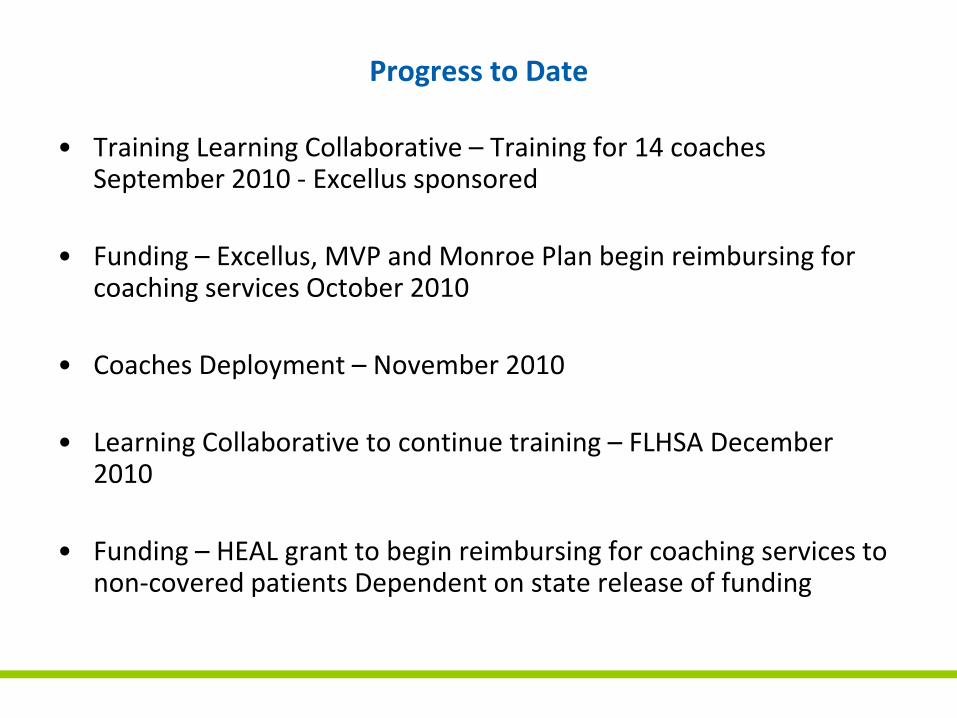
Progress to Date
• Training Learning Collaborative – Training for 14 coaches September 2010 ‐ Excellus sponsored
• Funding – Excellus, MVP and Monroe Plan begin reimbursing for coaching services October 2010
• Coaches Deployment – November 2010
• Learning Collaborative to continue training – FLHSA December 2010
• Funding – HEAL grant to begin reimbursing for coaching services to non‐covered patients Dependent on state release of funding
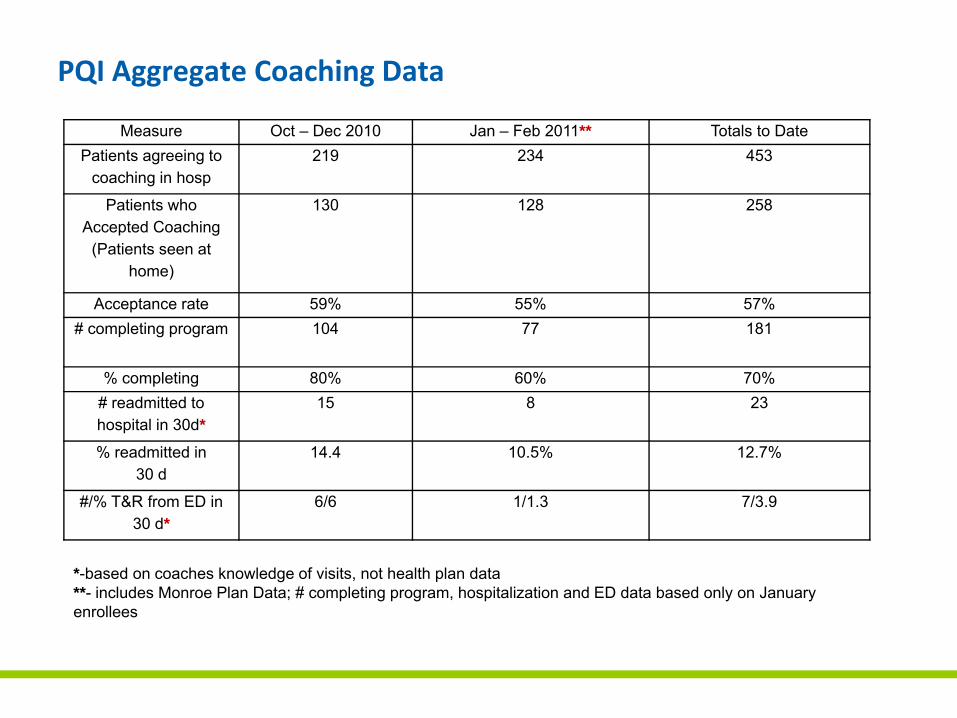
PQI Aggregate Coaching Data
Measure Oct – Dec 2010 Jan – Feb 2011** Totals to DatePatients agreeing to
coaching in hosp219 234 453
Patients who Accepted Coaching
(Patients seen at home)
130 128 258
Acceptance rate 59% 55% 57%# completing program 104 77 181
% completing 80% 60% 70%# readmitted to hospital in 30d*
15 8 23
% readmitted in 30 d
14.4 10.5% 12.7%
#/% T&R from ED in 30 d*
6/6 1/1.3 7/3.9
*-based on coaches knowledge of visits, not health plan data**- includes Monroe Plan Data; # completing program, hospitalization and ED data based only on January enrollees
Reduce Potentially Preventable Hospitalizations
41
Three Initiatives
Discharge Planning
Embedded Care
Managers
Transitions Coaching
Reduce readmissions and
avoidable ED visits
Reduce preventable hospitalizations by 25% by 2014
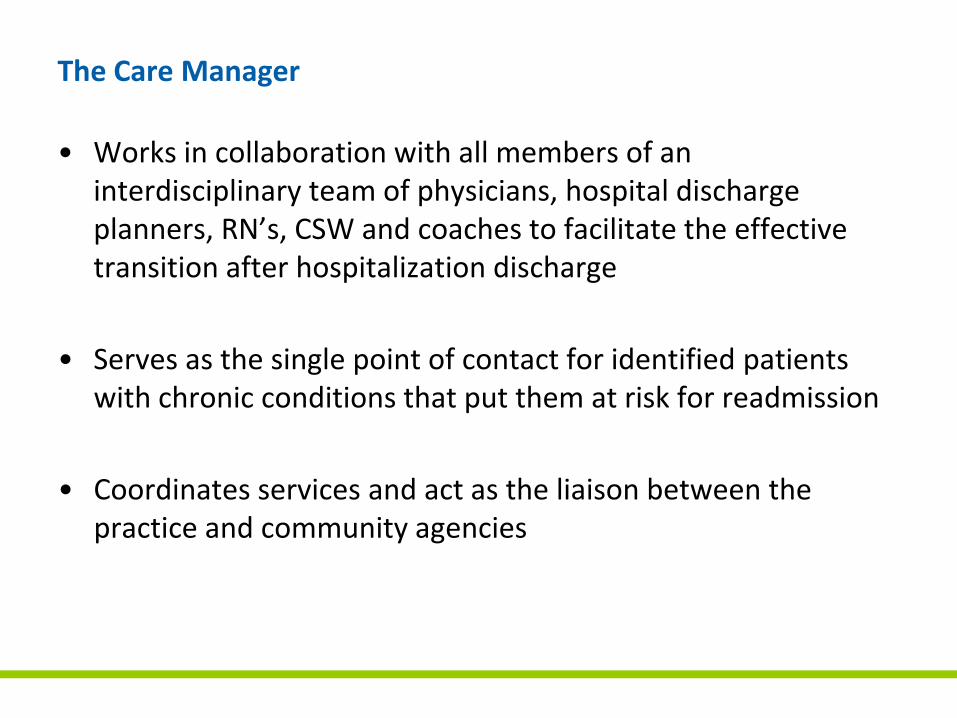
The Care Manager
• Works in collaboration with all members of an interdisciplinary team of physicians, hospital discharge planners, RN’s, CSW and coaches to facilitate the effective transition after hospitalization discharge
• Serves as the single point of contact for identified patients with chronic conditions that put them at risk for readmission
• Coordinates services and act as the liaison between the practice and community agencies
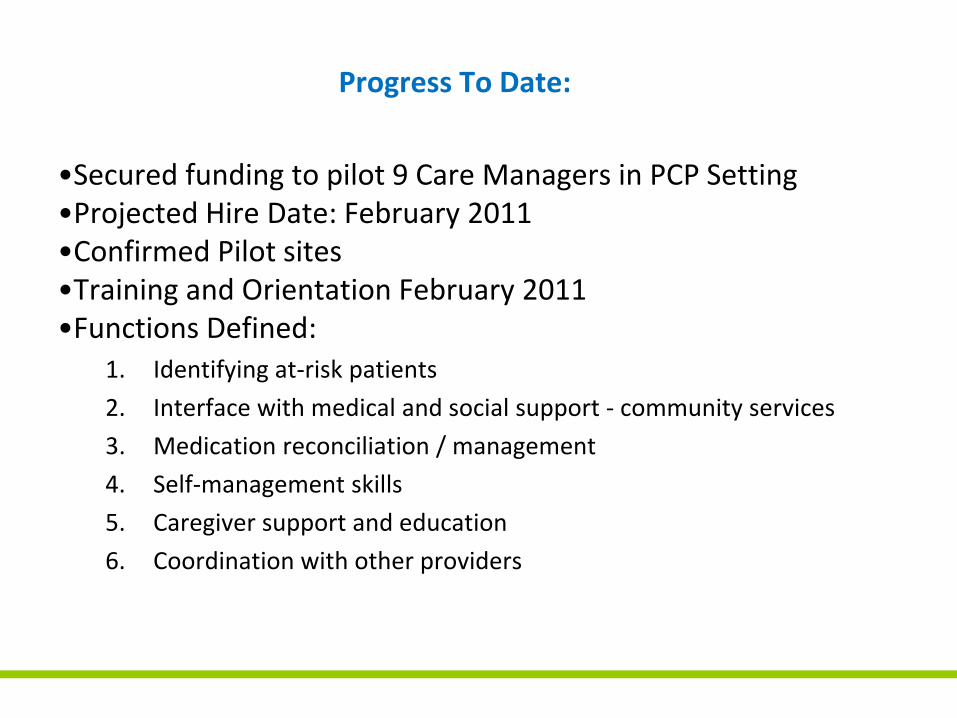
Progress To Date:
•Secured funding to pilot 9 Care Managers in PCP Setting•Projected Hire Date: February 2011•Confirmed Pilot sites•Training and Orientation February 2011•Functions Defined:
1. Identifying at‐risk patients
2. Interface with medical and social support ‐ community services
3. Medication reconciliation / management
4. Self‐management skills
5. Caregiver support and education
6. Coordination with other providers

Reduce Potentially Preventable Hospitalizations
Three Initiatives
Discharge Planning
Embedded Care
Managers
Transitions Coaching
Reduce readmissions and
avoidable ED visits
Reduce preventable hospitalizations by 25% by 2014
Four Community Standards for Discharge Planning
Creation of a region‐wide set of discharge/transition standards that, when fully implemented, will enhance patient safety and safe transition from hospital to community‐based setting and lead to a reduction in the number of avoidable hospital readmissions.
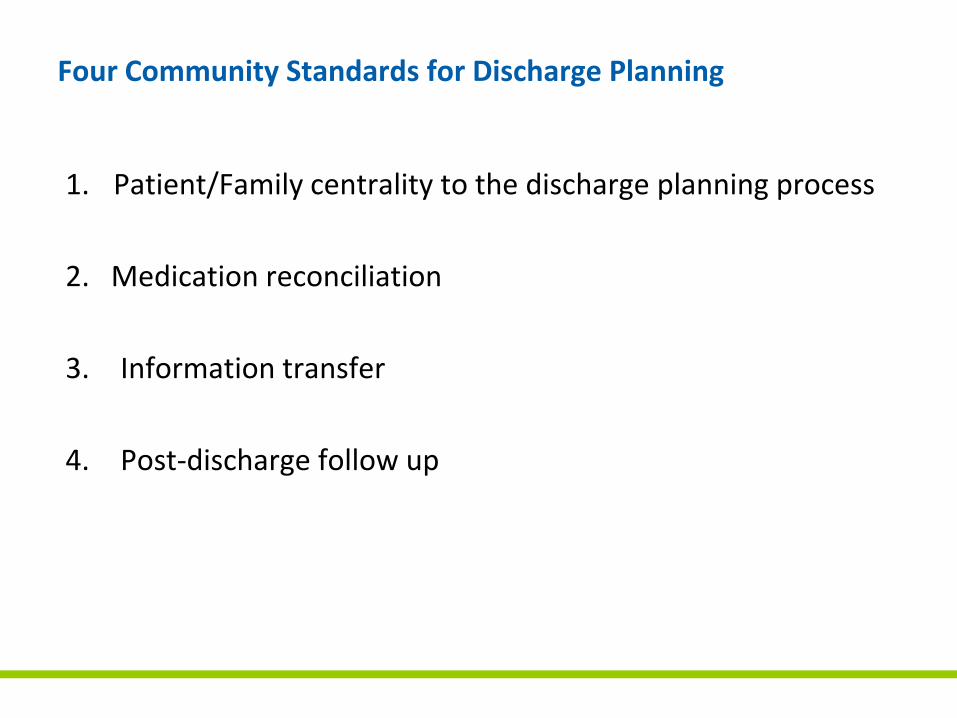
Four Community Standards for Discharge Planning
1. Patient/Family centrality to the discharge planning process
2. Medication reconciliation
3. Information transfer
4. Post‐discharge follow up
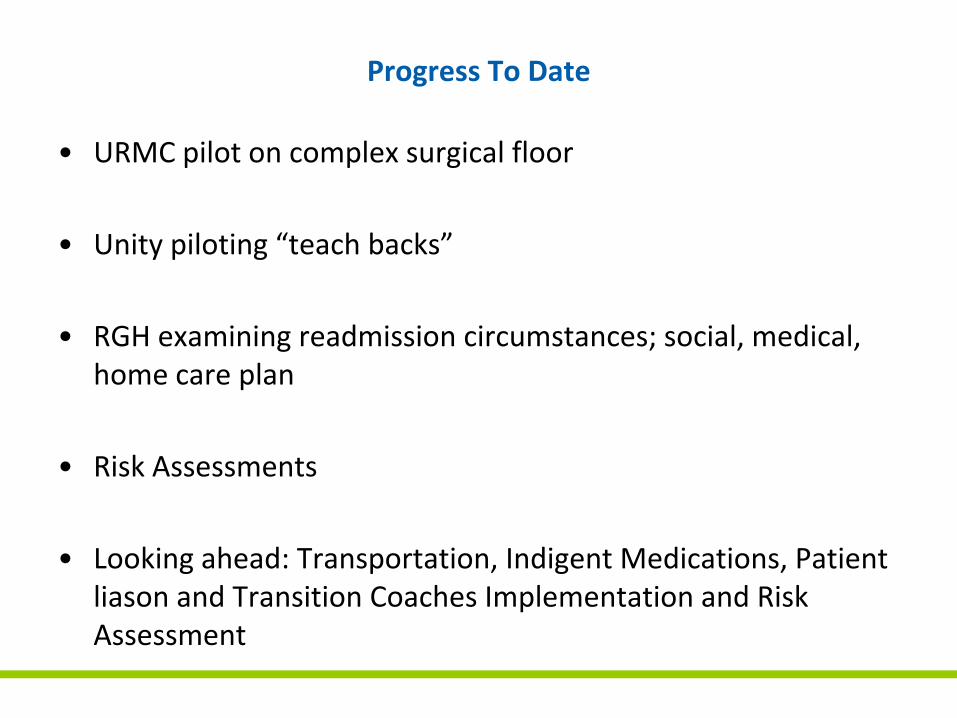
Progress To Date
• URMC pilot on complex surgical floor
• Unity piloting “teach backs”
• RGH examining readmission circumstances; social, medical, home care plan
• Risk Assessments
• Looking ahead: Transportation, Indigent Medications, Patient liason and Transition Coaches Implementation and Risk Assessment
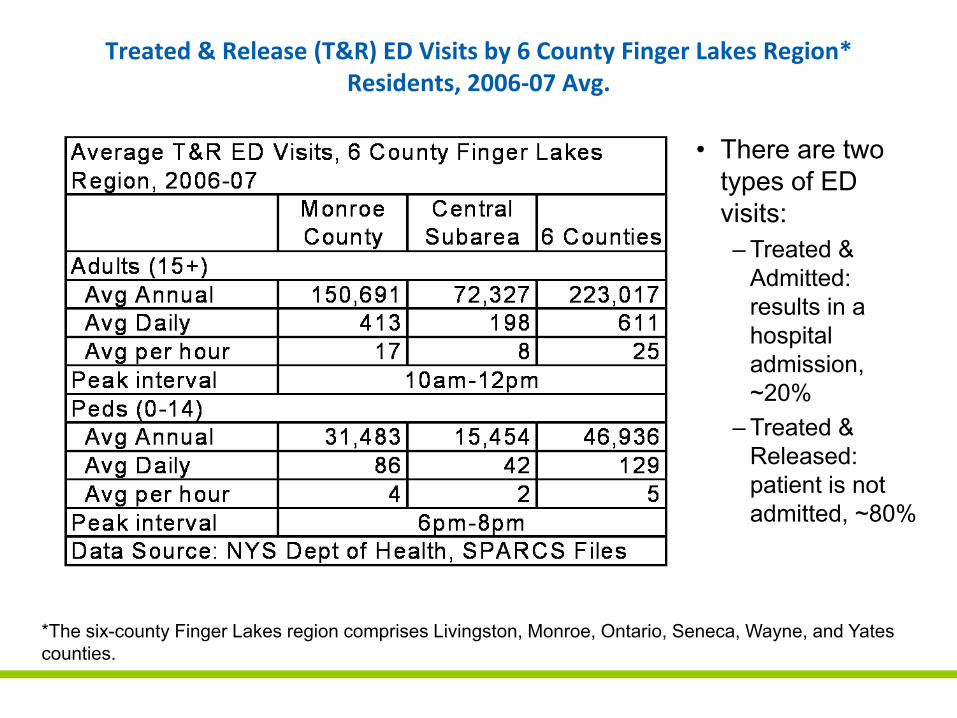
Treated & Release (T&R) ED Visits by 6 County Finger Lakes Region* Residents, 2006‐07 Avg.
• There are two types of ED visits:– Treated &
Admitted: results in a hospital admission, ~20%
– Treated & Released: patient is not admitted, ~80%
*The six-county Finger Lakes region comprises Livingston, Monroe, Ontario, Seneca, Wayne, and Yates counties.
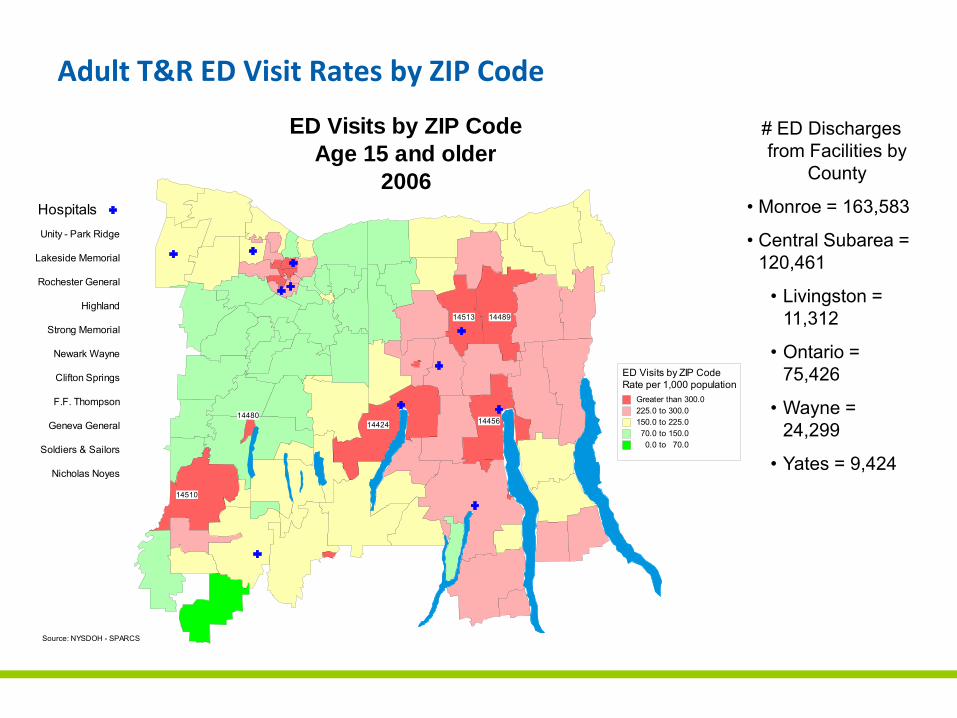
Adult T&R ED Visit Rates by ZIP Code
Unity - Park Ridge
Lakeside Memorial
Rochester General
Highland
Strong Memorial
Newark Wayne
Clifton Springs
F.F. Thompson
Geneva General
Soldiers & Sailors
Nicholas Noyes
Hospitals
Source: NYSDOH - SPARCS
ED Visits by ZIP CodeAge 15 and older
2006
1448914513
1442414480
14456
14510
ED Visits by ZIP CodeRate per 1,000 population
Greater than 300.0225.0 to 300.0150.0 to 225.070.0 to 150.00.0 to 70.0
# ED Discharges from Facilities by
County
• Monroe = 163,583
• Central Subarea = 120,461
• Livingston = 11,312
• Ontario = 75,426
• Wayne = 24,299
• Yates = 9,424
Unity - Park Ridge
Lakeside Memorial
Rochester General
Highland
Strong Memorial
Newark Wayne
Clifton Springs
F.F. Thompson
Geneva General
Soldiers & Sailors
Nicholas Noyes
Hospitals
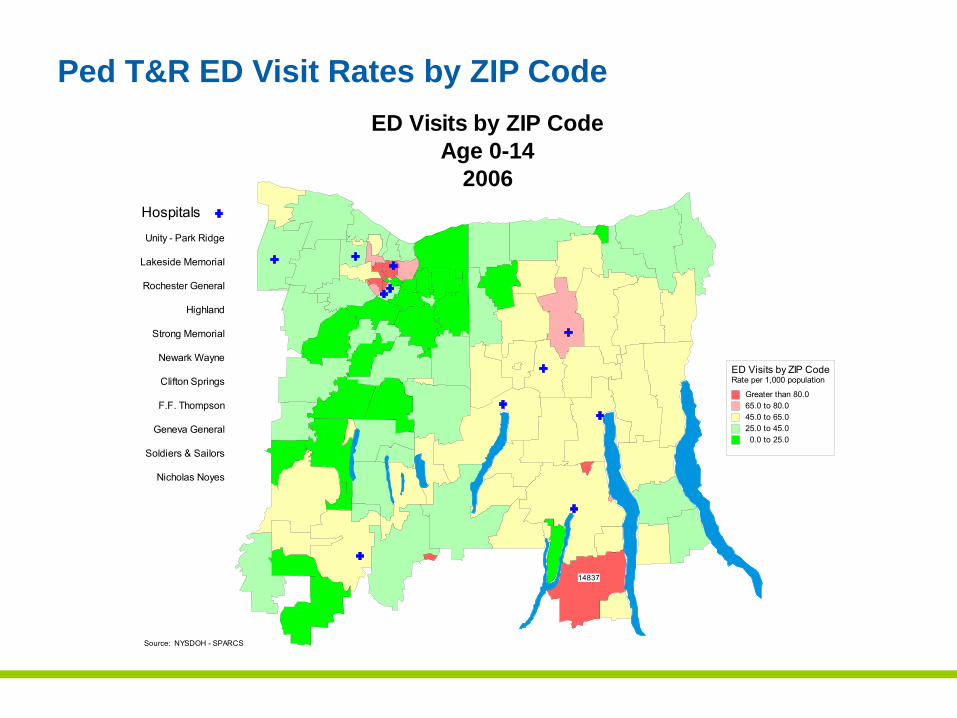
Source: NYSDOH - SPARCS
ED Visits by ZIP CodeAge 0-14
2006
14837
ED Visits by ZIP CodeRate per 1,000 population
Greater than 80.065.0 to 80.045.0 to 65.025.0 to 45.00.0 to 25.0
Ped T&R ED Visit Rates by ZIP Code
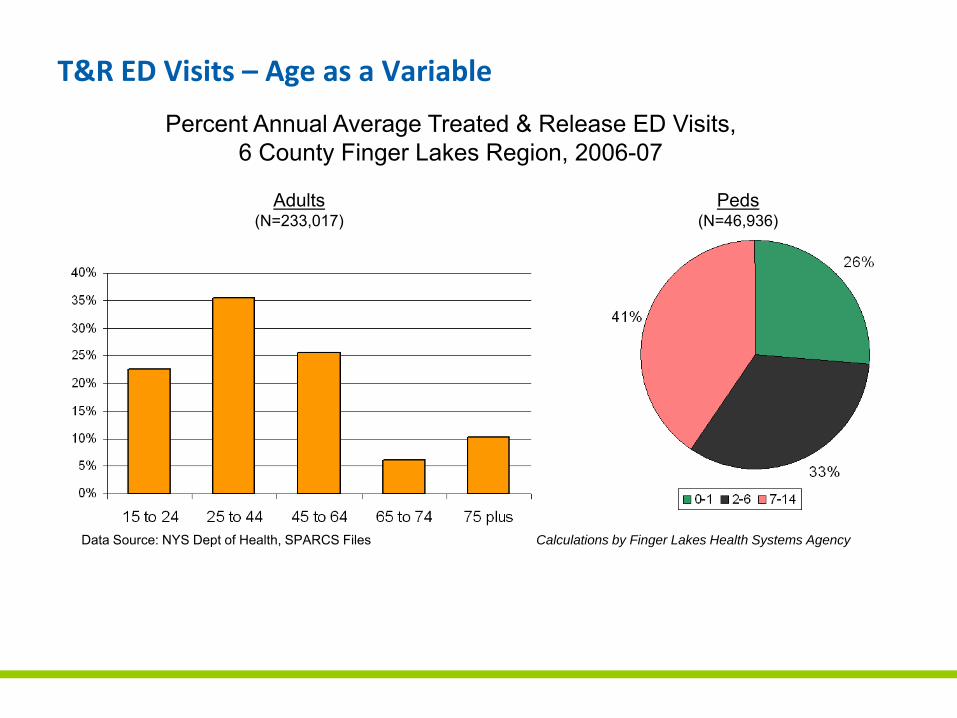
T&R ED Visits – Age as a Variable
Percent Annual Average Treated & Release ED Visits, 6 County Finger Lakes Region, 2006-07
Adults (N=233,017)
Data Source: NYS Dept of Health, SPARCS Files Calculations by Finger Lakes Health Systems Agency
Peds(N=46,936)
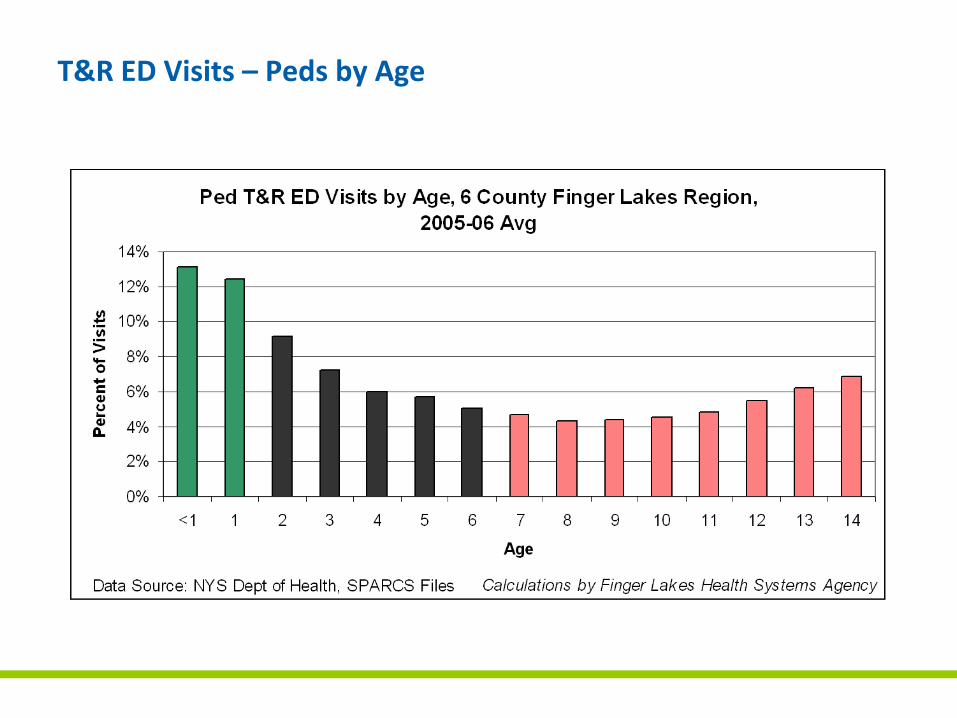
T&R ED Visits – Peds by Age
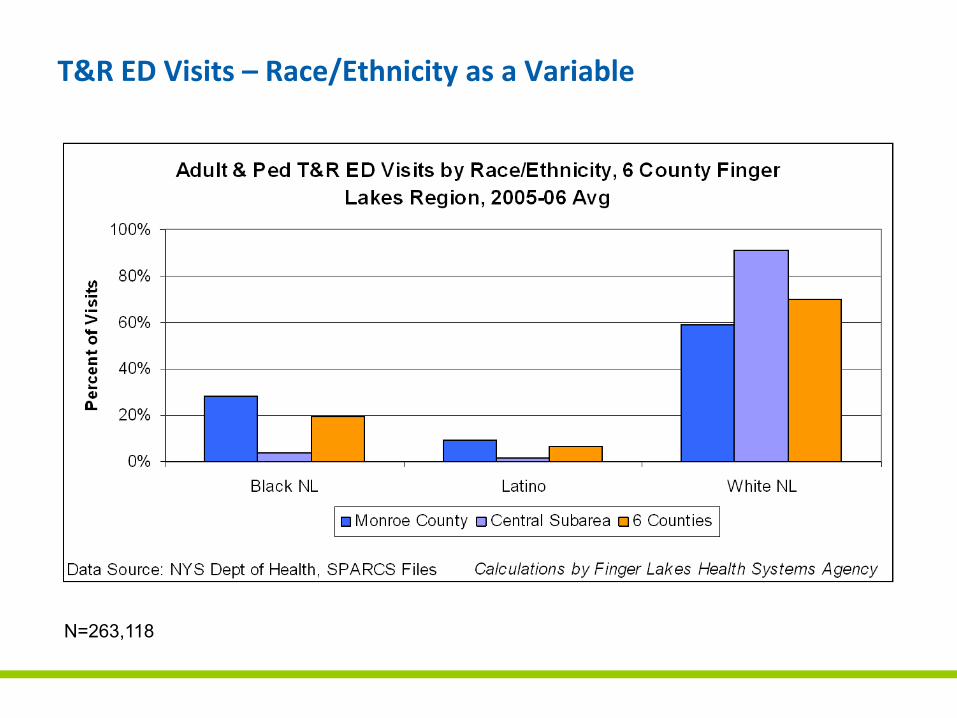
T&R ED Visits – Race/Ethnicity as a Variable
N=263,118
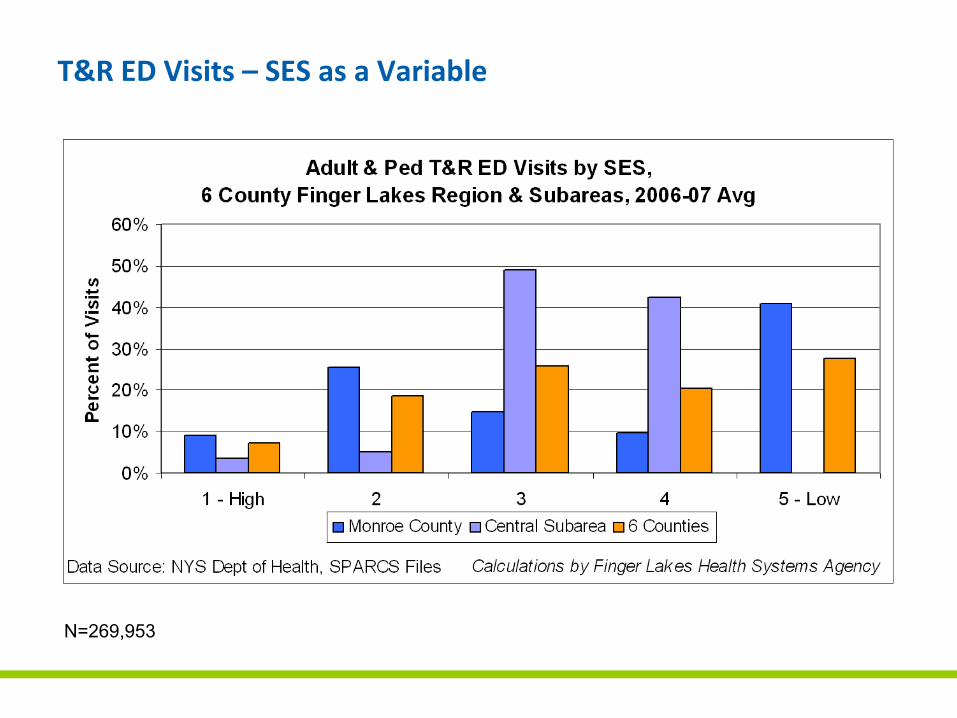
T&R ED Visits – SES as a Variable
N=269,953
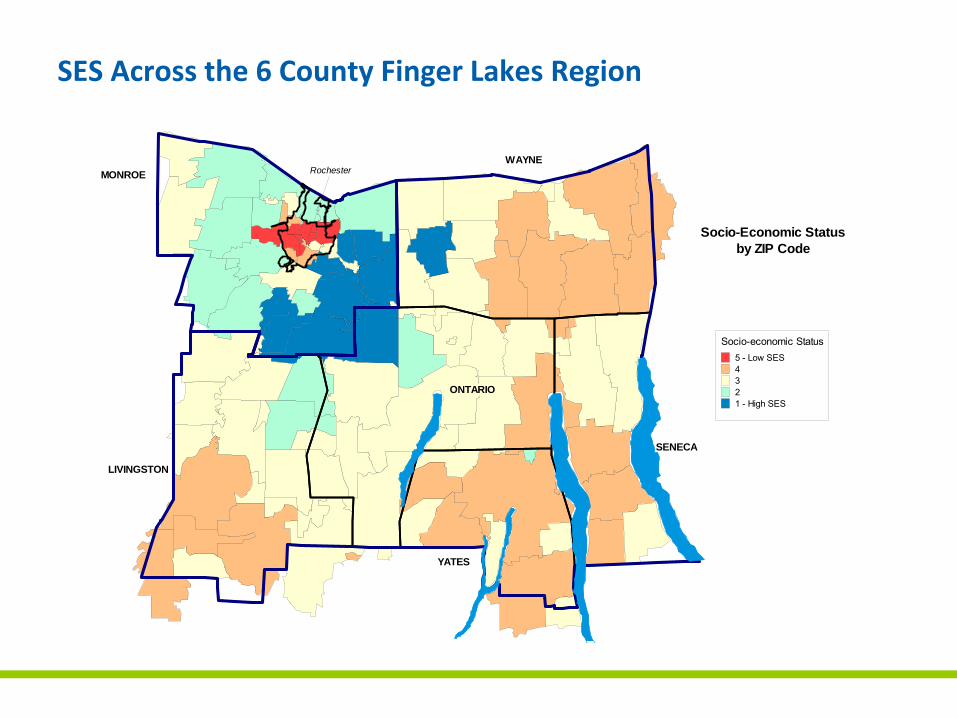
SES Across the 6 County Finger Lakes Region
Socio-Economic Statusby ZIP Code
MONROE
ONTARIO
LIVINGSTON
SENECA
YATES
WAYNERochester
Socio-economic Status5 - Low SES4321 - High SES
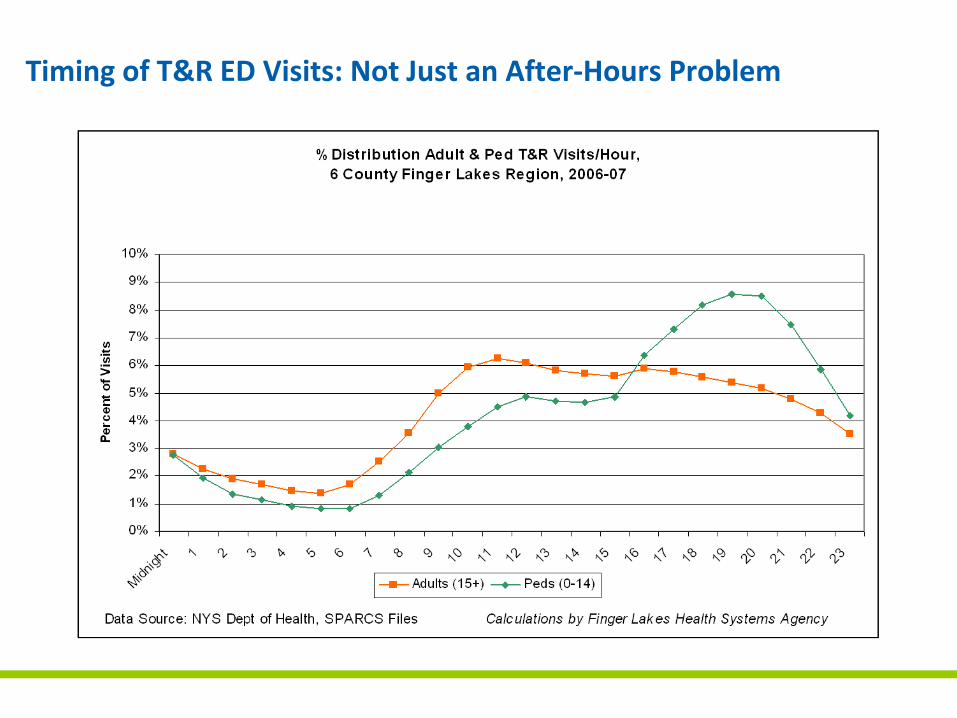
Timing of T&R ED Visits: Not Just an After‐Hours Problem
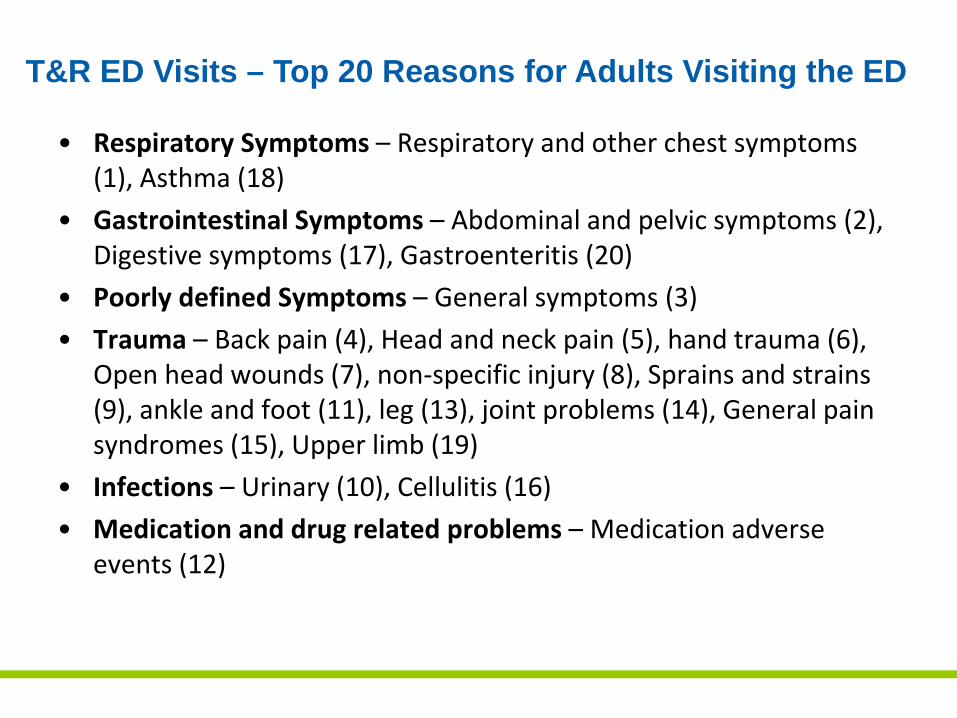
• Respiratory Symptoms – Respiratory and other chest symptoms (1), Asthma (18)
• Gastrointestinal Symptoms – Abdominal and pelvic symptoms (2), Digestive symptoms (17), Gastroenteritis (20)
• Poorly defined Symptoms – General symptoms (3)
• Trauma – Back pain (4), Head and neck pain (5), hand trauma (6), Open head wounds (7), non‐specific injury (8), Sprains and strains (9), ankle and foot (11), leg (13), joint problems (14), General pain syndromes (15), Upper limb (19)
• Infections – Urinary (10), Cellulitis (16)
• Medication and drug related problems – Medication adverse events (12)
T&R ED Visits – Top 20 Reasons for Adults Visiting the ED
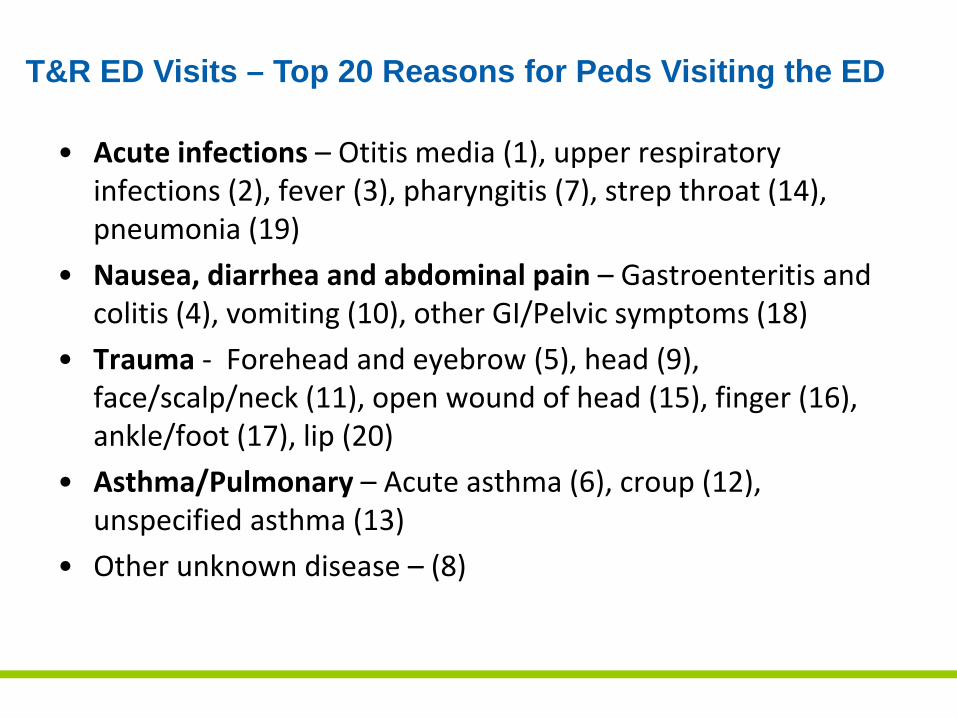
• Acute infections – Otitis media (1), upper respiratory infections (2), fever (3), pharyngitis (7), strep throat (14), pneumonia (19)
• Nausea, diarrhea and abdominal pain – Gastroenteritis and colitis (4), vomiting (10), other GI/Pelvic symptoms (18)
• Trauma ‐ Forehead and eyebrow (5), head (9), face/scalp/neck (11), open wound of head (15), finger (16), ankle/foot (17), lip (20)
• Asthma/Pulmonary – Acute asthma (6), croup (12), unspecified asthma (13)
• Other unknown disease – (8)
T&R ED Visits – Top 20 Reasons for Peds Visiting the ED
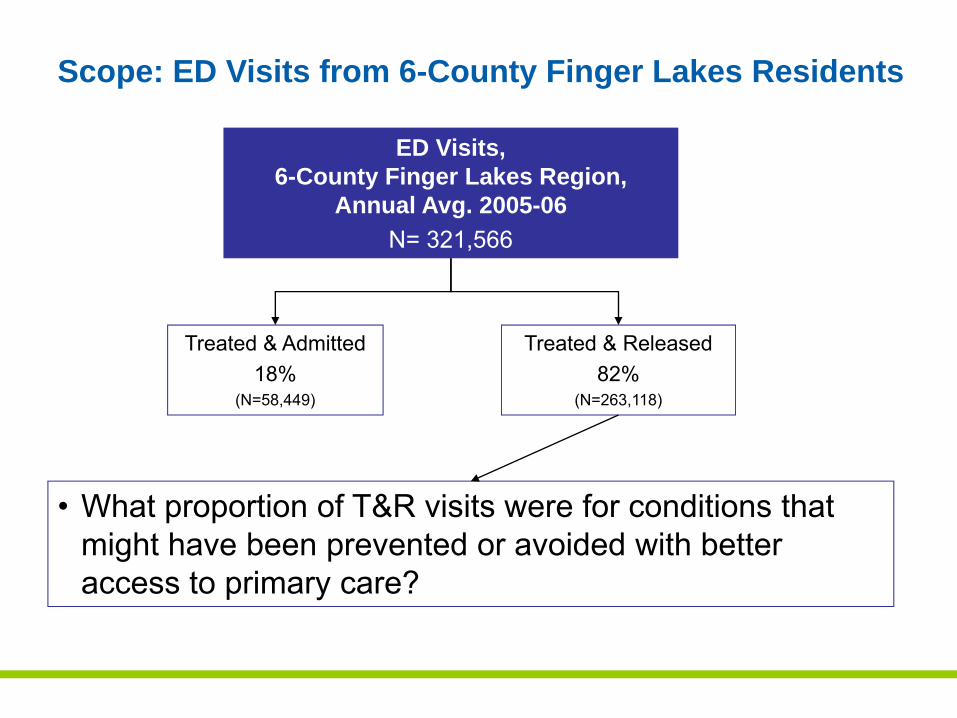
ED Visits, 6-County Finger Lakes Region,
Annual Avg. 2005-06N= 321,566
Treated & Admitted18%
(N=58,449)
Treated & Released82%
(N=263,118)
• What proportion of T&R visits were for conditions that might have been prevented or avoided with better access to primary care?
Scope: ED Visits from 6-County Finger Lakes Residents
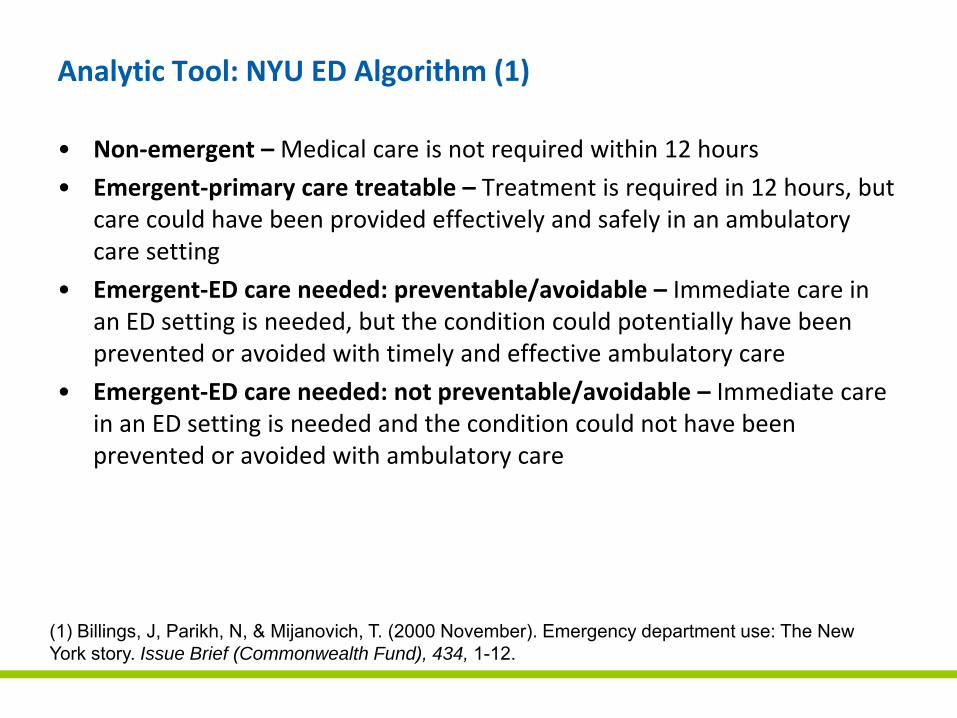
Analytic Tool: NYU ED Algorithm (1)
• Non‐emergent –Medical care is not required within 12 hours
• Emergent‐primary care treatable – Treatment is required in 12 hours, but care could have been provided effectively and safely in an ambulatory care setting
• Emergent‐ED care needed: preventable/avoidable – Immediate care in an ED setting is needed, but the condition could potentially have been prevented or avoided with timely and effective ambulatory care
• Emergent‐ED care needed: not preventable/avoidable – Immediate care in an ED setting is needed and the condition could not have been prevented or avoided with ambulatory care
(1) Billings, J, Parikh, N, & Mijanovich, T. (2000 November). Emergency department use: The New York story. Issue Brief (Commonwealth Fund), 434, 1-12.
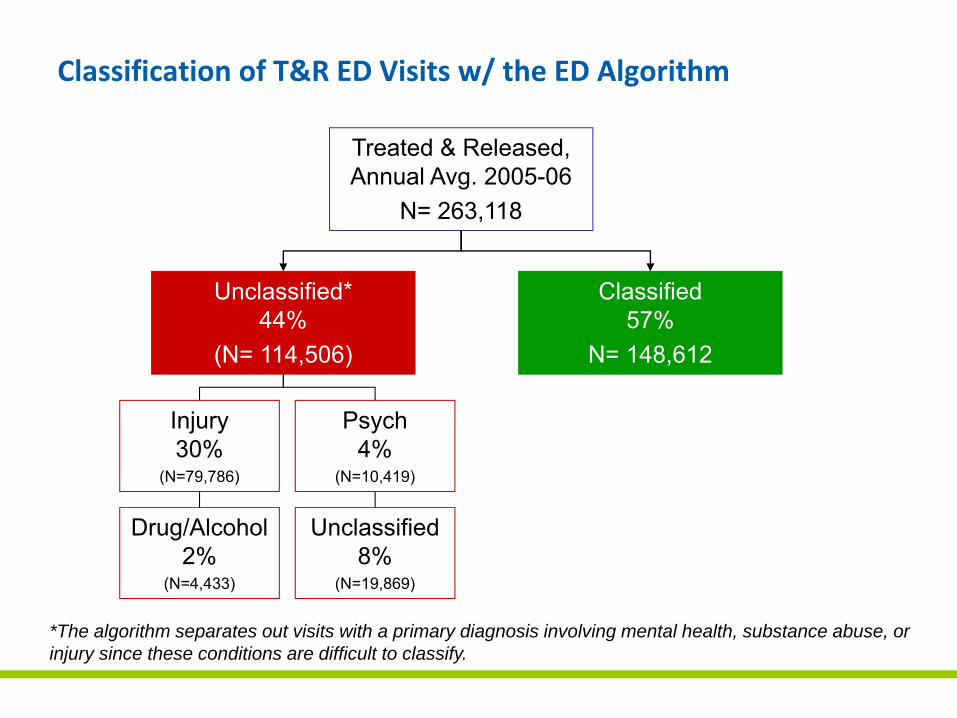
Classification of T&R ED Visits w/ the ED Algorithm
*The algorithm separates out visits with a primary diagnosis involving mental health, substance abuse, or injury since these conditions are difficult to classify.
Treated & Released, Annual Avg. 2005-06
N= 263,118
Unclassified*44%
(N= 114,506)
Classified57%
N= 148,612
Injury30%
(N=79,786)
Psych4%
(N=10,419)
Drug/Alcohol2%
(N=4,433)
Unclassified8%
(N=19,869)
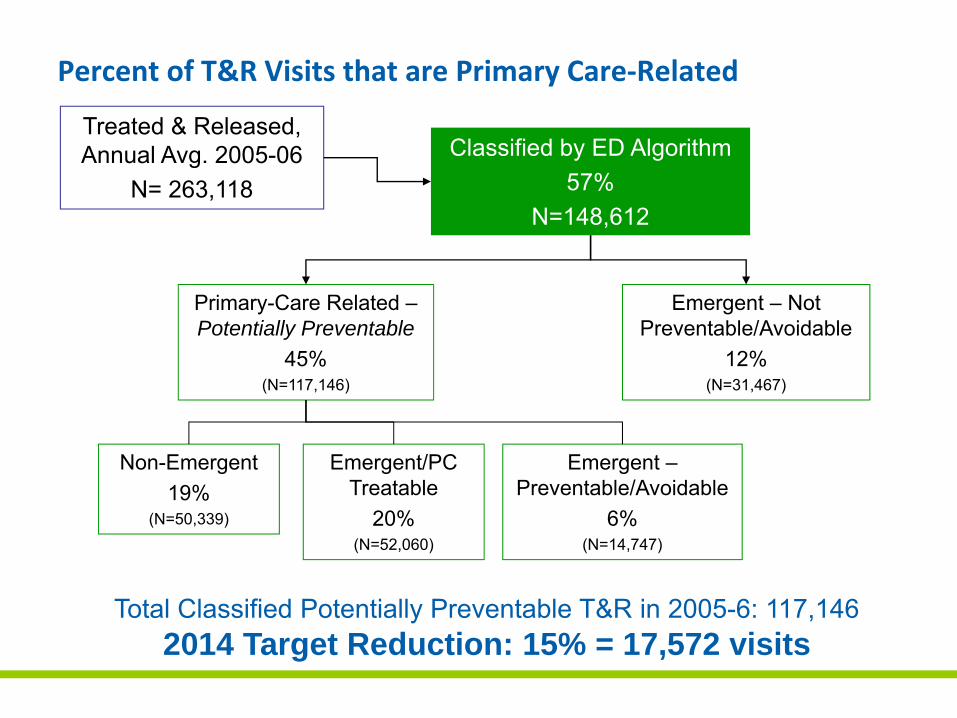
Percent of T&R Visits that are Primary Care‐Related
Classified by ED Algorithm 57%
N=148,612
Primary-Care Related –Potentially Preventable
45%(N=117,146)
Non-Emergent19%
(N=50,339)
Emergent/PC Treatable
20%(N=52,060)
Emergent –Preventable/Avoidable
6%(N=14,747)
Emergent – Not Preventable/Avoidable
12%(N=31,467)
Total Classified Potentially Preventable T&R in 2005-6: 117,1462014 Target Reduction: 15% = 17,572 visits
Treated & Released, Annual Avg. 2005-06
N= 263,118
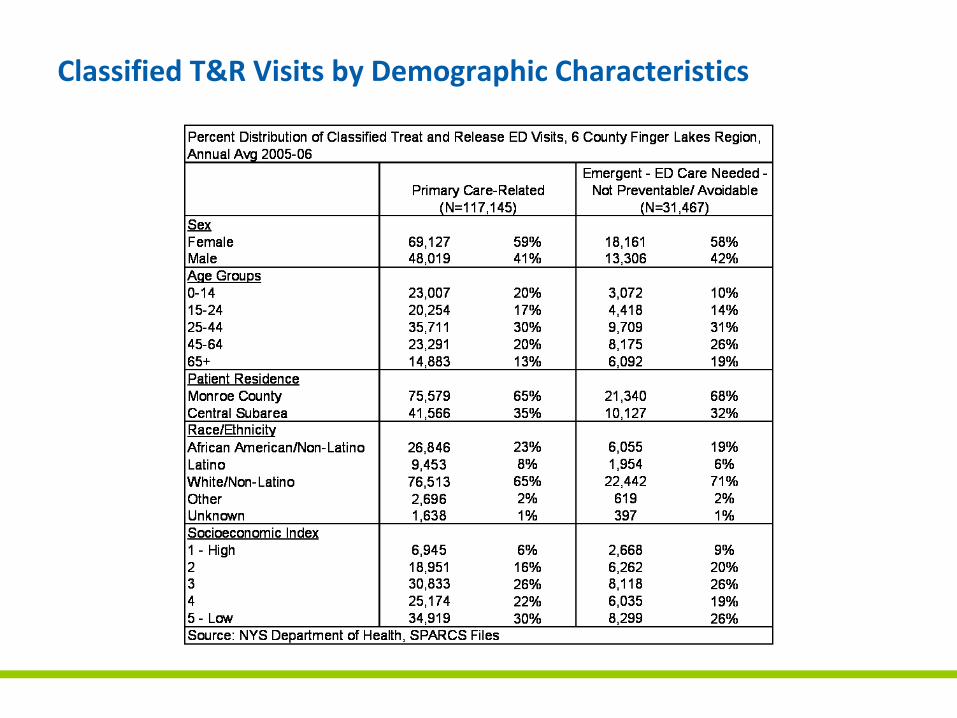
Classified T&R Visits by Demographic Characteristics
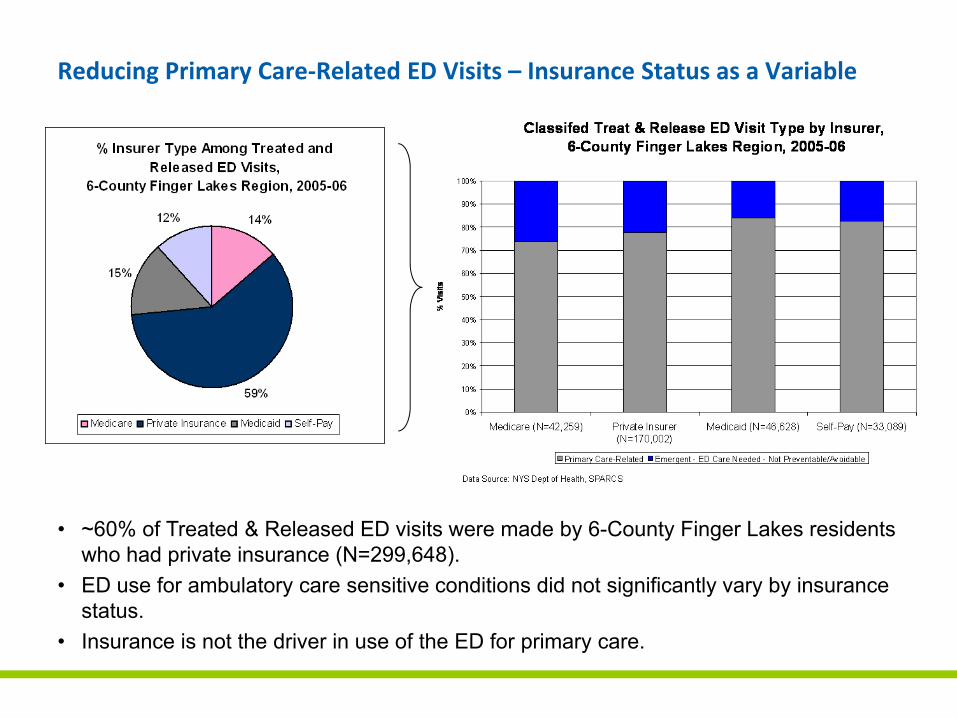
Reducing Primary Care‐Related ED Visits – Insurance Status as a Variable
• ~60% of Treated & Released ED visits were made by 6-County Finger Lakes residents who had private insurance (N=299,648).
• ED use for ambulatory care sensitive conditions did not significantly vary by insurance status.
• Insurance is not the driver in use of the ED for primary care.
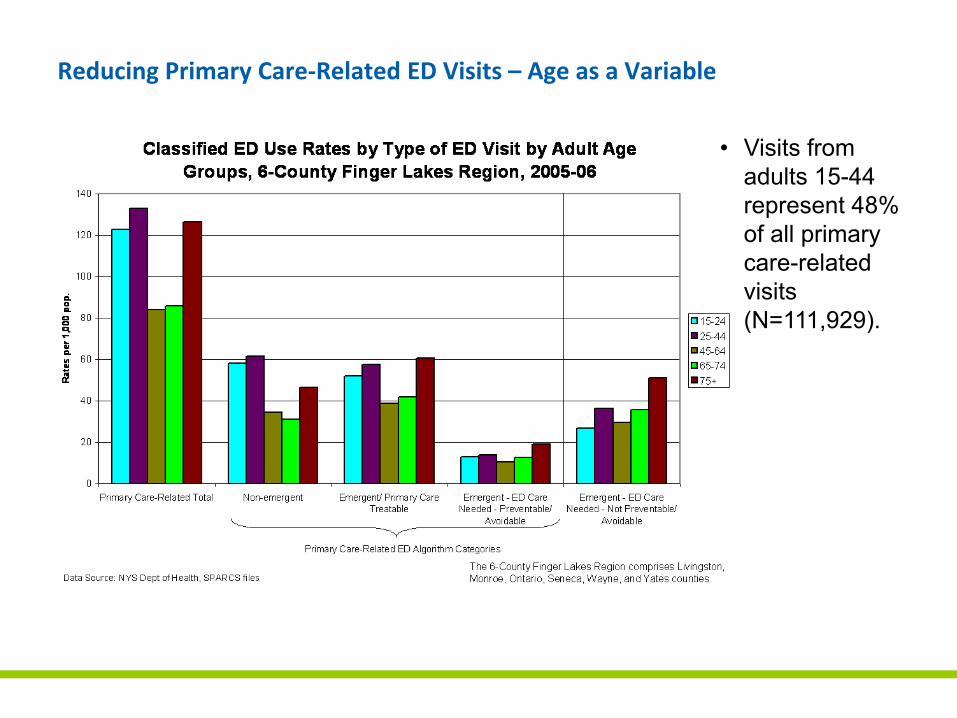
Reducing Primary Care‐Related ED Visits – Age as a Variable
• Visits from adults 15-44 represent 48% of all primary care-related visits (N=111,929).
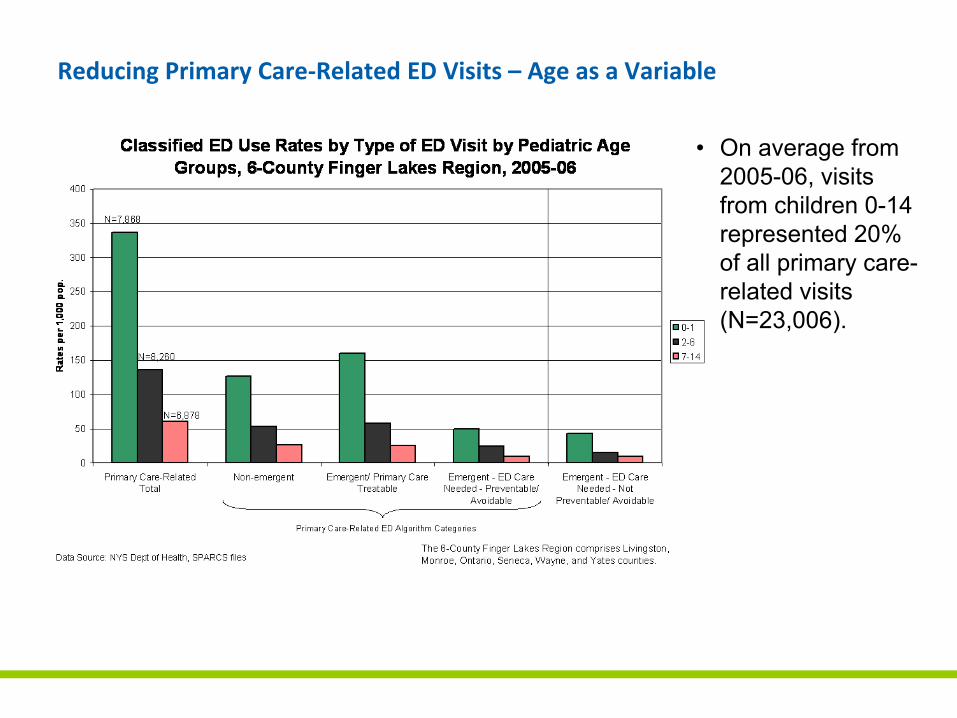
Reducing Primary Care‐Related ED Visits – Age as a Variable
• On average from 2005-06, visits from children 0-14 represented 20% of all primary care-related visits (N=23,006).
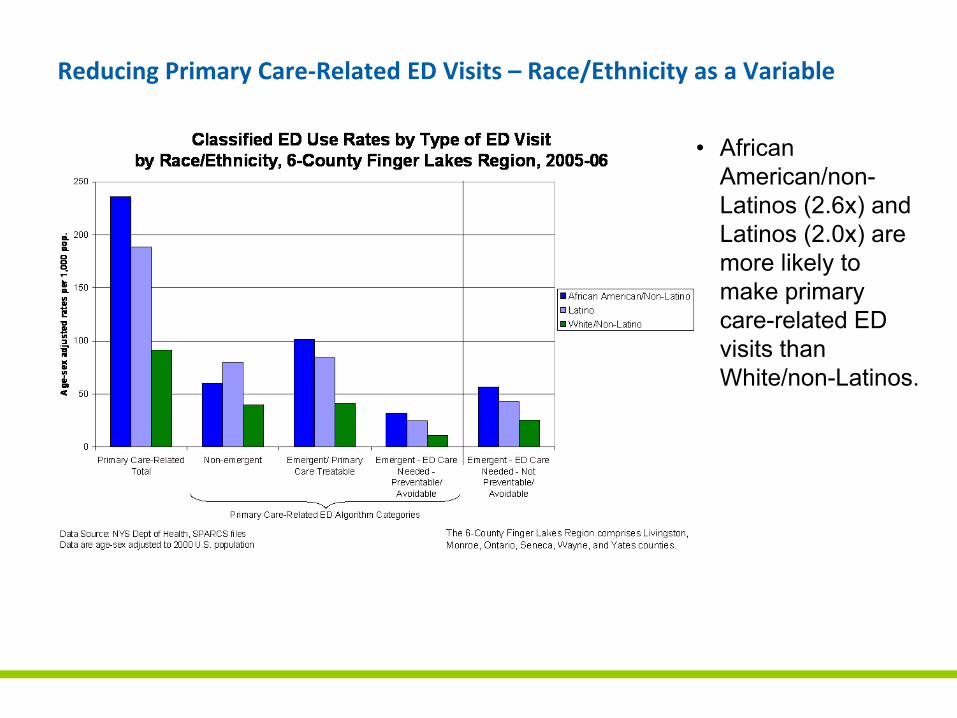
Reducing Primary Care‐Related ED Visits – Race/Ethnicity as a Variable
• African American/non-Latinos (2.6x) and Latinos (2.0x) are more likely to make primary care-related ED visits than White/non-Latinos.
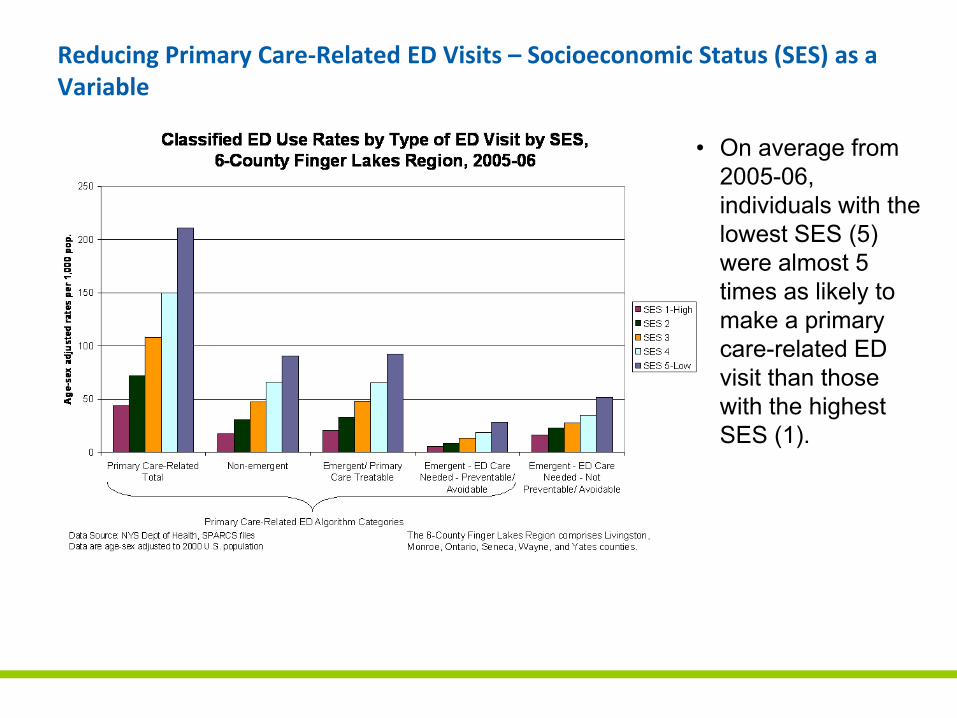
Reducing Primary Care‐Related ED Visits – Socioeconomic Status (SES) as a Variable
• On average from 2005-06, individuals with the lowest SES (5) were almost 5 times as likely to make a primary care-related ED visit than those with the highest SES (1).
• The primary focus to reduce primary care‐related ED visits is on patients of lower SES, especially African Americans and Latinos ages 15 to 44, and newborns (ages 0‐1).
• The majority of ED visits are made by white, mid‐ and lower SES individuals. Interventions must target this group as well
• Insurance status is not the major driver of ED use.
• Peak time for ED visits is afternoon and early evening; times that office practices are or can be “open.”
• Visits are for symptoms and trauma in adults; infections, trauma and symptoms in children
• We need more local data on reasons why people seek primary care in the ED and potential barriers to receiving care in the schools, physician offices and urgent care centers.
Conclusions from FLHSA Compiled Data
Lessons from National Studies
• Population drivers of ED use include race/ethnicity, low income, fair/poor health, being enrolled in an HMO, and proximity to an ED (2).
• African‐Americans, and Medicaid or uninsured patients constitute a disproportionate share of ED visits for ambulatory care sensitive conditions – a trend that does not appear to be explained by either differences in disease prevalence or severity (3).
• Patients were more likely to list medical necessity, convenience, a preference for the ED, and affordability than limitations of insurance as reasons for going to the ED (4).
• Interventions should be multifaceted.
Lessons from National Studies
• Influence of insurance coverage on ED use under debate – The rise in ED use appears to be driven by non‐poor individuals who
have insurance and a usual source of care (5).
– Uninsured patients are slightly more likely to make non‐urgent ED visits than those with private insurance (6).
– Low‐income, uninsured, and Medicaid patients depend more on EDs than people with Medicare or private coverage (7).
– Available data do not support assumptions that uninsured patients are a primary cause of ED overcrowding, present with less acute conditions than insured patients, or seek ED care primarily for convenience (8).
Issues to Keep in Mind
• The Institute for Healthcare Improvement ED reduction collaborative and the California Quality Collective found patient and physician focus groups to be important ways of understanding reasons for patients preferentially using the ED as a source of urgent care.
• Programs to provide primary care to uninsured using the ED have been successful in reducing ED and hospital use.
• Reducing ED use will influence hospital margins; especially focusing on reducing ED use in those with insurance. We understand this is a complex issue for hospitals.
Reducing Avoidable ED Use Interventions
• Telemed acute visits for children 1‐18
• Educational intervention for children 0‐1
• Providing Resources for Primary Care moving toward Patient Centered Medical Home model of care
Progress to Date
• Educational tool chosen and practice indentified for educational intervention (OB office)
• Telemed expansion already expanded in Rochester school district
• Standardization of telemed coding being implemented
• PCP Resources identified in HEAL funding:– Practice consultants
– IT resources
– Learning collaborative on care management
SAGE
• A comprehensive long range plan to address the health service needs of the 65 and older population
• Create a vision for a local system that makes health care more accessible for older adults, minimizes disparities, and that is financially viable
• Address:– The aging population
– Caregiver decline
– Financial instability
– Workforce shortage
Recommendations
• Increase the array of home and community based services
• Rebalance Long Term Care
• Improve access to care
• Change the current reimbursement system
• Enhance support for “informal” caregivers
• Enhance transportation services to maintain independence
• Expand housing options
• Increase the number of trained workers dedicated to geriatric health and community based services
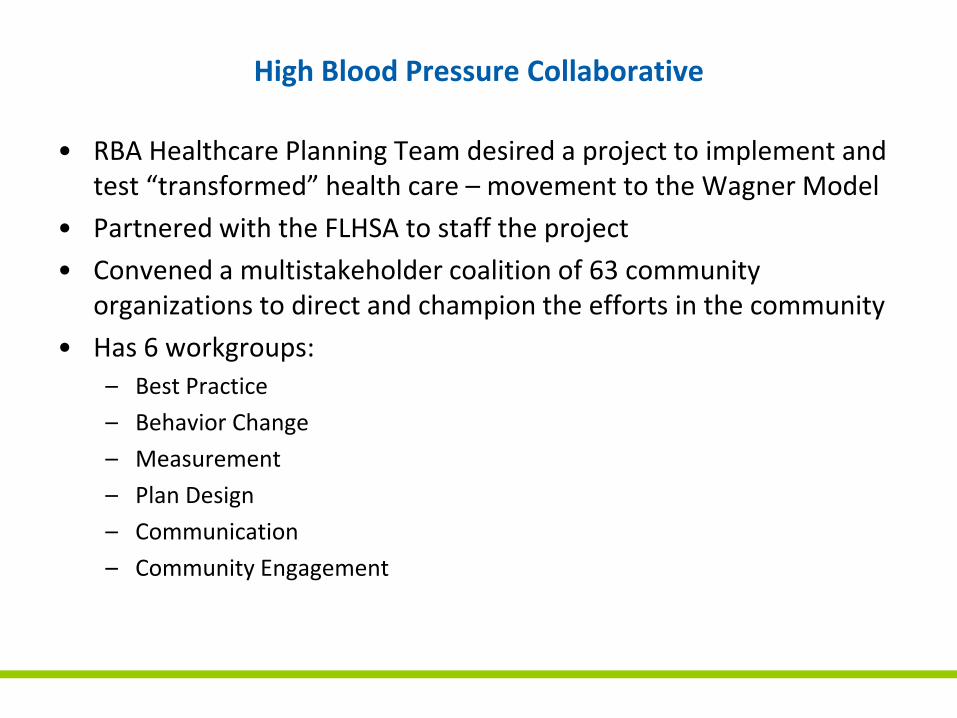
High Blood Pressure Collaborative
• RBA Healthcare Planning Team desired a project to implement and test “transformed” health care – movement to the Wagner Model
• Partnered with the FLHSA to staff the project
• Convened a multistakeholder coalition of 63 community organizations to direct and champion the efforts in the community
• Has 6 workgroups:– Best Practice
– Behavior Change
– Measurement
– Plan Design
– Communication
– Community Engagement

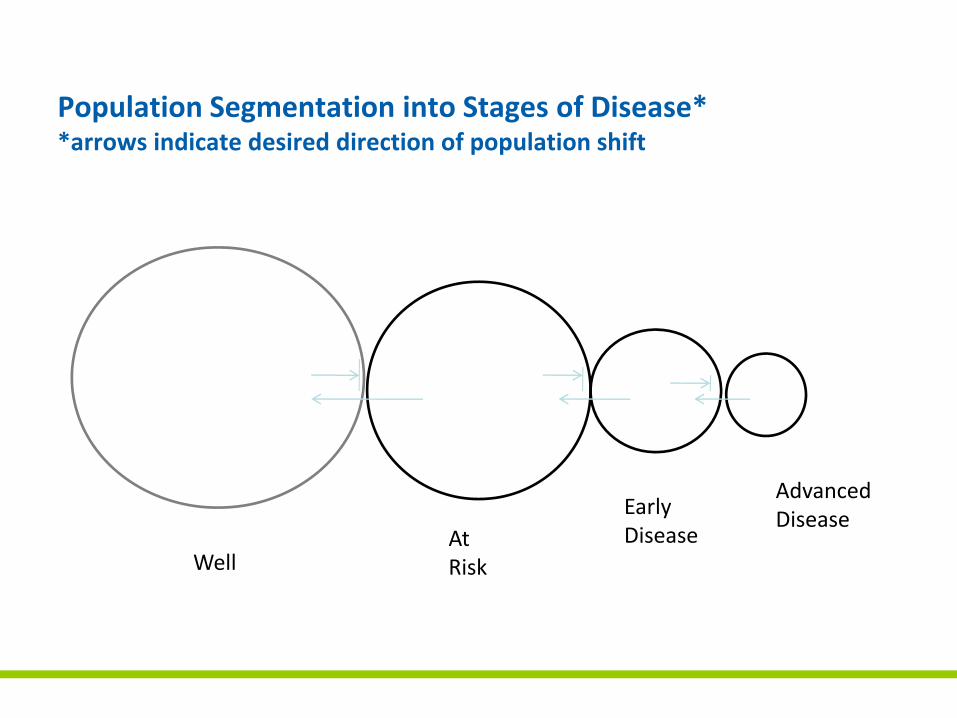
Population Segmentation into Stages of Disease**arrows indicate desired direction of population shift
WellAt Risk
Early Disease
Advanced Disease
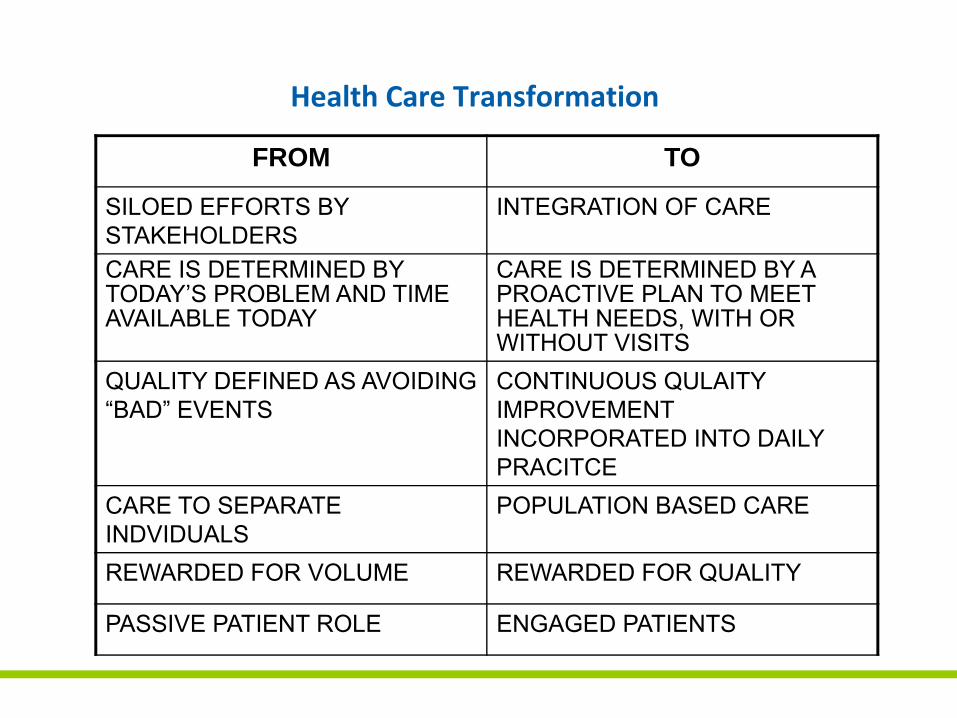
Health Care Transformation
FROM TO
SILOED EFFORTS BY STAKEHOLDERS
INTEGRATION OF CARE
CARE IS DETERMINED BY TODAY’S PROBLEM AND TIME AVAILABLE TODAY
CARE IS DETERMINED BY A PROACTIVE PLAN TO MEET HEALTH NEEDS, WITH OR WITHOUT VISITS
QUALITY DEFINED AS AVOIDING “BAD” EVENTS
CONTINUOUS QULAITY IMPROVEMENT INCORPORATED INTO DAILY PRACITCE
CARE TO SEPARATE INDVIDUALS
POPULATION BASED CARE
REWARDED FOR VOLUME REWARDED FOR QUALITY
PASSIVE PATIENT ROLE ENGAGED PATIENTS
Consequences of High Blood Pressure:
Initiation of Dialysis
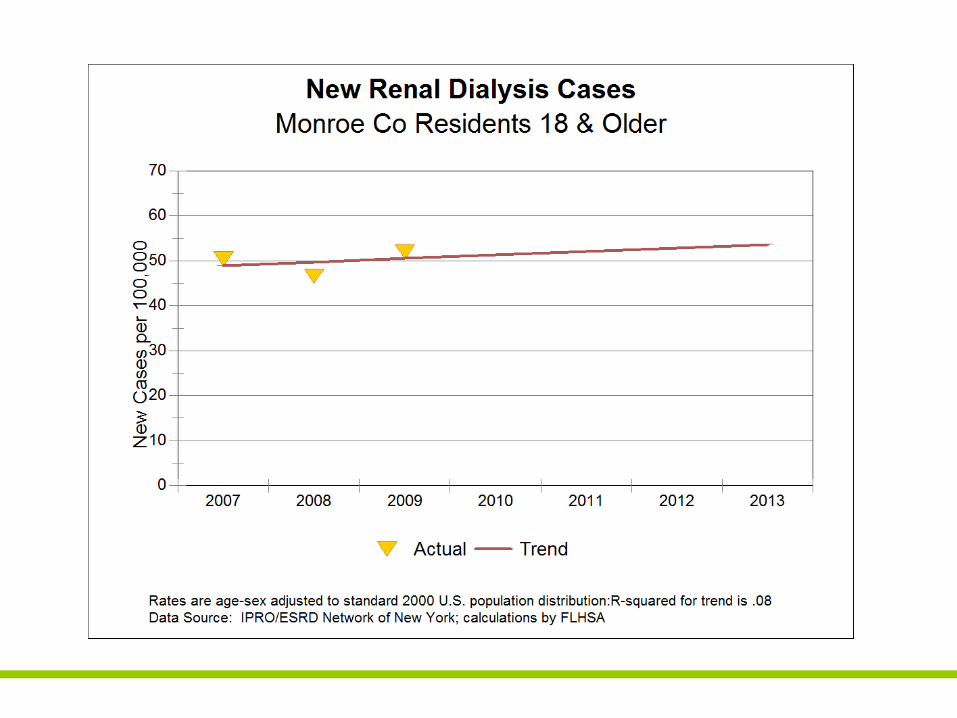
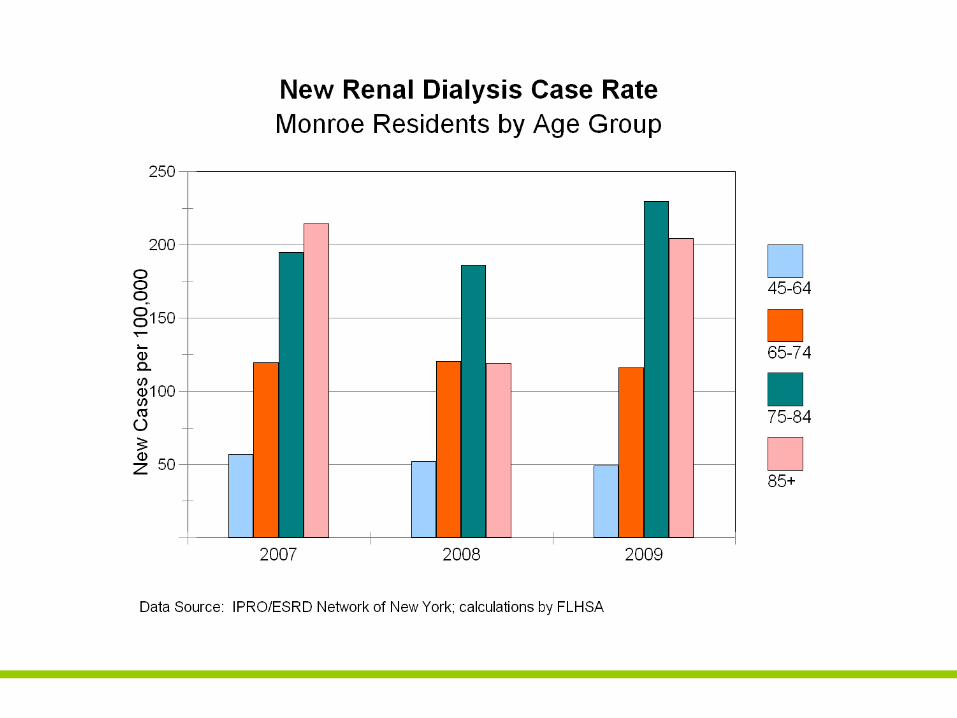
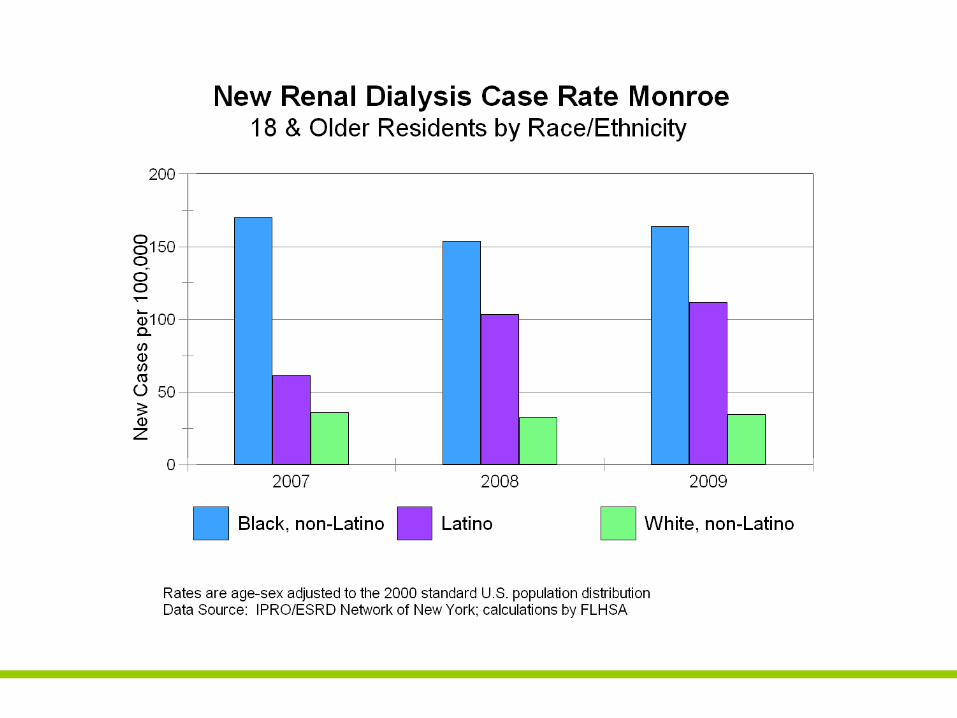
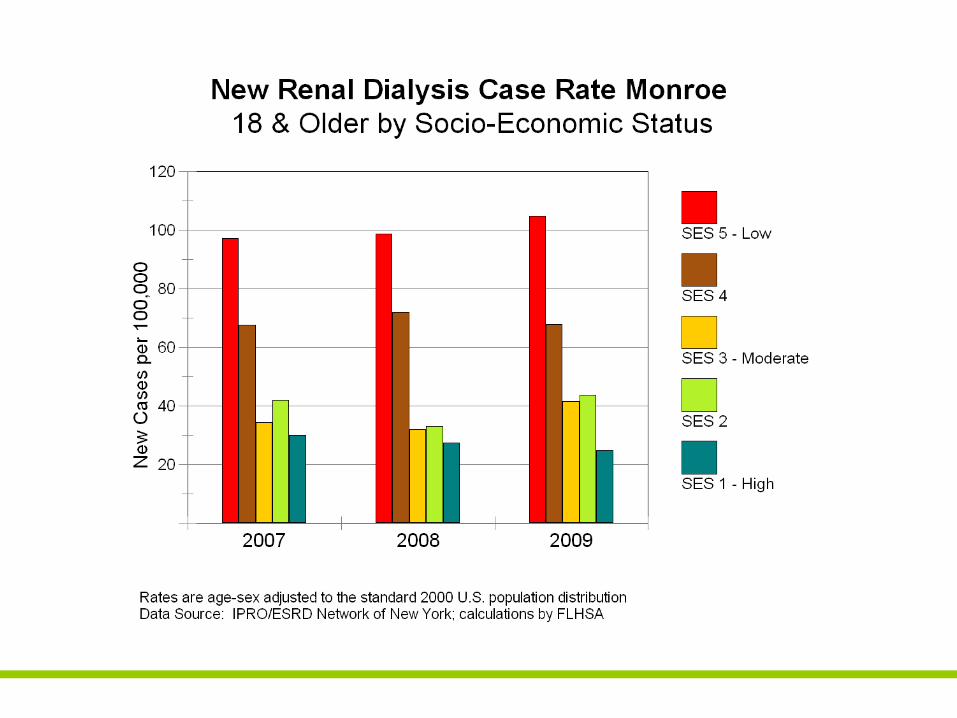
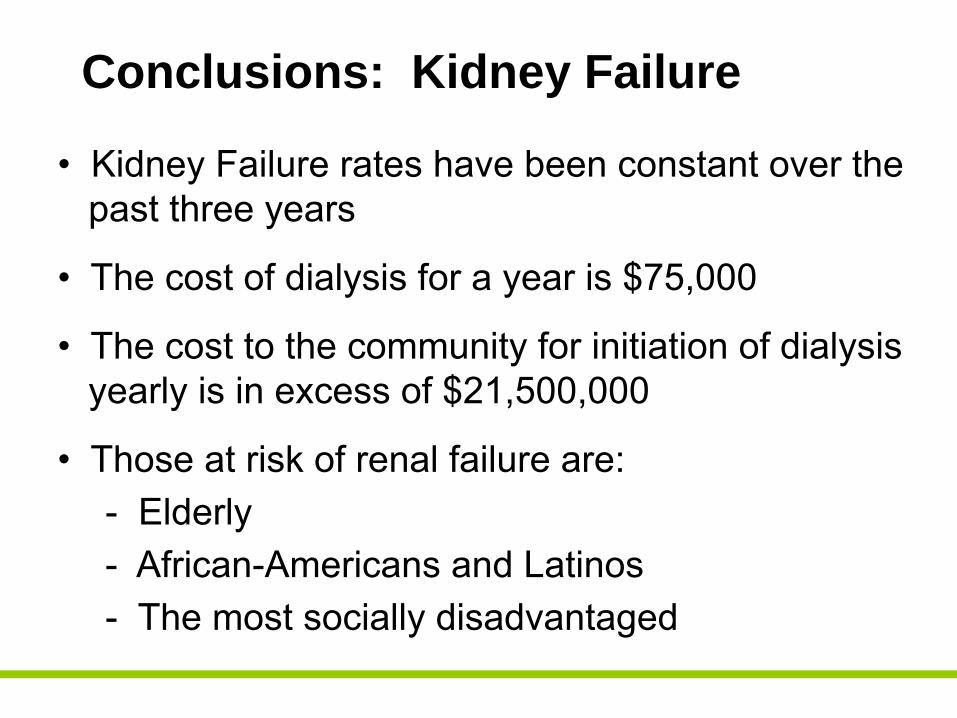
Conclusions: Kidney Failure
• Kidney Failure rates have been constant over thepast three years
• The cost of dialysis for a year is $75,000
• The cost to the community for initiation of dialysisyearly is in excess of $21,500,000
• Those at risk of renal failure are:- Elderly- African-Americans and Latinos- The most socially disadvantaged
Consequences of High Blood Pressure:
Stroke
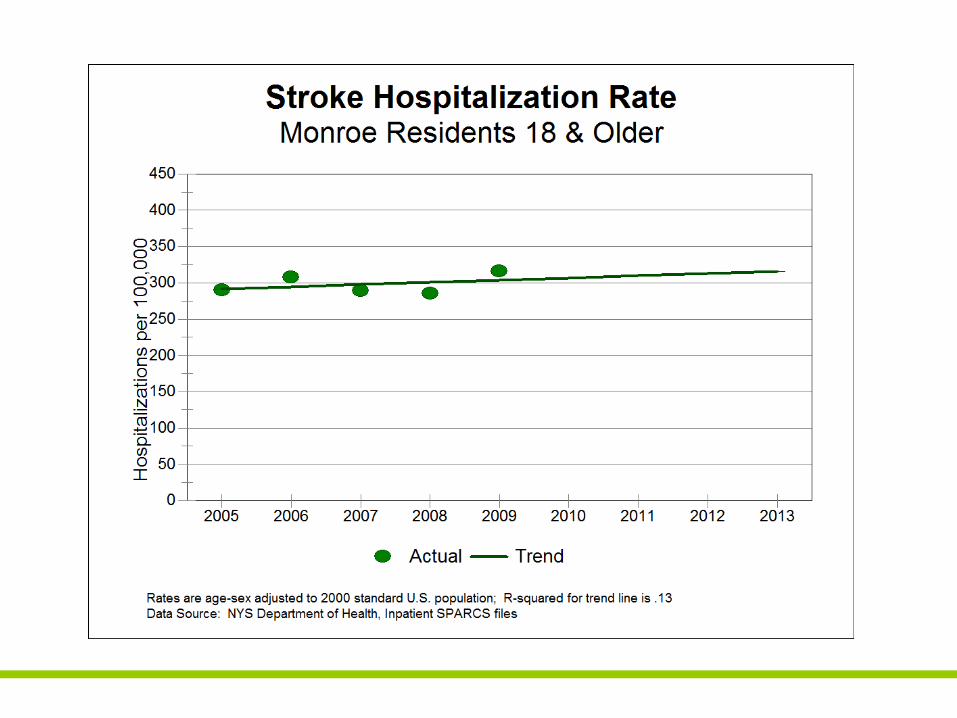
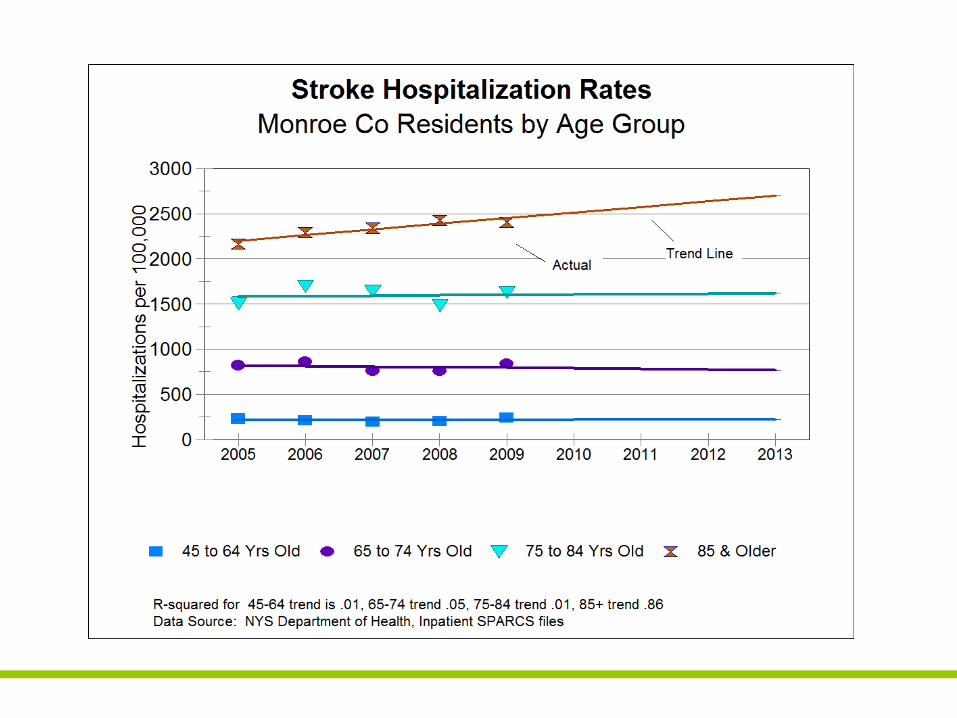
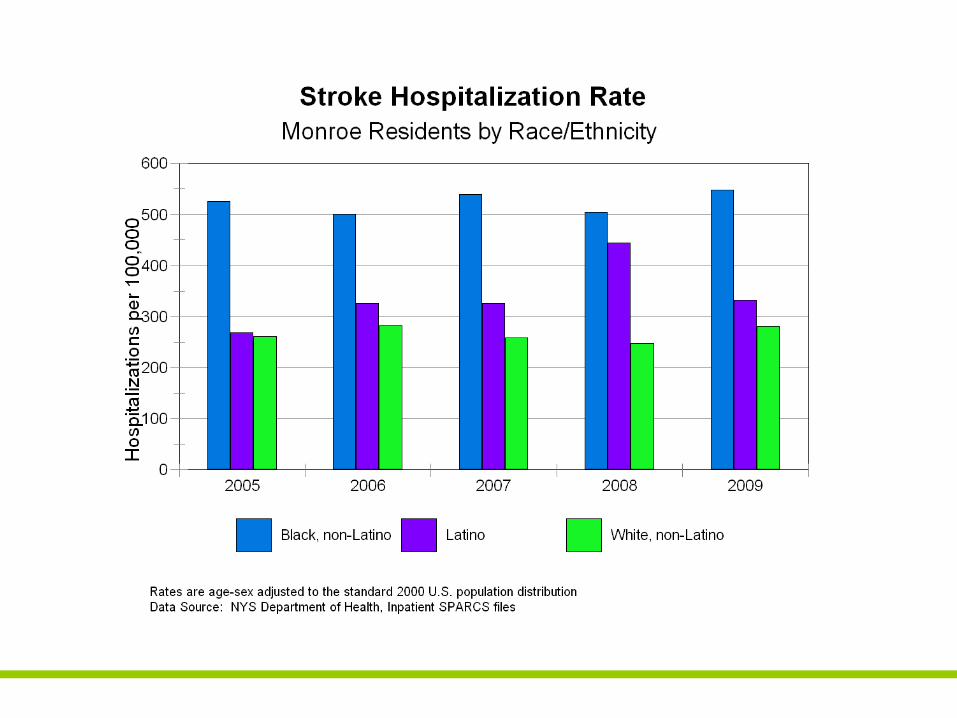
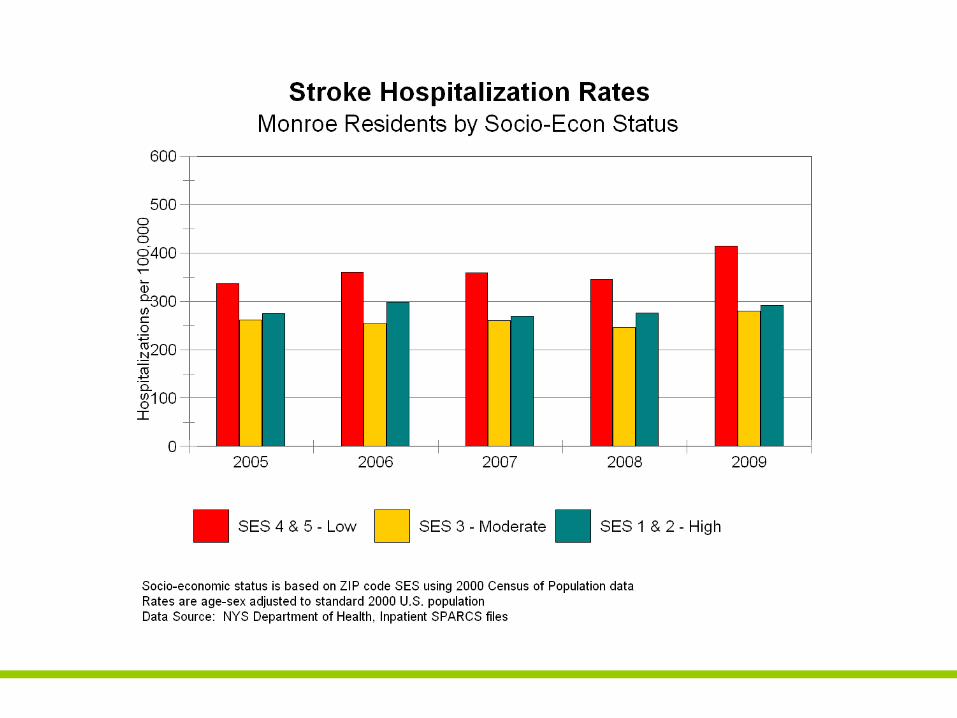
Conclusions: Stroke• Hospitalization rate for Stroke is unchanged over
the past five years
• Those most at risk are:- Elderly- African-Americans and Latinos (the disparity
is increasing)- The most socio-economically disadvantaged
(the disparity is increasing
Consequences of High Blood Pressure:
Heart Failure
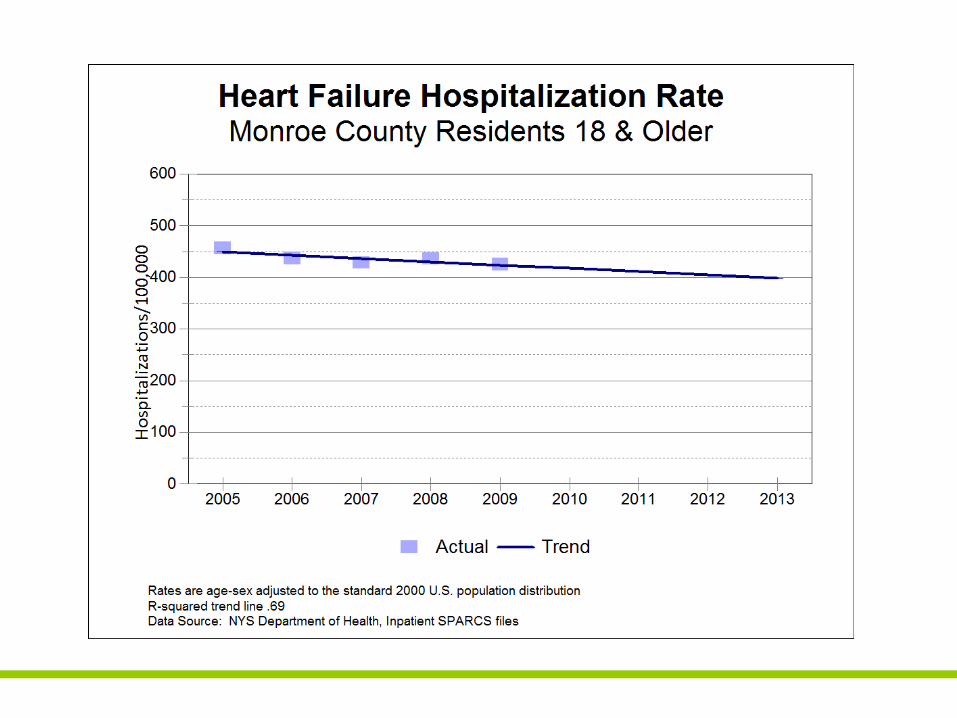
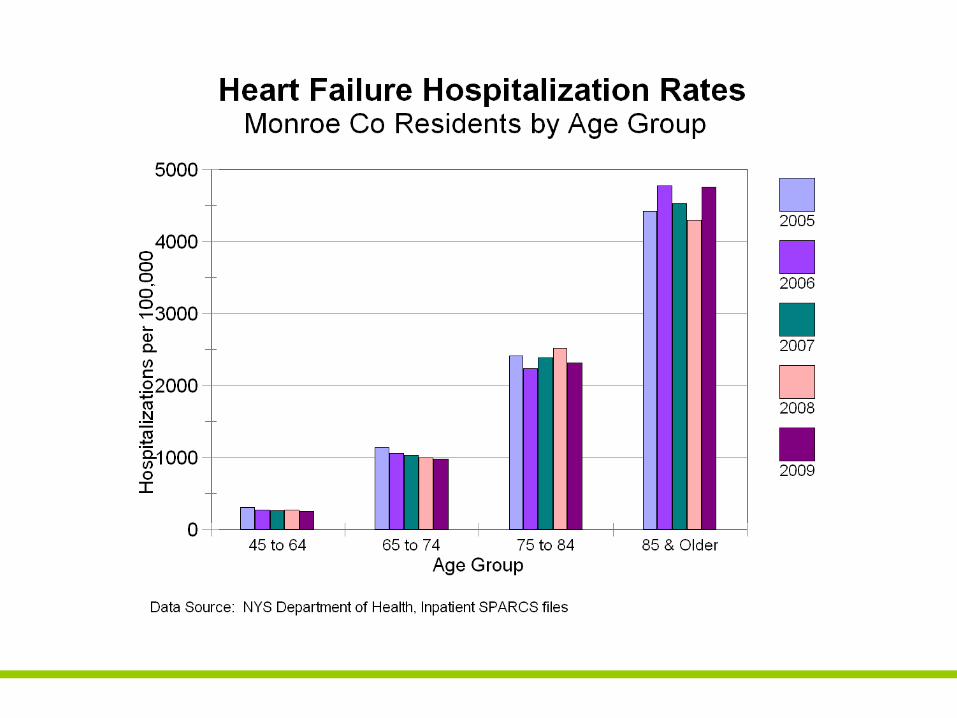
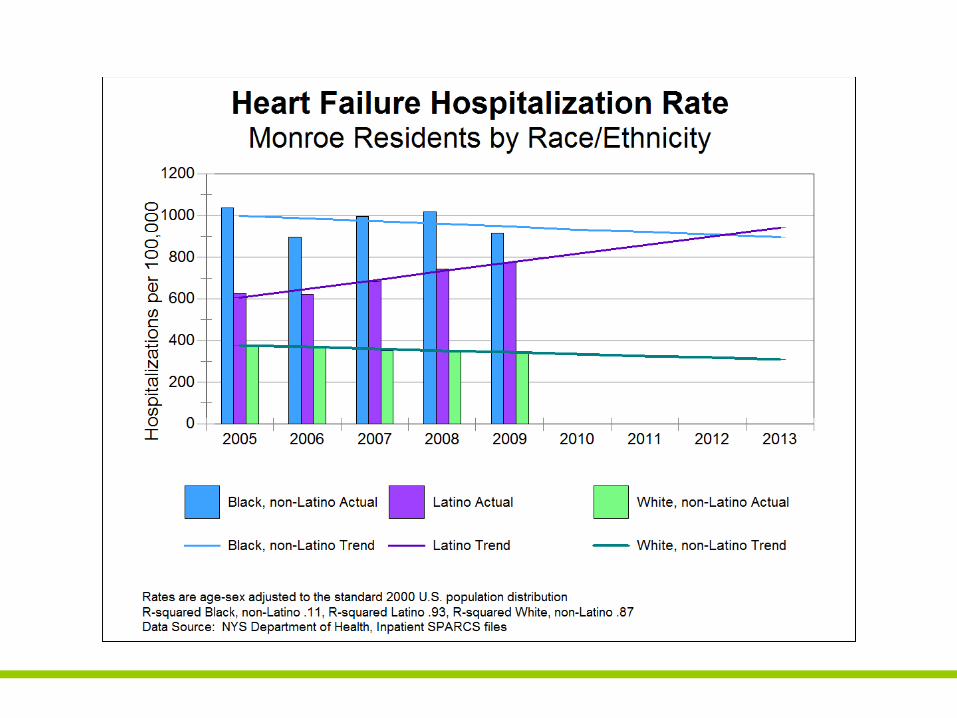
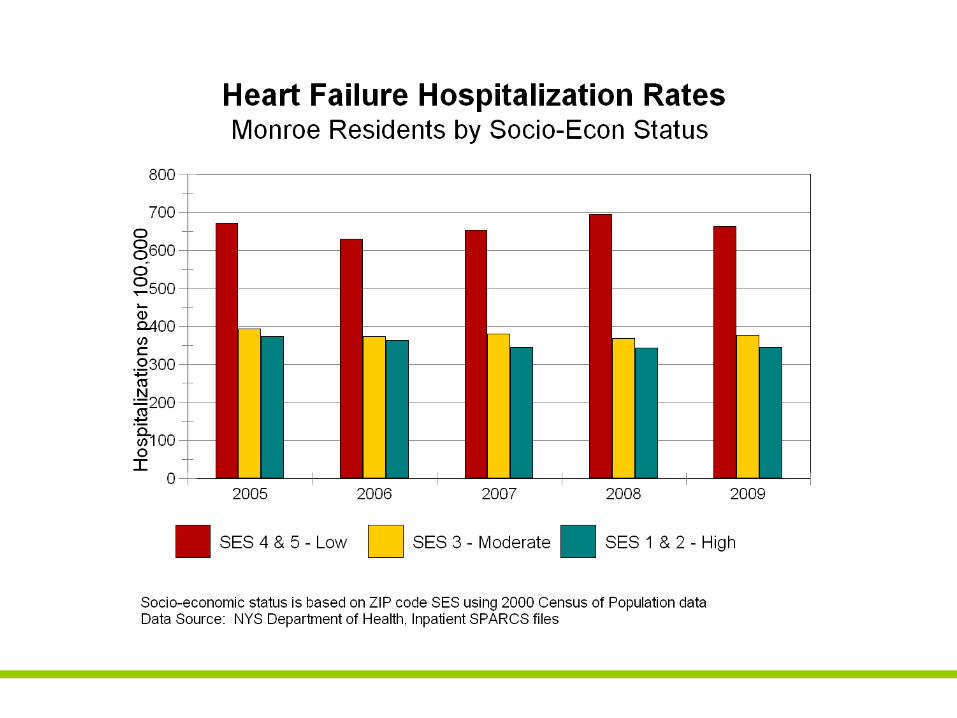
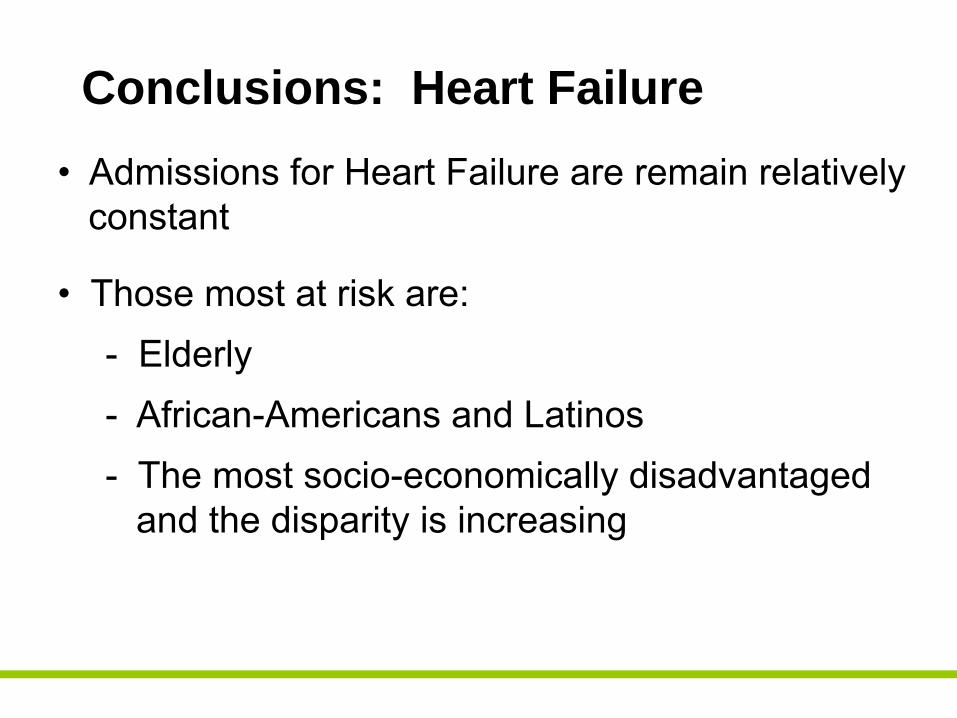
Conclusions: Heart Failure• Admissions for Heart Failure are remain relatively
constant
• Those most at risk are:- Elderly- African-Americans and Latinos - The most socio-economically disadvantaged
and the disparity is increasing
Consequences of High Blood Pressure:
Coronary Artery Disease
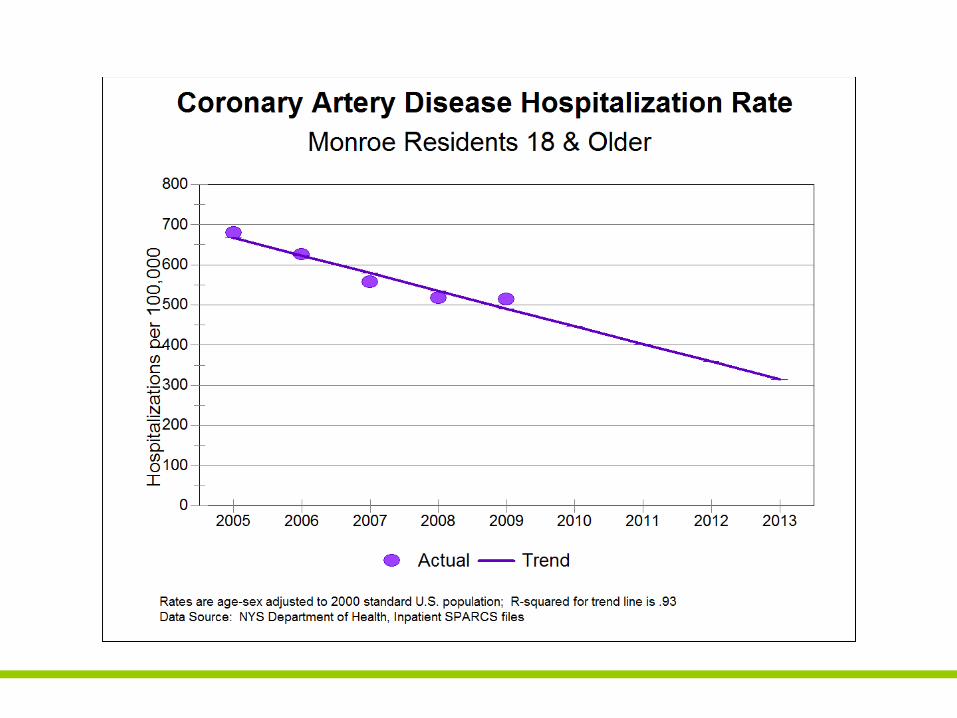
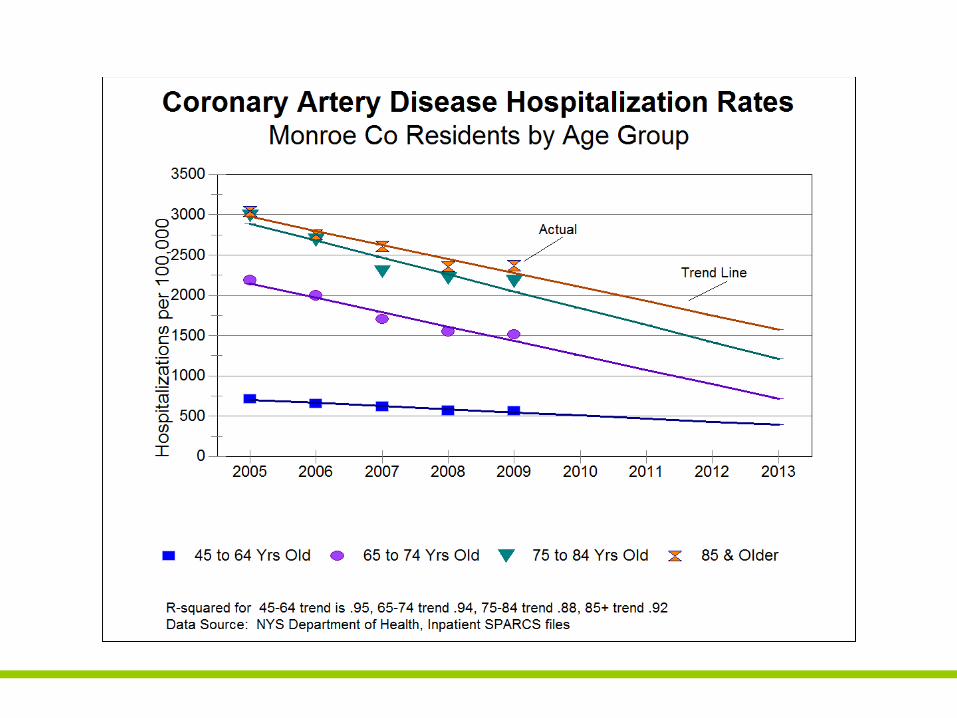
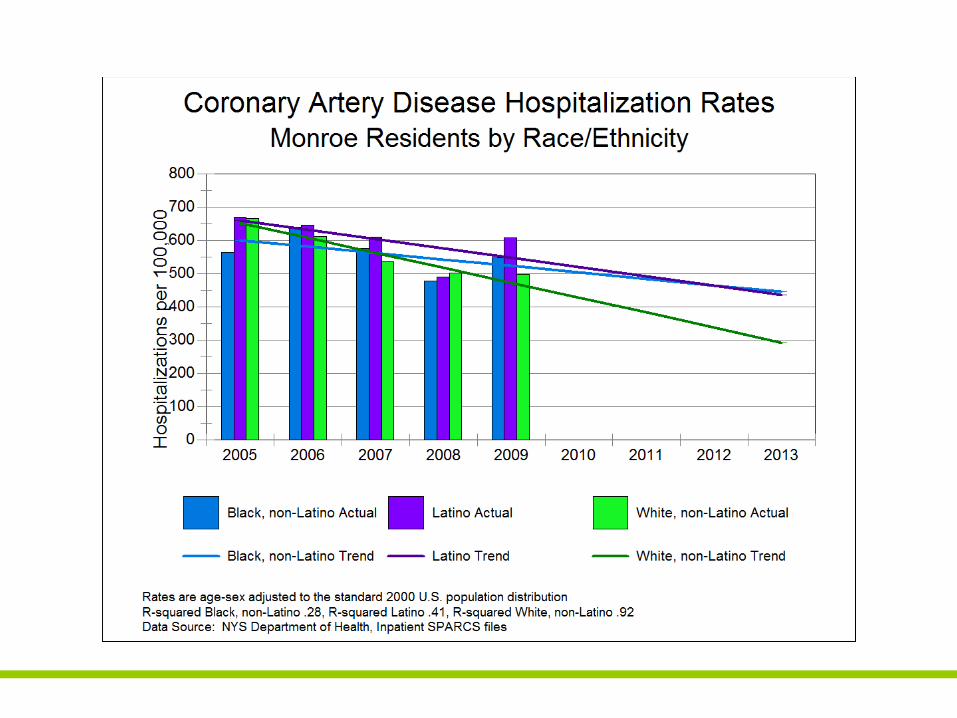
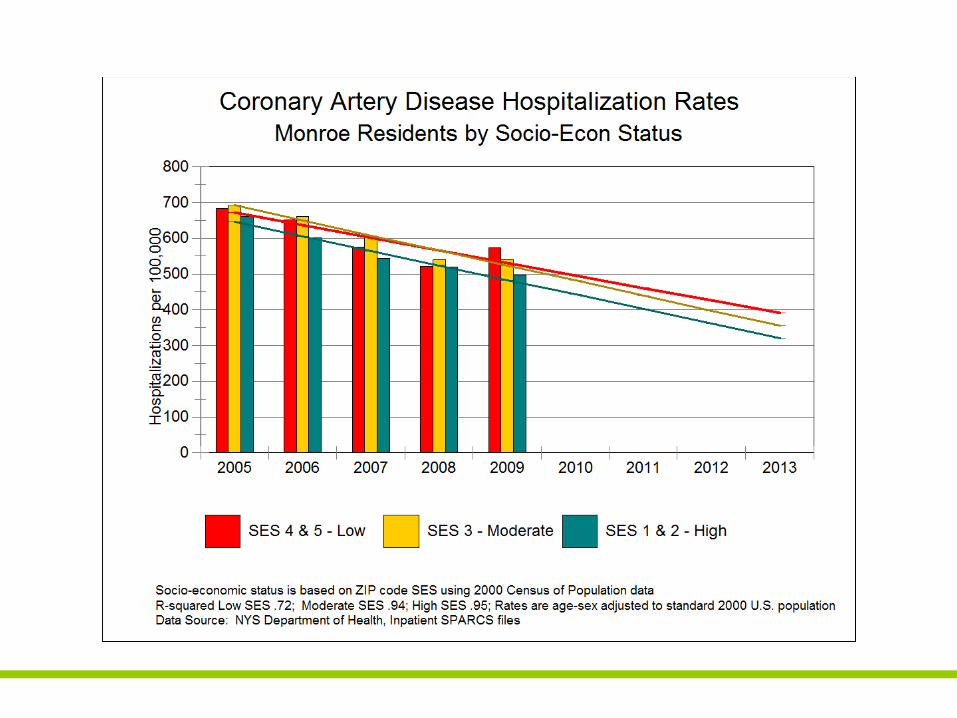
Conclusions: Coronary Artery Disease
• The number of admissions for CAD are falling
• Those most at risk are:- Elderly- African-Americans and Latinos
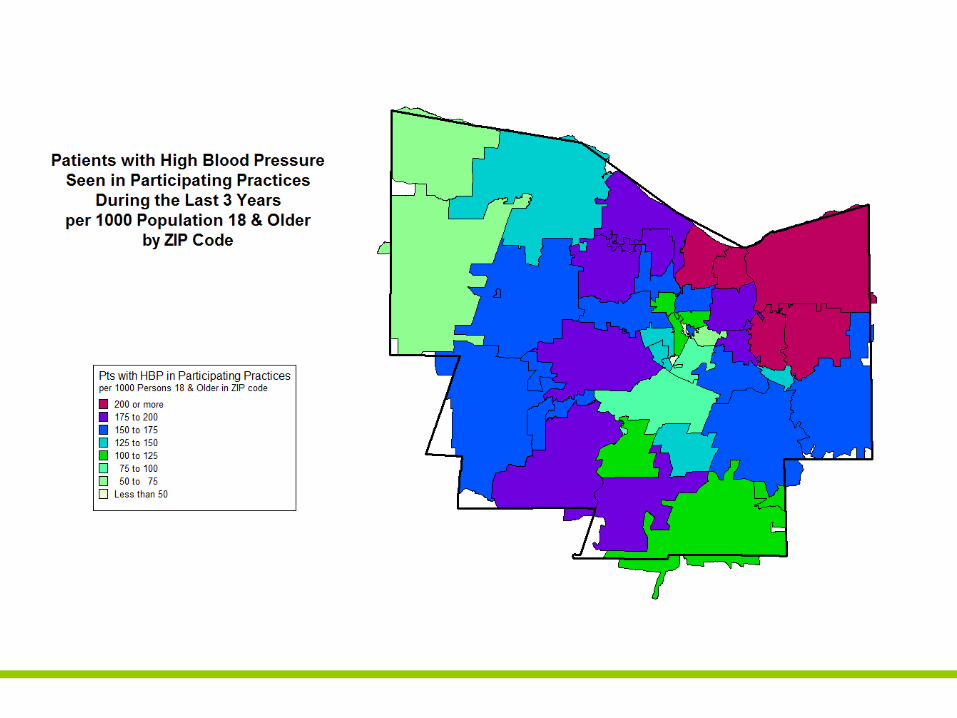
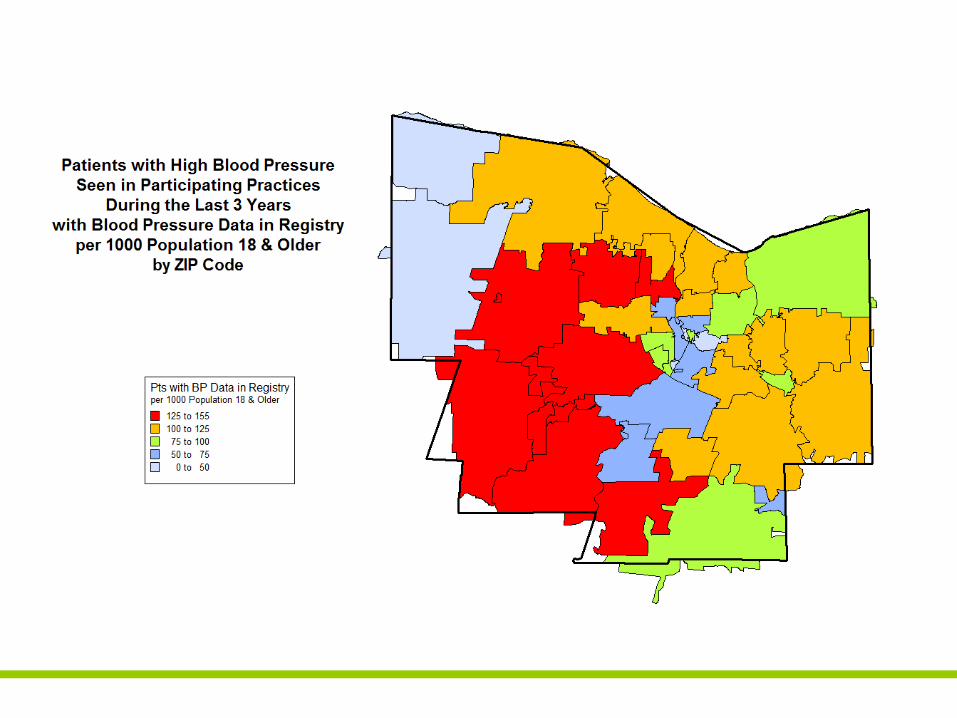
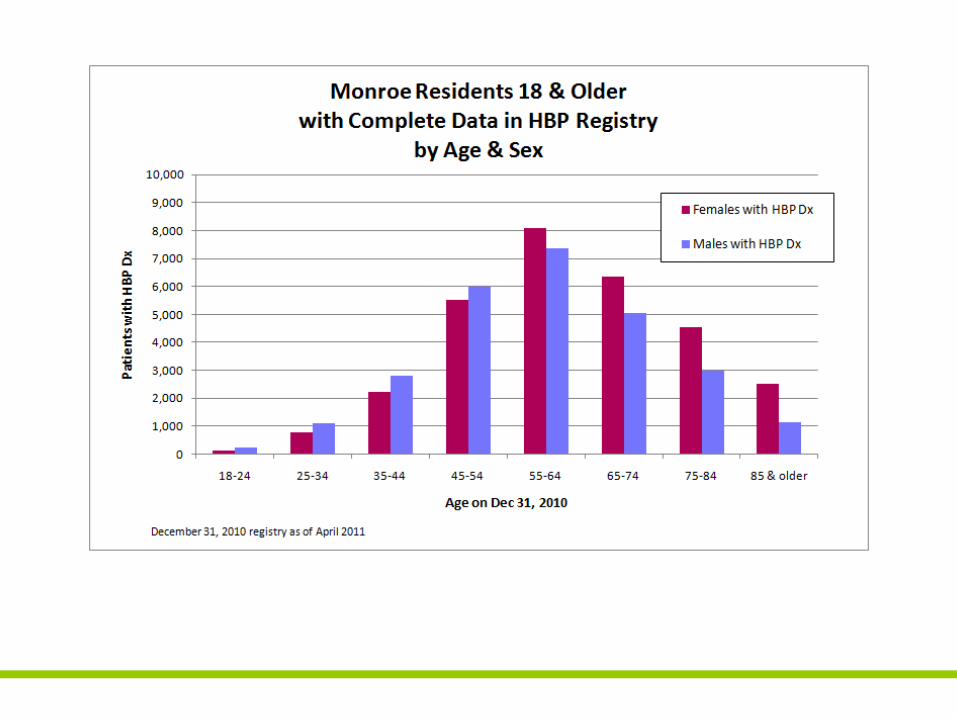
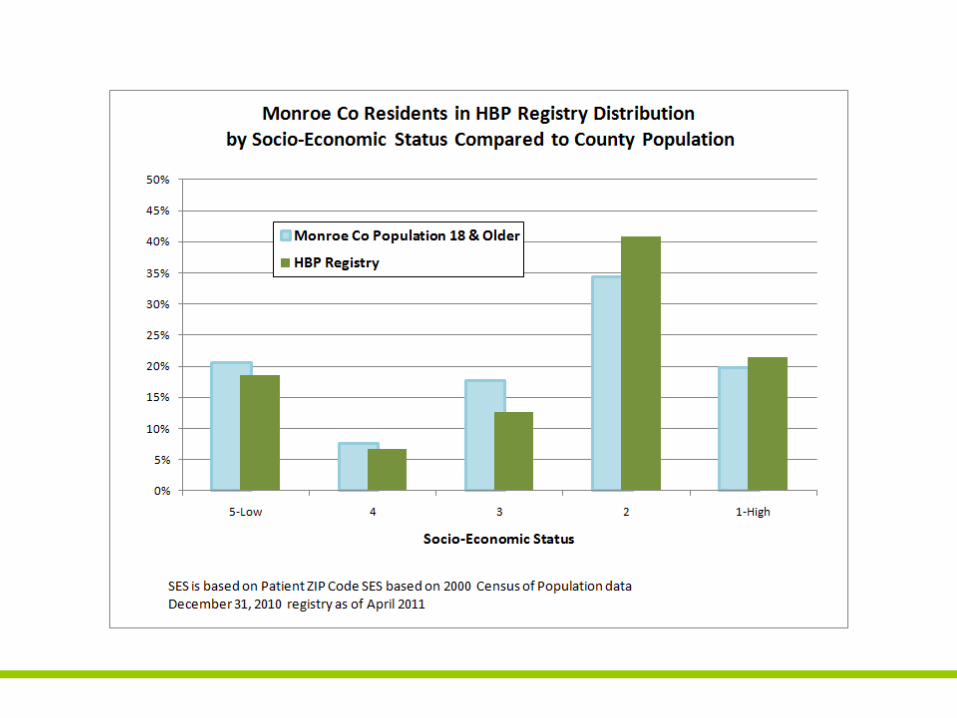
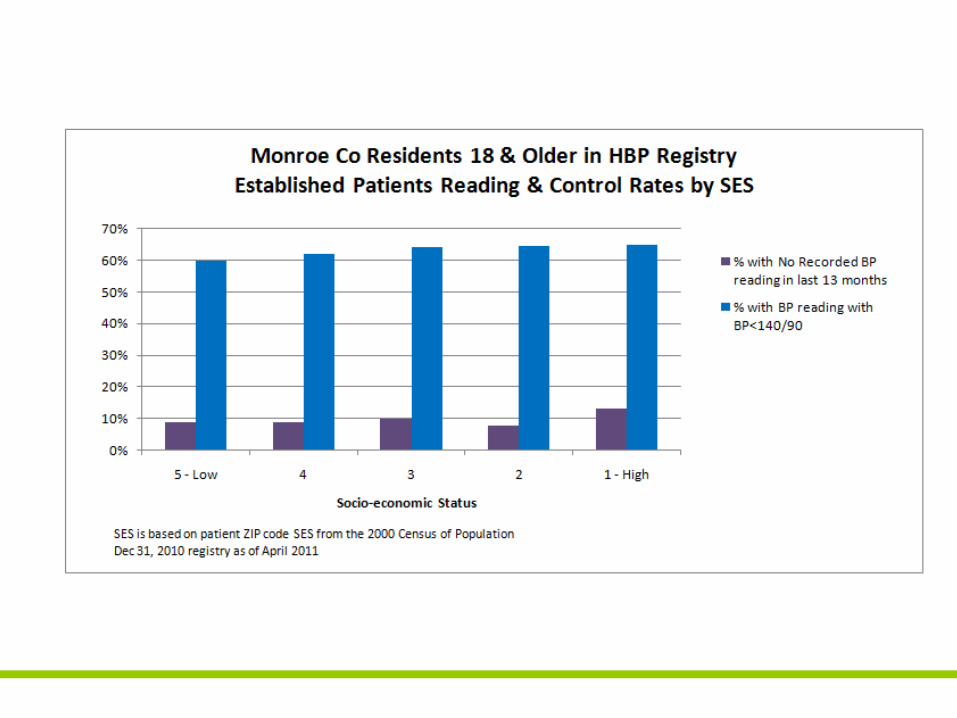
Community‐wide HBP Registry Data
• Monroe County patients for whom BP dataavailable – 56,864
• Participating Systems:- Jordan Health System- RGH- Unity- URMC- Westside
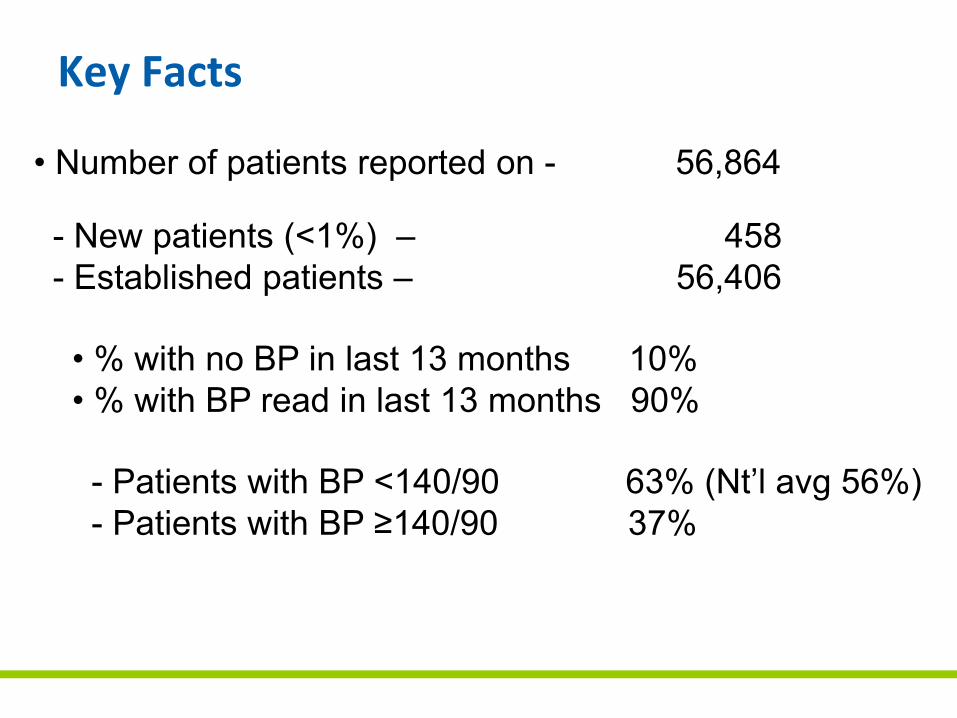
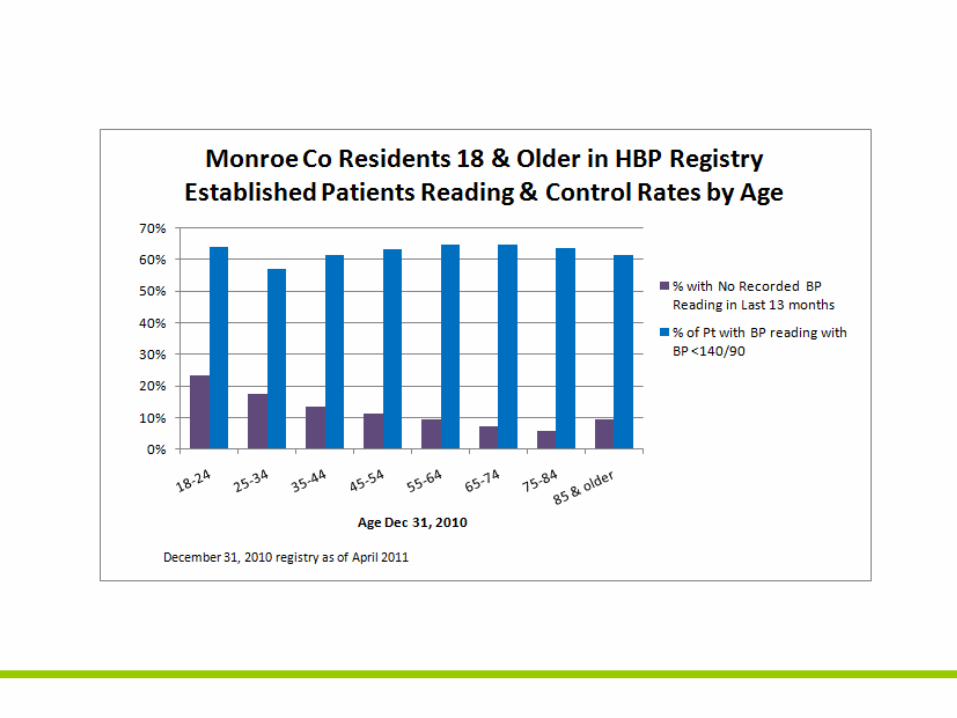
Key Facts
• Number of patients reported on - 56,864
- New patients (<1%) – 458 - Established patients – 56,406
• % with no BP in last 13 months 10%• % with BP read in last 13 months 90%
- Patients with BP <140/90 63% (Nt’l avg 56%)- Patients with BP ≥140/90 37%
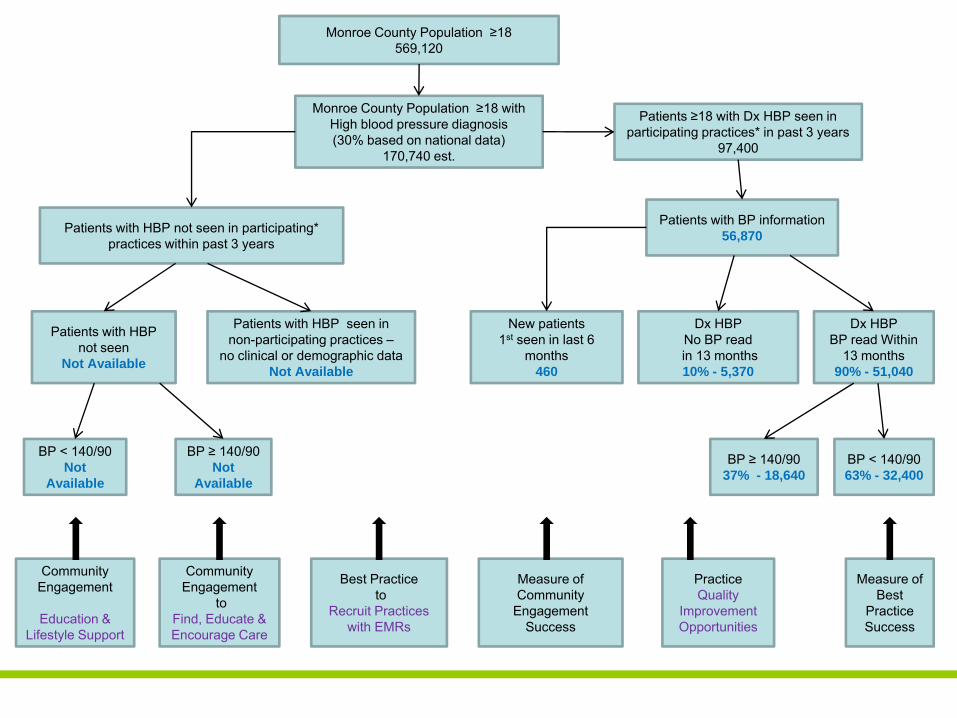
Patients with BP information56,870
Monroe County Population ≥18569,120
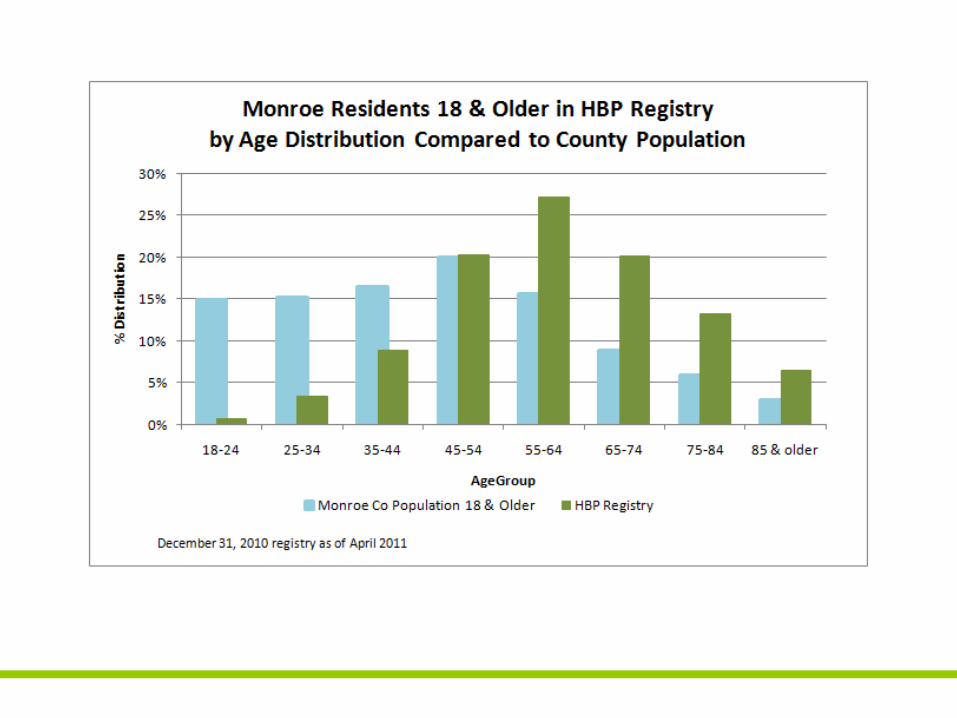
Patients ≥18 with Dx HBP seen in participating practices* in past 3 years
97,400
Monroe County Population ≥18 withHigh blood pressure diagnosis(30% based on national data)
170,740 est.
New patients1st seen in last 6
months460
Dx HBPNo BP read in 13 months10% - 5,370
Dx HBPBP read Within
13 months90% - 51,040
BP ≥ 140/9037% - 18,640
BP < 140/9063% - 32,400
Patients with HBP not seen in participating* practices within past 3 years
Patients with HBP not seen
Not Available
Patients with HBP seen in non-participating practices –
no clinical or demographic dataNot Available
BP < 140/90Not
Available
BP ≥ 140/90Not
Available
Community Engagement
Education &Lifestyle Support
Community Engagement
toFind, Educate & Encourage Care
Best Practice to
Recruit Practices with EMRs
Measure ofCommunity
Engagement Success
Practice Quality
ImprovementOpportunities
Measure of Best
Practice Success
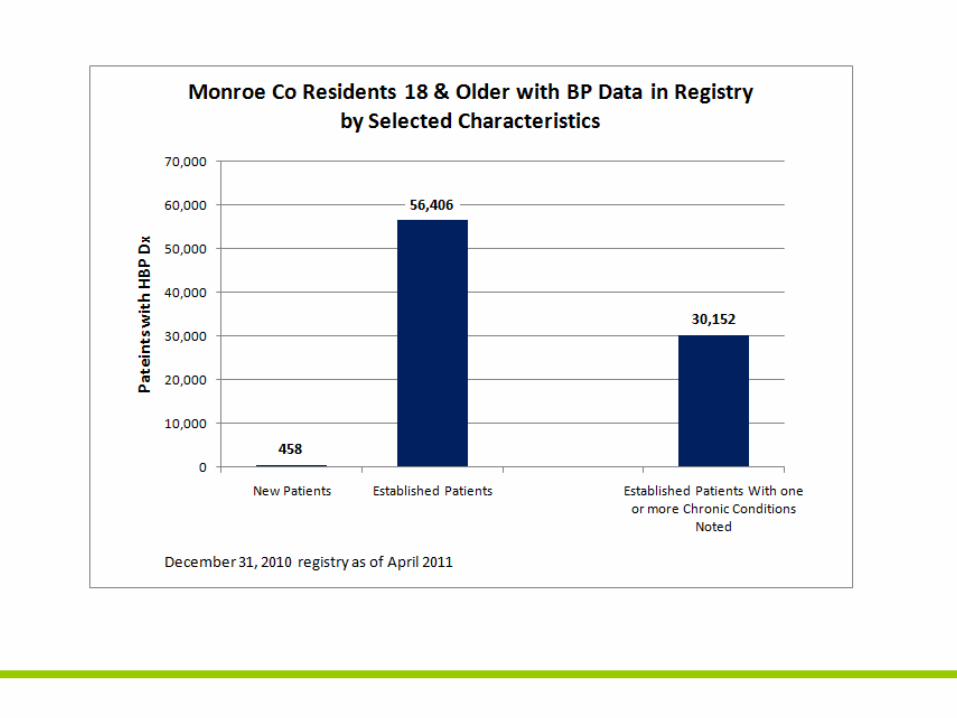
Conclusions: • Aggregated community wide practice reporting
represents > 30% of patients with HBP
• New patient measure can serve as an evaluationof community engagement
• Most patients are being seen – those that arenot can be viewed as QI Opportunity
• 36% of patients have not reached goal BP andcan be viewed as QI opportunity
• Additional practices with EMR should berecruited
Progress to Date
• Practices engaged to provide data and participate with changes in office management of Hypertension
• Community awareness with targeting of minority neighborhoods– Church outreach
– Barbershop screenings
• Communication plan for broad public campaign
• Measures agreed upon with sources identified
• Educational institutions engaged for participation in screenings
• Center for Community Health involved to direct behavior change efforts
Finger Lakes Health Systems Agency
The triangle represents our agency’s role as a fulcrum—the point on which a lever pivots—boosting the community’s health by leveraging the strengths of all stakeholders. The fulcrum is also a point of equilibrium, reflecting our ability to balance the needs of consumers, providers and payers on complex health matters. The inner triangle also evokes the Greek letter delta—used in medical and mathematical contexts to represent change—with a forward lean as we work with our community to achieve positive changes in health care.
Give me a lever long enough and a fulcrum on which to place it, and I shall move the world. —Archimedes
1150 University Avenue • Rochester, New York • 14607-1647585.461.3520 • www.FLHSA.org
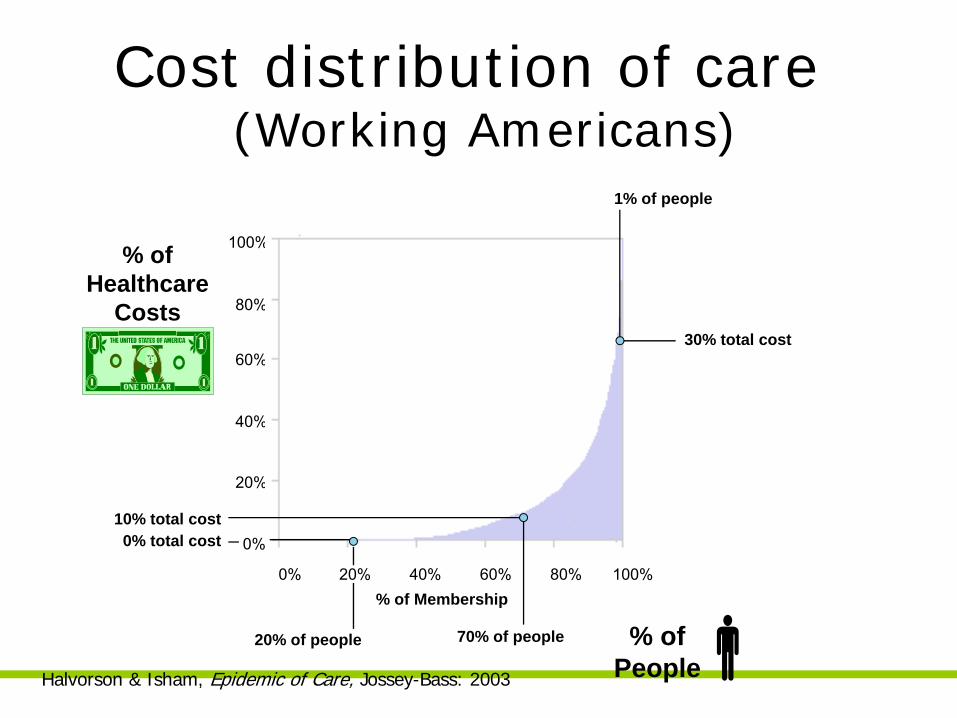
Cost distribution of care(Working Americans)
0%
20%
40%
60%
80%
100%
0% 20% 40% 60% 80% 100%% of Membership
0% total cost10% total cost
30% total cost
% of People
% of Healthcare
Costs
1% of people
70% of people20% of people
Halvorson & Isham, Epidemic of Care, Jossey-Bass: 2003
Population Segmentation into Stages of Disease**arrows indicate desired direction of population shift
WellAt Risk
Early Disease
Advanced Disease
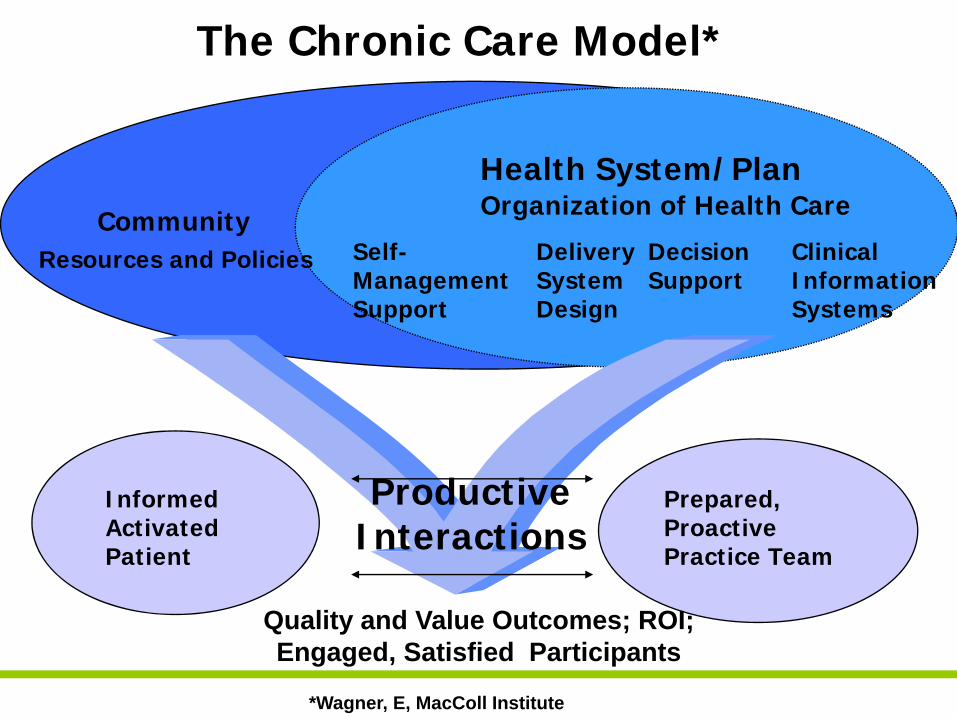
Community Resources and Policies
Health System/PlanOrganization of Health Care
Self-Management Support
Delivery System Design
Decision Support
Clinical Information Systems
Informed Activated Patient
Prepared, Proactive Practice Team
ProductiveInteractions
The Chronic Care Model*
Quality and Value Outcomes; ROI; Engaged, Satisfied Participants
*Wagner, E, MacColl Institute
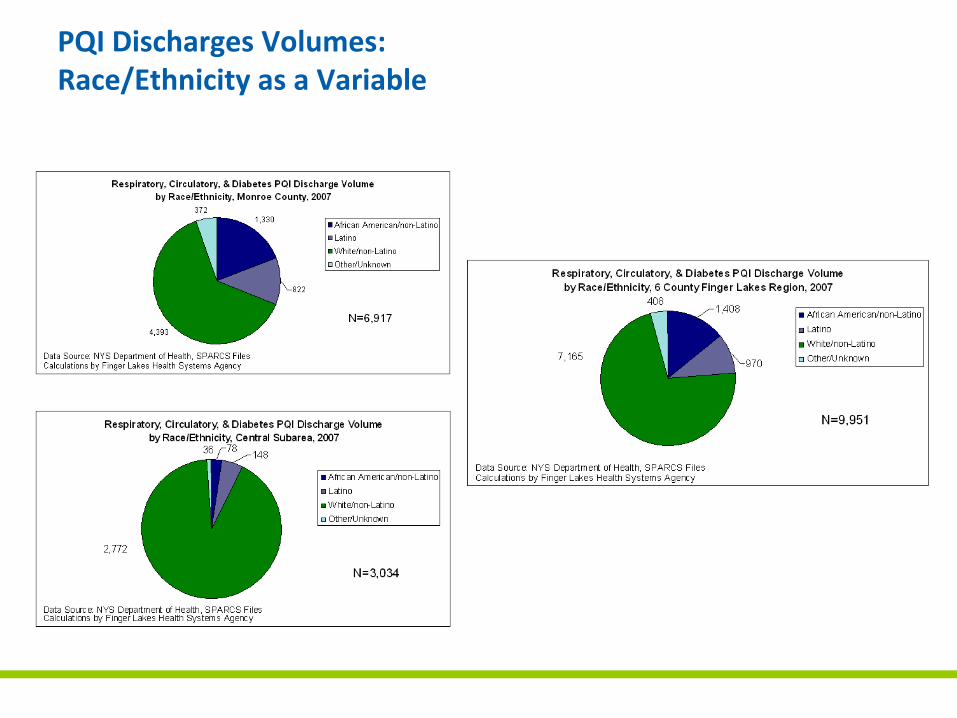
PQI Discharges Volumes: Race/Ethnicity as a Variable
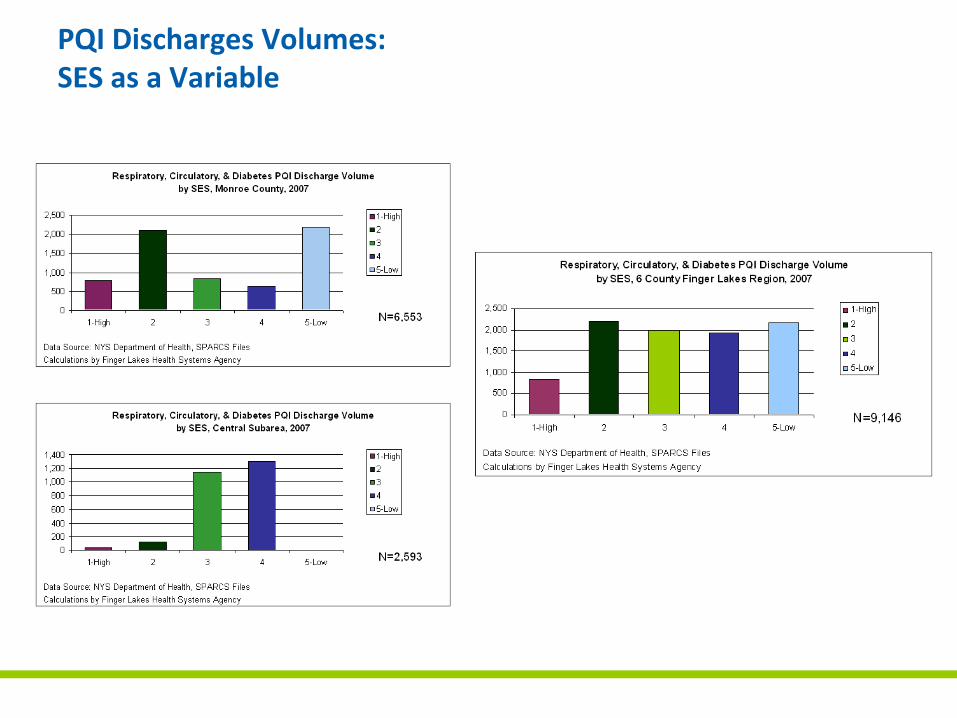
PQI Discharges Volumes:SES as a Variable
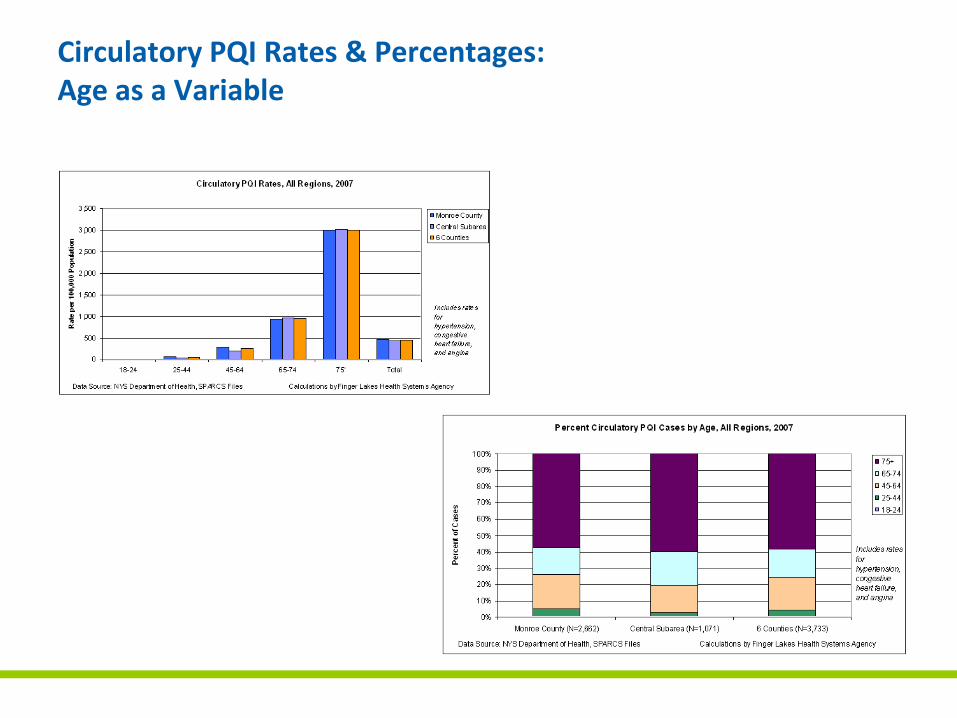
Circulatory PQI Rates & Percentages:Age as a Variable
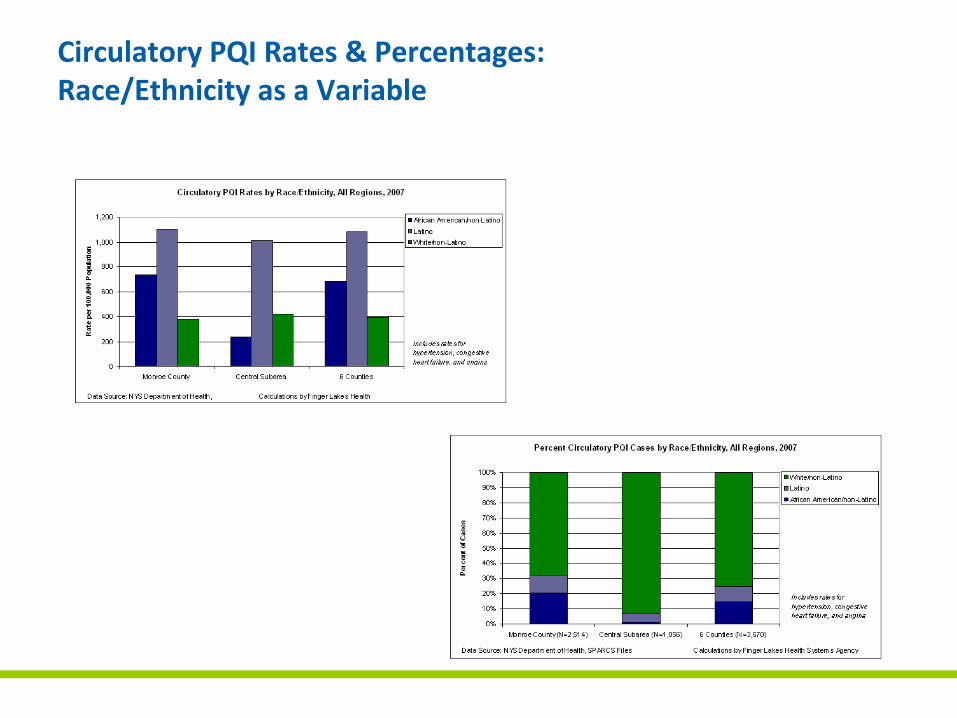
Circulatory PQI Rates & Percentages:Race/Ethnicity as a Variable
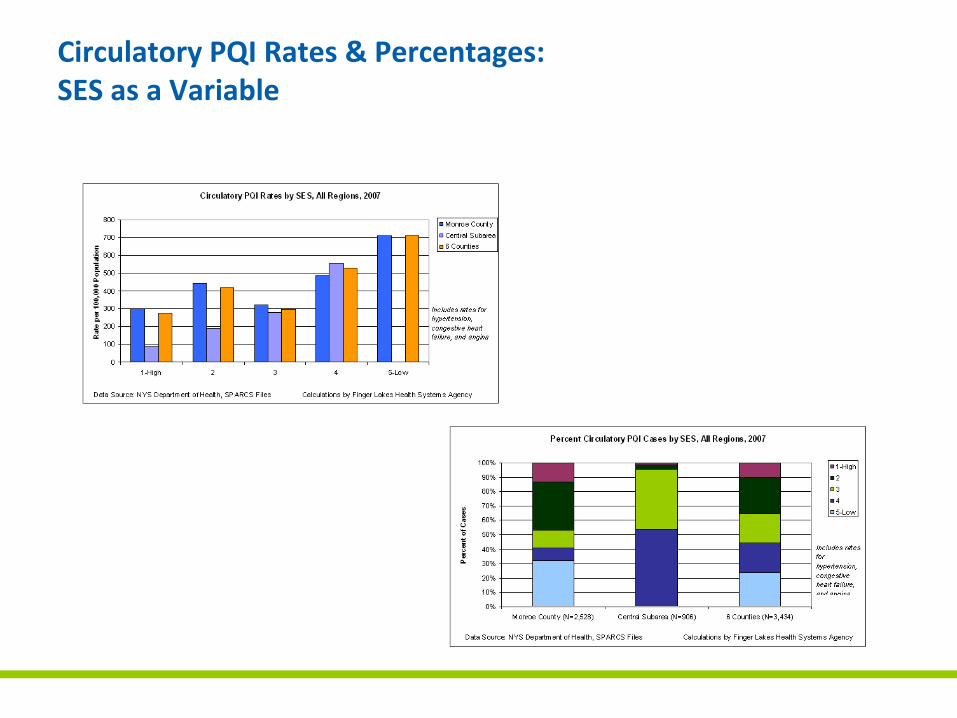
Circulatory PQI Rates & Percentages:SES as a Variable
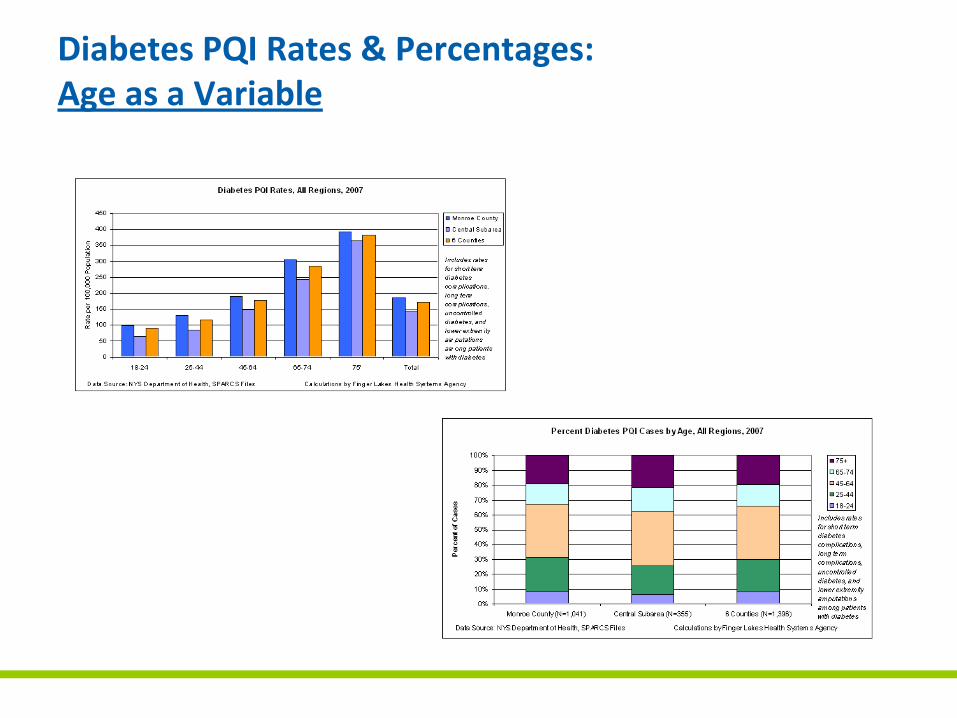
Diabetes PQI Rates & Percentages: Age as a Variable
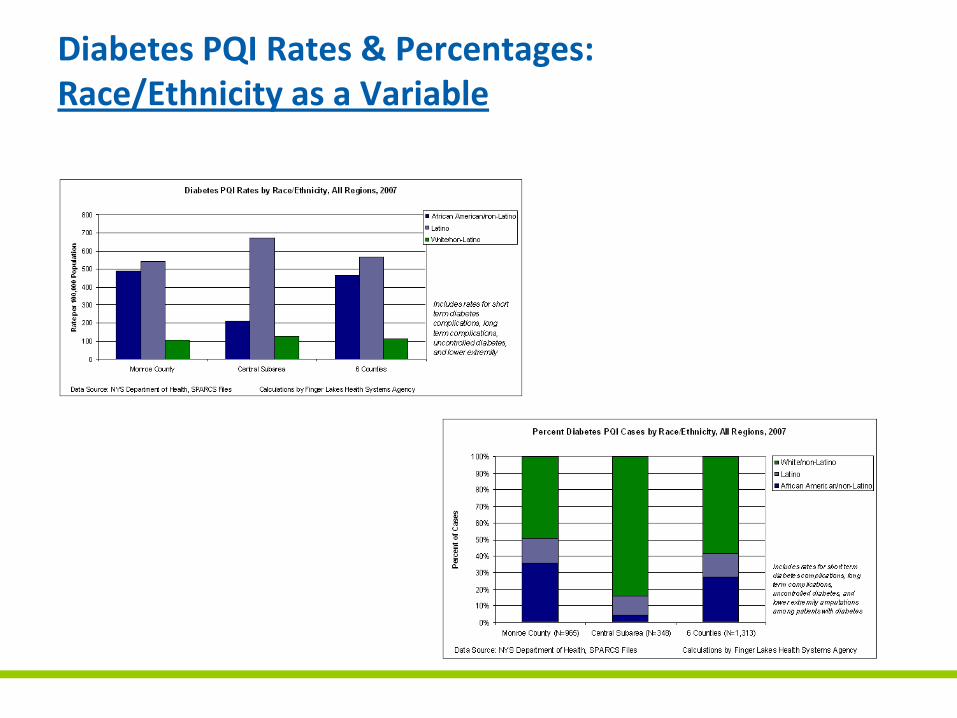
Diabetes PQI Rates & Percentages: Race/Ethnicity as a Variable
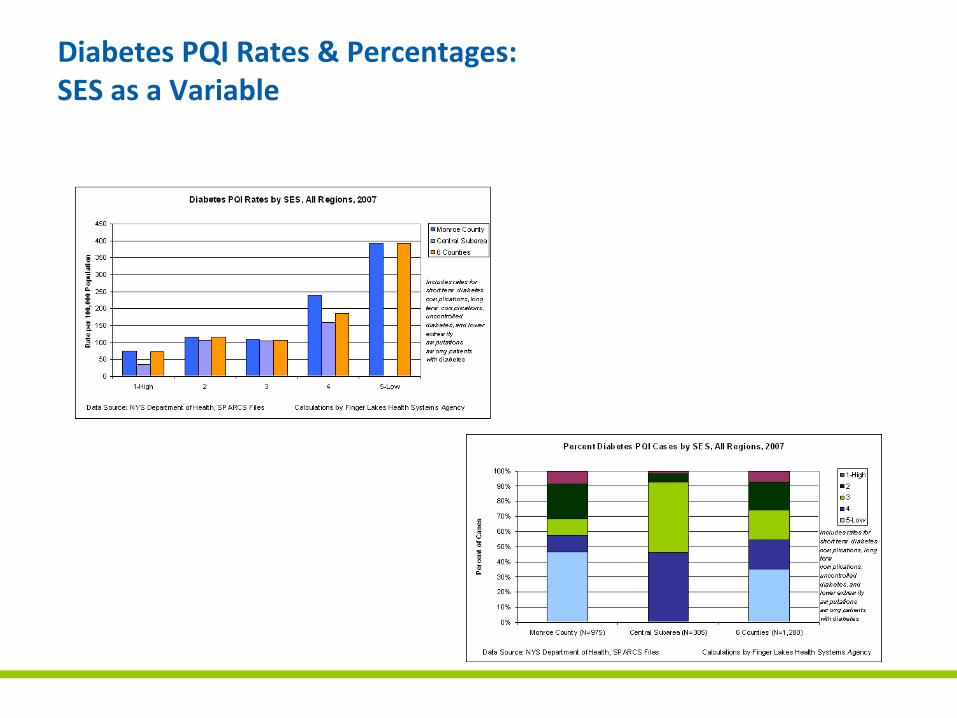
Diabetes PQI Rates & Percentages: SES as a Variable
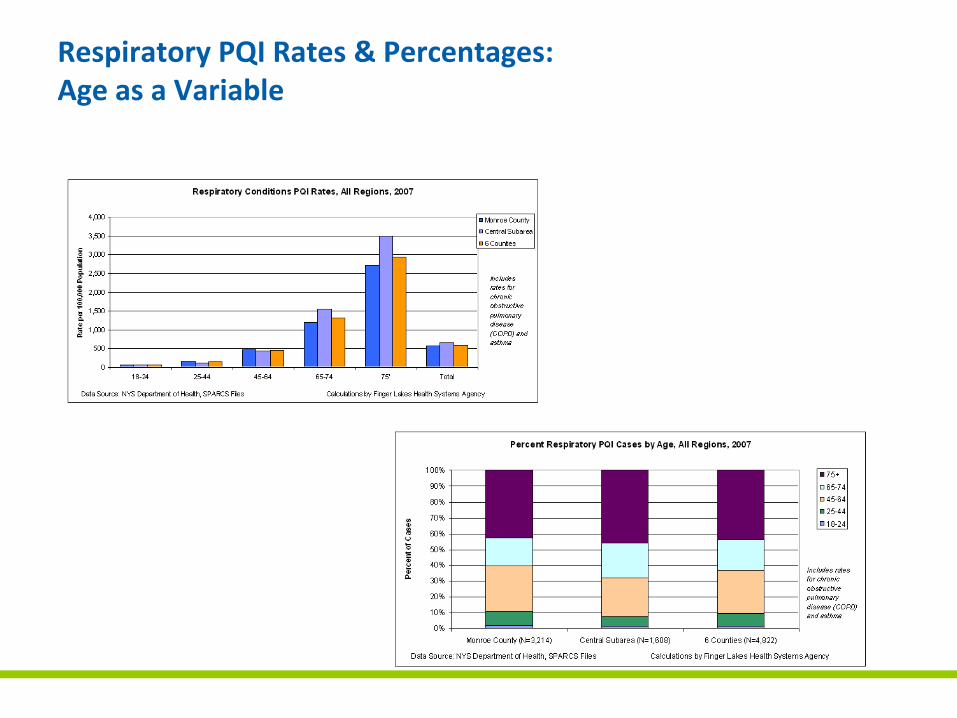
Respiratory PQI Rates & Percentages:Age as a Variable
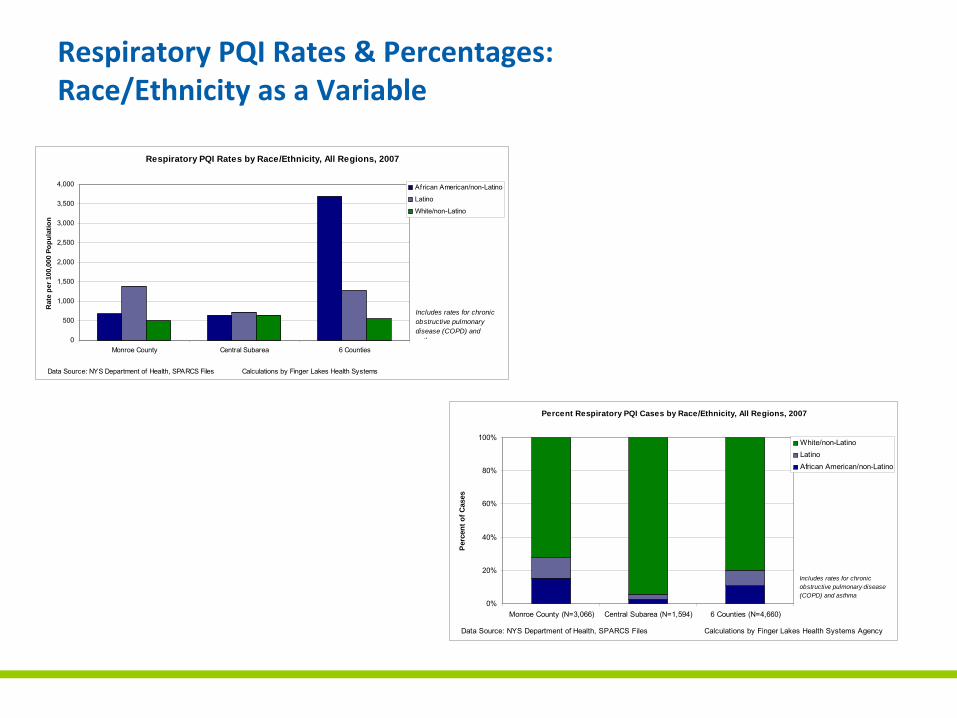
Respiratory PQI Rates & Percentages:Race/Ethnicity as a Variable
Respiratory PQI Rates by Race/Ethnicity, All Regions, 2007
0
500
1,000
1,500
2,000
2,500
3,000
3,500
4,000
Monroe County Central Subarea 6 Counties
Rat
e pe
r 100
,000
Pop
ulat
ion
African American/non-Latino
Latino
White/non-Latino
Data Source: NYS Department of Health, SPARCS Files Calculations by Finger Lakes Health Systems
Includes rates for chronic obstructive pulmonary disease (COPD) and asthma
Percent Respiratory PQI Cases by Race/Ethnicity, All Regions, 2007
0%
20%
40%
60%
80%
100%
Monroe County (N=3,066) Central Subarea (N=1,594) 6 Counties (N=4,660)
Per
cent
of C
ases
White/non-LatinoLatinoAfrican American/non-Latino
Data Source: NYS Department of Health, SPARCS Files Calculations by Finger Lakes Health Systems Agency
Includes rates for chronic obstructive pulmonary disease (COPD) and asthma
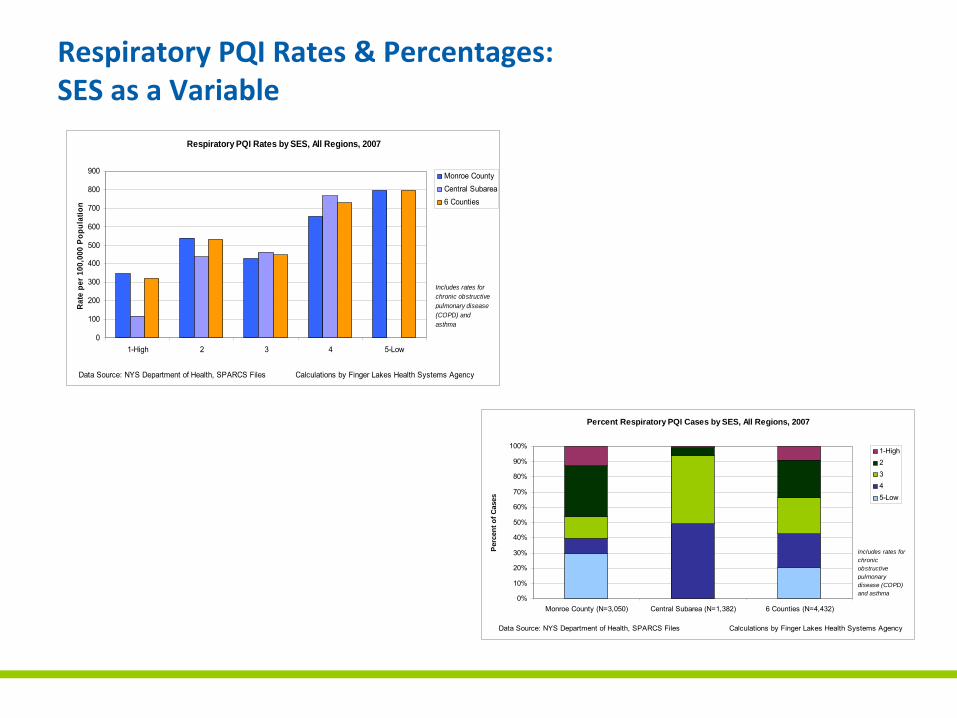
Respiratory PQI Rates & Percentages:SES as a Variable
Respiratory PQI Rates by SES, All Regions, 2007
0
100
200
300
400
500
600
700
800
900
1-High 2 3 4 5-Low
Rate
per
100
,000
Pop
ulat
ion
Monroe CountyCentral Subarea6 Counties
Data Source: NYS Department of Health, SPARCS Files Calculations by Finger Lakes Health Systems Agency
Includes rates for chronic obstructive pulmonary disease (COPD) and asthma
Percent Respiratory PQI Cases by SES, All Regions, 2007
0%
10%
20%
30%
40%
50%
60%
70%
80%
90%
100%
Monroe County (N=3,050) Central Subarea (N=1,382) 6 Counties (N=4,432)
Per
cent
of C
ases
1-High2345-Low
Data Source: NYS Department of Health, SPARCS Files Calculations by Finger Lakes Health Systems Agency
Includes rates for chronic obstructive pulmonary disease (COPD) and asthma

Reducing PQI Admissions - Intervention
• It’s all about improving chronic disease management and care transitions.
• The low-hanging fruit is reducing readmission by improving care transitions for Medicare patients with heart disease, respiratory disease and diabetes.
• Three types of interventions have come to the fore.
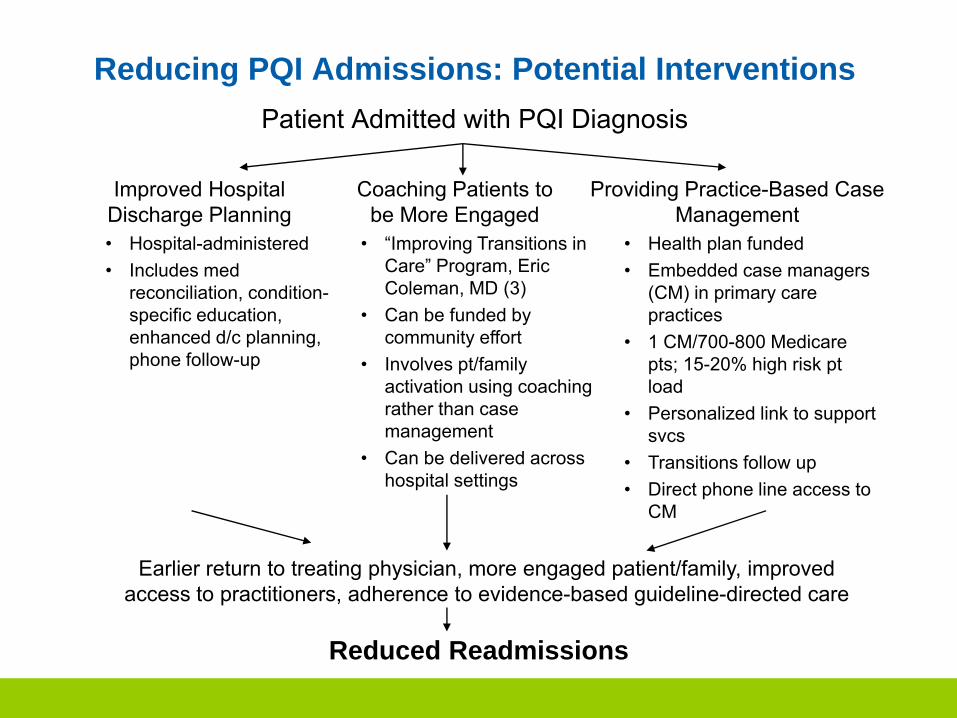
Earlier return to treating physician, more engaged patient/family, improved access to practitioners, adherence to evidence-based guideline-directed care
Reducing PQI Admissions: Potential InterventionsPatient Admitted with PQI Diagnosis
Improved Hospital Discharge Planning
Coaching Patients to be More Engaged
Providing Practice-Based Case Management
Reduced Readmissions
• Hospital-administered• Includes med
reconciliation, condition-specific education, enhanced d/c planning, phone follow-up
• “Improving Transitions in Care” Program, Eric Coleman, MD (3)
• Can be funded by community effort
• Involves pt/family activation using coaching rather than case management
• Can be delivered across hospital settings
• Health plan funded• Embedded case managers
(CM) in primary care practices
• 1 CM/700-800 Medicare pts; 15-20% high risk pt load
• Personalized link to support svcs
• Transitions follow up• Direct phone line access to
CM
Reduce Potentially Preventable Hospitalizations
135
Three Initiatives
Discharge Planning
Embedded Care
Managers
Transitions Coaching
Reduce readmissions and
avoidable ED visits
Reduce preventable hospitalizations by 25% by 2014
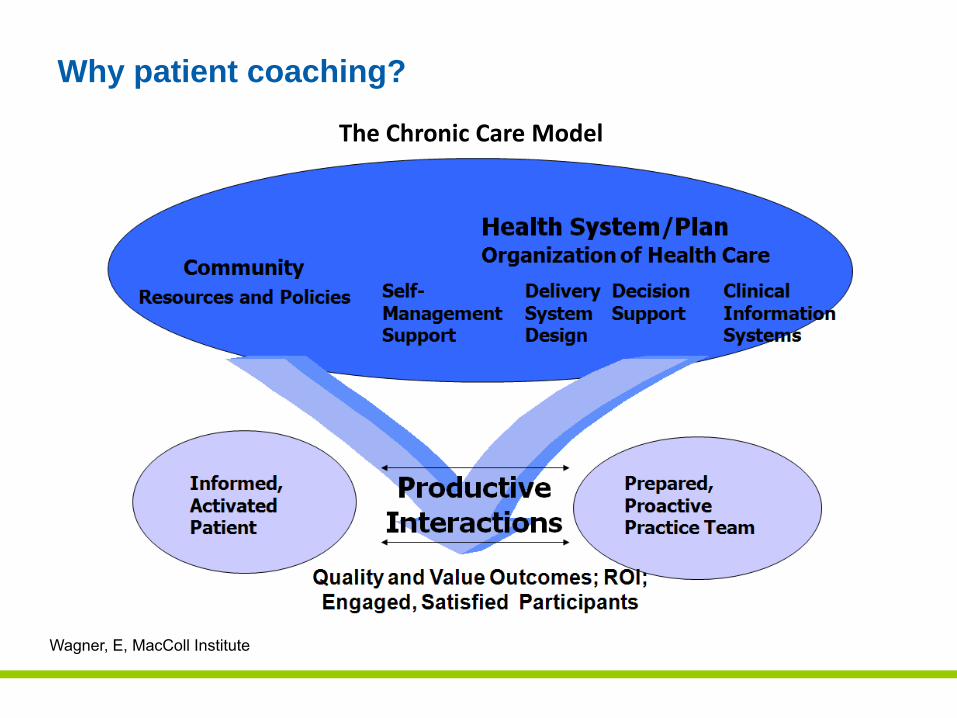
Why patient coaching?
Wagner, E, MacColl Institute
The Chronic Care Model
Care Transitions ProgramSM Description
• A four week program in which patients with complex care needs and family caregivers receive specific tools and work with a “Transitions Coach™” to learn self-management skills.
• This program has four conceptual domains, or “Pillars.”• Contact between the coach and the patient occurs in
three ways:1. The first patient visit in the hospital before discharge2. One follow-up home (or SNF) visits (ideally 24-48 hours post-
discharge)3. Three follow-up phone calls (ideally at 2, 7, and 14 days post-
discharge)– Each visit and phone call has a specific goal that includes
addressing the unique needs / goals of the patient
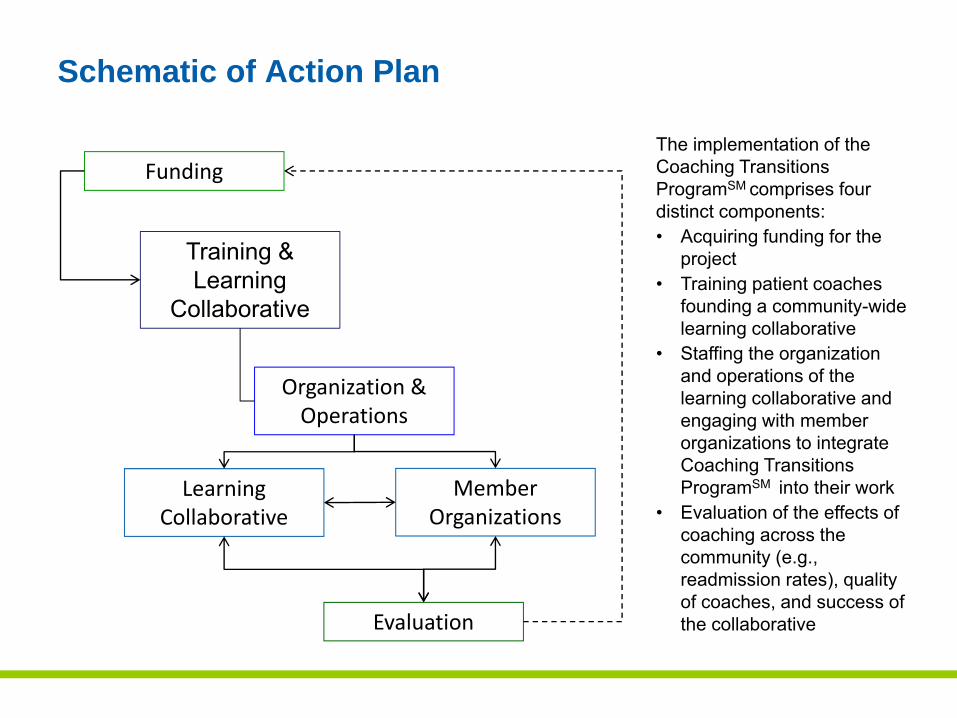
Schematic of Action Plan
Funding
Training & Learning
Collaborative
Organization & Operations
Member Organizations
Learning Collaborative
Evaluation
The implementation of the Coaching Transitions ProgramSM comprises four distinct components:• Acquiring funding for the
project• Training patient coaches
founding a community-wide learning collaborative
• Staffing the organization and operations of the learning collaborative and engaging with member organizations to integrate Coaching Transitions ProgramSM into their work
• Evaluation of the effects of coaching across the community (e.g., readmission rates), quality of coaches, and success of the collaborative
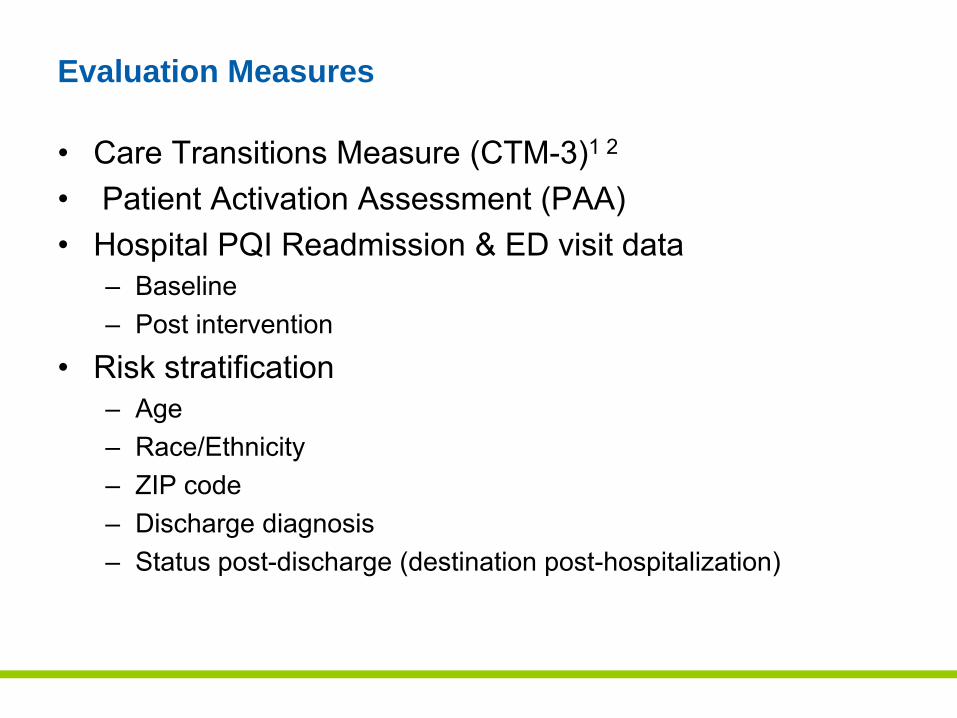
Evaluation Measures
• Care Transitions Measure (CTM-3)1 2
• Patient Activation Assessment (PAA)• Hospital PQI Readmission & ED visit data
– Baseline– Post intervention
• Risk stratification– Age– Race/Ethnicity– ZIP code– Discharge diagnosis– Status post-discharge (destination post-hospitalization)
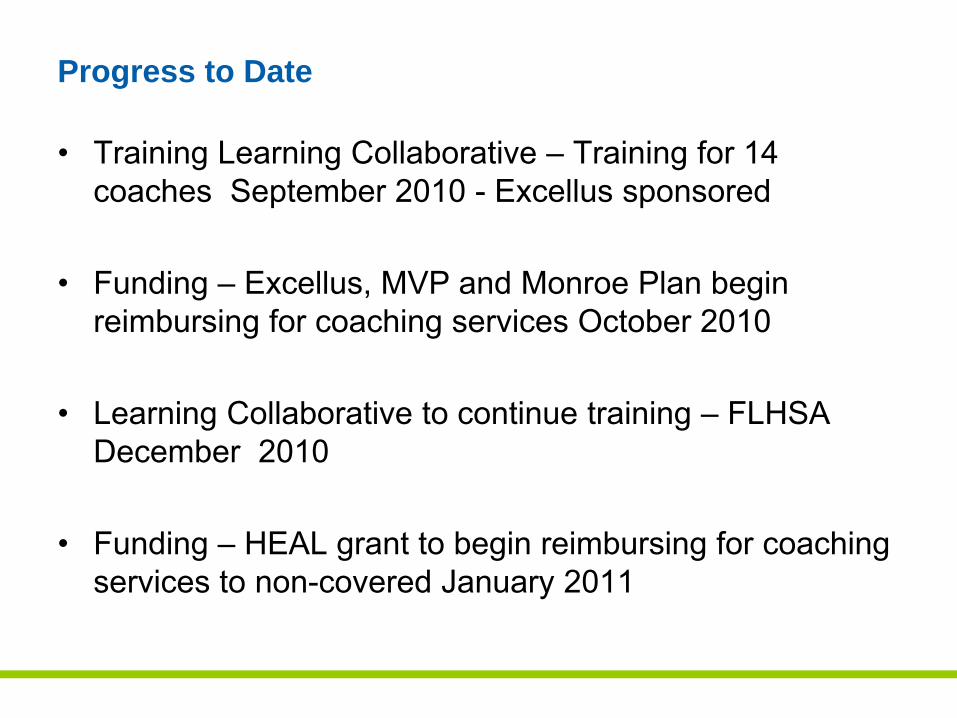
Progress to Date
• Training Learning Collaborative – Training for 14 coaches September 2010 - Excellus sponsored
• Funding – Excellus, MVP and Monroe Plan begin reimbursing for coaching services October 2010
• Learning Collaborative to continue training – FLHSA December 2010
• Funding – HEAL grant to begin reimbursing for coaching services to non-covered January 2011
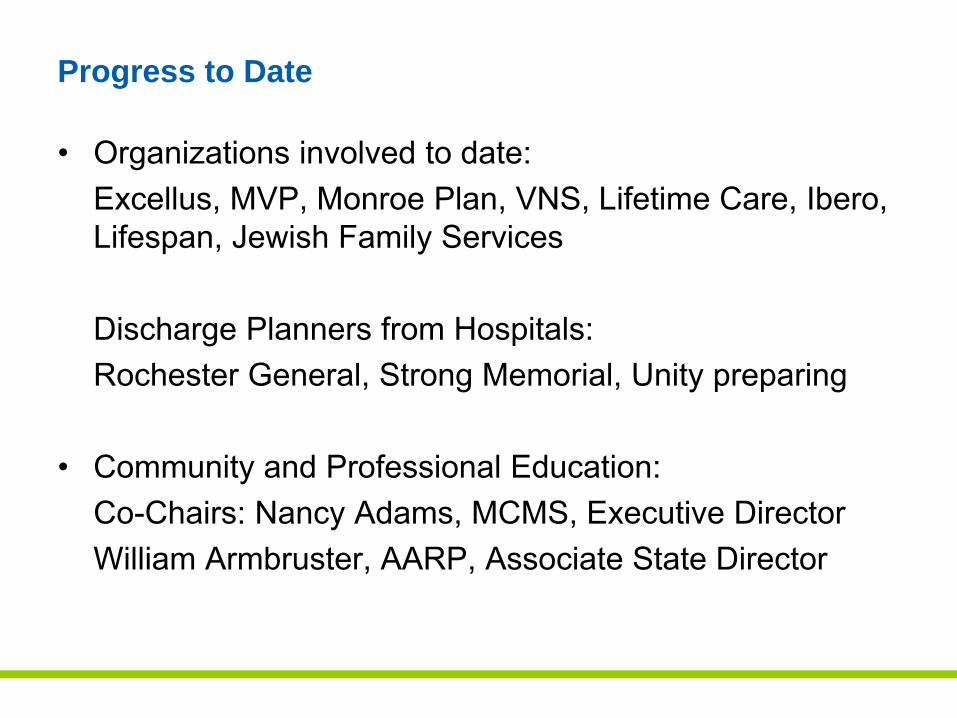
Progress to Date
• Organizations involved to date:Excellus, MVP, Monroe Plan, VNS, Lifetime Care, Ibero, Lifespan, Jewish Family Services
Discharge Planners from Hospitals:Rochester General, Strong Memorial, Unity preparing
• Community and Professional Education:Co-Chairs: Nancy Adams, MCMS, Executive DirectorWilliam Armbruster, AARP, Associate State Director
Progress to Date
• Evaluation and SpecificationsChair: Patricia Campbell, RN, MPH, Program Officer Rochester Community Area Foundation
Members from all community organizations involved
Deliverables
• 14 Active coaches by end of 2011• 12% reduction in 30 day readmissions • Implementation of a community wide Coaching Learning
Collaborative
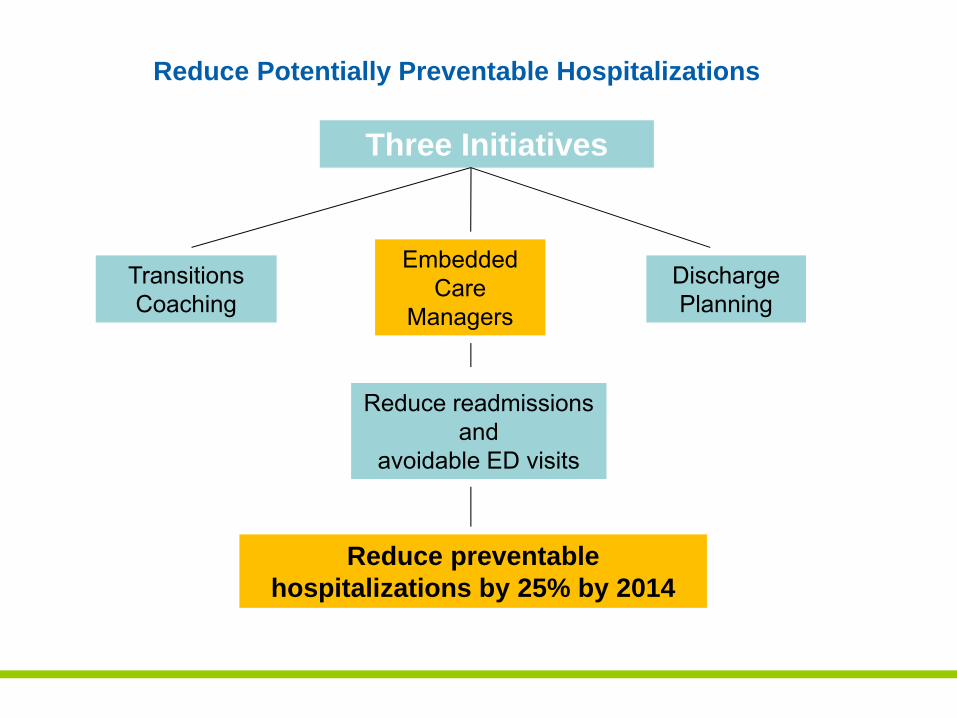
Reduce Potentially Preventable Hospitalizations
Three Initiatives
Discharge Planning
Embedded Care
Managers
Transitions Coaching
Reduce readmissions and
avoidable ED visits
Reduce preventable hospitalizations by 25% by 2014
Charge and Scope of the Embedded Care Management Workgroup
1. Identify ideal characteristics of a practice based case manager
2. Identify appropriate outcome metrics3. Identify community practices
- Cultural readiness for embedded CM- Technical capabilities- Sufficient practice volume
Work Group Structure
1. Local facilities2. Private Practice3. Home care4. Local FQHC input5. Major local payers6. Identify community practices
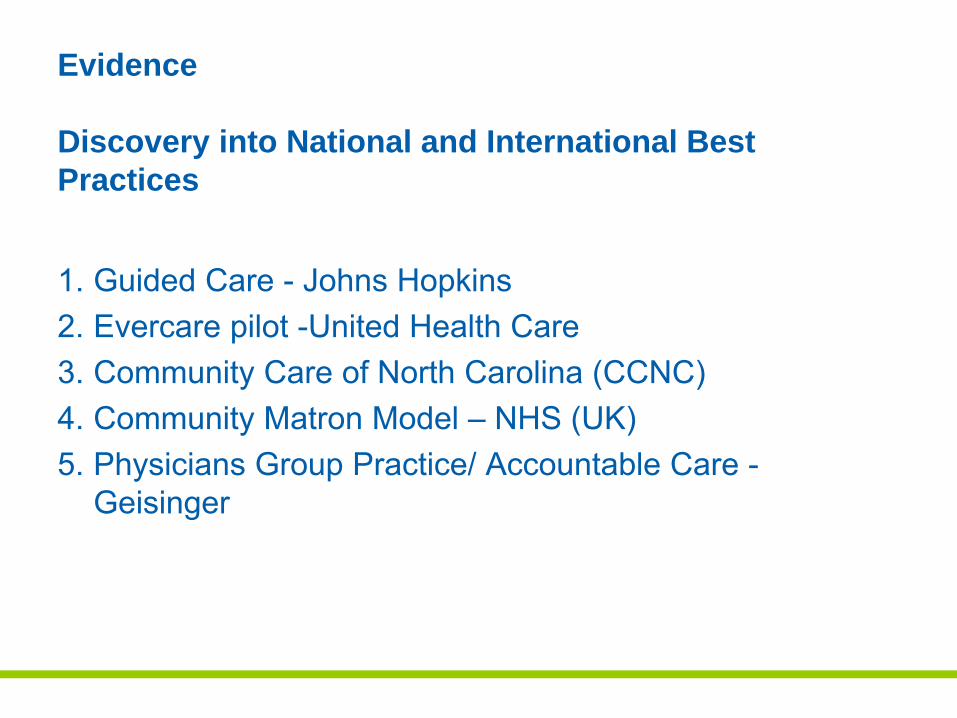
Evidence
Discovery into National and International Best Practices
1. Guided Care - Johns Hopkins 2. Evercare pilot -United Health Care3. Community Care of North Carolina (CCNC)4. Community Matron Model – NHS (UK)5. Physicians Group Practice/ Accountable Care -
Geisinger
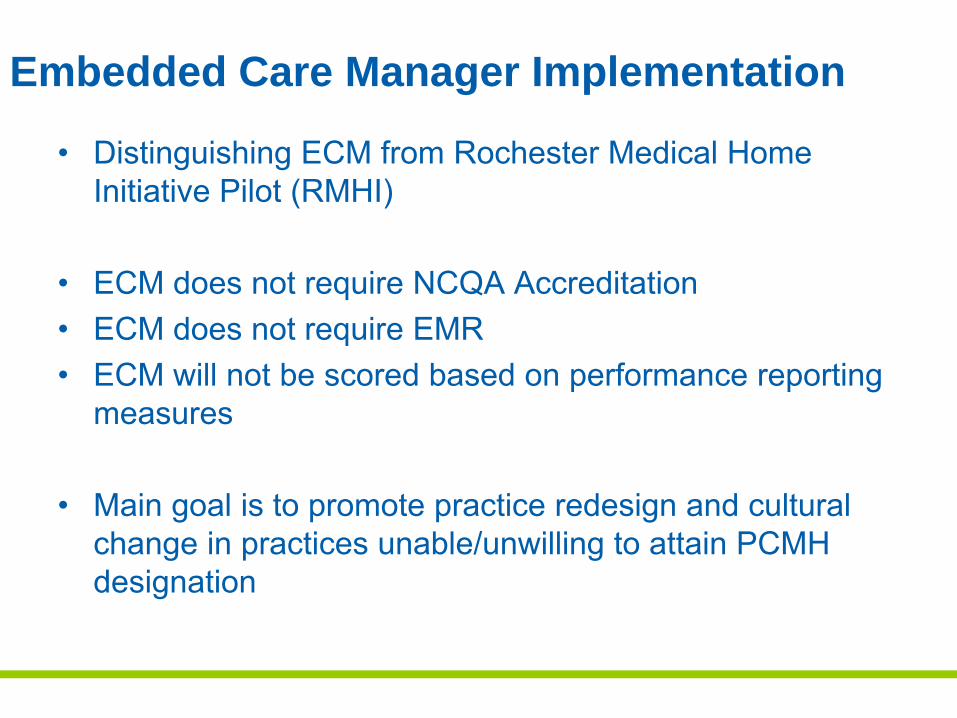
Embedded Care Manager Implementation
• Distinguishing ECM from Rochester Medical Home Initiative Pilot (RMHI)
• ECM does not require NCQA Accreditation • ECM does not require EMR• ECM will not be scored based on performance reporting
measures
• Main goal is to promote practice redesign and cultural change in practices unable/unwilling to attain PCMH designation
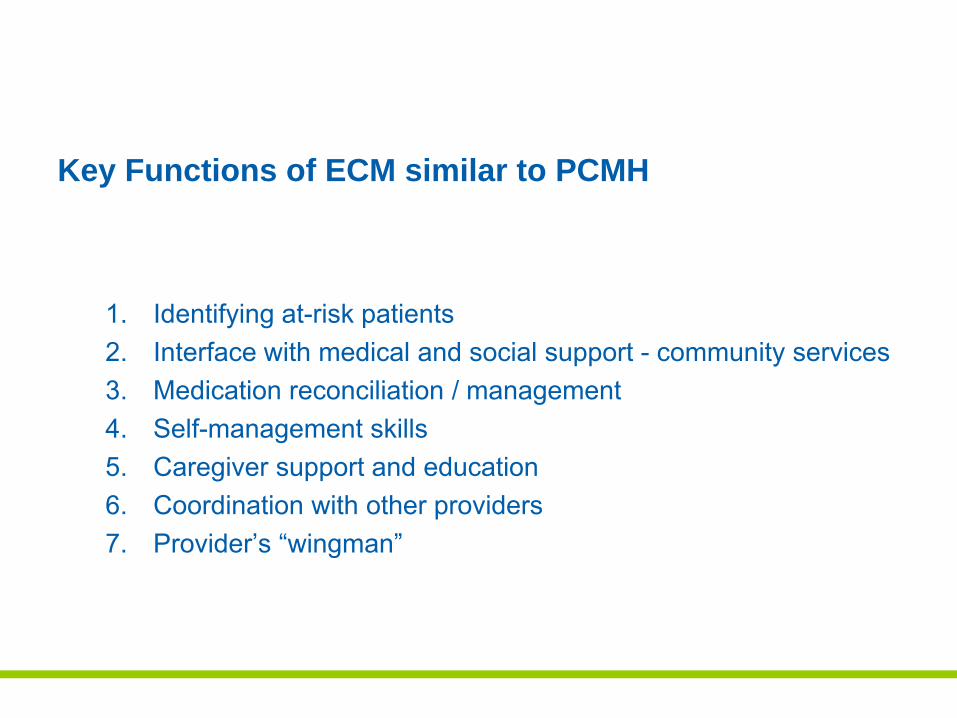
Key Functions of ECM similar to PCMH
1. Identifying at-risk patients2. Interface with medical and social support - community services3. Medication reconciliation / management4. Self-management skills5. Caregiver support and education6. Coordination with other providers7. Provider’s “wingman”
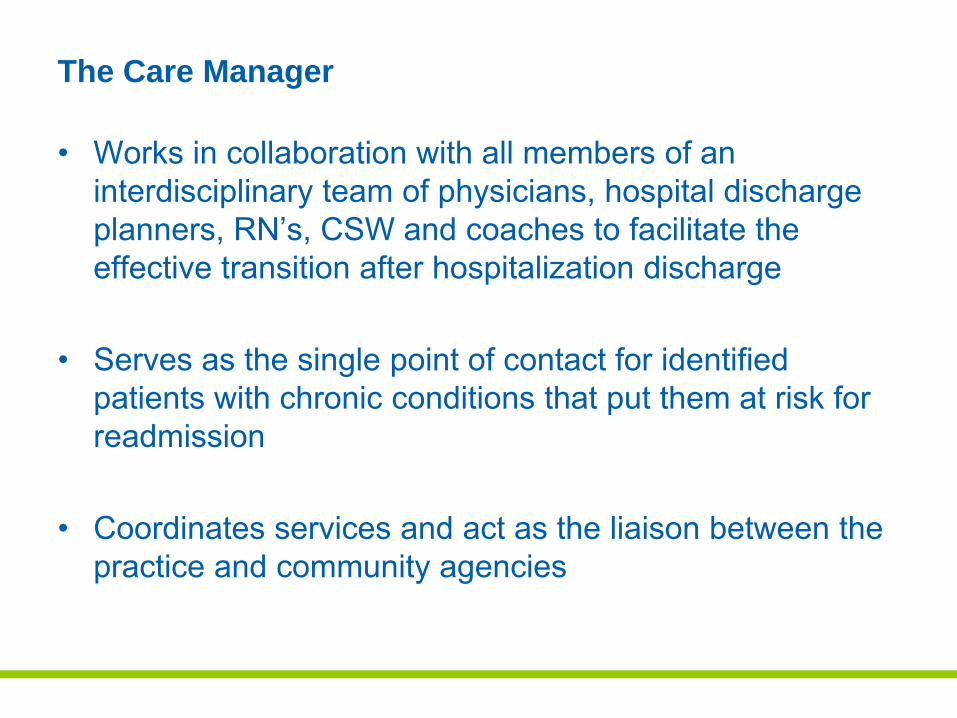
The Care Manager
• Works in collaboration with all members of an interdisciplinary team of physicians, hospital discharge planners, RN’s, CSW and coaches to facilitate the effective transition after hospitalization discharge
• Serves as the single point of contact for identified patients with chronic conditions that put them at risk for readmission
• Coordinates services and act as the liaison between the practice and community agencies
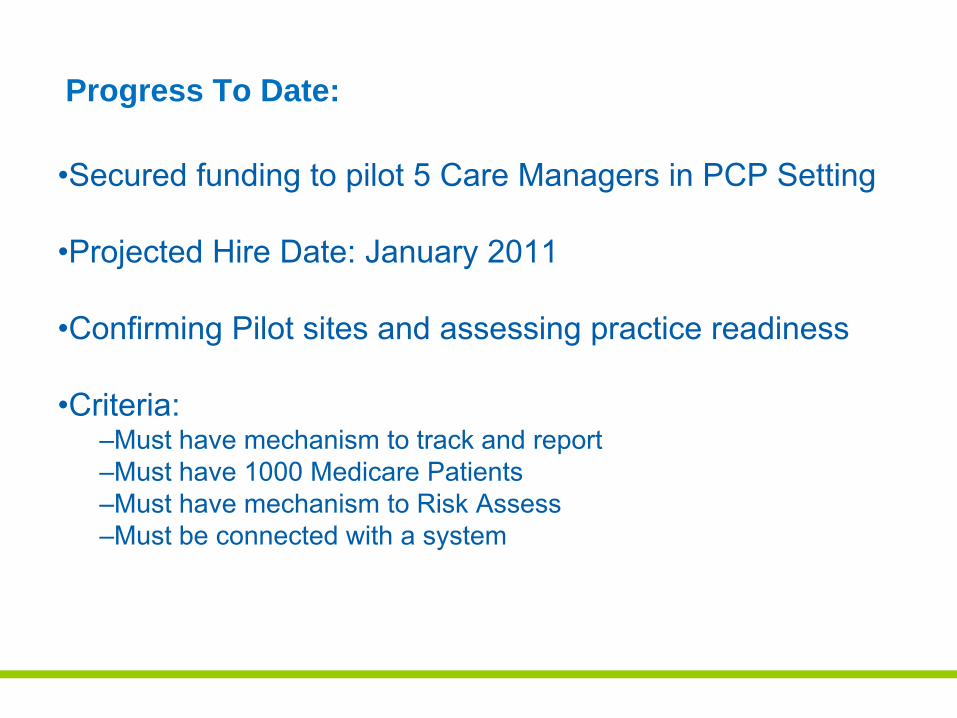
Progress To Date:
•Secured funding to pilot 5 Care Managers in PCP Setting
•Projected Hire Date: January 2011
•Confirming Pilot sites and assessing practice readiness
•Criteria:–Must have mechanism to track and report–Must have 1000 Medicare Patients–Must have mechanism to Risk Assess–Must be connected with a system
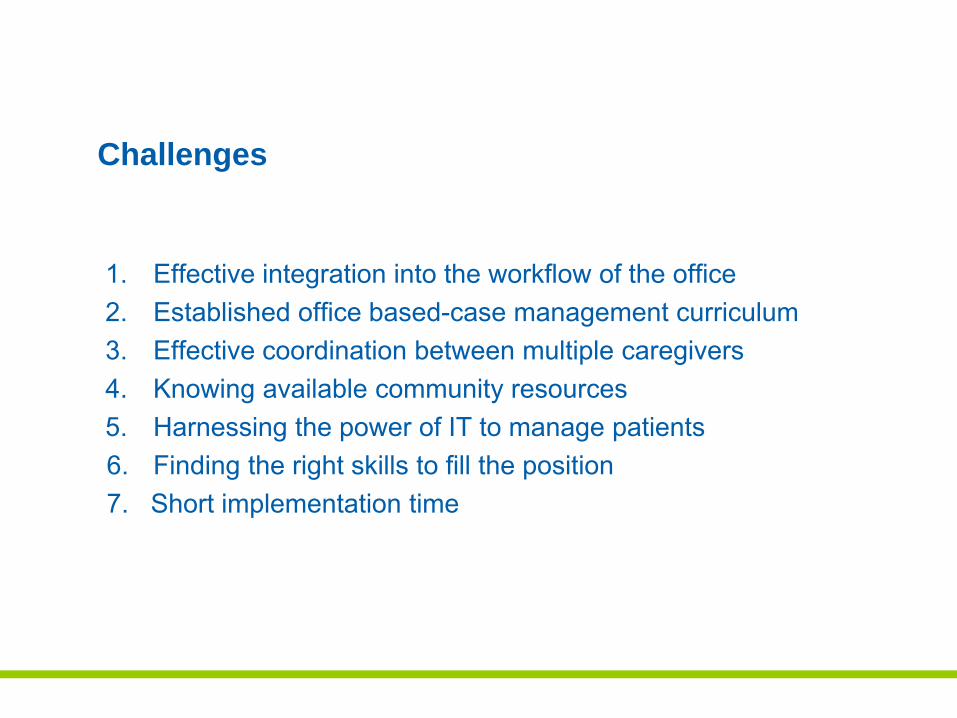
Challenges
1. Effective integration into the workflow of the office2. Established office based-case management curriculum3. Effective coordination between multiple caregivers4. Knowing available community resources5. Harnessing the power of IT to manage patients6. Finding the right skills to fill the position7. Short implementation time
Deliverables
• 5 Care Managers in PCP Practices-training and maintenance
• 12% Reduction in Readmissions
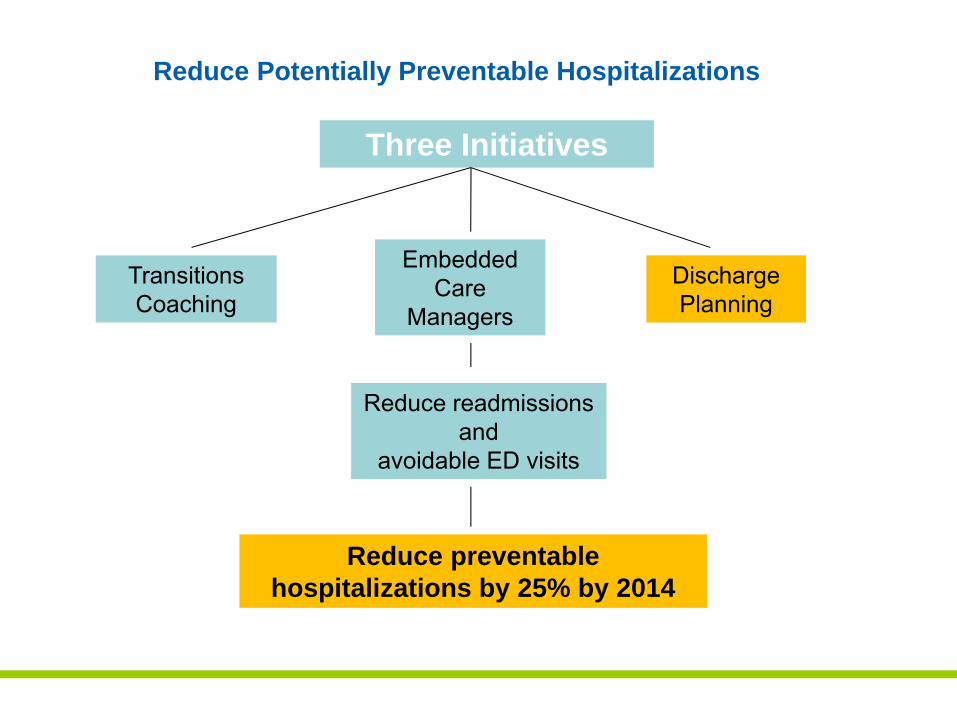
Reduce Potentially Preventable Hospitalizations
Three Initiatives
Discharge Planning
Embedded Care
Managers
Transitions Coaching
Reduce readmissions and
avoidable ED visits
Reduce preventable hospitalizations by 25% by 2014
Four Community Standards for Discharge Planning
Creation of a region-wide set of discharge/transition standards that, when fully implemented, will enhance patient safety and safe transition from hospital to community-based setting and lead to a reduction in the number of avoidable hospital readmissions.
Four Community Standards for Discharge Planning
1. Patient/Family centrality to the discharge planning process
2. Medication reconciliation
3. Information transfer
4. Post-discharge follow up
Progress To Date
• URMC pilot on complex surgical floor
• Unity piloting “teach backs”
• RGH examining readmission circumstances; social, medical, home care plan
• Risk Assessments
• Looking ahead: Transportation, Indigent Medications, Patient liason and Transition Coaches Implementation and Risk Assessment
Progress To Date
RHIO– Mapping and loading ADT messages from local hospitals– Clifton Springs Hospital is piloting ED Landing Page– Subscription Model pilot scheduled for fourth quarter 2010 to
inform PCP when a patient is admitted to ED– EMS pre-hospital care clinical document is being provided in a
standardized format and available on patient virtual health record (VHR)
– VHR will be available on Smart Phones– Senior Summary on VHR documents care provided by social
service agencies – Piloting patient portal to include Advance Directives– Pilot electronic referrals with first EHR vendor
Deliverable
Achieve a 15% reduction in 30-day PQI-related readmissions compared to 2009-2010 across thesix County Finger Lakes Region

160160160
Finger Lakes Health Systems Agency
The triangle represents our agency’s role as a fulcrum—the point on which a lever pivots—boosting the community’s health by leveraging the strengths of all stakeholders. The fulcrum is also a point of equilibrium, reflecting our ability to balance the needs of consumers, providers and payers on complex health matters. The inner triangle also evokes the Greek letter delta—used in medical and mathematical contexts to represent change—with a forward lean as we work with our community to achieve positive changes in health care.
Give me a lever long enough and a fulcrum on which to place it, and I shall move the world. —Archimedes
1150 University Avenue • Rochester, New York • 14607-1647585.461.3520 • www.FLHSA.org