Embed Size (px)
Citation preview
Using Entropy-Related Measures in Categorical Data Visualization
Jamal AlsakranThe University of Jordan
Xiaoke Huang, Ye ZhaoKent State University
Jing YangUNC Charlotte
Karl FastKent State University
Categorical Datasets
• Generated in a large variety of applications– E.g., health/social studies, bank transactions,
online shopping records, and taxonomy classifications
• Contain a series of categorical dimensions (variables)
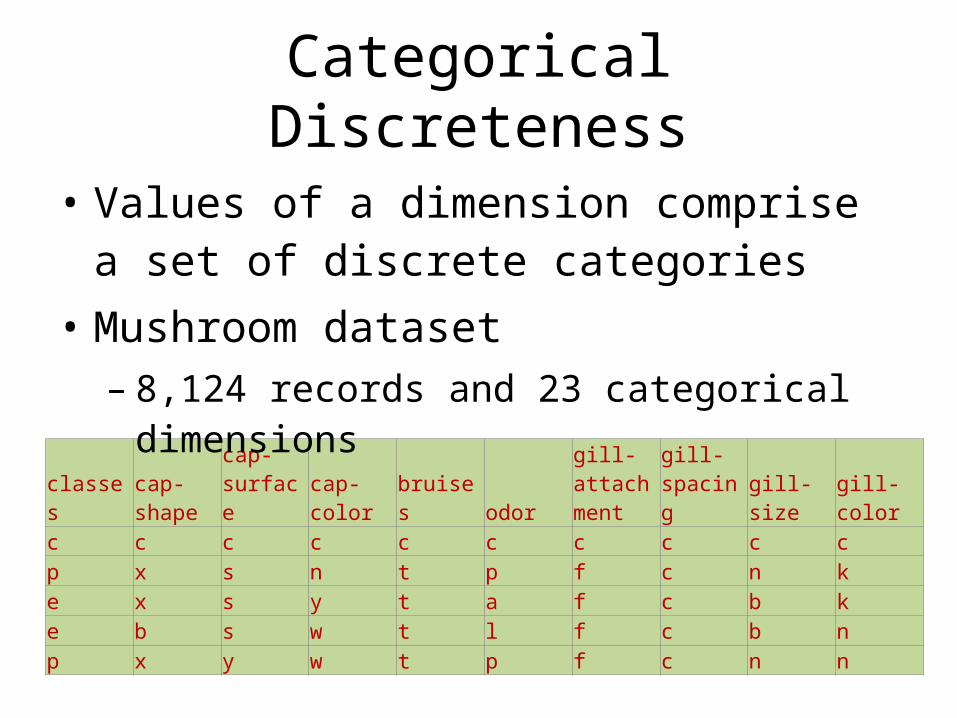
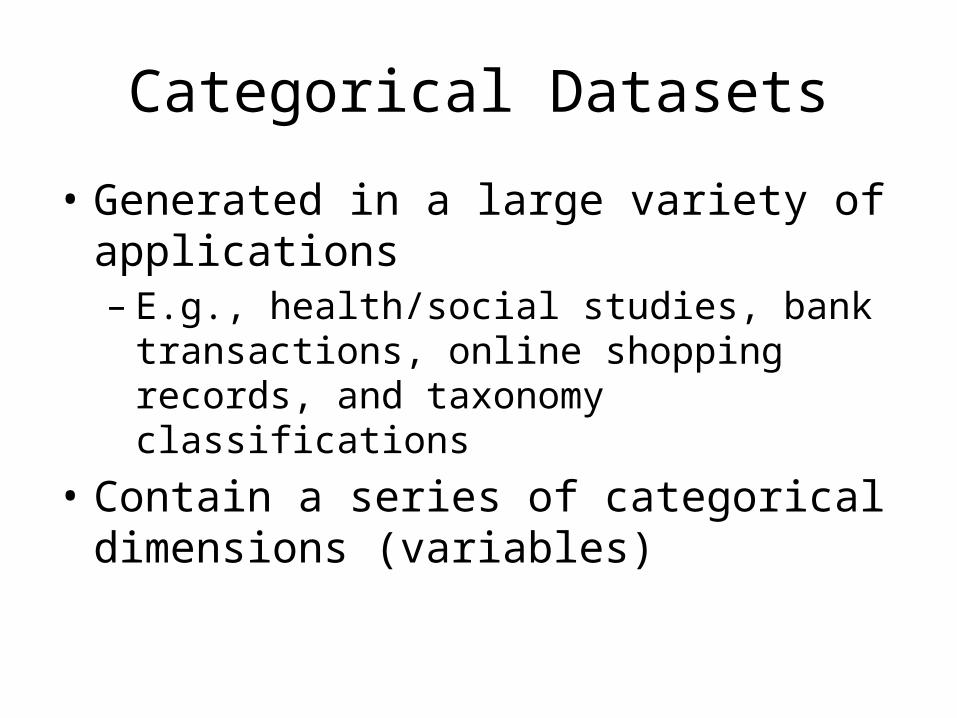
Categorical Discreteness
classescap-shape
cap-surface cap-color bruises odor
gill-attachment
gill-spacing gill-size gill-color
c c c c c c c c c cp x s n t p f c n ke x s y t a f c b ke b s w t l f c b np x y w t p f c n n
• Values of a dimension comprise a set of discrete categories
• Mushroom dataset – 8,124 records and 23 categorical dimensions
Challenges
• Multidimensional visualization methods are often undermined when directly applied to categorical datasets– the limited number of categories creates
overlapping elements and visual clutter– the lack of an inherent order (in contrast to
numeric variables) confounds the visualization design
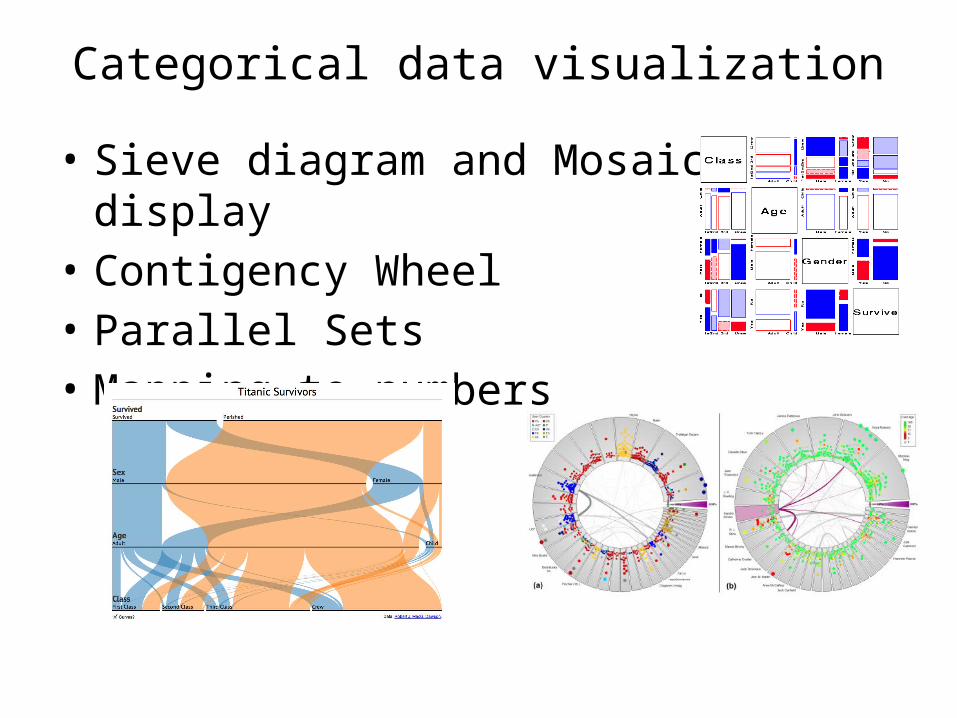
Categorical data visualization
• Sieve diagram and Mosaic display• Contigency Wheel• Parallel Sets• Mapping to numbers
Our Work
• Investigate the use of entropy-related measures in visualizing multidimensional categorical data– Show how entropy-related measures can help
users understand and navigate categorical data– Employ these measures in managing and ordering
dimensions within the parallel set visualization– Conduct user studies on real-world data
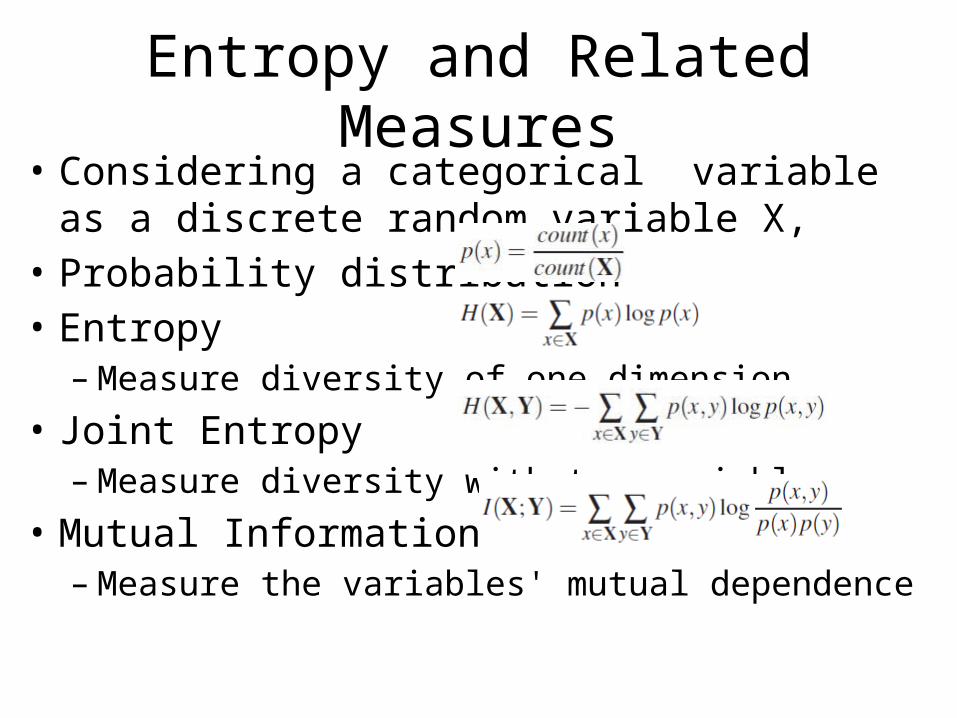
Entropy and Related Measures• Considering a categorical variable as a discrete
random variable X,• Probability distribution• Entropy– Measure diversity of one dimension
• Joint Entropy– Measure diversity with two variables
• Mutual Information– Measure the variables' mutual dependence

Use of Entropy
• Chen and Janicke proposed an information-theoretic framework for visualization.
• Pargnostics: pixel-based entropy used for order optimization of coordinates
• We use entropy and mutual information in categorical data visualization
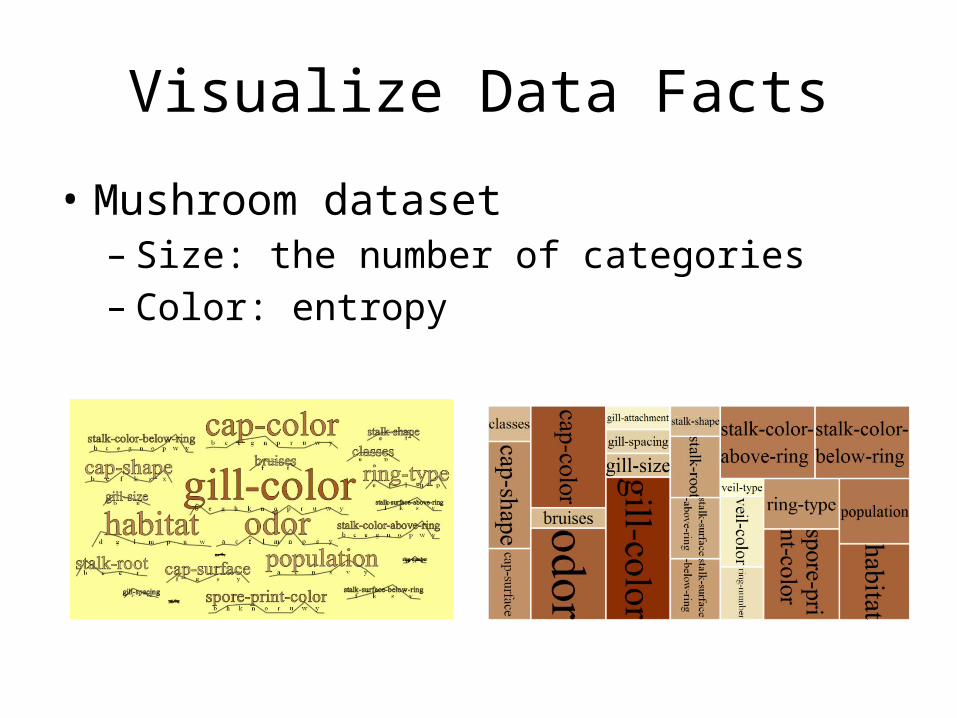
Visualize Data Facts
• Mushroom dataset– Size: the number of categories– Color: entropy

Navigation Guide: Scatter Plot Matrix• Joint entropy matrix
– High joint entropy indicates diversely distributed data records in a scatter plot
– Low joint entropy reveals lots of overlaps
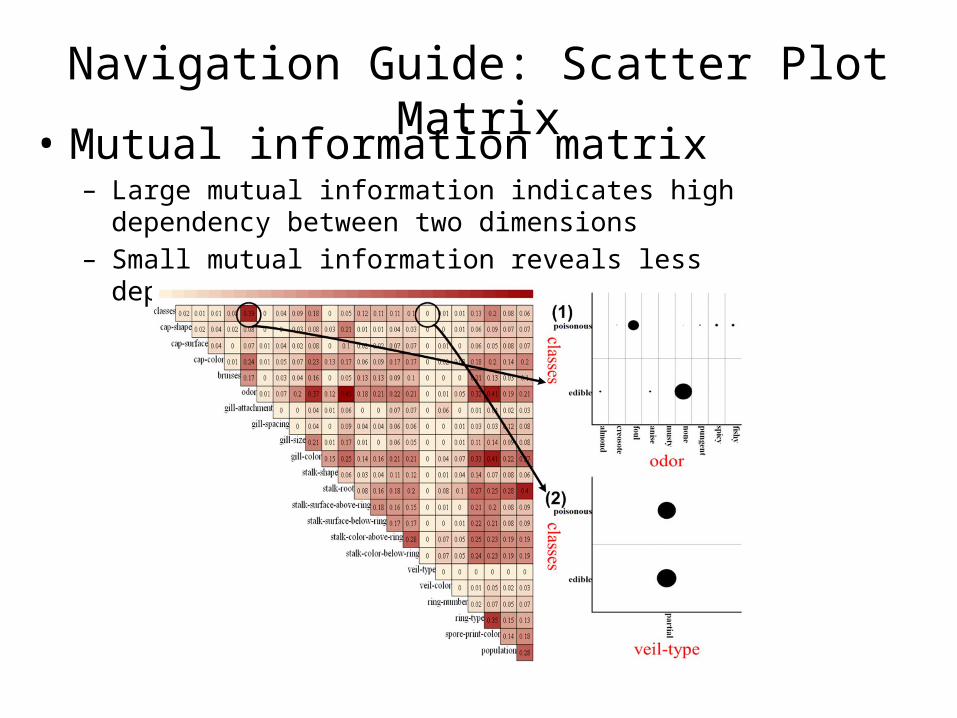
Navigation Guide: Scatter Plot Matrix• Mutual information matrix
– Large mutual information indicates high dependency between two dimensions
– Small mutual information reveals less dependency
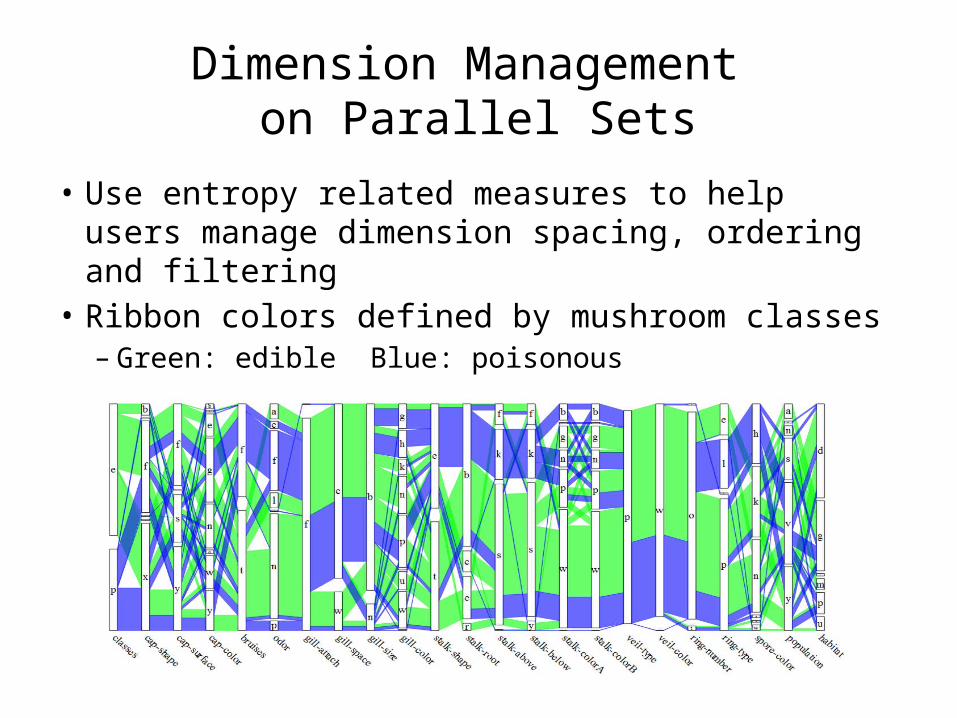
Dimension Management on Parallel Sets
• Use entropy related measures to help users manage dimension spacing, ordering and filtering
• Ribbon colors defined by mushroom classes– Green: edible Blue: poisonous
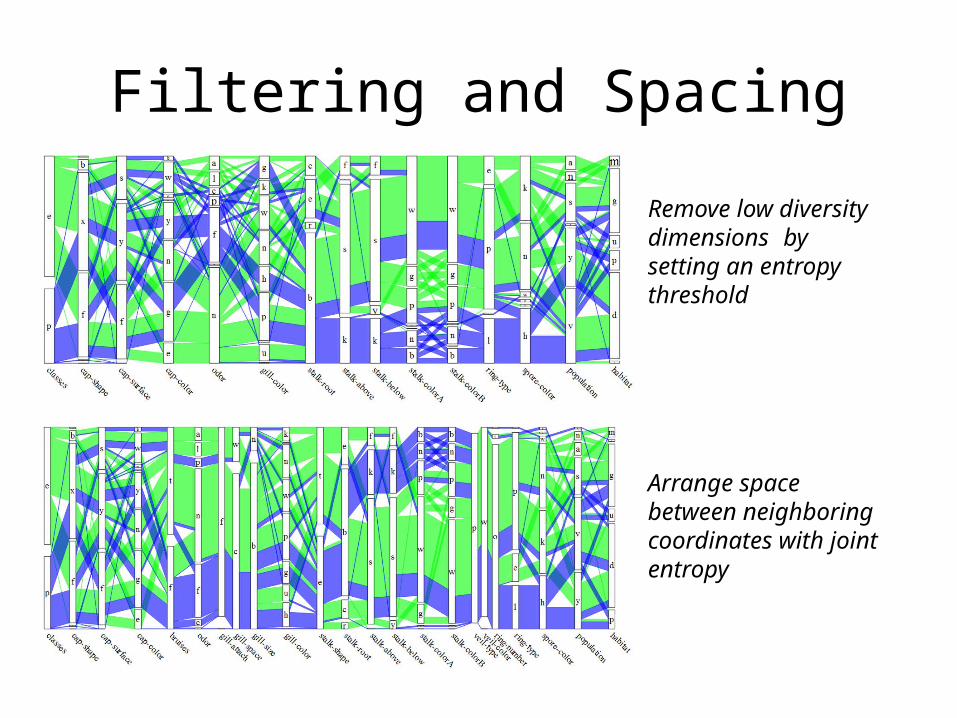
Filtering and Spacing
Remove low diversity dimensions by setting an entropy threshold
Arrange space between neighboring coordinates with joint entropy
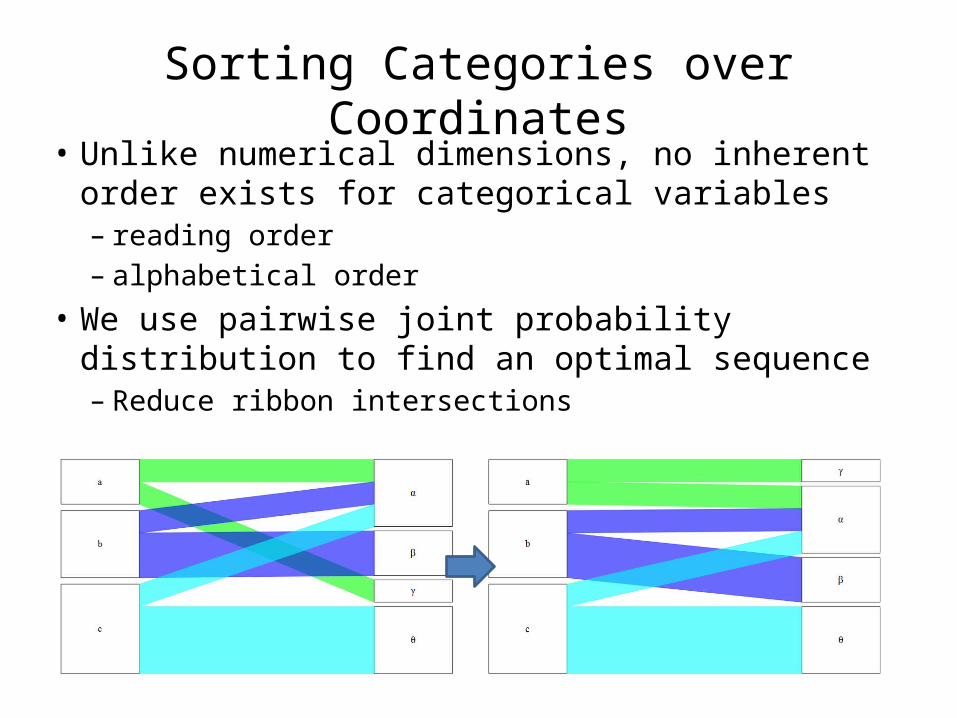
Sorting Categories over Coordinates• Unlike numerical dimensions, no inherent order
exists for categorical variables– reading order– alphabetical order
• We use pairwise joint probability distribution to find an optimal sequence– Reduce ribbon intersections
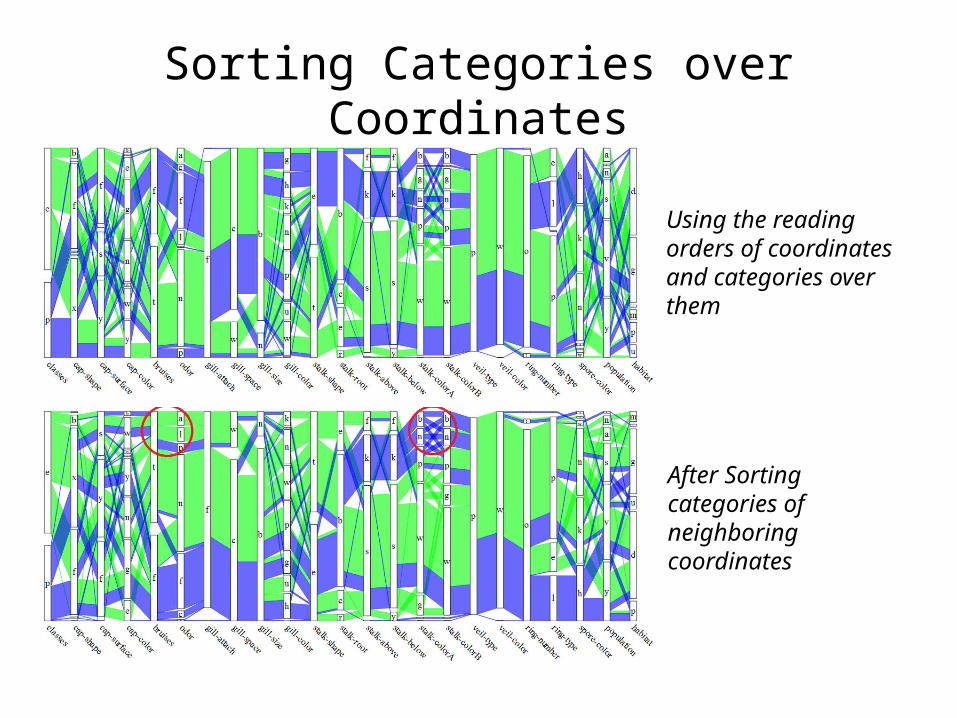
Sorting Categories over Coordinates
Using the reading orders of coordinates and categories over them
After Sorting categories of neighboring coordinates

Optimal Ordering of Multiple Coordinates
• For parallel coordinates many existing approaches reduce line crossings between neighboring coordinates
• Using line crossings as cost function between every pair of dimensions, global cost minimization is achieved by a graph theory based method [32]
• However, reducing crossings does not necessarily lead to more effective insight discovery– ribbon crossings reliant on the sequences of categories
over axes (reading order? Alphabeta order?)
Our Method
• We use mutual information as the cost function– Benefit: the cost is not related to the sequences of
categories over axes• Globally maximize the sum of mutual
information of a series of dimensions• A Hamiltonian path algorithm of the Traveling
Salesman Problem is solved to create optimal ordering
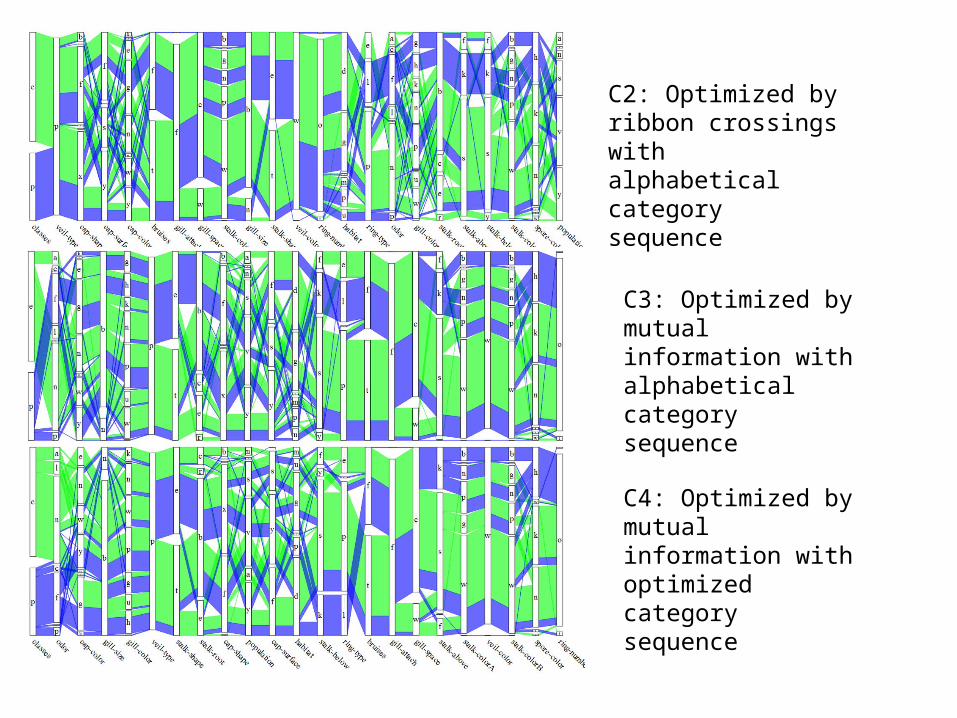
C2: Optimized by ribbon crossings with alphabetical category sequence
C3: Optimized by mutual information with alphabetical category sequence
C4: Optimized by mutual information with optimized category sequence
User Studies
• Assess user performance on insight discovery with different ordering approaches
• Design specific tasks for users to complete in a limited time period
• Apply statistical analysis on the results
Mushroom Data
• 11 participants received training and 10 minutes practice before test
• Each participant was given 90 seconds to find the mushroom characteristics as many as possible, which are (T1) All-edible; (T2) All-poisonous; (T3) Mostly-edible; (T4) Mostly poisonous
• Compared with ground truth, each participant was given a score
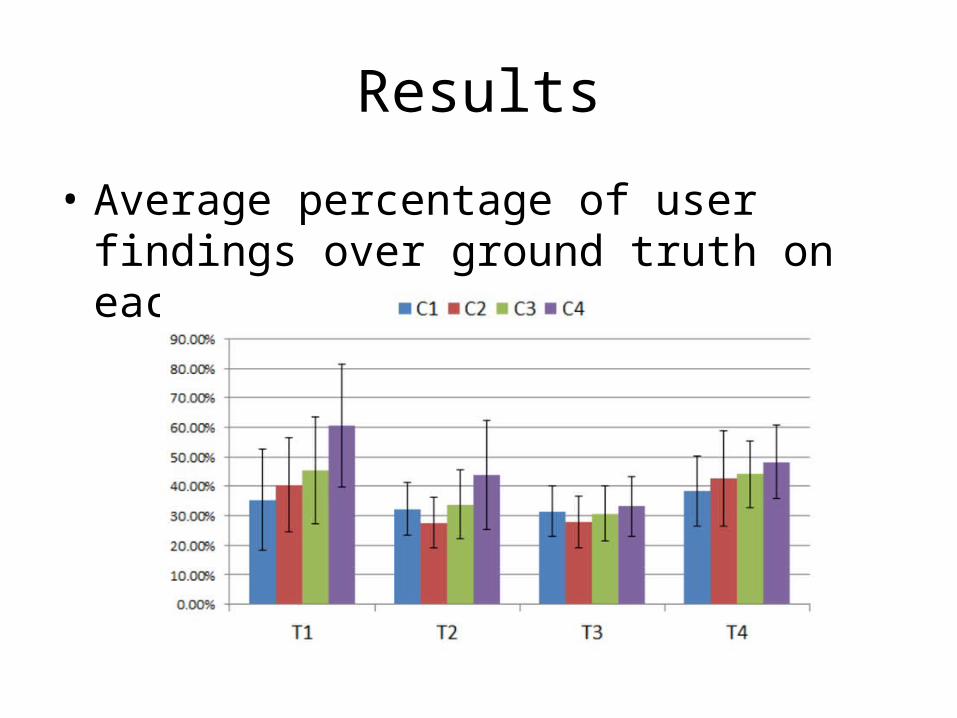
Results
• Average percentage of user findings over ground truth on each task

Results
• Total performance of user findings using different visualizations
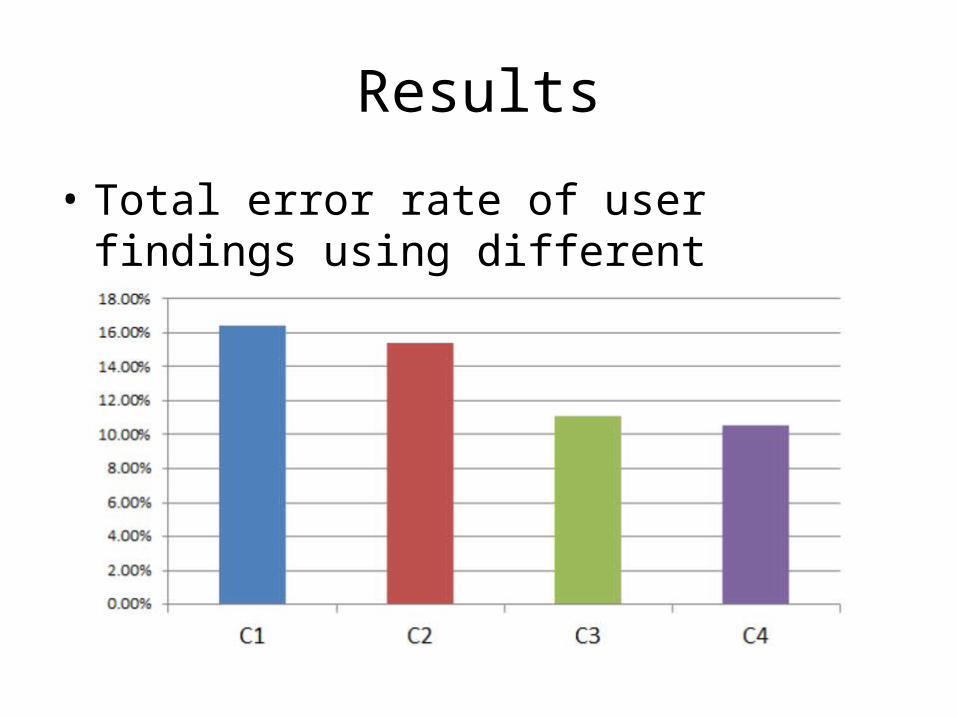
Results
• Total error rate of user findings using different visualizations
Statistical Test
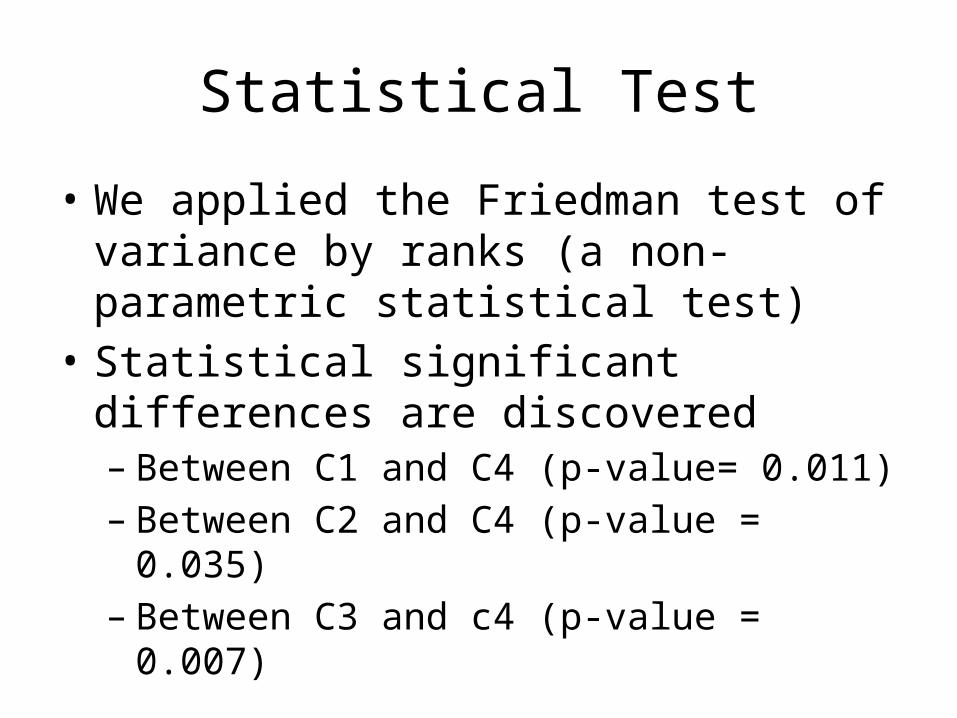
• We applied the Friedman test of variance by ranks (a non-parametric statistical test)
• Statistical significant differences are discovered– Between C1 and C4 (p-value= 0.011)– Between C2 and C4 (p-value = 0.035)– Between C3 and c4 (p-value = 0.007)
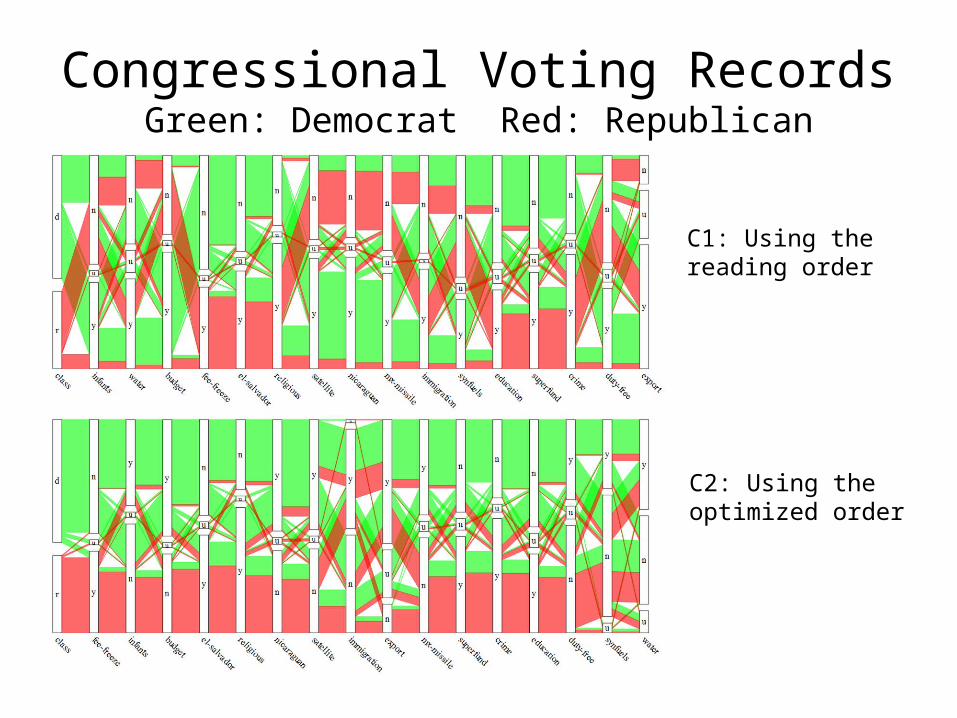
Congressional Voting RecordsGreen: Democrat Red: Republican
C1: Using the reading order
C2: Using the optimized order

Congressional Voting Recordsleftmost dimension is the votes of education-spending
Green: nay Red: yea
C3: Using the reading order
C4: Using the optimized order
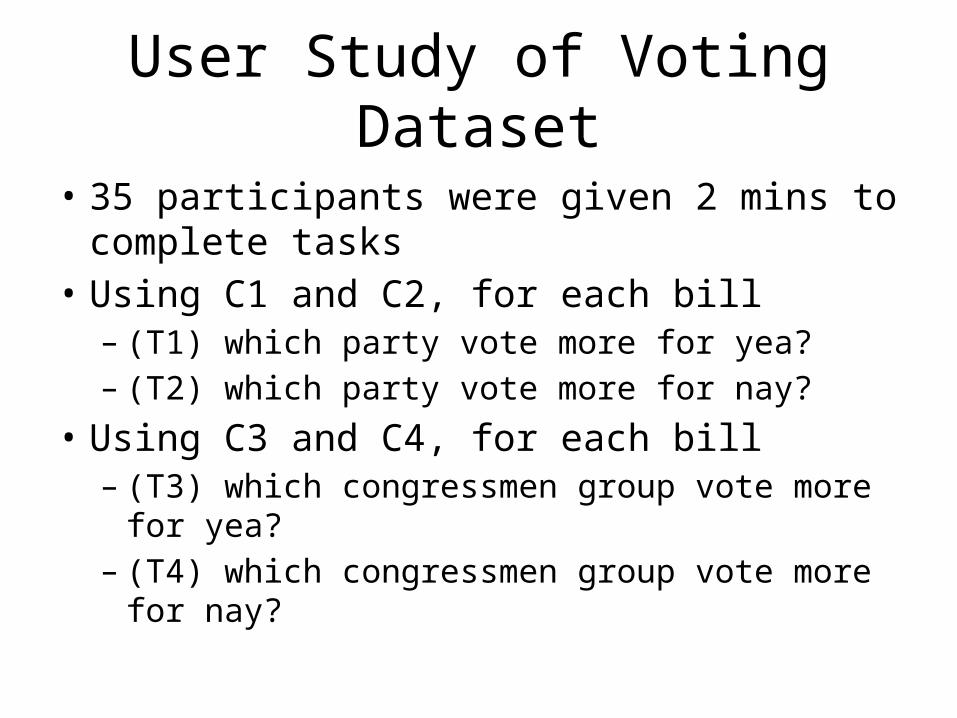
User Study of Voting Dataset
• 35 participants were given 2 mins to complete tasks
• Using C1 and C2, for each bill– (T1) which party vote more for yea? – (T2) which party vote more for nay?
• Using C3 and C4, for each bill – (T3) which congressmen group vote more for yea? – (T4) which congressmen group vote more for nay?
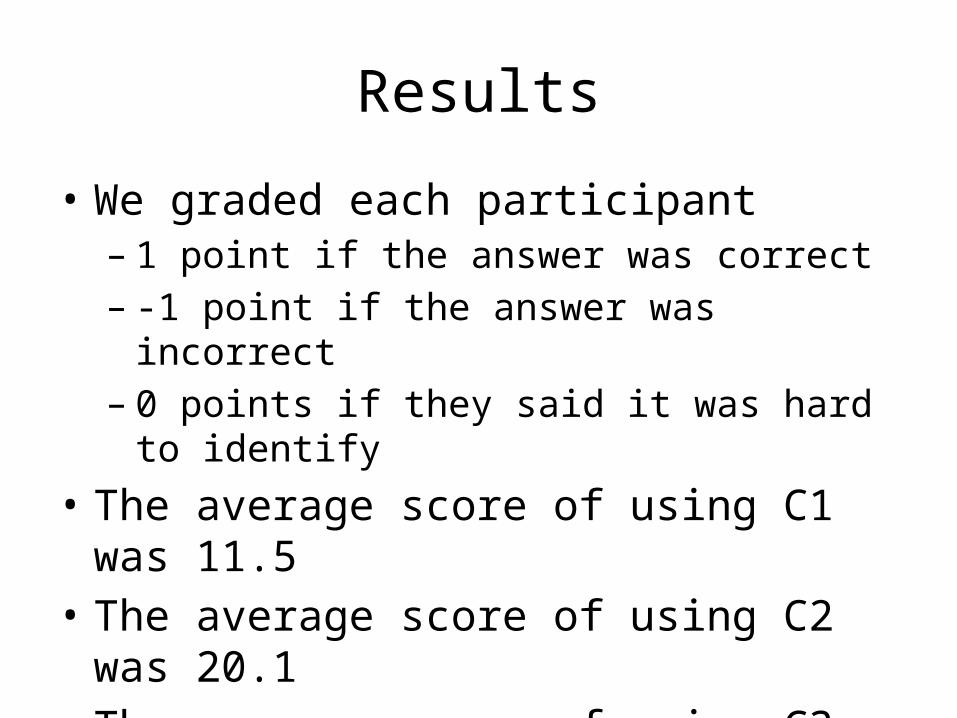
Results
• We graded each participant – 1 point if the answer was correct– -1 point if the answer was incorrect– 0 points if they said it was hard to identify
• The average score of using C1 was 11.5• The average score of using C2 was 20.1• The average score of using C3 was 13.2• The average score of using C4 was 18.0
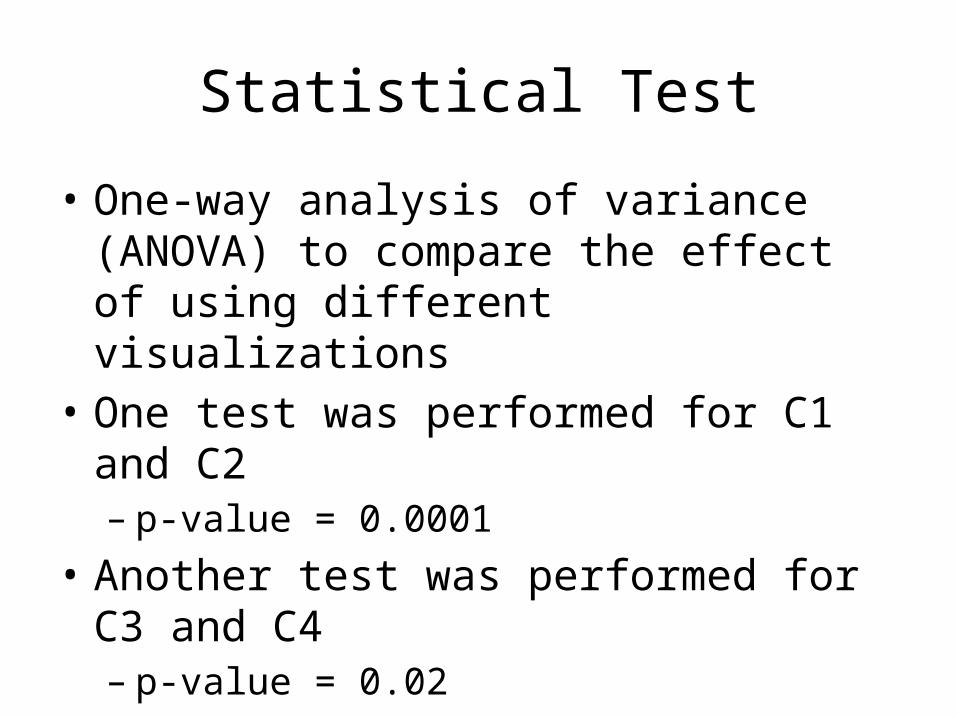
Statistical Test
• One-way analysis of variance (ANOVA) to compare the effect of using different visualizations
• One test was performed for C1 and C2– p-value = 0.0001
• Another test was performed for C3 and C4– p-value = 0.02

Conclusion
• Utilize measures from information theory to enhance the visualization of high dimensional categorical data
• Support users to browse data facts among dimensions, to determine starting points of data analysis, and to test- and-tune parameters for visual reasoning

Thanks!
• This work is partially supported by US NSF IIS-1352927, IIS-1352893, and Google Faculty Research Award