Embed Size (px)
Citation preview
TEC-00651-2014
1
Abstract—Improving offshore wind turbine reliability is a key
industry goal to improve the availability of this renewable energy
generation source. The semiconductor devices in the wind turbine
power converter (WTPC) are traditionally considered as the most
sensitive and important components to achieve this, and
managing their thermo-mechanical stressing is vital, since this is
one of their principal long-term aging mechanisms. Conventional
deterministic reliability prediction methods used in industrial
applications are not suitable for wind turbine applications, due to
the stochastic wind speed. This paper develops an electro-thermal
model of the power devices which is integrated with a wind
turbine system model for the investigation of power converter
thermal cycling under various operating conditions. The model
has been developed to eliminate the problems of PWM switching,
substantially reducing simulation time. The model is used to improve the current controller tuning
method to reduce thermal stresses suffered by the converter
during a grid fault. The model is finally used to design a control
method to alleviate a key problem of the doubly-fed induction
generator (DFIG) – severe thermal cycling caused during
operation near synchronous speed.
Index Terms—Wind turbine power converter, Power device
reliability, electro-thermal modelling, PSCAD/EMTDC
I. INTRODUCTION
HE power converter as a subassembly of the wind turbine is
subject to high failure rates, which makes it a major
concern in the overall reliability of future offshore wind farm
developments [1]. An industry survey [2] has revealed that the
power semiconductor switch is most vulnerable to thermal
cycling. It suffers two resultant principle failure mechanisms –
bond wire lift-off and solder fatigue. More accurate thermal
cycling modeling of the semiconductor, and mitigation
strategies for thermal cycling are thus important to improve
wind turbine reliability. It is this which this paper addresses.
Reliability research for the WTPC has just been started [3].
Manuscript submitted September 20, 2014 for review. This work was
supported in part by the Engineering and Physical Sciences Research Council
under Grant EP/H018662/1 – Supergen Wind Energy Technologies”.
T. Lei, M. Barnes and Sandy Smith are with the department of Electrical and Electronic Engineering, University of Manchester, M1 3DB, United Kingdom
(e-mail: [email protected]; [email protected];
[email protected]). W. Leithead, S. H. Hur, A. Stock are with the Department of Electronic and
Electrical Engineering, University of Strathclyde, Glasgow, Scotland, G1 1XW,
United Kingdom (e-mail: [email protected]; [email protected]; [email protected]).
Previous industrial reliability-based models can use defined
load cases. However, due to the unpredictable nature of wind
speed, a number of researchers have adopted an integrated
model and conduct numerical simulation. In [4] and [5], the
wind turbine model is used in conjunction with the power
device's reliability model. In this way, the turbine operating
modes are be firstly transformed into electric variations, which
are used to generate the device temperature variations by the
electro-thermal model, and then are converted to lifetime
consumption factors.
Relevant research in this area shows that both the
synchronous and the rated operating speeds have been
considered as the critical operating points [6], [7] and [8]. It is
known that the device lifetime is related to both the mean
temperature and its variations [5]. Working close to
synchronous operating point is especially undesirable for a
doubly-fed induction generator (DFIG) wind turbine, as the low
frequency load current will cause large peak-to-peak
temperature variations. Other literature investigates the impacts
of different turbine control and converter control strategies [9]
and [10], or various wind roughness [11]. An improved control
method to reduce thermal stresses in three-level
neutral-point-clamped (3L-NPC) converters has also been
analyzed [12]. In previous research, a detailed electro-thermal
model is usually not presented. Such a model involves a wide
bandwidth range for different sub-systems, (from several kHz
to a few Hz), thus it should be designed with sufficient detail so
as not to lose accuracy, but also be simplified in order to reduce
the computational effort.
This paper presents an averaged electro-thermal model. A
detailed description on how to calculate the power loss and the
development of the thermal network are given in Section III
and IV. Numerical simulation based on this model is conducted
in PSCAD/EMTDC to investigate the device thermal cycling
under different operating conditions, as is illustrated in Section
V. Section VI presents the temperature variations under
variable wind speeds with the rotor speed working near the
synchronous point. It also discusses the significant
enhancement achieved through using a modified turbine
control strategy.
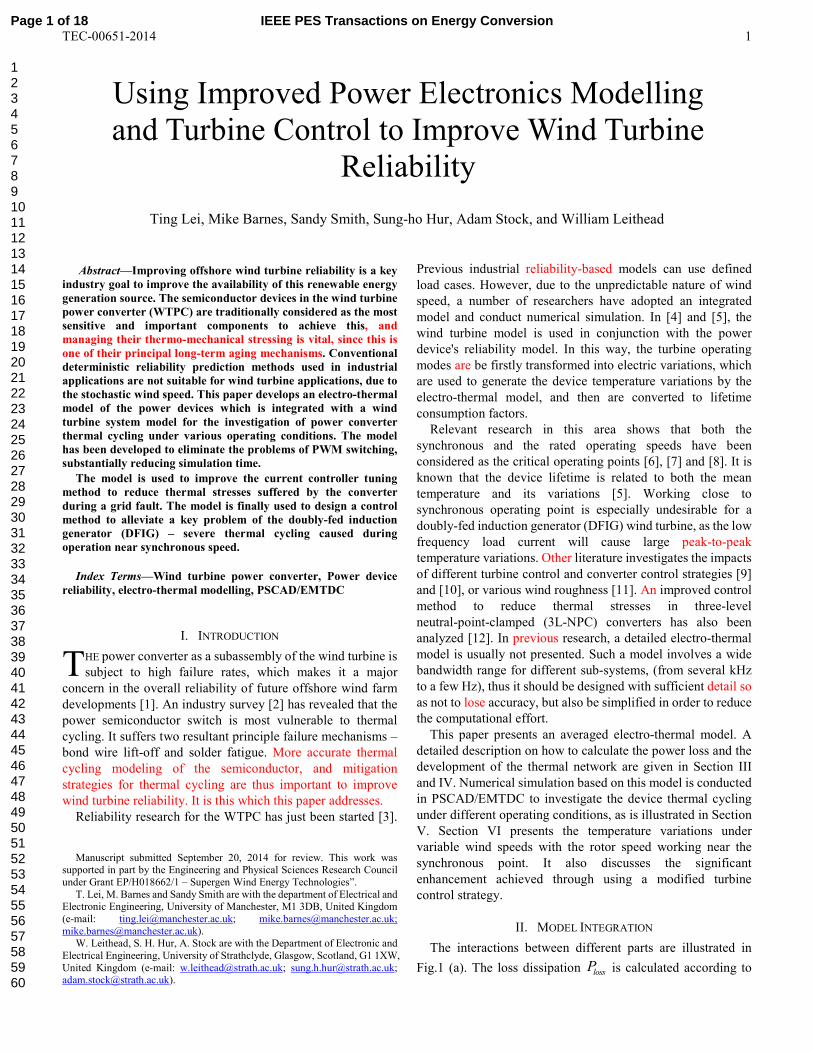
II. MODEL INTEGRATION
The interactions between different parts are illustrated in
Fig.1 (a). The loss dissipation lossP is calculated according to
Using Improved Power Electronics Modelling
and Turbine Control to Improve Wind Turbine
Reliability
Ting Lei, Mike Barnes, Sandy Smith, Sung-ho Hur, Adam Stock, and William Leithead
T
Page 1 of 18 IEEE PES Transactions on Energy Conversion
123456789101112131415161718192021222324252627282930313233343536373839404142434445464748495051525354555657585960
TEC-00651-2014
2
the averaged electrical signal from the wind turbine (current i ,
ac voltage acv and dc-link voltage dcV ) and the junction
temperature jT . This is then used by the thermal network to
predict the temperature variations.
A coherent electro-mechanical wind turbine model was
established, as in Fig.1 (b). It consists of an aerodynamic model
that converts the wind energy into aerodynamic torque and a
2-mass shaft system that can reflect the mechanical oscillations
when it is subject to disturbances. These together with the wind
turbine control are developed in MATLAB, from which the
electro-mechanical parameters can be extracted and applied to
the DFIG control level. A DFIG machine, a switch-averaged
voltage source converter and the converter control system are
built in PSCAD/EMTDC, which is described in detail in [13]
and will not be repeated here.
The work here is to establish the electro-thermal model and
to work out the impacts on the reliability via the model
integration. The rest of the paper will present the approach to
model and the analysis of thermal cycling in different
conditions.
III. POWER LOSS CALCULATION
Generally, there are two types of model used to calculate the
semiconductor's power loss. The first is an analytical model, by
which the average loss of a load cycle can be delivered [14],
[15], [16] and [17]. The other is a numerical circuit model, from
which the instantaneous power loss is obtained in the form of
pulse patterns [18] and [19]. The former is very fast, but the
results will not reflect the instantaneous load variation; whereas
the latter may take a very long simulation time as it needs a very
small time step to detect the PWM switching. As the time
constant of the thermal network is much larger than the PWM
frequency, the output temperature is mainly affected by the
fundamental load current variation, rather than the high
frequency switching component. In this paper, a
switch-averaged loss calculation method is thus adopted, where
the average loss per switching cycle is determined as a function
of the load current. In the following, basic equations for
obtaining conducting and switching losses are described.
A. Conduction Loss
In [18], a fast numerical simulation method is proposed for
calculating the conduction losses conP . It uses the characteristic
curves provided in the manufacturer's datasheet to derive a
second order polynomial function (1), with the load current LI
and device temperature jT as the input variables.
2
0 1 0 1( , ) ( ) ( )con L j j L j LP I T a a T I b bT I= + + + (1)
Here the coefficients a and b are obtained by curve fitting.
The Semikron IGBT module SKiiP 2013 GB172-4DW [20]
with 1.7kV blocking voltage and 2kA nominal current, which is
designed for wind turbine applications, will be used for the
purpose of developing the electro-thermal model of the power
devices used in a 5MW DFIG wind turbine. The
mechanical/electrical parameters of the wind turbine, the
thermal impedances and the temperature coefficients a and b
are given in the Appendix.
B. Switching Loss
The switching losses for a power device include turn-on and
turn-off losses. For a diode, turn-off loss is also referred to as
the reverse-recovery loss, which accounts for 99% of the total
switching loss [21]. The energy generated during a switching
event is given by (2) [22]. Here the switch-on and switch-off
losses are added into a single switching event. It can be seen
that several parameters affecting this loss type are: the blocking
voltage CCV , which equals to the dc-link voltage, the load
current LI and the device junction temperature jT . The
superscript ' 'ref denotes for the reference values for the
quantities, which is given in the manufacturer’s datasheet. iK
and vK are current and voltage dependency exponents; CESWT
is the temperature coefficient. Typical values for these
parameters used in this application are given in Table I.
( ) ( ) (1 ( ))ref Ki Kv refCCL
SW SW Esw j jref ref
L CC
VIE E TC T T
I V= ⋅ + ⋅ − (2)
C. Switch-averaged Loss Model
As the switching frequency is much larger than the
fundamental frequency, using a different modulation scheme
makes little difference in the temperature dynamics. Also, the
TABLE I PARAMETERS USED FOR CALCULATING THE SWITCHING ENERGY [21]
IGBT Diode
iK 1 0.6
vK 1.3-1.4 0.6
ESWTC 0.003 1/K 0.006 1/K
Ki = current dependency exponents, Kv = voltage dependency exponents,
TC ESW = temperature coefficient, K = Kelvin
(a)
(b)
Fig. 1. Model Integration. (a) Interactions between the wind turbine model
and the electro-thermal model, (b) DFIG wind turbine electro-mechanical
system model.
Page 2 of 18IEEE PES Transactions on Energy Conversion
123456789101112131415161718192021222324252627282930313233343536373839404142434445464748495051525354555657585960
TEC-00651-2014
3
current can be considered as constant during one switching
cycle. Then the conduction loss averaged for one switching
cycle conP is related to the instantaneous conduction loss ,con insP
as
,
,
con ins con
con con ins
P P
P P
δ τ τ
δ
⋅ ⋅ = ⋅
⇒ = ⋅ (3)
Here δ is the duty ratio. For PWM with sine-wave carrier,
the duty ratio can be expressed as a function of the dc-link
voltage and the instantaneous phase voltage phv [23].
1
(1 )2 / 2
ph
dc
v
Vδ = × + (4)
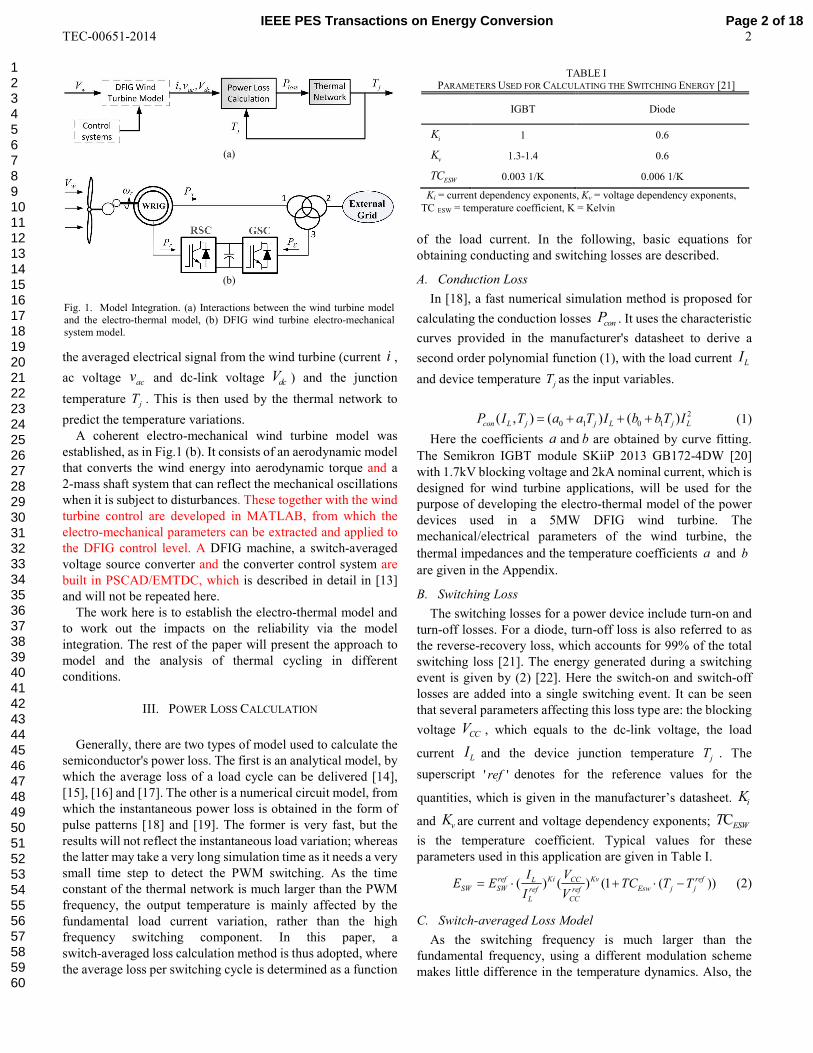
The loss calculation method is illustrated in Fig.2, where the
upper IGBT and the opposite lower diode are conducting for
half a load cycle, thus pI and nI in (5) are used respectively.
The subscripts ' Tr ' and D denotes the IGBT transistor and the
diode. The switching frequency swf is 4.5kHz. Combining eq.
(1) – (5), the total losses are obtained at the output.
0 if 0 if 0
if 00 if 0
LL L
p n
L LL
II II I
I II
>> = =
<< (5)
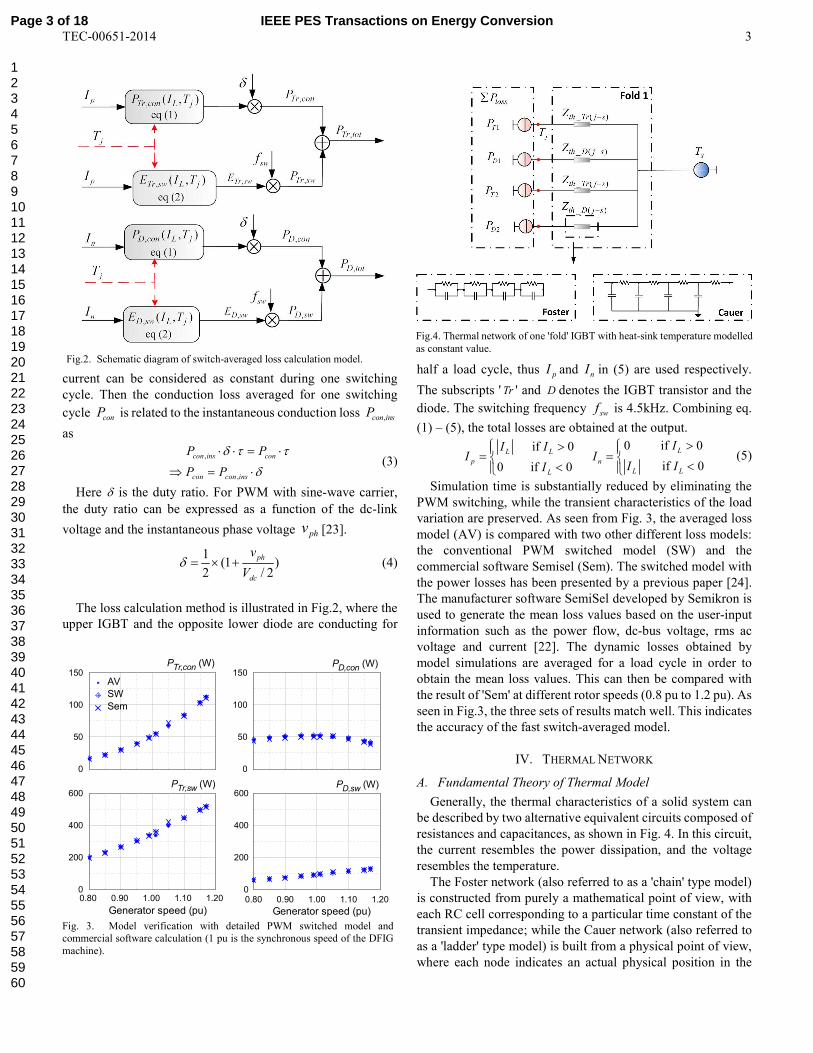
Simulation time is substantially reduced by eliminating the
PWM switching, while the transient characteristics of the load
variation are preserved. As seen from Fig. 3, the averaged loss
model (AV) is compared with two other different loss models:
the conventional PWM switched model (SW) and the
commercial software Semisel (Sem). The switched model with
the power losses has been presented by a previous paper [24].
The manufacturer software SemiSel developed by Semikron is
used to generate the mean loss values based on the user-input
information such as the power flow, dc-bus voltage, rms ac
voltage and current [22]. The dynamic losses obtained by
model simulations are averaged for a load cycle in order to
obtain the mean loss values. This can then be compared with
the result of 'Sem' at different rotor speeds (0.8 pu to 1.2 pu). As
seen in Fig.3, the three sets of results match well. This indicates
the accuracy of the fast switch-averaged model.
IV. THERMAL NETWORK
A. Fundamental Theory of Thermal Model
Generally, the thermal characteristics of a solid system can
be described by two alternative equivalent circuits composed of
resistances and capacitances, as shown in Fig. 4. In this circuit,
the current resembles the power dissipation, and the voltage
resembles the temperature.
The Foster network (also referred to as a 'chain' type model)
is constructed from purely a mathematical point of view, with
each RC cell corresponding to a particular time constant of the
transient impedance; while the Cauer network (also referred to
as a 'ladder' type model) is built from a physical point of view,
where each node indicates an actual physical position in the
Fig.2. Schematic diagram of switch-averaged loss calculation model.
Fig.4. Thermal network of one 'fold' IGBT with heat-sink temperature modelled
as constant value.
Fig. 3. Model verification with detailed PWM switched model and
commercial software calculation (1 pu is the synchronous speed of the DFIG
machine).
0
50
100
150
0
50
100
150
0.80 0.90 1.00 1.10 1.200
200
400
600
0.80 0.90 1.00 1.10 1.200
200
400
600
PD,sw
(W)PTr,sw
(W)
PD,con
(W)PTr,con
(W)
Generator speed (pu) Generator speed (pu)
AV
SW
Sem
Page 3 of 18 IEEE PES Transactions on Energy Conversion
123456789101112131415161718192021222324252627282930313233343536373839404142434445464748495051525354555657585960
TEC-00651-2014
4
solid system. In this topology the thermal resistance thR is
related to material conductivity and dimensions while the
thermal capacitance thC is related to heat storage capacity [25].
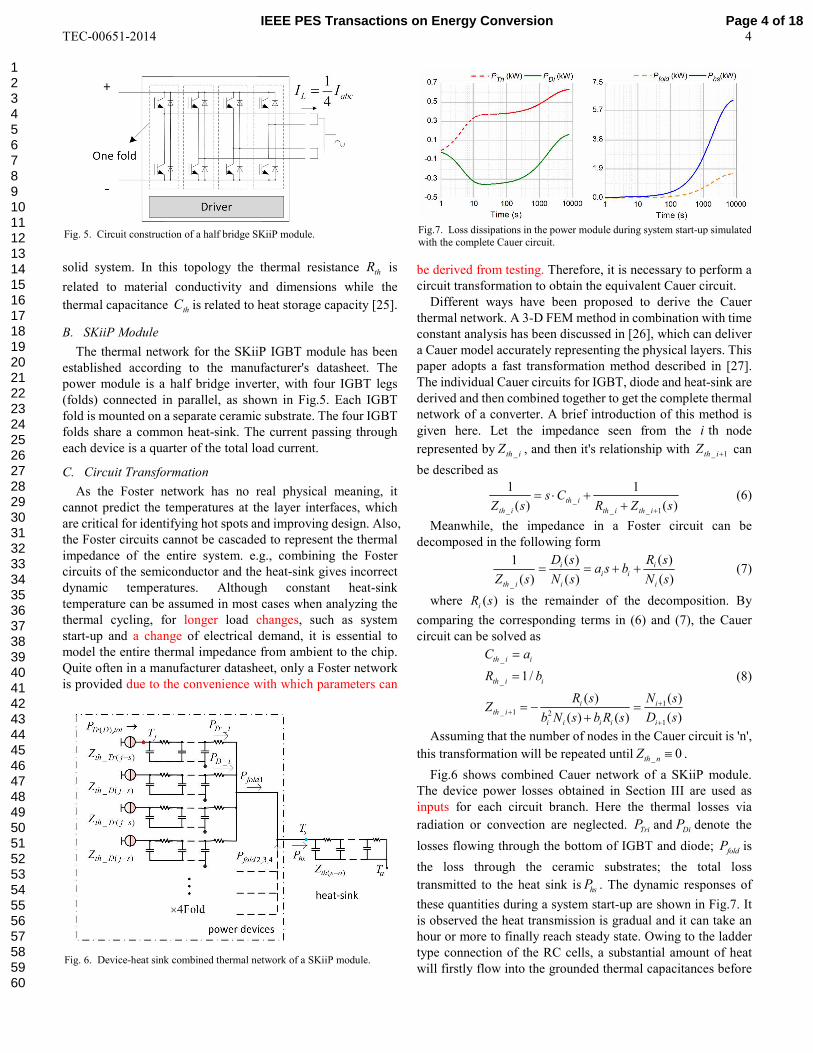
B. SKiiP Module
The thermal network for the SKiiP IGBT module has been
established according to the manufacturer's datasheet. The
power module is a half bridge inverter, with four IGBT legs
(folds) connected in parallel, as shown in Fig.5. Each IGBT
fold is mounted on a separate ceramic substrate. The four IGBT
folds share a common heat-sink. The current passing through
each device is a quarter of the total load current.
C. Circuit Transformation
As the Foster network has no real physical meaning, it
cannot predict the temperatures at the layer interfaces, which
are critical for identifying hot spots and improving design. Also,
the Foster circuits cannot be cascaded to represent the thermal
impedance of the entire system. e.g., combining the Foster
circuits of the semiconductor and the heat-sink gives incorrect
dynamic temperatures. Although constant heat-sink
temperature can be assumed in most cases when analyzing the
thermal cycling, for longer load changes, such as system
start-up and a change of electrical demand, it is essential to
model the entire thermal impedance from ambient to the chip.
Quite often in a manufacturer datasheet, only a Foster network
is provided due to the convenience with which parameters can
be derived from testing. Therefore, it is necessary to perform a
circuit transformation to obtain the equivalent Cauer circuit.
Different ways have been proposed to derive the Cauer
thermal network. A 3-D FEM method in combination with time
constant analysis has been discussed in [26], which can deliver
a Cauer model accurately representing the physical layers. This
paper adopts a fast transformation method described in [27].
The individual Cauer circuits for IGBT, diode and heat-sink are
derived and then combined together to get the complete thermal
network of a converter. A brief introduction of this method is
given here. Let the impedance seen from the thi node
represented by _th iZ , and then it's relationship with _ 1th iZ + can
be described as
_
_ _ _ 1
1 1
( ) ( )th i
th i th i th i
s CZ s R Z s+
= ⋅ ++
(6)
Meanwhile, the impedance in a Foster circuit can be
decomposed in the following form
_
( ) ( )1
( ) ( ) ( )
i i
i i
th i i i
D s R sa s b
Z s N s N s= = + + (7)
where ( )iR s is the remainder of the decomposition. By
comparing the corresponding terms in (6) and (7), the Cauer
circuit can be solved as
_
_
1
_ 1 2
1
1/
( ) ( )
( )( ) ( )
th i i
th i i
i i
th i
ii i i i
C a
R b
R s N sZ
D sb N s b R s
++
+
=
=
= − =+
(8)
Assuming that the number of nodes in the Cauer circuit is 'n',
this transformation will be repeated until _ 0th nZ ≡ .
Fig.6 shows combined Cauer network of a SKiiP module.
The device power losses obtained in Section III are used as
inputs for each circuit branch. Here the thermal losses via
radiation or convection are neglected. TriP and DiP denote the
losses flowing through the bottom of IGBT and diode; foldP is
the loss through the ceramic substrates; the total loss
transmitted to the heat sink is hsP . The dynamic responses of
these quantities during a system start-up are shown in Fig.7. It
is observed the heat transmission is gradual and it can take an
hour or more to finally reach steady state. Owing to the ladder
type connection of the RC cells, a substantial amount of heat
will firstly flow into the grounded thermal capacitances before
Fig. 5. Circuit construction of a half bridge SKiiP module.
Fig.7. Loss dissipations in the power module during system start-up simulated
with the complete Cauer circuit.
Fig. 6. Device-heat sink combined thermal network of a SKiiP module.
Page 4 of 18IEEE PES Transactions on Energy Conversion
123456789101112131415161718192021222324252627282930313233343536373839404142434445464748495051525354555657585960
TEC-00651-2014
5
the temperatures reach the steady state. Hence the time constant
for this combined Cauer model is much larger than that of the
device or the heat sink. However, if a combined Foster circuit is
used, the chain type RC cells will transmit the entire heat to
heat sink instantaneously at the start, giving incorrect dynamic
responses. This is why a Cauer model is preferred.
It is found that for the diode, the heat is not transmitted from
the device to the heat-sink until after approximately 2000s. This
is due to the diode's relatively larger time constant compared to
the IGBT, thus the losses from the IGBTs make the heat sink
temperature rise beyond the diodes' substrate temperature in a
short period at the system start-up.
V. IMPLEMENTATION WITH WIND TURBINE MODEL TO
EVALUATE THE DEVICE THERMAL CYCLING
A. Steady-state Thermal Cycling
Although the heat-sink can significantly influence a long
term temperature variation such as system start-up, for short
term dynamic behaviors in a load cycle, its effect is negligible.
Therefore a constant temperature heat-sink is used for steady
state analysis.
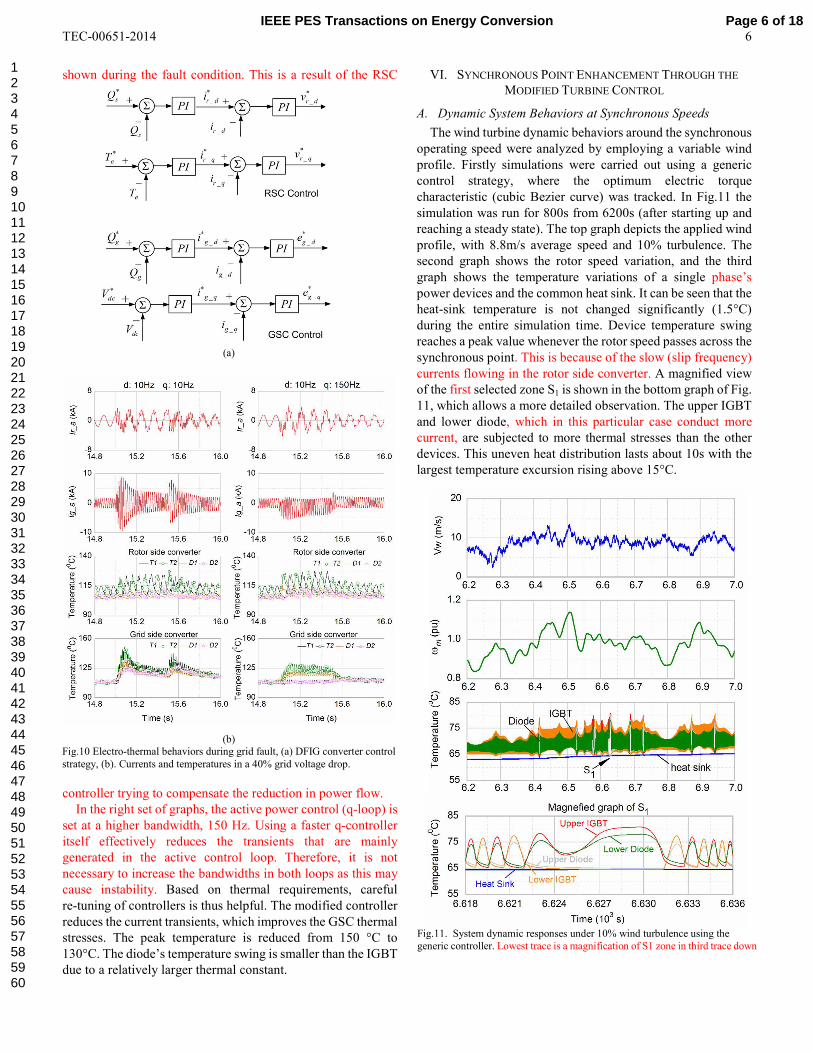
The average temperature of the IGBT and the heat-sink with
corresponding variations jT∆ resulting, are recorded for a
range of rotor speeds in Fig.8. It can be observed that the mean
temperature rises rapidly as the rotor speed increases to the
rated value, with a maximum steady state temperature
approaching 120°C. It is reported in [22] that the stress factor of
semiconductor increases little with temperature when it is
below 125°C, however, the device deteriorates very quickly
when the temperature is above 125°C. The presented model
indicates that working at rated operating point generally
imposes little harm for this WTPC; however, it is vulnerable to
abnormal events such as transients change in the load current
(increase torque demand or grid fault, which will be discussed
later). The converter lifetime may be significantly reduced if
that frequently happens during a full load condition.
The Coffin-Manson-Law [3] indicates that both the mean
temperature and temperature variations affect the
semiconductor's life time, i.e. the number of cycles to failure.
For a DFIG wind turbine, working with a small slip frequency
causes long time temperature rises and falls and thus produces
large peak to peak variations, resulting severe stresses in the
semiconductors. It is reported in [7] that for the converter, the
most stressful slip range around the synchronous point is
approximately 0.2-0.4 Hz.
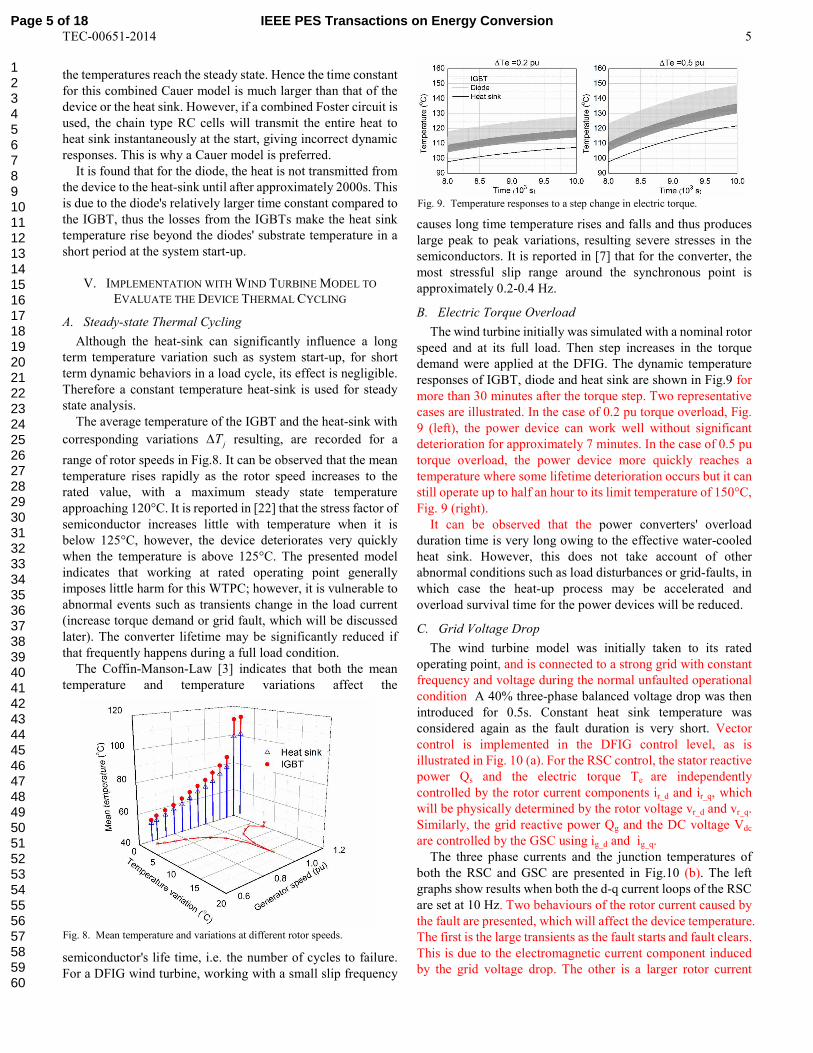
B. Electric Torque Overload
The wind turbine initially was simulated with a nominal rotor
speed and at its full load. Then step increases in the torque
demand were applied at the DFIG. The dynamic temperature
responses of IGBT, diode and heat sink are shown in Fig.9 for
more than 30 minutes after the torque step. Two representative
cases are illustrated. In the case of 0.2 pu torque overload, Fig.
9 (left), the power device can work well without significant
deterioration for approximately 7 minutes. In the case of 0.5 pu
torque overload, the power device more quickly reaches a
temperature where some lifetime deterioration occurs but it can
still operate up to half an hour to its limit temperature of 150°C,
Fig. 9 (right).
It can be observed that the power converters' overload
duration time is very long owing to the effective water-cooled
heat sink. However, this does not take account of other
abnormal conditions such as load disturbances or grid-faults, in
which case the heat-up process may be accelerated and
overload survival time for the power devices will be reduced.
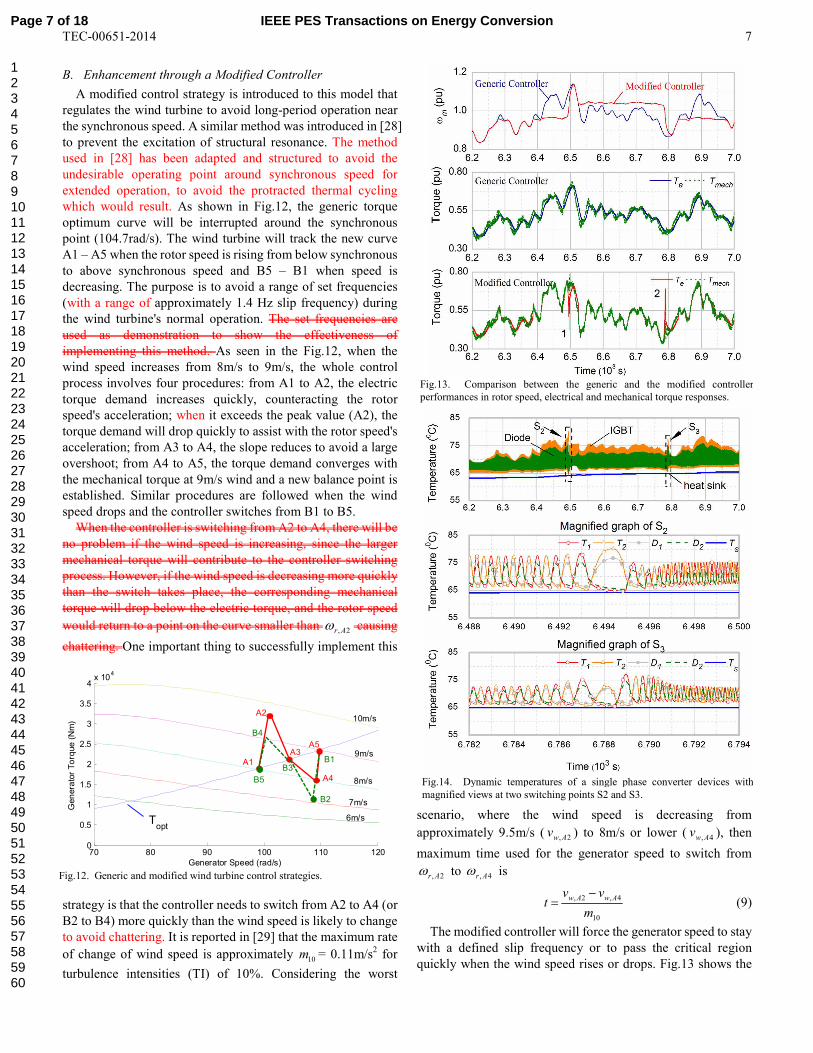
C. Grid Voltage Drop
The wind turbine model was initially taken to its rated
operating point, and is connected to a strong grid with constant
frequency and voltage during the normal unfaulted operational
condition A 40% three-phase balanced voltage drop was then
introduced for 0.5s. Constant heat sink temperature was
considered again as the fault duration is very short. Vector
control is implemented in the DFIG control level, as is
illustrated in Fig. 10 (a). For the RSC control, the stator reactive
power Qs and the electric torque Te are independently
controlled by the rotor current components ir_d and ir_q, which
will be physically determined by the rotor voltage vr_d and vr_q.
Similarly, the grid reactive power Qg and the DC voltage Vdc
are controlled by the GSC using ig_d and ig_q.
The three phase currents and the junction temperatures of
both the RSC and GSC are presented in Fig.10 (b). The left
graphs show results when both the d-q current loops of the RSC
are set at 10 Hz. Two behaviours of the rotor current caused by
the fault are presented, which will affect the device temperature.
The first is the large transients as the fault starts and fault clears.
This is due to the electromagnetic current component induced
by the grid voltage drop. The other is a larger rotor current
Fig. 9. Temperature responses to a step change in electric torque.
Fig. 8. Mean temperature and variations at different rotor speeds.
Page 5 of 18 IEEE PES Transactions on Energy Conversion
123456789101112131415161718192021222324252627282930313233343536373839404142434445464748495051525354555657585960
TEC-00651-2014
6
shown during the fault condition. This is a result of the RSC
controller trying to compensate the reduction in power flow.
In the right set of graphs, the active power control (q-loop) is
set at a higher bandwidth, 150 Hz. Using a faster q-controller
itself effectively reduces the transients that are mainly
generated in the active control loop. Therefore, it is not
necessary to increase the bandwidths in both loops as this may
cause instability. Based on thermal requirements, careful
re-tuning of controllers is thus helpful. The modified controller
reduces the current transients, which improves the GSC thermal
stresses. The peak temperature is reduced from 150 °C to
130°C. The diode’s temperature swing is smaller than the IGBT
due to a relatively larger thermal constant.
VI. SYNCHRONOUS POINT ENHANCEMENT THROUGH THE
MODIFIED TURBINE CONTROL
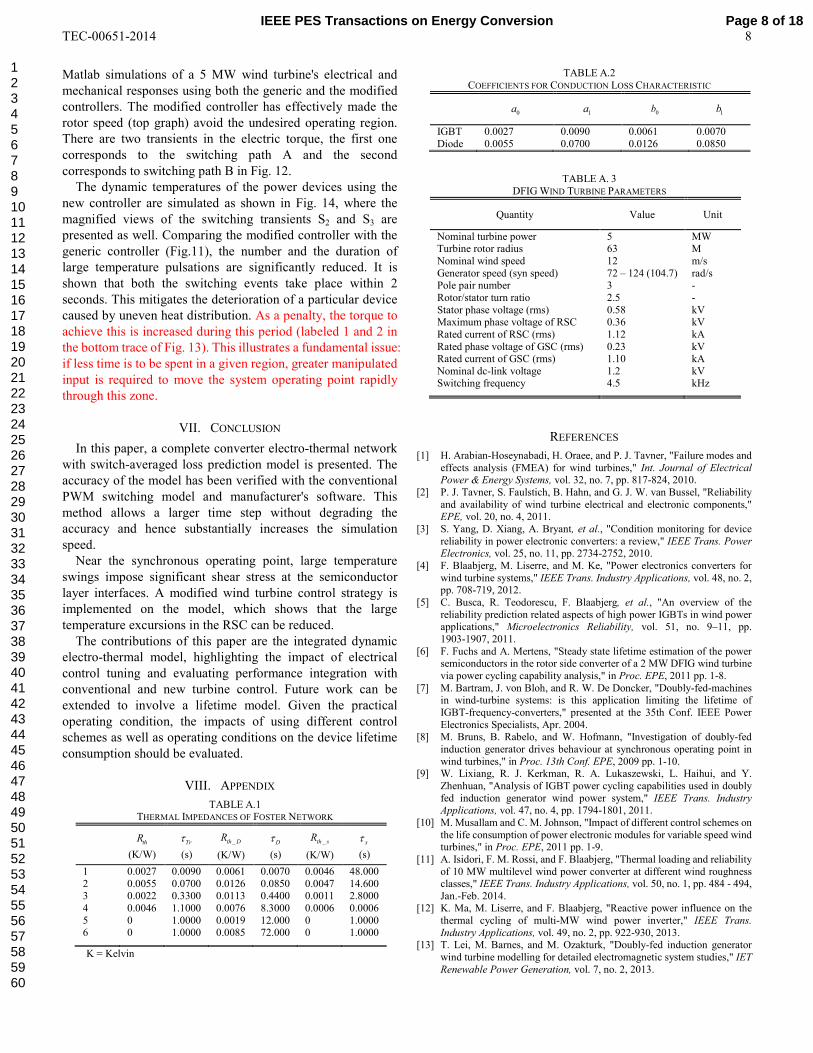
A. Dynamic System Behaviors at Synchronous Speeds
The wind turbine dynamic behaviors around the synchronous
operating speed were analyzed by employing a variable wind
profile. Firstly simulations were carried out using a generic
control strategy, where the optimum electric torque
characteristic (cubic Bezier curve) was tracked. In Fig.11 the
simulation was run for 800s from 6200s (after starting up and
reaching a steady state). The top graph depicts the applied wind
profile, with 8.8m/s average speed and 10% turbulence. The
second graph shows the rotor speed variation, and the third
graph shows the temperature variations of a single phase’s
power devices and the common heat sink. It can be seen that the
heat-sink temperature is not changed significantly (1.5°C)
during the entire simulation time. Device temperature swing
reaches a peak value whenever the rotor speed passes across the
synchronous point. This is because of the slow (slip frequency)
currents flowing in the rotor side converter. A magnified view
of the first selected zone S1 is shown in the bottom graph of Fig.
11, which allows a more detailed observation. The upper IGBT
and lower diode, which in this particular case conduct more
current, are subjected to more thermal stresses than the other
devices. This uneven heat distribution lasts about 10s with the
largest temperature excursion rising above 15°C.
(a)
(b)
Fig.10 Electro-thermal behaviors during grid fault, (a) DFIG converter control
strategy, (b). Currents and temperatures in a 40% grid voltage drop.
Fig.11. System dynamic responses under 10% wind turbulence using the
generic controller. Lowest trace is a magnification of S1 zone in third trace down
Page 6 of 18IEEE PES Transactions on Energy Conversion
123456789101112131415161718192021222324252627282930313233343536373839404142434445464748495051525354555657585960
TEC-00651-2014
7
B. Enhancement through a Modified Controller
A modified control strategy is introduced to this model that
regulates the wind turbine to avoid long-period operation near
the synchronous speed. A similar method was introduced in [28]
to prevent the excitation of structural resonance. The method
used in [28] has been adapted and structured to avoid the
undesirable operating point around synchronous speed for
extended operation, to avoid the protracted thermal cycling
which would result. As shown in Fig.12, the generic torque
optimum curve will be interrupted around the synchronous
point (104.7rad/s). The wind turbine will track the new curve
A1 – A5 when the rotor speed is rising from below synchronous
to above synchronous speed and B5 – B1 when speed is
decreasing. The purpose is to avoid a range of set frequencies
(with a range of approximately 1.4 Hz slip frequency) during
the wind turbine's normal operation. The set frequencies are
used as demonstration to show the effectiveness of
implementing this method. As seen in the Fig.12, when the
wind speed increases from 8m/s to 9m/s, the whole control
process involves four procedures: from A1 to A2, the electric
torque demand increases quickly, counteracting the rotor
speed's acceleration; when it exceeds the peak value (A2), the
torque demand will drop quickly to assist with the rotor speed's
acceleration; from A3 to A4, the slope reduces to avoid a large
overshoot; from A4 to A5, the torque demand converges with
the mechanical torque at 9m/s wind and a new balance point is
established. Similar procedures are followed when the wind
speed drops and the controller switches from B1 to B5.
When the controller is switching from A2 to A4, there will be
no problem if the wind speed is increasing, since the larger
mechanical torque will contribute to the controller switching
process. However, if the wind speed is decreasing more quickly
than the switch takes place, the corresponding mechanical
torque will drop below the electric torque, and the rotor speed
would return to a point on the curve smaller than , 2r Aω causing
chattering. One important thing to successfully implement this
strategy is that the controller needs to switch from A2 to A4 (or
B2 to B4) more quickly than the wind speed is likely to change
to avoid chattering. It is reported in [29] that the maximum rate
of change of wind speed is approximately 10
m = 0.11m/s2 for
turbulence intensities (TI) of 10%. Considering the worst
scenario, where the wind speed is decreasing from
approximately 9.5m/s ( , 2w Av ) to 8m/s or lower ( , 4w Av ), then
maximum time used for the generator speed to switch from
, 2r Aω to , 4r Aω is
, 2 , 4
10
w A w Av vt
m
−= (9)
The modified controller will force the generator speed to stay
with a defined slip frequency or to pass the critical region
quickly when the wind speed rises or drops. Fig.13 shows the
Fig.14. Dynamic temperatures of a single phase converter devices with
magnified views at two switching points S2 and S3.
Fig.12. Generic and modified wind turbine control strategies.
70 80 90 100 110 1200
0.5
1
1.5
2
2.5
3
3.5
4x 10
4
Generator Speed (rad/s)
Gen
era
tor
To
rque
(N
m)
B5
B1A1
A2
A4
B2
B4
A5A3
B3
6m/s
10m/s
9m/s
8m/s
7m/s
Topt
Fig.13. Comparison between the generic and the modified controller
performances in rotor speed, electrical and mechanical torque responses.
Page 7 of 18 IEEE PES Transactions on Energy Conversion
123456789101112131415161718192021222324252627282930313233343536373839404142434445464748495051525354555657585960
TEC-00651-2014
8
Matlab simulations of a 5 MW wind turbine's electrical and
mechanical responses using both the generic and the modified
controllers. The modified controller has effectively made the
rotor speed (top graph) avoid the undesired operating region.
There are two transients in the electric torque, the first one
corresponds to the switching path A and the second
corresponds to switching path B in Fig. 12.
The dynamic temperatures of the power devices using the
new controller are simulated as shown in Fig. 14, where the
magnified views of the switching transients S2 and S3 are
presented as well. Comparing the modified controller with the
generic controller (Fig.11), the number and the duration of
large temperature pulsations are significantly reduced. It is
shown that both the switching events take place within 2
seconds. This mitigates the deterioration of a particular device
caused by uneven heat distribution. As a penalty, the torque to
achieve this is increased during this period (labeled 1 and 2 in
the bottom trace of Fig. 13). This illustrates a fundamental issue:
if less time is to be spent in a given region, greater manipulated
input is required to move the system operating point rapidly
through this zone.
VII. CONCLUSION
In this paper, a complete converter electro-thermal network
with switch-averaged loss prediction model is presented. The
accuracy of the model has been verified with the conventional
PWM switching model and manufacturer's software. This
method allows a larger time step without degrading the
accuracy and hence substantially increases the simulation
speed.
Near the synchronous operating point, large temperature
swings impose significant shear stress at the semiconductor
layer interfaces. A modified wind turbine control strategy is
implemented on the model, which shows that the large
temperature excursions in the RSC can be reduced.
The contributions of this paper are the integrated dynamic
electro-thermal model, highlighting the impact of electrical
control tuning and evaluating performance integration with
conventional and new turbine control. Future work can be
extended to involve a lifetime model. Given the practical
operating condition, the impacts of using different control
schemes as well as operating conditions on the device lifetime
consumption should be evaluated.
VIII. APPENDIX
REFERENCES
[1] H. Arabian-Hoseynabadi, H. Oraee, and P. J. Tavner, "Failure modes and
effects analysis (FMEA) for wind turbines," Int. Journal of Electrical Power & Energy Systems, vol. 32, no. 7, pp. 817-824, 2010.
[2] P. J. Tavner, S. Faulstich, B. Hahn, and G. J. W. van Bussel, "Reliability
and availability of wind turbine electrical and electronic components," EPE, vol. 20, no. 4, 2011.
[3] S. Yang, D. Xiang, A. Bryant, et al., "Condition monitoring for device
reliability in power electronic converters: a review," IEEE Trans. Power Electronics, vol. 25, no. 11, pp. 2734-2752, 2010.
[4] F. Blaabjerg, M. Liserre, and M. Ke, "Power electronics converters for
wind turbine systems," IEEE Trans. Industry Applications, vol. 48, no. 2, pp. 708-719, 2012.
[5] C. Busca, R. Teodorescu, F. Blaabjerg, et al., "An overview of the
reliability prediction related aspects of high power IGBTs in wind power applications," Microelectronics Reliability, vol. 51, no. 9–11, pp.
1903-1907, 2011.
[6] F. Fuchs and A. Mertens, "Steady state lifetime estimation of the power semiconductors in the rotor side converter of a 2 MW DFIG wind turbine
via power cycling capability analysis," in Proc. EPE, 2011 pp. 1-8.
[7] M. Bartram, J. von Bloh, and R. W. De Doncker, "Doubly-fed-machines in wind-turbine systems: is this application limiting the lifetime of
IGBT-frequency-converters," presented at the 35th Conf. IEEE Power
Electronics Specialists, Apr. 2004. [8] M. Bruns, B. Rabelo, and W. Hofmann, "Investigation of doubly-fed
induction generator drives behaviour at synchronous operating point in
wind turbines," in Proc. 13th Conf. EPE, 2009 pp. 1-10. [9] W. Lixiang, R. J. Kerkman, R. A. Lukaszewski, L. Haihui, and Y.
Zhenhuan, "Analysis of IGBT power cycling capabilities used in doubly
fed induction generator wind power system," IEEE Trans. Industry Applications, vol. 47, no. 4, pp. 1794-1801, 2011.
[10] M. Musallam and C. M. Johnson, "Impact of different control schemes on
the life consumption of power electronic modules for variable speed wind turbines," in Proc. EPE, 2011 pp. 1-9.
[11] A. Isidori, F. M. Rossi, and F. Blaabjerg, "Thermal loading and reliability
of 10 MW multilevel wind power converter at different wind roughness classes," IEEE Trans. Industry Applications, vol. 50, no. 1, pp. 484 - 494,
Jan.-Feb. 2014. [12] K. Ma, M. Liserre, and F. Blaabjerg, "Reactive power influence on the
thermal cycling of multi-MW wind power inverter," IEEE Trans.
Industry Applications, vol. 49, no. 2, pp. 922-930, 2013. [13] T. Lei, M. Barnes, and M. Ozakturk, "Doubly-fed induction generator
wind turbine modelling for detailed electromagnetic system studies," IET
Renewable Power Generation, vol. 7, no. 2, 2013.
TABLE A. 3
DFIG WIND TURBINE PARAMETERS
Quantity Value Unit
Nominal turbine power 5 MW Turbine rotor radius 63 M
Nominal wind speed 12 m/s
Generator speed (syn speed) 72 – 124 (104.7) rad/s Pole pair number 3 -
Rotor/stator turn ratio 2.5 -
Stator phase voltage (rms) 0.58 kV Maximum phase voltage of RSC 0.36 kV
Rated current of RSC (rms) 1.12 kA
Rated phase voltage of GSC (rms) 0.23 kV Rated current of GSC (rms) 1.10 kA
Nominal dc-link voltage 1.2 kV Switching frequency 4.5 kHz
TABLE A.2
COEFFICIENTS FOR CONDUCTION LOSS CHARACTERISTIC
0a 1a 0b 1b
IGBT 0.0027 0.0090 0.0061 0.0070
Diode 0.0055 0.0700 0.0126 0.0850
TABLE A.1 THERMAL IMPEDANCES OF FOSTER NETWORK
thR
(K/W)
Trτ
(s)
_th DR
(K/W)
Dτ
(s)
_th sR
(K/W)
sτ
(s)
1 0.0027 0.0090 0.0061 0.0070 0.0046 48.000
2 0.0055 0.0700 0.0126 0.0850 0.0047 14.600 3 0.0022 0.3300 0.0113 0.4400 0.0011 2.8000
4 0.0046 1.1000 0.0076 8.3000 0.0006 0.0006
5 0 1.0000 0.0019 12.000 0 1.0000 6 0 1.0000 0.0085 72.000 0 1.0000
K = Kelvin
Page 8 of 18IEEE PES Transactions on Energy Conversion
123456789101112131415161718192021222324252627282930313233343536373839404142434445464748495051525354555657585960
TEC-00651-2014
9
[14] J. W. Kolar, F. C. Zach, and F. Casanellas, "Losses in PWM inverters
using IGBTs," in Proc. Electric Power Applications, 1995 pp. 285-288. [15] M. H. Bierhoff and F. W. Fuchs, "Semiconductor losses in voltage source
and current source IGBT converters based on analytical derivation,"
presented at the 35th Annual Conf. Power Electronics Specialists 2004. [16] O. Al-Naseem, R. W. Erickson, and P. Carlin, "Prediction of switching
loss variations by averaged switch modeling," presented at the 15th
Annual IEEE Applied Power Electronics Conf. and Exp., New Orleans, LA, 2000.
[17] L. K. Mestha and P. D. Evans, "Analysis of on-state losses in PWM
inverters," IEE Proc. Electric Power Applications, vol. 136, no. 4, pp. 189-195, 1989.
[18] U. Drofenik and J. W. Kolar, "A general scheme for calculating switching
and conduction-losses of power semiconductors in numerical circuit simulations of power electronic systems," presented at the 5th Int. Conf.
Power Electronics, Niigata, Japan, April 2005.
[19] A. R. Hefner, "A dynamic electro-thermal model for the IGBT," IEEE Trans. on Industry Applications, vol. 30, no. 2, pp. 394-405, 1994.
[20] SEMIKRON, SKiiP 2013 GB172-4DW V3 datasheet [Online]. Available:
http://www.semikron.com/products/data/cur/assets/SKiiP_2013_GB17
2_4DW_V3_20450248.pdf
[21] P. Alemi and L. Dong-Choon, "Power loss comparison in two- and
three-level PWM converters," presented at the 8th Int. Conf. Power Electronics and ECCE Asia, Jeju, 2011.
[22] A. Wintrich, U. Nicolai, W. Tursky, and T. Reimann. (2011). Application
manual power semiconductors SEMIKRON. [Online].Available:
http://www.semikron.com/skcompub/en/SEMIKRON_Application_Man
ual_Power_Semiconductors_.pdf
[23] N. Mohan, T. M. Undeland, and W. P. Robbins, in Power electronics:
converters, applications, and design, 2nd ed USA & Canada: John Wiley & Sons, Inc., 1995, p. 205.
[24] T. Lei, M. Barnes, and A. C. Smith, "Thermal cycling evaluation for
DFIG wind turbine power converter based on joint modelling," presented at the Energy Conversion Congress and Exposition, Co. USA, 2013.
[25] P. E. Bagnoli, C. E. Casarosa, M. Ciampi, and E. Dallago, "Thermal
resistance analysis by induced transient (TRAIT) method for power electronic devices thermal characterization. I. Fundamentals and theory,"
IEEE Trans. Power Electronics, vol. 13, no. 6, pp. 1208-1219, 1998.
[26] Y. Chan-Su, P. Malberti, M. Ciappa, and W. Fichtner, "Thermal component model for electrothermal analysis of IGBT module systems,"
IEEE Trans. Electron Devices, vol. 24, no. 3, pp. 401-406, 2001.
[27] Y. C. Gerstenmaier, W. Kiffe, and G. Wachutka, "Combination of thermal subsystems modeled by rapid circuit transformation," presented
at the 13th Int. Workshop. THERMINIC, 2007.
[28] W. E. Leithead and B. Connor, "Control of variable speed wind turbines: Design task," Int. Journal of Control, vol. 73, no. 13, pp. 1189-1212,
2000.
[29] H. Sung-ho, A. Stock, and W. E. Leithead, "Controller design to avoid a range of set frequencies for a 5MW wind turbine," Industrial Control
Centre, Department of Electronic and Electrical Engineering, University
of Strathclyde, Glasgow,April, 2013.
Ting Lei received the B.Eng. and Ph.D. degrees from the
University of Manchester, Manchester, U.K in 2010 and 2014
respectively, where she is currently a research staff.
Her research interests are wind turbine modelling, control
and reliability.
Mike Barnes (M’96–SM’07) received the B.Eng. and Ph.D.
degrees from the University of Warwick, Coventry, U.K.
In 1997, he joined the University of Manchester Institute of
Science and Technology (UMIST, now merged with The
University of Manchester), Manchester, U.K., as a lecturer, and
where he is now a Professor. His research interests cover the
field of power-electronics-enabled power systems and
advanced drives.
Sandy Smith received the B.Sc. and Ph.D. degrees from
Aberdeen University, Aberdeen, U.K in 1980.
He held academic appointments at Imperial College
(1984-1990), Cambridge University (1990-97), Fellow of
Magdalene College (1990-97) and a Visiting Professorship at
Newcastle University (1998-2000). In 1997, he joined Invensys
Brook Crompton as Head of Research responsible for advanced
motor technologies. He is currently with the University of
Manchester, Manchester, U.K., where he is a Professor. His
research interests cover the field of electrical motors,
generators, drives and actuators using analytical or
computational electromagnetic methods.
Sung H. Hur received the B.Eng. degree from the University
of Glasgow and the M.Sc. degree with Distinction and the Ph.D.
from University of Strathclyde.
He is a Research Associate in the Department of Electronic
and Electrical Engineering at University of Strathclyde. His
current research interests are in control, condition monitoring
and modelling, in particular with applications to wind turbines
and farms.
Adam Stock received an MEng degree from the University of
Newcastle Upon Tyne in 2007.
After a short spell in industry, in 2010 he took on his current
role as a Research Associate with the Department of Electronic
and Electrical Engineering, University of Strathclyde,
Glasgow, U.K where he is also undertaking his PhD. His
research interests include increasing the flexibility of operation
of wind turbines and wind farms, primarily through control.
.
William E. Leithead received the B.Sc. degree in
mathematical physics and the Ph.D. degree in theoretical
physics from the University of Edinburgh, Edinburgh, U.K., in
1971 and 1976, respectively.
Currently, he is a Professor and the Director of Systems and
Control Engineering in the Department of Electronic and
Electrical Engineering, University of Strathclyde, Glasgow,
U.K. His research interests include power system dynamics and
control and integrated design of wind turbines.
Page 9 of 18 IEEE PES Transactions on Energy Conversion
123456789101112131415161718192021222324252627282930313233343536373839404142434445464748495051525354555657585960