Embed Size (px)
Citation preview

Brigham Young University Brigham Young University
BYU ScholarsArchive BYU ScholarsArchive
Theses and Dissertations
2020-04-02
Using Parallel Narrative-Based Measures to Examine the Using Parallel Narrative-Based Measures to Examine the
Relationship Between Listening and Reading Comprehension Relationship Between Listening and Reading Comprehension
Collette Leifson Warr Brigham Young University
Follow this and additional works at: https://scholarsarchive.byu.edu/etd
Part of the Education Commons
BYU ScholarsArchive Citation BYU ScholarsArchive Citation Warr, Collette Leifson, "Using Parallel Narrative-Based Measures to Examine the Relationship Between Listening and Reading Comprehension" (2020). Theses and Dissertations. 8914. https://scholarsarchive.byu.edu/etd/8914
This Thesis is brought to you for free and open access by BYU ScholarsArchive. It has been accepted for inclusion in Theses and Dissertations by an authorized administrator of BYU ScholarsArchive. For more information, please contact [email protected], [email protected].
Using Parallel, Narrative-Based Measures to Examine the Relationship
Between Listening and Reading Comprehension
Collette Leifson Warr
A thesis submitted to the faculty of Brigham Young University
in partial fulfillment of the requirements for the degree of
Master of Science
Douglas B. Petersen, Chair Christopher Dromey
Randall S. Davies
Department of Communication Disorders
Brigham Young University
Copyright © 2020 Collette Leifson Warr
All Rights Reserved

ABSTRACT
Using Parallel, Narrative-Based Measures to Examine the Relationship Between Listening and Reading Comprehension
Collette Leifson Warr Department of Communication Disorders, BYU
Master of Science
The purpose of the current study was to examine how well the Narrative Language Measure (NLM) of Listening predicts the NLM Reading measure and the extent to which brief narrative-based listening and reading comprehension assessments administered to first, second, and third grade students demonstrate symmetry and equity. A total of 1039 first graders, 395 second graders, and 501 third graders participated in this study. The students were administered the NLM Listening and NLM Reading, and their scores were examined to address the research questions. Students with incomplete data sets and students who performed 1.5 standard deviations (7th percentile based on the local dataset norms) below the mean within their respective grade using local norms on a either the first or second winter benchmark reading fluency measure were removed from the participant pool. A correlation and regression analysis indicated that the NLM Listening was weakly predictive of NLM Reading. The means and standard deviations of listening comprehension and reading comprehension were compared, with the expectation that the means from both tasks would not be significantly different. This was examined using repeated measures ANOVA. Results indicated that for the first, second, and third-grade students, while removing those who scored at or below the 7th percentile, there was a statistically significant difference between the means for both the NLM Listening Benchmark 1 and NLM Reading Benchmark 1, as well as the NLM Listening Benchmark 2 and NLM Reading Benchmark 2. An equipercentile analysis determined the first-grade students scored higher in the listening comprehension than reading, and the second and third-grade students scored higher in the reading comprehension. While the data from this study indicate that the NLM Listening is not an adequate proxy for the NLM Reading measure, this study is another step in laying a foundation that a narrative-based assessment with carefully constructed parallel forms that reflect written academic language has the potential to produce scores in listening and reading comprehension that are symmetrical and equitable, in order to justify the use of one measure as proxy for the other.
Keywords: listening comprehension, reading comprehension, narrative, first grade, second grade, third grade

ACKNOWLEDGMENTS
I express my appreciation to my committee members; Dr. Petersen, Dr. Dromey, and Dr.
Davies, who provided support and feedback throughout the process of writing this thesis. I
especially want to thank my chair, Dr. Petersen, for the countless hours spent planning,
organizing, and analyzing the data with this study. I am thankful for his passion, work ethic,
support, and flexibility to enable me to complete this project. I would also like to thank my
family and friends for their support and assistance which has allowed me to complete my
education. I am thankful for my husband whose aid and motivation have been pivotal in my
ability to push myself beyond what I thought I was capable.

iv
TABLE OF CONTENTS
TITLE PAGE ................................................................................................................................... i
ABSTRACT .................................................................................................................................... ii
ACKNOWLEDGMENTS ............................................................................................................. iii
TABLE OF CONTENTS ............................................................................................................... iv
LIST OF TABLES ......................................................................................................................... vi
LIST OF FIGURES ...................................................................................................................... vii
DESCRIPTION OF THESIS STRUCTURE AND CONTENT ................................................. viii
Introduction ..................................................................................................................................... 1
Simple View of Reading .......................................................................................................... 1
Reading Comprehension Difficulty ......................................................................................... 3
Identification of Reading Difficulty ........................................................................................ 5
Proxy Measures ....................................................................................................................... 7
Curriculum-Based Measures (CBM) Requirements .............................................................. 10
CUBED Narrative Language Measures (NLM) .................................................................... 11
Method ......................................................................................................................................... 14
Participants ............................................................................................................................ 14
Procedures .............................................................................................................................. 15
CUBED NLM Listening administration ........................................................................... 15
CUBED NLM Reading administration ............................................................................. 16
Scoring of the retell, story questions, and vocabulary questions subtests ........................ 17
Results ........................................................................................................................................... 18
Data Analysis and Entry ........................................................................................................ 18

v
Correlation and Regression Analyses .................................................................................... 19
Mean Equivalency Analysis .................................................................................................. 21
Equipercentile Analysis ......................................................................................................... 25
Discussion ..................................................................................................................................... 27
Limitations ............................................................................................................................. 32
Conclusion ............................................................................................................................. 33
References ..................................................................................................................................... 34
APPENDIX: Annotated Bibliography .......................................................................................... 37

vi
LIST OF TABLES
Table 1 Pearson Correlations Between NLM Listening Variables and NLM Reading
Benchmarks 1 and 2 for First, Second, and Third Grade ............................................21

vii
LIST OF FIGURES
Figure 1. Mean equivalency analysis for reading comprehension and listening comprehension
for first-grade students ...................................................................................................24
Figure 2. Mean equivalency analysis for reading comprehension and listening comprehension
for second-grade students ...............................................................................................25
Figure 3. Mean equivalency analysis for reading comprehension and listening comprehension
for third-grade students ..................................................................................................25
Figure 4. Equipercentile analysis for reading comprehension and listening comprehension for
first-grade students .........................................................................................................26
Figure 5. Equipercentile analysis for reading comprehension and listening comprehension for
second-grade students ....................................................................................................27
Figure 6. Equipercentile analysis for reading comprehension and listening comprehension for
third-grade students ........................................................................................................27

viii
DESCRIPTION OF THESIS STRUCTURE AND CONTENT
To adhere to traditional thesis requirements and journal publication formats, this thesis,
Using Parallel, Narrative-Based Measures to Examine the Relationship Between Listening and
Reading Comprehension, is written in a hybrid format. The initial pages of the thesis adhere to
university requirements while the thesis report is presented in journal article format. An
annotated bibliography is included in the Appendix.

1
Introduction
There are many students struggling with reading comprehension, yet reading
comprehension is not measured until the students are in their later elementary school
years. Identifying students’ reading comprehension abilities towards the end of their elementary
school years deprives struggling students of early intervention services that they should be
receiving; some have called this a ‘wait to fail’ model. It is often understood that reading
comprehension is not measured in early grades because children cannot read well enough to
demonstrate comprehension. However, it is possible that oral narrative language can be used as
a proxy measure for reading comprehension at the beginning of elementary school. In order
for oral narrative language to serve as a proxy for reading comprehension, it must be
demonstrated that oral narrative language measures the same construct as written language and
that it can have parallel outcomes to a reading comprehension task. Therefore, the purpose of
this study is to examine the extent to which narrative-based listening and reading comprehension
assessments measure symmetry and equity.
Simple View of Reading
Reading is a complex process as it requires students to learn how to decode as well as
comprehend the information they receive as they are decoding. For example, the National
Reading Panel (2000) found that there were five major emphases required for reading to develop.
Three of those fall under the umbrella of decoding (fluency, phonemic awareness, phonics) and
the latter two fall under the umbrella of comprehension (comprehension strategies and
vocabulary). In 1990, Hoover and Gough proposed the “Simple View of Reading” (SVR). The
main premise of the SVR is that decoding and linguistic comprehension are necessary for
reading comprehension and as such, reading comprehension cannot be improved by focusing

2
only on strengthening a student’s ability to decode (National Reading Panel, 2000). Decoding is
of course a necessary skill to learn in order to read, but decoding should not be the only focus of
reading instruction. A student’s ability to comprehend what they read is also vital to the
student’s reading abilities.
The premise of the SVR has garnered much attention through the years, and many studies
have been conducted to investigate the validity of the SVR as well as examine other studies that
have used the principles of the SVR in their research. Tunmer and Chapman (2012) conducted a
review to examine the SVR model and identify if there were any additional components that
should be added to the model. They specifically considered the possibility of adding the
components of vocabulary and fluency to the model. They found that vocabulary was included
in the linguistic comprehension portion of the SVR, and concluded that while neither vocabulary
nor fluency needed to be added specifically to the SVR model, they did suggest that the
linguistic comprehension portion be defined in a comprehensive manner, accounting for multiple
factors including vocabulary, background knowledge, and cultural influences. Their conclusion
was based on the findings that oral language comprehension influenced reading directly, and that
decoding influenced reading indirectly. Tunmer and Chapman also maintained that having a
knowledge of words played a greater role in reading comprehension than an individual’s ability
to decode a word. Consequently, they determined that children should improve their oral
language skills when they are at risk for reading comprehension difficulties rather than just focus
on their decoding skills.
As the premise of the SVR is that reading comprehension cannot be improved by merely
focusing on decoding, researchers are working to analyze additional facets of reading to
determine what components are necessary for a student to be able to comprehend what they are

3
reading, and researchers are also working to define which components of reading comprehension
are not adequately being addressed. Identifying the facets that are involved in reading
comprehension is important because there are many students who, while they can decode, are
struggling with reading comprehension. To this end, in 2018, Lonigan, Burgess, and
Schatschneider examined whether the SVR’s conclusions have changed over the years. They
concluded that the SVR model still has merit because they found that both decoding and
linguistic comprehension are important for reading comprehension, and that there was evidence
that vocabulary was more predictive for children who had a higher reading comprehension skill
compared to those who had a lower reading comprehension skill.
Furthermore, in 2011, Roch, Florit, and Levorato conducted a study in which they
attempted to identify if skills in listening comprehension rather than reading skills could predict
how well an individual may develop their reading comprehension skills. They found that while
listening comprehension did correlate with reading comprehension, there did not appear to be a
strong correlation between decoding and reading comprehension. Thus, they found that
decoding skills were independent of listening comprehension and reading comprehension, and
that reading comprehension was influenced by listening comprehension.
Reading Comprehension Difficulty
Many students struggle to understand what they read. For example, 65% of fourth
graders in the U.S. read below grade level and approximately 80% of those fourth graders who
are culturally and linguistically diverse read below grade level (National Assessment of
Educational Progress [NAEP], 2017, 2019). The students’ reading levels are likely so low
because of their difficulty understanding what they read. This is illustrated in the findings of the
NAEP in 2002 when they found that 75% of students read with higher than 95% accuracy on
4
their fluency reading assessments. Fluency reading, in this case, is directly measuring their
decoding abilities. Also, the NAEP oral reading study (2002) indicated that 97% of fourth-grade
students were reading with 95% accuracy or higher. Additionally, in a study by Nakamoto,
Lindsey, and Manis (2006), it was reported that while the students were able to decode words at
grade level, it was their reading comprehension abilities that reduced their overall performance.
In other words, when the demands of more complex comprehension were required, the students
struggled. Nakomoto et al. followed decoding and comprehension in 303 students, and they
found that reading comprehension abilities declined as the children got older. These authors
found that 80% of the students they studied scored below grade level in reading, and
they concluded that many of those students have difficulty with understanding the specific
academic language presented to them in written text, as comprehension of the academic language
was not primarily a decoding issue.
A study conducted by Mancilla-Martinez and Lesaux (2011) looked at Spanish-speaking
students who were learning English. They attempted to analyze the patterns of development of
these students’ word reading and oral language skills and compared these student’s growth to the
national norms in each language. Mancilla-Martinez and Lesaux found that the students’
vocabulary skills in English averaged below the mean, and while their Spanish decoding skills
were close to the national norms, their oral language skills averaged two or more standard
deviations below the mean. Overall, Mancilla-Martinez and Lesaux found that while these
students were increasing in their decoding of both Spanish and English, they maintained a
discouragingly slow pace for oral language development.
5
Identification of Reading Difficulty
Even though studies are showing that students are struggling with reading
comprehension, it is important to note that reading comprehension is not usually measured at the
state or national level until third or fourth grade as stated by the National Assessment of
Educational Progress (2019). According to the English and Language Arts Common Core
Standards (2019), grades K-5 are instructed in decoding patterns as the way to improve reading
abilities. This means that while teachers may know how their students are decoding in the
younger grades, they do not know how well their students are comprehending what they read.
By not targeting reading comprehension early, this has a negative effect particularly on
students such as difficulty understanding material presented in class, assignments, doing poorly
on tests and other assessments that use language. Students with reading comprehension
difficulties who are also learning English as a second language may struggle even more than the
native English speaker. Early universal identification of students who struggle to understand
what they are reading and providing early intervention for those who do have reading
comprehension difficulties are needed to help these students be successful in their academics.
Therefore, we need a way to identify those students who are potentially at risk for
difficulties with reading comprehension. We realize that students who are beginning their
academic career are only just learning to read. As such, it can be difficult to measure their
reading comprehension as they often struggle to simply decode what they are reading. To
quickly identify if these early school-age children are at risk for poor reading comprehension, we
have to turn to another construct rather than decoding.
According to a study conducted by Catts, Nielsen, Bridges, and Liu (2016) we can use
language measures to identify students who may struggle with reading comprehension at a much

6
earlier age than is currently the case. For their study, Catts et al. wanted to find if measures of
language ability and/or a student’s response to language intervention in kindergarten would
predict if and what reading comprehension difficulties the student may struggle with in the third
grade. They studied 366 kindergarten children from a medium sized school district that was
diverse in ethnicity and socioeconomic status. At the beginning of their study, 19% of the
kindergarteners met the “at risk” criteria for reading difficulties. All participants were presented
with a screening battery which tested letter knowledge, phonological awareness, rapid
automatized naming, nonword repetition, vocabulary, grammar, and narration. Participants were
assigned to either an intervention condition or an at-risk control condition for intervention. Catts
et al. found that the language measures significantly predicted the student’s reading
comprehension abilities at the end of third grade, although it should be noted that the
contributions were relatively small.
Furthermore, Catts, Adlof, and Weismer (2006) obtained information on the listening
comprehension and decoding skills of 182 kindergarten students. They measured listening
comprehension using the Peabody Picture Vocabulary Test-R (PVT-R; Dunn & Dunn, 1981), the
Clinical Evaluation of Language Fundamentals-3 (CELF-3; Semel, Wiig, & Secord, 1995), and
the Test of Oral Language Development-P:2 (TOLD-P:2; Newcomer & Hammill, 1988).
Listening comprehension and decoding were measured again when students were in second,
fourth, and eighth grades. The researchers found that children who had listening comprehension
difficulties in kindergarten, second, and fourth grade were also found to have reading
comprehension deficits in eighth grade. Thus, listening comprehension abilities may be a
predictor of a student’s reading comprehension abilities. Similarly, Nation, Cocksey, Taylor,
and Bishop (2010) in a longitudinal study with 242 participants found that those who had

7
adequate decoding skills but reading comprehension difficulty at age 8 also had weaker listening
comprehension at ages 5, 5;6, 6, and 7.
In 1990, Hoover and Gough studied 254 bilingual students in first, second, third, and
fourth grade. They investigated the correlation between listening and reading comprehension.
The researchers had the children listen to a passage and then answer questions, followed by
reading a parallel passage and then answering additional questions. For the first-grade students,
there was a moderate correlation (r = .46) between the two parallel forms, and for the second,
third, and fourth-grade students they found strong correlations (r = .71, .80, and .87) between the
two forms, further illustrating that listening comprehension tasks may be used to measure a
student’s reading comprehension. Hoover and Gough hypothesized that the moderate correlation
between the listening and reading comprehension with the first-grade students was due to
decoding confounds.
Proxy Measures
In order to use listening comprehension in younger students as a way to identify potential
reading comprehension difficulties, the language measures used will need to reflect the same
construct as reading comprehension, or the comprehension of written academic language. In
other words, the oral language needs to reflect written academic language. Narratives have the
potential to bridge the gap between oral and written academic language. Narratives have this
potential as they are used by children from the earliest years to convey wants and needs. In a
study performed by Paris and Paris (2003), they noted that narratives involve strategic processes
such as making inferences, backtracking, summarizing, identifying the main idea(s), predicting,
and monitoring skills, which are all necessary for adequate comprehension of a text. Paris and
Paris also found that narratives encourage learning of perspective taking, theory of mind, and

8
story grammar elements which are important to understand academic language. In their
conclusion, Paris and Paris stated that narrative tasks (picture walk, retelling, and comprehension
questions) appear to be useful quantitative measures of young children’s narrative
comprehension. Even with these findings, before we can use oral narrative language
comprehension as a proxy for reading comprehension, we also need to show that oral listening
comprehension can be reflective of reading comprehension and have technical adequacy as a
universal screener and progress monitoring tool.
Recommendations from Catts et al. (2006) and Paris and Paris (2003) suggest that
schools need more effective methods to assess the oral language skills of students so that earlier
identification of reading comprehension problems can be detected, and preventative intervention
that promotes comprehension can be deployed. To actualize these implications we must
have efficient, valid, and reliable assessment tools of listening comprehension that can be
administered to a large number of students and that measure an equivalent construct to reading
comprehension. These listening comprehension assessments need to feature the same complex
language that children are required to understand when reading.
When considering a progress monitoring tool to assess children’s comprehension at an
earlier age, it must be stated that when using a progress monitoring tool, educators are looking to
document a student’s progress over time rather than comparing a student’s performance against
their peers on a normal distribution. Therefore, educators want a student’s performance on the
progress monitoring assessment to be at the high end of the distribution. Scores such as these
create a negative skew close to the ceiling. Similarly, when students are given a progress
monitoring assessment at the beginning of the school year before instruction has begun, many
often perform poorly, thus creating a skewed distribution. When scores collect around the

9
bottom or the top of a distribution and are not in alignment with the normal curve, it can cause
issues with correlation analysis because correlation requires variance and when little variance is
found the correlation is deemed insignificant which can be an inaccurate representation of the
reliability of the assessment.
A second issue arises when educators rely on the traditional correlation analyses to
identify the reliability of progress monitoring assessments. This issue comes about as progress
monitoring assessments focus on raw values of scores, and not just whether scores are correlated.
For example, three different students could receive scores of 8, 9, 12 correct out of a 20
point test, and then score 16, 18, and 20 correct on a second administration. The test-retest
correlation would be 1.0 or a perfect correlation coefficient indicating the test is reliable, but the
students’ scores have changed significantly implying that the interpretation is incorrect. The
opposite situation could also occur in which a weak correlation may state that a test is not
reliable; however, when looking at the raw scores from both test administrations, they are
consistent. As such, with the issues of the distribution of scores, and the interpretation of the
tests, simply relying on correlations is not the best method to establish reliability.
In addition to reliability requirements, and showing that both tests measure the same
construct, it would be important to show that an oral language task is significantly predictive of a
reading comprehension task, which can be demonstrated through regression analysis.
Furthermore, there are three specific conditions that reveal the extent to which two different tests
are equivalent (Holland & Dorans, 2006). There are equating procedures that provide evidence
of equivalency between two test forms. When there is strong evidence of equivalency this means
that two tests are interchangeable. First, both tests need to be symmetrical in order for the tests
to be used interchangeably. Symmetry is evidenced by examining means and equipercentiles.
10
Second, the two tests must be equitable, which indicates that they are similar in difficulty for
students with a range of ability levels. Mean and equipercentile analyses can also provide
evidence of equity. Third, tests need to demonstrate population invariance. This is when
evidence shows that two tests yield equivalent scores and assess the same construct across and
within diverse populations.
Curriculum-Based Measures (CBM) Requirements
Using curriculum-based assessments allows professionals to use items that a student will
be learning to determine if the student has learned that practice. According to Deno (1993,
2003), curriculum-based measures (CBM) have specific procedures in place to measure a
student’s growth which are different from assessments that examine a student’s mastery of a
skill. CBMs have technical adequacy; therefore, if a progress monitoring system meets CBM
requirements, the progress monitoring tool can then be a valid way to examine a student’s
continued performance. According to Petersen and Stoddard (2018), narrative language progress
monitoring tools can meet the CBM requirements of validity as narrative language is
decontextualized, which requires the storyteller to describe all the elements of a narrative such as
the characters, problems, reactions, and solutions, in such a way that the listener can
appropriately comprehend the narrative. Furthermore, Petersen and Stoddard found that Speech
Language Pathologists select narrative language tasks as a way to monitor their students’
progress because by using narratives the students are able to use language in a more natural
context. Narratives may be particularly beneficial as they require students to understand the
academic language in order to understand the story grammar concepts, as well as to produce
them in a way that is easily understood by their peers, families, and teachers.

11
There are specific requirements that must be met for a narrative-based general outcome
measure to be administered to a large population of students. In addition to strong evidence of
validity and reliability, the general outcome measure must assess a functionally relevant
construct. It must also have alternate forms as indicated through equating analyses, efficient and
standardized administration and scoring, and must be sensitive to growth over time (Deno, 1993,
2003). By meeting these specific requirements, there can be greater confidence that the results
of an oral language narrative-based general outcome measure could be used as a proxy for a
reading comprehension measure.
While Hoover and Gough (1990), and Tunmer and Chapman (2012) have conducted
studies examining the relationship between written and oral language using parallel forms, they
did not include a narrative-based approach to measure comprehension. It is possible that the
inclusion of a narrative retell task with inferential word learning and story comprehension
questions may more accurately characterize the ability to understand and use grade-level,
complex academic language, yet more research is needed (Reed & Vaughn, 2012).
CUBED Narrative Language Measures (NLM)
Petersen and Spencer (2012, 2016) have developed the CUBED Narrative Language
Measures (NLM), a narrative-based CBM designed for universal benchmark screening and
progress monitoring of oral and written language comprehension. The CUBED contains
standardized, criterion referenced measures of listening and narratives with parallel forms.
These listening and narrative measures can be used for universal screening and progress
monitoring. Within each measure and parallel form of the NLM are a personal-themed story that
contains relevant content for young students. The protocol of each measure has the student listen
to or read a short story and then retell the story. The administrator learns of the student’s

12
capacity to not only understand complex, academic oral and written language, but also to use
complex, academic language. Students may also be asked questions about the story’s content,
and inferential questions about word meanings is addressed. Each measure of the NLM form
takes only a few minutes to administer and score.
Each of the parallel forms of the NLM has evidence of both reliability and validity as the
NLM follows Deno’s (1993, 2003) criteria for general outcome measurement, which specify the
importance of reliability, validity, efficiency, effectiveness, parallel forms, and easy
administration and scoring. Since 2010, the NLM has been scrutinized for technical adequacy in
terms of universal screening and progress monitoring (Petersen & Spencer, 2012,
2016; Pettipiece & Petersen, 2013). In the CUBED manual, Petersen and Spencer (2012, 2016)
have included evidence of the reliability and several areas of validity such as concurrent
criterion-reference validity, indexes of sensitivity and specificity, predictive criterion-related
validity, and other sources of evidence of construct validity.
In 2016, Petersen and Spencer conducted initial psychometric examinations of the NLM.
For real-time inter-rater reliability, they had 65 examiners independently score 378 narrative
retells from 461 preschool and school-age children with less than 1 hour of training. The mean
point-to-point inter-rater reliability was 95% for the real-time narrative retell scores, 96% for
story questions, and 82% for vocabulary questions.
Each of the six benchmark stories used for the NLM Listening, and six used for the NLM
Reading were created to be parallel forms of each other as far as difficulty and complexity levels.
An additional 16 stories for each NLM Listening and NLM Reading are available for use as
progress monitoring tools per grade. The stories have identical story grammar elements
including setting, problem, internal responses, attempts, consequences, and resolution (Petersen

13
& Spencer, 2012). The stories also contain the same academic language features at each grade
level such as causal subordination, adverbs, adjectives, dialogue, and vocabulary (Petersen
& Spencer, 2012). Each model story was also equated using the Lexile readability index (Lexile
Framework for Reading, 2014), with each second-grade story written to yield a Lexile score of
approximately 600 (range 590-610), and each third-grade story written to yield a Lexile
readability index of approximately 760 (range 750-770), in alignment with current academic
standards (National Governors Association Center for Best Practices, Council of Chief State
School Officers, 2010). This careful alignment between the NLM Listening and the NLM
Reading ensures that they are measuring a similar construct.
The additional forms of the NLM Listening and Reading measures are designed to have
parallel validity within and across subtests. The validity can be assessed through the rubric used
to write each story, the Lexile scores assigned, and the mean length of utterance (MLU) for each
story. The evidence for the parallel forms was also calculated through a mean correlation
coefficient of .68 calculated from NLM Listening retells from 3,658 students. However, more
research is needed to examine the extent to which the NLM Listening is predictive of the NLM
Reading and that the two measures are also parallel. To date, no research has investigated
whether the NLM Listening comprehension measure is predictive of the NLM Reading
comprehension measure. Also, it is unclear whether these assessments, which can function as
general outcome measures (Deno, 2003), meet equivalency expectations (Holland
& Dorans, 2006). This predictive evidence and evidence of equivalency between the oral
narrative language and reading comprehension measures, demonstrated through regression,
equity, symmetry, and population invariance, would indicate that the oral narrative listening
measure could be used as a proxy measure for reading comprehension for young students who

14
cannot yet read. The purpose of this study was to specifically investigate the predictive validity
of an oral narrative language measure for reading comprehension and to investigate the
symmetry and equity of the oral language (listening) and reading comprehension measures for a
large sample of students from across the U.S. The following questions were investigated: a)
How well does the NLM Listening measure predict the NLM Reading measure? and b) To what
extent do brief narrative-based listening and reading comprehension assessments administered to
first, second, and third-grade students demonstrate symmetry and equity?
Method
Participants
A total of 1039 first graders, 395 second graders, and 501 third graders participated in
this study. The students were from 40 elementary schools across the U.S. and Canada. Fourteen
schools were from Wyoming, 2 Utah, 1 Nevada, 2 Arizona, 1 Wisconsin, 1 Washington, 7
Minnesota, 1 South Carolina, 6 Illinois, 1 Virginia, 1 Nebraska, 1 Oklahoma, and 2 British
Columbia. The data were collected from the years 2015-2020. The students were administered
the NLM Listening and NLM Reading, and their scores were examined to address the research
question. Students with incomplete data sets and students who performed 1.5 standard
deviations (7th percentile based on the local dataset norms) below the mean within their
respective grade using local norms on a either the first or second winter benchmark reading
fluency measure were removed from the participant pool. For first grade, the 7th percentile was
correct words per minute (CWPM) of 15. For second grade the 7th percentile was a score of 24.
For third grade the 7th percentile was a score of 43 CWPM. This cut-off for reading fluency
(both rate and accuracy) was used to control for students’ automaticity of word reading.

15
Students performing 1.5 standard deviations below the mean on local norms was considered to
have reading fluency difficulty that would potentially interfere with reading comprehension.
Procedures
The CUBED assessment was administered from 2015 to 2020 to first through third-grade
students across the U.S. and Canada primarily by SLPs. On-site training was provided for some
of the examiners, yet several examiners downloaded the CUBED and administered the tests
without direct training or supervision. Videos and other online training materials, in addition to
the CUBED manual, were available to all examiners. Examiners administered the CUBED by
either downloading and printing the forms or by using the Insight data system. Insight allows for
the digital administration of the CUBED and automatically records the students’ scores. To
assess both listening and reading comprehension in the current study, two NLM Listening forms
and two NLM Reading benchmark forms were administered.
CUBED NLM Listening administration. For the administration of the NLM Listening,
the examiner followed standardized procedures. Based on the script, the examiner said, “I am
going to tell you a story. Please listen carefully. When I am done, you are going to tell me the
same story. Are you ready?” The examiner read the model story word for word at a moderate
pace with normal inflection. When the examiner finished reading the story, they said, “Thanks
for listening. Now you tell me that story.” This began the Retell subtest. If a student was
hesitant to retell the story, the examiner encouraged the student by saying “It is OK, just do your
best.” or “I cannot help you, but you can just tell the parts you remember.” Only these two
prompts were allowed while the student retold the story. As the student retold the story, the
examiner scored the student’s narrative for story grammar and language complexity (see scoring
of the subtests following administration outlines). When the student finished retelling the story,

16
the examiner asked six comprehension questions about the story, providing data for the Story
Questions subtest. These questions were designed to assess recall of specific information related
to story grammar (i.e., character, setting, problem, feeling, attempt, consequence, and end
feeling) and one question asked students to infer what the character would do in a similar,
hypothetical situation in the future. Once the student answered all of the story questions, the
examiner asked questions about three less common words in the story, providing data for the
Vocabulary Questions subtest. The vocabulary questions were inferential in nature, with context
clues planted in the stories to help the students infer the meaning of each word. If students were
unable to infer the word’s meaning, the examiner then asked a follow up, forced choice question.
When the Retell, Story Questions, and Vocabulary Questions subtests were completed, the
administration procedures started over with the second form so that both NLM Listening forms
were administered in a single session. Sessions lasted 5-7 minutes.
CUBED NLM Reading administration. For the NLM Reading, the student was asked
to read the passage out loud instead of the examiner reading the story to the students. To
administer the NLM Reading, an examiner placed a written story in large print in front of the
student and said, “Please read this out loud. Do your very best reading. I will help you if you
need it. When you are done I might ask you to tell me the story.” The examiner either covertly
started a timer or clicked on the digital timer in the Insight system when the student began
reading the first word of the story. While the student read the story, the examiner followed along
using the NLM Reading record sheet. The examiner either clicked on or put a slash ( / ) through
words decoded incorrectly. If a student failed to decode a word within 3 seconds, the examiner
told the student the word and marked a slash through it. The examiner inconspicuously placed a
bracket ( ] ) after, or clicked on, the last word read in 1 minute, but the student’s reading was not

17
interrupted so that the student could continue to read the entire story. Self-corrections within 3
seconds, repetitions, and insertions were not considered errors. Decoding Fluency subtest scores
were calculated by subtracting the total number of errors from the total number of words read in
one minute. When the student finished reading the entire story, the examiner removed the
passage from in front of the student and initiated the Retell subtest by saying, “Thanks for
reading. Now you tell me that story.” The administration procedures for the Retell, Story
Questions, and Vocabulary Questions for the NLM Reading were exactly the same as described
above for the NLM Listening.
Scoring of the retell, story questions, and vocabulary questions subtests. The scoring
procedures of the Retell, Story Questions, and Vocabulary Questions subtests were identical to
the scoring procedures of the NLM Listening and the NLM Reading assessments. To score the
Retell subtest, examiners listened to the student’s retelling of the story and, in real time, used the
scoring section on the record sheet to rate the student’s inclusion and completeness of each story
grammar element. In the formal NLM administration procedures, examiners are allowed to
audio record student responses and then refer back to the recording if needed. Two points were
awarded for elements that were complete and clearly present in the student’s story. If the student
included an incomplete or unclear element, it was awarded only one point. No points were
awarded for story grammar elements that were not present in the student’s story. Because the
problem, attempt, consequence, and ending are the most essential story grammar elements for a
minimally complete episode, those elements are highlighted on the scoring rubric. When a
student earned two points on a combination of those story grammar elements, they were given
additional points in the episode scoring section, depending on the combination of complete and
clearly present elements. To score the language complexity section, specific words that mark

18
subordination (i.e., because, so that, when, after) were worth one point for each use up to three
points. Following the same general guidelines of complete and clear or incomplete and unclear,
the answers to the items in the Story Questions subtest were scored on a 0-2 scale. For the
Vocabulary Questions subtest, correct and clear definitions earned three points, and unclear but
mostly correct definitions earned two points. If the forced choice question had to be asked, the
correct answer was worth one point and the incorrect answer was worth zero points. For the
first, second, and third grade NLM Retell subtests there were a total of 28, 47, and 53 points
possible (sum of story grammar, language complexity, and episode scoring sections)
respectively. For the Story Questions subtest there were 12 total points possible for first grade
and 14 possible points for second and third grade. For the Vocabulary Questions subtest there
were 6 points possible for the first grade, 9 for the second grade, and 12 for the third grade.
Results
Data Analysis and Entry
In order to examiner whether the NLM Listening was predictive of the NLM Reading, we
conducted a correlation and regression analysis using the NLM subtests as predictor variables.
We examined the R2 statistic to determine how much variance was accounted for.
The means and standard deviation for listening comprehension and reading
comprehension were also compared, with the expectation that the means from both tasks would
not be significantly different. This was examined using repeated measures ANOVA without a
between subjects analysis. Concluding that two measures are parallel based on mean scores
alone ignores the possibility that there could be differences in means between tests across the
distribution of scores, whereas equipercentile equating does not assume this consistency. Raw
scores were examined for each grade level using an equipercentile analysis. This analysis was

19
conducted to determine whether the mean scores on the listening comprehension task were
equivalent to mean scores on the reading comprehension task at every fifth percentile interval.
Students who scored at or below the 7th percentile in reading fluency for each grade level were
removed from the analyses.
Because the NLM is composed of the Retell, Story Questions, and Vocabulary Questions
subtests, a composite score was calculated to reflect overall performance on the NLM measures.
To obtain composite listening comprehension and composite reading comprehension scores, the
highest raw scores from any of the two NLM Listening and any of the two NLM Reading Retell,
Story Questions, and Vocabulary Questions subtests were added together. The highest score
from the Decoding Fluency subtest was used to represent oral reading fluency in terms of
automaticity in identifying words while reading; these fluency scores were used to control for
decoding performance. The data were examined as to whether they met the assumptions for the
correlation and regression analyses and repeated measures ANOVA, including an investigation
of missing data, meaningful outliers (i.e., +/- 3 SDs from the mean), and linearity and
homeoscedasticity. Data were analyzed using the Statistical Package for Social Sciences (SPSS
version 24.0; IBM Corp., 2016).
Correlation and Regression Analyses
For first grade, the story grammar and total scores from NLM Listening Benchmark 1
and 2 were significantly correlated with both NLM Reading Benchmarks, and the Episode score
from Benchmark 2 was significantly correlated with NLM Reading Benchmark 2 (Table 1). For
first grade, a multiple regression analysis was conducted using the NLM Listening total
Benchmark 1 and 2 variables in a single model as predictors for the NLM Reading Benchmark 1
and then for the NLM Reading Benchmark 2. There was a significant relationship to NLM

20
Reading Benchmark 1, F(2, 534) = 5.01, p = .007. The R2 was .02, indicating that approximately
2% of the variance was accounted for. There was a significant relationship to NLM Reading
Benchmark 2, F(2, 440) = 7.06, p = .001. The R2 was .03, indicating that approximately 3% of
the variance was accounted for.
Also, based on the correlation analysis, story grammar and episode variables from the
NLM Listening Benchmarks 1 and 2 were entered as a single model to predict NLM Reading
Benchmark 1 and then for the NLM Reading Benchmark 2. For NLM Reading Benchmark 1,
there was a significant relationship F(4, 533) = 3.09, p = .016. The R2 was .02, indicating that
approximately 2% of the variance was accounted for. For NLM Reading Benchmark 2, there was
a significant relationship F(4, 438) = 5.90, p < .001. The R2 was .05, indicating that
approximately 5% of the variance was accounted for.
For second grade, the total score from NLM Listening Benchmark 2 was significantly
correlated with NLM Reading Benchmark 2 (Table 1). For second grade, a regression analysis
was conducted using the NLM Listening Total Benchmark 2 variable as the predictor for the
NLM Reading Benchmark 1 and then for the NLM Reading Benchmark 2. There was no
significant relationship to NLM Reading Benchmark 1, F(1, 208) = 1.83, p = .18. The R2 was
<.01. There was a significant relationship to NLM Reading Benchmark 2, F(1, 204) = 4.82, p =
.03. The R2 was .02, indicating that approximately 2% of the variance was accounted for.
For third grade, none of the NLM Listening variables were significantly correlated with
the NLM Reading Benchmarks (Table 1). Because there were no significant correlations, a step-
wise multiple regression analysis was conducted to identify the strongest NLM Listening
predictor variables. There were no variables that yielded a significant relationship to NLM

21
Reading Benchmark 1, F(12, 360) = 1.67, p = .07. The R2 was .05. There also no significant
relationship to NLM Reading Benchmark 2, F(12, 335) = 1.55, p = .10. The R2 was .05.
Table 1
Pearson Correlations Between NLM Listening Variables and NLM Reading Benchmarks 1 and 2 for First, Second, and Third Grade
NLM Listening Variables First Grade Second Grade Third Grade
Reading B1 Reading B2 Reading B1 Reading B2 Reading B1 Reading B2
Story Grammar B1 0.113*** 0.170*** * * * *
Total Listening B1 0.113*** 0.136*** * * * *
Story Grammar B2 0.145*** 0.212*** * * * *
Episode B2 * 0.105** * * * *
Total Listening B2 0.131*** 0.175*** * 0.152** * *
Note. B1 = NLM Benchmark 1. B2 = NLM Benchmark 2. * No Significance. ** Significant at 0.05. *** Significant at 0.01. Mean Equivalency Analysis
To determine if oral narrative and reading measures are symmetrical and equitable, the
means and standard deviations between oral narrative language and reading comprehension were
examined using repeated measures ANOVA. A repeated measures ANOVA was conducted to
determine whether there were statistically significant differences in mean scores between the
total scores of NLM Listening Benchmark 1 and NLM Reading Benchmark 1 and NLM
Listening Benchmark 2 and NLM Reading Benchmark 2. The repeated measures ANOVA was
conducted instead of a paired-samples t-test in order to obtain partial eta squared effect sizes.
For the partial eta squared effect sizes it was determined that .01 was a small effect size, .06 was
a medium effect size, and .14 was a large effect size.
For the first-grade students, assumptions for the repeated measures were analyzed and
met. The n (or number of students) for Benchmark 1 was 623 and the n for Benchmark 2 was

22
443. Again, these numbers have removed students with reading fluency scores of 15 or lower
(7th percentile). For NLM Listening Benchmark 1 and NLM Reading Benchmark 1 results
indicated that there was a statistically significant difference between the means, F(1, 622) =
279.91, p < .001; Wilk’s Λ = .69, partial η2 = .31. The mean for the NLM Listening Benchmark
1 was 18.54 (SD = 2.14) and the mean for the NLM Reading Benchmark 1 was 14.58 (SD =
5.76). For NLM Listening Benchmark 2 and NLM Reading Benchmark 2 results indicated that
there was a statistically significant difference between the means, F(1, 442) = 549.07, p < .001;
Wilk’s Λ = .45, partial η2 = .55. The mean for the NLM Listening Benchmark 2 was 18.48
(SD = 2.11) and the mean for the NLM Reading Benchmark 2 was 12.82 (SD = 5.01).
When first grade students’ reading fluency was at or below the 40th percentile, which
was a score of 35 or lower CWPM, there was still a significant difference between NLM
Listening Benchmark 1 and NLM Reading Benchmark 1 F(1, 442) = 550, p < .001; Wilk’s Λ =
.72, partial η2 = .28. The mean for the NLM Listening Benchmark 1 was 18.63 (SD = 1.88) and
the mean for the NLM Reading Benchmark 1 was 15.19 (SD = 5.45). There was still a
significant difference between NLM Listening Benchmark 2 and NLM Reading Benchmark
2 F(1, 408) = 479.54, p < .001; Wilk’s Λ = .46, partial η2 = .54. The mean for the NLM
Listening Benchmark 2 was 18.49 (SD = 2.13) and the mean for the NLM Reading Benchmark 2
was 13.27 (SD = 4.78).
For the second-grade students, assumptions for the repeated measures were analyzed and
met. The n for Benchmark 1 was 270 and the n for Benchmark 2 was 206. This was with
students reading fluency scores of 24 or lower (7th percentile) removed. For NLM Listening
Benchmark 1 and NLM Reading Benchmark 1 results indicated that there was a statistically
significant difference between the means, F(1, 269) = 108.39, p < .001; Wilk’s Λ = .71,

23
partial η2 = .29. The mean for the NLM Listening Benchmark 1 was 19.42 (SD = 2.70) and the
mean for the NLM Reading Benchmark 1 was 24.16 (SD = 7.17). For NLM Listening
Benchmark 2 and NLM Reading Benchmark 2 results indicated that there was a statistically
significant difference between the means, F(1, 205) = 5.59, p = .019; Wilk’s Λ = .97, partial η2 =
.03. The mean for the NLM Listening Benchmark 2 was 19.01 (SD = 2.25) and the mean for the
NLM Reading Benchmark 2 was 20.24 (SD = 7.46).
When second-grade students reading fluency was at or below the 40th percentile, which
was a score of 54 or lower CWPM, there was still a significant difference between NLM
Listening Benchmark 1 and NLM Reading Benchmark 1 F(1, 226) = 143.60, p < .001;
Wilk’s Λ = .61, partial η2 = .39. The mean for the NLM Listening Benchmark 1 was 19.44
(SD = 2.14) and the mean for the NLM Reading Benchmark 1 was 24.68 (SD = 6.24). There was
still a significant difference between NLM Listening Benchmark 2 and NLM Reading
Benchmark 2 F(1, 177) = 14.73, p < .001; Wilk’s Λ = .92, partial η2 = .08. The mean for the
NLM Listening Benchmark 2 was 19.13 (SD = 1.75) and the mean for the NLM Reading
Benchmark 2 was 21.12 (SD = 6.81).
For the third-grade students, assumptions for the repeated measures were analyzed and
met. The n for benchmark 1 was 451 the n for benchmark 2 was 348. This is with students
reading fluency scores of 43 or lower (7th percentile) removed. For NLM Listening Benchmark
1 and NLM Reading Benchmark 1 results indicated that there was a statistically significant
difference between the means, F(1, 450) = 36.17, p < .001; Wilk’s Λ = ..93, partial η2 = .07. The
mean for the NLM Listening Benchmark 1 was 20.16 (SD = 3.37) and the mean for the NLM
Reading Benchmark 1 was 22.42 (SD = 7.43). For NLM Listening Benchmark 2 and NLM
Reading Benchmark 2 results indicated that there was a statistically significant difference

24
between the means, F(1, 347) = 138.08, p < .001; Wilk’s Λ = .72, partial η2 = .29. The mean for
the NLM Listening Benchmark 2 was 19.69 (SD = 3.04) and the mean for the NLM Reading
Benchmark 2 was 24.15 (SD = 6.45).
When third-grade students reading fluency was at or below the 40th percentile, which
was a score of 92 or lower CWPM, there was still a significant difference between NLM
Listening Benchmark 1 and NLM Reading Benchmark 1 F(1, 280) = 34.14, p < .001; Wilk’s Λ =
.89, partial η2 = .11. The mean for the NLM Listening Benchmark 1 was 20.10 (SD 3.27) and
the mean for the NLM Reading Benchmark 1 was 22.88 (SD = 7.32). There was still a
significant difference between NLM Listening Benchmark 2 and NLM Reading Benchmark
2 F(1, 224) = 97.80, p < .001; Wilk’s Λ = .70, partial η2 = .30. The mean for the NLM Listening
Benchmark 2 was 19.53 (SD = 2.89) and the mean for the NLM Reading Benchmark 2 was
24.11 (SD = 6.41). Figures 1, 2, and 3 show the results of this mean equivalency analysis for the
students in graphical form.
Figure 1. Mean equivalency analysis for reading comprehension and listening comprehension for first-grade students.

25
Figure 2. Mean equivalency analysis for reading comprehension and listening comprehension for second-grade students.
Figure 3. Mean equivalency analysis for reading comprehension and listening comprehension for third-grade students.
Equipercentile Analysis
To examine symmetry and equity across the range of student performance, NLM
Listening and NLM Reading composite scores were identified for each percentile rank by
quintile. Figures 4, 5, and 6 show the results of this equipercentile analysis for the students in
graphical form. Two sets of equipercentile analysis was examined for each grade level. The first
set removed students whose fluency scores were at or below the 7th percentile, and the second

26
set removed students whose fluency scores were at or below the 40th percentile. For the first-
grade students in the first set of the analysis, listening comprehension scores were higher than the
reading comprehension scores consistently until approximately the 60th percentile, where
thereafter the scores were nearly equivalent. However, for second and third-grade students in the
first set of the analysis, they scored higher in reading comprehension than listening
comprehension consistently after the 40th percentile. For the first-grade students in the second
set of the analysis, listening comprehension scores were higher than the reading comprehension
scores consistently until approximately the 70th percentile, where thereafter the scores were
nearly equivalent. However, for second and third-grade students in the second set of the
analysis, they scored higher in reading comprehension than listening comprehension consistently
after the 30th percentile.
Figure 4. Equipercentile analysis for reading comprehension and listening comprehension for first-grade students.

27
Figure 5. Equipercentile analysis for reading comprehension and listening comprehension for second-grade students.
Figure 6. Equipercentile analysis for reading comprehension and listening comprehension for third-grade students.
Discussion
Reading comprehension is an important foundational skill that significantly impacts
learning. Even though reading comprehension is a vital part of a child’s education, it is typically
not frequently monitored until a student is in the third or fourth grade. However, there is a
possibility that oral language or listening comprehension can be used as a proxy measure for

28
reading comprehension for younger students who are at the beginning stages of learning to
decode. Before listening comprehension can be used as a proxy measure for reading
comprehension, it must be demonstrated that listening comprehension can predict performance
on reading comprehension and both listening comprehension and reading comprehension must
meet the parameters for equivalency (Holland & Dorans, 2006), and for curriculum-based
measures (Deno, 1993, 2003). The purpose of this study was to examine the predictive validity
of the NLM Listening for the NLM Reading and to determine whether those narrative listening
and reading measures are symmetrical and equitable.
Correlation and regression analyses indicated that for first grade the NLM Listening story
grammar, episode, and total score were significantly predictive of the NLM Reading measures.
For second grade, only the NLM Listening total score was significantly predictive of NLM
Reading. For third grade there were no NLM Listening variables that were significantly
predictive of NLM Reading.
A mean score comparison and equipercentile analyses provided information on symmetry
and equity. For the mean score comparison, a repeated measures ANOVA was conducted.
Results indicated that for the first, second, and third grade students, while removing those who
scored at or below the 7th percentile in reading fluency, there was a statistically significant
difference between the means for both the NLM Listening Benchmark 1 and NLM Reading
Benchmark 1, as well as the NLM Listening Benchmark 2 and NLM Reading Benchmark
2. When removing the first, second, and third-grade students who scored at or below the
40th percentile, the difference between the means of both the NLM Listening and NLM Reading
Benchmarks were also statistically significant, indicating that reading fluency was not a factor in
the differing results between the two measures.
29
Additionally, a mean percentile analysis was conducted to determine whether the mean
scores on the listening comprehension task were equivalent to mean scores on the reading
comprehension task at every 5th percentile interval. The first set of analysis removed students
whose fluency scores were at or below the 7th percentile, and the second set removed students
whose fluency scores were at or below the 40th percentile. Overall, for the first-grade students in
the first set of the analysis, listening comprehension was higher than reading comprehension, and
for the second and third-grade students in the first set of the analysis, their reading
comprehension scores were higher. Upon closer inspection, the first-grade students’ listening
comprehension scores were higher than the reading comprehension scores consistently until
approximately the 60th percentile, where thereafter the scores were nearly
equivalent. Furthermore, the second and third-grade students scored higher in reading
comprehension than listening comprehension consistently after the 30th percentile.
Similar to the first set of analyses, the first-grade students in the second set of analyses,
also achieved higher listening comprehension scores than reading comprehension scores
consistently until approximately the 70th percentile, where thereafter the scores were nearly
equivalent. Also, similar to the first set of analyses, second and third-grade students in the
second set of the analysis scored higher in reading comprehension than listening comprehension
consistently after the 30th percentile.
Listening comprehension could be higher for first, second, and third-grade students who
have weaker reading fluency because limited decoding ability likely impacts comprehension. In
fact, lower reading comprehension scores in first grade were also noted by Hoover and Gough
(1990) when they examined the relationship between reading comprehension and listening
comprehension. Hoover and Gough found a strong correlation between listening and reading

30
comprehension for the second, third, and fourth-grade students, but only a moderate correlation
between listening and reading comprehension for the first-grade students. The researchers
hypothesized that the moderate correlation was due to decoding confounds.
It is also interesting to note that reading comprehension scores were superior to listening
comprehension for second and third-grade students consistently after the 30th percentile which
could be a reflection of several different factors. There could have been an order effect because
the reading comprehension assessment was administered after the listening comprehension
assessment, but this seems unlikely due to the fact that these students were administered the
NLM Listening and Reading in the fall previously and such an effect was not noted in first-grade
students.
The higher scores on reading comprehension was likely not the result of easier reading
passages because the model stories for both the listening and reading comprehension tasks had
identical story grammar and language complexity. In fact, stories were tightly controlled across
multiple elements including having an exact story grammar structure, an identical number of
adverbs, adjectives, and subordinate clauses. Also, each story was constructed around a personal
theme that has a high probability of being universally experienced. For example, stories
concerning breaking something valuable, getting hurt, losing something or being scared are all
types of situations that most children experience throughout childhood. Some students may have
resonated better with the content of one story over another, but again, the highest score from two
administrations of the NLM Listening and the NLM Reading were taken to mitigate that
potential confound.
It is also possible, that when the students read the NLM Reading passage aloud, they
controlled their rate and prosody, which they could not control when listening to the reading
31
passages in the NLM Listening assessment. While reading, the students’ comprehension could
have also been supported by the visual representations of the passage they were
reading. Petersen and Spencer (2016) suggest that self-pacing, using personal dialect, and
prosody when reading has the potential to improve reading comprehension over listening
comprehension. This is because when students are able to read aloud at their determined pace, in
their personal dialect, with the ability to slow down or speed up, they use these factors to
facilitate comprehension. These factors are reduced or eliminated when students are listening to
a passage read by the examiner, offering them little control in the way the information is given to
them (Petersen & Spencer, 2016).
While the second and third-grade students appeared to reach a ceiling on the NLM
Listening, with scores hovering around 20, there did not appear to be such a ceiling effect with
the NLM Reading. This ceiling effect with the NLM Listening may have a connection with the
previous discussion of a student being able to control personal variables when reading out loud,
while these same variables are not in the student’s control when the examiner is reading the
passage. The ceiling effect on the NLM Listening could also be present because the examiner did
not have sufficient inflexion or suprasegmentals in order to capture the students’ attention, as
students often pay closer attention to what they read as opposed to what they hear.
An additional factor to consider would be the issue of inter-rater reliability as the
reliability of any assessment has a direct effect on the standard error of measurement. The NLM
subtests in this study scored approximately 80%-90% in inter-rater reliability which leaves room
for variation in the scores received (Petersen & Spencer, 2016); including a range around each
student’s score on the NLM Listening and the NLM Reading could account for the variation due
to the inter-rater reliability.

32
The results of this study particularly indicate that in order for the NLM Listening to be
predictive of the NLM Reading, and to achieve stronger symmetry and equity, the NLM
Listening scores should be adjusted to better reflect performance on the NLM Reading. This
means that for the second and third grades, the NLM Listening scores should be adjusted
upwards, and for first grade, the NLM Listening scores should be adjusted downwards for the
majority of students.
Limitations
In this study, there were limited descriptive data for the participants. For example,
gender, ethnicity, socio-economic status, and English language proficiency were not available.
Although there was a larger dataset available in this study, only approximately 20% of the
sample were administered both the NLM Listening and the NLM Reading. Two major factors
were involved as to whether a student was administered only one of those tests. For example, in
second and third grade, students who performed at or above the benchmark expectation for
reading comprehension as set forth in the CUBED manual were often not administered an NLM
Listening passage, because it was presumed that comprehension was in-tact. Furthermore, if a
student was administered the NLM Listening, it was typically after a student performed poorly
on the NLM Reading. For first-grade students, many examiners chose to only administer the
NLM Listening because they thought that their first graders could not decode well enough.
Examiners who were unfamiliar with the NLM administration and scoring may have had
greater difficulty scoring the first and second administration of the test and may have scored with
greater accuracy in the later administrations. This weakness in fidelity of administration and
scoring accuracy could have impacted the relationship between the listening and reading
33
passages. As reported earlier, examiners had varying levels of instruction in the administration
and scoring of the NLM.
Conclusion
With the ongoing decline in the percentage of students who are able to read at grade
level, there is continued urgency to identify students who are at risk for poor reading
comprehension at an earlier age so that early intervention services can begin. Being able to
identify those at-risk students at an early age by using a proxy measure would allow those
students to participate in intense, preventative language instruction. While the data from this
study indicate that the NLM Listening is not an adequate proxy for the NLM Reading measure,
this study is another step in laying a foundation that a narrative-based assessment with carefully
constructed parallel forms that reflect written academic language has the potential to produce
scores in listening and reading comprehension that are symmetrical and equitable, in order to
justify the use of one measure as proxy for the other.
34
References
Catts, H. W., Adlof, S. M., & Weismer, S. E. (2006). Language deficits in poor comprehenders:
A case for the simple view of reading. Journal of Speech, Language, and Hearing
Research, 49, 278–293. doi: 10.1044/1092-4388(2006/023)
Catts, H. W., Nielsen, D. C., Bridges, M. S., & Liu, Y.-S. (2016). Early identification of reading
comprehension difficulties. Journal of Learning Disabilities, 49, 451–465.
Deno, S. L. (1993). Performance in reading from content area text as an indicator of
achievement. Remedial and Special Education, 14, 47–59.
doi: 10.1177/074193259301400610
Deno, S. L. (2003). Developments in curriculum-based measurement. The Journal of Special
Education, 37, 184–192. doi: 10.1177/00224669030370030801
Dunn, L. M., & Dunn, L. M. (1981). Peabody Picture Vocabulary Test, Revised. Circle Pines,
MN: American Guidance Service.
English and Language Arts Common Core Standards. (2019). Retrieved
from http://www.corestandards.org/ELA-Literacy/
Holland, P. W., & Dorans, N. J. (2006). 6 equating test scores. Handbook of Statistics
Psychometrics, 1, 169–203. doi: 10.1016/s0169-7161(06)26006-1
Hoover, W. A., & Gough, P. B. (1990). The simple view of reading. Reading and Writing, 2,
127-160. doi:10.1007/bf00401799
Lexile Framework for Reading. (2014). Lexile Analyzer. Retrieved from http://www.lexile.com
Lonigan, C. J., Burgess, S. R., & Schatschneider, C. (2018). Examining the simple view of
reading with elementary school children: Still simple after all these years. Remedial and
Special Education, 39, 260-273. doi:10.1177/0741932518764833

35
Nakamoto, J., Lindsey, K. A., & Manis, F. R. (2006). A longitudinal analysis of English
language learners’ word decoding and reading comprehension. Reading and Writing, 20,
691-719. doi:10.1007/s11145-006-9045-7
Nation, K., Cocksey, J., Taylor, J. S., & Bishop, D. V. (2010). A longitudinal investigation of
early reading and language skills in children with poor reading comprehension. Journal
of Child Psychology and Psychiatry, 51, 1031–1039. doi: 10.1111/j.1469-
7610.2010.02254.x
National Governors Association Center for Best Practices, Council of Chief State School
Officers. (2010). Retrieved from https://www.nga.org/bestpractices/
National Assessment of Education Progress (NAEP) Report Card: Reading. (2002). Retrieved
from https://www.nationsreportcard.gov/reading/nation/scores/?grade=4
National Assessment of Education Progress (NAEP) Report Card: Reading. (2017). Retrieved
from https://www.nationsreportcard.gov/reading/nation/scores/?grade=4
National Assessment of Education Progress (NAEP) Report Card: Reading. (2019). Retrieved
from https://www.nationsreportcard.gov/reading/nation/scores/?grade=4
National Reading Panel (Historical/For Reference Only). (2000). Retrieved from
https://www.nichd.nih.gov/research/supported/nrp
Newcomer, P., & Hammill, D. (1988). Test of Language Development: Primary Second Edition.
Austin, TX: Pro-Ed.
Mancilla-Martinez, J., & Lesaux, N. K. (2011). The gap between spanish speakers’ word reading
and word knowledge: A longitudinal study. Child Development, 82, 1544-1560.
Paris, A. H., & Paris, S. G. (2003). Assessing narrative comprehension in young
children. Reading Research Quarterly, 38, 36-76.

36
Petersen, D. B., & Spencer, T. D. (2012). The narrative language measures: Tools for language
screening, progress monitoring, and intervention planning. Perspectives on Language
Learning and Education, 19, 119-129.
Petersen, D. B., & Spencer, T. D. (2016). Using narrative intervention to accelerate canonical
story grammar and complex language growth in culturally diverse preschoolers. Topics in
Language Disorders, 36, 6–19. doi: 10.1097/tld.0000000000000078
Petersen, D. B., & Stoddard, A. (2018). Psychometric requirements of oral and written language
progress monitoring assessments. Perspectives of the ASHA Special Interest Groups, 3,
180–197. doi: 10.1044/persp3.sig1.180
Pettipiece, J., & Petersen, D. B. (2013). Inter-rater reliability of scoring procedures of bilingual
children’s narratives. Poster presented at the 4th Intermountain Area Speech and Hearing
Convention. Denver, CO, October.
Reed, D. K., & Vaughn, S. (2012). Retell as an indicator of reading comprehension. Scientific
Studies of Reading, 16, 187–217. doi: 10.1080/10888438.2010.538780
Roch, M., Florit, E., & Levorato, C. (2011). Follow-up study on reading comprehension in
Down's syndrome: The role of reading skills and listening comprehension. International
Journal of Language & Communication Disorders, 46, 231-242.
doi:10.3109/13682822.2010.487882
Semel, E., Wiig, E., & Secord, W. (1995). Clinical Evaluation of Language Fundamentals—
Third Edition. San Antonio, TX: The Psychological Corporation.
Tunmer, W. E., & Chapman, J. W. (2012). The simple view of reading redux. Journal of
Learning Disabilities, 45, 453-466. doi:10.1177/0022219411432685

37
APPENDIX
Annotated Bibliography
Catts, H. W., Adlof, S. M., & Weismer, S. E. (2006). Language deficits in poor comprehenders:
A case for the simple view of reading. Journal of Speech, Language, and Hearing
Research, 49, 278–293. doi: 10.1044/1092-4388(2006/023)
Purpose: The researchers wanted to examine the language abilities of children, concurrently and
retrospectively, with specific reading comprehension deficits and compare them to typical
readers and children with specific decoding deficits.
Method: In the first study, the participants included 57 poor comprehenders, 27 poor decoders,
and 98 typical readers on the basis of 8th-grade reading achievement. These subgroups’
performances on 8th-grade measures of language comprehension and phonological processing
were examined. In the second study, the authors examined subgroups’ performances on measures
of language comprehension and phonological processing in kindergarten, 2nd, and 4th grades
retrospectively.
Results: The first study showed that poor comprehenders had concurrent deficits in language
comprehension but normal abilities in phonological processing. The second study’s results
showed that subgroups had language (and word recognition) profiles in the earlier
grades that were consistent with those observed in 8th grade. The differences found in the
subgroup in reading comprehension were inconsistent across grades but reflective of the changes
in the components of reading comprehension over time.
Conclusions: The results support the simple view of reading and the phonological deficit
hypothesis. The findings indicate that a classification system that is based on the simple view has
advantages over standard systems.

38
Relevance to the current study: This study supports the idea that students who have listening
comprehension difficulties in kindergarten, second, and fourth grades, continue to have reading
comprehension deficits in eighth grade. Therefore, it is possible to identify children who may
struggle with reading comprehension in the future by analyzing the student’s listening
comprehension in their earlier school years.
Catts, H. W., Nielsen, D. C., Bridges, M. S., & Liu, Y.-S. (2016). Early identification of reading
comprehension difficulties. Journal of Learning Disabilities, 49, 451–465.
Purpose: The researchers wanted to find if measures of language ability and/or a student’s
response to language intervention in kindergarten would predict if and what reading
comprehension difficulties the student may struggle with in the third grade. One point of
reasoning is that through the simple view of reading, measures of language ability can aid in
identifying potential issues with reading comprehension.
Method: The participants were 366 kindergarten children from a medium sized school district
that was diverse in ethnicity and socioeconomic status. The participants were divided into two
cohorts and were one year apart. 19% of the kindergarteners met the “at risk” criteria for reading
difficulties. All participants were presented with a screening battery which tested letter
knowledge, phonological awareness, rapid automatized naming, nonword repetition, vocabulary,
grammar, and narration. Participants were assigned to either an intervention condition or an at-
risk control condition for intervention.
Results: All correlations were significant and in the .3 to the .6 range which is considered low to
moderate. A logistic regression analysis was used, as well as a nested approach. It was found that
Letter Naming Fluency was the best predictor of reading comprehension difficulties, although all
four kindergarten measures were significant indicators of the student’s reading comprehension.

39
Conclusion: The language measures that were examined were shown to significantly predict the
student’s reading comprehension abilities at the end of third grade, although it should be noted
that the contributions were relatively small.
Relevance to the current study: we can use language measures to identify students who may
struggle with reading comprehension at a much earlier age than is currently being addressed.
Catts, H. W., Herrera, S., Nielsen, D. C., & Bridges, M. S. (2015). Early prediction of reading
comprehension within the simple view framework. Reading and Writing: An
Interdisciplinary Journal, 28, 1407–1425.
Purpose: The researchers desired to identify if the components of the simple view of reading
could be used for the early prediction of reading comprehension abilities.
Method: Participants included 366 kindergarten children who were in an ethnically and
socioeconomic diverse school district and were divided into two cohort groups. Students were
given language code-related measures which included assessing the student’s letter knowledge,
phonological awareness, rapid naming, nonword repetition, and measures of oral language.
Results: A confirmatory factor analysis was used. All measures presented with strong
correlations, although it should be noted that reading comprehension was more strongly
correlated with second grade word recognition than kindergarten oral language.
Conclusion: Findings included that the word reading precursors were moderately related to each
other, with the strongest relationship between phonological awareness and letter knowledge. The
researchers also found that word-reading precursors and oral language ability was associated at
the start of kindergarten, and that the strongest relationship was identified to be between
phonological awareness and oral language.

40
Relevance to the current study: The components of the simple view of reading can be used to
predict reading comprehension abilities in third grade students, and oral language ability plays a
significant role in a child’s ability to comprehend language.
Nakamoto, J., Lindsey, K. A., & Manis, F. R. (2006). A longitudinal analysis of English
language learners’ word decoding and reading comprehension. Reading and Writing, 20,
691-719. doi:10.1007/s11145-006-9045-7
Purpose: They want to track reading outcomes for ELLs from the first to sixth grade. They also
want to look at the relationship between ELL predictors and reading outcomes.
Method: The sample contained 303 Latino kindergarten children with limited English language
proficiency who were in a transitional bilingual curriculum. The students came from a low SES
background. Fifteen classes from ten schools were selected to participate in the study. The
children were followed throughout the length of the study as the children were tested in
Kindergarten, First, Second, Third, Fifth, and Sixth grade. The kindergarten and first grade
testing measured letters, words, sentence repetition, and mazing for reading comprehension in
Spanish. In first grade testing measured first initial sound phonemic awareness, elision, rapid
automatic naming, and sentence repetition in English. In all grades the Woodcock Johnson
reading assessments were used to measure both code based and language based constructs of the
children in English.
Results: The decoding scores remained average throughout all the grades when compared to
native English speakers, although their reading comprehension abilities were significantly
different starting at third grade.
Conclusion: Based on the data collected, while ELL had adequate decoding skills, their
comprehension abilities significantly suffered. This was found once the demands of more

41
complex comprehension was placed on the children. Education should be focused on
comprehension strategies and oral language skills to improve ELLs comprehension.
Relevance to the current study: 80% below grade level in reading: it is likely that many of these
students have difficulty with understanding the specific academic language presented to them in
written text (not primarily a decoding issue).
Nation, K., Cocksey, J., Taylor, J. S., & Bishop, D. V. (2010). A longitudinal investigation of
early reading and language skills in children with poor reading comprehension. Journal
of Child Psychology and Psychiatry, 51, 1031–1039. doi: 10.1111/j.1469-
7610.2010.02254.x
Purpose: The purpose of this study was to examine the early reading and language skills of a
group of children identified as poor comprehenders later in development as much research has
been done on children who are at an age where they are already failing in their abilities to
comprehend.
Method: There were 242 children who began the study at age 5. Assessments of language and
reading skills were made at 5.5, 6, 7 and 8 years. At age 8, 15 children met the criteria for being
a poor comprehender and were compared to 15 control children both concurrently and
prospectively.
Results: The poor comprehenders showed normal reading accuracy and fluency at all ages.
Reading comprehension was poor at each time point and notably, showed minimal increases in
their raw scores between 6 and 8 years. Phonological skills were generally normal throughout,
but mild impairments in expressive and receptive language, listening comprehension and
grammatical understanding were seen at all ages.
Conclusions: Children identified as poor comprehenders at 8 years showed the same reading

42
profile throughout earlier development. Their difficulties with the non-phonological aspects of
oral language were present at school entry and persisted through childhood, showing that the oral
language weaknesses seen in poor comprehenders in mid-childhood are not a simple
consequence of their reading comprehension impairment.
Relevance to the current study: This study supports the idea that children who have poor
listening comprehension in their younger school ages have a higher probability of having reading
comprehension difficulties, even though they also have adequate decoding skills.
Mancilla-Martinez, J., & Lesaux, N. K. (2011). The gap between spanish speakers’ word reading
and word knowledge: A longitudinal study. Child Development, 82, 1544–1560.
Purpose: To identify the patterns of development of students’ Spanish and English word reading
and oral language skills from ages 4.5 to 11. To determine students’ rates of growth compare to
national norms in each language.
Method: Participants came from three hundred and eighty-seven families and were followed
from the ages of 4.5 to 8. At the age of 11, one hundred and seventy-three families were re-
recruited. Spanish was the primary language spoken in these homes, although some of the
children did speak English at school. Children were tested six times throughout the study, at ages
4.5, 5, 6, 7, 8, and 11. The children’s language and literacy were assessed through both English
and Spanish standardized assessments.
Results: The student’s English vocabulary skills averaged below the mean range across all ages
assessed except at age 11 when the student’s standard score averaged the 17th percentile. While
the student’s Spanish word reading skills were near average at each age assessed, their oral
language skills averaged two or more SD below average at all ages assessed. Although the
students improved in their English vocabulary, they still scored below the average norms at all

43
ages assessed. As the children were learning and speaking English in the schools, their growth
rate in English passed their growth in Spanish vocabulary.
Conclusion: LM learners’ word reading and oral language skills were stronger in English than in
Spanish at every age assessed. This demonstrates that LM learners have the ability to learn
language and reading skills at the same rate as native speakers. It is noteworthy to state that each
of these students had been in an English speaking environment since preschool, and increasingly
spoke English in the home, but they still had a worrisome slow rate of development in oral
language. This demonstrates that children need more explicit instruction in vocabulary and
language structures.
Relevance to the current study: This article supports the research that children learn much of
their vocabulary from reading which only occurs when the reader can appropriately understand
the text (comprehension.) The idea that children will learn to comprehend simply by reading is
not adequate as there must also be an emphasis on oral language development.
Paris, A. H., & Paris, S. G. (2003). Assessing narrative comprehension in young
children. Reading Research Quarterly, 38, 36-76.
Purpose: Strategic processes such as making inferences, backtracking, summarizing, identifying
the main idea(s), predicting, and monitoring are necessary for an individual to comprehend a
text. Comprehension occurs when the individual has the necessary knowledge about language
that is needed to create connections between the content read and the reader’s previous
experiences. Narratives may be useful because children learn from a very young age to express
their wants and needs through narratives. Preschoolers use narrative scripts in order to express
events and routines. Narrative schemas are used by children which include main ideas and
temporal and causal sequencing. Narratives encourage learning of perspective taking, theory of

44
mind, and story grammar elements. This study looked at the cognitive impact of children’s
narrative comprehension as this field has not had much inquiry.
The purpose of this research was to provide a uniform task and procedure for assessing
children’s narrative comprehension independent of decoding abilities and to evaluate the
reliability and validity of the assessment. Analyzed three studies.
Study One
Method: 158 children in grades K-2 were observed for how they interacted with picture books in
three different settings: picture walk, elicited retelling, and prompted comprehension during
questioning. Additional tests were administered in order to determine how the children’s
performance on the picture books corresponded with their other reading skills.
Results: Overall, children’s scores improved with age. An ANOVA with the picture walk
showed no significant effects due to grade. Retelling scores increased significantly with age, as
was demonstrated by ANOVA yielding a significant grade effect. In the prompted
comprehension results, ANOVAs by grade showed that older children scored significantly higher
than the younger children. In post-hoc tests, it was discovered that for the implicit
comprehension questions, significant differences in scores emerged only between second and
first grade, but not between kindergarten and first.
Study Two
Method: The participants included the prereaders from study one, and 91 newly selected
students; all were primarily kindergarten and first graders. Two additional books were chosen for
the NC task. Picture books were randomly assigned. Similar to the first study, the children
participated in the picture walk, retelling, and comprehension questions.

45
Results: Consistent, strong relations continued retelling and prompted comprehension. It was
found in the second study, that the NC task has consistent results across the different picture
books.
Study 3
Method: The participants included 54 children ages K-1, and 87 new children ages K-2. Two
picture books were used, and the same three sections were looked at: picture walk, retelling, and
comprehension. Additional assessments were given to look the children’s overall reading skills.
Results: Again, the retelling and prompted comprehension questions scores correlated more
strongly than with the picture walk scores. The scores in the picture walk reflected similarly to
the scores from study 1. Second graders performed better than the first graders on most
questions.
Conclusion: All three studies show that the Narrative Comprehension task appears to be a useful
quantitative measure of young children’s narrative comprehension. The patterns found in the
children’s performances show the appropriate sensitivity of the NC measures. The significant
relations also evidence of concurrent validity.
Relevance to the current study: Narratives can and should be used for the strengthening of a
child’s comprehension abilities.
Petersen, D. B., & Stoddard, A. (2018). Psychometric requirements of oral and written language
progress monitoring assessments. Perspectives of the ASHA Special Interest Groups, 3,
180–197. doi: 10.1044/persp3.sig1.180
Purpose: The purpose of this article is to outline the psychometric requirements for progress
monitoring tools for oral and written language as well as to provide an overview of the strengths
and weaknesses of current oral and written language progress monitoring tools used by

46
speech-language pathologists (SLPs) and general and special educators. This is due to the fact
that progress monitoring tools are used frequently to make data-based decisions, to determine if
goals need to be adjusted, or if instruction should be changed.
Method: Educator-friendly approaches to the examination of validity and reliability of progress
monitoring tools were reviewed and described. The extent to which current language and
reading progress monitoring assessments meet the requirements for validity and reliability
was briefly examined.
Results: SLP-generated progress monitoring assessments have had a strong focus on
narrative-based language assessment, demonstrating strong evidence of construct validity,
including positive evidence of consequential validity. Evidence of reliability has relied on
inappropriate analyses that are more applicable to norm-referenced assessments. SLP generated
language progress monitoring tools tend to fall short on several other important
features, such as parallel forms and ease of administration and scoring. Educator-generated
progress monitoring tools have sacrificed construct validity for the sake of reliability. Evidence
of consequential validity is greatly concerning.
Conclusion: Greater collaboration between SLPs and general and special educators is
needed to develop oral and written language progress monitoring assessments that meet
both validity and reliability expectations.
Relevance to the current study: The need for parallel forms and ease of administration and
scoring of valid, reliable progress monitoring assessments with a strong narrative-based focus are
identified.
Reed, D. K., & Vaughn, S. (2012). Retell as an indicator of reading comprehension. Scientific
Studies of Reading, 16, 187–217. doi: 10.1080/10888438.2010.538780

47
Purpose: The purpose of this narrative synthesis is to determine the reliability and validity of
retell protocols for assessing reading comprehension of students in grades K–12.
Method: The researchers systematically coded fifty-four studies for data related to the
administration protocol, scoring procedures, and technical adequacy of the retell
component. Results: The retell section was moderately correlated with standardized measures of
reading comprehension and, with older students, had a lower correlation with decoding and
fluency. Literal information was retold more frequently than inferential, and students with
learning disabilities or reading difficulties needed more supports to demonstrate adequate recall.
Conclusion: Great variability was shown in the prompting procedures, but scoring methods were
more consistent across studies. The influences of genre, background knowledge, and
organizational features were often specific to particular content, texts, or students. Overall, retell
has not yet demonstrated adequacy as a progress monitoring instrument.
Relevance to the current study: This research aims to identify if retell contributes valid and
reliable information about an individual’s reading comprehension. Interrater reliability was
difficult to score because there was no quantitative approach. In aspects of validity and reliability
of using retell to understand an individual’s reading comprehension level, more research is
needed.
Roch, M., Florit, E., & Levorato, C. (2011). Follow-up study on reading comprehension in
Down's syndrome: the role of reading skills and listening comprehension. International
Journal Of Language & Communication Disorders, 46, 231-242.
doi:10.3109/13682822.2010.487882
Purpose: Researchers expected greater gains in reading skills than in comprehension, both
listening and reading. To verify whether listening comprehension was a stronger predictor of the

48
development of reading comprehension than reading skills. It was hypothesized that listening
comprehension might be causally related to reading comprehension while reading skills,
although more preserved, might have a less strong influence on the development of reading
comprehension.
Method: The population included 10 individuals with Down Syndrome between 11 and 19 years
old participated in each phase of the study. All were native Italian speakers, no physical or
neurological disorders. Normal or corrected hearing and vision. Assessments included evaluating
reading comprehension through the MT test, listening comprehension through the TOR 3-8, and
fluency and accuracy through a word and non-word task from the “Battery for Dyslexia
Evaluation.” Tests were administered twice one year apart.
Results: It was indicated that in reading comprehension, 7/10 participants reached a first
grade level comprehension and three participant’s reading level was measured to be higher than a
first grade level. Listening comprehension was measured to be poorer than reading
comprehension. No specific intervention was administered during the time between the
assessments, which resulted in no improvement in reading or listening comprehension. Decoding
however did improve.
Conclusion: While reading comprehension was correlated with listening comprehension, there
did not appear to be a correlation with decoding. Looked at reading comprehension as the
outcome, and looked at reading comprehension, listening comprehension, and decoding as the
outcomes. They used reading comprehension as a predictor at time one to predict reading
comprehension at the second assessment. It was found that reading comprehension at time one
predicted the reading variance at time two 57.4%. They added word recognition into the
prediction and found that word recognition added another 8% variance to the predictors. That
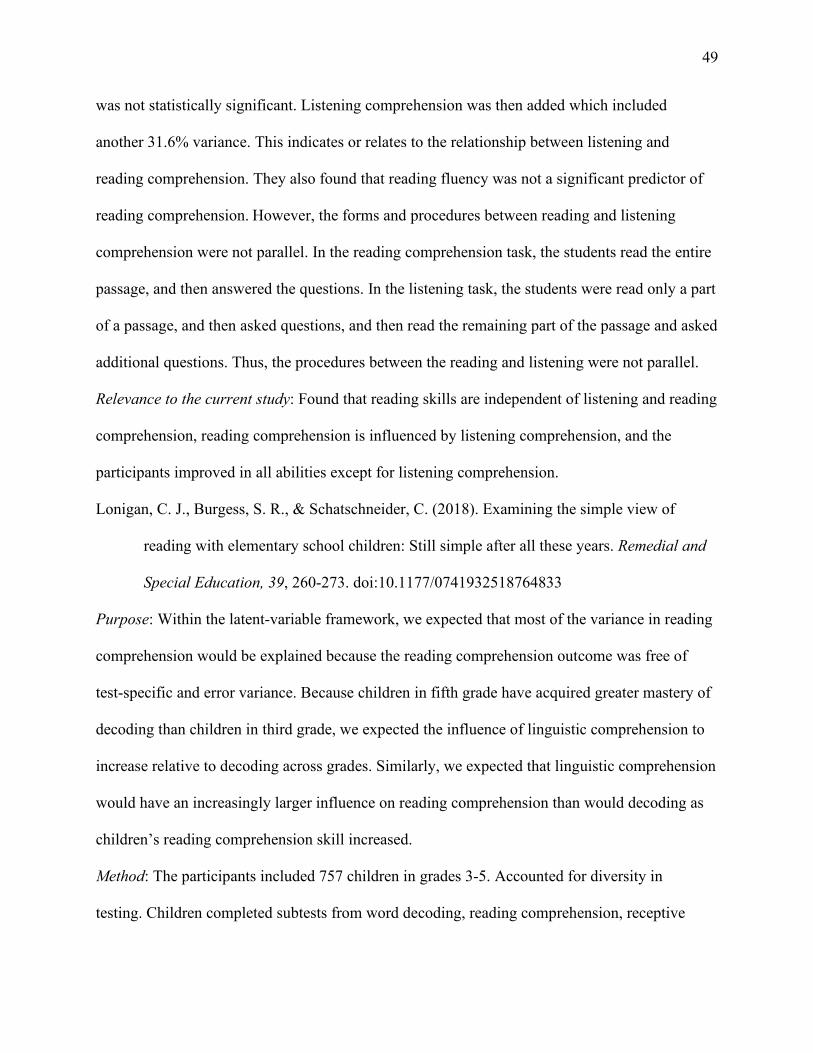
49
was not statistically significant. Listening comprehension was then added which included
another 31.6% variance. This indicates or relates to the relationship between listening and
reading comprehension. They also found that reading fluency was not a significant predictor of
reading comprehension. However, the forms and procedures between reading and listening
comprehension were not parallel. In the reading comprehension task, the students read the entire
passage, and then answered the questions. In the listening task, the students were read only a part
of a passage, and then asked questions, and then read the remaining part of the passage and asked
additional questions. Thus, the procedures between the reading and listening were not parallel.
Relevance to the current study: Found that reading skills are independent of listening and reading
comprehension, reading comprehension is influenced by listening comprehension, and the
participants improved in all abilities except for listening comprehension.
Lonigan, C. J., Burgess, S. R., & Schatschneider, C. (2018). Examining the simple view of
reading with elementary school children: Still simple after all these years. Remedial and
Special Education, 39, 260-273. doi:10.1177/0741932518764833
Purpose: Within the latent-variable framework, we expected that most of the variance in reading
comprehension would be explained because the reading comprehension outcome was free of
test-specific and error variance. Because children in fifth grade have acquired greater mastery of
decoding than children in third grade, we expected the influence of linguistic comprehension to
increase relative to decoding across grades. Similarly, we expected that linguistic comprehension
would have an increasingly larger influence on reading comprehension than would decoding as
children’s reading comprehension skill increased.
Method: The participants included 757 children in grades 3-5. Accounted for diversity in
testing. Children completed subtests from word decoding, reading comprehension, receptive
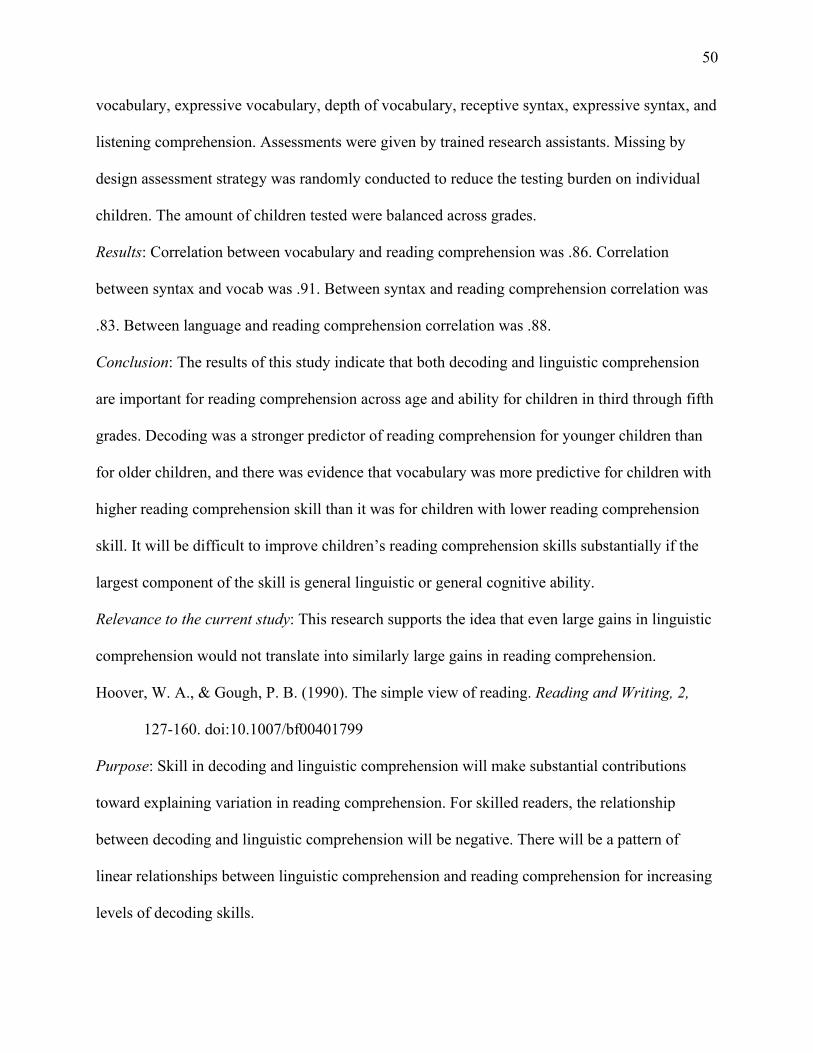
50
vocabulary, expressive vocabulary, depth of vocabulary, receptive syntax, expressive syntax, and
listening comprehension. Assessments were given by trained research assistants. Missing by
design assessment strategy was randomly conducted to reduce the testing burden on individual
children. The amount of children tested were balanced across grades.
Results: Correlation between vocabulary and reading comprehension was .86. Correlation
between syntax and vocab was .91. Between syntax and reading comprehension correlation was
.83. Between language and reading comprehension correlation was .88.
Conclusion: The results of this study indicate that both decoding and linguistic comprehension
are important for reading comprehension across age and ability for children in third through fifth
grades. Decoding was a stronger predictor of reading comprehension for younger children than
for older children, and there was evidence that vocabulary was more predictive for children with
higher reading comprehension skill than it was for children with lower reading comprehension
skill. It will be difficult to improve children’s reading comprehension skills substantially if the
largest component of the skill is general linguistic or general cognitive ability.
Relevance to the current study: This research supports the idea that even large gains in linguistic
comprehension would not translate into similarly large gains in reading comprehension.
Hoover, W. A., & Gough, P. B. (1990). The simple view of reading. Reading and Writing, 2,
127-160. doi:10.1007/bf00401799
Purpose: Skill in decoding and linguistic comprehension will make substantial contributions
toward explaining variation in reading comprehension. For skilled readers, the relationship
between decoding and linguistic comprehension will be negative. There will be a pattern of
linear relationships between linguistic comprehension and reading comprehension for increasing
levels of decoding skills.

51
Method: The participants included 254 English-Spanish bilingual children. All followed through
second grade, 101 through third grade, and 61 through fourth grade. Children were located
within five different “study sites.” Children’s pre-reading skills were assessed at the beginning of
the study. The instructional emphasis in two of the sites was “skills development,” or an equal
emphasis of decoding, vocabulary, and text comprehension. In the other two sites, reading
instruction focused on letter-sound correspondences and word attack skills. In the last site, the
reading program was individualized but after two years, the district shifted to a basal reading
program. The Interactive Reading Assessment System was given yearly. It consisted of nine
subtests and took 45-90 minutes to complete. Student’s performance was represented by a
critical index.
Results: At the end of first grade, skill in decoding was relatively low. Average first grade
performance at the first level narrative for reading comprehension, but the third-level narrative
for listening comprehension. Skill in each area increased over the grade levels.
Conclusion: Decoding and linguistic comprehension are substantially related to reading
comprehension. Aggregate skills in decoding, listening comprehension, and their product
increased as the sample was reduced based on increasing reading comprehension skill. For the 17
slope values, all were significantly positive, with the exception of two zero values.
Relevance to the current study: This research supports the idea that reading comprehension
cannot be improved simply by improving decoding. Individuals do need to decode, but more
than that, they need to be adequate in listening comprehension as well.
Tunmer, W. E., & Chapman, J. W. (2012). The simple view of reading redux. Journal of
Learning Disabilities, 45, 453-466. doi:10.1177/0022219411432685
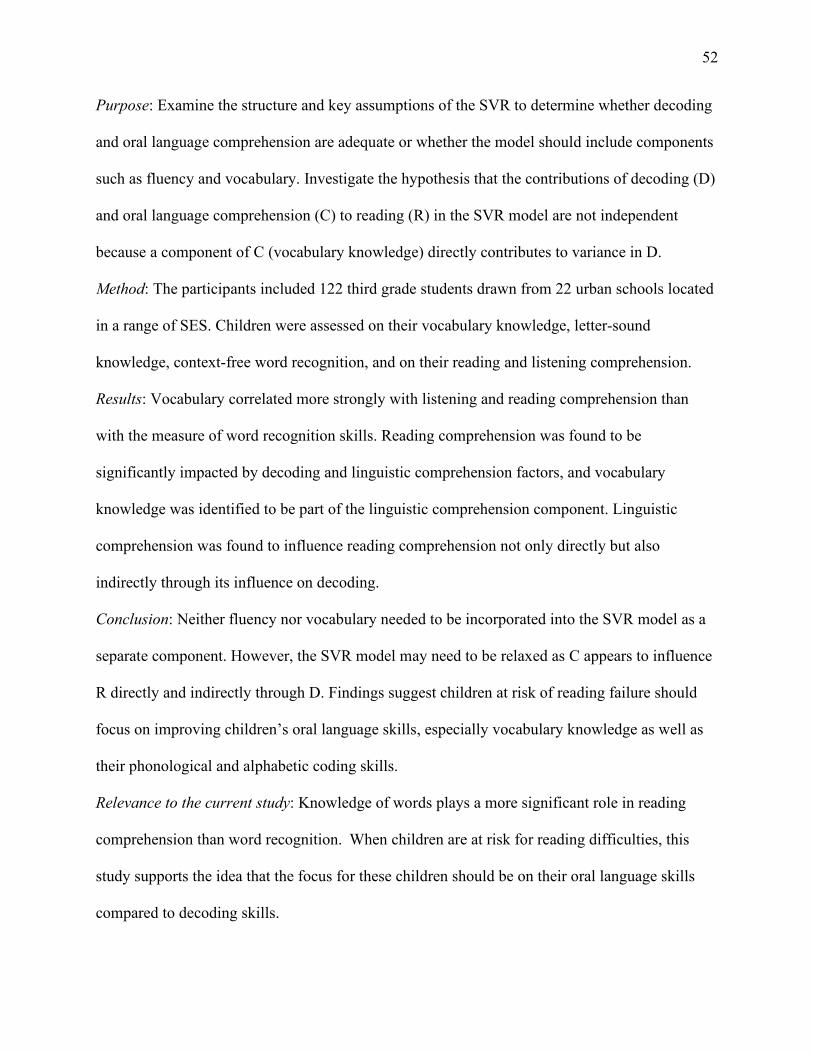
52
Purpose: Examine the structure and key assumptions of the SVR to determine whether decoding
and oral language comprehension are adequate or whether the model should include components
such as fluency and vocabulary. Investigate the hypothesis that the contributions of decoding (D)
and oral language comprehension (C) to reading (R) in the SVR model are not independent
because a component of C (vocabulary knowledge) directly contributes to variance in D.
Method: The participants included 122 third grade students drawn from 22 urban schools located
in a range of SES. Children were assessed on their vocabulary knowledge, letter-sound
knowledge, context-free word recognition, and on their reading and listening comprehension.
Results: Vocabulary correlated more strongly with listening and reading comprehension than
with the measure of word recognition skills. Reading comprehension was found to be
significantly impacted by decoding and linguistic comprehension factors, and vocabulary
knowledge was identified to be part of the linguistic comprehension component. Linguistic
comprehension was found to influence reading comprehension not only directly but also
indirectly through its influence on decoding.
Conclusion: Neither fluency nor vocabulary needed to be incorporated into the SVR model as a
separate component. However, the SVR model may need to be relaxed as C appears to influence
R directly and indirectly through D. Findings suggest children at risk of reading failure should
focus on improving children’s oral language skills, especially vocabulary knowledge as well as
their phonological and alphabetic coding skills.
Relevance to the current study: Knowledge of words plays a more significant role in reading
comprehension than word recognition. When children are at risk for reading difficulties, this
study supports the idea that the focus for these children should be on their oral language skills
compared to decoding skills.