Embed Size (px)
Citation preview
Using the Adolescent Time Inventory-Time Attitudes (ATI-TA) toassess time attitudes in Italian adolescents and young adults:Psychometric properties and validityDonati, M. A., Boncompagni, J., Scabia, A., Morsanyi, K., & Primi, C. (2018). Using the Adolescent TimeInventory-Time Attitudes (ATI-TA) to assess time attitudes in Italian adolescents and young adults: Psychometricproperties and validity. INTERNATIONAL JOURNAL OF BEHAVIORAL DEVELOPMENT.https://doi.org/10.1177/0165025418797020
Published in:INTERNATIONAL JOURNAL OF BEHAVIORAL DEVELOPMENT
Document Version:Peer reviewed version
Queen's University Belfast - Research Portal:Link to publication record in Queen's University Belfast Research Portal
Publisher rights© 2018 The Authors. This work is made available online in accordance with the publisher’s policies. Please refer to any applicable terms ofuse of the publisher.
General rightsCopyright for the publications made accessible via the Queen's University Belfast Research Portal is retained by the author(s) and / or othercopyright owners and it is a condition of accessing these publications that users recognise and abide by the legal requirements associatedwith these rights.
Take down policyThe Research Portal is Queen's institutional repository that provides access to Queen's research output. Every effort has been made toensure that content in the Research Portal does not infringe any person's rights, or applicable UK laws. If you discover content in theResearch Portal that you believe breaches copyright or violates any law, please contact [email protected].
Download date:09. Dec. 2020
Using the Adolescent Time Inventory-Time Attitudes (ATI-TA) to assess time attitudes in Italian
adolescents and young adults: Psychometric properties and validity
Maria Anna Donati, Jessica Boncompagni, Aurora Scabia, Kinga Morsanyi°, & Caterina Primi
RUNNING HEAD: MEASURING TIME ATTITUDES IN YOUNG PEOPLE
Department of Neuroscience, Psychology, Drug, and Child’s Health (NEUROFARBA),
Section of Psychology, University of Florence, Italy.
° School of Psychology, Queens University of Belfast, Belfast, UK.
Correspondence concerning this article should be addressed to Maria Anna Donati,
Department of Neuroscience, Psychology, Drug, and Child’s Health (NEUROFARBA), Section of
Psychology, via di San Salvi 12- Padiglione 26, 50135 Firenze (Italy). E-mail:
Please cite the paper as:
Donati, M. A., Boncompagni, J., Scabia, A., Morsanyi, K. & Primi, C. (2018). Using the Adolescent
Time Inventory-Time Attitudes (ATI-TA) to assess time attitudes in Italian adolescents and young
adults: Psychometric properties and validity. International Journal of Behavioral Development. (in
press.)
MEASURING TIME ATTITUDES IN YOUNG PEOPLE
1
Using the Adolescent Time Inventory-Time Attitudes (ATI-TA) to assess time attitudes in
Italian adolescents and young adults: Psychometric properties and validity
Abstract
Time attitudes (TA) are evaluative feelings toward the past, present and future. Given the role
of TA in psychological and behavioural outcomes, the aim of this study was to analyze the
adequacy of the Adolescent Time Inventory-Time Attitudes (ATI-TA; Mello & Worrell, 2007) scale
among adolescents and young adults in Italy. The scale was administered to 638 students in order to
test its psychometric properties and validity. These analyses confirmed the adequacy of the six-
factor model and the reliability of the subscales. Additionally, the measurement invariance of the
scale across genders and age groups (between adolescents up to the age of 18, and young adults
above 18) was demonstrated. Specifically, gender invariance reached the level of equivalence of
error variances/covariances, and the same level was partially reached for invariance across age
groups. Evidence of the validity of the scale was also provided by obtaining significant correlations
between the subscales, and self-esteem and strategic learning. Taken together, these results support
the suitability of the ATI-TA to be used for research and clinical purposes.
Keywords: Adolescents; ATI-TA; Dimensionality; Time attitude; Measurement invariance; Validity
MEASURING TIME ATTITUDES IN YOUNG PEOPLE
2
Time perspective (TP) can be described as the subjective and often non-conscious process
whereby individuals relate to time, and organize and categorize their personal and social
experiences into the temporal frames of the past, present, and future (Boyd & Zimbardo, 2005).
Time perspectives emerge during adolescence, when individuals first develop the ability to consider
multiple time dimensions (Piaget, 1955). TPs play an important role in the process of identity
formation, which involves the integration of one’s personal past, present, and future (Erikson,
1968). Zimbardo and Boyd (1999) have developed a questionnaire, the Zimbardo Time Perspective
Inventory (ZTPI), to simultaneously measure five different TPs: past positive and negative, present
hedonistic and fatalistic, and future, and they have extensively tested the validity of this
questionnaire in young adults.
These investigations have shown that the TPs were related to risk-taking, and both positive
and negative psychological outcomes in young adults. Specifically, the present and the future TPs
were found to predict – respectively, positively and negatively - risky driving, self-reported alcohol
and drug use, unsafe health habits, crime, sexual promiscuity, and addictions (Boyd & Zimbardo,
2005; Henson, Carey, Carey, & Maisto, 2006; Keough, Zimbardo & Boyd, 1999; Wills, Sandy &
Yaeger, 2001; Zimbardo, Keough & Boyd, 1997). The past negative perspective was also found to
correlate negatively with happiness and mindfulness (Drake, Duncan, Sutherland, Abernethy &
Henry, 2008), and the present fatalistic attitude discriminated between severe suicidal ideators and
non-ideators (Laghi, Baiocco, D’Alessio & Gurrieri, 2009), while the future perspective was
positively associated with self-efficacy (Luszczynska, Gibbons, Piko & Tekozel, 2004). Moreover,
the time perspective profiles of adolescents in Children’s Homes (a population characterised by
increased risk-taking tendencies) was also found to differ from adolescents growing up in a family
environment (Morsanyi & Fogarasi, 2014), with characteristic differences in the past and present
perspectives. The above studies have demonstrated the ecological validity of the ZTPI in adolescent
and college populations.
MEASURING TIME ATTITUDES IN YOUNG PEOPLE
3
Whereas the ZTPI is related to a range of real-life outcomes, there are issues with its
psychometric properties (Worrell, Mello, & Buhl, 2011). One important finding is that the 5-factor
structure of the ZTPI was only partially supported in adolescent samples (Worrell & Mello, 2007).
Additionally, at the conceptual level, Worrell et al. (2011) argued that the ZTPI subscales were not
pure indicators of time attitudes. For example, present hedonism (e.g., “it is important to put
excitement in my life”) does not only reflect positive attitudes towards the present, but also a
tendency for risk-taking, lack of ego-control and sensation seeking. Similarly, the present fatalistic
perspective (e.g., “things rarely work out as I expected”) is related to anxiety and depression, in
addition to a person’s attitudes toward their present. Worrell et al. (2011) also proposed that
positive and negative feelings about the future should be considered as separate dimensions, instead
of treating them as a single construct.
Time attitudes and the ATI-TA
According to the multidimensional interpretation (McKay, Cole, Percy, Worrell, & Mello,
2015; Shipp, Edwards, & Schurer-Lambert, 2009; Worrell et al., 2011), TP involves various
dimensions, including cognitions, feelings, and attitudes towards time. One of these dimensions,
Time Attitude (TA), has attracted much research attention. TA refers to “an individual’s emotional
and evaluative feelings toward the past, the present, and the future” (Worrell, McKay, & Andretta,
2018, p.1). Similar to TPs, TAs have been found to be related to individuals’ everyday functioning,
including educational outcomes, psychological wellbeing, and risky behaviour among adolescents.
For instance, positive attitudes toward the future are positively correlated with psychological well-
being. Specifically, an optimistic view of the future was found to be positively linked to self-esteem
and negatively related to depression and perceived stress (Scheier & Carver, 1985). Stress-resilient
children reported significantly higher expectations regarding the future than did stress-affected
children (Wyman et al., 1992), and Worrell and Hale (2001) found that the belief that the future will
work out distinguished between high school dropouts and graduates. Finally, positive attitudes
MEASURING TIME ATTITUDES IN YOUNG PEOPLE
4
toward the future are positively related to self-esteem and positive affect, and negatively related to
negative affect (Snyder et al., 1996).
The ATI-TA
Given the importance of TA in adolescence and the lack of reliable and valid psychometric
instruments to specifically measure the affective dimension of time perspective from a
multidimensional perspective among young people, Mello and Worrell (2007) developed the
Adolescent Time Inventory - Time Attitudes (ATI-TA’ also known as the ATAS – Adolescent Time
Attitude Scale – e.g., Worrell et al., 2011), a self-report scale that measures adolescents’ attitudes
towards the past, present, and future, including both positive and negative valences. Thus, the ATI-
TA assesses six types of TA: Past Positive, Past Negative, Present Positive, Present Negative,
Future Positive and Future Negative, in a holistic way (Andretta, Worrell, Mello, Dixson, & Baik,
2013).
Studies using the ATI-TA have reported relationships between TAs and both risky behaviours
and positive psychological outcomes. For instance, Mello and colleagues (2017) found that
adolescents who ran away from home reported less positive and more negative attitudes toward
time compared to adolescents who did not run away, with the largest differences in attitudes toward
the past. Having positive TAs was also associated with responsible attitudes to alcohol consumption
and lower reported alcohol use (Wells, Morgan, Worrell, Sumnall, & McKay, 2018). Additionally,
TAs have been found to be related to grade point average, optimism, hope, perceived stress, and
self-esteem among adolescents (Andretta, Worrell, & Mello, 2014; Mello et al., 2016; Worrell &
Mello, 2009). Significant relationships were also found between time attitude profiles and academic
achievement and expectations, self-efficacy, self-esteem, and perceived stress, demonstrating that
youth with more positive profiles had more desirable characteristics in terms of academic
performance and psychological wellbeing (Alansari, Worrell, Rubie-Davies, & Webber, 2013;
Andretta et al., 2013; Andretta et al., 2014; Buhl & Linder, 2009). Furthermore, positive feelings
towards time were longitudinally predictive of well-being and reduced psychosomatic
MEASURING TIME ATTITUDES IN YOUNG PEOPLE
5
symptomatology (Konowalczyk, McKay, Wells, & Cole, 2018), increased academic, social, and
emotional self-efficacy (Morgan, Wells, Andretta, & McKay, 2017; Wells, McKay, Morgan, &
Worrell, 2018), and a decrease in sensation seeking, whereas the opposite was true for negative
profiles (Morgan et al., 2017).
The psychometric properties of the ATI-TA
Although the ATI-TA has been widely employed to assess TA in adolescents, relatively less
attention has been paid to its psychometric properties. Concerning the dimensionality of the scale,
several studies have confirmed that the best structural solution is a six-factor structure in which
each dimension measures a positive or negative attitude towards the three time periods (e.g.,
Alansari et al., 2013; Çelik, Sahranç, Kaya, & Turan, 2017; Chishima, Murakami, Worrell, &
Mello, 2017; McKay et al., 2015; Mello et al., 2016; Şahin-Baltacı, Tagay, Worrell, & Mello, 2017;
Wells, McKay et al., 2018; Worrell et al., 2013; Worrell et al., 2018). This structure has shown a
parsimonious and best solution compared with a two-factor model focussing on valence (i.e.,
positive and negative) alone (e.g., Alansari et al., 2013; McKay et al., 2015; Mello et al., 2016;
Şahin-Baltacı et al., 2017), and a three-factor model that represents the three time periods (i.e., past,
present, and future; e.g., Alansari et al., 2013; McKay et al., 2015; Mello et al., 2016; Şahin-Baltacı
et al., 2017; Worrell et al., 2013; Worrell et al., 2017). Additionally, the six-factor structure has
been confirmed in several countries, including Germany (Worrell et al., 2013), Japan (Chishima et
al., 2017), and Turkey (Çelik et al., 2017; Şahin-Baltacı et al., 2017).
When analysing the psychometric properties of an instrument, it is important to establish its
measurement invariance, which corresponds to the ability of a test to measure a specific construct in
the same way across different groups of respondents. This is a central property of a test, as if an
instrument does not measure a construct in the same way in different groups of respondents, the
comparison of test scores between different groups of individuals has to be considered invalid
(Waiyavutti, Johnson, & Deary, 2011). With regard to the ATI-TA, its invariance across genders,
age, time points, and languages has been demonstrated (Mello et al., 2016; Wells, McKay et al.,
MEASURING TIME ATTITUDES IN YOUNG PEOPLE
6
2018; Worrell et al., 2013; Worrell et al., 2017). Specifically, Worrell and colleagues (2017) found
equivalence of the items’ factor loadings and the intercepts of the items regressed on the latent
variables across boys and girls in two samples of UK adolescents at three different time points (i.e.,
when the participants were 12-13 years old, and 12 and 24 months later). Concerning age
invariance, Mello et al. (2016) investigated if the ATI-TA could be employed from late adolescence
through adulthood to older age by comparing participants from three age groups: between 18-24,
25-59 and 60-85 years. Multigroup confirmatory factor analyses revealed that the scale was
invariant across the three age groups at the configural level. With regard to longitudinal invariance
across time points of administrations, strict invariance was supported by Wells, McKay et al.
(2018), confirming the equivalence of the six-factor structure of the ATI-TA across time points,
with a time difference of 24 months. Another study analysed separately the invariance of the
positive and negative subscales, finding that the subscales could be considered equivalent only at
the configural level, whereas the negative subscales also showed metric invariance (Worrell et al.,
2017). Finally, Worrell et al. (2013) tested the cross-cultural invariance of the ATI-TA across
American and German samples of adolescents (between 12-20 years of age), demonstrating the
scalar invariance of the six-factor model.
Regarding reliability, most of the ATI-TA subscales have been found to show adequate
reliability when the internal consistency of the raw scores was assessed by Cronbach’s alpha (α)
coefficients (Cronbach & Shavelson, 2004) as well as McDonald’s (1999) omega (Ω), which
corresponds to the ratio of true-score variance and the total variance, and, for each factor, it is
calculated using the item’s coefficients on the factor. Cronbach’s alpha coefficients have been
found to range from .67 to .89 for the Past Positive subscale, from .72 to .90 for the Past Negative
subscale, from .77 to .94 for the Present Positive subscale, from .72 to .91 for the Present Negative
subscale, and from .77 to .93 for the Future Positive subscale). The Future Negative subscale
appeared to be the weakest, ranging from .53 to .89 (Alansari et al., 2013; Andretta et al., 2013;
Çelik et al., 2017; Chishima et al., 2017; McKay et al., 2015; Mello et al., 2016; Prow, Worrell,
MEASURING TIME ATTITUDES IN YOUNG PEOPLE
7
Andretta, & Mello, 2016; Şahin-Baltacı et al., 2017; Worrell et al., 2013; Worrell et al., 2017).
Considering McDonald’s (1999) omega (Ω), a similar pattern of results has been obtained, with
values equal to or above .80 for the ATI-TA subscales with a positive valence (Alansari et al., 2013;
Chishima et al., 2017; McKay et al., 2015; Mello et al., 2016; Worrell et al., 2017), whereas
somewhat lower values have been reported for the Past Negative (Ω=.75), Present Negative
(Ω=.77) (Şahin-Baltacı et al., 2017), and the Future Negative subscale, for which Ω values ranged
from .68 to .78 (McKay et al., 2015; Mello et al., 2016; Worrell et al., 2017), and for the Future
Positive subscale, which Mello and colleagues (2016) found to be equal to .74 in the younger and
.72 in the older adult sample.
Concerning the validity of the ATI-TA, the majority of the psychometric studies have focused
on its structural validity (e.g., Çelik et al., 2017; Mello et al., 2016; Worrell et al., 2013; Worrell et
al., 2017), with relatively less attention paid to its criterion validity. These investigations have
mostly focussed on the relationships between the six TA subscales and some constructs related to
psychological and academic outcomes. For instance, Alansari et al. (2013) found that the six time
attitudes had meaningful relationships with attitudes to school, and Şahin-Baltacı et al., (2017)
showed significant correlations between positive attitudes towards the past, present, and future, and
negative attitudes towards the present and self-esteem, well-being, and optimism. The relationship
with self-esteem was also supported by Chishima et al. (2017), who found significant, moderate
correlations among all the positive and negative time attitudes and self-esteem. Worrell and Mello
(2009) reported that each of the six time attitudes were significantly and moderately correlated with
hope, optimism, self-esteem, and perceived stress. Moreover, McKay et al. (2015) found that
academic, social, and emotional self-efficacy were positively related to positive attitudes towards
each time period, and negatively related to negative attitudes towards the past, present and future.
Other studies have analysed the validity of time attitude profiles. For instance, Andretta et al.
(2014) found that adolescents with a profile of higher positive than negative attitudes reported more
favourable educational (grade point average) and psychological (perceived stress and self-esteem)
MEASURING TIME ATTITUDES IN YOUNG PEOPLE
8
outcomes than did adolescents with higher negative attitudes, and Alansari et al. (2013) reported
that youth with positive profiles had not only higher academic self-ranking scores and school marks
than did adolescents with negative profiles, but they also had more positive attitudes towards both
their schools and their teachers.
The current study
Following these results, the aim of the present study was to investigate the psychometric
properties of the ATI-TA among Italian adolescents and young adults. Indeed, to the best of our
knowledge, although several studies have analysed the psychometric properties of the ATI-TA in
various languages (e.g., Çelik et al., 2017; Chishima et al., 2017; Şahin-Baltacı et al., 2017; Worrell
et al., 2013), there is a lack of studies on the Italian version of the ATI-TA (Mello, Worrell, Laghi,
Baiocco, & Lonigro, 2011). To fill this gap, we aimed to analyze the adequacy of this instrument in
measuring time attitude in adolescents and young adults by confirming its characteristics in terms of
dimensionality, invariance, reliability, and validity. Specifically, we aimed to confirm the six-factor
model (e.g., Alansari et al., 2013; Çelik et al., 2017; Chishima et al., 2017; McKay et al., 2015;
Mello et al., 2016; Şahin-Baltacı et al., 2017; Wells, McKay et al., 2018; Worrell et al., 2013;
Worrell et al., 2017), and to show that this is the best structural solution as compared to the other
dimensional solutions tested in literature, i.e., a two-factor model focused on valence (positive and
negative) (e.g., Alansari et al., 2013; McKay et al., 2015; Mello et al., 2016; Şahin-Baltacı et al.,
2017), and a three-factor model focussing on time periods (i.e., past, present, and future -e.g.,
Alansari et al., 2013; McKay et al., 2015; Mello et al., 2016; Şahin-Baltacı et al., 2017; Worrell et
al., 2013; Worrell et al., 2017).
We also aimed to test the invariance of the six-factor model across genders and ages, and to
compare the time attitudes of males and females, as well as adolescents and young adults. Previous
studies using the ATI-TA reported mixed results about gender differences in time attitudes.
Specifically, one study found a small in size difference in the Future Negative attitude, with boys
scoring higher than girls (Mello & Worrell, 2006), whereas other studies did not find a gender
MEASURING TIME ATTITUDES IN YOUNG PEOPLE
9
difference in the attitudes toward the past, present, and future (Andretta et al., 2013; Andretta et al.,
2014). Concerning age, no significant correlations between age and ATI-TA scores were found
(Andretta et al., 2014; Worrell & Mello, 2009). Nevertheless, it has been suggested that adolescents
are more focused on the future relative to the past and present than adults (Mello, Finan, & Worrell,
2013).
In order to conduct meaningful multigroup comparisons, it is necessary to demonstrate that
the measurement instrument is operating exactly the same way in the compared groups (Byrne,
2004; Dimitrov, 2010; Vandenberg & Lance, 2000). As we described above, there is evidence for
the scalar invariance of the ATI-TA across genders among adolescents between the ages of 12-16
(Worrell et al., 2017). However, the total scale has been found to be invariant across the age groups
of late adolescents, young- to middle- aged adults and older adults only at the configural level, as
higher levels of invariance were only demonstrated when the six subscales were considered
separately. Metric invariance was reached in the case of the Future Positive subscale and scalar
invariance was shown for the Present Negative subscale. Nonetheless, on the basis of these results,
Mello et al. (2016) concluded that the ATI could be adequately used in both adolescent and adult
samples. In order to offer more robust evidence regarding the equivalence of the dimensional
structure of the ATI-TA across genders and between adolescence (up to the age of 18) and young
adulthood (individuals above 18 years of age), we conducted gender and age invariance analyses.
Concerning the internal consistency of the ATI-TA, we expected to confirm previous results
by obtaining high Cronbach’s α coefficients (e.g. Alansari et al., 2013; Andretta et al., 2013; Çelik
et al., 2017; Chishima et al., 2017; McKay et al., 2015; Mello et al., 2016; Prow et al., 2016; Şahin-
Baltacı et al., 2017; Worrell et al., 2013; Worrell et al., 2017) and McDonald’s Ω values (e.g.,
Alansari et al., 2013; Chishima et al., 2017; McKay et al., 2015; Mello et al., 2016; Şahin-Baltacı et
al., 2017; Worrell et al., 2017). Indeed, previous findings showed lower internal consistency only in
the case of the Future Negative subscale (e.g., McKay et al., 2015; Mello et al., 2016; Worrell et al.,
2017).
MEASURING TIME ATTITUDES IN YOUNG PEOPLE
10
Additionally, we aimed to provide empirical support for the scale’s criterion validity by
confirming the relationships between the six time attitudes and self-esteem, consistent with studies
showing significant and positive/negative relationships between self-esteem and positive and
negative attitudes toward time, respectively (e.g. Alansari et al., 2013; Andretta et al., 2013;
Andretta et al., 2014; Buhl & Linder, 2009; Worrell & Mello, 2009). Moreover, given that positive
attitudes toward the past and the future have been considered to be linked to good scholastic
performance, engagement, and self-efficacy (Alansari et al., 2013; Andretta et al., 2013; Andretta et
al., 2014; Buhl & Linder, 2009; McKay et al., 2015; Morgan et al., 2017; Wells, McKay et al.,
2018; Worrell & Hale, 2001), we aimed to verify that positive time attitudes were related to
effective learning. In particular, we aimed to show an association with strategic learning, which
entails self-regulatory capacities in controlling commitment, metacognition, satiation, emotion, and
environment in order to maximize learning (Dörnyei, 2009).
Methods
Participants
The participants were 638 students (64% females) between the ages of 14 and 29 years
(Mage=18.3, SD=2.8). The high school sample (n=382, 52% females, Mage=16.4, SD=1.5) was
recruited in urban centres of Florence, in Italy. A detailed study protocol which explained the
study’s goal and methodology was approved by the institutional review board of each school. The
students received an information sheet, which assured them that the data obtained would be handled
confidentially and anonymously, and they were asked to give written informed assent. Parents of
minors were required to provide consent on behalf of their children. All parents gave their
permission. The college sample (n=256, 81% females, Mage=21.2, SD=1.52) was recruited from the
School of Psychology at the University of Florence, Italy. All participants were first and second
year bachelor students, and were recruited using opportunity sampling from various lectures and
seminars. All students participated on a voluntary basis, after giving their informed consent.
Materials
MEASURING TIME ATTITUDES IN YOUNG PEOPLE
11
The Adolescent Time Inventory-Time Attitudes (ATI-TA; Mello & Worrell, 2007; Italian
version: Mello et al., 2011) consists of 30 items, related to six dimensions which are evaluated on a
5-point Likert scale ranging from 1 (Totally disagree) to 5 (Totally agree): Past Negative (PaNeg)
(5 items; e.g., “My past is a time in my life that I would like to forget”), Past Positive (PaPos) (5
items; e.g., “I have very happy memories of my childhood”), Present Negative (PrNeg) (5 items;
e.g., “I am not satisfied with my life right now”), Present Positive (PrPos) (5 items; e.g., “I am
happy with my current life”), Future Negative (FuNeg) (5 items; e.g., “I doubt I will make
something of myself”), and Future Positive (FuPos) (5 items; “My future makes me happy”). For
each subscale, the score is computed by summing the response items and dividing the sum by the
number of items for each subscale (e.g., McKay et al., 2015).
To assess self-esteem, we administered the Rosenberg Self-Esteem Scale (RSE; Rosenberg,
1965; Italian Version: Prezza, Trombaccia, & Armento, 1997), which consists of 10 items, with a 4-
point Likert scale ranging from 1=strongly agree to 4=strongly disagree. An example item is “I feel
that I have a number of good qualities”. Coefficient alpha for the current sample was good (α =
.81).
In order to investigate strategic learning, we administered the Strategic subscale of the
Approaches and Study Skills Inventory for Students (ASSIST; Tait, Entwistle, & McCune, 1998;
Italian Version: Chiesi et al., 2015). High scores on the scale indicate learning which is
characterized by strong achievement motivation, and is tailored to assessment demands through
well-organized and conscientious study methods (including time management), with the aim to
perform well (Struyven, Dochy, Janssens, & Gielen, 2006). An example item is: “I manage to find
conditions for studying which allow me to get on with my work easily”). The subscale consists of 8
items rated on a 5-point Likert scale ranging from 1= Disagree to 5= Agree. Coefficient alpha for
the current sample was high (α = .87).
Procedure
MEASURING TIME ATTITUDES IN YOUNG PEOPLE
12
The scales were administered individually during class time. All participants completed the
ATI-TA. Additionally, in order to analyze the criterion validity, a subsample of the high school
group (n=216) also completed the RSE, whereas a subsample of the college group (n=88) also
completed the ASSIST- Strategic subscale, after completing the ATI-TA. The students were
provided with a brief introduction to the study, and with some instructions. Answers were collected
in a paper-and-pencil format, and data collection was completed in about 20-30 minutes.
Results
Dimensionality
Univariate distributions of the ATI-TA items were examined to assess normality. Skewness
and Kurtosis indices were between -1 and +1, except for in the case of three items, which were
slightly outside the range of normality (Table 1). However, deviation of a few items from normality
can be considered negligible (Ghasemi & Zahediasl, 2012).
- INSERT TABLE 1 -
Thus, confirmatory factor analyses were carried out, employing the Maximum Likelihood
(ML) method using AMOS (Arbuckle & Wothke, 1999). The two-factor model, the three-factor
model, and the six-factor model were tested. To verify the models’ fit, the following indices were
taken into account: the ratio of chi-square to its degrees of freedom (χ2/df), the Comparative Fit
Index (CFI; Bentler, 1990), the Tucker-Lewis Index (TLI; Tuker & Lewis, 1973), and the Root
Mean Square Error of Approximation (RMSEA; Steiger & Lind, 1980). Furthermore, we used the
Akaike Information Criterion (AIC; Akaike, 1974) and the Bayesian Information Criterion (BIC;
Schwarz, 1978) to compare the different models and to choose the model that demonstrated the
lowest level of loss of information. In the case of χ2/df, values below or equal to two are interpreted
as good, while values between two and three are interpreted as acceptable (Schermelleh-Engel,
Mossbrugger, & Müller, 2003). For the TLI and CFI indices, values above .90 are indicative of
acceptable fit, while values above .95 are indicative of excellent fit (Hu & Bentler, 1999). The
RMSEA value is considered acceptable when it is below .08 and good when it is below .05 (Kline,
MEASURING TIME ATTITUDES IN YOUNG PEOPLE
13
2010). Concerning the AIC and BIC indices, the model that minimizes those indices can be selected
as the best model (see Vrieze, 2012, for a discussion about AIC and BIC indices). Table 2
summarizes the goodness-of-fit results for the three tested models.
- INSERT TABLE 2 –
The results showed that the fit indices of the two-factor model were not acceptable. When we
tested the fit of the three-factor model, the results showed a poor overall fit. Modification Indices
(MIs) suggested adding error covariance between items 3 and 9, both items belonging to the Past
dimension, and between items 7 and 13, both relating to the Future dimension. Scrutiny of the
content of each of these items revealed a substantial overlap between item 3 “I have very happy
memories of my childhood” and item 9 “I have good memories about growing up”, and among item
7 “My future makes me happy” and item 13 “My future makes me smile”. This overlap in item
content can lead to error covariances (Byrne, 2004). The modified model showed a good fit except
for χ2/df, which was higher than three.
Concerning the six-factor model, the results showed a poor overall fit, but MIs suggested
adding error covariance between items 3 and 9, and between the items 7 and 13. Following these
modifications, all the fit indices showed acceptable (χ2/df, TLI, RMSEA) or good (CFI) values.
Thus, the six-factor model displayed the best fit indices in comparison to the other tested models.
Consistent with these analyses, the six-factor model had lower values for the Information Criterion
indices (AIC and BIC) than the other models.
Standardized factor loadings ranged from .51 to .88, and were significant at the .001 level,
(effect sizes ranged from .26 to .77). The correlations between the six factors were all significant.
Specifically, the correlations between the dimensions referring to the same time period but with
opposite valence were very high, ranging from -.82 to -.96 (Figure 1).
- INSERT FIGURE 1 -
Gender Invariance
MEASURING TIME ATTITUDES IN YOUNG PEOPLE
14
Gender invariance analyses were conducted using data from 633 adolescents (Male=229;
Female=404), as five participants did not report their gender. As a prerequisite, we tested the final
six-factor model separately in males and females (Byrne, 2004), using AMOS (Arbuckle &
Wothke, 1999). The model showed acceptable fit indices among boys (χ2/df=1.76; CFI=.93;
TLI=.92; RMSEA=.058, 90% CI [.050-.065]), with standardized factor loadings significant at the
.001 level and ranging from .43 to .87 (effect sizes ranged from .18 to .76). For girls, the model
reached acceptable or good fit indices (χ2/df=2.05; CFI= .95; TLI= .95; RMSEA= .051, 90% CI
[.046-.056]). Standardized factor loadings ranged from .47 to .90 and were all significant at the .001
level (effect sizes ranged from .22 to .76).
Analyses were conducted by performing hierarchically nested confirmatory factor analyses
(see Byrne, 2004, for testing multigroup invariance with AMOS), and gender invariance was
evaluated using not only Δχ2, which is sensitive to sample size, but also ΔCFI, which has been
found to be the most sensitive index to detect a lack of invariance (Meade, Johnson, & Braddy,
2008), employing the absolute value of ΔCFI of less than .01 (Cheung & Rensvold, 2002; Dimitrov,
2010).
In line with the recommended practice for testing measurement invariance (Dimitrov, 2010;
Little, 1997; Vandenberg & Lance, 2000), first the independence model was fitted (χ2=13369.82,
df=870, p<.001). As reported in Table 3, in addition to configural invariance (χ2/df=2.07, p<.001,
CFI=.934, RMSEA=.041), weak or metric factorial invariance was supported (Δχ2=22.53, p=.547,
ΔCFI=.000), confirming that the factor loadings were equal across genders. Then, scalar or strict
invariance, which constrained intercepts to be invariant across groups, and, subsequently, the
equivalence of structural variances and covariances, were also tested (Δχ2Model 2 – Model 3=38.92,
p=.128, ΔCFI=.001; Δχ2Model 3 – Model 4=21.04, p=.456, ΔCFI=.000). Finally, although we obtained a
significant Δχ2 (p<.001), the test of the equality of the items’ variances and covariances met the
ΔCFI criterion, as the CFI of the more restrictive model did not decrease by more than .01.
- INSERT TABLE 3 –
MEASURING TIME ATTITUDES IN YOUNG PEOPLE
15
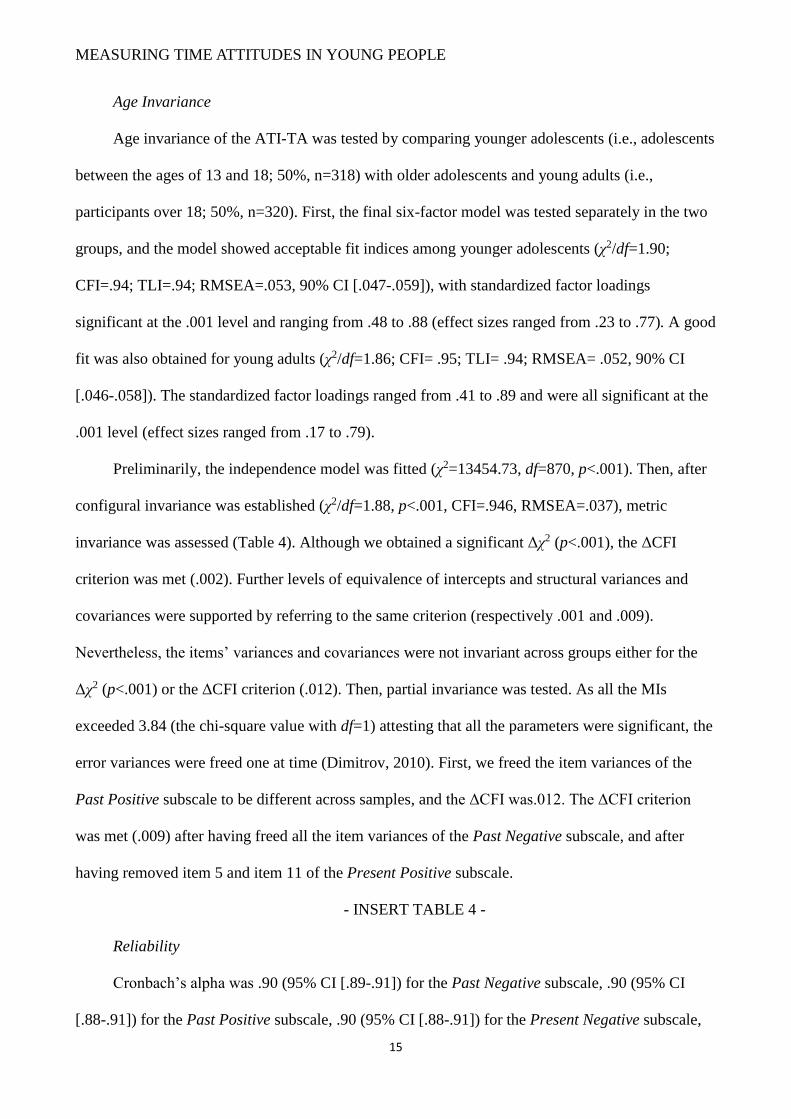
Age Invariance
Age invariance of the ATI-TA was tested by comparing younger adolescents (i.e., adolescents
between the ages of 13 and 18; 50%, n=318) with older adolescents and young adults (i.e.,
participants over 18; 50%, n=320). First, the final six-factor model was tested separately in the two
groups, and the model showed acceptable fit indices among younger adolescents (χ2/df=1.90;
CFI=.94; TLI=.94; RMSEA=.053, 90% CI [.047-.059]), with standardized factor loadings
significant at the .001 level and ranging from .48 to .88 (effect sizes ranged from .23 to .77). A good
fit was also obtained for young adults (χ2/df=1.86; CFI= .95; TLI= .94; RMSEA= .052, 90% CI
[.046-.058]). The standardized factor loadings ranged from .41 to .89 and were all significant at the
.001 level (effect sizes ranged from .17 to .79).
Preliminarily, the independence model was fitted (χ2=13454.73, df=870, p<.001). Then, after
configural invariance was established (χ2/df=1.88, p<.001, CFI=.946, RMSEA=.037), metric
invariance was assessed (Table 4). Although we obtained a significant Δχ2 (p<.001), the ΔCFI
criterion was met (.002). Further levels of equivalence of intercepts and structural variances and
covariances were supported by referring to the same criterion (respectively .001 and .009).
Nevertheless, the items’ variances and covariances were not invariant across groups either for the
Δχ2 (p<.001) or the ΔCFI criterion (.012). Then, partial invariance was tested. As all the MIs
exceeded 3.84 (the chi-square value with df=1) attesting that all the parameters were significant, the
error variances were freed one at time (Dimitrov, 2010). First, we freed the item variances of the
Past Positive subscale to be different across samples, and the ΔCFI was.012. The ΔCFI criterion
was met (.009) after having freed all the item variances of the Past Negative subscale, and after
having removed item 5 and item 11 of the Present Positive subscale.
- INSERT TABLE 4 -
Reliability
Cronbach’s alpha was .90 (95% CI [.89-.91]) for the Past Negative subscale, .90 (95% CI
[.88-.91]) for the Past Positive subscale, .90 (95% CI [.88-.91]) for the Present Negative subscale,
MEASURING TIME ATTITUDES IN YOUNG PEOPLE
16
.92 (95% CI [.91-.93]) for the Present Positive subscale, .74 (95% CI [.71-.77]) for the Future
Negative subscale, and .83 (95% CI [.81-.85]) for the Future Positive subscale. All corrected item-
total correlations were above .40. With regard to McDonald’s Ω values, they were equivalent to the
Cronbach’s alpha values. Following the cut-offs proposed by the European Federation of
Psychologists’ Association (EFPA; Evers et al., 2013), the internal consistency value was adequate
for the Future Negative subscale, good for the Future Positive subscale, and excellent for the other
subscales.
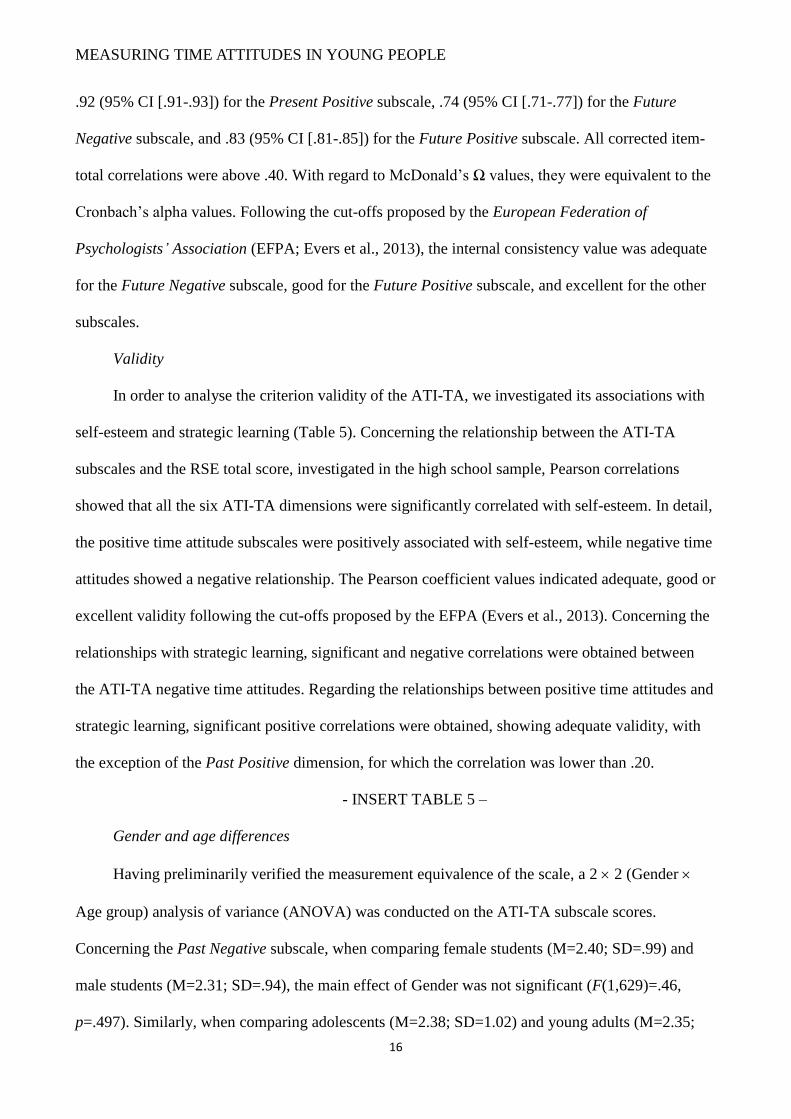
Validity
In order to analyse the criterion validity of the ATI-TA, we investigated its associations with
self-esteem and strategic learning (Table 5). Concerning the relationship between the ATI-TA
subscales and the RSE total score, investigated in the high school sample, Pearson correlations
showed that all the six ATI-TA dimensions were significantly correlated with self-esteem. In detail,
the positive time attitude subscales were positively associated with self-esteem, while negative time
attitudes showed a negative relationship. The Pearson coefficient values indicated adequate, good or
excellent validity following the cut-offs proposed by the EFPA (Evers et al., 2013). Concerning the
relationships with strategic learning, significant and negative correlations were obtained between
the ATI-TA negative time attitudes. Regarding the relationships between positive time attitudes and
strategic learning, significant positive correlations were obtained, showing adequate validity, with
the exception of the Past Positive dimension, for which the correlation was lower than .20.
- INSERT TABLE 5 –
Gender and age differences
Having preliminarily verified the measurement equivalence of the scale, a 2 2 (Gender
Age group) analysis of variance (ANOVA) was conducted on the ATI-TA subscale scores.
Concerning the Past Negative subscale, when comparing female students (M=2.40; SD=.99) and
male students (M=2.31; SD=.94), the main effect of Gender was not significant (F(1,629)=.46,
p=.497). Similarly, when comparing adolescents (M=2.38; SD=1.02) and young adults (M=2.35;
MEASURING TIME ATTITUDES IN YOUNG PEOPLE
17
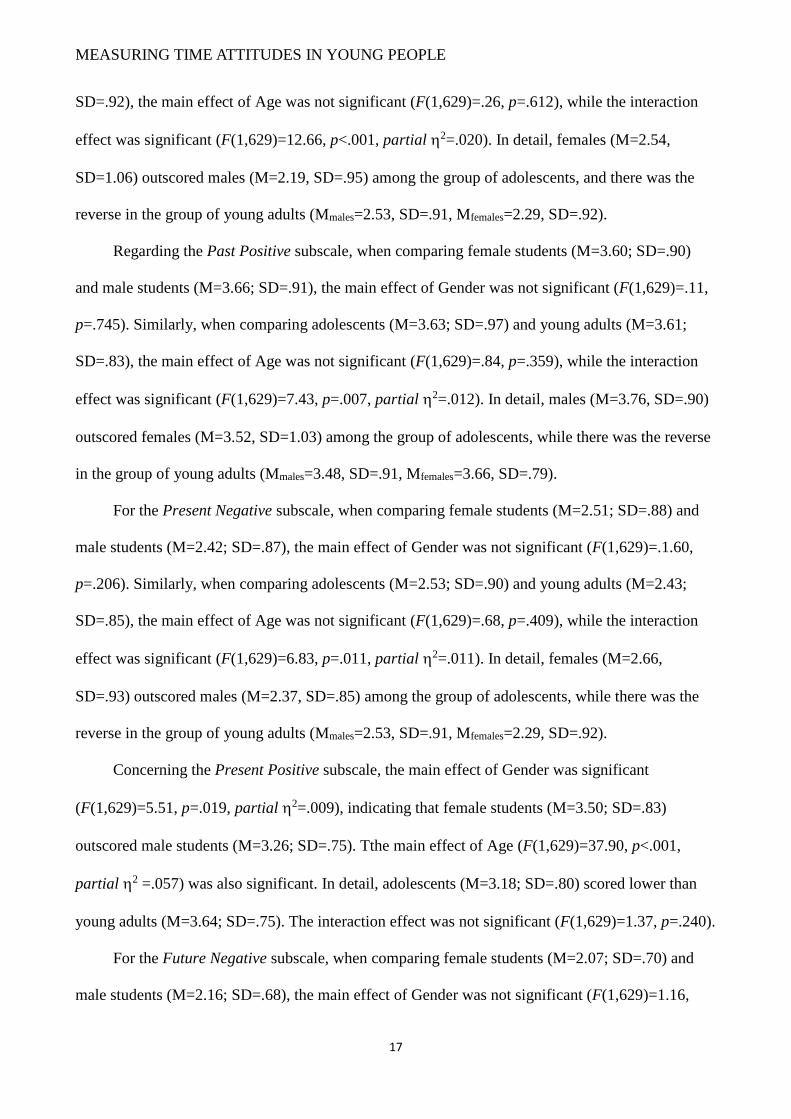
SD=.92), the main effect of Age was not significant (F(1,629)=.26, p=.612), while the interaction
effect was significant (F(1,629)=12.66, p<.001, partial 2=.020). In detail, females (M=2.54,
SD=1.06) outscored males (M=2.19, SD=.95) among the group of adolescents, and there was the
reverse in the group of young adults (Mmales=2.53, SD=.91, Mfemales=2.29, SD=.92).
Regarding the Past Positive subscale, when comparing female students (M=3.60; SD=.90)
and male students (M=3.66; SD=.91), the main effect of Gender was not significant (F(1,629)=.11,
p=.745). Similarly, when comparing adolescents (M=3.63; SD=.97) and young adults (M=3.61;
SD=.83), the main effect of Age was not significant (F(1,629)=.84, p=.359), while the interaction
effect was significant (F(1,629)=7.43, p=.007, partial 2=.012). In detail, males (M=3.76, SD=.90)
outscored females (M=3.52, SD=1.03) among the group of adolescents, while there was the reverse
in the group of young adults (Mmales=3.48, SD=.91, Mfemales=3.66, SD=.79).
For the Present Negative subscale, when comparing female students (M=2.51; SD=.88) and
male students (M=2.42; SD=.87), the main effect of Gender was not significant (F(1,629)=.1.60,
p=.206). Similarly, when comparing adolescents (M=2.53; SD=.90) and young adults (M=2.43;
SD=.85), the main effect of Age was not significant (F(1,629)=.68, p=.409), while the interaction
effect was significant (F(1,629)=6.83, p=.011, partial 2=.011). In detail, females (M=2.66,
SD=.93) outscored males (M=2.37, SD=.85) among the group of adolescents, while there was the
reverse in the group of young adults (Mmales=2.53, SD=.91, Mfemales=2.29, SD=.92).
Concerning the Present Positive subscale, the main effect of Gender was significant
(F(1,629)=5.51, p=.019, partial 2=.009), indicating that female students (M=3.50; SD=.83)
outscored male students (M=3.26; SD=.75). Tthe main effect of Age (F(1,629)=37.90, p<.001,
partial 2 =.057) was also significant. In detail, adolescents (M=3.18; SD=.80) scored lower than
young adults (M=3.64; SD=.75). The interaction effect was not significant (F(1,629)=1.37, p=.240).
For the Future Negative subscale, when comparing female students (M=2.07; SD=.70) and
male students (M=2.16; SD=.68), the main effect of Gender was not significant (F(1,629)=1.16,
MEASURING TIME ATTITUDES IN YOUNG PEOPLE
18
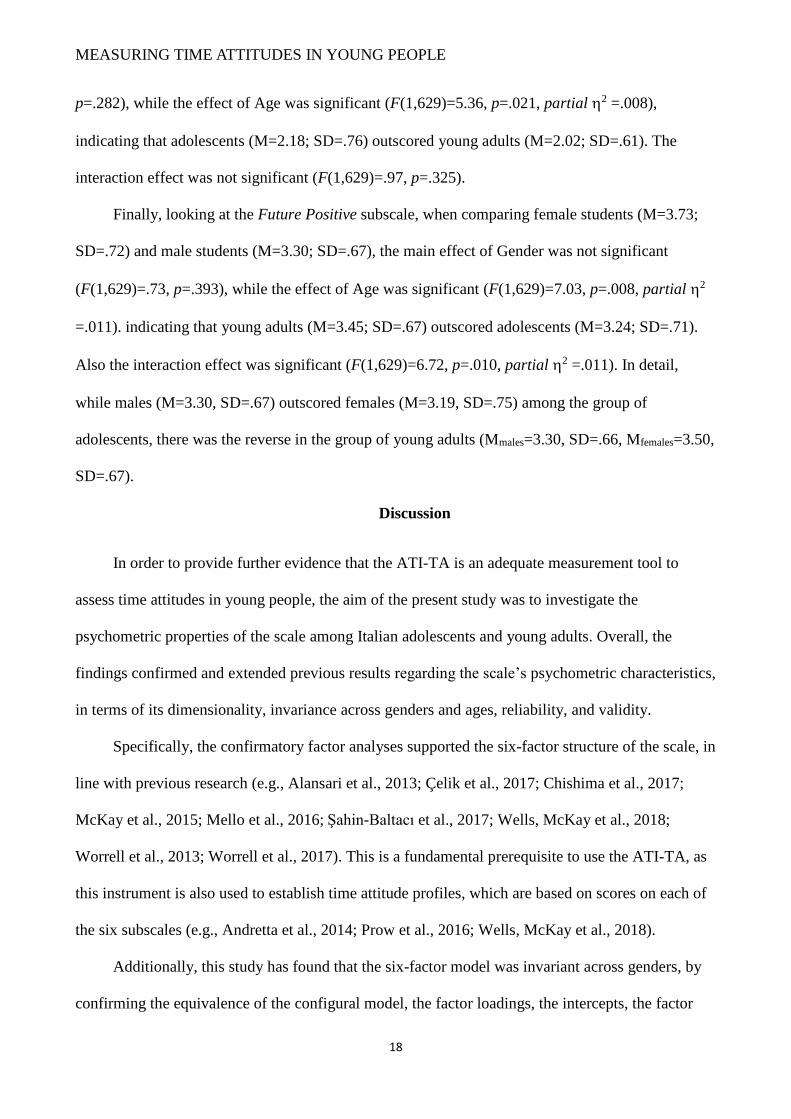
p=.282), while the effect of Age was significant (F(1,629)=5.36, p=.021, partial 2 =.008),
indicating that adolescents (M=2.18; SD=.76) outscored young adults (M=2.02; SD=.61). The
interaction effect was not significant (F(1,629)=.97, p=.325).
Finally, looking at the Future Positive subscale, when comparing female students (M=3.73;
SD=.72) and male students (M=3.30; SD=.67), the main effect of Gender was not significant
(F(1,629)=.73, p=.393), while the effect of Age was significant (F(1,629)=7.03, p=.008, partial 2
=.011). indicating that young adults (M=3.45; SD=.67) outscored adolescents (M=3.24; SD=.71).
Also the interaction effect was significant (F(1,629)=6.72, p=.010, partial 2 =.011). In detail,
while males (M=3.30, SD=.67) outscored females (M=3.19, SD=.75) among the group of
adolescents, there was the reverse in the group of young adults (Mmales=3.30, SD=.66, Mfemales=3.50,
SD=.67).
Discussion
In order to provide further evidence that the ATI-TA is an adequate measurement tool to
assess time attitudes in young people, the aim of the present study was to investigate the
psychometric properties of the scale among Italian adolescents and young adults. Overall, the
findings confirmed and extended previous results regarding the scale’s psychometric characteristics,
in terms of its dimensionality, invariance across genders and ages, reliability, and validity.
Specifically, the confirmatory factor analyses supported the six-factor structure of the scale, in
line with previous research (e.g., Alansari et al., 2013; Çelik et al., 2017; Chishima et al., 2017;
McKay et al., 2015; Mello et al., 2016; Şahin-Baltacı et al., 2017; Wells, McKay et al., 2018;
Worrell et al., 2013; Worrell et al., 2017). This is a fundamental prerequisite to use the ATI-TA, as
this instrument is also used to establish time attitude profiles, which are based on scores on each of
the six subscales (e.g., Andretta et al., 2014; Prow et al., 2016; Wells, McKay et al., 2018).
Additionally, this study has found that the six-factor model was invariant across genders, by
confirming the equivalence of the configural model, the factor loadings, the intercepts, the factor
MEASURING TIME ATTITUDES IN YOUNG PEOPLE
19
variances and covariances, and the measurement residuals across male and female respondents. As
a previous study has shown scalar invariance across genders (Worrell et al., 2017), having reached
higher level of equivalence in the multigroup confirmatory analysis represents an important novelty
in the psychometric literature focused on the ATI-TA. Moreover, this result is of particular
importance, as the issue of gender differences and similarities in adolescent TA has been widely
debated in the literature (e.g., Andretta et al., 2013; Andretta et al., 2014; Mello & Worrell, 2006).
Extending Worrell and colleagues’ (2017) results obtained with younger participants, we have
found that the ATI-TA scores also have “the same meaning” (Reise & Waller, 2009) across males
and females in a young adult sample. Overall, the ATI-TA is an effective and adequate
measurement tool to compare attitude towards time between male and female respondents. That is,
group differences or similarities can be interpreted as true differences or similarities in the
underlying construct.
This study also offers empirical evidence for the invariance of the ATI-TA across adolescents
and young adults, reaching the level of equivalence of measurement error variances/covariances.
However, this level was only partially supported. Nevertheless, partial invariance should be
interpreted as a situation in which there is no perfect invariance for the specific parameters – in this
case, error variances – but neither is there evidence of their complete inequality (Dimitrov, 2010).
Furthermore, linking this result to previous research, although Mello et al. (2016) suggested that the
ATI-TA could be considered a measurement tool suitable for adolescents as well as adults, based on
their invariance analyses, they only reached configural invariance for the total scale across three age
groups ranging from late adolescence to older age. Our results represent a more robust empirical
evidence of the age invariance of the ATI-TA, that allows researchers to use this tool to investigate
age differences and similarities in TA by comparing mean scores (e.g., (Andretta et al., 2014;
Worrell & Mello, 2009).
Concerning gender and age differences, we have only found a small in size gender difference
in the Present Positive perspective, with girls scoring higher than boys, while for the other scales
MEASURING TIME ATTITUDES IN YOUNG PEOPLE
20
any differences were found (Andretta et al., 2013; Andretta et al., 2014), and a significant age
differences in the Past Positive and Future Positive, in which young adults outscored adolescents,
and in Future Negative, in which adolescents scored higher than young adolescents. The differences
in the Future are consistent with the suggestion that the perception of the future characterizes
adolescents (Mello, Finan, & Worrell, 2013). Our findings are important mostly in the light of the
literature suggesting mixed results regarding gender and age differences in TP. Indeed, although
females have been found to be more focused on the future and to have a more positive future
outlook, and to see the past in a more positive way than males (Keough et al., 1999; Morsanyi &
Fogarasi, 2014; Zimbardo & Boyd, 1999), and males scored higher than females in the tendency to
perceive the present hedonistically (Keough et al., 1999), some other studies did not find significant
gender differences (McCabe & Barnett, 2000). There is a similar inconsistency in findings
regarding age differences, with some studies showing an increase in future orientation and a
decrease in present- and past orientation during adolescence, whereas other research suggests that
adolescents focus more on the present, especially in terms of a hedonistic perception of the present,
rather than the past or the future (see Mello & Worrell, 2006). Having an instrument that can be
considered invariant across genders and age represents a great advantage in pursuing this line of
research regarding the broader construct of TP.
Concerning reliability, our results are in line with previous studies (e.g. Alansari et al., 2013;
Andretta et al., 2013; Çelik et al., 2017; McKay et al., 2015; Mello et al., 2016; Prow et al., 2016;
Şahin-Baltacı et al., 2017; Worrell et al., 2013) in showing that all Cronbach’s alpha and
McDonald’s Ω values were good or excellent, with the Future Negative subscale characterized by a
lower level of internal consistency than the other TAs, even though the alpha values were adequate
in our study.
Finally, with respect to validity, evidence of adequate, good, or excellent concurrent validity
was obtained considering the relationship between the ATI-TA scores and self-esteem (e.g.,
Andretta et al. 2014; Şahin-Baltacı et al., 2017; Worrell & Mello, 2009) and strategic learning,
MEASURING TIME ATTITUDES IN YOUNG PEOPLE
21
confirming the association of time attitudes with school engagement and effective learning
strategies (Worrell & Hale, 2001). The pattern of correlations also suggests that self-esteem is
particularly strongly related to the present perspectives, whereas (a lack of) strategic learning was
most strongly predicted by negative time attitudes.
Concerning the practical implications, this study suggests that the ATI-TA can be adequately
used to measure TA in research and practice involving Italian youth. From a research point of view,
as the ATI-TA has been widely employed with adolescents, highlighting that TA is related to
various types of risky behaviours, i.e., having positive attitudes towards alcohol and using alcohol
(Wells, Morgan, et al., 2018), and both positive and negative psychological outcomes, such as
perceived stress and psychosomatic symptomatology, optimism, hope, self-esteem, academic
achievement and expectations, as well as self-efficacy (Alansari et al., 2013; Andretta et al., 2013;
Andretta et al., 2014; Buhl & Linder, 2009; Konowalczyk et al., 2018; Mello et al., 2016; Morgan et
al., 2017; Wells, McKay, et al., 2018; Worrell & Mello, 2009), this study offers evidence of the
adequacy of using this instrument for research into adolescent behavioral and psychological
outcomes. Moreover, as more and more studies are using the ATI-TA to assess time attitude,
offering proof of the robustness of the scale from a psychometric point of view allows researchers
to draw more reliable and valid interpretations of their findings concerning the psychological
functioning of adolescents and young adults.
From a practical perspective, the ATI-TA provides specific and detailed cues for developing
ad-hoc interventions. Indeed, the instrument could help practitioners in the early identification of
adolescents characterized by negative attitudes toward the different time periods, and in planning
educational interventions for them. For instance, if adolescents with negative time attitudes toward
the past, present or future are detected, they could be educated at looking at their past or present
experiences in searching for the reasons why they have this kind of attitude. Moreover, they could
be helped in developing more adaptive views of their future using individual activities that are
aimed at converting negative thoughts into positive beliefs about the future.
MEASURING TIME ATTITUDES IN YOUNG PEOPLE
22
Some limitations of this study have to be pointed out, such as an imbalance of genders across
the adolescent and young adult samples, and the fact that the overall sample was from a specific
geographic area of Italy. As a result, the sample cannot be considered to be nationally
representative. Additionally, the older group included college students who can be considered a
selective group of high-achieving young adults. Thus, further investigations are needed to
strengthen the present findings. For instance, by also including early adolescents, i.e., students
attending middle school, it might be interesting to also test the invariance of the scale across school
grades, extending research on the measurement invariance of the ATI-TA across age groups (Mello
et al., 2016). The psychometric properties of the scale could also be tested among adults without
college education. Moreover, the criterion validity of the scale should be more thoroughly
investigated.
To conclude, the present results provide evidence that the Italian version of the ATI-TA is
psychometrically appropriate to be used with young people in order to assess TA. This is a
promising finding as the ATI-TA is the only measure that currently assesses both positive and
negative attitudes toward the past, the present, and the future, without confounding this
measurement with the assessment of other psychological constructs.
References
Akaike, H. (1974). A new look at the statistical model identification. IEEE transactions on
automatic control, 19(6), 716-723.
Alansari, M., Worrell, F. C., Rubie-Davies, C., & Webber, M. (2013). Adolescent Time Attitude
Scale (ATAS) scores and academic outcomes in secondary school females in New Zealand.
International Journal of Quantitative Research in Education, 1, 251-274.
https://doi.org/10.1504/IJQRE.2013.057687
Andretta, J. R., Worrell, F. C., & Mello, Z. R. (2014). Predicting educational outcomes and
psychological well‐being in adolescents using time attitude profiles. Psychology in the
Schools, 51(5), 434-451. DOI: 10.1002/pits.21762
MEASURING TIME ATTITUDES IN YOUNG PEOPLE
23
Andretta, J. R., Worrell, F. C., Mello, Z. R., Dixson, D. D., & Baik, S. H. (2013). Demographic
group differences in adolescents' time attitudes. Journal of Adolescence, 36(2), 289-301.
https://doi.org/10.1016/j.adolescence.2012.11.005
Arbuckle, J., & Wothke, W. (1999). AMOS 4 user’s reference guide. Chicago: Smallwaters
Corporation.
Bentler, P. M. (1990). Comparative fit indexes in structural models. Psychological Bulletin, 107(2),
238-246.
Boyd, J. N., & Zimbardo, P. G. (2005). Time perspective, health, and risk taking. In A. Strathman,
& J. Joireman (Eds.), Understanding behavior in the context of time: Theory, research, and
application (pp. 85–107). Mahwah, NJ: Lawrence Erlbaum Associates.
Buhl, M., & Linder, D. (2009). Time perspectives in adolescence: Measurement, profiles, and links
with personality characteristics and scholastic experience. Diskurs Kindheits und
Jungendforschung, 2, 197–216.
Byrne, B. M. (2004). Testing for multigroup invariance using AMOS graphics: A road less traveled.
Structural Equation Modeling, 11(2), 272-300. https://doi.org/10.1207/s15328007sem1102_8
Çelik, E., Sahranç, Ü., Kaya, M., & Turan, M. E. (2017). Adolescent Time Attitude Scale:
Adaptation into Turkish. Universal Journal of Educational Research, 5(2), 249-254. DOI:
10.13189/ujer.2017.050210
Cheung, G. W., & Rensvold, R. B. (2002). Evaluating goodness-of-fit indexes for testing
measurement invariance. Structural Equation Modeling, 9(2), 233-255.
https://doi.org/10.1207/S15328007SEM0902_5
Chiesi, F., Primi, C., Bilgin, A. A., Lopez, M. V., del Carmen Fabrizio, M., Gozlu, S., & Tuan, N.
M. (2015). Measuring University Students’ Approaches to Learning Statistics: An Invariance
Study. Journal of Psychoeducational Assessment, 1-13.
https://doi.org/10.1177/0734282915596125
MEASURING TIME ATTITUDES IN YOUNG PEOPLE
24
Chishima, Y., Murakami, T., Worrell, F. C., & Mello, Z. R. (2017). The Japanese Version of the
Adolescent Time Inventory–Time Attitudes (ATI-TA) Scale: Internal Consistency, Structural
Validity, and Convergent Validity. Assessment, https://doi.org/10.1177/1073191116683800
Cronbach, L. J., & Shavelson, R. J. (2004). My current thoughts on coefficient alpha and successor
procedures. Educational and Psychological Measurement, 64(3), 391-418.
https://doi.org/10.1177/0013164404266386
Dimitrov, D. M. (2010). Testing for Factorial Invariance in the Context of Construct Validation.
Measurement and Evaluation in Counseling and Development, 43(2), 121-149.
https://doi.org/10.1177/0748175610373459
Dörnyei, Z. (2009). Individual differences: Interplay of learner characteristics and learning
environment. Language Learning, 59(s1), 230-248. DOI: 10.1111/j.1467-9922.2009.00542.x
Drake, L., Duncan, E., Sutherland, F., Abernethy, C., & Henry, C. (2008). Time perspective and
correlates of wellbeing. Time & Society, 17(1), 47-61.
https://doi.org/10.1177/0961463X07086304
Erikson, E. (1968). Identity: Youth and crisis. New York: Norton.
Evers, A., Hagemeister, C., Høstmælingen, A., Lindley, P., Muñiz, J., & Sjöberg, A. (2013, July).
EFPA Review Model for the description and evaluation of psychological and educational
tests. Test review form and notes for reviewers. Version 4.2.6.
Ghasemi, A., & Zahediasl, S. (2012). Normality tests for statistical analysis: a guide for non-
statisticians. International Journal of Endocrinology and Metabolism, 10(2), 486-489. DOI:
10.5812/ijem.3505
Henson, J. M., Carey, M. P., Carey, K. B., & Maisto, S. A. (2006). Associations among health
behaviors and time perspective in young adults: Model testing with boot-strapping replication.
Journal of Behavioral Medicine, 29(2), 127-137. https://doi.org/10.1007/s10865-005-9027-2
MEASURING TIME ATTITUDES IN YOUNG PEOPLE
25
Hu, L. T., & Bentler, P. M. (1999). Cutoff criteria for fit indexes in covariance structure analysis:
Conventional criteria versus new alternatives. Structural Equation Modeling: A
Multidisciplinary Journal, 6(1), 1-55. https://doi.org/10.1080/10705519909540118
Keough, K. A., Zimbardo, P. G., & Boyd, J. N. (1999). Who's smoking, drinking, and using drugs?
Time perspective as a predictor of substance use. Basic and applied social psychology, 21(2),
149-164.
Kline, R. B. (2010). Principles and Practice of Structural Equation Modeling (3rd ed.). New York:
Guilford Press.
Konowalczyk, S., McKay, M. T., Wells, K. E., & Cole, J. C. (2018). The Influence of Time
Attitudes Profile Membership on Mental Well-being and Psychosomatic Symptomatology: A
United Kingdom-based Prospective Study. Psychiatry Research, 375-382.
https://doi.org/10.1016/j.psychres.2017.12.071
Laghi, F., Baiocco, R., D'Alessio, M., & Gurrieri, G. (2009). Suicidal ideation and time perspective
in high school students. European Psychiatry, 24(1), 41-46.
https://doi.org/10.1016/j.eurpsy.2008.08.006
Little, T. D. (1997). Mean and covariance structures (MACS) analyses of cross-cultural data:
Practical and theoretical issues. Multivariate Behavioral Research, 32(1), 53-76.
Luszczynska, A., Gibbons, F. X., Piko, B. F., & Tekozel, M. (2004). Self-regulatory
cognitions, social comparison, and perceived peers’ behaviors as predictors of nutrition and
physical activity: A comparison among adolescents in Hungary, Poland, Turkey, and
USA. Psychology & Health, 19(5), 577-593. https://doi.org/10.1080/0887044042000205844
McCabe, K., & Barnett, D. (2000). First comes work, then comes marriage: Future orientation
among African American young adolescents. Family Relations, 49(1), 63-70.
McDonald, R. P. (1999). Test theory: A unified treatment. Mahwah, NJ. Erlbaum.
McKay, M. T., Cole, J. C., Percy, A., Worrell, F. C., & Mello, Z. R. (2015). Reliability and factorial
validity of Adolescent Time Inventory–Time Attitude (ATI-TA) scores in Scottish and
MEASURING TIME ATTITUDES IN YOUNG PEOPLE
26
Northern Irish adolescents. Personality and Individual Differences, 86, 412-416.
https://doi.org/10.1016/j.paid.2015.06.040
Meade, A. W., Johnson, E. C., & Braddy, P. W. (2008). Power and sensitivity of alternative fit
indices in tests of measurement invariance. Journal of Applied Psychology, 93(3), 568-592.
DOI: 10.1037/0021-9010.93.3.568
Mello, Z. R., Finan, L. J., & Worrell, F. C. (2013). Introducing an instrument to assess time
orientation and time relation in adolescents. Journal of Adolescence, 36(3), 551-563.
https://doi.org/10.1016/j.adolescence.2013.03.005
Mello, Z. R., Walker, E. B., Finan, L. J., Stiasny, A., Wiggers, I. C., McBroom, K. A., & Worrell,
F. C. (2017). Time perspective, psychological outcomes, and risky behavior among runaway
adolescents. Applied Developmental Science, 1-11.
https://doi.org/10.1080/10888691.2016.1276455
Mello, Z. R., & Worrell, F. C. (2006). The relationship of time perspective to age, gender, and
academic achievement among academically talented adolescents. Journal for the Education of
the Gifted, 29(3), 271-289. https://doi.org/10.1177/016235320602900302
Mello, Z. R., & Worrell, F. C. (2007). The Adolescent Time Attitude Scale–English. University of
California, Berkeley, CA: Author.
Mello, Z. R., Worrell, F. C., Laghi, F., Baiocco, R., & Lonigro, A. (2011). The Adolescent time
Inventory-Italian. Unpublished scale: The University of Colorado, Colorado Springs and
Sapienza University of Rome.
Mello, Z. R., Zhang, J. W., Barber, S. J., Paoloni, V. C., Howell, R. T., & Worrell, F. C. (2016).
Psychometric properties of time attitude scores in young, middle, and older adult samples.
Personality and Individual Differences, 101, 57-61.
https://doi.org/10.1016/j.paid.2016.05.037
Morgan, G. B., Wells, K. E., Andretta, J. R., & McKay, M. T. (2017). Temporal attitudes profile
transition among adolescents: A longitudinal examination using mover− stayer latent
MEASURING TIME ATTITUDES IN YOUNG PEOPLE
27
transition analysis. Psychological Assessment, 29(7), 890-901.
http://dx.doi.org/10.1037/pas0000383
Morsanyi, K., & Fogarasi, E. (2014). Thinking about the past, present and future in adolescents
growing up in Children's Homes. Journal of Adolescence, 37(7), 1043-1056.
https://doi.org/10.1016/j.adolescence.2014.07.011
Piaget, J. (1955). The development of time concepts in the child. In P. H. Hoch & J. Zubin
(Eds.), Psychopathology of childhood (pp. 34-44). London: Grube and Stratton.
Prezza, M., Trombaccia, F.R., & Armento, L. (1997). La scala dell'autostima di Rosenberg:
traduzione e validazione italiana. Bollettino di Psicologia Applicata, 223, 35-44.
Prow, R. M., Worrell, F. C., Andretta, J. R., & Mello, Z. R. (2016). Demographic Differences in
Adolescent Time Attitude Profiles in an Urban High School: A Person-Oriented Analysis
Using Model-Based Clustering. Berkeley Review of Education, 6(1), 79-95.
https://escholarship.org/uc/item/4bb6r8n6
Reise, S. P., & Waller, N. G. (2009). Item response theory and clinical measurement. Annual
Review of Clinical Psychology, 5, 27-48.
https://doi.org/10.1146/annurev.clinpsy.032408.153553
Rosenberg, M. (1965). Rosenberg self-esteem scale (RSE). Acceptance and commitment therapy.
Measures package, 61, 52.
Şahin-Baltacı, H., Tagay, Ö., Worrell, F. C., & Mello, Z. R. (2017). Psychometric properties of
Turkish Adolescent Time Inventory-Time Attitude (ATI-TA) scores. International
Perspectives in Psychology: Research, Practice, Consultation, 6(1), 47-59.
http://dx.doi.org/10.1037/ipp0000066
Scheier, M. F., & Carver, C. S. (1985). Optimism, coping, and health: assessment and implications
of generalized outcome expectancies. Health Psychology, 4(3), 219-247.
MEASURING TIME ATTITUDES IN YOUNG PEOPLE
28
Schermelleh-Engel, K., Moosbrugger, H., & Müller, H. (2003). Evaluating the fit of structural
equation models: Tests of significance and descriptive goodness-of-fit measures. Methods of
Psychological Research Online, 8(2), 23-74. http://www.mpr-online.de
Schwarz, G. (1978). Estimating the dimension of a model. The Annals of Statistics, 6(2), 461-464.
Shipp, A. J., Edwards, J. R., & Lambert, L. S. (2009). Conceptualization and measurement of
temporal focus: The subjective experience of the past, present, and future. Organizational
Behavior and Human Decision Processes, 110(1), 1-22. DOI: 10.1016/j.obhdp.2009.05.001
Snyder, C. R., Sympson, S. C., Ybasco, F. C., Borders, T. F., Babyak, M. A., & Higgins, R. L.
(1996). The development and validation of the Stage Hope Scale. Journal of Personality and
Social Psychology, 2, 321 – 335Steiger, J. H., & Lind, J. C. (1980, April). Statistically-based
tests for the number of common factors. Annual spring meeting of the Psychometric Society,
Iowa City.
Steiger, J. H., & Lind, J. C. (1980, May). Statistically based tests for the number of common
factors. In annual meeting of the Psychometric Society, Iowa City, IA (Vol. 758, pp. 424-453).
Struyven, K., Dochy, F., Janssens, S., & Gielen, S. (2006). On the dynamics of students' approaches
to learning: The effects of the teaching/learning environment. Learning and Instruction,
16(4), 279-294. https://doi.org/10.1016/j.learninstruc.2006.07.001
Tait, H., Entwistle, N. J., & McCune, V. (1998). ASSIST: A reconceptualisation of the approaches
to studying inventory. Improving student learning: Improving students as learners, 262-271.
Tucker, L. R., & Lewis, C. (1973). A reliability coefficient for maximum likelihood factor analysis.
Psychometrika, 38, 1-10.
Vandenberg, R. J., & Lance, C. E. (2000). A review and synthesis of the measurement invariance
literature: Suggestions, practices, and recommendations for organizational
research. Organizational Research Methods, 3(1), 4-70.
https://doi.org/10.1177/109442810031002
MEASURING TIME ATTITUDES IN YOUNG PEOPLE
29
Vrieze, S. I. (2012). Model selection and psychological theory: A discussion of the differences
between the Akaike Information Criterion (AIC) and the Bayesian Information Criterion
(BIC). Psychological Methods, 17(2), 228-243. DOI: 10.1037/a0027127
Waiyavutti, C., Johnson, W., and Deary, I. J. (2011). Do personality scale items function differently
in people with high and low IQ? Psychological Assessment, 24, 545-555. DOI:
10.1037/a0026266
Wells, K. E., Morgan, G., Worrell, F. C., Sumnall, H., & McKay, M. T. (2018). The influence of
time attitudes on alcohol-related attitudes, behaviors and subjective life expectancy in early
adolescence: A longitudinal examination using mover–stayer latent transition
analysis. International Journal of Behavioral Development, 42(1), 93-105.
https://doi.org/10.1177/0165025416679740
Wells, K. E., McKay, M. T., Morgan, G. B., & Worrell, F. C. (2018). Time attitudes predict
changes in adolescent self-efficacy: A 24-month latent transition mover-stayer analysis.
Journal of Adolescence, 62, 27-37. https://doi.org/10.1016/j.adolescence.2017.10.005
Wills, T. A., Sandy, J. M., & Yaeger, A. M. (2001). Time perspective and early-onset substance
use: A model based on stress–coping theory. Psychology of Addictive Behaviors, 15(2), 118-
125. http://dx.doi.org/10.1037/0893-164X.15.2.118
Worrell, F. C., & Hale, R. L. (2001). The relationship of hope in the future and perceived school
climate to school completion. School Psychology Quarterly, 16(4), 370-388.
http://dx.doi.org/10.1521/scpq.16.4.370.19896
Worrell, F. C., & Mello, Z. R. (2007). The reliability and validity of Zimbardo Time Perspective
Inventory scores in academically talented adolescents. Educational and Psychological
Measurement, 67(3), 487-504. https://doi.org/10.1177/0013164406296985
Worrell, F. C., & Mello, Z. R. (2009). Convergent and discriminant validity of time attitude scores
on the Adolescent Time Perspective Inventory. Diskurs Kindheits und Jugendforschung
[Research on Child and Adolescent Development], 4, 185–196-
MEASURING TIME ATTITUDES IN YOUNG PEOPLE
30
Worrell, F. C., Mckay, M. T., & Andretta, J. R. (2018). Psychometric properties of Adolescent
Time Inventory Time Attitude (ATI-TA) scores in three waves of longitudinal data.
Psychological Assessment, 30(1), 106-115. DOI: 10.1037/pas0000457
Worrell, F. C., Mello, Z. R., & Buhl, M. (2013). Introducing English and German versions of the
adolescent time attitude scale. Assessment, 20(4), 496-510.
https://doi.org/10.1177/1073191110396202
Wyman, P. A., Cowen, E. L., Work, W. C., Raoof, A., Gribble, P. A., Parker, G. R., & Wannon, M.
(1992). Interviews with children who experienced major life stress: Family and child
attributes that predict resilient outcomes. Journal of the American Academy of Child &
Adolescent Psychiatry, 31(5), 904-910.
Zimbardo, P. G. & Boyd, J. N. (1999). Putting time in perspective: A valid, reliable individual-
differences metric. Journal of Personality and Social Psychology, 77, 1271-1288.
Zimbardo, P. G., Keough, K. A., & Boyd, J. N. (1997). Present time perspective as a predictor of
risky driving. Personality and Individual Differences, 23(6), 1007-1023.
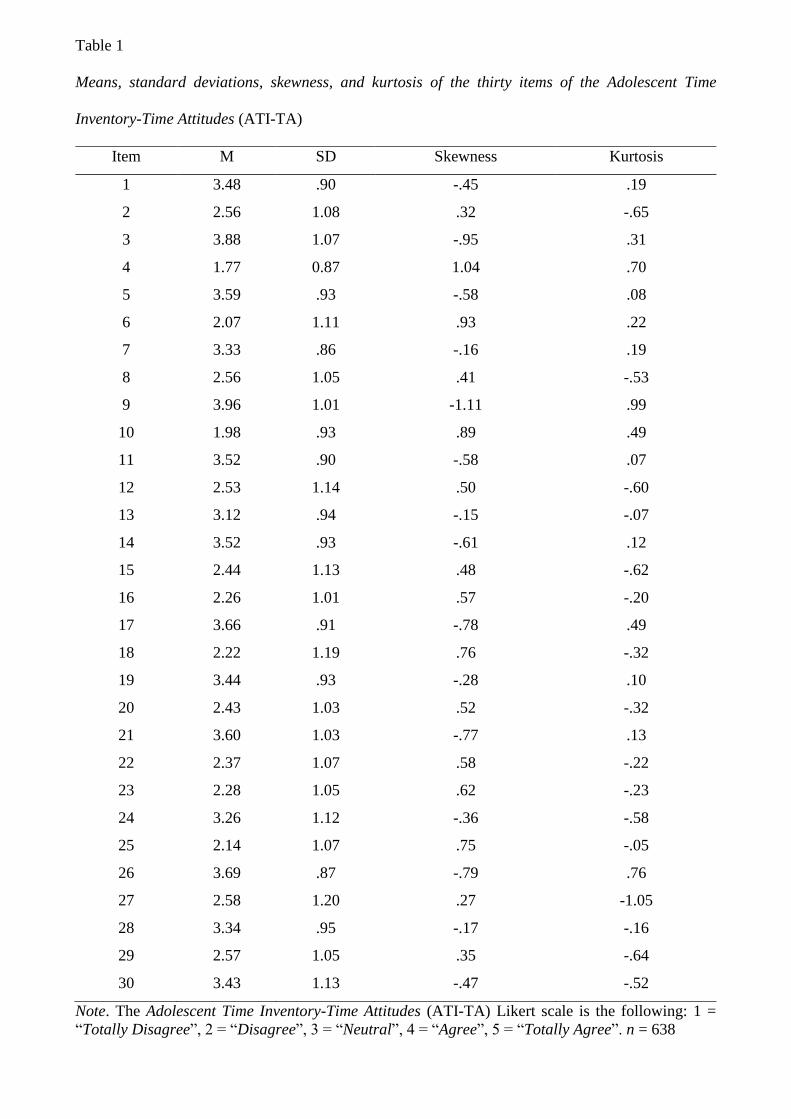
Table 1
Means, standard deviations, skewness, and kurtosis of the thirty items of the Adolescent Time
Inventory-Time Attitudes (ATI-TA)
Item M SD Skewness Kurtosis
1 3.48 .90 -.45 .19
2 2.56 1.08 .32 -.65
3 3.88 1.07 -.95 .31
4 1.77 0.87 1.04 .70
5 3.59 .93 -.58 .08
6 2.07 1.11 .93 .22
7 3.33 .86 -.16 .19
8 2.56 1.05 .41 -.53
9 3.96 1.01 -1.11 .99
10 1.98 .93 .89 .49
11 3.52 .90 -.58 .07
12 2.53 1.14 .50 -.60
13 3.12 .94 -.15 -.07
14 3.52 .93 -.61 .12
15 2.44 1.13 .48 -.62
16 2.26 1.01 .57 -.20
17 3.66 .91 -.78 .49
18 2.22 1.19 .76 -.32
19 3.44 .93 -.28 .10
20 2.43 1.03 .52 -.32
21 3.60 1.03 -.77 .13
22 2.37 1.07 .58 -.22
23 2.28 1.05 .62 -.23
24 3.26 1.12 -.36 -.58
25 2.14 1.07 .75 -.05
26 3.69 .87 -.79 .76
27 2.58 1.20 .27 -1.05
28 3.34 .95 -.17 -.16
29 2.57 1.05 .35 -.64
30 3.43 1.13 -.47 -.52
Note. The Adolescent Time Inventory-Time Attitudes (ATI-TA) Likert scale is the following: 1 =
“Totally Disagree”, 2 = “Disagree”, 3 = “Neutral”, 4 = “Agree”, 5 = “Totally Agree”. n = 638
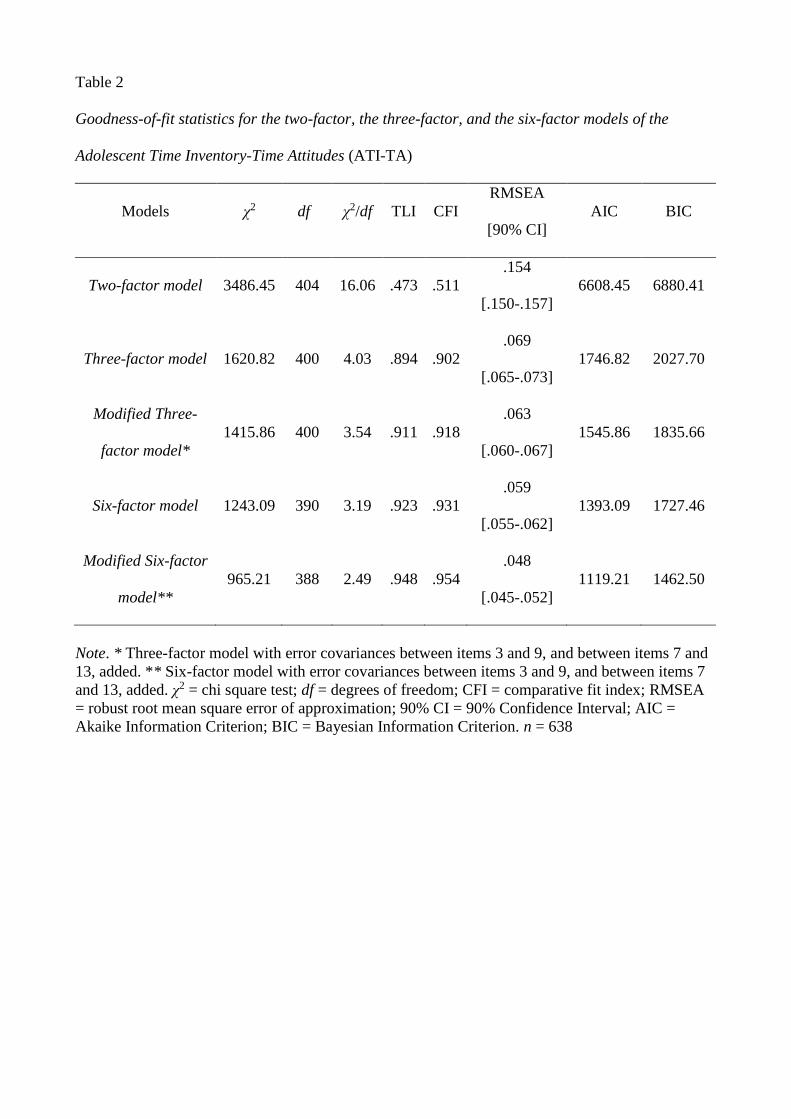
Table 2
Goodness-of-fit statistics for the two-factor, the three-factor, and the six-factor models of the
Adolescent Time Inventory-Time Attitudes (ATI-TA)
Note. * Three-factor model with error covariances between items 3 and 9, and between items 7 and
13, added. ** Six-factor model with error covariances between items 3 and 9, and between items 7
and 13, added. χ2 = chi square test; df = degrees of freedom; CFI = comparative fit index; RMSEA
= robust root mean square error of approximation; 90% CI = 90% Confidence Interval; AIC =
Akaike Information Criterion; BIC = Bayesian Information Criterion. n = 638
Models χ2 df χ2/df TLI CFI
RMSEA
[90% CI]
AIC BIC
Two-factor model 3486.45 404 16.06 .473 .511
.154
[.150-.157]
6608.45 6880.41
Three-factor model 1620.82 400 4.03 .894 .902
.069
[.065-.073]
1746.82 2027.70
Modified Three-
factor model*
1415.86 400 3.54 .911 .918
.063
[.060-.067]
1545.86 1835.66
Six-factor model 1243.09 390 3.19 .923 .931
.059
[.055-.062]
1393.09 1727.46
Modified Six-factor
model**
965.21 388 2.49 .948 .954
.048
[.045-.052]
1119.21 1462.50
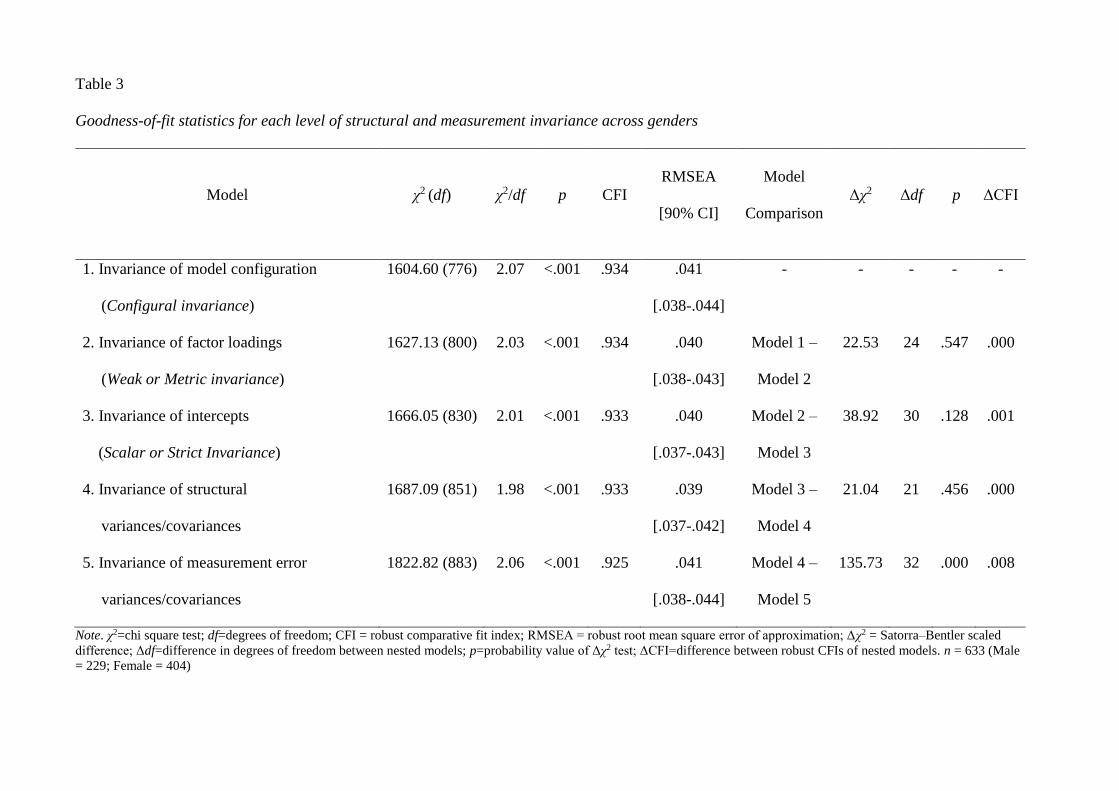
Table 3
Goodness-of-fit statistics for each level of structural and measurement invariance across genders
Model
χ2 (df)
χ2/df p CFI
RMSEA
[90% CI]
Model
Comparison
Δχ2 Δdf p ΔCFI
1. Invariance of model configuration
(Configural invariance)
1604.60 (776) 2.07 <.001 .934 .041
[.038-.044]
- - - - -
2. Invariance of factor loadings
(Weak or Metric invariance)
1627.13 (800) 2.03 <.001 .934 .040
[.038-.043]
Model 1 –
Model 2
22.53 24 .547 .000
3. Invariance of intercepts
(Scalar or Strict Invariance)
1666.05 (830) 2.01 <.001 .933 .040
[.037-.043]
Model 2 –
Model 3
38.92 30 .128 .001
4. Invariance of structural
variances/covariances
1687.09 (851) 1.98 <.001 .933 .039
[.037-.042]
Model 3 –
Model 4
21.04 21 .456 .000
5. Invariance of measurement error
variances/covariances
1822.82 (883) 2.06 <.001 .925 .041
[.038-.044]
Model 4 –
Model 5
135.73 32 .000 .008
Note. χ2=chi square test; df=degrees of freedom; CFI = robust comparative fit index; RMSEA = robust root mean square error of approximation; Δχ2 = Satorra–Bentler scaled
difference; Δdf=difference in degrees of freedom between nested models; p=probability value of Δχ2 test; ΔCFI=difference between robust CFIs of nested models. n = 633 (Male
= 229; Female = 404)
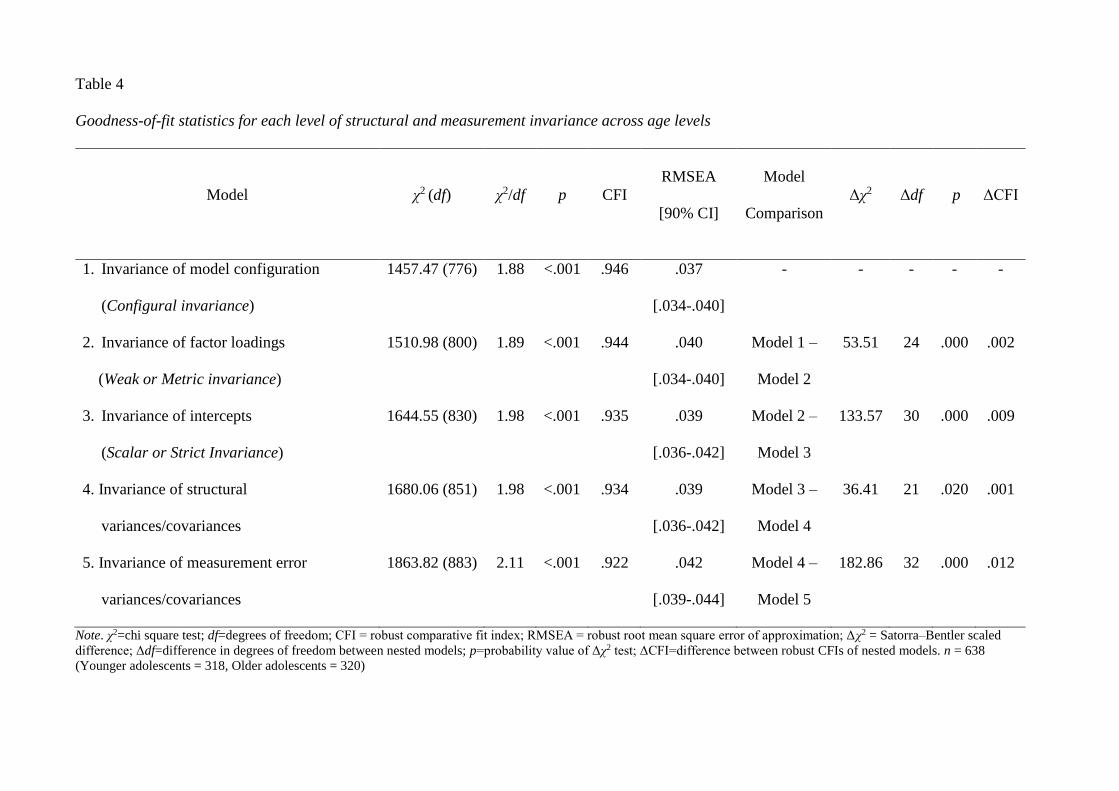
Table 4
Goodness-of-fit statistics for each level of structural and measurement invariance across age levels
Model
χ2 (df)
χ2/df p CFI
RMSEA
[90% CI]
Model
Comparison
Δχ2 Δdf p ΔCFI
1. Invariance of model configuration
(Configural invariance)
1457.47 (776) 1.88 <.001 .946 .037
[.034-.040]
- - - - -
2. Invariance of factor loadings
(Weak or Metric invariance)
1510.98 (800) 1.89 <.001 .944 .040
[.034-.040]
Model 1 –
Model 2
53.51 24 .000 .002
3. Invariance of intercepts
(Scalar or Strict Invariance)
1644.55 (830) 1.98 <.001 .935 .039
[.036-.042]
Model 2 –
Model 3
133.57 30 .000 .009
4. Invariance of structural
variances/covariances
1680.06 (851) 1.98 <.001 .934 .039
[.036-.042]
Model 3 –
Model 4
36.41 21 .020 .001
5. Invariance of measurement error
variances/covariances
1863.82 (883) 2.11 <.001 .922 .042
[.039-.044]
Model 4 –
Model 5
182.86 32 .000 .012
Note. χ2=chi square test; df=degrees of freedom; CFI = robust comparative fit index; RMSEA = robust root mean square error of approximation; Δχ2 = Satorra–Bentler scaled
difference; Δdf=difference in degrees of freedom between nested models; p=probability value of Δχ2 test; ΔCFI=difference between robust CFIs of nested models. n = 638
(Younger adolescents = 318, Older adolescents = 320)
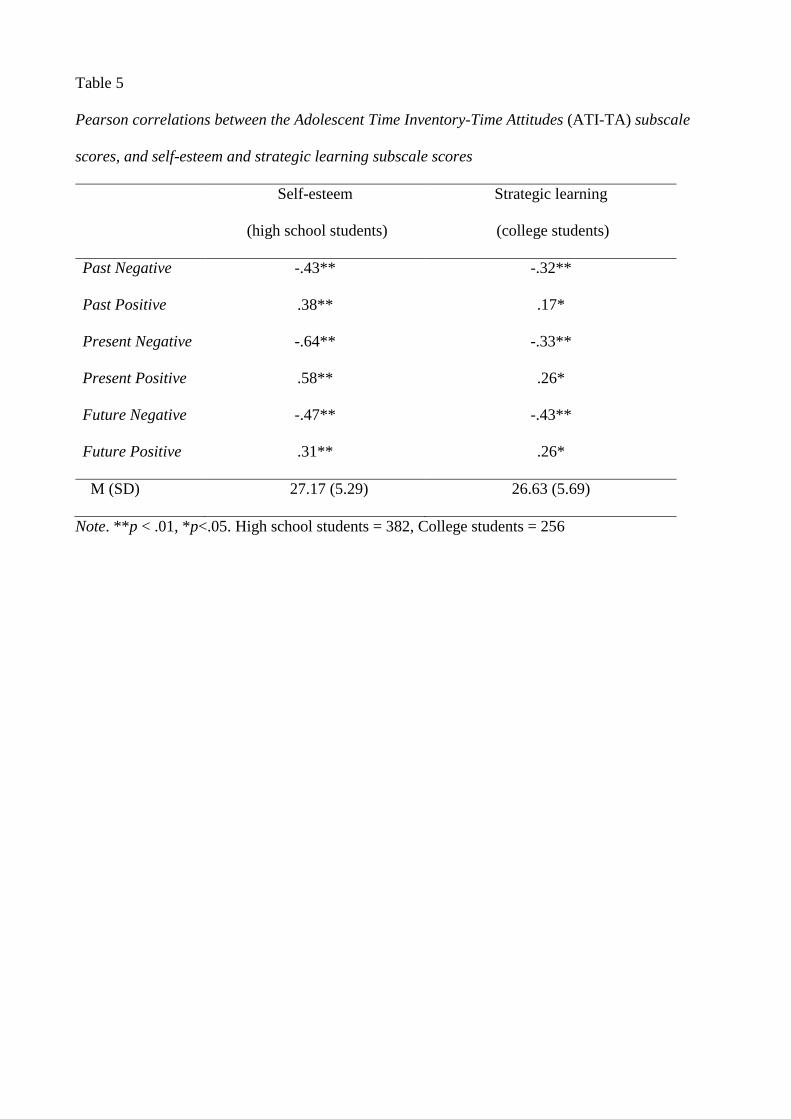
Table 5
Pearson correlations between the Adolescent Time Inventory-Time Attitudes (ATI-TA) subscale
scores, and self-esteem and strategic learning subscale scores
Self-esteem
(high school students)
Strategic learning
(college students)
Past Negative -.43** -.32**
Past Positive .38** .17*
Present Negative -.64** -.33**
Present Positive .58** .26*
Future Negative -.47** -.43**
Future Positive .31** .26*
M (SD) 27.17 (5.29) 26.63 (5.69)
Note. **p < .01, *p<.05. High school students = 382, College students = 256
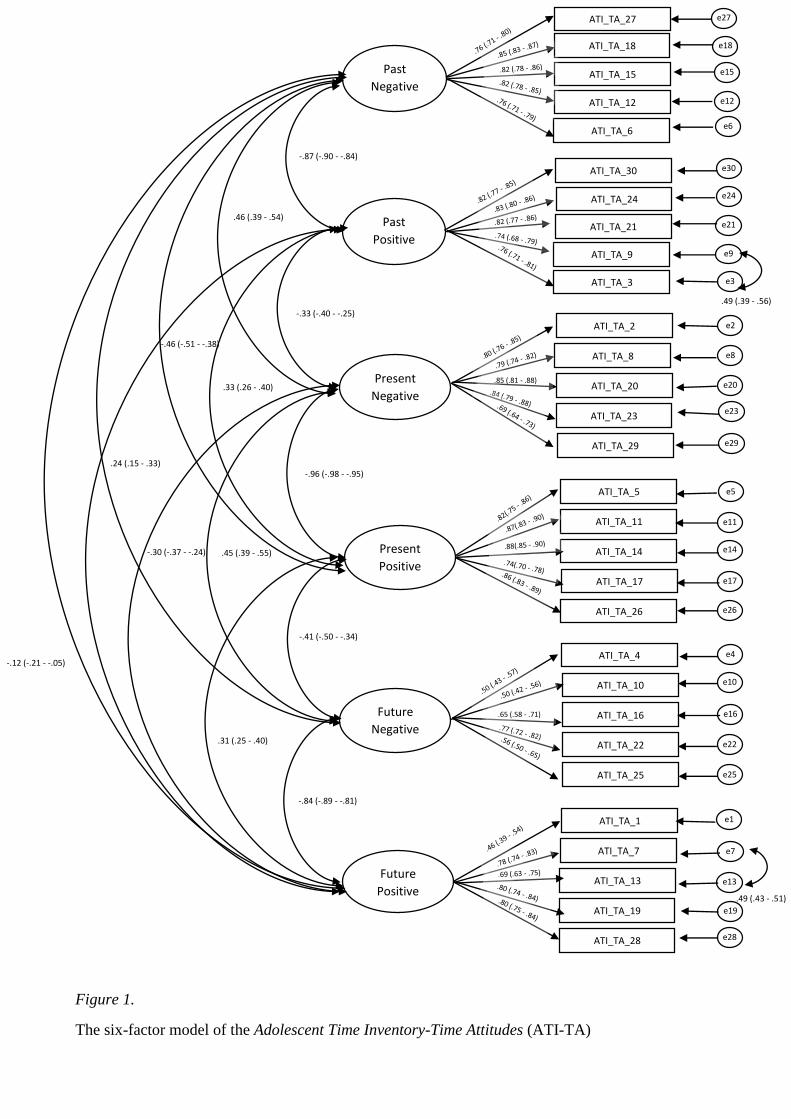
Figure 1.
The six-factor model of the Adolescent Time Inventory-Time Attitudes (ATI-TA)
ATI_TA_27 e27
27
Past
Negative
ATI_TA_18
ATI_TA_15
ATI_TA_12
ATI_TA_6
ATI_TA_30
ATI_TA_24
ATI_TA_21
ATI_TA_9
ATI_TA_3
e18
27 e15
27 e12
27 e6
27
e30
27
ATI_TA_2
ATI_TA_8
ATI_TA_20
ATI_TA_23
ATI_TA_29
e24
27 e21
27 e9
27 e3
27
e2
27 e8
27 e20
27 e23
27 e29
27
ATI_TA_5
ATI_TA_11
ATI_TA_14
ATI_TA_17
ATI_TA_26
e5
27
ATI_TA_4
ATI_TA_10
ATI_TA_16
ATI_TA_22
ATI_TA_25
ATI_TA_1
ATI_TA_7
ATI_TA_13
ATI_TA_19
ATI_TA_28
e11
27 e14
27 e17
27 e26
27
e4
27 e10
27 e16
27 e22
27 e25
27
e1
27 e7
27 e13
32
7 e19
27 e28
27
Present
Negative
Present
Positive
Future
Negative
Future
Positive
-.87 (-.90 - -.84)
Past
Positive .46 (.39 - .54)
-.33 (-.40 - -.25)
.85 (.81 - .88) )
-.96 (-.98 - -.95)
-.41 (-.50 - -.34)
-.84 (-.89 - -.81)
.65 (.58 - .71) )) ) ) )
.33 (.26 - .40)
.45 (.39 - .55)
.31 (.25 - .40)
-.46 (-.51 - -.38)
-.30 (-.37 - -.24)
.24 (.15 - .33)
-.12 (-.21 - -.05)
.49 (.43 - .51)
.49 (.39 - .56)

Note: standardized parameters, all significant at .001, with relative 90% Confidence Intervals, n =
638