Embed Size (px)
Citation preview
CDC: Safer - Healthier - People ~ 1
Using the BMI-for-Age Growth Charts
INTRODUCTION
The Body Mass Index (BMI)-for-age charts for boys and girls aged 2 to 20 years are a major addition to the new CDC Pediatric Growth Charts. For the first time there is a screening tool to assess risk of overweight and overweight in children and adolescents. This module presents the rationale behind the decision to include the BMI-for-age charts, discusses characteristics of the BMI-for-age charts, and provides an opportunity for practical application of calculating BMI, and plotting and interpreting BMI-for-age through case studies.
OBJECTIVES
• Describe the advantages of using the BMI-for-age charts as a screening tool to evaluate overweight and underweight in children and adolescents
• Calculate BMI using the metric and English methods
• Demonstrate an understanding of the use of the BMI-for-age chart by accurately plotting and interpreting BMI-for-age on the appropriate chart
TABLE OF CONTENTS
1. What is BMI?
2. Advantages to using BMI-for-age as a screening tool for overweight and underweight
3. Recommendations for using BMI to assess overweight
4. Characteristics of BMI-for-age
5. Recommended BMI-for-age cutoffs
6. Calculating BMI
7. Other methods to obtain BMI
8. Visual assessment versus calculation of BMI
9. Accuracy of measurements
10. Interpretation
11. Summary
12. Steps to plot and interpret BMI-for-age
13. References and resources
Appendix
CDC: Safer - Healthier - People ~ 2
1. WHAT IS BMI?
• An anthropometric index of weight and height Body Mass Index (BMI) is an anthropometric index of weight and height that is defined as body weight in kilograms divided by height in meters squared (Keys et al., 1972).
BMI = weight (kg) / height (m)² BMI is the commonly accepted index for classifying adiposity in adults and it is recommended for use with children and adolescents.
• A screening tool Like weight-for-stature, BMI is a screening tool used to identify individuals who are underweight or overweight. BMI is NOT a diagnostic tool (Barlow and Dietz, 1998). For example, a child who is relatively heavy may have a high BMI for his or her age or high weight-for-stature. To determine whether the child has excess fat, further assessment would be needed and that might include skinfold measurements. To determine a counseling strategy, assessments of diet, health, and physical activity are needed. For children, BMI is gender specific and age specific (Hammer et al., 1991; Pietrobelli et al., 1998). Because BMI changes substantially as children get older, BMI-for-age is the measure used for children ages 2 to 20 years.
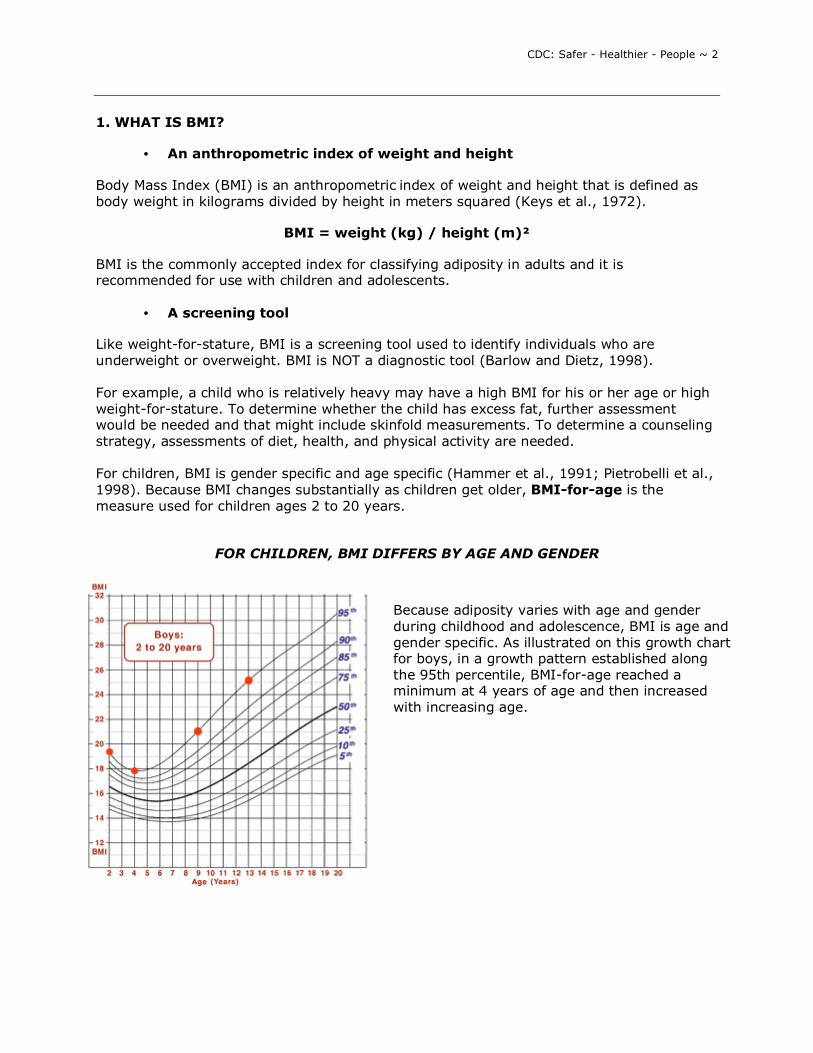
FOR CHILDREN, BMI DIFFERS BY AGE AND GENDER
Because adiposity varies with age and gender during childhood and adolescence, BMI is age and gender specific. As illustrated on this growth chart for boys, in a growth pattern established along the 95th percentile, BMI-for-age reached a minimum at 4 years of age and then increased with increasing age.
CDC: Safer - Healthier - People ~ 3
• An indirect measure of body fatness
BMI is not a direct measure of body fatness. However, BMI parallels changes obtained by direct measures of body fat such as underwater weighing and dual energy x-ray absorptiometry (DXA). BMI can be considered a proxy for measures of body fat.
2. ADVANTAGES TO USING BMI-FOR-AGE AS A SCREENING TOOL FOR OVERWEIGHT AND UNDERWEIGHT There are several advantages to using BMI-for-age as a screening tool for overweight and underweight.
• BMI-for-age provides a reference for adolescents not previously available. When the 1977 NCHS growth charts were developed, weight-for-height percentiles were provided only for prepubescent girls up to 10 years and for boys up to 11.5 years (Hamill et al., 1979). BMI-for-age is the only indicator that allows us to plot a measure of weight and height with age on the same chart. BMI-for-age was not available in the 1977 charts. Age as well as stage of sexual maturity is highly correlated with body fatness (Daniels et al., 1997).
• BMI-for-age is the measure that is consistent with the adult index so it
can be used continuously from 2 years of age to adulthood.
• BMI-for-age is not used in the United States before 2 years of age to screen for growth. BMI values at younger ages have a weak association with adolescent or adult obesity (Whitaker et al., 1997; Guo et al., 1994).
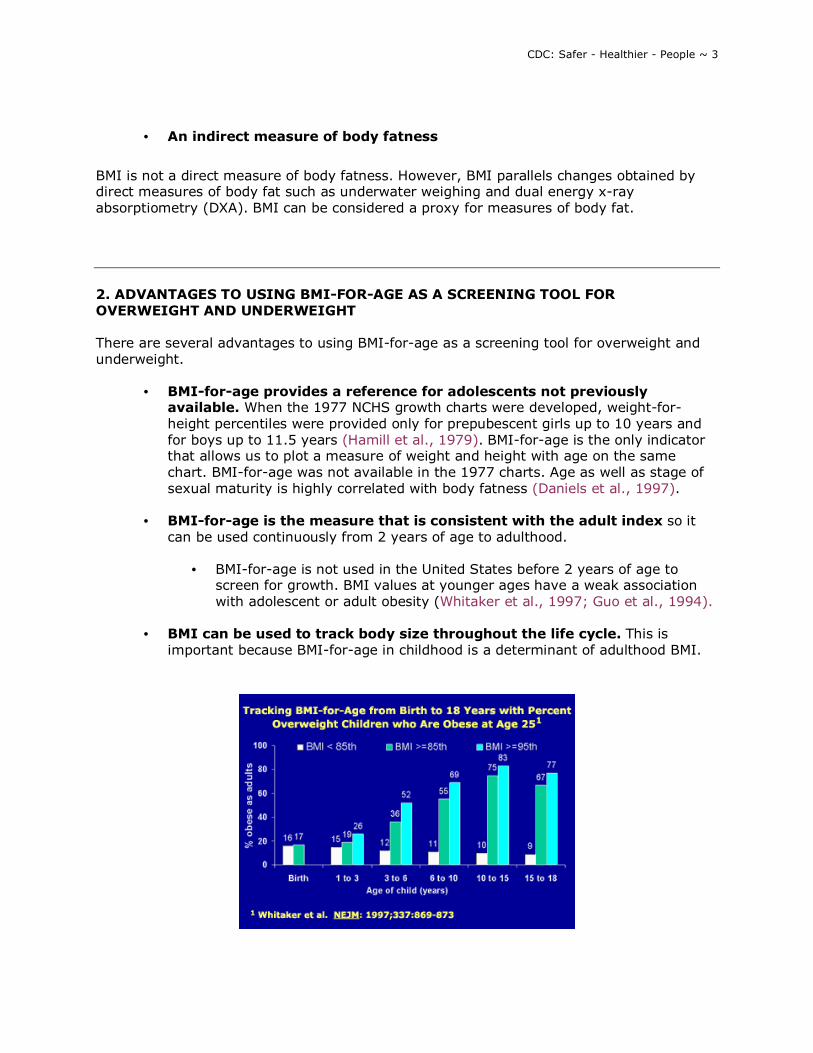
• BMI can be used to track body size throughout the life cycle. This is
important because BMI-for-age in childhood is a determinant of adulthood BMI.
CDC: Safer - Healthier - People ~ 4
The tracking of BMI that occurs from childhood to adulthood is clearly shown in data from a study by Robert Whitaker and colleagues (Whitaker et al., 1997). They examined the probability of obesity in young adults in relation to the presence or absence of overweight at various times during childhood. For example, in children 10 to 15 years old, 10% of those with a BMI-for-age < 85th percentile were obese at age 25 whereas 75% of those with a BMI-for-age > 85th percentile were obese as adults and 80% of those with a BMI-for-age > 95th percentile were obese at age 25. (The sample size for the study was 854.) From this study, it is clear that an overweight child is more likely than a child of normal weight to be obese as an adult.
Other studies have shown this same trend of tracking occurring from childhood to adulthood (Guo et al., 1999; Guo et al., 1994; Garn and LaVelle, 1985).
• BMI-for-age relates to health risks.
o BMI-for-age correlates with clinical risk factors for cardiovascular disease
including hyperlipidemia, elevated insulin and high blood pressure. Freedman and colleagues used data from the Bogalusa Heart Study and found that approximately 60% of 5 to 10 year-old children who were overweight had at least one biochemical or clinical risk factor for cardiovascular disease such as those just mentioned, and 20% had two or more risk factors (Freedman et al., 1999).
o BMI-for-age during pubescence is related to lipid and lipoprotein levels
and blood pressure in middle age (Must et al., 1992). Risk factors in children can become chronic diseases in adults.
• BMI-for-age compares well with both weight-for-stature measurements
and measures of body fat. o A study completed by researchers at the CDC (Mei et al., 2002) compared
the performance of BMI-for-age and weight-for-stature with fatness measured by dual energy x-ray absorptiometry (DXA), a direct measure of adiposity.
• NHANES III data were used to test how well BMI-for-age predicts underweight (below the 15th percentile) and overweight (above the 85th percentile) relative to the traditional weight-for-stature in children 2 to 19 years old.
• Both BMI-for-age and weight-for-stature performed equally well in screening for underweight and overweight among children 3 to 5 years of age.
• For school-aged children (6 to 11 and 12 to 19 age groups), BMI-for-age was slightly better than weight-for-stature in predicting underweight and overweight.
CDC: Safer - Healthier - People ~ 5
• Ratios of weight relative to stature such as BMI-for-age and weight-for-stature may be used as indirect measures of overweight that correlate with direct measures.
• CDC recommends the use of BMI-for-age for children aged 2 years and older. However, weight-for-stature performs equally well in pre-school aged children and can be used in this age group.
• BMI-for-age is significantly correlated with subcutaneous and total body fatness in adolescents (Barlow and Dietz, 1998).
3. RECOMMENDATIONS FOR USING BMI TO ASSESS OVERWEIGHT Because of the numerous advantages of using BMI-for-age to assess overweight in children and adolescents, expert committees and advisory groups have recommended BMI-for-age as the accepted measure.
• In 1994, an expert committee on Clinical Guidelines for Overweight in Adolescent Preventive Services was convened by the Maternal and Child Health Bureau (MCHB), American Academy of Pediatrics and the American Medical Association with support from the Centers for Disease Control and Prevention, to advise Bright Futures: National Guidelines for Health Supervision of Infants, Children and Adolescents and Guidelines for Adolescent Preventive Services (GAPS) on the criteria for the identification of adolescent obesity. The committee recommended that BMI-for-age be used to routinely screen for overweight in adolescents (Himes and Dietz, 1994).
• In 1997, a consensus panel recommended that BMI for age be used routinely to
screen children for overweight. They also recommended cutpoints of between the 85th and 95th percentiles to identify children and adolescents as at risk of overweight and at or above the 95th percentile to identify children and adolescents as overweight. (Barlow and Dietz, 1998).
• Also, in 1997, an international conference convened by the International Obesity
Task Force concluded that BMI is a reasonable measure for assessing overweight in children and adolescents worldwide. (Dietz and Bellizzi, 1999; Bellizzi and Dietz, 1999).
Dr. William Dietz discusses the rationale for the BMI cutpoints, the limitations and sensitivity of BMI-for-age. Dr. Dietz is the Director of the Division of Nutrition and Physical Activity, National Center for Chronic Disease Prevention and Health Promotion, Centers for Disease Control and Prevention, and was a member of the various expert committees on obesity. Full text is included in the Appendix.

CDC: Safer - Healthier - People ~ 6
4. CHARACTERISTICS OF BMI-FOR-AGE
• The shape of the weight-for-stature curve versus the BMI-for-age curve
The shapes of the weight-for-stature and the BMI-for-age growth curves differ, as you can see. The weight-for-stature curve shows how weight increases in relation to stature. The 1977 weight-for-stature charts are limited to prepubescent boys under 11.5 years of age and statures of less than 145 cm and to prepubescent girls under 10 years of age and statures less than 137 cm (Hamill et al., 1979). The BMI-for-age chart shows age-related changes in growth and can be used up to age 20. With the BMI-for-age chart weight, stature and age of a child are considered whereas with the weight-for-stature chart, only weight and height are used.
• The shape of the BMI-for-age chart clearly illustrates "adiposity" rebound
BMI changes substantially with age. After about 1 year of age, BMI-for-age begins to decline and it continues falling during the preschool years until it reaches a minimum around 4 to 6 years of age. After 4 to 6 years of age, BMI-for-age begins a gradual increase through adolescence and most of adulthood. The rebound or increase in BMI that occurs after it reaches its lowest point is referred to as "adiposity" rebound (Whitaker et al., 1998; Rolland-Cachera et al., 1991; Rolland-Cachera et al., 1984). This is a normal pattern of growth that occurs in all children.
Age (months) BMI26 18.2 32 17.4 38 18.5 41 18.7
CDC: Safer - Healthier - People ~ 7
Here you see a section of the BMI-for-age chart for boys enlarged to show the shape of the curve in more detail. After 4 to 6 years of age, BMI-for-age begins a gradual increase through adolescence and most of adulthood. The rebound or increase in BMI that occurs after it reaches its lowest point is referred to as "adiposity" rebound (Whitaker et al., 1998; Rolland-Cachera et al., 1991; Rolland-Cachera et al., 1984). This is a normal pattern of growth that occurs in all children.
Recent research has shown that the age when the "adiposity" rebound occurs may be a critical period in childhood for the development of obesity as an adult (Whitaker et al., 1998). An early "adiposity" rebound, occurring before ages 4 to 6, is associated with obesity in adulthood. In the example shown here, adiposity rebound occurred at around age 3. BMI reached the lowest point at 32 months (2 years 8 months) and then began to increase.
However, studies have yet to determine whether the higher BMI in childhood is truly adipose tissue versus lean body mass or bone. Additional research is needed to further understand the impact of early adiposity rebound on adult obesity. (Note that we put the word adiposity in quotations when using it in this context since we do not know if it is truly adipose tissue.)
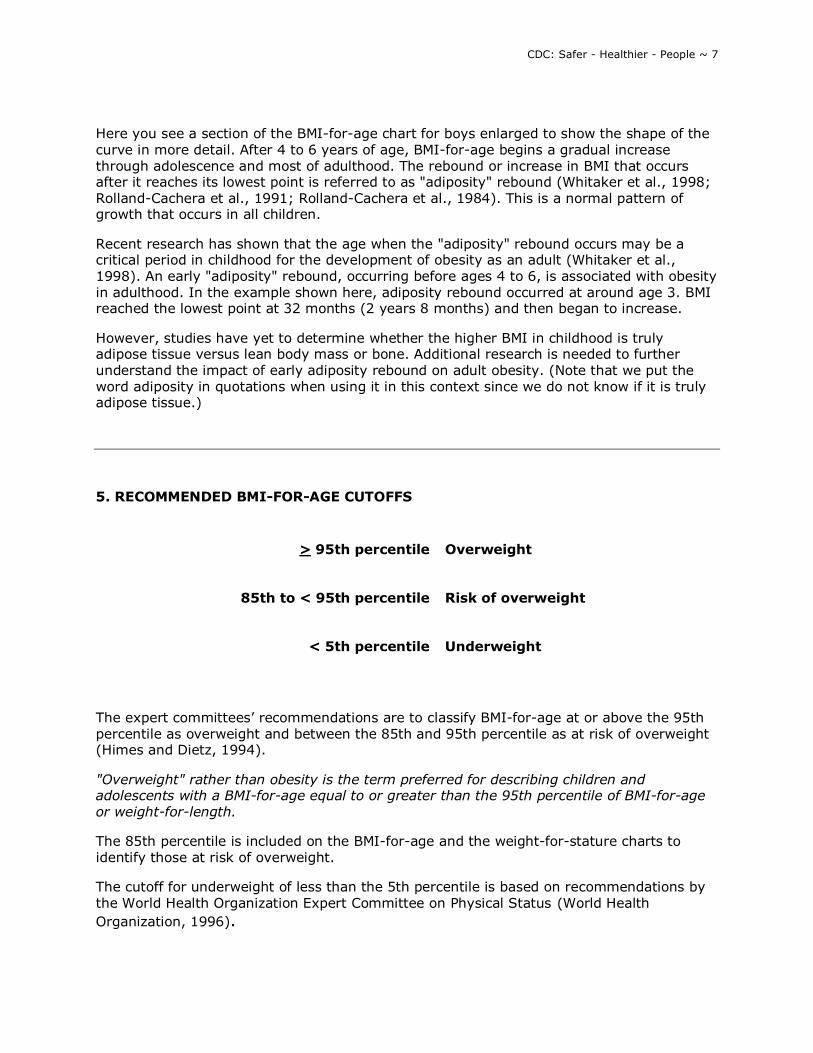
5. RECOMMENDED BMI-FOR-AGE CUTOFFS
The expert committees� recommendations are to classify BMI-for-age at or above the 95th percentile as overweight and between the 85th and 95th percentile as at risk of overweight (Himes and Dietz, 1994).
"Overweight" rather than obesity is the term preferred for describing children and adolescents with a BMI-for-age equal to or greater than the 95th percentile of BMI-for-age or weight-for-length.
The 85th percentile is included on the BMI-for-age and the weight-for-stature charts to identify those at risk of overweight.
The cutoff for underweight of less than the 5th percentile is based on recommendations by the World Health Organization Expert Committee on Physical Status (World Health Organization, 1996).
> 95th percentile
Overweight
85th to < 95th percentile Risk of overweight
< 5th percentile Underweight

CDC: Safer - Healthier - People ~ 8
Classifications of Overweight and Underweight for Adults
Classification of overweight and underweight is different for adults than it is for children and adolescents. For adults, overweight and underweight categories are defined by fixed BMI cutpoints derived from morbidity and mortality data. Adults with low and very high BMIs are at a higher relative mortality risk compared to those with BMIs of 18.5 or greater and less than 30.0 (Strawbridge et al., 2000). For adults, BMI is not age- or gender-specific as it is for children and adolescents.
Clinical guidelines established in 1998 by the National Heart, Lung, and Blood Institute are as follows:
Performance of BMI-for-Age As A Screening Tool
"The validity of selected cutoff points to identify adolescents with the highest percentage of body fat has been investigated. In general, common cutoff points for BMI and relative weight have low sensitivities but high specificities. For example, BMIs > 85th percentile has a sensitivity of 29% and 23% for identifying adolescent males and females, respectively, who are above the 90th percentile for percentage body fat; corresponding specificities are 99% and 100% (Himes and Bouchard, 1989). In screening for adolescent overweight, specificity may be more important than sensitivity. Maximizing specificity minimizes the proportion of adolescents who will be incorrectly considered overweight by the screen" (Himes and Dietz, 1994).
Recently it has been shown that cardiovascular risk factors are associated with the established BMI-for-age cutoffs. Freedman et al., (1999) found that approximately 60% of 5 to 10 year-old children with BMI-for-age values > the 95th percentile had at least one biochemical or clinical risk factor for cardiovascular disease such as hypertension, elevated insulin levels, and hyperlipidemia. Twenty percent of children had two or more risk factors.
6. CALCULATING BMI
BMI can be calculated using either the metric system or the English system.
BMI less than 18.5 underweight
BMI of 18.5 through 24.9 normal
BMI of 25.0 through 29.9 overweight
BMI of 30.0 or greater obese
CDC: Safer - Healthier - People ~ 9
CALCULATING BMI USING THE METRIC SYSTEM
Formula: weight (kg) / [height (m)]2
Calculation: [weight (kg) / height (cm) / height (cm)] x 10,000
With the metric system, the formula for BMI is weight in kilograms divided by height in meters squared. Since height is commonly measured in centimeters, an alternate calculation formula, dividing the weight in kilograms by the height in centimeters squared, and then multiplying the result by 10,000, can be used.
It is necessary to multiply by 10,000 to convert BMI to meters since stature measurements are generally taken in centimeters. There are 100 centimeters in a meter and since stature is squared we must convert as such: 100 x 100 = 10,000.
When using a hand-held calculator:
• if your calculator has a square function, divide weight (kg) by height (cm) squared, multiply by 10,000 and round to one decimal place.
• if your calculator does not have a square function, divide weight by height twice as shown in the calculation formula above, multiply by 10,000 and round to one decimal place.
Calculations for BMI can be completed as a continuous equation. (Note that the formula for the latter calculation is on the CDC Clinical Growth Charts and will be the calculation used in this module).
Example: We know that Sam�s weight is 16.9 kg and his height is 105.4 cm. What is Sam�s BMI?
Answer: (16.9 kg / 105.4 cm / 105.4 cm ) x 10,000 = 15.2
Practice calculating BMI using the metric system
Complete the following two calculations, rounding to one decimal place.
Calculation 1: Georgia�s weight is 16.6 kg and her height is 99.1 cm. What is Georgia�s BMI?
Answer: (16.6 kg / 99.1 cm / 99.1 cm) x 10,000 = 16.9
Calculation 2: Jose�s weight is 18.3 kg and his height is 103.5 cm. What is Jose�s BMI?
Answer: (18.3 kg / 103.5 cm / 103.5 cm) x 10,000 = 17.1
CALCULATING BMI USING THE ENGLISH SYSTEM
Formula: weight (lb) / [height (in)]2 x 703
Calculation: [weight (lb) / height (in) / height (in)] x 703
CDC: Safer - Healthier - People ~ 10
When using English measurements, ounces (oz) and fractions must be changed to decimal values. Then, calculate BMI by dividing weight in pounds (lbs) by height in inches (in) squared and multiplying by a conversion factor of 703.
• When using a hand-held calculator, if your calculator has a square function, divide weight (lbs) by height (in) squared, multiply by 703 and round to one decimal place.
• If your calculator does not have a square function, divide weight by height twice as shown in the calculation above, multiply by 703 and round to one decimal place.
Calculations for BMI can be completed as a continuous equation. Note that the formula for the latter calculation is on the CDC Clinical Growth Charts and will be the calculation used in this module. Example: Let�s calculate Sam�s BMI using the English numeric system. His weight is 37 pounds and 4 ounces and his height is 41 1/2 inches. Convert ounces and fractions to decimals:
Weight of 37 lbs and 4 oz = 37.25 lbs (16 ounces = 1 pound so 4 oz/16 oz = 0.25).
Height = 41.5 in.
(37.25 lbs / 41.5 in / 41.5 in) x 703 = 15.2
Practice calculating BMI using the English system
Complete the following two calculations, rounding to one decimal place.
Calculation 1: Georgia�s weight is 36 ½ pounds and her height is 39 inches. What is Georgia�s BMI?
Answer: Convert fractions to decimals: Weight of 36 ½ lbs = 36.5 lbs (36.5 lbs / 39 in / 39 in) x 703 = 16.9 Calculation 2: Jose�s weight is 40 ¼ pounds and his height is 40 ¾ inches. What is Jose�s BMI? Answer: Convert fractions to decimals: Weight of 40 ¼ lbs = 40.25 lbs Height of 40 ¾ in = 40.75 in (40.25 lbs / 40.75 / 40.75) x 703 = 17.0 Note: There is a difference of 0.1 between BMI calculations when using the metric system (17.1) versus the English system (17.0). This is due to the conversion factor.
CDC: Safer - Healthier - People ~ 11
7. OTHER METHODS TO OBTAIN BMI
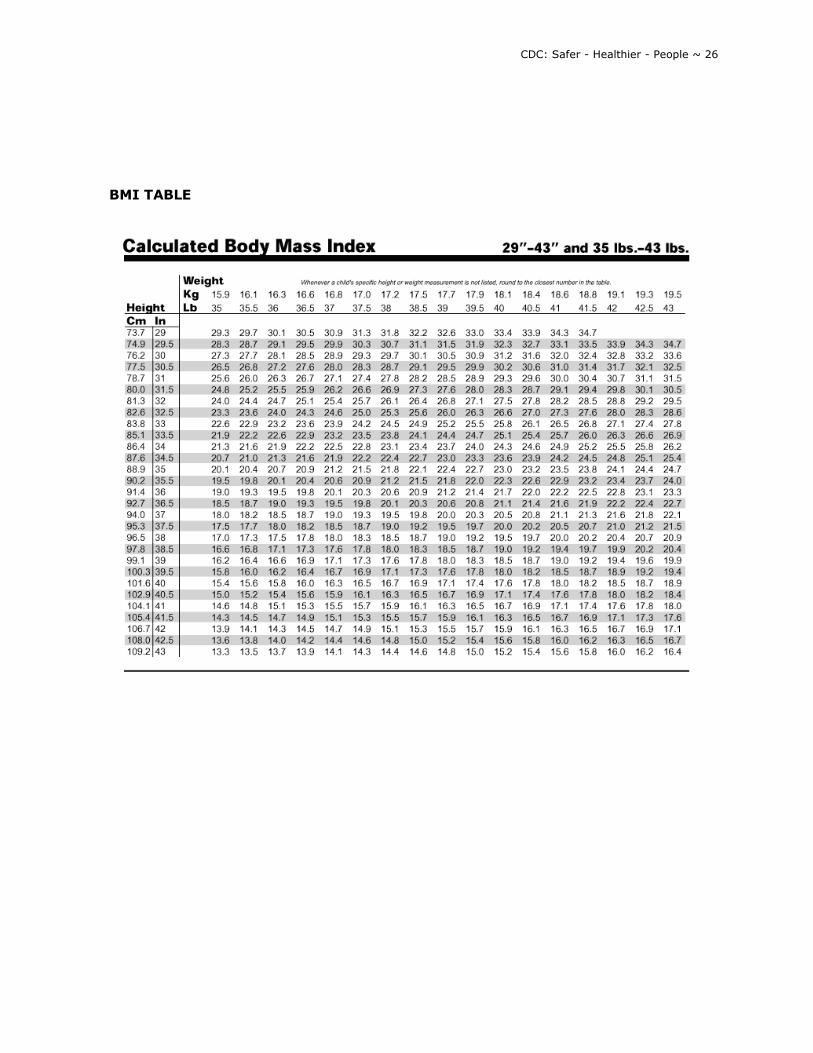
• CDC Table for Calculated Body Mass Index Values for Selected Heights and Weights for Ages 2 to 20
In addition to calculations, BMI can also be determined by looking it up on the CDC Table for Calculated Body Mass Index Values for Selected Heights and Weights for Ages 2 to 20 in which BMI has been calculated.
Example:
Using the metric system, find the BMI for a child with a weight of 17.0 kg and a height of 105.4 cm.
Using the English system, find the BMI for a child with a weight of 37.5 lb and a height of 41.5 in.
See BMI TABLE in Appendix.
• Epi Info 2000 has an anthropometric data component called NUTSTAT that can be used to look at population-based data or group data.
• SAS program to calculate BMI and percentiles for all indices. 8. VISUAL ASSESSMENT VERSUS CALCULATION OF BMI
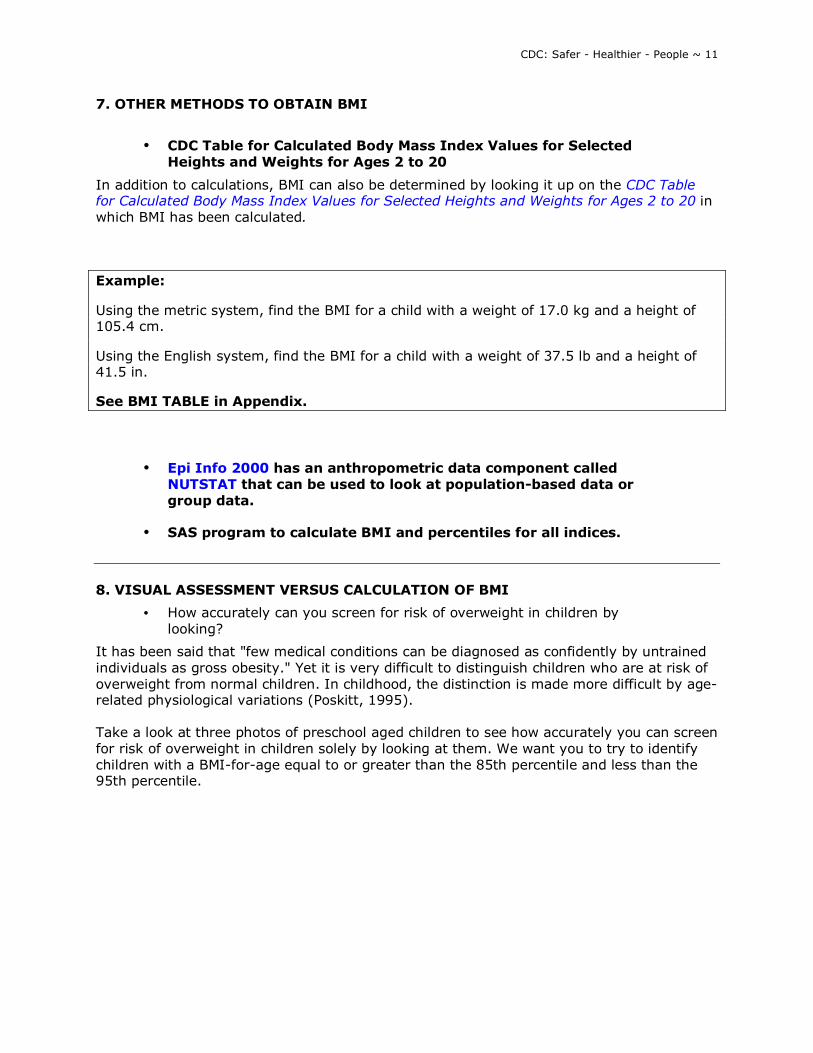
• How accurately can you screen for risk of overweight in children by looking?
It has been said that "few medical conditions can be diagnosed as confidently by untrained individuals as gross obesity." Yet it is very difficult to distinguish children who are at risk of overweight from normal children. In childhood, the distinction is made more difficult by age-related physiological variations (Poskitt, 1995). Take a look at three photos of preschool aged children to see how accurately you can screen for risk of overweight in children solely by looking at them. We want you to try to identify children with a BMI-for-age equal to or greater than the 85th percentile and less than the 95th percentile.
CDC: Safer - Healthier - People ~ 12
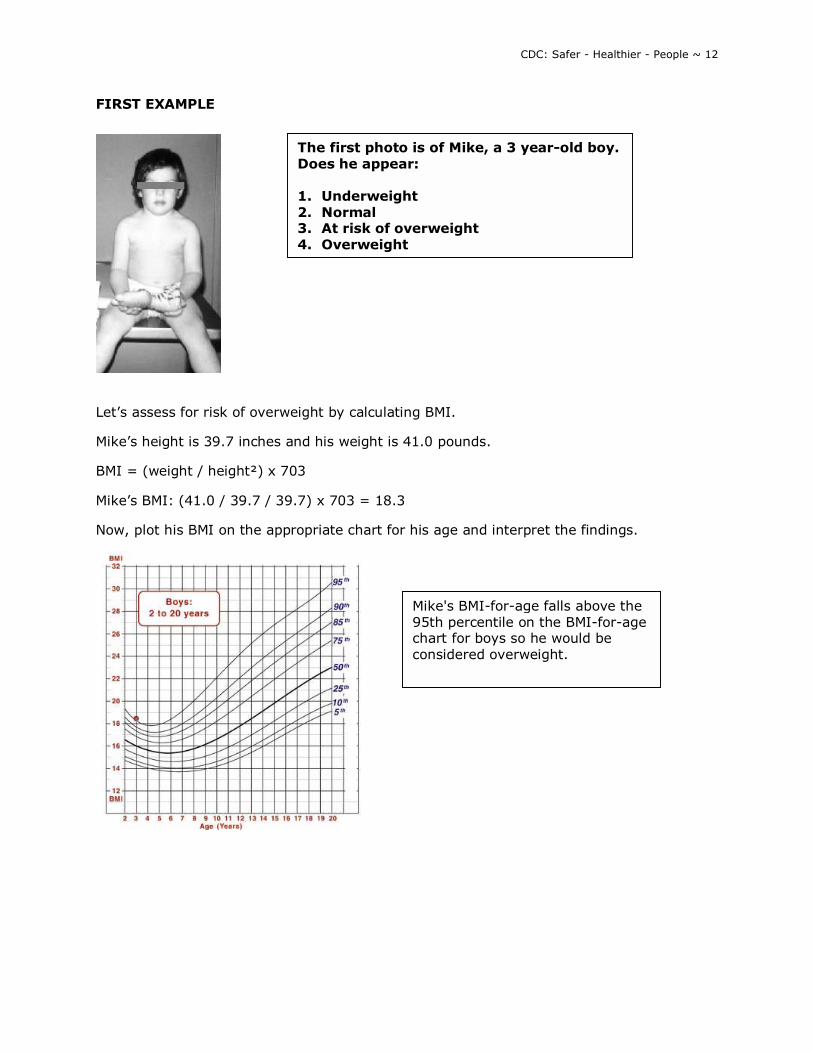
FIRST EXAMPLE
Let�s assess for risk of overweight by calculating BMI.
Mike�s height is 39.7 inches and his weight is 41.0 pounds.
BMI = (weight / height²) x 703
Mike�s BMI: (41.0 / 39.7 / 39.7) x 703 = 18.3
Now, plot his BMI on the appropriate chart for his age and interpret the findings.
The first photo is of Mike, a 3 year-old boy. Does he appear: 1. Underweight 2. Normal 3. At risk of overweight 4. Overweight
Mike's BMI-for-age falls above the 95th percentile on the BMI-for-age chart for boys so he would be considered overweight.
CDC: Safer - Healthier - People ~ 13
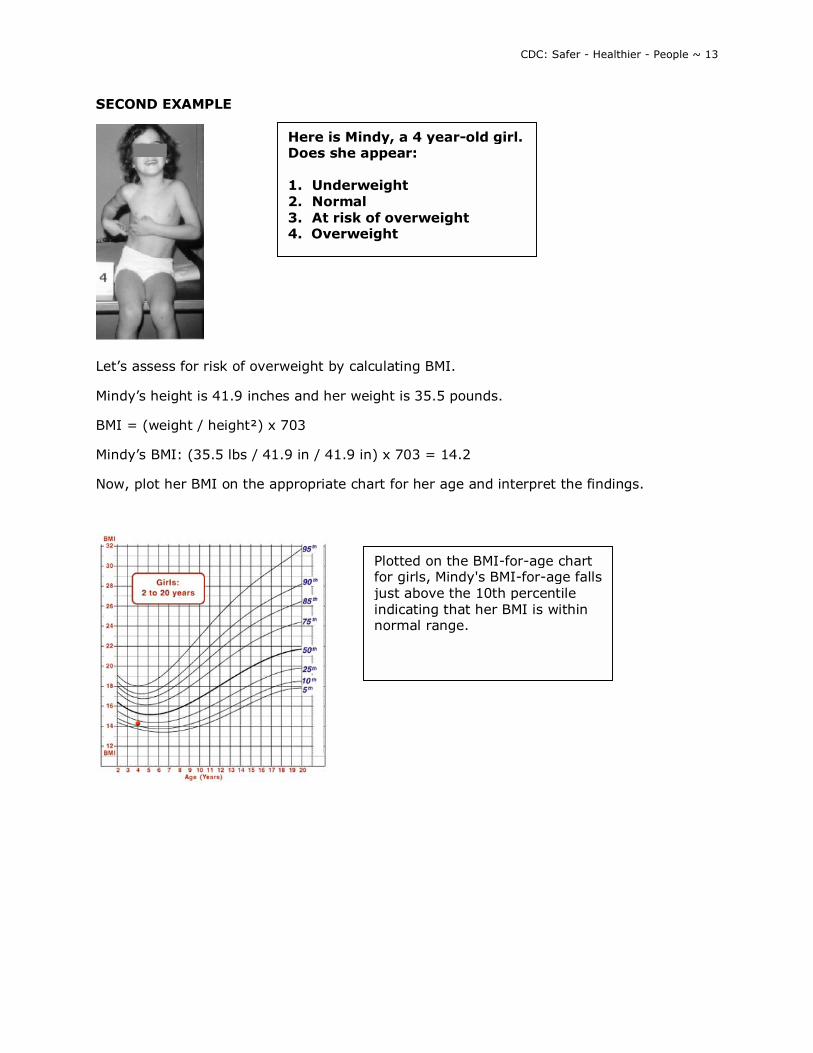
SECOND EXAMPLE
Let�s assess for risk of overweight by calculating BMI.
Mindy�s height is 41.9 inches and her weight is 35.5 pounds.
BMI = (weight / height²) x 703
Mindy�s BMI: (35.5 lbs / 41.9 in / 41.9 in) x 703 = 14.2
Now, plot her BMI on the appropriate chart for her age and interpret the findings.
Here is Mindy, a 4 year-old girl. Does she appear: 1. Underweight 2. Normal 3. At risk of overweight 4. Overweight
Plotted on the BMI-for-age chart for girls, Mindy's BMI-for-age falls just above the 10th percentile indicating that her BMI is within normal range.
CDC: Safer - Healthier - People ~ 14
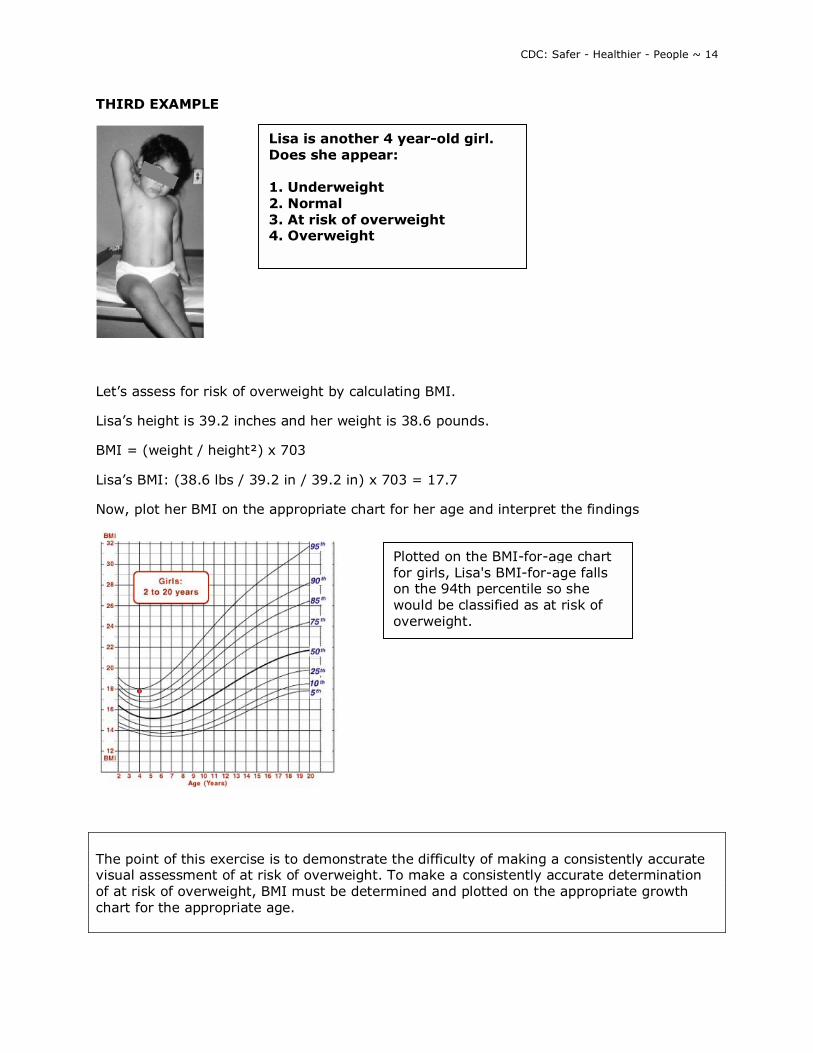
THIRD EXAMPLE
Let�s assess for risk of overweight by calculating BMI.
Lisa�s height is 39.2 inches and her weight is 38.6 pounds.
BMI = (weight / height²) x 703
Lisa�s BMI: (38.6 lbs / 39.2 in / 39.2 in) x 703 = 17.7
Now, plot her BMI on the appropriate chart for her age and interpret the findings
The point of this exercise is to demonstrate the difficulty of making a consistently accurate visual assessment of at risk of overweight. To make a consistently accurate determination of at risk of overweight, BMI must be determined and plotted on the appropriate growth chart for the appropriate age.
Lisa is another 4 year-old girl. Does she appear: 1. Underweight 2. Normal 3. At risk of overweight 4. Overweight
Plotted on the BMI-for-age chart for girls, Lisa's BMI-for-age falls on the 94th percentile so she would be classified as at risk of overweight.
CDC: Safer - Healthier - People ~ 15
9. ACCURACY OF MEASUREMENTS
Measurements must be obtained and recorded accurately if they are to be used as an effective screening tool. Stature and weight should be measured following recommended protocols:
Stature: http://www.cdc.gov/nccdphp/dnpa/bmi/meas-height.htm
Weight: http://www.cdc.gov/nccdphp/dnpa/bmi/meas-weight.htm
The following examples illustrate the importance of accurate measurements and shows that inaccurate measurements can result in an inaccurate growth assessment.
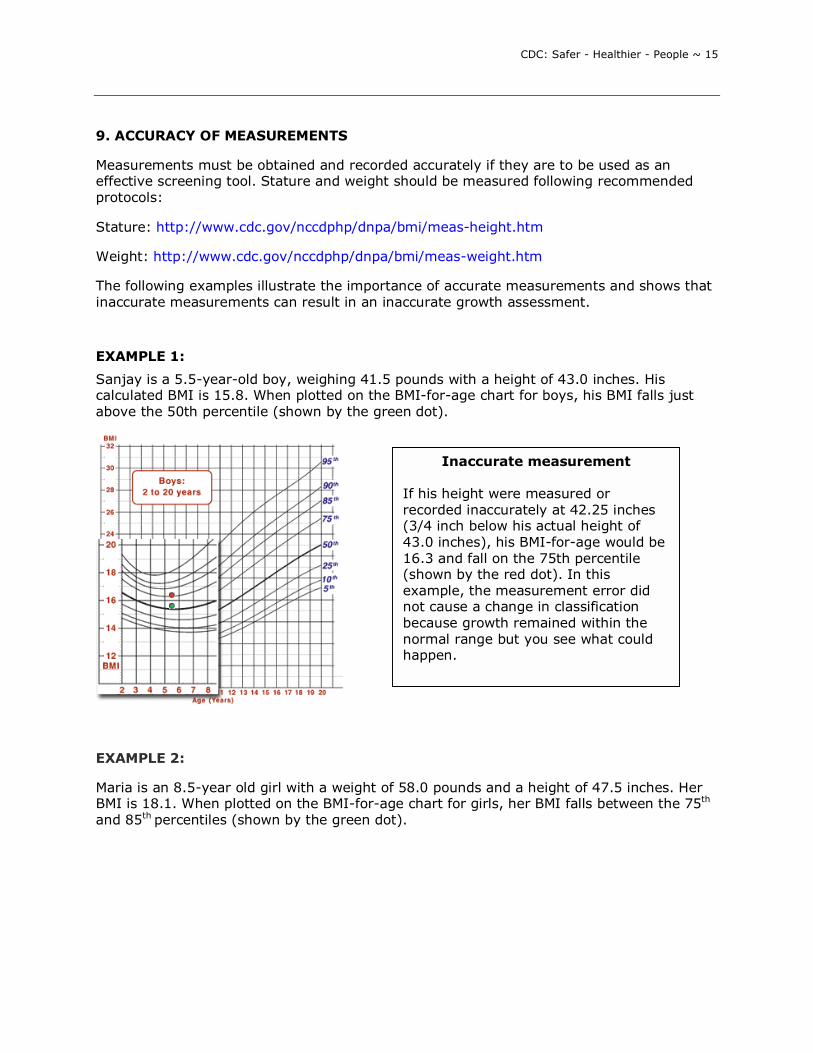
EXAMPLE 1:
Sanjay is a 5.5-year-old boy, weighing 41.5 pounds with a height of 43.0 inches. His calculated BMI is 15.8. When plotted on the BMI-for-age chart for boys, his BMI falls just above the 50th percentile (shown by the green dot).
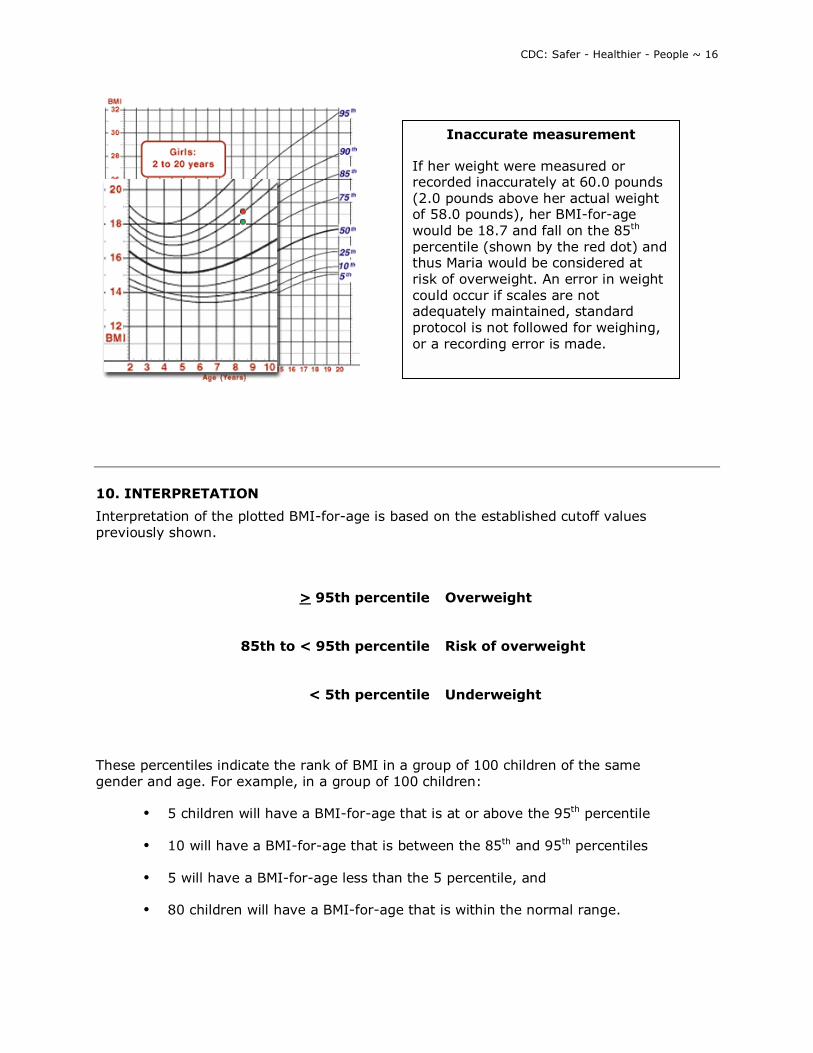
EXAMPLE 2:
Maria is an 8.5-year old girl with a weight of 58.0 pounds and a height of 47.5 inches. Her BMI is 18.1. When plotted on the BMI-for-age chart for girls, her BMI falls between the 75th
and 85th percentiles (shown by the green dot).
Inaccurate measurement If his height were measured or recorded inaccurately at 42.25 inches (3/4 inch below his actual height of 43.0 inches), his BMI-for-age would be 16.3 and fall on the 75th percentile (shown by the red dot). In this example, the measurement error did not cause a change in classification because growth remained within the normal range but you see what could happen.
CDC: Safer - Healthier - People ~ 16
10. INTERPRETATION
Interpretation of the plotted BMI-for-age is based on the established cutoff values previously shown.
These percentiles indicate the rank of BMI in a group of 100 children of the same gender and age. For example, in a group of 100 children:
• 5 children will have a BMI-for-age that is at or above the 95th percentile
• 10 will have a BMI-for-age that is between the 85th and 95th percentiles
• 5 will have a BMI-for-age less than the 5 percentile, and
• 80 children will have a BMI-for-age that is within the normal range.
> 95th percentile Overweight
85th to < 95th percentile Risk of overweight
< 5th percentile Underweight
Inaccurate measurement If her weight were measured or recorded inaccurately at 60.0 pounds (2.0 pounds above her actual weight of 58.0 pounds), her BMI-for-age would be 18.7 and fall on the 85th
percentile (shown by the red dot) and thus Maria would be considered at risk of overweight. An error in weight could occur if scales are not adequately maintained, standard protocol is not followed for weighing, or a recording error is made.
CDC: Safer - Healthier - People ~ 17
When assessing physical growth, it is desirable to have a series of accurate measurements to establish an observed growth pattern. Having a series of measurements takes into consideration short- and longer-term conditions and provides a context for individual measurements in interpretation. Growth patterns that fall outside the established parameters, the 5th and 95th percentile for any given anthropometric indices, suggest the need to recheck measurements, plots, and calculations and make any necessary corrections or adjustments. If measurements are correct, further evaluation is needed to determine the cause. 11. SUMMARY
• BMI-for-age is the method recommended for screening overweight and underweight in children and adolescents from 2 to 20 years of age.
• BMI-for-age is a screening tool that may lead to further assessment to diagnose a specific health condition.
• For children, BMI is age and gender specific and nutritional status is identified based on percentiles. For adults, BMI is neither age nor gender specific and nutritional status is defined by fixed cut points.
• Periodic, accurate measurements and growth records are important elements of growth screening. An accurate interpretation of growth depends on the accuracy of weighing and measuring.
12. STEPS TO PLOT AND INTERPRET BMI-FOR-AGE
The six steps outlined here to plot and interpret BMI-for-age are similar to those used for a general growth assessment.
Step 1: Obtain accurate weights and height measurements Step 2: Select the appropriate growth chart (based on the age and gender of the child being weighed and measured) Step 3: Record the data Step 4: Calculate BMI Step 5: Plot measurements Step 6: Interpret the plotted measurements
An instruction sheet on Using and Interpreting the CDC Growth Charts contains detailed instructions for the above steps.
Example Case Study
CDC: Safer - Healthier - People ~ 18
The following case is an example of an anthropometric assessment of "Sam�s" physical growth using the steps recommended to determine, plot and interpret BMI-for-age. You can choose to view this example using the metric system or the English system.
PLOTTING AND INTERPRETING BMI-FOR-AGE USING THE METRIC SYSTEM
A Case Study of �Sam�
Step 1. Obtain accurate weights and height measurements
Date of Birth (DOB): 9/15/94 Date of Visit (DOV): 4/4/98 Weight = 16.9 kg Height = 105.4 cm
Step 2. Select the appropriate growth chart
Because Sam is a normal 3.5 years old, a standing height was obtained. The appropriate chart to use is the �Boys 2 to 20 BMI-for-age� chart.
Step 3. Record the data
On the data entry table found on the clinical growth chart, information relevant to the growth chart is recorded. Here data has been recorded for the date of visit, the child�s age, weight and height at the visit.
Date Age Weight Stature BMI
4/4/98 3.5 yrs 16.9 kg 105.4 cm
Step 4. Calculate BMI
Calculate BMI at the time of the clinic visit.
BMI = (weight / height / height) x 10,000
BMI: (16.9 kg/ 105.4 cm/ 105.4 cm) x 10,000 = 15.2
Then the BMI of 15.2 is entered on the data entry table.
Date Age Weight Stature BMI
4/4/98 3.5 yrs 16.9 kg 105.4 cm 15.2
Step 5. Plot measurements
All the necessary information is recorded and Sam�s BMI can be plotted. On the BMI-for-age chart, find Sam�s age on the horizontal axis and visually draw a vertical line up from that

CDC: Safer - Healthier - People ~ 19
point. Then find his BMI on the vertical axis and visually draw a horizontal line across from that point. The point where the two intersect represents Sam�s BMI-for-age.
When plotted on the growth chart, Sam�s BMI-for-age falls just below the 25th percentile curve.
Step 6. Interpret the plotted measurements
Since Sam�s BMI-for-age falls just below the 25th percentile curve, this means that of 100 children with the same gender and age as Sam�s, fewer than 25 children have a BMI-for-age lower than his and more than 75 have a BMI-for-age higher than his. Sam is not overweight, underweight or at risk of overweight.
When a child�s plotted measurement falls between the 5th and 85th percentiles it is considered to be within the normal range. Sam�s BMI-for-age is in the normal range based on this measurement.
PLOTTING AND INTERPRETING BMI-FOR-AGE USING THE ENGLISH SYSTEM
A Case Study of �Sam�
Step 1. Obtain accurate weights and height measurements
Date of Birth (DOB): 9/15/94 Date of Visit (DOV): 4/4/98 Weight: 37 pounds 4 ounces Height: 41 1/2 inches
Step 2. Select the appropriate growth chart
Because Sam is a normal 3.5 years old, a standing height was obtained. The appropriate chart to use is the �Boys 2 to 20 BMI-for-age� chart.
Step 3. Record the data
CDC: Safer - Healthier - People ~ 20
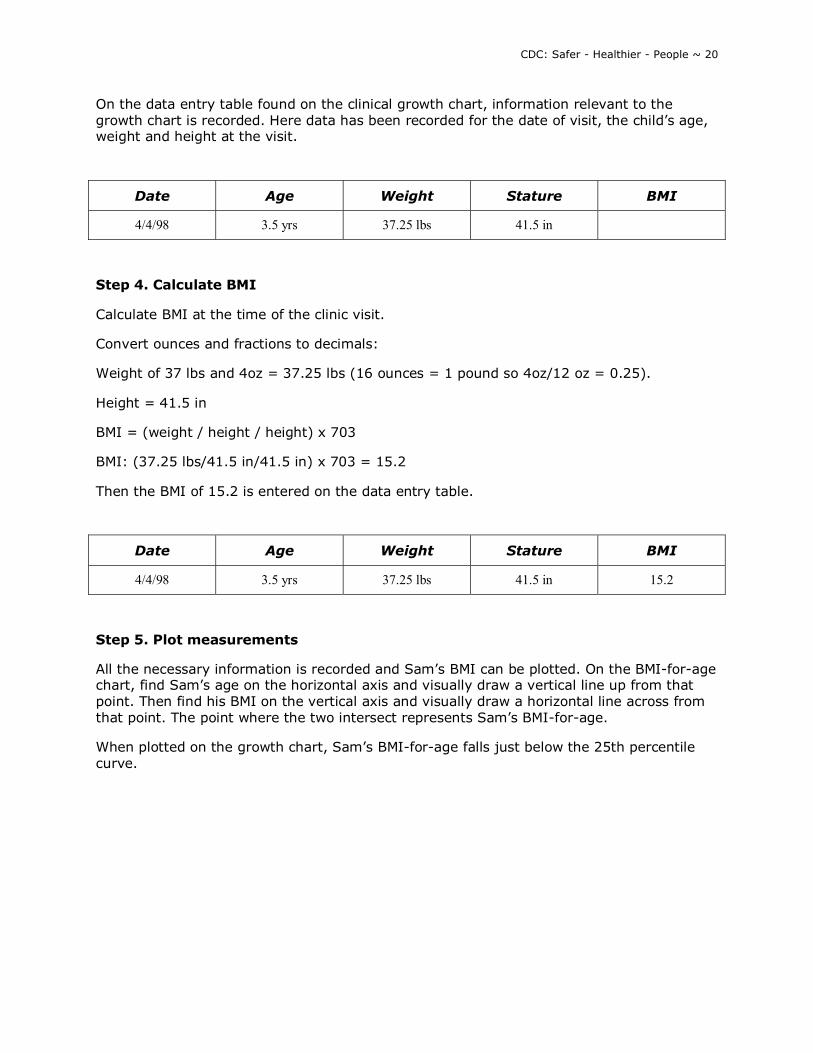
On the data entry table found on the clinical growth chart, information relevant to the growth chart is recorded. Here data has been recorded for the date of visit, the child�s age, weight and height at the visit.
Date Age Weight Stature BMI
4/4/98 3.5 yrs 37.25 lbs 41.5 in
Step 4. Calculate BMI
Calculate BMI at the time of the clinic visit.
Convert ounces and fractions to decimals:
Weight of 37 lbs and 4oz = 37.25 lbs (16 ounces = 1 pound so 4oz/12 oz = 0.25).
Height = 41.5 in
BMI = (weight / height / height) x 703
BMI: (37.25 lbs/41.5 in/41.5 in) x 703 = 15.2
Then the BMI of 15.2 is entered on the data entry table.
Date Age Weight Stature BMI
4/4/98 3.5 yrs 37.25 lbs 41.5 in 15.2
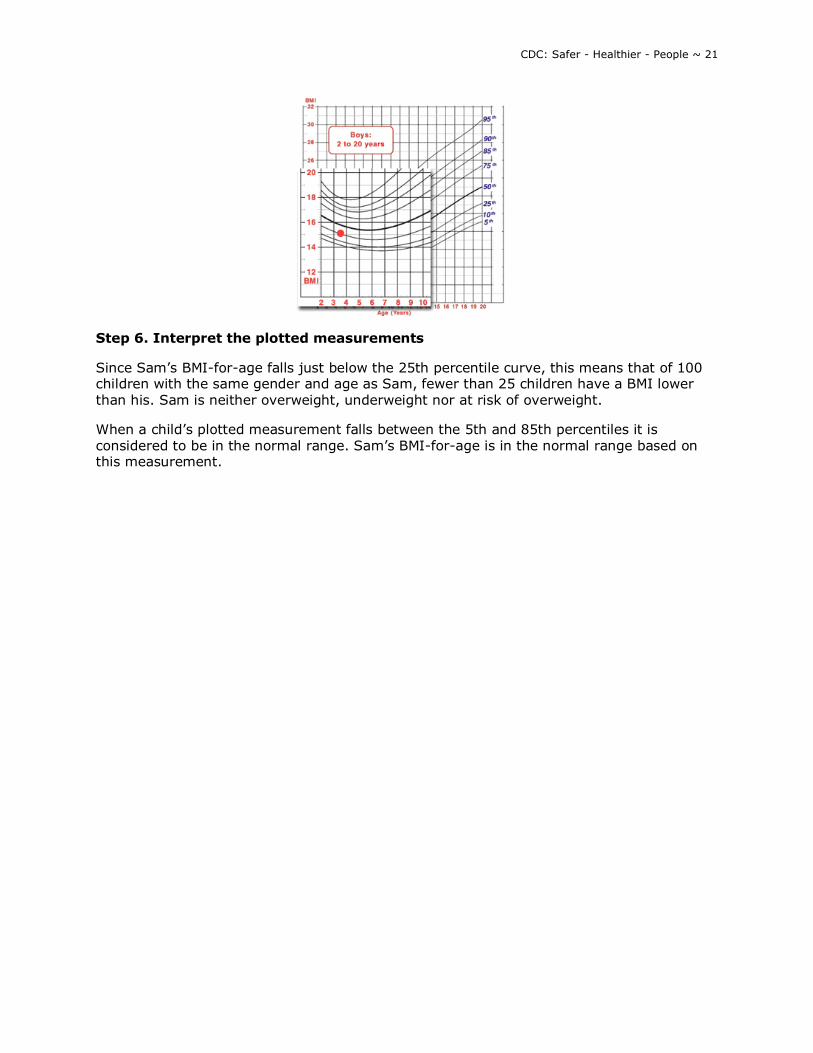
Step 5. Plot measurements
All the necessary information is recorded and Sam�s BMI can be plotted. On the BMI-for-age chart, find Sam�s age on the horizontal axis and visually draw a vertical line up from that point. Then find his BMI on the vertical axis and visually draw a horizontal line across from that point. The point where the two intersect represents Sam�s BMI-for-age.
When plotted on the growth chart, Sam�s BMI-for-age falls just below the 25th percentile curve.
CDC: Safer - Healthier - People ~ 21
Step 6. Interpret the plotted measurements
Since Sam�s BMI-for-age falls just below the 25th percentile curve, this means that of 100 children with the same gender and age as Sam, fewer than 25 children have a BMI lower than his. Sam is neither overweight, underweight nor at risk of overweight.
When a child�s plotted measurement falls between the 5th and 85th percentiles it is considered to be in the normal range. Sam�s BMI-for-age is in the normal range based on this measurement.
CDC: Safer - Healthier - People ~ 22
13. REFERENCES AND RESOURCES
REFERENCES
Barlow, SE and Dietz, WH. Obesity evaluation and treatment: expert committee recommendations. Journal of Pediatrics 1998; 102(3): e29.
Bellizzi MC and Dietz WH, Workshop on childhood obesity: Summary of the discussion. American Journal of Clinical Nutrition 1999: 70:173S-175S.
Daniels SR, Khoury PR, Morrison JA. The utility of body mass index as a measure of body fatness in children and adolescents: differences by race and gender. Pediatrics 1997; 99 (6); 804-807.
Dietz, WH and Bellizzi, MC. Introduction: the use of BMI to assess obesity in children. American Journal of Clinical Nutrition 1999; 70(suppl):123s-5s.
Freedman DS, Dietz WH, Srinivasan SR, Berenson GS. The relation of overweight to cardiovascular risk factors among children and adolescents: the Bogalusa Heart Study. Pediatrics 1999; 103:1175-1182
Garn SM, LaVelle M. Two-decade follow-up of fatness in early childhood. American Journal of Diseases of Child 1985; 139:181-185.
Guo SS, Roche AF, Chumlea WC, Gardner JD, Siervogel RM. The predictive value of childhood body mass index values for overweight at age 35 y. American Journal of Clinical Nutrition 1994; 59:810-819.
Guo SS and Chumlea, WC. Tracking of BMI in children in relation to overweight in adulthood. American Journal of Clinical Nutrition 1999; 70(suppl):145s-148s.
Hamill, PVV, Drizd TA, Johnson CL, Reed RB, Roche AF, Moore WM. Physical growth: National Center for Health Statistics percentiles. American Journal of Clinical Nutrition 1979; 32, 607-629.
Hammer LD, Kraemer HC, Wilson DM, Ritter PL, Dornbusch SM, Standardized percentile curves of body-mass index for children and adolescents. American Journal of Diseases of Child 1991; 145:259-263.
Himes JH and Bouchard C. Validity of anthropometry in classifying youths as obese. International Journal of Obesity 1989; 13:183-193.
Himes, JH and Deitz, WH. Guidelines for overweight in adolescent preventive services: recommendations form an expert committee. American Journal of Clinical Nutrition. 1994; 59:307-316.
Keys A, Fidanza F, Karvonen MJ, Kimura N, Taylor HL. Indices of relative weight and obesity. Journal of Chronic Disease 1972; 25:329-343.
Mei Z, Grummer-Strawn LM, Pietrobelli A, Goulding A, Goran MI, Dietz WH. Validity of body mass index compared with other body-composition screening indexes for the assessment of body fatness in children and adolescents. American Journal of Clinical Nutrition. 2002; 75:978�985.
CDC: Safer - Healthier - People ~ 23
Must A, Jacques PF, Dallal GE, Bajema CJ, Dietz WH. Long-term morbidity and mortality of overweight adolescents. New England Journal of Medicine 1992: 327:1350-1355.
Pietrobelli A, Faith MS, Allison DB, Gallagher D, Chiumello G, Heymsfield SB. Body mass index as a measure of adiposity among children and adolescents: A validation study. Journal of Pediatrics 1998; 132:204-210.
Poskitt EME. Defining childhood obesity: the relative body mass index (BMI). Acta Paediatrica 1995; 84:961-963.
Rolland-Cachera MF, Cole TJ, Sempe M, Tichet J, Rossignol C, Charraud A. Body mass index variation: centiles from birth to 87 years; European Journal of Clinical Nutrition 1991. 45:13-21.
Rolland-Cachera MF, Deheeger M, Bellisle F, Sempe M, Guilloud-Bataille M, Avons P, Patois E. Adiposity rebound in children: a simple indicator for predicting obesity. American Journal of Clinical Nutrition 1984; 39:129-135.
Strawbridge WJ, Wallhagen MI, Sherma SJ. New NHLBI clinical guidelines for obesity and overweight: Will they promote health? American Journal of Public Health 2000; 90:340-343.
Whitaker RC, Pepe MS, Wright JA, Seidel KD, Dietz WH. Early adiposity rebound and the risk of adult obesity. Pediatrics 1998; 101(5): URL:http://www.pediatrics.org/cgi/content/full/101-3/e5.
Whitaker RC, Wright JA, Pepe MS, Seidel KD, Dietz WH. Predicting obesity in young adulthood from childhood and parental obesity. New England Journal of Medicine 1997; 37(13):869-873.
World Health Organization Expert Committee on Physical Status. The Use and Interpretation of Anthropometry. Physical Status: Report of a WHO Expert Committee: WHO Technical Report Series 854, WHO, Geneva, 1996.
RESOURCES
CDC Table for Calculated Body Mass Index Values for Selected Heights and Weights for Ages 2 to 20: http://www.cdc.gov/nccdphp/dnpa/bmi/00binaries/bmi-tables.pdf
Epi Info 2000 with NUTSTAT: http://www.cdc.gov/epiinfo/
Instruction sheet for CDC Growth Charts
Measuring height/stature: http://www.cdc.gov/nccdphp/dnpa/bmi/meas-height.htm
Measuring weight: http://www.cdc.gov/nccdphp/dnpa/bmi/meas-weight.htm
Links to non-Federal organizations are provided solely as a service to our users. This link does not constitute an endorsement of this organization by CDC or the Federal Government, and none should be inferred. The CDC is not responsible for the content of the individual organization Web pages found at this link.
CDC: Safer - Healthier - People ~ 24
GLOSSARY
Anthropometric/Anthropometry: the science that deals with the measurement of the size, weight, and proportions of the human body.
Adiposity: the amount of fat in the body, expressed either as total fat mass (in kg) or the fraction (percentage) of total body fat.
Dual energy x-ray asorptiometry (DXA): a relatively new technology to directly measure body composition. DXA uses two x-ray energies to measure body fat, muscle, and bone mineral; considered more accurate and valid than underwater weighing.
Height: also referred to as stature; distance from the crown of the head to the surface on which the individual is standing; measured when the child/adolescent is not wearing shoes.
Hyperlipidemia: a general term for elevated concentrations of any or all of the lipids in plasma, e.g., hypercholesterolemia; a risk factor for cardiovascular disease.
Lipids: a family of compounds that includes triglycerides, phospholipids, and sterols.
Lipoprotein: a diverse class of particles containing varying amounts of triglycerides, cholesterol, phospholipids, and protein that solubilize lipids for blood transport.
Overweight: describes excess body weight; preferred term for describing excess body weight in children and adolescents.
CDC: Safer - Healthier - People ~ 25
APPENDIX
WILLIAM DIETZ, MD, PHD Director, Division of Nutrition and Physical Activity Centers for Disease Control and Prevention
The Body Mass Index (or BMI) is used to identify overweight and at risk of overweight in children and adolescents. The criteria we use are that a BMI between the 85th and 95th percentiles for age and gender identifies children at risk of overweight, and a BMI greater than or equal to the 95th percentile identifies children or teenagers who are overweight. The rationale for the use of these criteria is that a BMI at the 95th percentile in the U.S. population corresponds to a BMI of 30 in a young adult. In a young adult, a BMI greater than or equal to 30 is considered obesity.
In addition, a BMI at the 85th percentile in a young adult identifies a young adult with a BMI of 25, which is considered the top end of normal weight.
Therefore, the criteria used in children and teenagers do correspond (roughly) to the criteria used in adults for the identification of obesity and overweight.
There are several potential limitations to Body Mass Index which require that it not be used as the exclusive standard by which to judge a child at risk of overweight or overweight. The first limitation is that, as you know, BMI is weight divided by height squared.
Weight and height do not directly measure body fatness, so that an additional criteria that should be used for determining whether somebody who is overweight (as indicated by BMI greater than the 95th percentile) is also overfat, is a measure of a skinfold thickness -- like the tricep skinfold thickness. This will help differentiate children and teenagers who are both overweight and overfat from those who are overweight because of increased muscle mass or bone mass.
One of the questions is how sensitive and specific the BMI is for the identification of children with increased fatness. We compared body fatness in children and teenagers measured by DEXA (which is a definitive measure of body composition) with children with a BMI over the 95th percentile. The overwhelming majority of those children -- 95 percent of those children with a BMI greater than the 95th percentile -- also had increases in percent body fat compared to the general population.
The second consideration is how valid Body Mass Index is as a predictor of risk.
We know, from studies of 5 to 10 year-old children whose BMI is greater than the 95th percentile, that 60 percent have at least one additional cardiovascular disease risk factor -- like elevated systolic or diastolic blood pressure, elevated cholesterol or triglycerides, or elevated insulin levels. In addition about 15 percent of those same children (with a BMI greater than the 95th percentile) have two or more risk factors.
Therefore, BMI not only identifies children who have increased body fatness, but in addition BMI also indicates that those children who are overweight have associated risk factors.
CDC: Safer - Healthier - People ~ 26
BMI TABLE
CDC: Safer - Healthier - People ~ 27
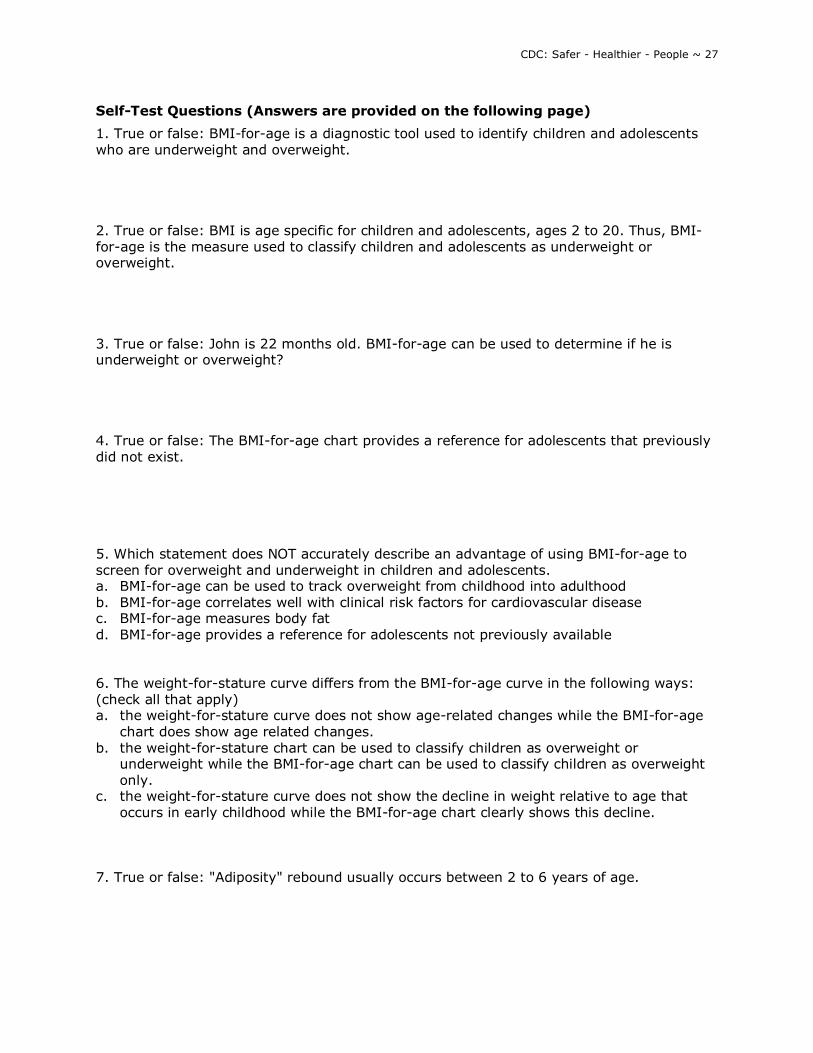
Self-Test Questions (Answers are provided on the following page)
1. True or false: BMI-for-age is a diagnostic tool used to identify children and adolescents who are underweight and overweight. 2. True or false: BMI is age specific for children and adolescents, ages 2 to 20. Thus, BMI-for-age is the measure used to classify children and adolescents as underweight or overweight. 3. True or false: John is 22 months old. BMI-for-age can be used to determine if he is underweight or overweight? 4. True or false: The BMI-for-age chart provides a reference for adolescents that previously did not exist. 5. Which statement does NOT accurately describe an advantage of using BMI-for-age to screen for overweight and underweight in children and adolescents. a. BMI-for-age can be used to track overweight from childhood into adulthood b. BMI-for-age correlates well with clinical risk factors for cardiovascular disease c. BMI-for-age measures body fat d. BMI-for-age provides a reference for adolescents not previously available 6. The weight-for-stature curve differs from the BMI-for-age curve in the following ways: (check all that apply) a. the weight-for-stature curve does not show age-related changes while the BMI-for-age
chart does show age related changes. b. the weight-for-stature chart can be used to classify children as overweight or
underweight while the BMI-for-age chart can be used to classify children as overweight only.
c. the weight-for-stature curve does not show the decline in weight relative to age that occurs in early childhood while the BMI-for-age chart clearly shows this decline.
7. True or false: "Adiposity" rebound usually occurs between 2 to 6 years of age.
CDC: Safer - Healthier - People ~ 28
Answers to Self-Test Questions
1. True or false: BMI-for-age is a diagnostic tool used to identify children and adolescents who are underweight and overweight. Answer: False BMI-for-age is a SCREENING tool used to identify children and adolescents who are underweight and overweight. It is not a diagnostic tool. 2. True or false: BMI is age specific for children and adolescents, ages 2 to 20. Thus, BMI-for-age is the measure used to classify children and adolescents as underweight or overweight. Answer: True BMI changes substantially for children as age increases so the measure used to screen for overweight and underweight is BMI-for-age. BMI-for-age is gender specific for children and adolescents. This is unlike BMI for adults that is neither age nor gender specific and for which cutoff points of BMI of 25 and 30 have been established to identify overweight and obesity, respectively. 3. True or false: John is 22 months old. BMI-for-age can be used to determine if he is underweight or overweight? Answer: False BMI-for-age is used to screen children and adolescents age 2 to 20 years for underweight or overweight. BMI is not used with children younger than 2 years as there is not sufficient evidence to suggest that there is an association between BMI at ages younger than 2 years and BMI in adolescence or adults. 4. True or false: The BMI-for-age chart provides a reference for adolescents that previously did not exist. Answer: True BMI-for-age was not available in the 1977 growth charts and the 1977 weight-for-stature charts were limited to use with prepubescent boys under 11.5 years of age and to prepubescent girls under 10 years of age.
CDC: Safer - Healthier - People ~ 29
5. Which statement does NOT accurately describe an advantage of using BMI-for-age to screen for overweight and underweight in children and adolescents. a. BMI-for-age can be used to track overweight from childhood into adulthood b. BMI-for-age correlates well with clinical risk factors for cardiovascular disease c. BMI-for-age measures body fat d. BMI-for-age provides a reference for adolescents not previously available Answer: C BMI-for-age is not a direct measure of body fat but rather it is a proxy for body fat. One of the advantages of using BMI-for-age is that it compares well with direct measures of body fat such as dual energy x-ray asorptometry (DEXA). 6. The weight-for-stature curve differs from the BMI-for-age curve in the following ways: (check all that apply) a. the weight-for-stature curve does not show age-related changes while the BMI-for-age
chart does show age related changes. b. the weight-for-stature chart can be used to classify children as overweight or
underweight while the BMI-for-age chart can be used to classify children as overweight only.
c. the weight-for-stature curve does not show the decline in weight relative to age that occurs in early childhood while the BMI-for-age chart clearly shows this decline.
Answer: a and c accurately describe the differences between the weight-for-stature chart and the BMI-for-age chart 7. True or false: "Adiposity" rebound usually occurs between 2 to 6 years of age. Answer: False "Adiposity" rebound usually occurs between 4 to 6 years of age when BMI-for-age reaches a minimum before beginning a gradual increase into adulthood. However, "adiposity" rebound can occur earlier than 4. Research indicates that an early "adiposity" rebound is associated with an increased risk of adult obesity.
[END OF MODULE]