Embed Size (px)
Citation preview
Cristiano Farias Almeida, Mariana Figueiredo Penaforte, Yaeko Yamashita 1
Using the Theory of Constraints to Analyze Bottlenecks in the Freight Transportation System: the Case of the Center-north Corridor in Brazil Cristiano Farias Almeida, Mariana Figueiredo Penaforte and Yaeko Yamashita C. F. Almeida, Escola de Engenharia Civil – EEC, Federal University of Goias – UFG. Praça Universitária, Setor Universitário, Goiânia-GO, 74605-220, Brazil. Telephone number: +55 62 32096279. E-mail: [email protected] M.F. Penaforte, Departamento Nacional de Infraestrutura de Transportes – DNIT, Ministério dos Transportes do Brasil. SAN Q.03 Bloco. A – Edifício Núcleo dos Transportes, 70.040-902, Brazil. Telephone number: +55 61 33154000. E-mail: [email protected] Y. Yamashita, Programa de Pós-Graduação em Transportes – PPGT, Brasilia University – UnB, Asa Norte, Brasília-DF, 70910-900, Brazil. Telephone number: +55 61 33071931. E-mail: [email protected] Corresponding author: C. F. Almeida, [email protected]. Submission date: July 11, 2012. Word account: 4,944 words, 3 table and 7 figures. Total: 7,444 words.
TRB 2013 Annual Meeting Paper revised from original submittal.
Cristiano Farias Almeida, Mariana Figueiredo Penaforte, Yaeko Yamashita 2
ABSTRACT Looking at the logistics chain in Brazil, it is easy to find several problems that need to be solved to obtain maximum efficiency in moving goods around the national territory, especially because in such country the commodities exportation is one of the most important elements of the country’s economy. In this context, the problem this paper aims at studying is: how can the bottlenecks in the logistics chain of freight transportation be analyzed in order to deliver efficient freight transportation in a given region? Considering these aspects, this study seeks to develop a methodology for analyzing the logistics bottlenecks in order to promote improvements in the logistics chain of freight transportation in Brazil. This methodology was developed using the concepts of the Theory of Constraints, which has been created by Eliyahu Goldratt when he became interested in problems regarding logistics of production. The methodology was applied to the case of the Center-North Corridor in Brazil in order to be validated. Keywords: Freight Transportation System, Bottlenecks, Theory of Constraints.
TRB 2013 Annual Meeting Paper revised from original submittal.
Cristiano Farias Almeida, Mariana Figueiredo Penaforte, Yaeko Yamashita 3
1. INTRODUCTION Over the past years, great growth has been taking place in the countries which form the BRIC group. High export rates have played a central role in driving economic growth in such countries (O’Neill, 2008; Kobayashi-Hillary, 2007). This situation may also be observed in Brazil, where commodities exportation is one of the most important elements of the country’s economy.
In Brazil, the economic sectors connected with industry and agriculture receive investments for improving management and operational technique in order to achieve greater competitiveness in the global market. In this context, Brazilian agribusiness has emerged as a world leader in producing and exporting a wide range of products. Agribusiness is responsible for 33% of the Brazilian Gross Domestic Product (GDP) (MA, 2009).
Even though many changes regarding the development of techniques to increase industrial production have occurred, these changes failed to reduce or eliminate bottlenecks in the logistics chain (Carvalho, 2008). Considering this scenario, some bottlenecks in the national production chain may be identified, such as: poor infrastructure, high tax burden, inefficient public policies, and low investment in transportation, among others. These bottlenecks affect the competitiveness of Brazilian goods in the international market because they increase the cost of transportation enormously.
Thus, this paper aims at studying how the bottlenecks in the logistics chain of goods transportation can be analyzed to deliver efficient freight transportation services in a given region. In this context, the Theory of Constraints, developed by Eliyahu Goldratt, appears as an important tool for identifying bottlenecks in the freight transportation system, checking the impact these bottlenecks have on the transport system and proposing effective solutions (Martins, 2002; SEGeT, 2007).
Considering such aspects, this study seeks to analyze logistics bottlenecks to promote improvements in the logistics chain of freight transportation. Additionally, a methodology was developed and applied to the case of the Center-North Corridor in Brazil. 2. LITERATURE REVIEW The literature review was established to develop this study. The first one concerns the freight transportation system and logistics chain. The second one concerns bottlenecks in the logistics chain, and the third one is the Theory of Constraints itself. 2.1. The Freight Transportation System and the Logistics Chain The concern with storage, transportation and distribution of goods has been a constant throughout the history of economy. However, the systematization and planning of these operations have only started to be taken into account recently. As a science, the study of logistics was created as a specific task within supply activities in military operations (Ballou, 1992). Currently, logistics has lent itself to the areas of supply and transportation management, which changed preexisting concepts and broadened its scope in the so-called logistics chain (Lambert et. al., 1998; Bowersox, 1996).
The logistics chain has a direct effect on the whole supply chain. The aim of logistics is to facilitate the flow of goods from the point of acquisition of raw materials until the delivery of processed goods to the end-consumer. Logistics also aims at facilitating the flow of information that puts these goods in motion so as to achieve efficiency at the least possible cost (Lambert et. al., 1998; Bowersox, 1996).
In the logistics chain, first, the raw materials are bought and goods are produced in one or more factories; then, they are moved to warehouses, and, after that, they are taken to retailers or customers. The logistics chain consists of suppliers, centers of production, warehouses and centers of distribution, as well as raw materials, products needed in the process of production, and final products (Chopra & Meindl, 2001). Consequently, logistics chain management consists of a series of approaches used to integrate suppliers, manufacturers and stores for goods to be produced and distributed in ideal amounts, in the right places and in optimum time (SIMCHI-LEVI, 2003).
Considering the need to reduce costs in the process of moving products around, an important problem that needs to be solved in any supply chain is choosing the mode or set of modes of transport that best meet the technical and economic needs of the chain in question. Each mode of transport has
TRB 2013 Annual Meeting Paper revised from original submittal.
Cristiano Farias Almeida, Mariana Figueiredo Penaforte, Yaeko Yamashita 4
distinct features that make them more or less suitable depending on the type of product being transported, the time available for delivery, how much the company is willing to spend, among other factors (Carvalho, 2008). The elements that need to be taken into account when selecting a mode or combination of modes of transport are the following: availability, cost of freight, average delivery time and its variability, loss and damage, transit time, and whether it provides situational information (Goebel, 1996). 2.2. Bottlenecks The term bottleneck has been used in logistics to indicate “any facility, function, department or resource which hinders production because its capacity is equal to or less than the demand placed upon it” (Hannola & Myller, 2000).
In this study, the term bottleneck will be used as an obstacle or point of congestion. Accordingly, a bottleneck refers to a component or task that prevents the system from having a better performance. Therefore, in freight transportation, a bottleneck is any obstacle that prevents transport from being more efficient (Lisboa, 2009).
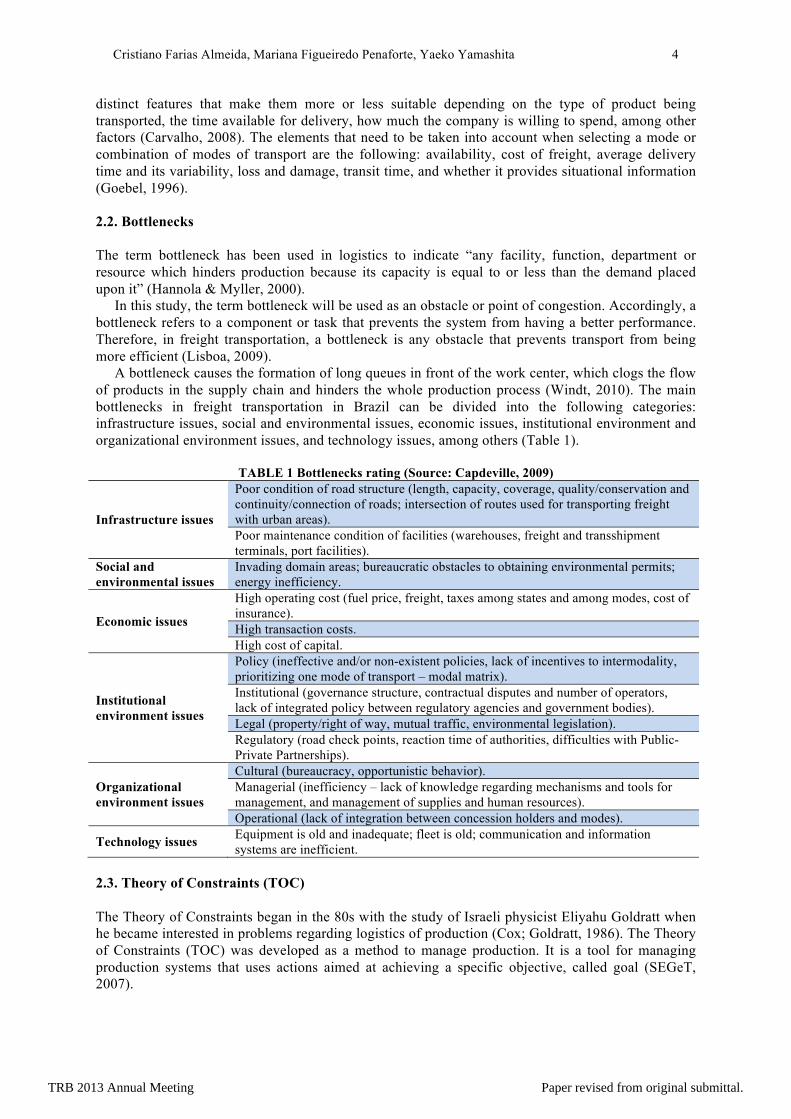
A bottleneck causes the formation of long queues in front of the work center, which clogs the flow of products in the supply chain and hinders the whole production process (Windt, 2010). The main bottlenecks in freight transportation in Brazil can be divided into the following categories: infrastructure issues, social and environmental issues, economic issues, institutional environment and organizational environment issues, and technology issues, among others (Table 1).
TABLE 1 Bottlenecks rating (Source: Capdeville, 2009)
Infrastructure issues
Poor condition of road structure (length, capacity, coverage, quality/conservation and continuity/connection of roads; intersection of routes used for transporting freight with urban areas). Poor maintenance condition of facilities (warehouses, freight and transshipment terminals, port facilities).
Social and environmental issues
Invading domain areas; bureaucratic obstacles to obtaining environmental permits; energy inefficiency.
Economic issues
High operating cost (fuel price, freight, taxes among states and among modes, cost of insurance). High transaction costs. High cost of capital.
Institutional environment issues
Policy (ineffective and/or non-existent policies, lack of incentives to intermodality, prioritizing one mode of transport – modal matrix). Institutional (governance structure, contractual disputes and number of operators, lack of integrated policy between regulatory agencies and government bodies). Legal (property/right of way, mutual traffic, environmental legislation). Regulatory (road check points, reaction time of authorities, difficulties with Public-Private Partnerships).
Organizational environment issues
Cultural (bureaucracy, opportunistic behavior). Managerial (inefficiency – lack of knowledge regarding mechanisms and tools for management, and management of supplies and human resources). Operational (lack of integration between concession holders and modes).
Technology issues Equipment is old and inadequate; fleet is old; communication and information systems are inefficient.
2.3. Theory of Constraints (TOC) The Theory of Constraints began in the 80s with the study of Israeli physicist Eliyahu Goldratt when he became interested in problems regarding logistics of production (Cox; Goldratt, 1986). The Theory of Constraints (TOC) was developed as a method to manage production. It is a tool for managing production systems that uses actions aimed at achieving a specific objective, called goal (SEGeT, 2007).
TRB 2013 Annual Meeting Paper revised from original submittal.
Cristiano Farias Almeida, Mariana Figueiredo Penaforte, Yaeko Yamashita 5
Martins (2002) states that there is, at least, one constraint in every system. A constraint is any element or factor that prevents a system from achieving a higher level of performance relative to its goal; that is, "every system has at least one constraint or the chain always has a weaker link." Thus, in the transportation system, constraints are elements that cause inefficiency in the system (SEGeT, 2007).
The thinking process underlying this methodology is important to solve policy constraints (i.e., this method is useful to identify solutions to a system’s problems). Martins (2002) believes that the thinking process underlying Goldratt’s methodology seeks to identify a system’s bottlenecks, define the impact of these bottlenecks on the system and help to propose efficient solutions by means of studying the impact the solutions will have on the bottlenecks. Cabral and Fleury (2007) believe that "TOC provides a structured script that helps us design scenarios, formulate strategies and define solutions to bottlenecks in production systems". The TOC is a tool that helps us identify constraints and adopt solutions to systems; and it can be applied to transport.
The ongoing improvement process (for physical constraints) emerged from that reasoning and it aims at concentrating efforts toward the goal of any system (SEGeT, 2007). This process is the base of TOC’s methods, including the methodology used for managerial accounting. It consists of five (5) basic steps (SIMPEP, 2006), namely: • Identifying the system’s constraint(s): the system’s constraints must be identified in this first
step. Every system has one or more constraints. Physical constraints are more easily detected, whereas market constraints are beyond the control of companies, and, in most cases, they are policy-related issues.
• Deciding how to exploit the system’s constraint: make the most out of the constraints in order to achieve the best results.
• Subordinating all non-constraints to the system’s constraint: in this step, one must decide what to do with the resources, which are not constraints. Thus, subordinating all non-constraints to the previous decision means that the role of non-constraints is not to work at their best; their role is to work in such a way that the constraint performs in line with the management’s decisions on how to exploit such constraints.
• Elevating the system’s constraint(s): in this step, one must find ways to increase the constraint’s capacity. This is usually achieved by means of investments that enable the constraint to perform at its maximum possible effectiveness.
• If any constraint is broken in a previous step, one should go back to step one, while not allowing inertia to set in: after constraints are elevated in step 4, one should go back to step one and repeat the steps one more time, looking for the next constraining link. At the same time, it is necessary to monitor how the changes related to subsequent constraints impact the already improved constraints. This verification process must be followed because all resources are managed based on the constraint.
3. METHODOLOGY FOR ANALYZING BOTTLENECKS IN THE FREIGHT TRANSPORTATION SYSTEM The proposed methodology is based on the Theory of Constraints, which can be used to assess problems, define causality relationships among these problems, and pose solutions to bottlenecks by means of defining specific and operational actions. The Theory of Constraints is a tool that can be applied in several areas of knowledge and that can help evaluate and solve different types of bottlenecks in simple as well as complex systems (SEGeT, 2007). The methodology for analyzing bottlenecks in the freight transportation system is composed of seven (7) steps, which are described as follows. Step 1: Defining the Object of Study Because there are a number of variables that can be encountered in a transportation planning process, it is necessary to define the object of study so as to provide the correct understanding of what exactly the research should focus on exploring. Thus, the purpose of this step is to define and characterize the
TRB 2013 Annual Meeting Paper revised from original submittal.
Cristiano Farias Almeida, Mariana Figueiredo Penaforte, Yaeko Yamashita 6
object of study to allow the subsequent steps of the research to be developed. Before defining the object of study, one should first consider the current stage, location and availability of information about the proposed object of study. Step 2: Defining the Area Under Study Defining the area under study is important because it frames the geographical area where analyses will be conducted, and it outlines the process of defining and collecting data to be used in such analyses (Almeida et. al., 2012). In this paper, the area under study is defined as a region. A region can be a geographic area that composes a separate unit due to certain features. Even though we acknowledge that the area under study and its surroundings are related, this study will consider the area under study as a closed system where relationships are known. This approach makes it easier to identify and assess the concentration of phenomena (e.g., generation and attraction of road trips and road traffic flow). Step 3: Characterizing the Area Under Study The purpose of this step is to describe the current situation of the area under study regarding bottlenecks in the freight transportation system. Knowing the freight transport system in this area enables us to know the main aspects that should be analyzed regarding the existence of bottlenecks that impede the system from working efficiently. This characterization step facilitates the development of the future reality tree. Step 4: Building the Current Reality Tree (CRT) In this step, the current reality tree is drawn. Such tree aims at identifying the system’s bottlenecks (i.e., undesirable effects). Consequently, the relationships among these bottlenecks within the structure of a tree are also identified. This step helps us understand what the real problem is and how bottlenecks affect one another (Goldratt, 2004). Step 5: Creating the Evaporating Cloud or Conflict Diagram The fifth step refers to building the evaporating cloud or conflict diagram. Such diagram is used to identify the system’s real constraints. This step helps us define the system’s desirable outcome. Accordingly, this step aims at finding the system’s core problem (i.e., the main bottleneck which causes most of the system’s undesirable effects) and posing solutions by means of defining requirements and pre-requisites for solving it (Goldratt, 2004). Step 6: Building the Future Reality Tree (FRT) The purpose of the sixth step is to draw a parallel between actions that could solve bottlenecks (i.e., injections) and the desirable effects that could result from such changes in the system under study. The future reality tree is used to check whether the proposed injection actually eliminates the undesirable effects (SEGeT, 2007; Goldratt, 2004). Step 7: Building the Prerequisite Tree (PrT) The pre-requisite tree is drawn in this step. Such tree aims at identifying activities to achieve the proposed injection and overcome the obstacles found. The purpose of this step is to identify obstacles to each activity before performing the injection. 4. ANALYZING BOTTLENECKS IN THE FREIGHT TRANSPORTATION SYSTEMS IN THE CENTER-NORTH CORRIDOR: A CASE STUDY.
TRB 2013 Annual Meeting Paper revised from original submittal.
Cristiano Farias Almeida, Mariana Figueiredo Penaforte, Yaeko Yamashita 7
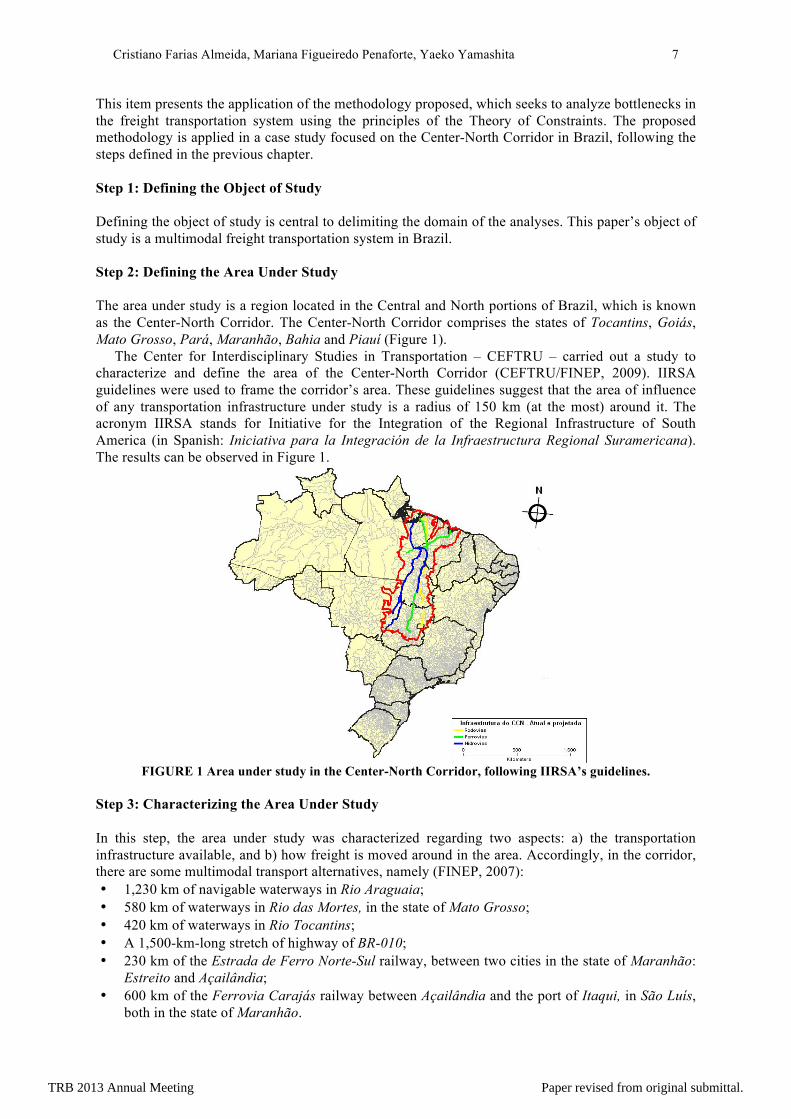
This item presents the application of the methodology proposed, which seeks to analyze bottlenecks in the freight transportation system using the principles of the Theory of Constraints. The proposed methodology is applied in a case study focused on the Center-North Corridor in Brazil, following the steps defined in the previous chapter. Step 1: Defining the Object of Study Defining the object of study is central to delimiting the domain of the analyses. This paper’s object of study is a multimodal freight transportation system in Brazil. Step 2: Defining the Area Under Study The area under study is a region located in the Central and North portions of Brazil, which is known as the Center-North Corridor. The Center-North Corridor comprises the states of Tocantins, Goiás, Mato Grosso, Pará, Maranhão, Bahia and Piauí (Figure 1).
The Center for Interdisciplinary Studies in Transportation – CEFTRU – carried out a study to characterize and define the area of the Center-North Corridor (CEFTRU/FINEP, 2009). IIRSA guidelines were used to frame the corridor’s area. These guidelines suggest that the area of influence of any transportation infrastructure under study is a radius of 150 km (at the most) around it. The acronym IIRSA stands for Initiative for the Integration of the Regional Infrastructure of South America (in Spanish: Iniciativa para la Integración de la Infraestructura Regional Suramericana). The results can be observed in Figure 1.
FIGURE 1 Area under study in the Center-North Corridor, following IIRSA’s guidelines.
Step 3: Characterizing the Area Under Study In this step, the area under study was characterized regarding two aspects: a) the transportation infrastructure available, and b) how freight is moved around in the area. Accordingly, in the corridor, there are some multimodal transport alternatives, namely (FINEP, 2007): • 1,230 km of navigable waterways in Rio Araguaia; • 580 km of waterways in Rio das Mortes, in the state of Mato Grosso; • 420 km of waterways in Rio Tocantins; • A 1,500-km-long stretch of highway of BR-010; • 230 km of the Estrada de Ferro Norte-Sul railway, between two cities in the state of Maranhão:
Estreito and Açailândia; • 600 km of the Ferrovia Carajás railway between Açailândia and the port of Itaqui, in São Luís,
both in the state of Maranhão.
TRB 2013 Annual Meeting Paper revised from original submittal.
Cristiano Farias Almeida, Mariana Figueiredo Penaforte, Yaeko Yamashita 8
In the Center-North corridor, the road system (e.g., highways) was conceived to compliment the system of waterways that already existed in the region. However, nowadays, most of the highways in the corridor are in very poor condition and, what is worse, some highways are interrupted in many stretches, which makes it difficult for traffic flow to be continuous in the area.
Regarding the railway system, the Ferrovia Norte-Sul stands out. It is a state-owned railroad operating under a concession agreement with Valec. Its original project foresees linking the region of Brasília to Northern Brazil. The railroad would run a total of 1,570 km and cross the states of Goiás, Tocantins and Maranhão, until it reached Açailândia. It would then connect to the Estrada de Ferro Carajás (EFC) railroad (CEFTRU/FINEP, 2009). However, out of the total 1,570 km of railway foreseen in the original project, only a 226 km stretch of rail is in full operation, which links the cities of Estreito (Porto Franco) and Açailândia (both located in the state of Maranhão). In Açailândia, the Ferrovia Norte-Sul railway connects to the Estrada de Ferro de Carajás railway (Almeida et. al., 2012). On the other hand, the Estrada de Ferro de Carajás (EFC) railway is in full operation, linking the Carajás iron ore mine to the port of Itaqui/Ponta da Madeira (in Maranhão). It is mainly used to transport mineral ores produced by Companhia Vale.
Currently, the Port of Itaqui/Ponta da Madeira has great movement of mineral products extracted and processed in Serra dos Carajás (Almeida & Yamashita, 2010). Furthermore, the waterway system in Rio Araguaia (in the state of Tocantins) is composed of two subsystems: 1) "Araguaia - Rio das Mortes", and 2) "Tocantins" (CEFTRU / FINEP, 2009). The port infrastructure is still poor because the low investment to improve its operational efficiency.
The main dry bulk cargoes handled in the Center-North region are: sugar, corn, raw material for fertilizers, soybeans and wheat. Around 80% of these products are transported by road. Accordingly, 96.7% of the liquid bulk, such as soybean oil and alcohol are also transported by road (ESALQ-LOG, 2009). Step 4: Building the Current Reality Tree (CRT) The system’s undesirable effects are identified in this step. Such effects were identified by means of a survey conducted by the Escola Superior de Agricultura "Luiz de Queiroz" College (ESALQ-LOG, 2009), in Brazil. This survey carried out interviews to identify the perception that shippers, carriers, and institutions have about the problems identified in the freight transport system in the Center-North Corridor. Table 2 illustrates the Undesirable Effects (UDE) identified by these stakeholders.
TABLE 2 Identifying undesirable effects (Source: ESALQ-LOG, 2009) EI1 Lack of alternative mode of transport EI2 Poor road infrastructure EI3 High cost of freight EI4 Insufficient provision of transportation services EI5 High toll fares EI6 High tax burden EI7 Obstacles in the negotiation process EI8 Lack of port infrastructure EI9 Transshipment issues EI10 High risk EI11 Heavy traffic
After the undesirable effects were identified, a map illustrating the relationships between these effects was drawn; it is called the Current Reality Tree. In order to draw a Current Reality Tree, a survey was conducted with seven (7) specialists in transportation at the Center for Interdisciplinary Studies in Transportation (CEFTRU), housed at the University of Brasília (UnB). The survey consisted of a Relationship Matrix, which is a commonly used tool to acknowledge and visualize relationships
TRB 2013 Annual Meeting Paper revised from original submittal.
Cristiano Farias Almeida, Mariana Figueiredo Penaforte, Yaeko Yamashita 9
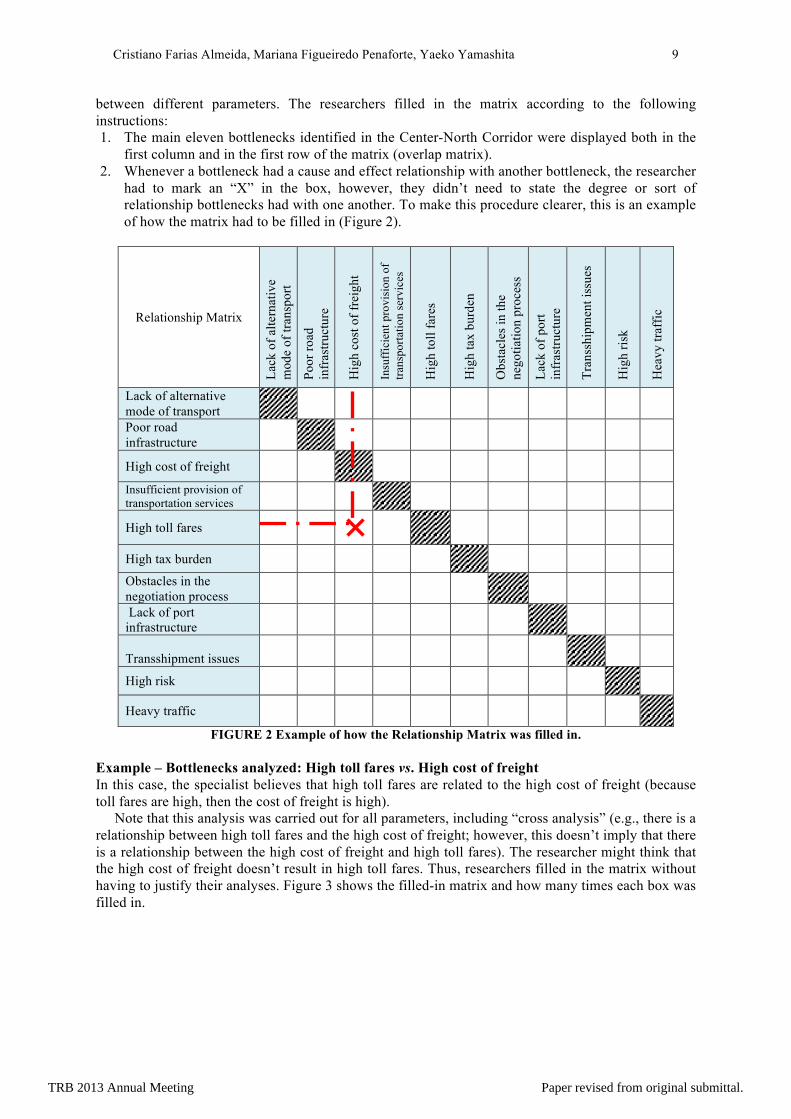
between different parameters. The researchers filled in the matrix according to the following instructions: 1. The main eleven bottlenecks identified in the Center-North Corridor were displayed both in the
first column and in the first row of the matrix (overlap matrix). 2. Whenever a bottleneck had a cause and effect relationship with another bottleneck, the researcher
had to mark an “X” in the box, however, they didn’t need to state the degree or sort of relationship bottlenecks had with one another. To make this procedure clearer, this is an example of how the matrix had to be filled in (Figure 2).
Relationship Matrix
Lack
of a
ltern
ativ
e m
ode
of tr
ansp
ort
Poor
road
in
fras
truct
ure
Hig
h co
st o
f fre
ight
Insu
ffic
ient
pro
visi
on o
f tra
nspo
rtatio
n se
rvic
es
Hig
h to
ll fa
res
Hig
h ta
x bu
rden
Obs
tacl
es in
the
nego
tiatio
n pr
oces
s
Lack
of p
ort
infr
astru
ctur
e
Tran
sshi
pmen
t iss
ues
Hig
h ris
k
Hea
vy tr
affic
Lack of alternative mode of transport
Poor road infrastructure
High cost of freight
Insufficient provision of transportation services
High toll fares
High tax burden
Obstacles in the negotiation process
Lack of port infrastructure
Transshipment issues
High risk
Heavy traffic
FIGURE 2 Example of how the Relationship Matrix was filled in. Example – Bottlenecks analyzed: High toll fares vs. High cost of freight In this case, the specialist believes that high toll fares are related to the high cost of freight (because toll fares are high, then the cost of freight is high).
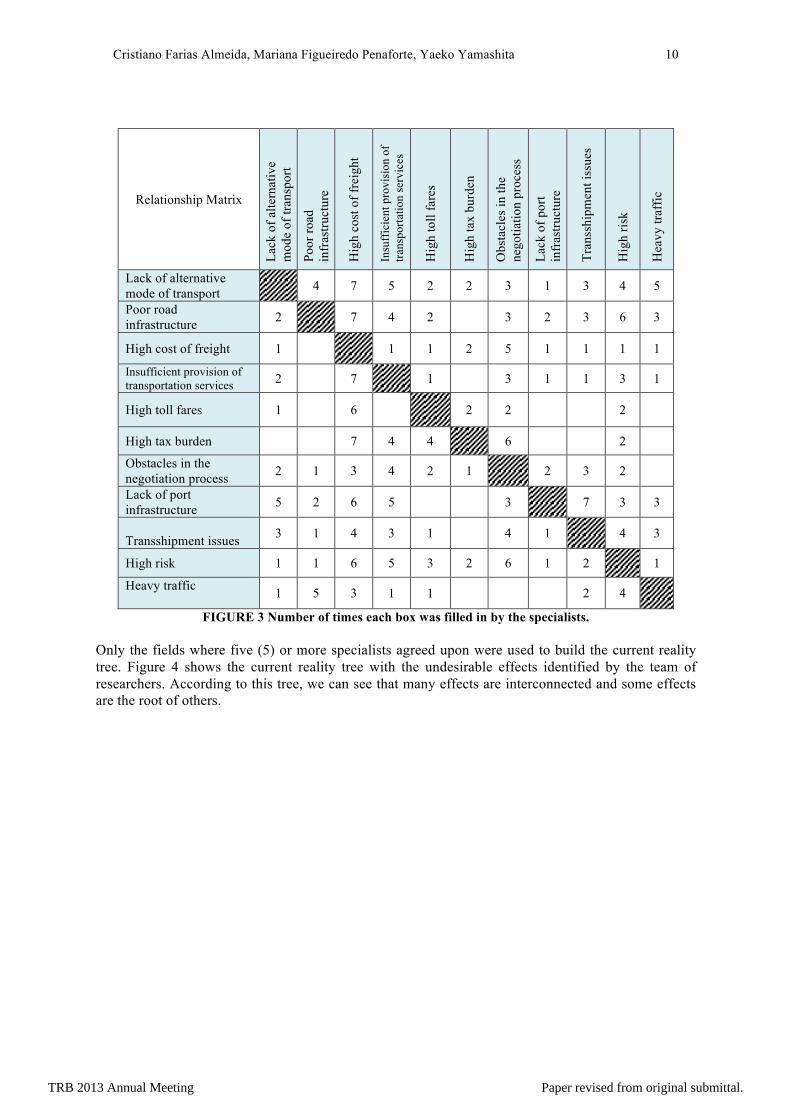
Note that this analysis was carried out for all parameters, including “cross analysis” (e.g., there is a relationship between high toll fares and the high cost of freight; however, this doesn’t imply that there is a relationship between the high cost of freight and high toll fares). The researcher might think that the high cost of freight doesn’t result in high toll fares. Thus, researchers filled in the matrix without having to justify their analyses. Figure 3 shows the filled-in matrix and how many times each box was filled in.
TRB 2013 Annual Meeting Paper revised from original submittal.
Cristiano Farias Almeida, Mariana Figueiredo Penaforte, Yaeko Yamashita 10
Relationship Matrix
Lack
of a
ltern
ativ
e m
ode
of tr
ansp
ort
Poor
road
in
fras
truct
ure
Hig
h co
st o
f fre
ight
Insu
ffic
ient
pro
visi
on o
f tra
nspo
rtatio
n se
rvic
es
Hig
h to
ll fa
res
Hig
h ta
x bu
rden
Obs
tacl
es in
the
nego
tiatio
n pr
oces
s
Lack
of p
ort
infr
astru
ctur
e
Tran
sshi
pmen
t iss
ues
Hig
h ris
k
Hea
vy tr
affic
Lack of alternative mode of transport
4 7 5 2 2 3 1 3 4 5
Poor road infrastructure 2 7 4 2 3 2 3 6 3
High cost of freight 1 1 1 2 5 1 1 1 1
Insufficient provision of transportation services 2 7 1 3 1 1 3 1
High toll fares 1 6 2 2 2
High tax burden 7 4 4 6 2
Obstacles in the negotiation process 2 1 3 4 2 1 2 3 2
Lack of port infrastructure 5 2 6 5 3 7 3 3
Transshipment issues 3 1 4 3 1 4 1 4 3
High risk 1 1 6 5 3 2 6 1 2 1
Heavy traffic 1 5 3 1 1 2 4
FIGURE 3 Number of times each box was filled in by the specialists. Only the fields where five (5) or more specialists agreed upon were used to build the current reality tree. Figure 4 shows the current reality tree with the undesirable effects identified by the team of researchers. According to this tree, we can see that many effects are interconnected and some effects are the root of others.
TRB 2013 Annual Meeting Paper revised from original submittal.
Cristiano Farias Almeida, Mariana Figueiredo Penaforte, Yaeko Yamashita 11
Lack of port infrastructure High toll fares
Lack of alternative mode of transport High cost of freightInsufficient provision of
transportation services Transshipment issues
High tax burdenHeavy traffic
Poor road infrastructure
High risk
Obstacles in the negotiation process
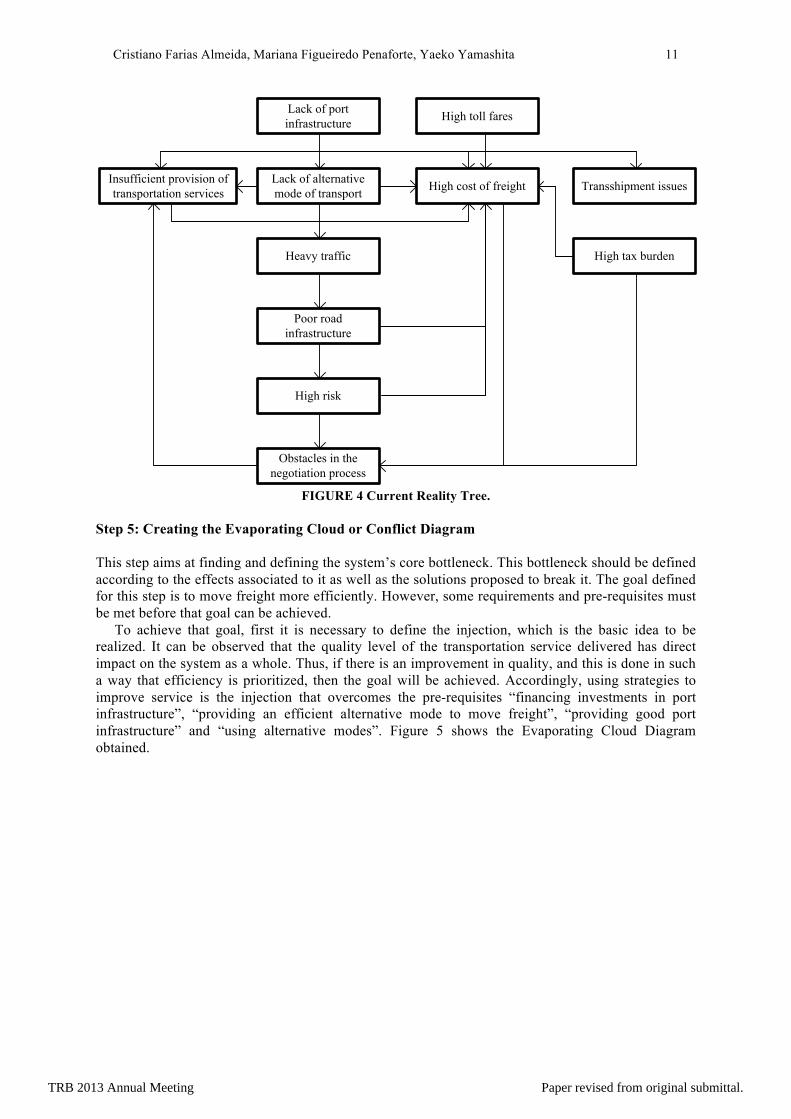
FIGURE 4 Current Reality Tree. Step 5: Creating the Evaporating Cloud or Conflict Diagram This step aims at finding and defining the system’s core bottleneck. This bottleneck should be defined according to the effects associated to it as well as the solutions proposed to break it. The goal defined for this step is to move freight more efficiently. However, some requirements and pre-requisites must be met before that goal can be achieved.
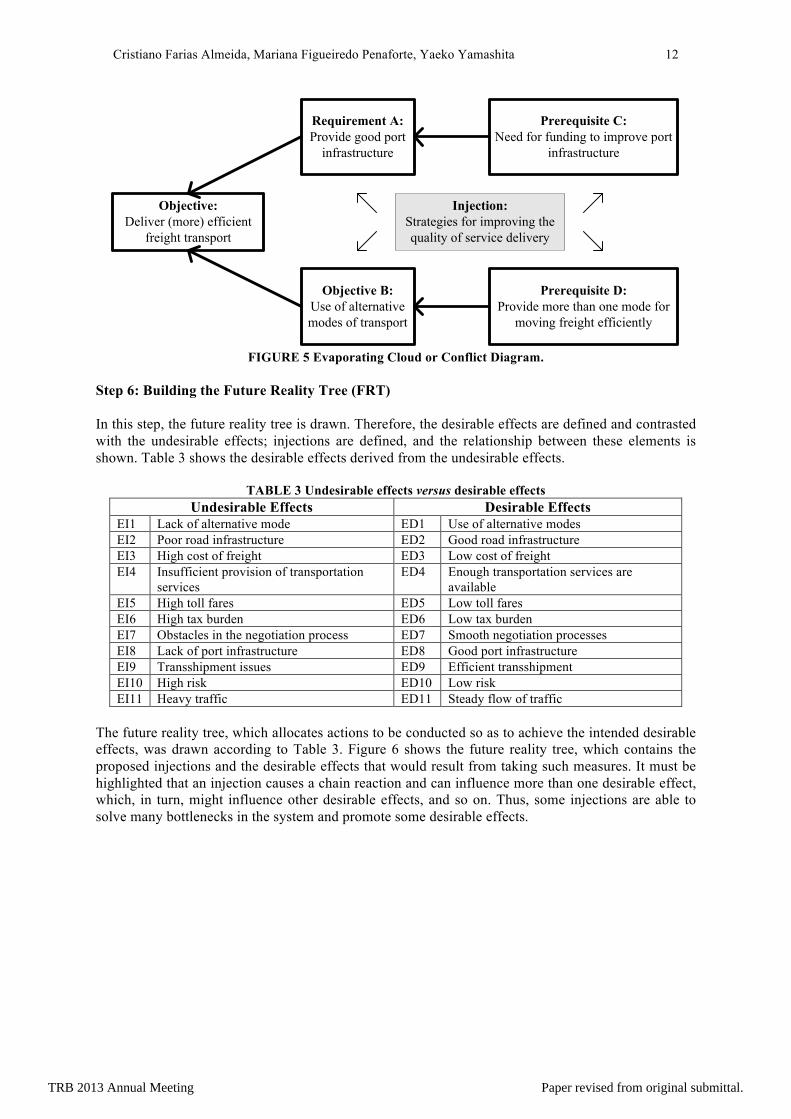
To achieve that goal, first it is necessary to define the injection, which is the basic idea to be realized. It can be observed that the quality level of the transportation service delivered has direct impact on the system as a whole. Thus, if there is an improvement in quality, and this is done in such a way that efficiency is prioritized, then the goal will be achieved. Accordingly, using strategies to improve service is the injection that overcomes the pre-requisites “financing investments in port infrastructure”, “providing an efficient alternative mode to move freight”, “providing good port infrastructure” and “using alternative modes”. Figure 5 shows the Evaporating Cloud Diagram obtained.
TRB 2013 Annual Meeting Paper revised from original submittal.
Cristiano Farias Almeida, Mariana Figueiredo Penaforte, Yaeko Yamashita 12
Objective:Deliver (more) efficient
freight transport
Requirement A: Provide good port
infrastructure
Objective B:Use of alternative modes of transport
Prerequisite C:Need for funding to improve port
infrastructure
Prerequisite D:Provide more than one mode for
moving freight efficiently
Injection:Strategies for improving the quality of service delivery
FIGURE 5 Evaporating Cloud or Conflict Diagram.
Step 6: Building the Future Reality Tree (FRT) In this step, the future reality tree is drawn. Therefore, the desirable effects are defined and contrasted with the undesirable effects; injections are defined, and the relationship between these elements is shown. Table 3 shows the desirable effects derived from the undesirable effects.
TABLE 3 Undesirable effects versus desirable effects Undesirable Effects Desirable Effects
EI1 Lack of alternative mode ED1 Use of alternative modes EI2 Poor road infrastructure ED2 Good road infrastructure EI3 High cost of freight ED3 Low cost of freight EI4 Insufficient provision of transportation
services ED4 Enough transportation services are
available EI5 High toll fares ED5 Low toll fares EI6 High tax burden ED6 Low tax burden EI7 Obstacles in the negotiation process ED7 Smooth negotiation processes EI8 Lack of port infrastructure ED8 Good port infrastructure EI9 Transshipment issues ED9 Efficient transshipment EI10 High risk ED10 Low risk EI11 Heavy traffic ED11 Steady flow of traffic
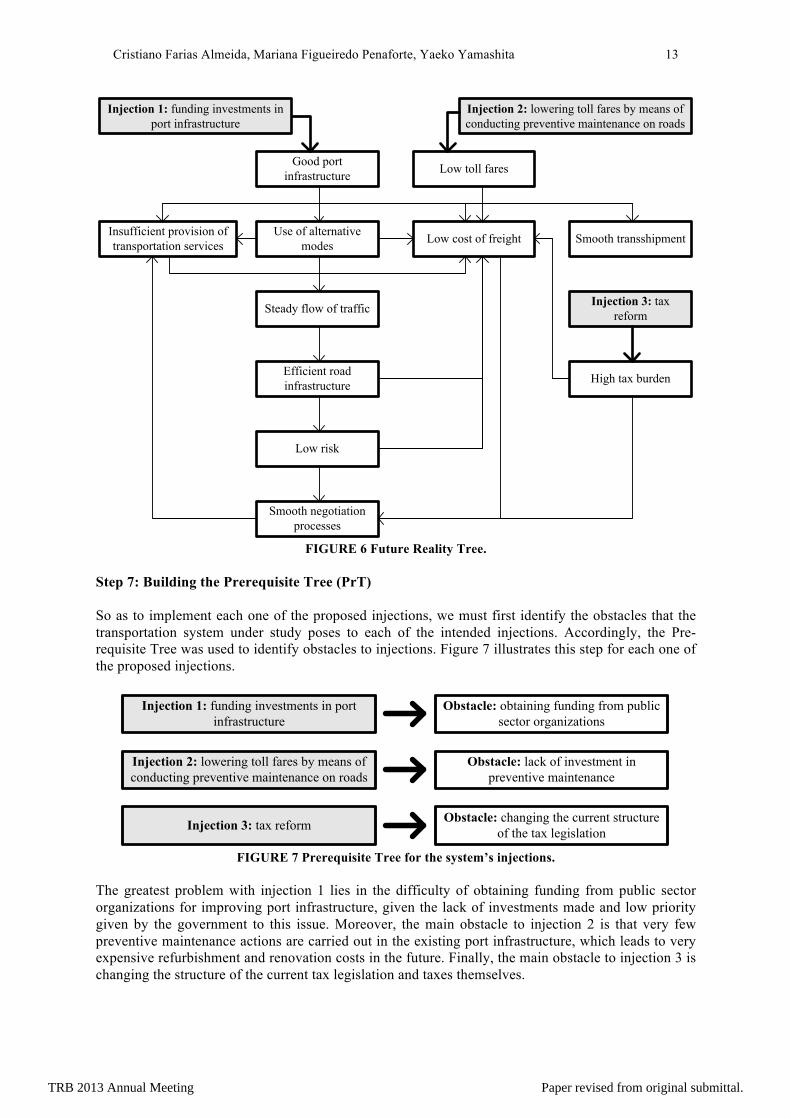
The future reality tree, which allocates actions to be conducted so as to achieve the intended desirable effects, was drawn according to Table 3. Figure 6 shows the future reality tree, which contains the proposed injections and the desirable effects that would result from taking such measures. It must be highlighted that an injection causes a chain reaction and can influence more than one desirable effect, which, in turn, might influence other desirable effects, and so on. Thus, some injections are able to solve many bottlenecks in the system and promote some desirable effects.
TRB 2013 Annual Meeting Paper revised from original submittal.
Cristiano Farias Almeida, Mariana Figueiredo Penaforte, Yaeko Yamashita 13
Good port infrastructure Low toll fares
Use of alternative modes Low cost of freightInsufficient provision of
transportation services Smooth transshipment
High tax burden
Steady flow of traffic
Efficient road infrastructure
Low risk
Smooth negotiation processes
Injection 1: funding investments in port infrastructure
Injection 2: lowering toll fares by means of conducting preventive maintenance on roads
Injection 3: tax reform
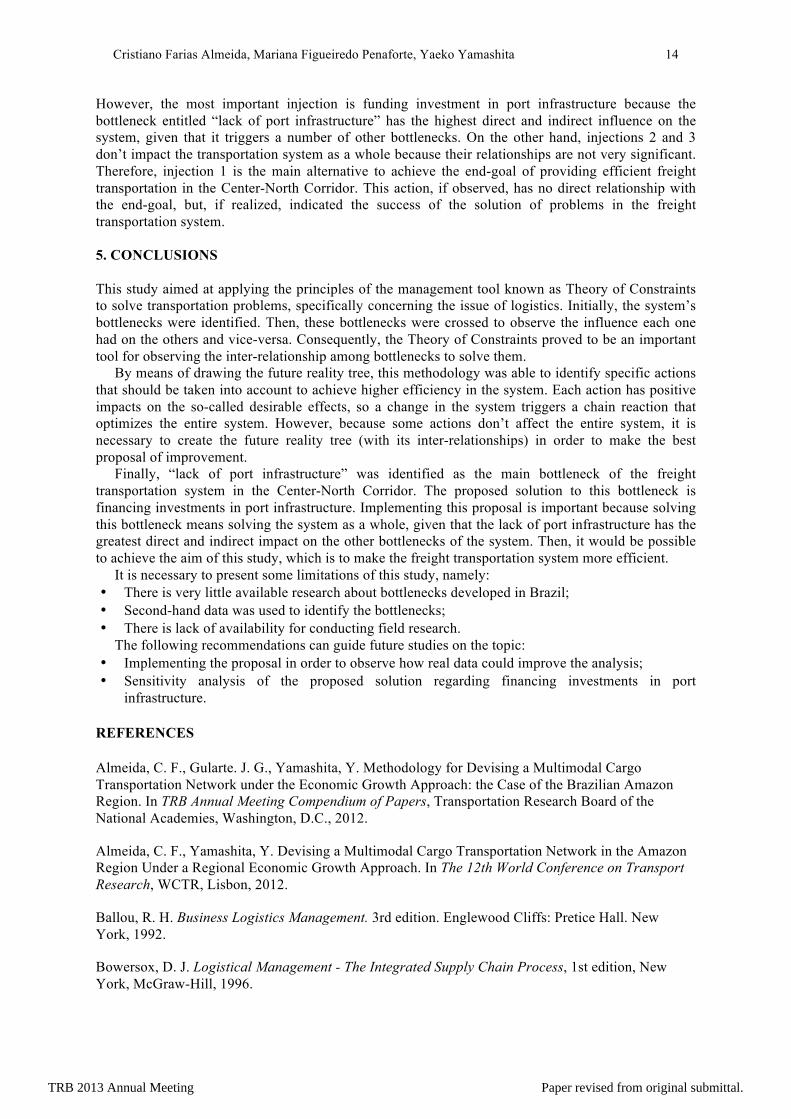
FIGURE 6 Future Reality Tree. Step 7: Building the Prerequisite Tree (PrT) So as to implement each one of the proposed injections, we must first identify the obstacles that the transportation system under study poses to each of the intended injections. Accordingly, the Pre-requisite Tree was used to identify obstacles to injections. Figure 7 illustrates this step for each one of the proposed injections.
Injection 1: funding investments in port infrastructure
Injection 2: lowering toll fares by means of conducting preventive maintenance on roads
Injection 3: tax reform
Obstacle: obtaining funding from public sector organizations
Obstacle: lack of investment in preventive maintenance
Obstacle: changing the current structure of the tax legislation
FIGURE 7 Prerequisite Tree for the system’s injections.
The greatest problem with injection 1 lies in the difficulty of obtaining funding from public sector organizations for improving port infrastructure, given the lack of investments made and low priority given by the government to this issue. Moreover, the main obstacle to injection 2 is that very few preventive maintenance actions are carried out in the existing port infrastructure, which leads to very expensive refurbishment and renovation costs in the future. Finally, the main obstacle to injection 3 is changing the structure of the current tax legislation and taxes themselves.
TRB 2013 Annual Meeting Paper revised from original submittal.
Cristiano Farias Almeida, Mariana Figueiredo Penaforte, Yaeko Yamashita 14
However, the most important injection is funding investment in port infrastructure because the bottleneck entitled “lack of port infrastructure” has the highest direct and indirect influence on the system, given that it triggers a number of other bottlenecks. On the other hand, injections 2 and 3 don’t impact the transportation system as a whole because their relationships are not very significant. Therefore, injection 1 is the main alternative to achieve the end-goal of providing efficient freight transportation in the Center-North Corridor. This action, if observed, has no direct relationship with the end-goal, but, if realized, indicated the success of the solution of problems in the freight transportation system. 5. CONCLUSIONS This study aimed at applying the principles of the management tool known as Theory of Constraints to solve transportation problems, specifically concerning the issue of logistics. Initially, the system’s bottlenecks were identified. Then, these bottlenecks were crossed to observe the influence each one had on the others and vice-versa. Consequently, the Theory of Constraints proved to be an important tool for observing the inter-relationship among bottlenecks to solve them.
By means of drawing the future reality tree, this methodology was able to identify specific actions that should be taken into account to achieve higher efficiency in the system. Each action has positive impacts on the so-called desirable effects, so a change in the system triggers a chain reaction that optimizes the entire system. However, because some actions don’t affect the entire system, it is necessary to create the future reality tree (with its inter-relationships) in order to make the best proposal of improvement.
Finally, “lack of port infrastructure” was identified as the main bottleneck of the freight transportation system in the Center-North Corridor. The proposed solution to this bottleneck is financing investments in port infrastructure. Implementing this proposal is important because solving this bottleneck means solving the system as a whole, given that the lack of port infrastructure has the greatest direct and indirect impact on the other bottlenecks of the system. Then, it would be possible to achieve the aim of this study, which is to make the freight transportation system more efficient.
It is necessary to present some limitations of this study, namely: • There is very little available research about bottlenecks developed in Brazil; • Second-hand data was used to identify the bottlenecks; • There is lack of availability for conducting field research.
The following recommendations can guide future studies on the topic: • Implementing the proposal in order to observe how real data could improve the analysis; • Sensitivity analysis of the proposed solution regarding financing investments in port
infrastructure. REFERENCES Almeida, C. F., Gularte. J. G., Yamashita, Y. Methodology for Devising a Multimodal Cargo Transportation Network under the Economic Growth Approach: the Case of the Brazilian Amazon Region. In TRB Annual Meeting Compendium of Papers, Transportation Research Board of the National Academies, Washington, D.C., 2012.
Almeida, C. F., Yamashita, Y. Devising a Multimodal Cargo Transportation Network in the Amazon Region Under a Regional Economic Growth Approach. In The 12th World Conference on Transport Research, WCTR, Lisbon, 2012.
Ballou, R. H. Business Logistics Management. 3rd edition. Englewood Cliffs: Pretice Hall. New York, 1992.
Bowersox, D. J. Logistical Management - The Integrated Supply Chain Process, 1st edition, New York, McGraw-Hill, 1996.
TRB 2013 Annual Meeting Paper revised from original submittal.
Cristiano Farias Almeida, Mariana Figueiredo Penaforte, Yaeko Yamashita 15
Cabral, A. C. D., Fleury, A. C.C. Competitividade Sistêmica: um modelo de análise de cenários para gestão de empresas. Revista Gestão Industrial. V. 03. Ponta Grossa, Paraná, 2007. (in Portuguese) Capdeville, A. Categorização dos Gargalos de Uma Cadeia Logística de Transporte da Safra Agrícola. Projeto de Mestrado Submetido ao Programa de Pós Graduação em Transportes da Universidade de Brasília, Brasil, 2009. (in Portuguese) Carvalho, W. L. Metodologia de Gestão Sistêmica dos Gargalos e de Seus Impactos nas Cadeias Logísticas. Projeto de Doutorado Submetido ao Programa de Pós-Graduação em Transportes da Universidade de Brasília, Brasil, 2008. (in Portuguese) Chopra, S.; Meindel, P. Supply Chain Management: Strategy, Planning and Operation. Pretince-Hall, 2001. Cox, J.; Goldratt, E. M. The goal: a process of ongoing improvement. [Croton-on-Hudson, NY]: North River Press. ISBN 0-88427-061-0, 1986. CEFTRU/FINEP. Relatório de Caracterização do Corredor Centro-Norte, Brasília, Brasil, 2009. (in Portuguese) ESALQ–LOG. Modelo Matemático de Otimização Logística para o Transporte Multimodal de Safras Agrícolas pelo Corredor Centro-Norte, 2009. (in Portuguese) FINEP. Chamada Pública Mct/Finep/Ação Transversal – Logística De Transporte - 02/2007, Seleção Pública De Propostas Para Apoio A Projetos De C,T&I Na Área De Cadeias Logísticas De Transportes Multimodal. 13p, Brasília, 2007. (in Portuguese) Goebel, D. Logística - Otimização do Transporte e Estoques na Empresa, Estudos em Comércio Exterior. Vol. I nº 1 – jul/dez 1996. (in Portuguese) Goldratt, E. M. The Goal: A Process of Ongoing Improvemen. ISBN 978-0-88427-178-9, 2004. Hannola, L.; Myller, E. Logistic and Industry -Specific Bottlenecks in a Transportation Corridor. In 21st Intenational Conference on Production Research (ICPR), Stuttgart, Germany, 2011. Kobayashi-Hillary, M. Building a Future with BRICs: The Next Decade for Offshoring. ISBN 978-3-540-46453-2, 2007. Lambert, D.M., Stock, J.R., Ellram, L.M. Fundamentals of Logistics Management, 1st edition., Irwin-McGraw Hill, New York, USA, 1998. Lisboa, P. Glossário de Informática e tradução de termos informáticos. http://visibilidade.net/tutorial/glossario-informatica.html. Accessed June 20, 2009. (in Portuguese) MA. Agronegócio Brasileiro: Uma Oportunidade de Investimentos. Ministério da Agricultura. http://www.agricultura.gov.br/. Accessed June 19, 2009. (in Portuguese) Martins, F. A. O processo de raciocínio da teoria das restrições na indústria moveleira de pequeno porte: um estudo de caso. Dissertação de mestrado. UFSC. Florianópolis, Brasil, 2002. (in Portuguese) O'Neill, J. (2008). BRICs could point the way out of the Economic Mire, Financial Times, London, p. 28, 2008.
TRB 2013 Annual Meeting Paper revised from original submittal.
Cristiano Farias Almeida, Mariana Figueiredo Penaforte, Yaeko Yamashita 16
SEGeT. Aplicação do processo de raciocínio da teoria das restrições (TOC) para análise dos gargalos do transporte público, 2007. (in Portuguese) Simchi-Levi, D.; Kamisnky, P. Designing and managing the supply chain: concepts, strategies, and case studies. 2ª ed. McGraw-Hill/Irwin, New York, 2003. SIMPEP. A teoria das restrições na prática: elevação dos gargalos no processo produtivo de uma indústria metal mecânica. In XIII SIMPEP, 2006. (in Portuguese) Windt, K.; Iber, M.; Klein, J. Grooving Factory – Bottleneck Control in Production Logistics Through Auditory Display. In The 16th International Conference on Auditory Display (ICAD-2010). Washington, D.C., USA, 2010.
TRB 2013 Annual Meeting Paper revised from original submittal.
![Visual Analytics of Cascaded Bottlenecks in Planar Flow ...hamann/PostGillmannWis...works is the identification and elimination of bottlenecks [18]. The analysis of bottlenecks in](https://img.pdfslide.net/doc/110x75/6066a715e1fcfc51770dd091/visual-analytics-of-cascaded-bottlenecks-in-planar-flow-hamannpostgillmannwis.jpg)