Embed Size (px)
Citation preview
Using vRealize Network Insight
VMware vRealize Network Insight 5.2
You can find the most up-to-date technical documentation on the VMware website at:
https://docs.vmware.com/
If you have comments about this documentation, submit your feedback to
VMware, Inc.3401 Hillview Ave.Palo Alto, CA 94304www.vmware.com
Copyright © 2020 VMware, Inc. All rights reserved. Copyright and trademark information.
Using vRealize Network Insight
VMware, Inc. 2
Contents
1 About vRealize Network Insight User Guide 10
2 Getting Started 11Introduction 11
Homepage 13
Navigation 14
Settings 15
3 Adding a Data Source in vRealize Network Insight 17Supported Products and Versions 19
Add vCenter Server 22
Add VMware NSX Manager 24
Add VMware NSX-T Manager 26
Add VMware SD-WAN 29
Add Cisco ASR/ISR for SD-WAN Assessment 30
Add VMware Cloud on AWS 32
Setting up vRealize Network Insight Collector for VMware Cloud on AWS 32
Creating VMware Cloud on AWS firewall rules for vRealize Network Insight 32
Add a VMware Cloud on AWS vCenter 34
Add a VMware Cloud on AWS NSX Manager 35
Add Amazon Web Services 36
Add a Master AWS Data Source 37
Add a Standard AWS Data Source 42
AWS: Geo-Blocking Support 45
Add Azure Subscription 46
Enable NSG Flow Log 47
Add VMware PKS 47
Add Kubernetes 48
Add OpenShift 49
Add Palo Alto Networks Panorama 50
Add Check Point Management Server 51
Add Cisco ASA 52
Add a Fortinet FortiManager 52
Add Arista Switch SSH 53
Add Dell OS10 Switches 54
Enable Telemetry on Dell OS10 Switches 55
Add Huawei 6800/7800/8800 Series 56
Add Cisco ACI 58
VMware, Inc. 3
Add a Physical Flow Collector for NetFlow and sFlow 59
Add vRealize Log Insight 60
Add Infoblox 61
Add F5 BIG-IP 62
Add ServiceNow 64
Adding ServiceNow 66
Add a New Generic Router or Switch 80
Edit a Generic Router or Switch 81
4 Migrating Data Sources 82
5 Delete a Data Source from vRealize Network Insight 84
6 Configuring vRealize Network Insight Settings 85Viewing System Health 86
Configure Data Retention Interval 86
Configuring IP Properties and Subnets 87
Import the DNS mapping file 87
Configure Mapping Between Subnet and a VLAN 87
Configure East-West IPs 88
Configure North-South IPs 88
Configuring Events and Notifications 89
System Events List 89
View and Edit System Events 136
Edit User Defined Events 139
View Platform Health Events 141
NSX-T Events 141
Kubernetes Events 151
Notifications 153
Configuring Identity and Access management 156
Configure User Management 156
Configuring Logs 165
View and Export Audit Logs 165
Setup Syslog Configuration 165
Configure Mail Server 166
Configure SNMP Trap Destination 167
Delete an SNMP Trap Destination 167
Managing Licenses 168
Comparing Feature Based on License 169
Add and Change License 170
Configure Auto-Refresh Interval 171
Using vRealize Network Insight
VMware, Inc. 4
Configure User Session Timeout 172
Add Google Maps API Key 172
Configure Data Source Certificate Validation 172
Accept a Data Source Certificate Manually 173
View the Audit Logs 174
Join or Leave the Customer Experience Improvement Program 175
Viewing Health of your Setup 176
Enabling the Support Tunnel 176
Managing your Disk Utilization 176
View the Node Details 177
Create a Support Bundle 178
Understanding Capacity for Collector and Platform Load 178
7 Direct Connect Support in vRealize Network Insight 180Viewing VMC Direct Connect Details 181
Viewing Flows over Direct Connect 181
Direct Connect Search Queries 182
8 vRealize Operations Manager Integration 184
9 Creating and Expanding Clusters 185Create Clusters 185
Expand Clusters 186
10 Configuring Flows in vRealize Network Insight 187Enabling IPFIX Configuration 187
IPFIX Configuration on VDS and DVPG 187
VMware NSX IPFIX Configuration 189
Flow Support for Physical Servers 191
Configuring a NetFlow Collector in a Physical Device 191
Enriching Flows and IP Endpoints 196
Search for Physical to Physical Flows 196
View Blocked and Protected Flows 197
Network Address Translation (NAT) 198
NAT Flow Support - Examples 199
VMware Cloud on AWS Flows 201
Create VPC Flow Log 201
Sending Flow Records from F5 To vRealize Network Insight Collectors 202
Create a pool of IPFIX Collectors 203
Create an IPFIX Log Destination 203
Create a Log Publisher 204
Using vRealize Network Insight
VMware, Inc. 5
Create iRules 204
Add the iRule To a Virtual Server 209
Create a Route Entry 209
11 Kubernetes and VMware PKS Scoping and Flow Information 211
12 Viewing Entity Details 212Viewing vRealize Network Insight System (NI-System) Details 213
Viewing Platform VM details 214
Viewing Collector VM Details 214
Viewing VMware vCenter Data Source Details 215
Viewing PCI Compliance Details 215
Export as PDF 216
Viewing Kubernetes Details 217
Viewing Load Balancer Details 218
Viewing VM Details 219
Viewing Edge Device Details 219
Viewing NSX Manager Details 220
Viewing VMware NSX-T Manager Details 221
Viewing NSX-T Management Node Details 222
Viewing NSX-T Transport Details 222
Viewing Virtual Server Details 224
Viewing Pool Members Details 225
Viewing Microsoft Azure Details 226
Viewing VeloCloud Enterprise Details 228
Viewing VeloCloud Edge Details 229
Viewing SD-WAN and Edge SD-WAN Application Details 230
Viewing SD-WAN Assessment Details 231
Generate Assessment Report 231
Viewing VeloCloud Link Application Details 231
Viewing VeloCloud Business Policy Details 232
Viewing VMC Sddc Details 232
Viewing Arista Hardware Gateway and Arista Hardware Gateway Binding Details 233
Viewing Flow Insight Details 233
Viewing Micro-Segmentation Details 237
Viewing Application Details 238
Analytics - Outlier Detection 239
How to Detect the Outlier VMs 239
Analytics: Static and Dynamic Thresholds 241
Configure Thresholds and Alerts 241
View the Threshold Configuration Page 243
Using vRealize Network Insight
VMware, Inc. 6
13 Viewing Entity Topology 245Virtual Machine Topology 245
Hosts Topology 245
VXLAN Topology 246
VLAN Topology 247
NSX Manager Topology 247
Viewing Audit Information of NSX objects in vRealize Network Insight 248
14 Working with Pins 252Pins 252
Types of Pins 252
Pinboards 254
Sharing and Collaboration of Pinboards 258
To Set A Pinboard as the Home Page 260
To Duplicate a Pinboard 261
15 Load Balancer support in vRealize Network Insight 262F5 as a Load Balancer 262
Viewing Load Balancer Details 263
Viewing Virtual Server Details 264
Viewing Pool Members Details 265
Sample Search Queries Related to Load Balancer 266
NSX-V as a Load Balancer 266
16 Network Visibility 267Path Topology 267
AWS VM-VM Path 268
NSX-T 270
NSX-V Edge Trunk Interface VM-VM Path 271
NAT support in vRealize Network Insight 271
VMware SD-WAN VM-VM path 273
Arista Hardware VTEP VM-VM Path 274
VMware Cloud on AWS: VM-VM Path 275
Cisco ACI VM-VM Path 276
Support for the Cisco BGP-EVPN Mode 277
Support for Equal-Cost Multi-Path (ECMP) Route 278
Support for the L2 Bridges 279
Viewing BGP Neighbours Details 279
Path to Internet 280
17 Security 281
Using vRealize Network Insight
VMware, Inc. 7
Cross vCenter NSX 281
Palo Alto Networks 282
Cisco ASA Firewall 285
Check Point Firewall 286
Security Groups 289
Policy-Based VPN 290
NSX Distributed Firewall Inactive Rules 291
Fortinet Firewall 291
18 Working with Micro-Segmentation 293Analyzing the Application 293
Viewing Micro-Segmentation And Flow Data in Donut View 293
View Micro-segmentation And Flow Data in Grid View 296
Create an Application Manually 297
Application Discovery 299
Add Discovered Applications 301
VMware Cloud on AWS: Planning and Micro-Segmentation 304
19 Recommended Firewall Rules 306Exporting Rules 308
NSX DFW Universal Artifacts 309
Save the Configuration for CSV Export as Property Template 310
Export and Apply Kubernetes Network Policies 312
20 Working with Search Queries 314Save and Delete Search Queries 315
Search Queries 316
Azure Search Queries 321
Cisco ACI Entities 322
Fortinet Search Queries 325
Enriching Flows with the Infoblox DNS Data 326
Common Search Queries for Kubernetes Entities 326
Sample Search Queries Related to Load Balancer 328
Search Queries for NSX Firewall Rules 329
VMware SD-WAN Search Queries 329
VMC Sddc Search Queries 330
VMware Cloud on AWS for AWS Entities 331
Advanced Queries 332
Time Control 336
Search Results 337
Filters 337
Using vRealize Network Insight
VMware, Inc. 8
vCenter Tags 338
21 Planning Disaster Recovery for vRealize Network Insight 341Sample Disaster Recovery Scenario 342
22 Troubleshooting 345Common Data Source Errors 345
Unable to Enable DFW IPFIX 346
23 Planning Application Migration to VMware Cloud on AWS using vRealize Network Insight 349
How do I obtain the CSP Refresh Token for NSX Manager 350
How Do I Obtain vCenter Credentials 353
Compute Gateway Firewall Rule 356
Using vRealize Network Insight
VMware, Inc. 9
About vRealize Network Insight User Guide 1The vRealize Network Insight User Guide provides information about using vRealize Network Insight.
Intended AudienceThis information is intended for administrators or specialists responsible for using vRealize Network Insight. The information is written for experienced virtual machine administrators who are familiar with enterprise management applications and datacenter operations.
VMware, Inc. 10
Getting Started 2This chapter includes the following topics:
n Introduction
n Homepage
n Navigation
n Settings
IntroductionvRealize Network Insight delivers intelligent operations for software-defined networking and security. It helps customers build an optimized, highly-available, and secure network infrastructure across multi-cloud environments. It accelerates micro-segmentation planning and deployment, enables visibility across virtual and physical networks, and provides operational views to manage and scale the VMware NSX deployments.
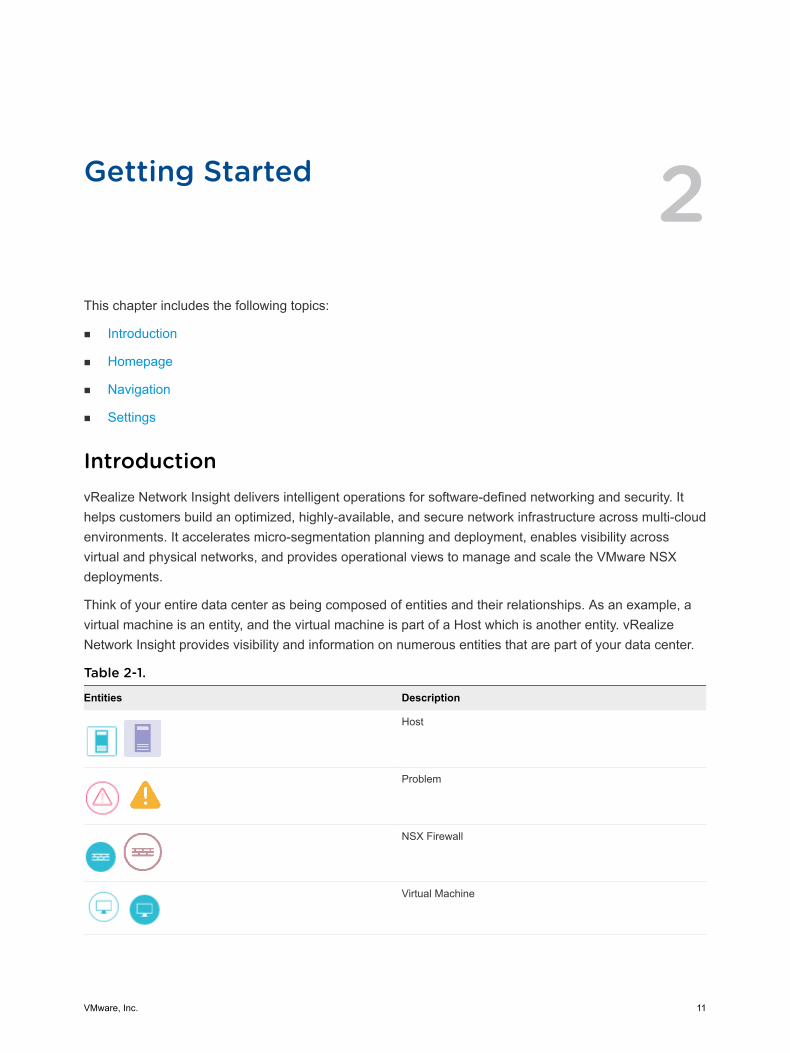
Think of your entire data center as being composed of entities and their relationships. As an example, a virtual machine is an entity, and the virtual machine is part of a Host which is another entity. vRealize Network Insight provides visibility and information on numerous entities that are part of your data center.
Table 2-1.
Entities Description
Host
Problem
NSX Firewall
Virtual Machine
VMware, Inc. 11
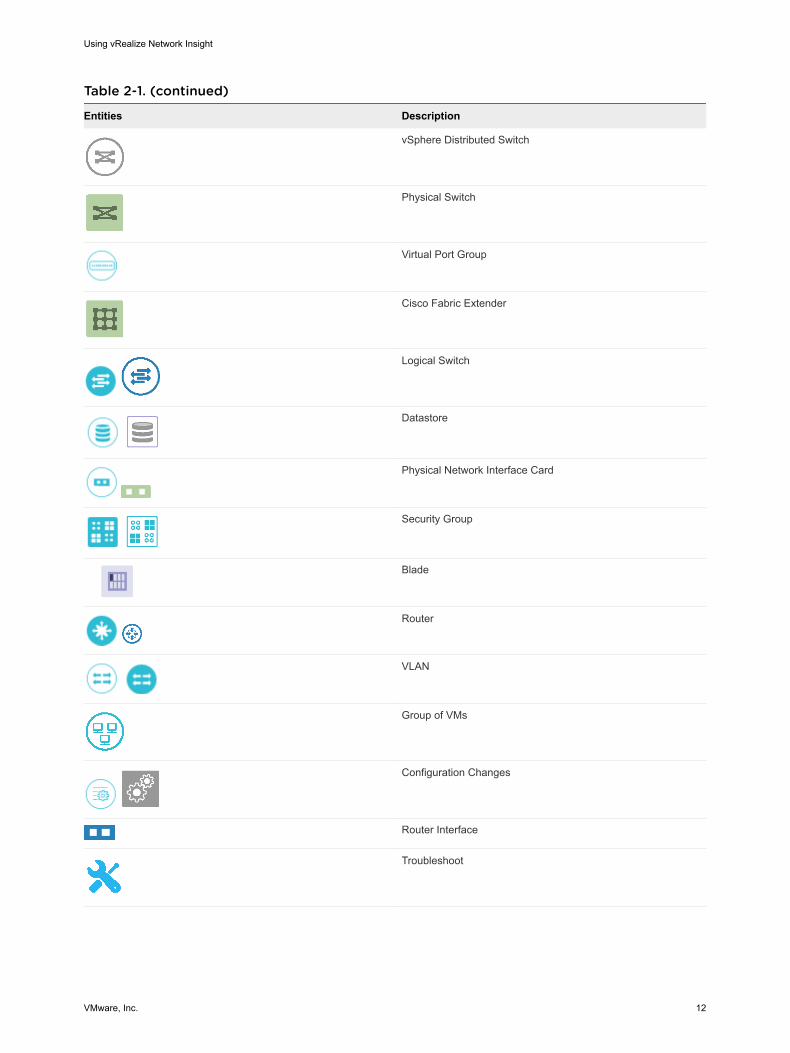
Table 2-1. (continued)
Entities Description
vSphere Distributed Switch
Physical Switch
Virtual Port Group
Cisco Fabric Extender
Logical Switch
Datastore
Physical Network Interface Card
Security Group
Blade
Router
VLAN
Group of VMs
Configuration Changes
Router Interface
Troubleshoot
Using vRealize Network Insight
VMware, Inc. 12
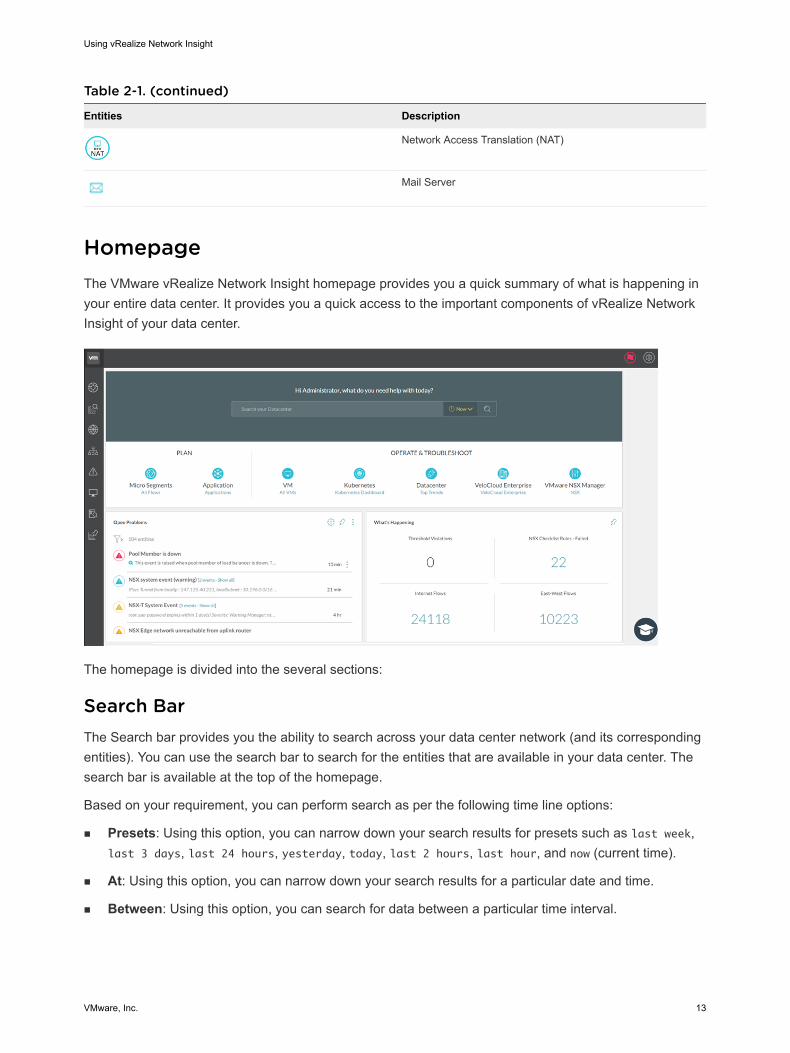
Table 2-1. (continued)
Entities Description
Network Access Translation (NAT)
Mail Server
HomepageThe VMware vRealize Network Insight homepage provides you a quick summary of what is happening in your entire data center. It provides you a quick access to the important components of vRealize Network Insight of your data center.
The homepage is divided into the several sections:
Search BarThe Search bar provides you the ability to search across your data center network (and its corresponding entities). You can use the search bar to search for the entities that are available in your data center. The search bar is available at the top of the homepage.
Based on your requirement, you can perform search as per the following time line options:
n Presets: Using this option, you can narrow down your search results for presets such as last week, last 3 days, last 24 hours, yesterday, today, last 2 hours, last hour, and now (current time).
n At: Using this option, you can narrow down your search results for a particular date and time.
n Between: Using this option, you can search for data between a particular time interval.
Using vRealize Network Insight
VMware, Inc. 13
Plan Sectionn Micro Segments: You can plan the micro-segmentation of the network based on the flows between
all the VMs.
n Application: You can define your applications and analyse their flows, and plan their security.
Operate and Troubleshoot SectionThe Operate and Troubleshoot section provides visibility, metrics, and analytics for the following components:
n Virtual Machine (VM)
n VLAN Network
n Data Center
n NSX Security Group
n VMware NSX
Open ProblemsThe Open Problems section provides a quick glance of the critical events that the platform finds in your data center. All such similar events are grouped. Use Show All to view all the events. To view more
details of an event, click (View Details). You can use the Configure Events icon to navigate to the System Events page and configure them.
Also, if you click Configure event option under More Options for a particular event, you can navigate directly to the edit view of the particular event to modify the configurations.
What's HappeningThe What’s Happening section provides a quick view of very high-value properties from your data center. To view the property details, click the count of a particular property. This section also contains filters on the left side to filter the events, and expand all and collapse all buttons to view the details of the events.
NavigationvRealize Network Insight contains a navigation panel on the left that helps users to navigate quickly to the key product features such as Security, Topologies, Entities, Events, and Saved Searches of interest without having to type any search queries.
The Navigation Panel contains the following options:
n Security: Provides you the following options:
n Plan Security: Allows you to analyze the flows in the environment and helps to plan the micro-segments within the environment. You can select all the entities or select a particular entity and then select the duration to analyze the selected entity.
Using vRealize Network Insight
VMware, Inc. 14
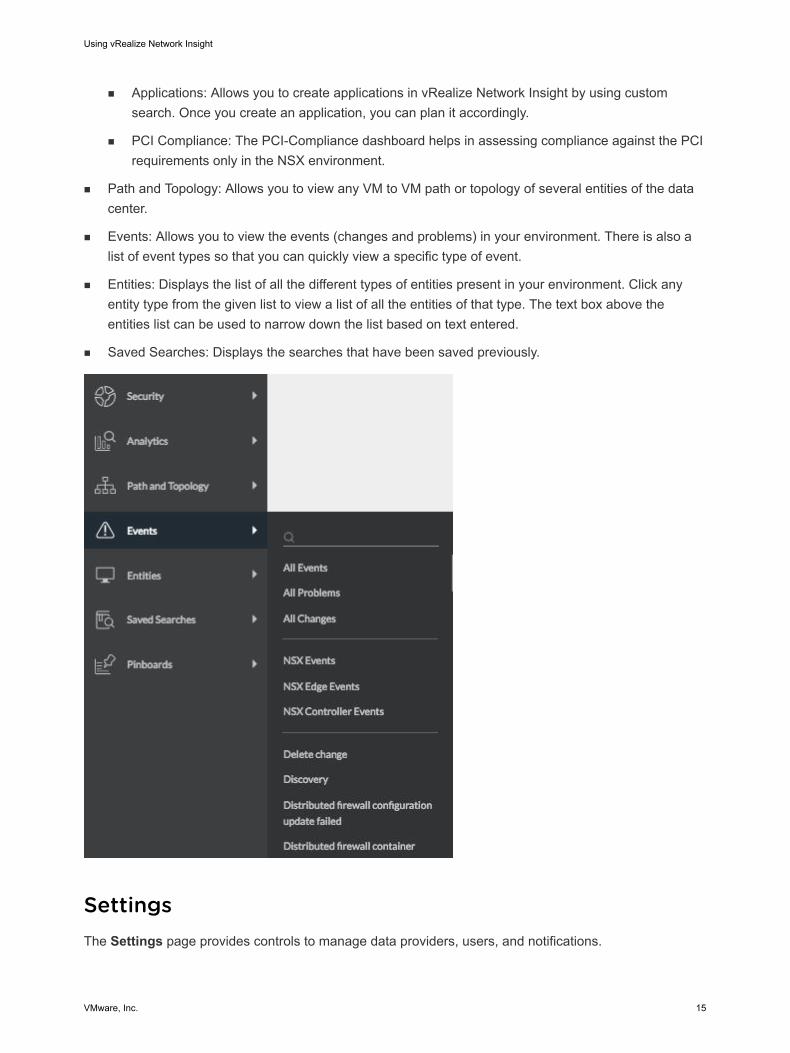
n Applications: Allows you to create applications in vRealize Network Insight by using custom search. Once you create an application, you can plan it accordingly.
n PCI Compliance: The PCI-Compliance dashboard helps in assessing compliance against the PCI requirements only in the NSX environment.
n Path and Topology: Allows you to view any VM to VM path or topology of several entities of the data center.
n Events: Allows you to view the events (changes and problems) in your environment. There is also a list of event types so that you can quickly view a specific type of event.
n Entities: Displays the list of all the different types of entities present in your environment. Click any entity type from the given list to view a list of all the entities of that type. The text box above the entities list can be used to narrow down the list based on text entered.
n Saved Searches: Displays the searches that have been saved previously.
SettingsThe Settings page provides controls to manage data providers, users, and notifications.
Using vRealize Network Insight
VMware, Inc. 15
To go to the Settings page:
1 On the top-right hand corner in the Home page, click the Profile icon.
2 Click Settings. The Settings page appears.
Using vRealize Network Insight
VMware, Inc. 16
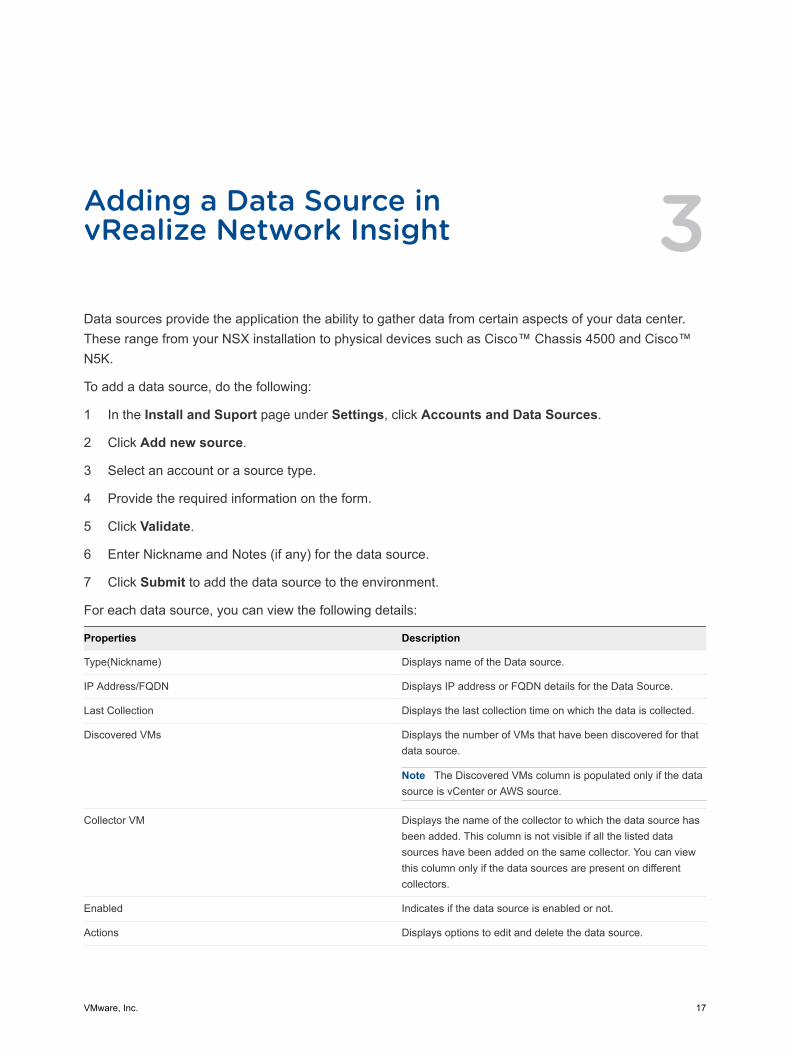
Adding a Data Source in vRealize Network Insight 3Data sources provide the application the ability to gather data from certain aspects of your data center. These range from your NSX installation to physical devices such as Cisco™ Chassis 4500 and Cisco™ N5K.
To add a data source, do the following:
1 In the Install and Suport page under Settings, click Accounts and Data Sources.
2 Click Add new source.
3 Select an account or a source type.
4 Provide the required information on the form.
5 Click Validate.
6 Enter Nickname and Notes (if any) for the data source.
7 Click Submit to add the data source to the environment.
For each data source, you can view the following details:
Properties Description
Type(Nickname) Displays name of the Data source.
IP Address/FQDN Displays IP address or FQDN details for the Data Source.
Last Collection Displays the last collection time on which the data is collected.
Discovered VMs Displays the number of VMs that have been discovered for that data source.
Note The Discovered VMs column is populated only if the data source is vCenter or AWS source.
Collector VM Displays the name of the collector to which the data source has been added. This column is not visible if all the listed data sources have been added on the same collector. You can view this column only if the data sources are present on different collectors.
Enabled Indicates if the data source is enabled or not.
Actions Displays options to edit and delete the data source.
VMware, Inc. 17
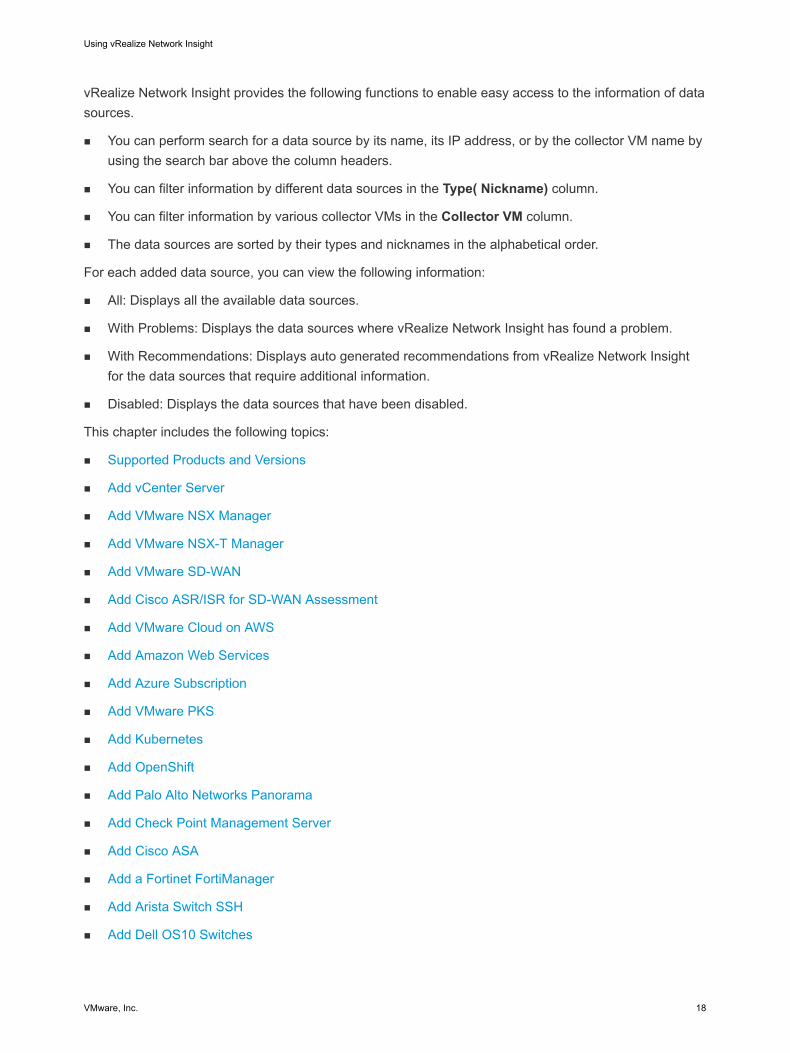
vRealize Network Insight provides the following functions to enable easy access to the information of data sources.
n You can perform search for a data source by its name, its IP address, or by the collector VM name by using the search bar above the column headers.
n You can filter information by different data sources in the Type( Nickname) column.
n You can filter information by various collector VMs in the Collector VM column.
n The data sources are sorted by their types and nicknames in the alphabetical order.
For each added data source, you can view the following information:
n All: Displays all the available data sources.
n With Problems: Displays the data sources where vRealize Network Insight has found a problem.
n With Recommendations: Displays auto generated recommendations from vRealize Network Insight for the data sources that require additional information.
n Disabled: Displays the data sources that have been disabled.
This chapter includes the following topics:
n Supported Products and Versions
n Add vCenter Server
n Add VMware NSX Manager
n Add VMware NSX-T Manager
n Add VMware SD-WAN
n Add Cisco ASR/ISR for SD-WAN Assessment
n Add VMware Cloud on AWS
n Add Amazon Web Services
n Add Azure Subscription
n Add VMware PKS
n Add Kubernetes
n Add OpenShift
n Add Palo Alto Networks Panorama
n Add Check Point Management Server
n Add Cisco ASA
n Add a Fortinet FortiManager
n Add Arista Switch SSH
n Add Dell OS10 Switches
Using vRealize Network Insight
VMware, Inc. 18
n Add Huawei 6800/7800/8800 Series
n Add Cisco ACI
n Add a Physical Flow Collector for NetFlow and sFlow
n Add vRealize Log Insight
n Add Infoblox
n Add F5 BIG-IP
n Add ServiceNow
n Add a New Generic Router or Switch
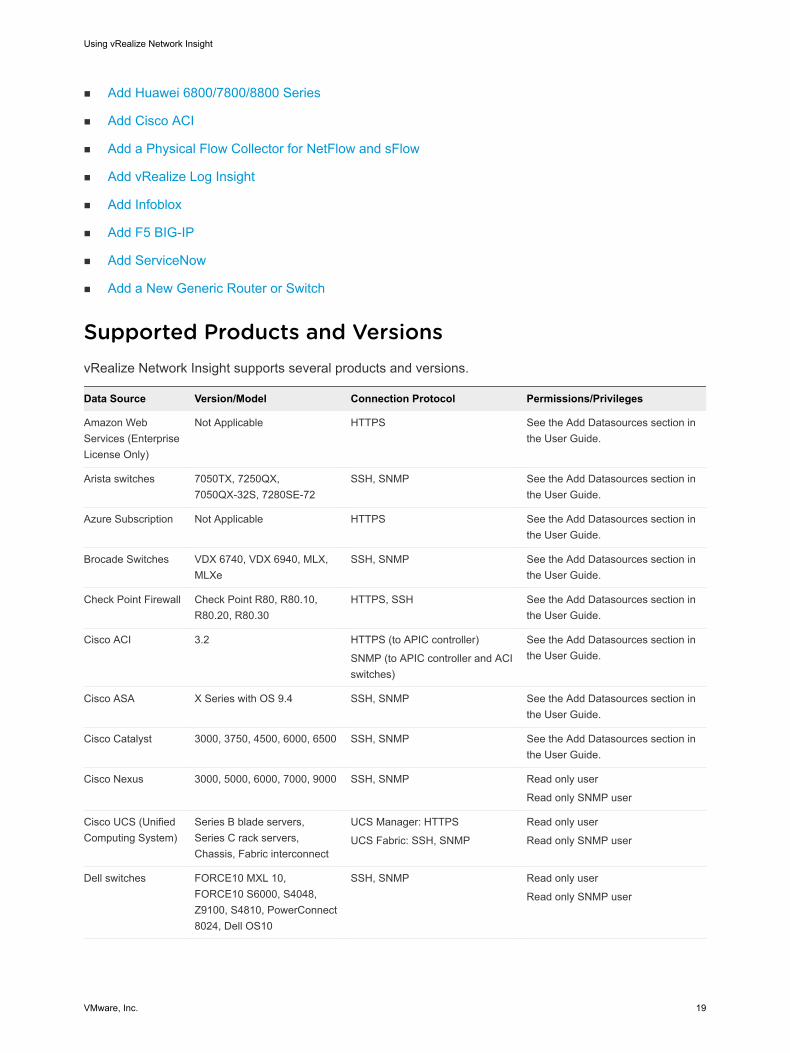
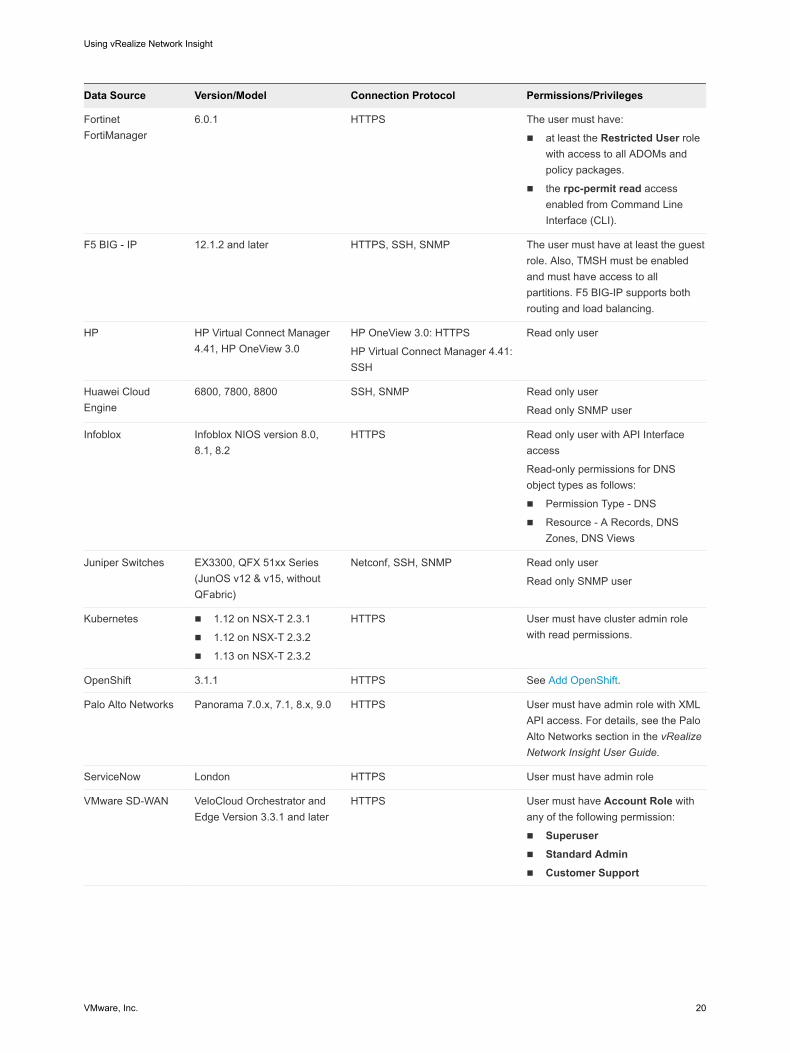
Supported Products and VersionsvRealize Network Insight supports several products and versions.
Data Source Version/Model Connection Protocol Permissions/Privileges
Amazon Web Services (Enterprise License Only)
Not Applicable HTTPS See the Add Datasources section in the User Guide.
Arista switches 7050TX, 7250QX, 7050QX-32S, 7280SE-72
SSH, SNMP See the Add Datasources section in the User Guide.
Azure Subscription Not Applicable HTTPS See the Add Datasources section in the User Guide.
Brocade Switches VDX 6740, VDX 6940, MLX, MLXe
SSH, SNMP See the Add Datasources section in the User Guide.
Check Point Firewall Check Point R80, R80.10, R80.20, R80.30
HTTPS, SSH See the Add Datasources section in the User Guide.
Cisco ACI 3.2 HTTPS (to APIC controller)
SNMP (to APIC controller and ACI switches)
See the Add Datasources section in the User Guide.
Cisco ASA X Series with OS 9.4 SSH, SNMP See the Add Datasources section in the User Guide.
Cisco Catalyst 3000, 3750, 4500, 6000, 6500 SSH, SNMP See the Add Datasources section in the User Guide.
Cisco Nexus 3000, 5000, 6000, 7000, 9000 SSH, SNMP Read only user
Read only SNMP user
Cisco UCS (Unified Computing System)
Series B blade servers, Series C rack servers, Chassis, Fabric interconnect
UCS Manager: HTTPS
UCS Fabric: SSH, SNMP
Read only user
Read only SNMP user
Dell switches FORCE10 MXL 10, FORCE10 S6000, S4048, Z9100, S4810, PowerConnect 8024, Dell OS10
SSH, SNMP Read only user
Read only SNMP user
Using vRealize Network Insight
VMware, Inc. 19
Data Source Version/Model Connection Protocol Permissions/Privileges
Fortinet FortiManager
6.0.1 HTTPS The user must have:
n at least the Restricted User role with access to all ADOMs and policy packages.
n the rpc-permit read access enabled from Command Line Interface (CLI).
F5 BIG - IP 12.1.2 and later HTTPS, SSH, SNMP The user must have at least the guest role. Also, TMSH must be enabled and must have access to all partitions. F5 BIG-IP supports both routing and load balancing.
HP HP Virtual Connect Manager 4.41, HP OneView 3.0
HP OneView 3.0: HTTPS
HP Virtual Connect Manager 4.41: SSH
Read only user
Huawei Cloud Engine
6800, 7800, 8800 SSH, SNMP Read only user
Read only SNMP user
Infoblox Infoblox NIOS version 8.0, 8.1, 8.2
HTTPS Read only user with API Interface access
Read-only permissions for DNS object types as follows:
n Permission Type - DNS
n Resource - A Records, DNS Zones, DNS Views
Juniper Switches EX3300, QFX 51xx Series (JunOS v12 & v15, without QFabric)
Netconf, SSH, SNMP Read only user
Read only SNMP user
Kubernetes n 1.12 on NSX-T 2.3.1
n 1.12 on NSX-T 2.3.2
n 1.13 on NSX-T 2.3.2
HTTPS User must have cluster admin role with read permissions.
OpenShift 3.1.1 HTTPS See Add OpenShift.
Palo Alto Networks Panorama 7.0.x, 7.1, 8.x, 9.0 HTTPS User must have admin role with XML API access. For details, see the Palo Alto Networks section in the vRealize Network Insight User Guide.
ServiceNow London HTTPS User must have admin role
VMware SD-WAN VeloCloud Orchestrator and Edge Version 3.3.1 and later
HTTPS User must have Account Role with any of the following permission:
n Superusern Standard Adminn Customer Support
Using vRealize Network Insight
VMware, Inc. 20
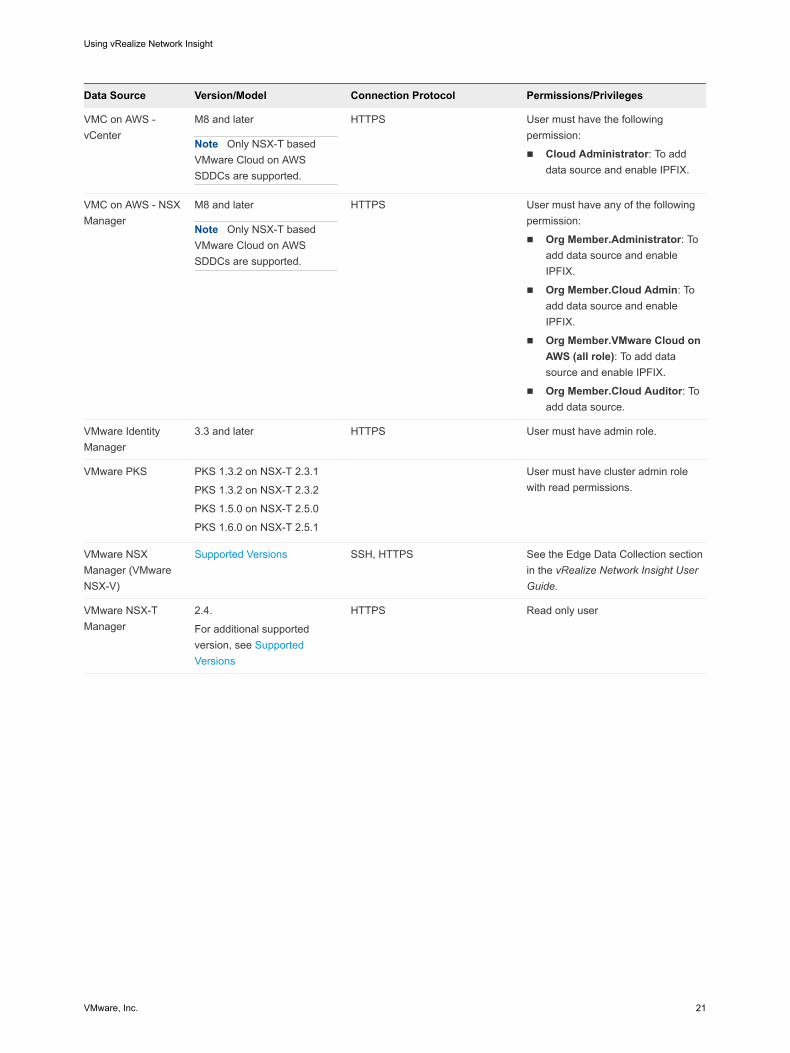
Data Source Version/Model Connection Protocol Permissions/Privileges
VMC on AWS - vCenter
M8 and later
Note Only NSX-T based VMware Cloud on AWS SDDCs are supported.
HTTPS User must have the following permission:
n Cloud Administrator: To add data source and enable IPFIX.
VMC on AWS - NSX Manager
M8 and later
Note Only NSX-T based VMware Cloud on AWS SDDCs are supported.
HTTPS User must have any of the following permission:
n Org Member.Administrator: To add data source and enable IPFIX.
n Org Member.Cloud Admin: To add data source and enable IPFIX.
n Org Member.VMware Cloud on AWS (all role): To add data source and enable IPFIX.
n Org Member.Cloud Auditor: To add data source.
VMware Identity Manager
3.3 and later HTTPS User must have admin role.
VMware PKS PKS 1.3.2 on NSX-T 2.3.1
PKS 1.3.2 on NSX-T 2.3.2
PKS 1.5.0 on NSX-T 2.5.0
PKS 1.6.0 on NSX-T 2.5.1
User must have cluster admin role with read permissions.
VMware NSX Manager (VMware NSX-V)
Supported Versions SSH, HTTPS See the Edge Data Collection section in the vRealize Network Insight User Guide.
VMware NSX-T Manager
2.4.
For additional supported version, see Supported Versions
HTTPS Read only user
Using vRealize Network Insight
VMware, Inc. 21
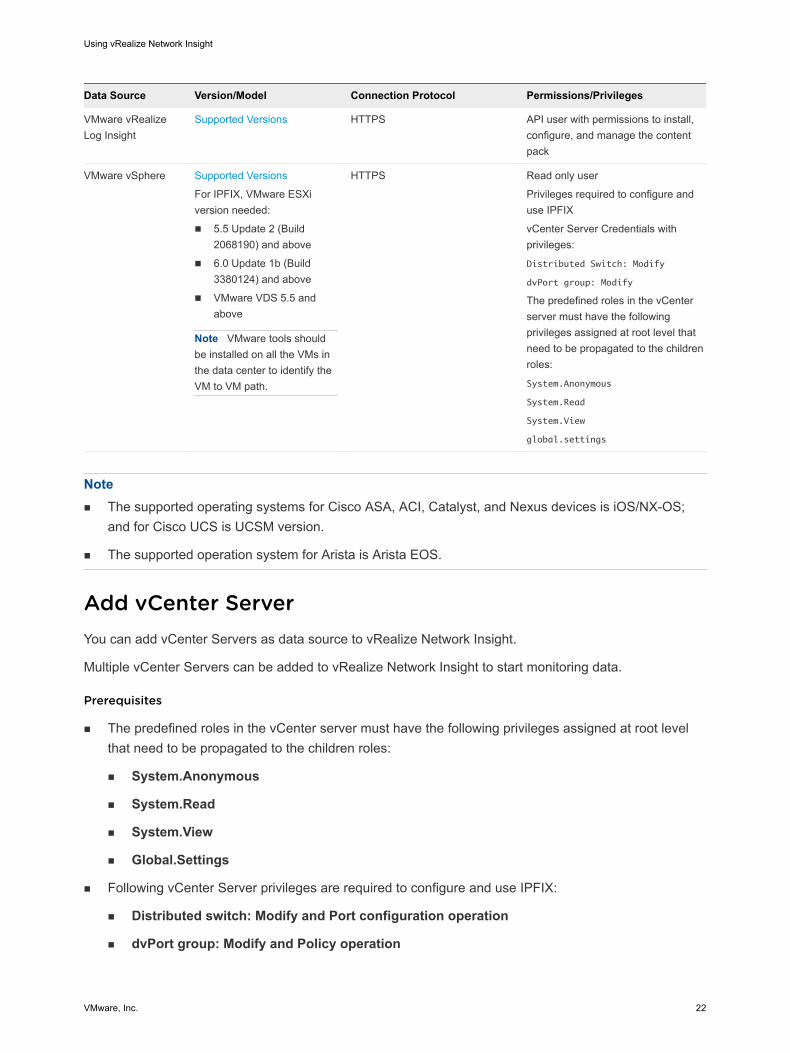
Data Source Version/Model Connection Protocol Permissions/Privileges
VMware vRealize Log Insight
Supported Versions HTTPS API user with permissions to install, configure, and manage the content pack
VMware vSphere Supported Versions
For IPFIX, VMware ESXi version needed:
n 5.5 Update 2 (Build 2068190) and above
n 6.0 Update 1b (Build 3380124) and above
n VMware VDS 5.5 and above
Note VMware tools should be installed on all the VMs in the data center to identify the VM to VM path.
HTTPS Read only user
Privileges required to configure and use IPFIX
vCenter Server Credentials with privileges:
Distributed Switch: Modify
dvPort group: Modify
The predefined roles in the vCenter server must have the following privileges assigned at root level that need to be propagated to the children roles:
System.Anonymous
System.Read
System.View
global.settings
Note n The supported operating systems for Cisco ASA, ACI, Catalyst, and Nexus devices is iOS/NX-OS;
and for Cisco UCS is UCSM version.
n The supported operation system for Arista is Arista EOS.
Add vCenter ServerYou can add vCenter Servers as data source to vRealize Network Insight.
Multiple vCenter Servers can be added to vRealize Network Insight to start monitoring data.
Prerequisites
n The predefined roles in the vCenter server must have the following privileges assigned at root level that need to be propagated to the children roles:
n System.Anonymous
n System.Read
n System.View
n Global.Settings
n Following vCenter Server privileges are required to configure and use IPFIX:
n Distributed switch: Modify and Port configuration operation
n dvPort group: Modify and Policy operation
Using vRealize Network Insight
VMware, Inc. 22
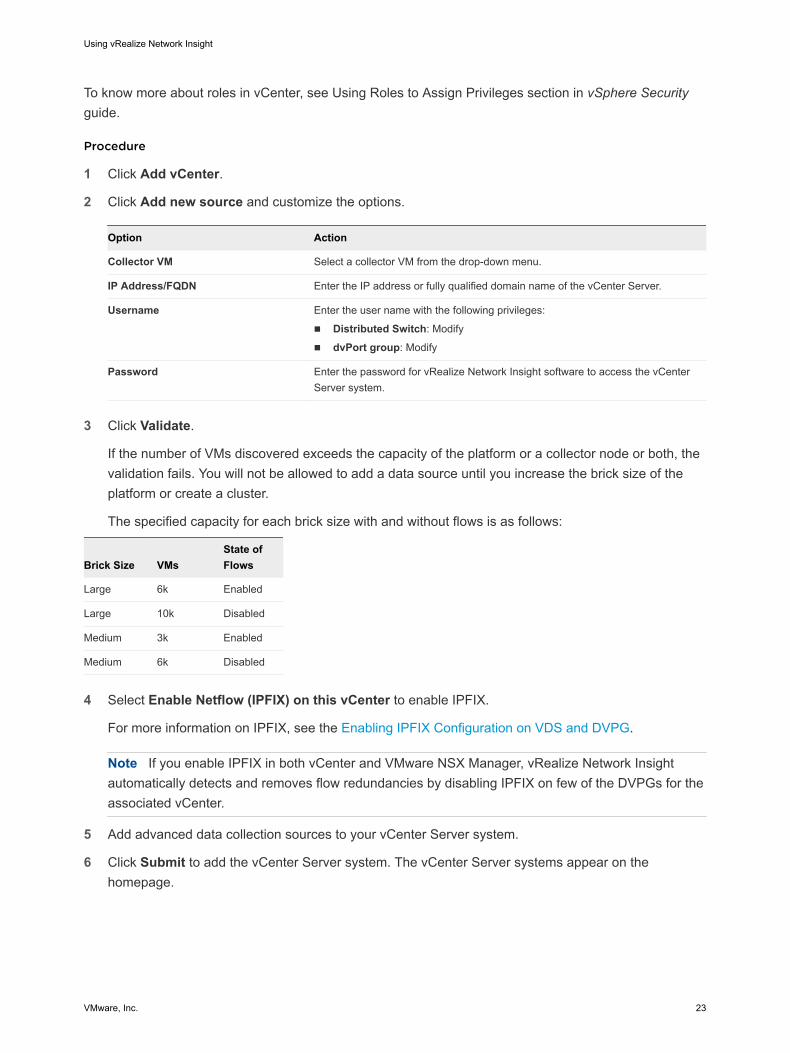
To know more about roles in vCenter, see Using Roles to Assign Privileges section in vSphere Security guide.
Procedure
1 Click Add vCenter.
2 Click Add new source and customize the options.
Option Action
Collector VM Select a collector VM from the drop-down menu.
IP Address/FQDN Enter the IP address or fully qualified domain name of the vCenter Server.
Username Enter the user name with the following privileges:
n Distributed Switch: Modify
n dvPort group: Modify
Password Enter the password for vRealize Network Insight software to access the vCenter Server system.
3 Click Validate.
If the number of VMs discovered exceeds the capacity of the platform or a collector node or both, the validation fails. You will not be allowed to add a data source until you increase the brick size of the platform or create a cluster.
The specified capacity for each brick size with and without flows is as follows:
Brick Size VMsState of Flows
Large 6k Enabled
Large 10k Disabled
Medium 3k Enabled
Medium 6k Disabled
4 Select Enable Netflow (IPFIX) on this vCenter to enable IPFIX.
For more information on IPFIX, see the Enabling IPFIX Configuration on VDS and DVPG.
Note If you enable IPFIX in both vCenter and VMware NSX Manager, vRealize Network Insight automatically detects and removes flow redundancies by disabling IPFIX on few of the DVPGs for the associated vCenter.
5 Add advanced data collection sources to your vCenter Server system.
6 Click Submit to add the vCenter Server system. The vCenter Server systems appear on the homepage.
Using vRealize Network Insight
VMware, Inc. 23
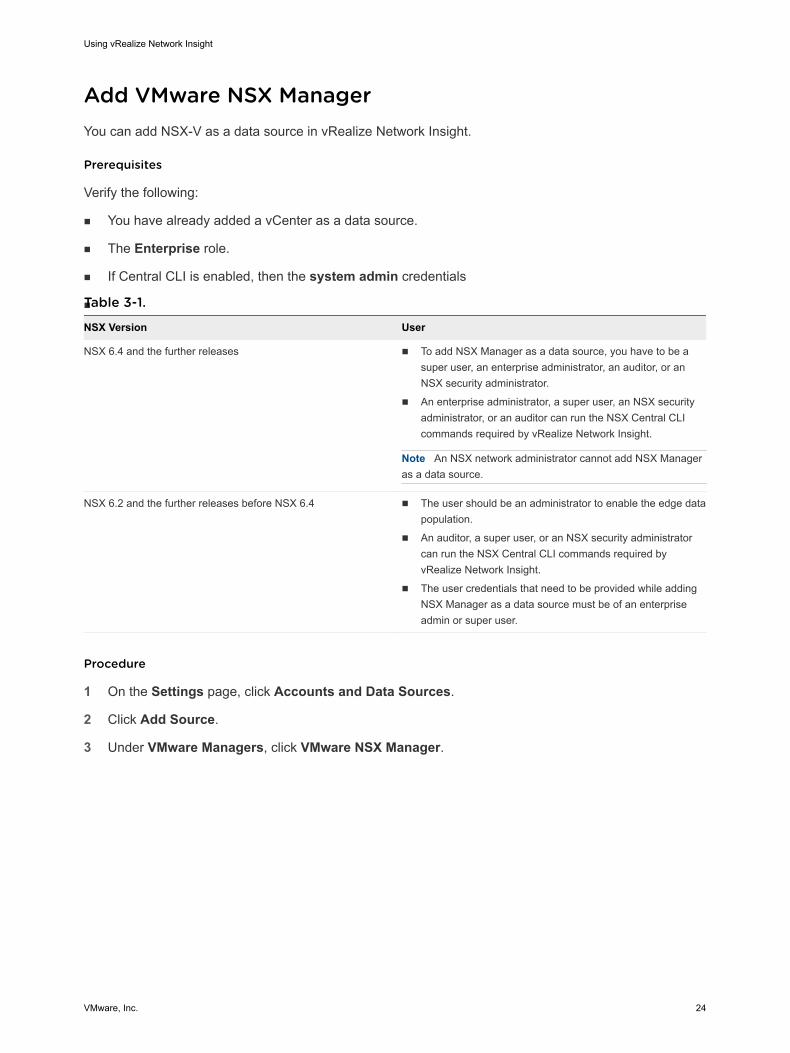
Add VMware NSX ManagerYou can add NSX-V as a data source in vRealize Network Insight.
Prerequisites
Verify the following:
n You have already added a vCenter as a data source.
n The Enterprise role.
n If Central CLI is enabled, then the system admin credentials
nTable 3-1.
NSX Version User
NSX 6.4 and the further releases n To add NSX Manager as a data source, you have to be a super user, an enterprise administrator, an auditor, or an NSX security administrator.
n An enterprise administrator, a super user, an NSX security administrator, or an auditor can run the NSX Central CLI commands required by vRealize Network Insight.
Note An NSX network administrator cannot add NSX Manager as a data source.
NSX 6.2 and the further releases before NSX 6.4 n The user should be an administrator to enable the edge data population.
n An auditor, a super user, or an NSX security administrator can run the NSX Central CLI commands required by vRealize Network Insight.
n The user credentials that need to be provided while adding NSX Manager as a data source must be of an enterprise admin or super user.
Procedure
1 On the Settings page, click Accounts and Data Sources.
2 Click Add Source.
3 Under VMware Managers, click VMware NSX Manager.
Using vRealize Network Insight
VMware, Inc. 24
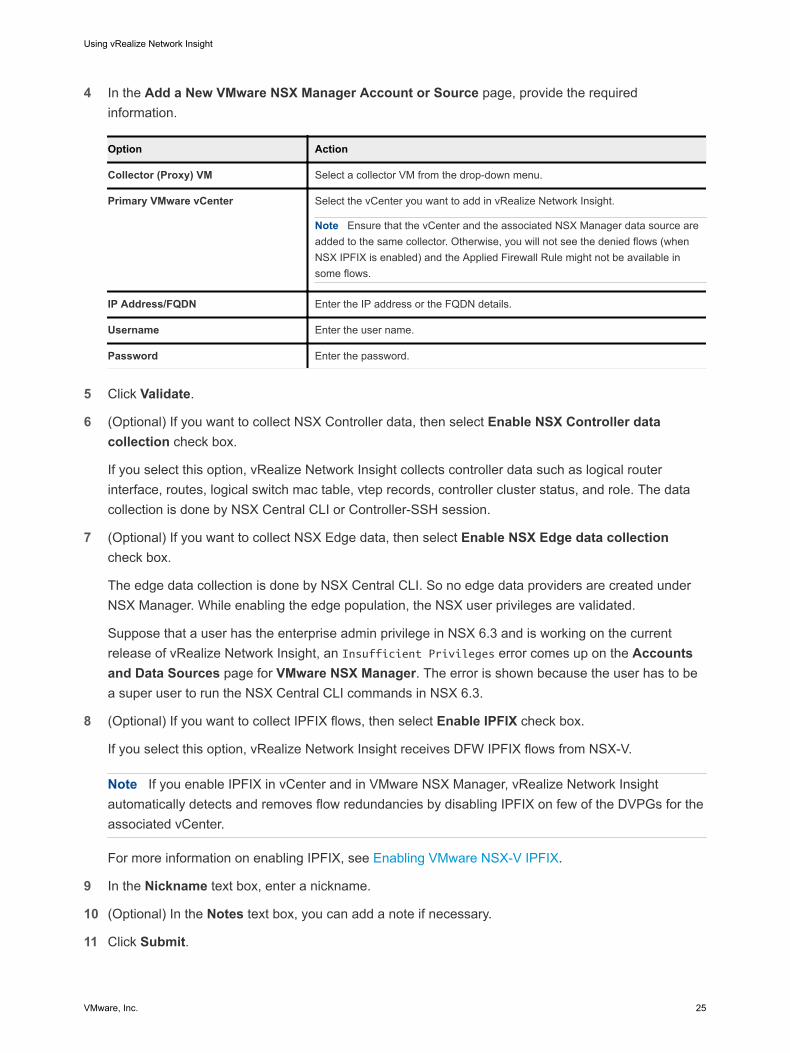
4 In the Add a New VMware NSX Manager Account or Source page, provide the required information.
Option Action
Collector (Proxy) VM Select a collector VM from the drop-down menu.
Primary VMware vCenter Select the vCenter you want to add in vRealize Network Insight.
Note Ensure that the vCenter and the associated NSX Manager data source are added to the same collector. Otherwise, you will not see the denied flows (when NSX IPFIX is enabled) and the Applied Firewall Rule might not be available in some flows.
IP Address/FQDN Enter the IP address or the FQDN details.
Username Enter the user name.
Password Enter the password.
5 Click Validate.
6 (Optional) If you want to collect NSX Controller data, then select Enable NSX Controller data collection check box.
If you select this option, vRealize Network Insight collects controller data such as logical router interface, routes, logical switch mac table, vtep records, controller cluster status, and role. The data collection is done by NSX Central CLI or Controller-SSH session.
7 (Optional) If you want to collect NSX Edge data, then select Enable NSX Edge data collection check box.
The edge data collection is done by NSX Central CLI. So no edge data providers are created under NSX Manager. While enabling the edge population, the NSX user privileges are validated.
Suppose that a user has the enterprise admin privilege in NSX 6.3 and is working on the current release of vRealize Network Insight, an Insufficient Privileges error comes up on the Accounts and Data Sources page for VMware NSX Manager. The error is shown because the user has to be a super user to run the NSX Central CLI commands in NSX 6.3.
8 (Optional) If you want to collect IPFIX flows, then select Enable IPFIX check box.
If you select this option, vRealize Network Insight receives DFW IPFIX flows from NSX-V.
Note If you enable IPFIX in vCenter and in VMware NSX Manager, vRealize Network Insight automatically detects and removes flow redundancies by disabling IPFIX on few of the DVPGs for the associated vCenter.
For more information on enabling IPFIX, see Enabling VMware NSX-V IPFIX.
9 In the Nickname text box, enter a nickname.
10 (Optional) In the Notes text box, you can add a note if necessary.
11 Click Submit.
Using vRealize Network Insight
VMware, Inc. 25
Add VMware NSX-T ManagerVMware NSX-T is designed to address the emerging application frameworks and architectures that have heterogeneous endpoints and technology stacks. In addition to vSphere, these environments may also include other hypervisors, containers, bare metal, and public clouds. vRealize Network Insight supports NSX-T deployments where the VMs are managed by vCenter.
Considerationsn vRealize Network Insight supports only the NSX-T setups in which vCenter manages the ESXi hosts.
n vRealize Network Insight supports NSGroups, NSX-T Firewall Rules, IPSets, NSX-T Logical Ports, NSX-T Logical Switches, NSX-T distributed firewall IPFIX flows, Segment, Group, and Policy Based VPN.
n vRealize Network Insight supports both NSX-V and NSX-T deployments. When you use NSX in your queries, the results include both NSX-V and NSX-T entities. NSX Manager lists both NSX-V and NSX-T Managers. NSX Security Groups list both NSX-T and NSX-V security groups. If NSX-V or NSX-T is used instead of NSX, then only those entities are displayed. The same logic applies to the entities such as firewall rules, IPSets, and logical switches.
n With NSX-T 2.4 release, vRealize Network Insight supports NSX Declarative Policy Management which simplifies and automate network and security configurations through outcome-driven policy statements.
Note Micro-segmentation for Security Group is done based on NSX Policy data. But in case there is no corresponding NSX Policy Group, the standalone NS Group is included in the Micro-segmentation analysis. For more details on NS Group, see NSX-T product documentation.
To Add an NSX-T Manager as a Data SourceHere are the prerequisites for adding an NSX-T Manager as a data source:
n It is recommended that you add all the vCenters associated with NSX-T Manager as data sources in vRealize Network Insight.
n If you add NSX-T Manager before adding vCenter then vRealize Network Insight takes around 4 hours to stabilize.
n Ensure that there are no logical switches in the exclusion list in the Distributed Firewall (DFW). If there are any logical switches in this list, then the flows are not reported for any VMs attached to these logical switches.
To add an NSX-T Manager:
1 On the Accounts and Data Source page under Settings, click Add Source.
2 Under VMware Manager in the Select an Account or Data Type page, select VMware NSX-T Manager.
Using vRealize Network Insight
VMware, Inc. 26
3 Provide the user credentials.
Note n If you have more than one management node in a single NSX-T deployment, you must add only
one node as a data source in vRealize Network Insight or use Virtual IP (VIP) (of those nodes). If you add more than one management node, then vRealize Network Insight may not function properly.
n It is recommended to use VIP when you add NSX-T as a data source. If you add a management node IP instead of VIP, and later if you want to add a VIP or other management node IP, then you have to delete the existing data source to add the new VIP or Management IP.
n If IPFIX is not required, the user must be a local user with the audit level permissions. But if IPFIX is required then the user must have one of the following audit level permissions: enterprise_admin, network_engineer, or security_engineer.
4 (Optional) Select Enable DFW IPFIX to update the IPFIX settings on NSX-T. By selecting this option, vRealize Network Insight receives DFW IPFIX flows from NSX-T. For more information on enabling IPFIX, see Enabling VMware NSX-T DFW IPFIX.
Note n DFW IPFIX is not supported in the Standard Edition of NSX-T.
n vRealize Network Insight does not support NSX-T Switch IPFIX flows.
5 (Optional) If you want to collect latency metrics data, select Enable latency metric collection check box. If you select this option, vRealize Network Insight receives latency metrics (VTEP - VTEP) from NSX - T. This option is available only for NSX-T 2.5 and later. Ensure that the port 1991 is open on the collector to receive the latency data from the ESXi node.
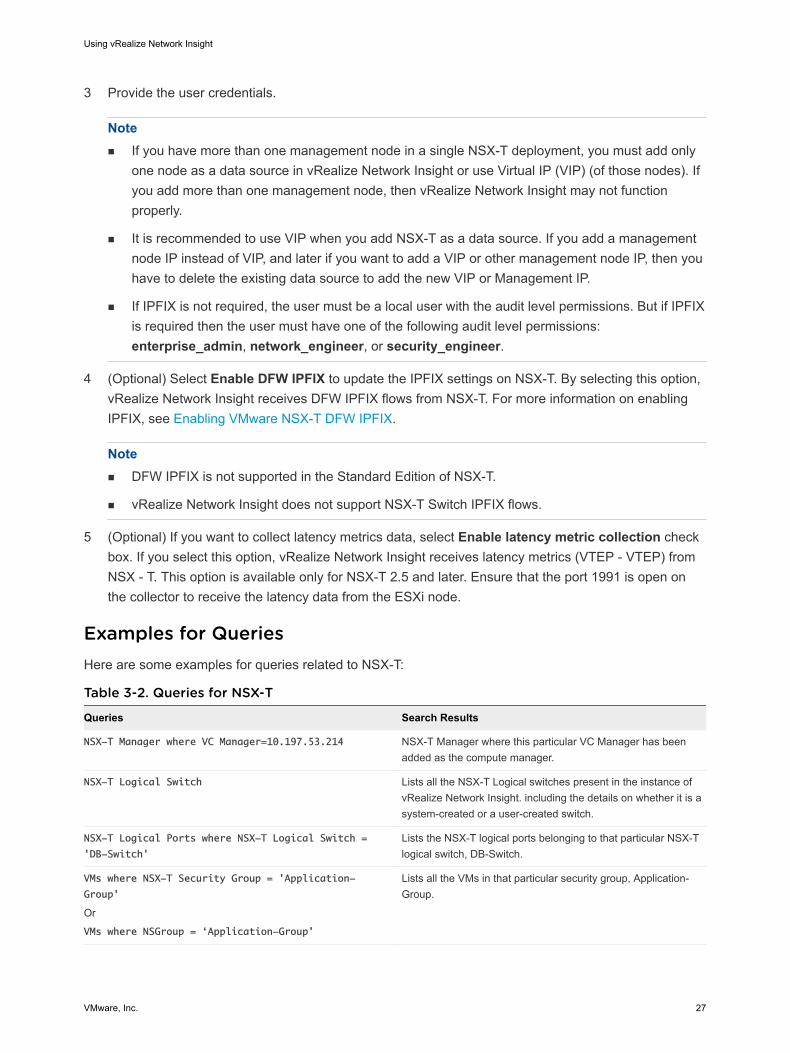
Examples for QueriesHere are some examples for queries related to NSX-T:
Table 3-2. Queries for NSX-T
Queries Search Results
NSX-T Manager where VC Manager=10.197.53.214 NSX-T Manager where this particular VC Manager has been added as the compute manager.
NSX-T Logical Switch Lists all the NSX-T Logical switches present in the instance of vRealize Network Insight. including the details on whether it is a system-created or a user-created switch.
NSX-T Logical Ports where NSX-T Logical Switch =
'DB-Switch'
Lists the NSX-T logical ports belonging to that particular NSX-T logical switch, DB-Switch.
VMs where NSX-T Security Group = 'Application-
Group'
Or
VMs where NSGroup = ‘Application-Group’
Lists all the VMs in that particular security group, Application-Group.
Using vRealize Network Insight
VMware, Inc. 27
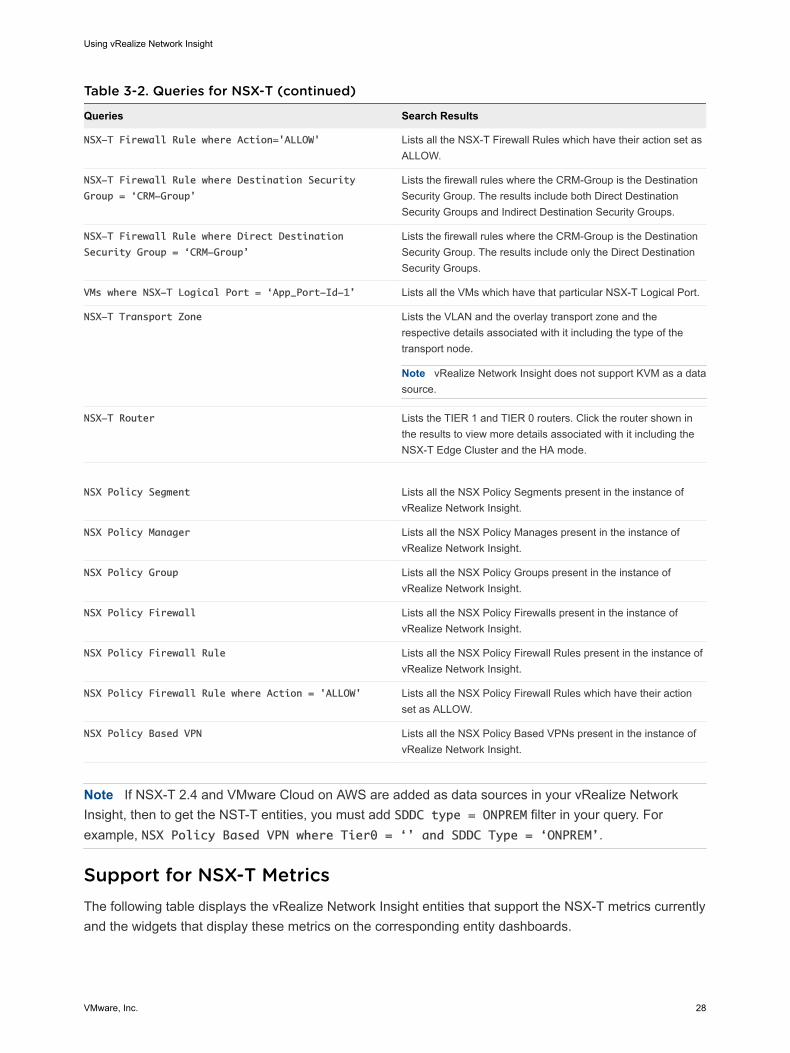
Table 3-2. Queries for NSX-T (continued)
Queries Search Results
NSX-T Firewall Rule where Action='ALLOW' Lists all the NSX-T Firewall Rules which have their action set as ALLOW.
NSX-T Firewall Rule where Destination Security
Group = ‘CRM-Group’
Lists the firewall rules where the CRM-Group is the Destination Security Group. The results include both Direct Destination Security Groups and Indirect Destination Security Groups.
NSX-T Firewall Rule where Direct Destination
Security Group = ‘CRM-Group’
Lists the firewall rules where the CRM-Group is the Destination Security Group. The results include only the Direct Destination Security Groups.
VMs where NSX-T Logical Port = ‘App_Port-Id-1’ Lists all the VMs which have that particular NSX-T Logical Port.
NSX-T Transport Zone Lists the VLAN and the overlay transport zone and the respective details associated with it including the type of the transport node.
Note vRealize Network Insight does not support KVM as a data source.
NSX-T Router Lists the TIER 1 and TIER 0 routers. Click the router shown in the results to view more details associated with it including the NSX-T Edge Cluster and the HA mode.
NSX Policy Segment Lists all the NSX Policy Segments present in the instance of vRealize Network Insight.
NSX Policy Manager Lists all the NSX Policy Manages present in the instance of vRealize Network Insight.
NSX Policy Group Lists all the NSX Policy Groups present in the instance of vRealize Network Insight.
NSX Policy Firewall Lists all the NSX Policy Firewalls present in the instance of vRealize Network Insight.
NSX Policy Firewall Rule Lists all the NSX Policy Firewall Rules present in the instance of vRealize Network Insight.
NSX Policy Firewall Rule where Action = 'ALLOW' Lists all the NSX Policy Firewall Rules which have their action set as ALLOW.
NSX Policy Based VPN Lists all the NSX Policy Based VPNs present in the instance of vRealize Network Insight.
Note If NSX-T 2.4 and VMware Cloud on AWS are added as data sources in your vRealize Network Insight, then to get the NST-T entities, you must add SDDC type = ONPREM filter in your query. For example, NSX Policy Based VPN where Tier0 = ‘’ and SDDC Type = ‘ONPREM’.
Support for NSX-T MetricsThe following table displays the vRealize Network Insight entities that support the NSX-T metrics currently and the widgets that display these metrics on the corresponding entity dashboards.
Using vRealize Network Insight
VMware, Inc. 28
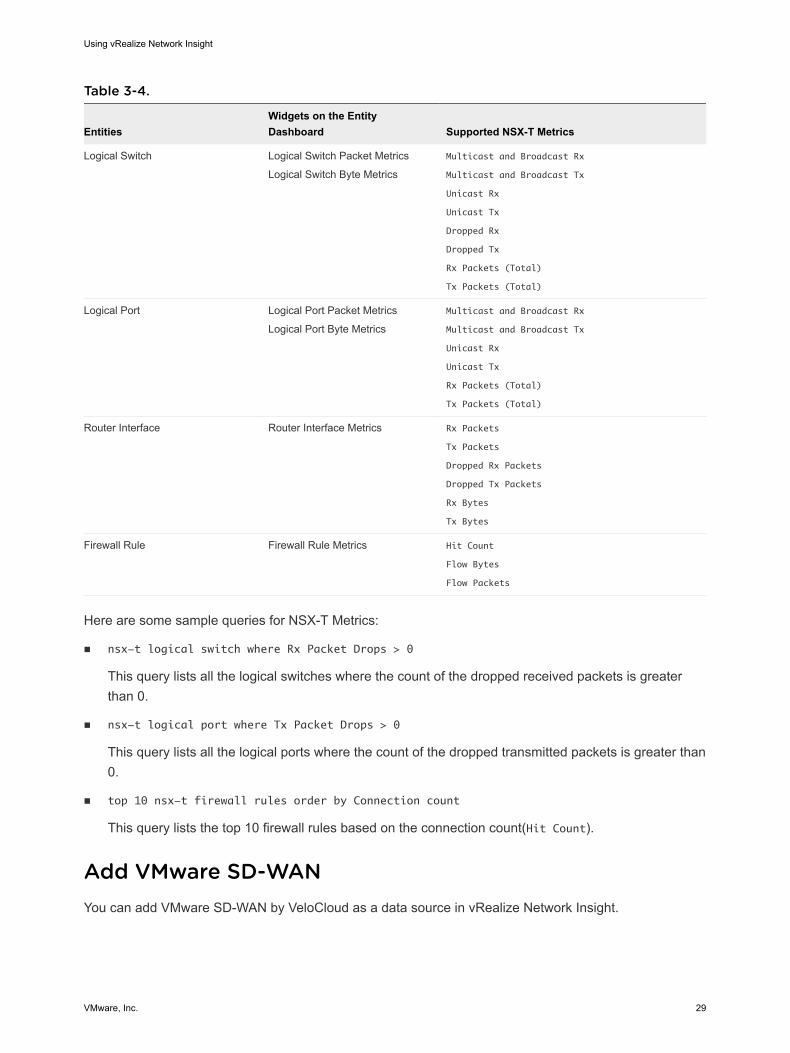
Table 3-4.
EntitiesWidgets on the Entity Dashboard Supported NSX-T Metrics
Logical Switch Logical Switch Packet Metrics
Logical Switch Byte Metrics
Multicast and Broadcast Rx
Multicast and Broadcast Tx
Unicast Rx
Unicast Tx
Dropped Rx
Dropped Tx
Rx Packets (Total)
Tx Packets (Total)
Logical Port Logical Port Packet Metrics
Logical Port Byte Metrics
Multicast and Broadcast Rx
Multicast and Broadcast Tx
Unicast Rx
Unicast Tx
Rx Packets (Total)
Tx Packets (Total)
Router Interface Router Interface Metrics Rx Packets
Tx Packets
Dropped Rx Packets
Dropped Tx Packets
Rx Bytes
Tx Bytes
Firewall Rule Firewall Rule Metrics Hit Count
Flow Bytes
Flow Packets
Here are some sample queries for NSX-T Metrics:
n nsx-t logical switch where Rx Packet Drops > 0
This query lists all the logical switches where the count of the dropped received packets is greater than 0.
n nsx-t logical port where Tx Packet Drops > 0
This query lists all the logical ports where the count of the dropped transmitted packets is greater than 0.
n top 10 nsx-t firewall rules order by Connection count
This query lists the top 10 firewall rules based on the connection count(Hit Count).
Add VMware SD-WANYou can add VMware SD-WAN by VeloCloud as a data source in vRealize Network Insight.
Using vRealize Network Insight
VMware, Inc. 29
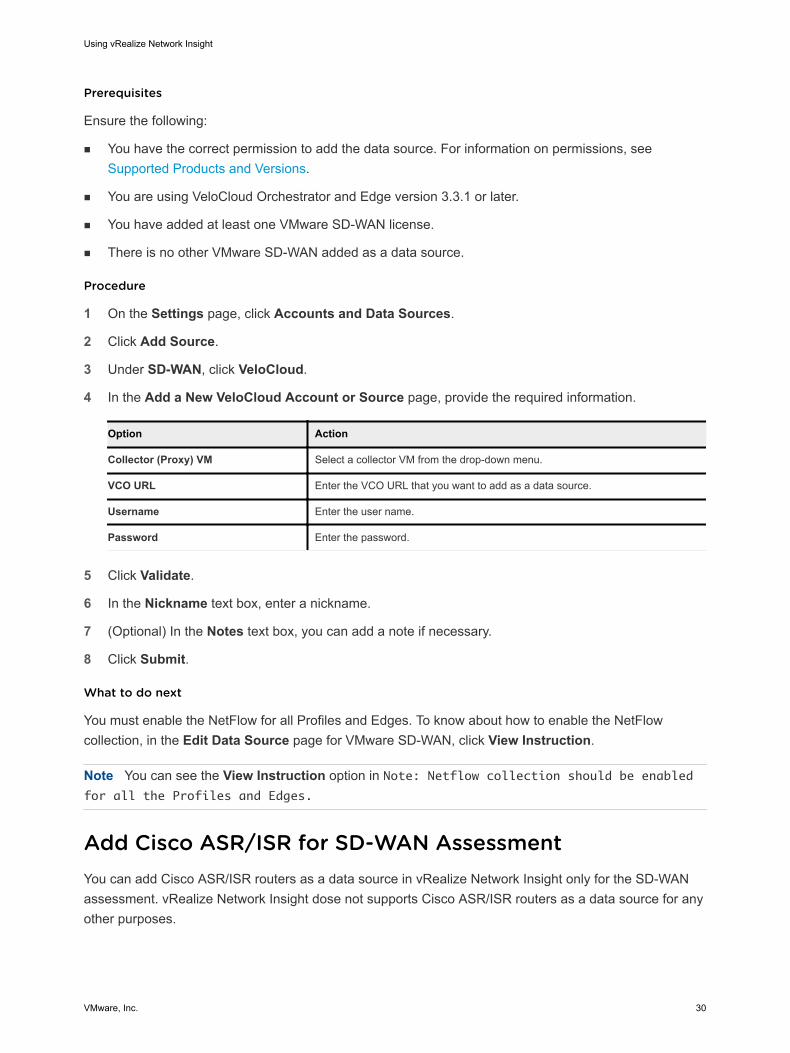
Prerequisites
Ensure the following:
n You have the correct permission to add the data source. For information on permissions, see Supported Products and Versions.
n You are using VeloCloud Orchestrator and Edge version 3.3.1 or later.
n You have added at least one VMware SD-WAN license.
n There is no other VMware SD-WAN added as a data source.
Procedure
1 On the Settings page, click Accounts and Data Sources.
2 Click Add Source.
3 Under SD-WAN, click VeloCloud.
4 In the Add a New VeloCloud Account or Source page, provide the required information.
Option Action
Collector (Proxy) VM Select a collector VM from the drop-down menu.
VCO URL Enter the VCO URL that you want to add as a data source.
Username Enter the user name.
Password Enter the password.
5 Click Validate.
6 In the Nickname text box, enter a nickname.
7 (Optional) In the Notes text box, you can add a note if necessary.
8 Click Submit.
What to do next
You must enable the NetFlow for all Profiles and Edges. To know about how to enable the NetFlow collection, in the Edit Data Source page for VMware SD-WAN, click View Instruction.
Note You can see the View Instruction option in Note: Netflow collection should be enabled for all the Profiles and Edges.
Add Cisco ASR/ISR for SD-WAN AssessmentYou can add Cisco ASR/ISR routers as a data source in vRealize Network Insight only for the SD-WAN assessment. vRealize Network Insight dose not supports Cisco ASR/ISR routers as a data source for any other purposes.
Using vRealize Network Insight
VMware, Inc. 30
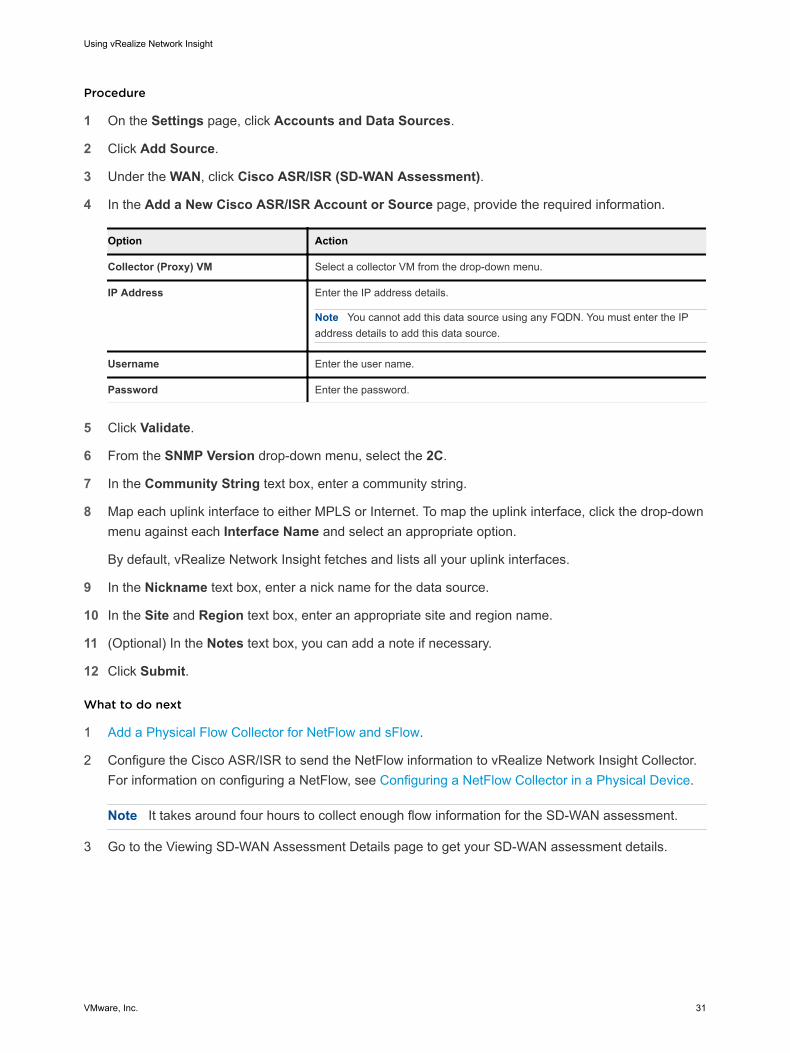
Procedure
1 On the Settings page, click Accounts and Data Sources.
2 Click Add Source.
3 Under the WAN, click Cisco ASR/ISR (SD-WAN Assessment).
4 In the Add a New Cisco ASR/ISR Account or Source page, provide the required information.
Option Action
Collector (Proxy) VM Select a collector VM from the drop-down menu.
IP Address Enter the IP address details.
Note You cannot add this data source using any FQDN. You must enter the IP address details to add this data source.
Username Enter the user name.
Password Enter the password.
5 Click Validate.
6 From the SNMP Version drop-down menu, select the 2C.
7 In the Community String text box, enter a community string.
8 Map each uplink interface to either MPLS or Internet. To map the uplink interface, click the drop-down menu against each Interface Name and select an appropriate option.
By default, vRealize Network Insight fetches and lists all your uplink interfaces.
9 In the Nickname text box, enter a nick name for the data source.
10 In the Site and Region text box, enter an appropriate site and region name.
11 (Optional) In the Notes text box, you can add a note if necessary.
12 Click Submit.
What to do next
1 Add a Physical Flow Collector for NetFlow and sFlow.
2 Configure the Cisco ASR/ISR to send the NetFlow information to vRealize Network Insight Collector. For information on configuring a NetFlow, see Configuring a NetFlow Collector in a Physical Device.
Note It takes around four hours to collect enough flow information for the SD-WAN assessment.
3 Go to the Viewing SD-WAN Assessment Details page to get your SD-WAN assessment details.
Using vRealize Network Insight
VMware, Inc. 31
Add VMware Cloud on AWSvRealize Network Insight supports VMware Cloud on AWS for the enterprise license users only. You can add VMware Cloud on AWS (vCenter) or VMware Cloud on AWS (NSX Policy Manager) as a data source.
Setting up vRealize Network Insight Collector for VMware Cloud on AWSYou must set up the vRealize Network Insight collector to collect data from VMware Cloud on AWS.
Prerequisites
Deploy a vRealize Network Insight collector within every SDDC that needs to be added as a data source.
Note n Using a vRealize Network Insight collector deployed in one VMware Cloud on AWS SDDC to collect
data from another VMware Cloud on AWS SDDC is not supported.
n You must deploy the vRealize Network Insight collector on a native VMware Cloud on AWS segment. Deploying a collector on extended segments is not supported.
Procedure
1 Log in to vRealize Network Insight.
2 Navigate to Settings > Install and Support > Add Collector VM.
3 Copy the contents of the shared secret.
You will require this during the deployment of vRealize Network Insight Collector OVA.
4 Deploy the vRealize Network Insight Collector OVA in the Compute Resource Pool of the VMware Cloud on AWS vCenter.
Use the shared secret that you have generated.
5 Change the CPU resource reservation of the collector OVA to 1251 MHz.
6 Start the collector VM and follow the wizard to pair the collector with the vRealize Network Insight platform.
7 Validate that the collector pairs successfully with the platform.
Creating VMware Cloud on AWS firewall rules for vRealize Network InsightYou must create VMware Cloud on AWS groups and firewall rules to build communication with vRealize Network Insight.
Using vRealize Network Insight
VMware, Inc. 32
Prerequisitesn Deploy vRealize Network Insight platform and collector (for on-premise) or get the valid subscription
(for cloud service).
n You must have required privileges. See Supported Products and Versions.
n Deploy a VMware Cloud on AWS software-defined data center (SDDC) 1.8 and later with NSX-T networking.
n Configure Firewall Rules for communication between vRealize Network Insight platform and collector.
n For the port requirements of incoming traffic, see the Ports for the Collector Server table on the System Ports page.
n Open the HTTPS port 443 for outgoing traffic to the following domains:
n *.vmwareidentity.com
n gaz.csp-vidm-prod.com
n *.vmware.com
n *.ni-onsaas.com
Configure Firewall Rules for communication between vRealize Network Insight platform and collectorConfiguring firewall rules in VMware Cloud on AWS includes:
n Creating a VMware Cloud on AWS group for vRealize Network Insight collector.
a Log in to VMware Cloud on AWS at https://vmc.vmware.com.
b On the Networking & Security tab, click Inventory > Groups.
c On the Groups card, click COMPUTE GROUPS, then click ADD GROUP and give the group a Name and an optional Description.
d Click Set Members to open the Select Members page.
e Provide the vRealize Network Insight collector VM details.
You use this group in the firewall rules that you create later to allow communication between VMware Cloud on AWS NSX Manager and vRealize Network Insight.
n Create a firewall rule.
a Log in to the VMC Console at https://vmc.vmware.com.
b On the Networking & Security tab, click Gateway Firewall.
c On the Gateway Firewall card, click Compute Gateway, then click ADD RULE and give the new rule a Name.
d Enter the parameters for the new rule.
n Sources: Enter the name of the VMware Cloud on AWS group containing the vRealize Network Insight collector IP address.
Using vRealize Network Insight
VMware, Inc. 33
n Destinations: Select Any.
n Services: Select HTTPS, DNS, DNS-UDP, NTP, ICMP.
n Action: Select Allow.
n Applied To: Select Internet Interface.
n Logging: Enable logging if required. Else this field is unchanged.
The new rule is enabled by default. Slide the toggle to the left to disable it.
e Click Publish.
Configure Firewall Rules for communication between collector and NSX Manager, and collector and vCenter1 Log in to the VMC Console at https://vmc.vmware.com.
2 On the Networking & Security tab, click Gateway Firewall.
3 On the Gateway Firewall card, click Management Gateway, then click ADD RULE and give the new rule a Name.
4 Enter the parameters for the new rule.
n Sources: Enter the name of the VMware Cloud on AWS group containing the vRealize Network Insight collector IP address.
n Destinations: Select System Defined Groups, search for NSX Manager, and then select the NSX Manager entry.
n Services: Select HTTPS (443).
n Action: Select Allow.
n Logging: Enable logging if required.
The new rule is enabled, by default. Slide the toggle to disable it.
5 Click Publish.
6 Perform the same steps to configure a rule for the vCenter Server.
Note Ensure to select the vCenter for the Destinations field in Step 4.
Add a VMware Cloud on AWS vCenterYou can add VMware Cloud on AWS - vCenter as a data source.
Prerequisites
n Obtain the credentials to add VMware Cloud on AWS - vCenter as a data source
a Log in to your VMWare Cloud Services console.
b Click VMware Cloud on AWS under My Services.
Using vRealize Network Insight
VMware, Inc. 34
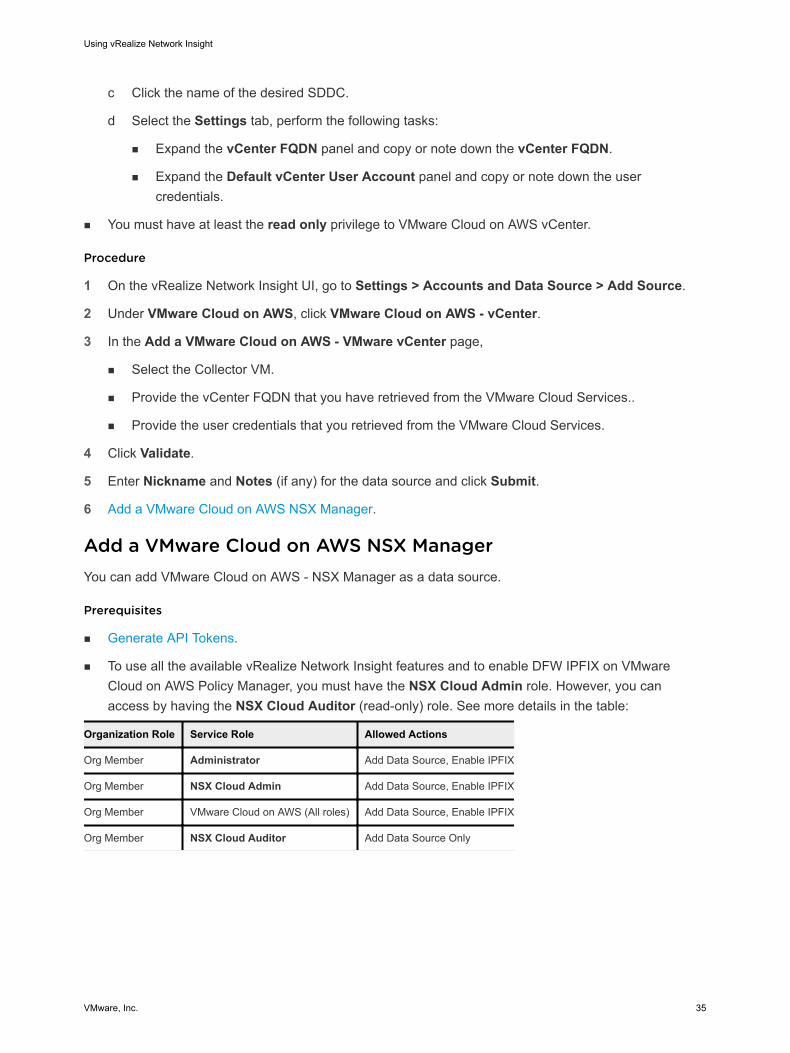
c Click the name of the desired SDDC.
d Select the Settings tab, perform the following tasks:
n Expand the vCenter FQDN panel and copy or note down the vCenter FQDN.
n Expand the Default vCenter User Account panel and copy or note down the user credentials.
n You must have at least the read only privilege to VMware Cloud on AWS vCenter.
Procedure
1 On the vRealize Network Insight UI, go to Settings > Accounts and Data Source > Add Source.
2 Under VMware Cloud on AWS, click VMware Cloud on AWS - vCenter.
3 In the Add a VMware Cloud on AWS - VMware vCenter page,
n Select the Collector VM.
n Provide the vCenter FQDN that you have retrieved from the VMware Cloud Services..
n Provide the user credentials that you retrieved from the VMware Cloud Services.
4 Click Validate.
5 Enter Nickname and Notes (if any) for the data source and click Submit.
6 Add a VMware Cloud on AWS NSX Manager.
Add a VMware Cloud on AWS NSX ManagerYou can add VMware Cloud on AWS - NSX Manager as a data source.
Prerequisites
n Generate API Tokens.
n To use all the available vRealize Network Insight features and to enable DFW IPFIX on VMware Cloud on AWS Policy Manager, you must have the NSX Cloud Admin role. However, you can access by having the NSX Cloud Auditor (read-only) role. See more details in the table:
Organization Role Service Role Allowed Actions
Org Member Administrator Add Data Source, Enable IPFIX
Org Member NSX Cloud Admin Add Data Source, Enable IPFIX
Org Member VMware Cloud on AWS (All roles) Add Data Source, Enable IPFIX
Org Member NSX Cloud Auditor Add Data Source Only
Using vRealize Network Insight
VMware, Inc. 35
Procedure
1 Perform one of the following:
n If you have not added VMware Cloud on AWS - vCenter,
a Add a VMware Cloud on AWS vCenter.
b Click Add NSX Manager.
n If you have already added VMware Cloud on AWS - vCenter,
a Click Settings > Accounts and Data Source > Add Source.
b Under VMware Cloud on AWS, click VMware Cloud on AWS - NSX Manager.
2 In the Add a new VMC NSX Manager Account page,
n Select the corresponding vCenter.
The collector is automatically selected based on the selection of the vCenter. VMware Cloud on AWS. You must add the NSX Manager to the same collector VM as that of the corresponding vCenter.
n Provide the IP address and the API token that you have generated.
The IP of the NSX Manager would be available in the Support tab of the VMware Cloud on AWS SDDC.
3 Click Validate.
4 If you want to collect IPFIX flows for DFW, select Enable DFW IPFIX.
Note The error messages pop up in the following scenarios:
n You do not have the NSX Cloud Admin privilege.
n You have already added four collectors to the DFW IPFIX collector profile. See also Unable to Enable DFW IPFIX.
5 Enter Nickname and Notes (if any) for the data source and click Submit.
Add Amazon Web ServicesYou can add Amazon Web Services (AWS) as a data source in vRealize Network Insight .
You can add the following two types of AWS accounts as a data source.
n Master and Linked AWS Accounts
n Standard AWS Account
Master and Linked AWS AccountsThe Master AWS Account also known as Organization Account or Payer Account has the organization level access to discover and list all Linked AWS accounts in your organization through API calls.
Using vRealize Network Insight
VMware, Inc. 36
All the AWS accounts in your organization that are added to the Master Account are known as Linked Accounts. For more information, see ListAccount .
The Master AWS Account must assume a role over the Linked AWS accounts to access and control the resources of the Linked AWS account . All the Linked AWS Account must trust the Master AWS Account through a Role ARN. For more information about roles, see AssumeRole.
When you add a Master AWS Account as a data source, all the Linked AWS Accounts are added as a data source automatically.
Standard AWS AccountA Standard AWS Account doesn’t have Master and Linked relationship .
Add a Master AWS Data SourceWith Master AWS Account, you can automatically add all the Linked AWS Accounts in your organization in the vRealize Network Insight. .
Prerequisites
n Configure the organization firewall for AWS API access. See Firewall Configuration for AWS API Access.
n Create a master account policy for the Master AWS Account and a linked account policy for all the Linked AWS Accounts. See Create a Master and Linked Account Policy. .
n In all the Linked AWS Accounts, add a role to trust the Master AWS Account that you want to add in vRealize Network Insight and attach the linked account policy. See Create a Role in AWS.
n Create a user in the Master AWS Account. See Create a User in AWS Account.
Procedure
1 Log in to vRealize Network Insight.
2 Go to Settings > Accounts and Data Sources > Add Source.
3 Under the Public Clouds section, click Amazon Web Services .
4 Select the Collector (Proxy) VM.
5 Enter your Amazon Access Key ID and corresponding Secret Access Key.
Note Your Amazon Access Key ID is a 20-digit string with a corresponding Secret Access Key that you create in the AWS console. For more details, see http://docs.aws.amazon.com/general/latest/gr/managing-aws-access-keys.html .
This process takes around 15–20 minutes for adding and displaying your account data .
Using vRealize Network Insight
VMware, Inc. 37
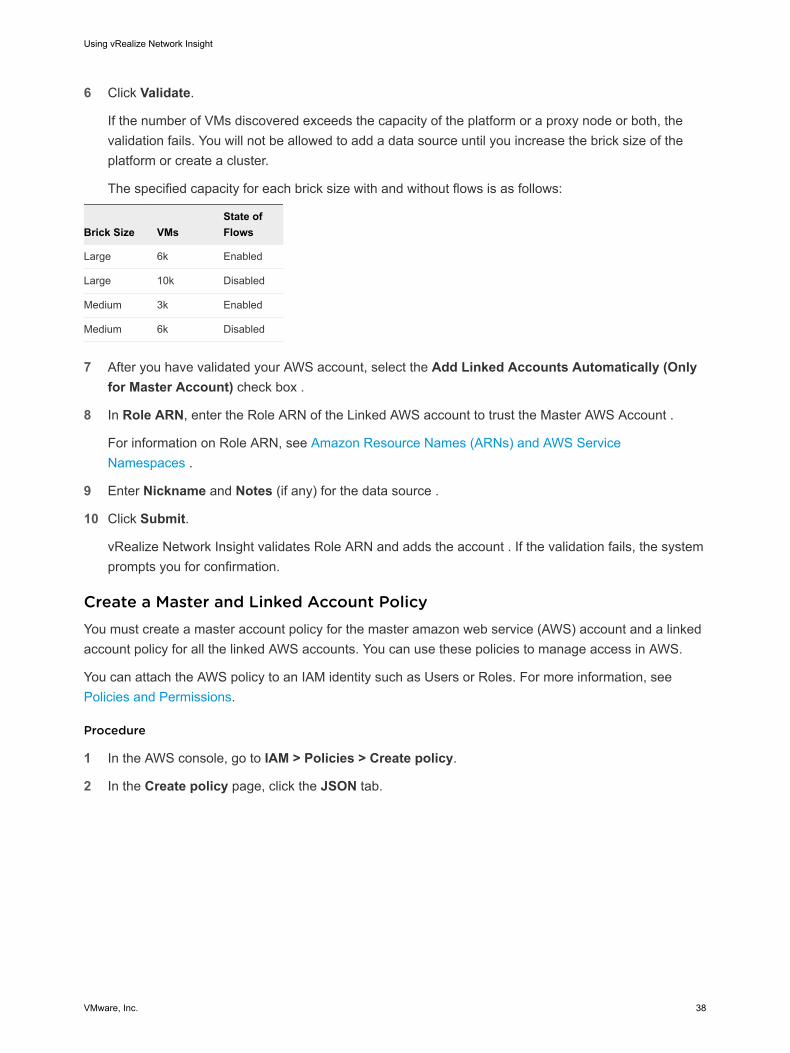
6 Click Validate.
If the number of VMs discovered exceeds the capacity of the platform or a proxy node or both, the validation fails. You will not be allowed to add a data source until you increase the brick size of the platform or create a cluster.
The specified capacity for each brick size with and without flows is as follows:
Brick Size VMsState of Flows
Large 6k Enabled
Large 10k Disabled
Medium 3k Enabled
Medium 6k Disabled
7 After you have validated your AWS account, select the Add Linked Accounts Automatically (Only for Master Account) check box .
8 In Role ARN, enter the Role ARN of the Linked AWS account to trust the Master AWS Account .
For information on Role ARN, see Amazon Resource Names (ARNs) and AWS Service Namespaces .
9 Enter Nickname and Notes (if any) for the data source .
10 Click Submit.
vRealize Network Insight validates Role ARN and adds the account . If the validation fails, the system prompts you for confirmation.
Create a Master and Linked Account PolicyYou must create a master account policy for the master amazon web service (AWS) account and a linked account policy for all the linked AWS accounts. You can use these policies to manage access in AWS.
You can attach the AWS policy to an IAM identity such as Users or Roles. For more information, see Policies and Permissions.
Procedure
1 In the AWS console, go to IAM > Policies > Create policy.
2 In the Create policy page, click the JSON tab.
Using vRealize Network Insight
VMware, Inc. 38
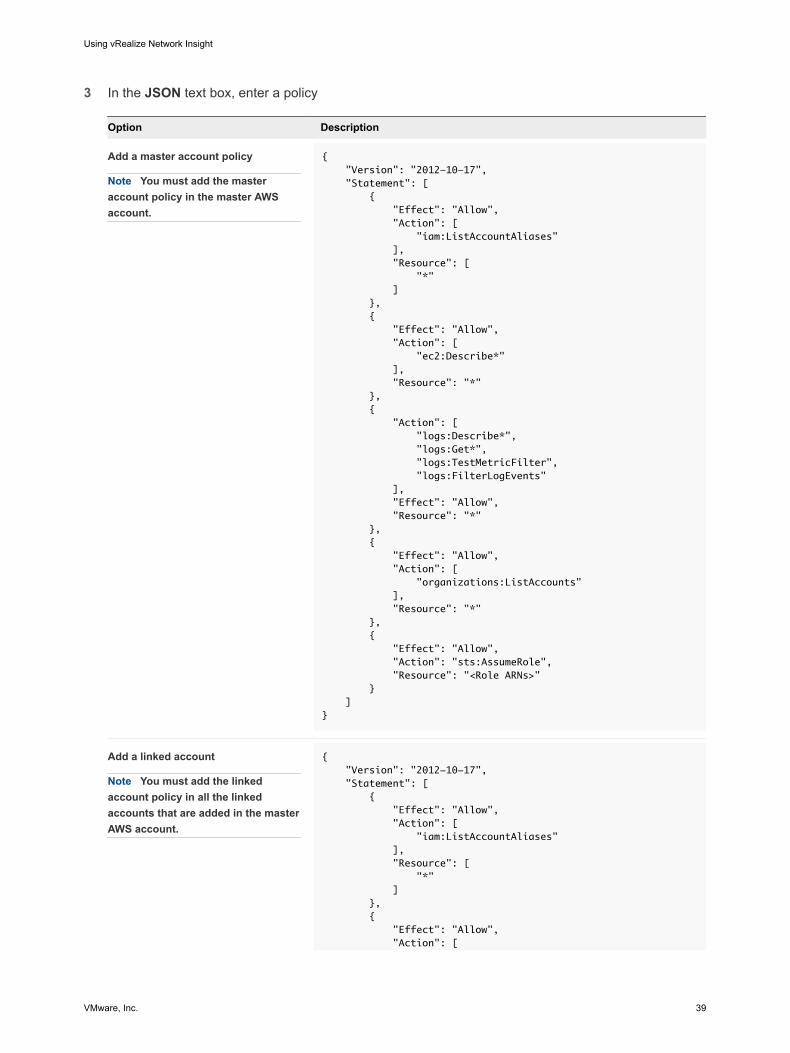
3 In the JSON text box, enter a policy
Option Description
Add a master account policy
Note You must add the master account policy in the master AWS account.
{ "Version": "2012-10-17", "Statement": [ { "Effect": "Allow", "Action": [ "iam:ListAccountAliases" ], "Resource": [ "*" ] }, { "Effect": "Allow", "Action": [ "ec2:Describe*" ], "Resource": "*" }, { "Action": [ "logs:Describe*", "logs:Get*", "logs:TestMetricFilter", "logs:FilterLogEvents" ], "Effect": "Allow", "Resource": "*" }, { "Effect": "Allow", "Action": [ "organizations:ListAccounts" ], "Resource": "*" }, { "Effect": "Allow", "Action": "sts:AssumeRole", "Resource": "<Role ARNs>" } ]}
Add a linked account
Note You must add the linked account policy in all the linked accounts that are added in the master AWS account.
{ "Version": "2012-10-17", "Statement": [ { "Effect": "Allow", "Action": [ "iam:ListAccountAliases" ], "Resource": [ "*" ] }, { "Effect": "Allow", "Action": [
Using vRealize Network Insight
VMware, Inc. 39
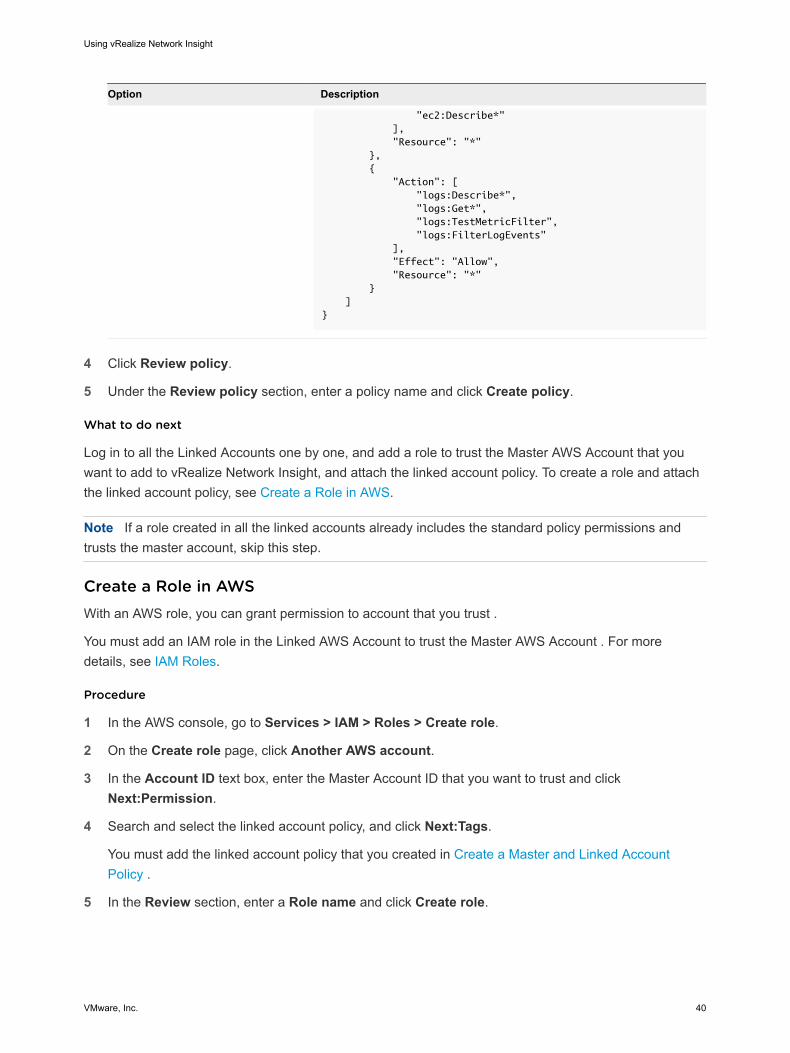
Option Description
"ec2:Describe*" ], "Resource": "*" }, { "Action": [ "logs:Describe*", "logs:Get*", "logs:TestMetricFilter", "logs:FilterLogEvents" ], "Effect": "Allow", "Resource": "*" } ]}
4 Click Review policy.
5 Under the Review policy section, enter a policy name and click Create policy.
What to do next
Log in to all the Linked Accounts one by one, and add a role to trust the Master AWS Account that you want to add to vRealize Network Insight, and attach the linked account policy. To create a role and attach the linked account policy, see Create a Role in AWS.
Note If a role created in all the linked accounts already includes the standard policy permissions and trusts the master account, skip this step.
Create a Role in AWSWith an AWS role, you can grant permission to account that you trust .
You must add an IAM role in the Linked AWS Account to trust the Master AWS Account . For more details, see IAM Roles.
Procedure
1 In the AWS console, go to Services > IAM > Roles > Create role.
2 On the Create role page, click Another AWS account.
3 In the Account ID text box, enter the Master Account ID that you want to trust and click Next:Permission.
4 Search and select the linked account policy, and click Next:Tags.
You must add the linked account policy that you created in Create a Master and Linked Account Policy .
5 In the Review section, enter a Role name and click Create role.
Using vRealize Network Insight
VMware, Inc. 40
What to do next
Create a User in AWS Account.
Create a User in AWS AccountYou must create a user in the AWS Account to get the Amazon Access Key ID and the corresponding Secret Access Key. You can use the Amazon Access Key ID and the corresponding Secret Access Key to add the AWS Account in vRealize Network Insight as a data source.
Procedure
1 Log in to the AWS console.
2 Go to Services > IAM > Users > Add user.
3 On the Add user page, enter a User name, select the Programmatic access check box, and click Next Permission.
4 Under the Set Permission group, click Attached existing policies directly, and then search and select an account policy that you created previously .
n For a Master AWS Account, select the master account policy.
n For a Standard AWS Account, select the standard account policy.
5 Click Next Tags > Next:Review.
6 Review and click Create user .
Note down the Access key ID and Secret access key .
What to do next
n To add a Master AWS Account, log in to vRealize Network Insight and add a Master AWS Account. See, Add a Master AWS Data Source.
n To add a Standard AWS Account, log in to vRealize Network Insight and add a Standard AWS Account. See, Add a Standard AWS Data Source.
Firewall Configuration for AWS API AccessThe collector VM requires a list of URLs to gain access to the AWS.
n The AWS can be deployed in multiple regions. There are separate URLs associated with different regions. If you are unaware of the region or the service, have a wildcard entry for the URL such as *.amazonaws.com.
Note The wildcard entry does not work for the China region.
If you want to give fine-grained access to separate URLs, there are 4 services based on the region:
n Regions except GovCloud and China
n ec2.<REGION>.amazonaws.com
Using vRealize Network Insight
VMware, Inc. 41
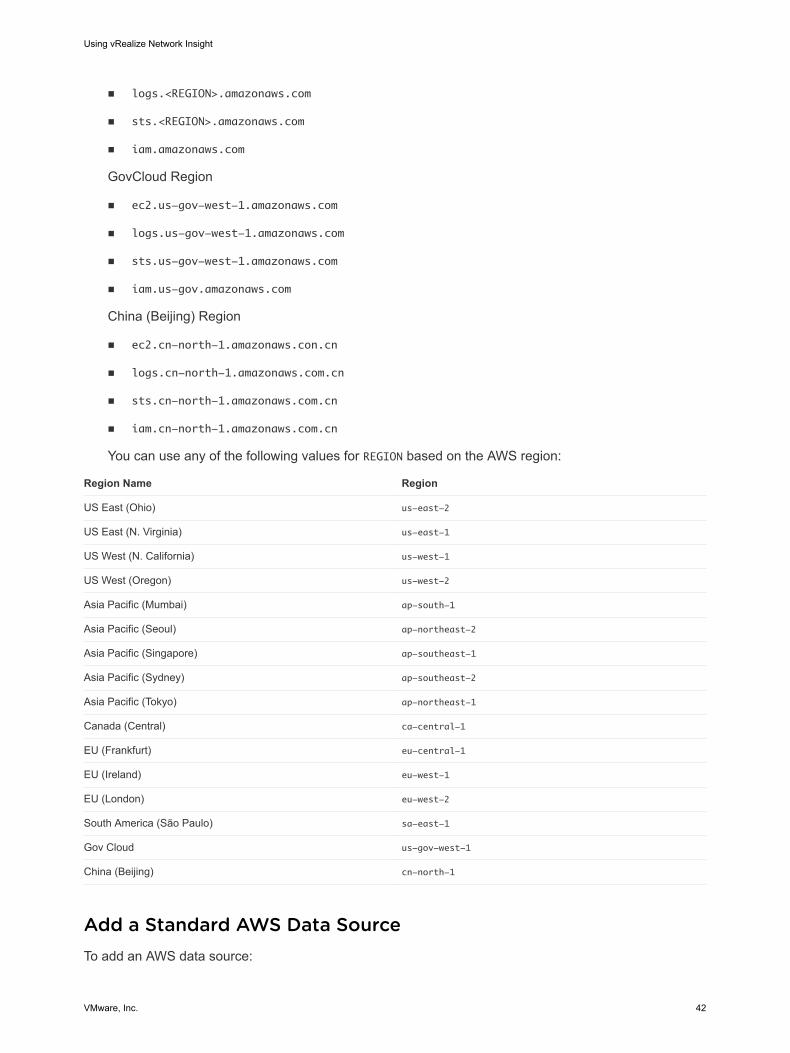
n logs.<REGION>.amazonaws.com
n sts.<REGION>.amazonaws.com
n iam.amazonaws.com
GovCloud Region
n ec2.us-gov-west-1.amazonaws.com
n logs.us-gov-west-1.amazonaws.com
n sts.us-gov-west-1.amazonaws.com
n iam.us-gov.amazonaws.com
China (Beijing) Region
n ec2.cn-north-1.amazonaws.con.cn
n logs.cn-north-1.amazonaws.com.cn
n sts.cn-north-1.amazonaws.com.cn
n iam.cn-north-1.amazonaws.com.cn
You can use any of the following values for REGION based on the AWS region:
Region Name Region
US East (Ohio) us-east-2
US East (N. Virginia) us-east-1
US West (N. California) us-west-1
US West (Oregon) us-west-2
Asia Pacific (Mumbai) ap-south-1
Asia Pacific (Seoul) ap-northeast-2
Asia Pacific (Singapore) ap-southeast-1
Asia Pacific (Sydney) ap-southeast-2
Asia Pacific (Tokyo) ap-northeast-1
Canada (Central) ca-central-1
EU (Frankfurt) eu-central-1
EU (Ireland) eu-west-1
EU (London) eu-west-2
South America (São Paulo) sa-east-1
Gov Cloud us-gov-west-1
China (Beijing) cn-north-1
Add a Standard AWS Data SourceTo add an AWS data source:
Using vRealize Network Insight
VMware, Inc. 42
Prerequisites
n Configure the organization firewall for AWS API access. See Firewall Configuration for AWS API Access.
n Create a standard account policy for the AWS account that you want to add in vRealize Network Insight. To create a policy, see Create a Standard Account Policy.
n Create a user in the Standard AWS Account. To create a user in AWS, see Create a User in AWS Account.
Procedure
1 Go to Settings > Accounts and Data Sources > Add Source.
2 Under Public Clouds, click Amazon Web Services.
3 Select the Collector (Proxy) VM.
4 Enter your Amazon Access Key ID and corresponding Secret Access Key.
Note Your Amazon Access Key ID is a 20-digit string with a corresponding Secret Access Key. For more details, see http://docs.aws.amazon.com/general/latest/gr/managing-aws-access-keys.html.
Note To add AWS Gov Cloud Region as a data source, create an AWS IAM user by using the recommended policy in the AWS account with access to the Gov Cloud region. Use the Access key and the Secret key for the newly created account to add the data source to vRealize Network Insight.
This process takes around 15–20 minutes for adding and displaying your account data.
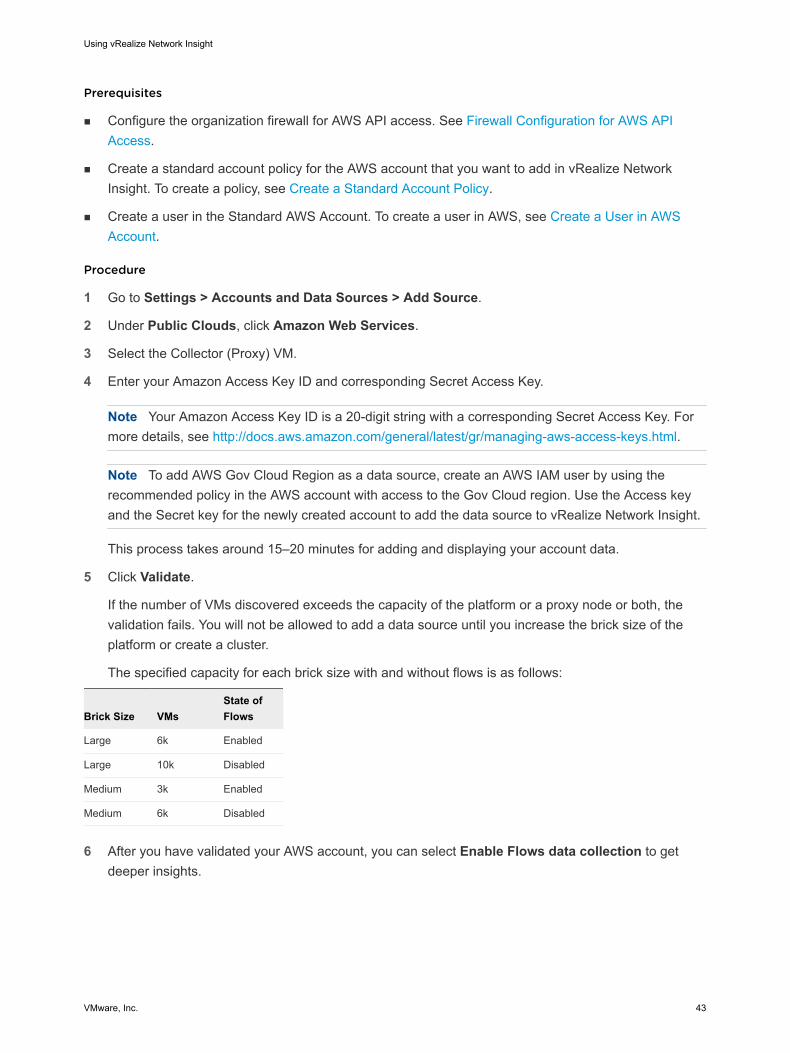
5 Click Validate.
If the number of VMs discovered exceeds the capacity of the platform or a proxy node or both, the validation fails. You will not be allowed to add a data source until you increase the brick size of the platform or create a cluster.
The specified capacity for each brick size with and without flows is as follows:
Brick Size VMsState of Flows
Large 6k Enabled
Large 10k Disabled
Medium 3k Enabled
Medium 6k Disabled
6 After you have validated your AWS account, you can select Enable Flows data collection to get deeper insights.
Using vRealize Network Insight
VMware, Inc. 43
Create a User in AWS AccountYou must create a user in the AWS Account to get the Amazon Access Key ID and the corresponding Secret Access Key. You can use the Amazon Access Key ID and the corresponding Secret Access Key to add the AWS Account in vRealize Network Insight as a data source.
Procedure
1 Log in to the AWS console.
2 Go to Services > IAM > Users > Add user.
3 On the Add user page, enter a User name, select the Programmatic access check box, and click Next Permission.
4 Under the Set Permission group, click Attached existing policies directly, and then search and select an account policy that you created previously .
n For a Master AWS Account, select the master account policy.
n For a Standard AWS Account, select the standard account policy.
5 Click Next Tags > Next:Review.
6 Review and click Create user .
Note down the Access key ID and Secret access key .
What to do next
n To add a Master AWS Account, log in to vRealize Network Insight and add a Master AWS Account. See, Add a Master AWS Data Source.
n To add a Standard AWS Account, log in to vRealize Network Insight and add a Standard AWS Account. See, Add a Standard AWS Data Source.
Create a Standard Account PolicyYou must create a standard account policy for the Standards AWS Accounts. With this policy, you can manage access in AWS.
You can attach the AWS policy to an IAM identity such as Users or Roles. For more information, see Policies and Permissions.
Procedure
1 In the AWS console, go to IAM > Policies > Create policy.
2 In the Create policy page, click the JSON tab.
Using vRealize Network Insight
VMware, Inc. 44
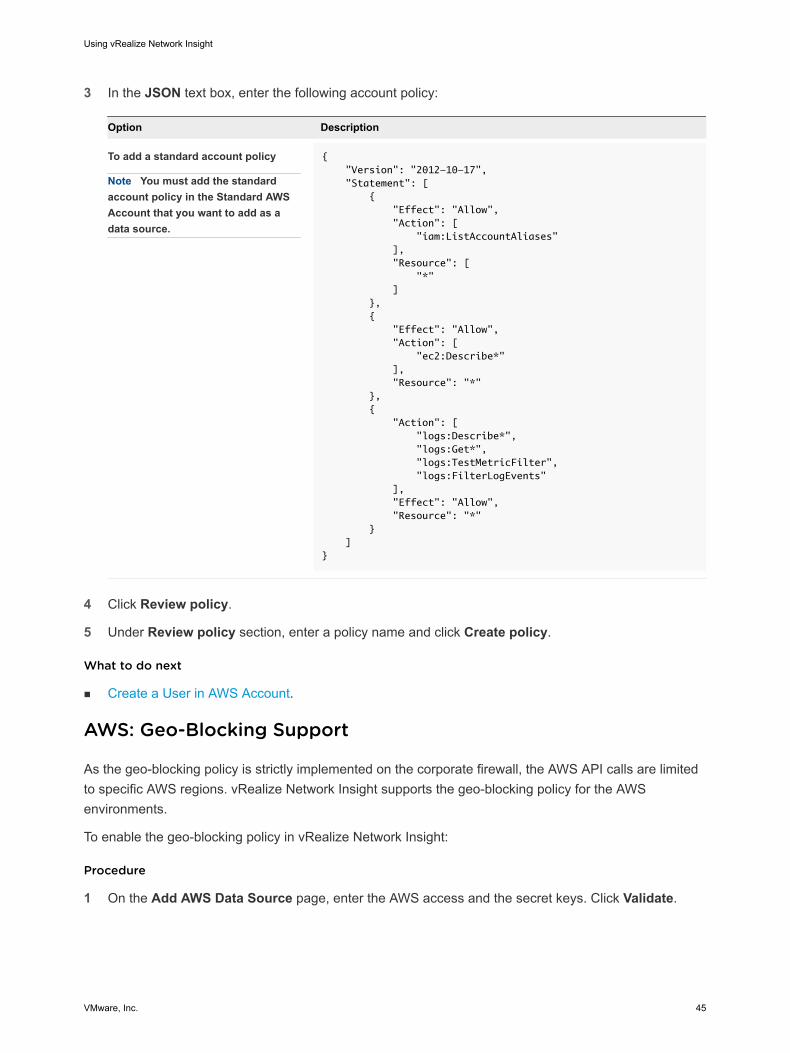
3 In the JSON text box, enter the following account policy:
Option Description
To add a standard account policy
Note You must add the standard account policy in the Standard AWS Account that you want to add as a data source.
{ "Version": "2012-10-17", "Statement": [ { "Effect": "Allow", "Action": [ "iam:ListAccountAliases" ], "Resource": [ "*" ] }, { "Effect": "Allow", "Action": [ "ec2:Describe*" ], "Resource": "*" }, { "Action": [ "logs:Describe*", "logs:Get*", "logs:TestMetricFilter", "logs:FilterLogEvents" ], "Effect": "Allow", "Resource": "*" } ]}
4 Click Review policy.
5 Under Review policy section, enter a policy name and click Create policy.
What to do next
n Create a User in AWS Account.
AWS: Geo-Blocking Support
As the geo-blocking policy is strictly implemented on the corporate firewall, the AWS API calls are limited to specific AWS regions. vRealize Network Insight supports the geo-blocking policy for the AWS environments.
To enable the geo-blocking policy in vRealize Network Insight:
Procedure
1 On the Add AWS Data Source page, enter the AWS access and the secret keys. Click Validate.
Using vRealize Network Insight
VMware, Inc. 45
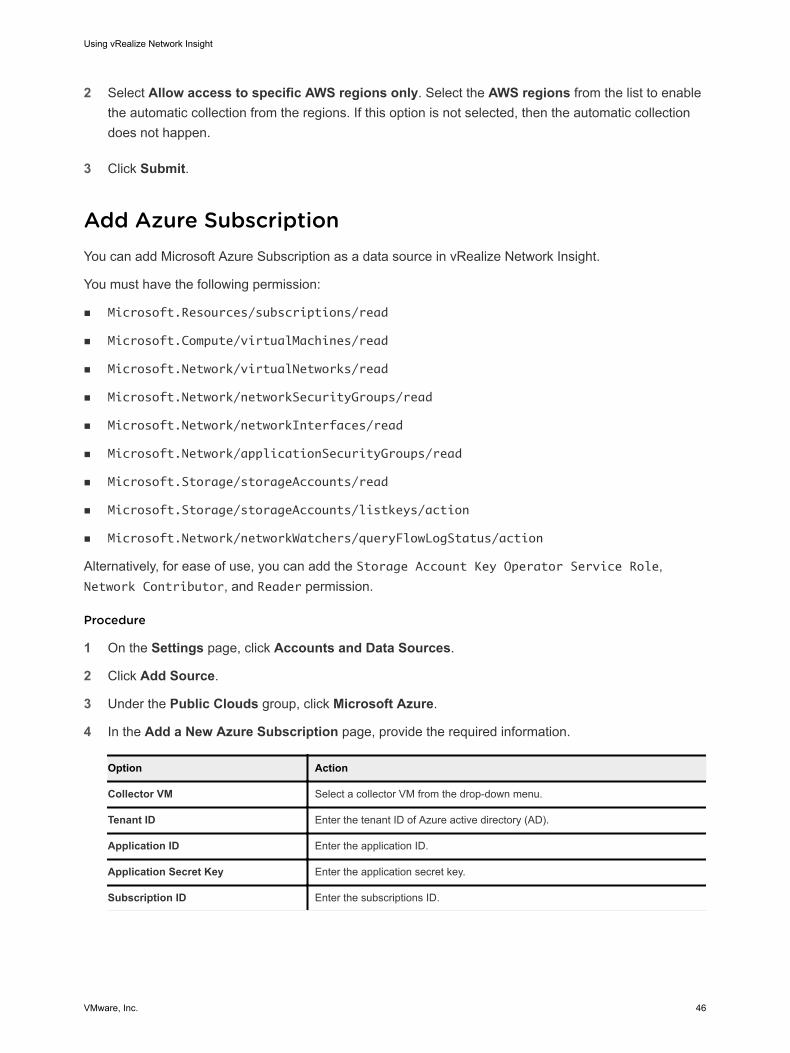
2 Select Allow access to specific AWS regions only. Select the AWS regions from the list to enable the automatic collection from the regions. If this option is not selected, then the automatic collection does not happen.
3 Click Submit.
Add Azure SubscriptionYou can add Microsoft Azure Subscription as a data source in vRealize Network Insight.
You must have the following permission:
n Microsoft.Resources/subscriptions/read
n Microsoft.Compute/virtualMachines/read
n Microsoft.Network/virtualNetworks/read
n Microsoft.Network/networkSecurityGroups/read
n Microsoft.Network/networkInterfaces/read
n Microsoft.Network/applicationSecurityGroups/read
n Microsoft.Storage/storageAccounts/read
n Microsoft.Storage/storageAccounts/listkeys/action
n Microsoft.Network/networkWatchers/queryFlowLogStatus/action
Alternatively, for ease of use, you can add the Storage Account Key Operator Service Role, Network Contributor, and Reader permission.
Procedure
1 On the Settings page, click Accounts and Data Sources.
2 Click Add Source.
3 Under the Public Clouds group, click Microsoft Azure.
4 In the Add a New Azure Subscription page, provide the required information.
Option Action
Collector VM Select a collector VM from the drop-down menu.
Tenant ID Enter the tenant ID of Azure active directory (AD).
Application ID Enter the application ID.
Application Secret Key Enter the application secret key.
Subscription ID Enter the subscriptions ID.
Using vRealize Network Insight
VMware, Inc. 46
5 Click Validate.
You must have at least one VM, network security group (NSG), NIC, and VNet for a successful validation.
6 (Optional) If you want to collect the NSG flow logs to get details insight on flows, then select Enable NSG flow data collection check box.
7 In the Nickname text box, enter a nickname.
8 (Optional) In the Notes text box, you can add a note if necessary.
9 Click Submit.
Enable NSG Flow LogTo enable the Network Security Group (NSG) flow data collection in vRealize Network Insight, you must enable the NSG flow log in your Azure environment.
The procedure and task related to Azure are documented in https://docs.microsoft.com/en-us/azure/network-watcher/.
Prerequisites
Verify that you have the correct permission. For information on permissions, see Supported Products and Versions.
Procedure
1 Enable network watcher in your Azure environment. For more information, see tutorials on Log VM network traffic in Azure Network Watcher Documentation.
2 Register insights provider in your Azure environment. For more information, see tutorials on Log VM network traffic in Azure Network Watcher Documentation.
3 Enable NSG flow log in your Azure environment. For more information, see tutorials on Log VM network traffic in Azure Network Watcher Documentation.
4 In the Microsoft Azure portal, Click Storage Account > Blob.
5 Select the container in which you are storing the flow logs, then click Change access level and select Container (anonymous read access for container and blobs).
You must do this step for all the container in which you are storing the flow logs.
Add VMware PKSYou can add VMware PKS as a data source and fetch your PKS cluster details in vRealize Network Insight.
Prerequisites
You must add the corresponding NSX-T Manager.
Using vRealize Network Insight
VMware, Inc. 47
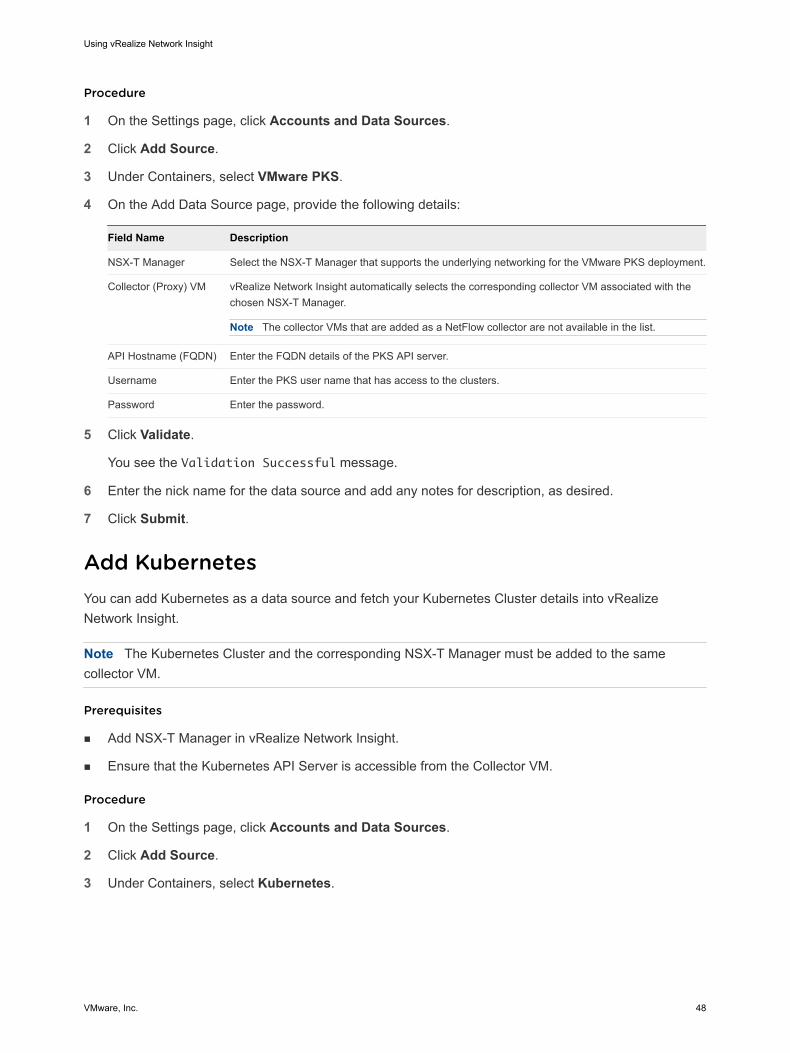
Procedure
1 On the Settings page, click Accounts and Data Sources.
2 Click Add Source.
3 Under Containers, select VMware PKS.
4 On the Add Data Source page, provide the following details:
Field Name Description
NSX-T Manager Select the NSX-T Manager that supports the underlying networking for the VMware PKS deployment.
Collector (Proxy) VM vRealize Network Insight automatically selects the corresponding collector VM associated with the chosen NSX-T Manager.
Note The collector VMs that are added as a NetFlow collector are not available in the list.
API Hostname (FQDN) Enter the FQDN details of the PKS API server.
Username Enter the PKS user name that has access to the clusters.
Password Enter the password.
5 Click Validate.
You see the Validation Successful message.
6 Enter the nick name for the data source and add any notes for description, as desired.
7 Click Submit.
Add KubernetesYou can add Kubernetes as a data source and fetch your Kubernetes Cluster details into vRealize Network Insight.
Note The Kubernetes Cluster and the corresponding NSX-T Manager must be added to the same collector VM.
Prerequisites
n Add NSX-T Manager in vRealize Network Insight.
n Ensure that the Kubernetes API Server is accessible from the Collector VM.
Procedure
1 On the Settings page, click Accounts and Data Sources.
2 Click Add Source.
3 Under Containers, select Kubernetes.
Using vRealize Network Insight
VMware, Inc. 48
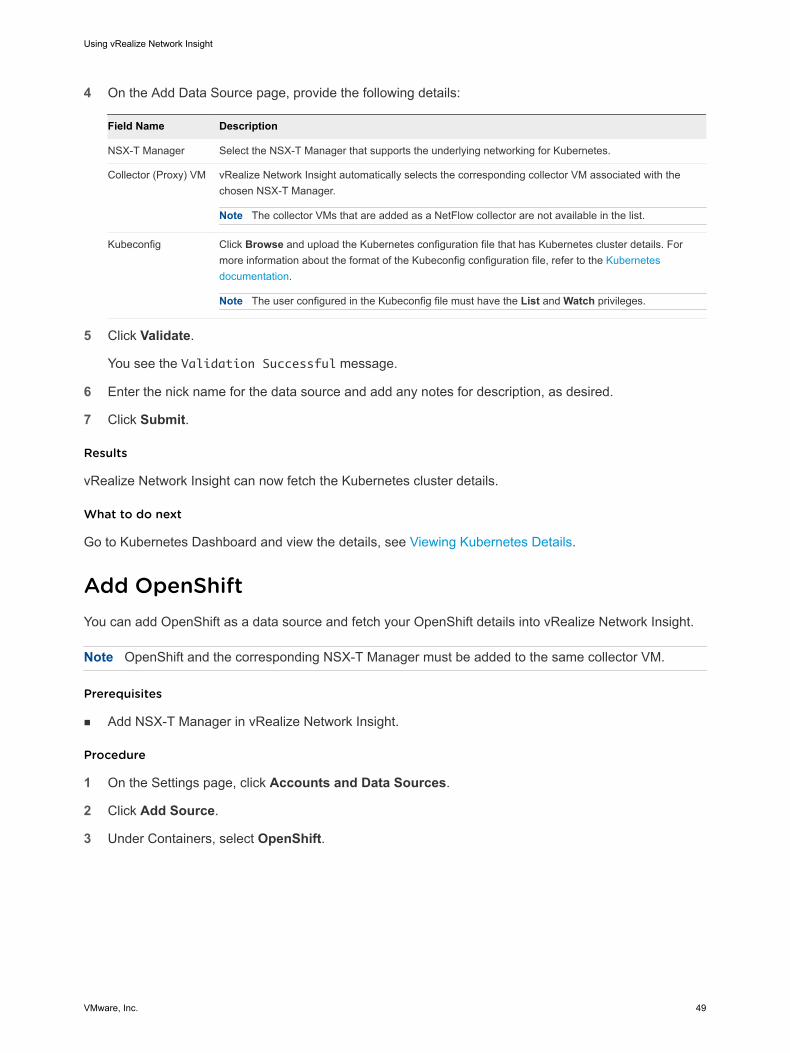
4 On the Add Data Source page, provide the following details:
Field Name Description
NSX-T Manager Select the NSX-T Manager that supports the underlying networking for Kubernetes.
Collector (Proxy) VM vRealize Network Insight automatically selects the corresponding collector VM associated with the chosen NSX-T Manager.
Note The collector VMs that are added as a NetFlow collector are not available in the list.
Kubeconfig Click Browse and upload the Kubernetes configuration file that has Kubernetes cluster details. For more information about the format of the Kubeconfig configuration file, refer to the Kubernetes documentation.
Note The user configured in the Kubeconfig file must have the List and Watch privileges.
5 Click Validate.
You see the Validation Successful message.
6 Enter the nick name for the data source and add any notes for description, as desired.
7 Click Submit.
Results
vRealize Network Insight can now fetch the Kubernetes cluster details.
What to do next
Go to Kubernetes Dashboard and view the details, see Viewing Kubernetes Details.
Add OpenShiftYou can add OpenShift as a data source and fetch your OpenShift details into vRealize Network Insight.
Note OpenShift and the corresponding NSX-T Manager must be added to the same collector VM.
Prerequisites
n Add NSX-T Manager in vRealize Network Insight.
Procedure
1 On the Settings page, click Accounts and Data Sources.
2 Click Add Source.
3 Under Containers, select OpenShift.
Using vRealize Network Insight
VMware, Inc. 49
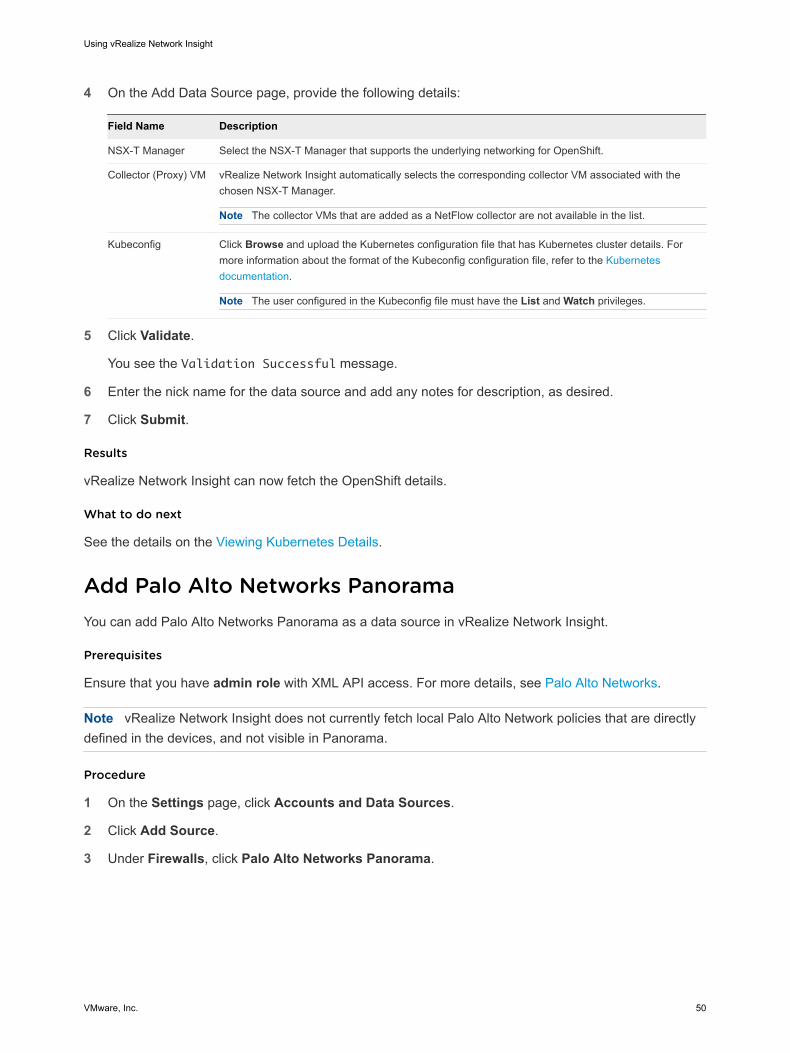
4 On the Add Data Source page, provide the following details:
Field Name Description
NSX-T Manager Select the NSX-T Manager that supports the underlying networking for OpenShift.
Collector (Proxy) VM vRealize Network Insight automatically selects the corresponding collector VM associated with the chosen NSX-T Manager.
Note The collector VMs that are added as a NetFlow collector are not available in the list.
Kubeconfig Click Browse and upload the Kubernetes configuration file that has Kubernetes cluster details. For more information about the format of the Kubeconfig configuration file, refer to the Kubernetes documentation.
Note The user configured in the Kubeconfig file must have the List and Watch privileges.
5 Click Validate.
You see the Validation Successful message.
6 Enter the nick name for the data source and add any notes for description, as desired.
7 Click Submit.
Results
vRealize Network Insight can now fetch the OpenShift details.
What to do next
See the details on the Viewing Kubernetes Details.
Add Palo Alto Networks PanoramaYou can add Palo Alto Networks Panorama as a data source in vRealize Network Insight.
Prerequisites
Ensure that you have admin role with XML API access. For more details, see Palo Alto Networks.
Note vRealize Network Insight does not currently fetch local Palo Alto Network policies that are directly defined in the devices, and not visible in Panorama.
Procedure
1 On the Settings page, click Accounts and Data Sources.
2 Click Add Source.
3 Under Firewalls, click Palo Alto Networks Panorama.
Using vRealize Network Insight
VMware, Inc. 50
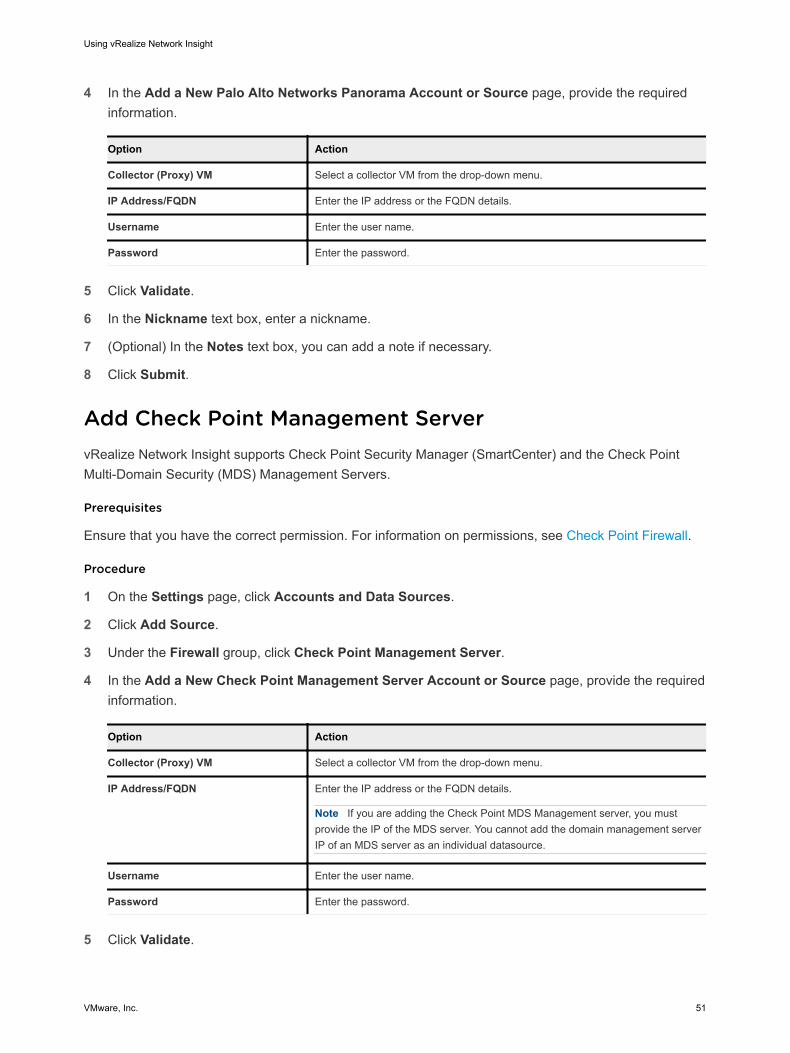
4 In the Add a New Palo Alto Networks Panorama Account or Source page, provide the required information.
Option Action
Collector (Proxy) VM Select a collector VM from the drop-down menu.
IP Address/FQDN Enter the IP address or the FQDN details.
Username Enter the user name.
Password Enter the password.
5 Click Validate.
6 In the Nickname text box, enter a nickname.
7 (Optional) In the Notes text box, you can add a note if necessary.
8 Click Submit.
Add Check Point Management ServervRealize Network Insight supports Check Point Security Manager (SmartCenter) and the Check Point Multi-Domain Security (MDS) Management Servers.
Prerequisites
Ensure that you have the correct permission. For information on permissions, see Check Point Firewall.
Procedure
1 On the Settings page, click Accounts and Data Sources.
2 Click Add Source.
3 Under the Firewall group, click Check Point Management Server.
4 In the Add a New Check Point Management Server Account or Source page, provide the required information.
Option Action
Collector (Proxy) VM Select a collector VM from the drop-down menu.
IP Address/FQDN Enter the IP address or the FQDN details.
Note If you are adding the Check Point MDS Management server, you must provide the IP of the MDS server. You cannot add the domain management server IP of an MDS server as an individual datasource.
Username Enter the user name.
Password Enter the password.
5 Click Validate.
Using vRealize Network Insight
VMware, Inc. 51
6 In the Nickname text box, enter a nickname.
7 (Optional) In the Notes text box, you can add a note if necessary.
8 Click Submit.
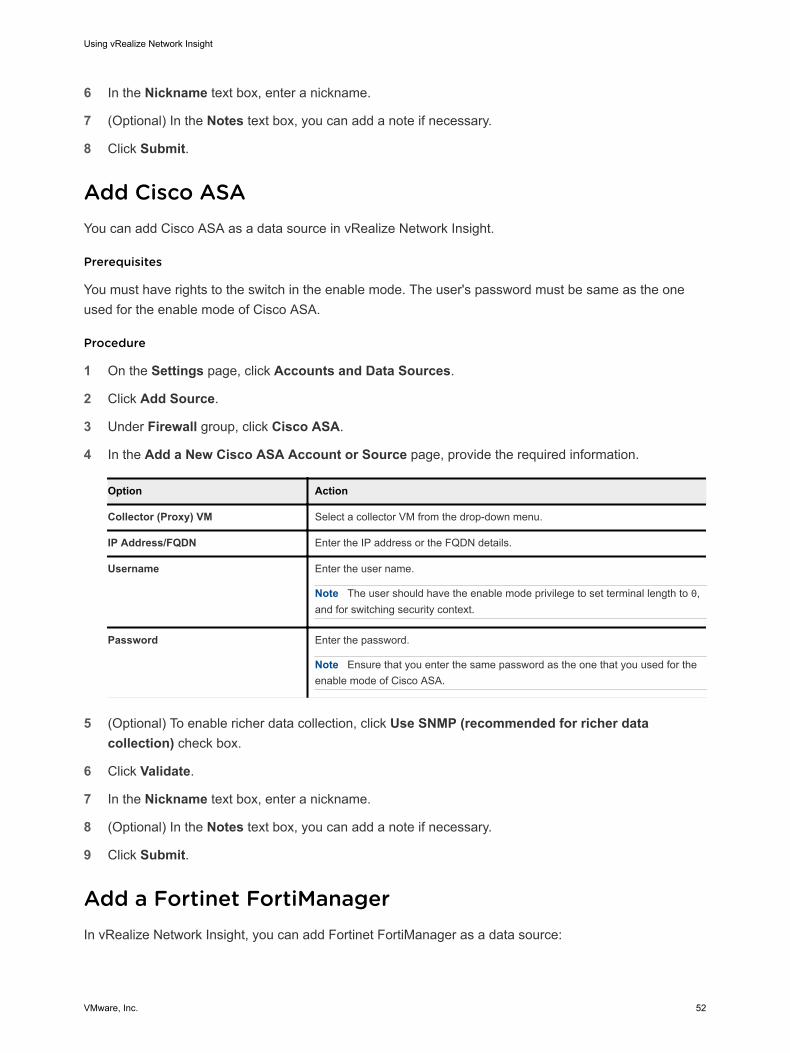
Add Cisco ASAYou can add Cisco ASA as a data source in vRealize Network Insight.
Prerequisites
You must have rights to the switch in the enable mode. The user's password must be same as the one used for the enable mode of Cisco ASA.
Procedure
1 On the Settings page, click Accounts and Data Sources.
2 Click Add Source.
3 Under Firewall group, click Cisco ASA.
4 In the Add a New Cisco ASA Account or Source page, provide the required information.
Option Action
Collector (Proxy) VM Select a collector VM from the drop-down menu.
IP Address/FQDN Enter the IP address or the FQDN details.
Username Enter the user name.
Note The user should have the enable mode privilege to set terminal length to 0, and for switching security context.
Password Enter the password.
Note Ensure that you enter the same password as the one that you used for the enable mode of Cisco ASA.
5 (Optional) To enable richer data collection, click Use SNMP (recommended for richer data
collection) check box.
6 Click Validate.
7 In the Nickname text box, enter a nickname.
8 (Optional) In the Notes text box, you can add a note if necessary.
9 Click Submit.
Add a Fortinet FortiManagerIn vRealize Network Insight, you can add Fortinet FortiManager as a data source:
Using vRealize Network Insight
VMware, Inc. 52
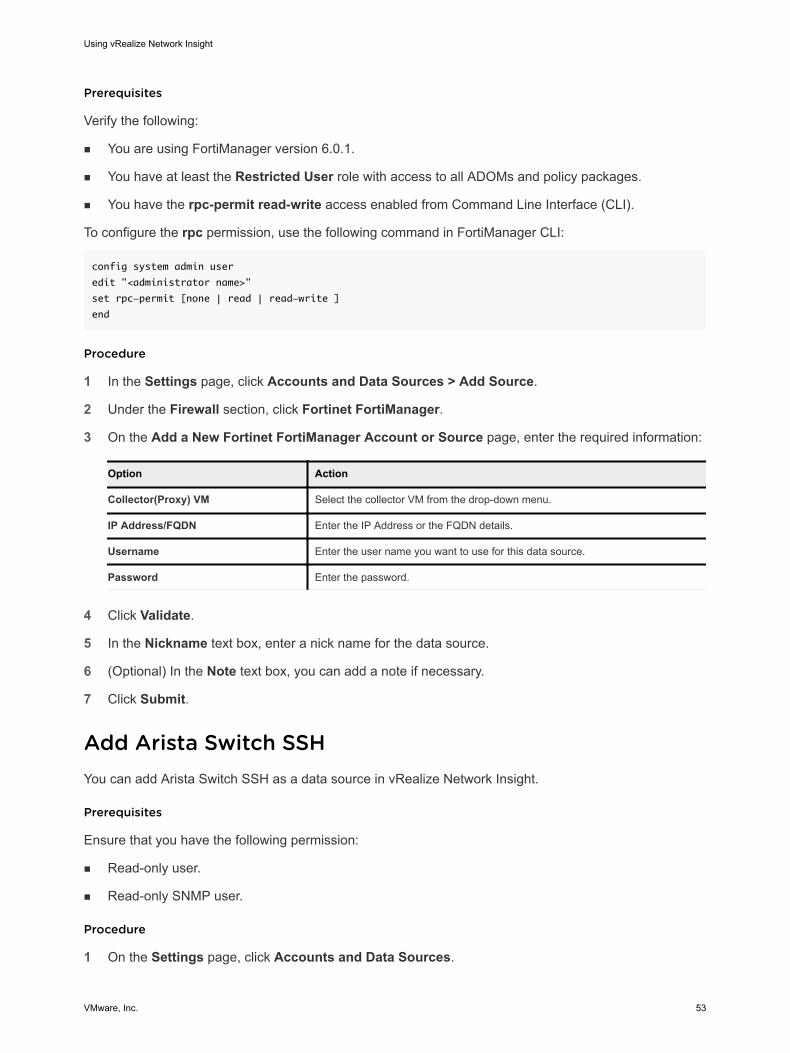
Prerequisites
Verify the following:
n You are using FortiManager version 6.0.1.
n You have at least the Restricted User role with access to all ADOMs and policy packages.
n You have the rpc-permit read-write access enabled from Command Line Interface (CLI).
To configure the rpc permission, use the following command in FortiManager CLI:
config system admin user
edit "<administrator name>"
set rpc-permit [none | read | read-write ]
end
Procedure
1 In the Settings page, click Accounts and Data Sources > Add Source.
2 Under the Firewall section, click Fortinet FortiManager.
3 On the Add a New Fortinet FortiManager Account or Source page, enter the required information:
Option Action
Collector(Proxy) VM Select the collector VM from the drop-down menu.
IP Address/FQDN Enter the IP Address or the FQDN details.
Username Enter the user name you want to use for this data source.
Password Enter the password.
4 Click Validate.
5 In the Nickname text box, enter a nick name for the data source.
6 (Optional) In the Note text box, you can add a note if necessary.
7 Click Submit.
Add Arista Switch SSHYou can add Arista Switch SSH as a data source in vRealize Network Insight.
Prerequisites
Ensure that you have the following permission:
n Read-only user.
n Read-only SNMP user.
Procedure
1 On the Settings page, click Accounts and Data Sources.
Using vRealize Network Insight
VMware, Inc. 53
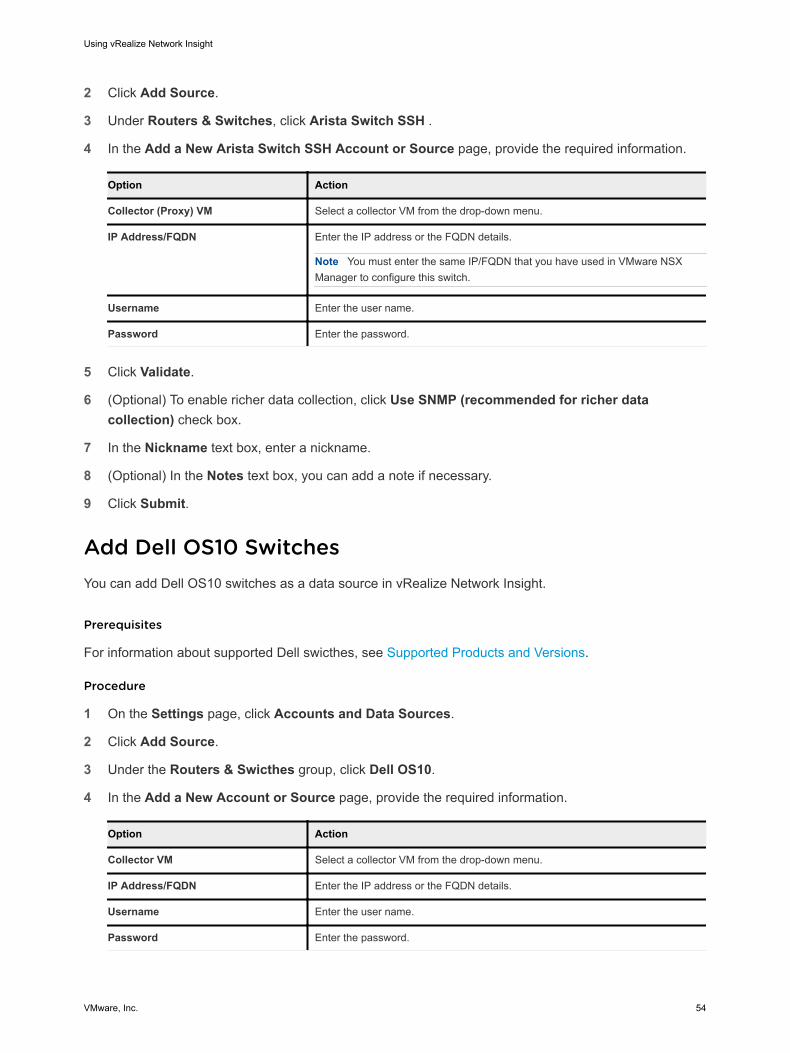
2 Click Add Source.
3 Under Routers & Switches, click Arista Switch SSH .
4 In the Add a New Arista Switch SSH Account or Source page, provide the required information.
Option Action
Collector (Proxy) VM Select a collector VM from the drop-down menu.
IP Address/FQDN Enter the IP address or the FQDN details.
Note You must enter the same IP/FQDN that you have used in VMware NSX Manager to configure this switch.
Username Enter the user name.
Password Enter the password.
5 Click Validate.
6 (Optional) To enable richer data collection, click Use SNMP (recommended for richer data collection) check box.
7 In the Nickname text box, enter a nickname.
8 (Optional) In the Notes text box, you can add a note if necessary.
9 Click Submit.
Add Dell OS10 SwitchesYou can add Dell OS10 switches as a data source in vRealize Network Insight.
Prerequisites
For information about supported Dell swicthes, see Supported Products and Versions.
Procedure
1 On the Settings page, click Accounts and Data Sources.
2 Click Add Source.
3 Under the Routers & Swicthes group, click Dell OS10.
4 In the Add a New Account or Source page, provide the required information.
Option Action
Collector VM Select a collector VM from the drop-down menu.
IP Address/FQDN Enter the IP address or the FQDN details.
Username Enter the user name.
Password Enter the password.
Using vRealize Network Insight
VMware, Inc. 54
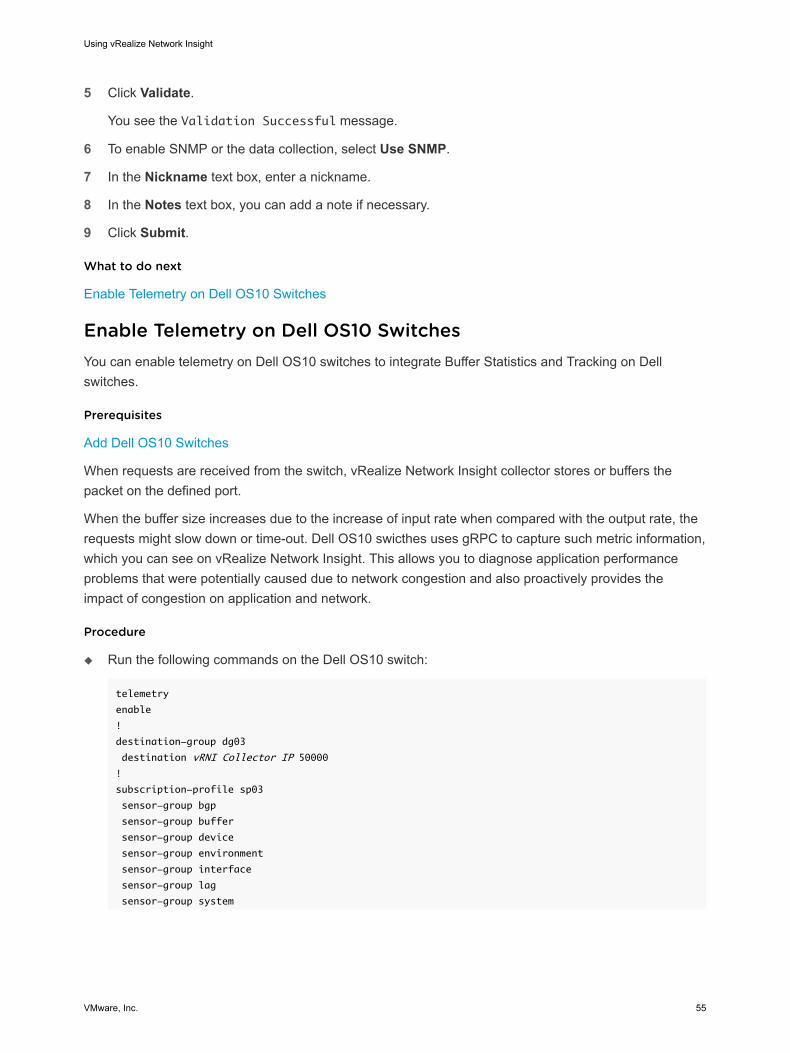
5 Click Validate.
You see the Validation Successful message.
6 To enable SNMP or the data collection, select Use SNMP.
7 In the Nickname text box, enter a nickname.
8 In the Notes text box, you can add a note if necessary.
9 Click Submit.
What to do next
Enable Telemetry on Dell OS10 Switches
Enable Telemetry on Dell OS10 SwitchesYou can enable telemetry on Dell OS10 switches to integrate Buffer Statistics and Tracking on Dell switches.
Prerequisites
Add Dell OS10 Switches
When requests are received from the switch, vRealize Network Insight collector stores or buffers the packet on the defined port.
When the buffer size increases due to the increase of input rate when compared with the output rate, the requests might slow down or time-out. Dell OS10 swicthes uses gRPC to capture such metric information, which you can see on vRealize Network Insight. This allows you to diagnose application performance problems that were potentially caused due to network congestion and also proactively provides the impact of congestion on application and network.
Procedure
u Run the following commands on the Dell OS10 switch:
telemetry
enable
!
destination-group dg03
destination vRNI Collector IP 50000
!
subscription-profile sp03
sensor-group bgp
sensor-group buffer
sensor-group device
sensor-group environment
sensor-group interface
sensor-group lag
sensor-group system
Using vRealize Network Insight
VMware, Inc. 55
destination-group dg03
encoding gpb
transport grpc no-tls
source-interface ethernet1/1/1
Results
vRealize Network Insight collector collects the following telemetry information from the Dell OS10 switches.
n per-port egress unicast queues
n per-port egress multicast queues
n per-port egress service pool
n per priority group ingress shared headroom
n per service pool ingress
What to do next
Run any of the following queries:
n show ports where metric > X in time range
n show switches where metric > X in time range
n port show metrics in time range
n swicth show metrics in time range
n show switches where at least one port metric > X in time range
You see the respective event triggered. For example, SwitchPort Buffer Threshold Exceeded Event.
You can also search for the Interface Peak Buffer Utilization metric and identify the reason for the request slow down.
Add Huawei 6800/7800/8800 SeriesvRealize Network Insight supports a multiple series of Huawei Cloud Engine.
Prerequisites
The user must have at least Read-Only permissions.
Procedure
1 On the Settings page, click Accounts and Data Sources.
2 Click Add Source.
3 Under Routers & Switches, select Huawei 6800/7800/8800 Series.
Using vRealize Network Insight
VMware, Inc. 56
4 Enter the following information:
Properties Description
Collector(Proxy) VM Select the proxy VM from the drop-down menu.
IP Address/FQDN Enter the IP Address or the FQDN details.
Username Enter the user name you want to use for this data source.
Password Enter the password.
5 Click Validate.
6 If you enable SNMP for the data collection, select SNMP Version.
a For 2c, enter the associated community string.
b For 3, enter the following:
n Username
n Context Name
n Authentication Type
7 Provide the Nickname and Notes as required.
8 Click Submit.
What to do next
You can use the following features of vRealize Network Insight with Huawei devices or routers.
n VM-VM path
n VM Underlay topology
n Huawei Router or Switch dashboard
n Metrics: Switch port and router interface metrics
n Dashboards
n Huawei Router or Switch
n Router Interfaces
n Port Channels
n Switch Ports
n Routes
n High availability: supports M-LAG (Multi-Chassis Link Aggregation) and VRRP (Virtual Router Redundancy Protocol)
n Searches
n VRF (Virtual routing and forwarding) of Huawei
n Router Interface of Huawei
Using vRealize Network Insight
VMware, Inc. 57
n Switch port of Huawei
n Port Channel of Huawei
n Routes in Huawei
n Huawei NetStream data monitoring
Add Cisco ACIYou can add Cisco ACI as a data source. This feature is available only for the enterprise license users.
Prerequisites
n To connect to the APIC controller REST API over HTTPS, you must have access to all the tenants and have the read-only privilege.
n For SNMP, you must have the read-only permission.
n Ensure you have a local user role with the following privilege:
n Security Domain: all
n Role: admin
n Access: read
For details on how to create a local user in Cisco ACI, see Access, Authentication, and Accounting section in Cisco APIC Security Configuration Guide.
Procedure
1 In the Accounts and Data Source page under Settings, click Add Source.
2 Under Others, click Cisco ACI.
3 In the Add a new Cisco ACI Account or Source page, provide the required information:
Option Action
Collector (Proxy) VM Select a collector VM from the drop-down menu.
IP Address/FQDN Enter the IP address or the FQDN details.
Username Enter the user name.
Note If the user is a domain user, then you must add apic: before the user name. For example: if the user name is user1 and if the user belongs to the domain domain1 then specify the user name as apic:domain1\\user1. The domain name is case-sensitive.
Password Enter the password. n Select the Collector VM.
Using vRealize Network Insight
VMware, Inc. 58
n Provide the IP address of any of the APIC controllers in the cluster.
Note You do not have to add the individual switches in the ACI fabric.
n Provide the user credentials.
n vRealize Network Insight collects the metric data over SNMP from the individual switches. To enable this task, select Use SNMP.
4 Click Validate.
5 Enter Nickname and Notes (if any) for the data source and click Submit
Add a Physical Flow Collector for NetFlow and sFlowYou can add a physical flow collector and configure the switches to push sFlow and NetFlow records to the collector. The collector VM that is used for NetFlow or sFlow is a dedicated collector. It cannot be used for any other data source. If any other data source is also added on the proxy server, it is not available as a Physical Flow Collector for sFlow and NetFlow.
Procedure
1 In the Settings page, click Accounts and Data Sources.
2 Click Add Source.
3 Under Flows, click Physical Flow Collector (Netflow, sFlow).
sFlows are accepted only on the physical collector.
4 Enter Nickname and Notes as required.
5 Click Submit.
Results
Note vRealize Network Insight collects the packet samples for sFlow and so cannot show the complete metrics for the flows.
What to do next
Configure the switches to push the flows to the Physical Flow Collector.
n Define the destination (Collector IP address that you added in vRealize Network Insight).
n Set the port for the flow collector.
n Assign poll interval.
Note The procedure to configure depends on the switch that you want to configure. For more information, see the specific switch documentation.
Using vRealize Network Insight
VMware, Inc. 59
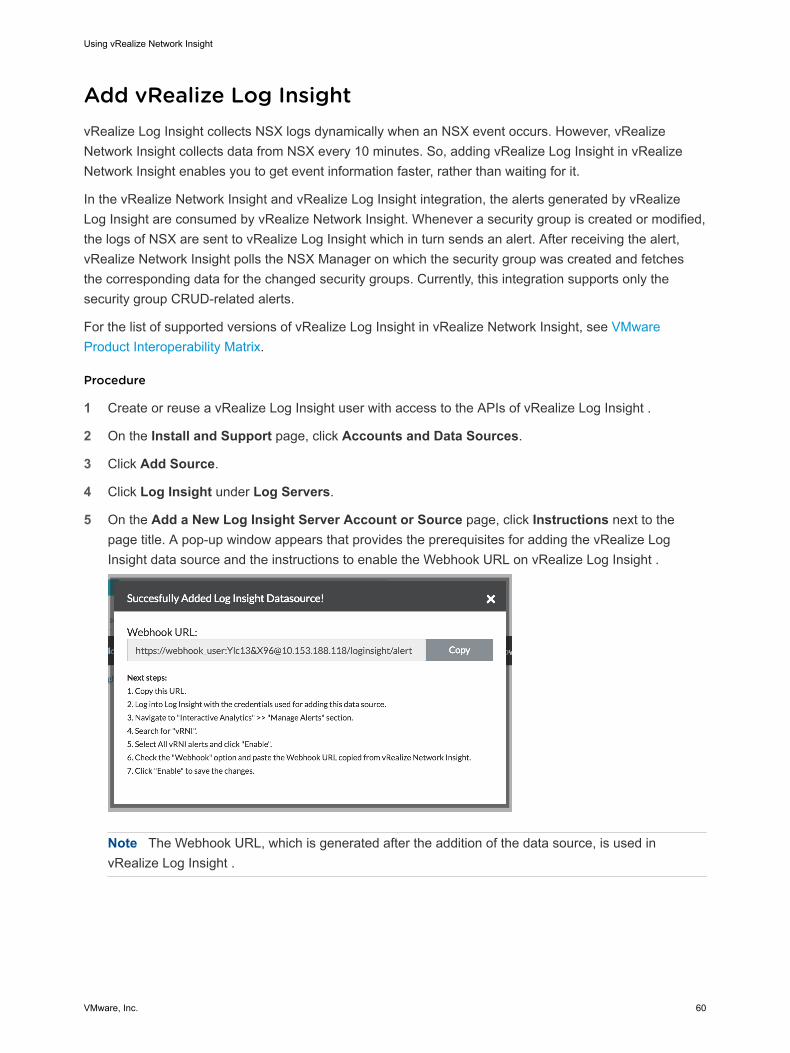
Add vRealize Log InsightvRealize Log Insight collects NSX logs dynamically when an NSX event occurs. However, vRealize Network Insight collects data from NSX every 10 minutes. So, adding vRealize Log Insight in vRealize Network Insight enables you to get event information faster, rather than waiting for it.
In the vRealize Network Insight and vRealize Log Insight integration, the alerts generated by vRealize Log Insight are consumed by vRealize Network Insight. Whenever a security group is created or modified, the logs of NSX are sent to vRealize Log Insight which in turn sends an alert. After receiving the alert, vRealize Network Insight polls the NSX Manager on which the security group was created and fetches the corresponding data for the changed security groups. Currently, this integration supports only the security group CRUD-related alerts.
For the list of supported versions of vRealize Log Insight in vRealize Network Insight, see VMware Product Interoperability Matrix.
Procedure
1 Create or reuse a vRealize Log Insight user with access to the APIs of vRealize Log Insight .
2 On the Install and Support page, click Accounts and Data Sources.
3 Click Add Source.
4 Click Log Insight under Log Servers.
5 On the Add a New Log Insight Server Account or Source page, click Instructions next to the page title. A pop-up window appears that provides the prerequisites for adding the vRealize Log Insight data source and the instructions to enable the Webhook URL on vRealize Log Insight .
Note The Webhook URL, which is generated after the addition of the data source, is used in vRealize Log Insight .
Using vRealize Network Insight
VMware, Inc. 60
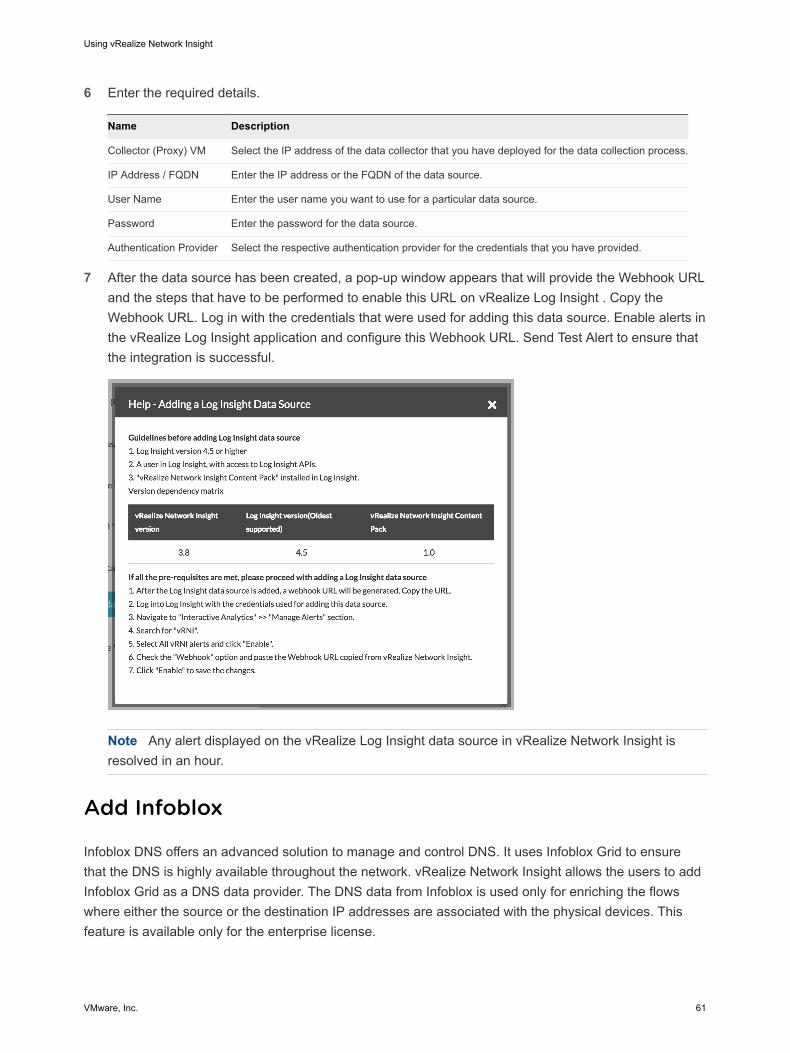
6 Enter the required details.
Name Description
Collector (Proxy) VM Select the IP address of the data collector that you have deployed for the data collection process.
IP Address / FQDN Enter the IP address or the FQDN of the data source.
User Name Enter the user name you want to use for a particular data source.
Password Enter the password for the data source.
Authentication Provider Select the respective authentication provider for the credentials that you have provided.
7 After the data source has been created, a pop-up window appears that will provide the Webhook URL and the steps that have to be performed to enable this URL on vRealize Log Insight . Copy the Webhook URL. Log in with the credentials that were used for adding this data source. Enable alerts in the vRealize Log Insight application and configure this Webhook URL. Send Test Alert to ensure that the integration is successful.
Note Any alert displayed on the vRealize Log Insight data source in vRealize Network Insight is resolved in an hour.
Add Infoblox
Infoblox DNS offers an advanced solution to manage and control DNS. It uses Infoblox Grid to ensure that the DNS is highly available throughout the network. vRealize Network Insight allows the users to add Infoblox Grid as a DNS data provider. The DNS data from Infoblox is used only for enriching the flows where either the source or the destination IP addresses are associated with the physical devices. This feature is available only for the enterprise license.
Using vRealize Network Insight
VMware, Inc. 61
The Infoblox DNS data co-exists with the DNS data that is imported by using CSV.
If you configure an Infoblox DNS data source on a proxy server, you can configure other data sources also on the same proxy server. You do not need a dedicated proxy server for Infoblox.
Considerations
n vRealize Network Insight supports only single-grid mode for Infoblox in the current release.
n Only A Records are supported in the current release. Shared A Records are not supported currently.
n The DNS enrichment is supported only for the IP addresses that are marked as physical in the current release.
n If there are multiple FQDNs for a single physical IP address, all FQDNs are returned.
Procedure
1 On the Settings page, click Accounts and Data Sources.
2 Click Add new source.
3 Click Infoblox under DNS.
4 Provide the following information:
Table 3-5.
Properties Description
Collector(Proxy) VM Select the proxy VM from the drop-down menu.
IP Address/FQDN Enter the IP Address/FQDN of Infoblox Grid Master.
Username Enter the user name you want to use for a particular data source.
Password Enter the password.
5 Click Validate.
Note Ensure that you have the API Privilege to access the Infloblox APIs.
6 Enter Nickname and Notes (if any) for the data source and click Submit to add the Infoblox DNS data source to the environment.
Add F5 BIG-IPvRealize Network Insight supports the router and load balancer functionalities of F5 BIG-IP. The features like VM-VM path, high availability, VRFs, Routes, Router Interfaces, Switch Ports, Port Channels, Switch Port metrics, VRF Dashboard, Switch Dashboard and Router dashboard are supported. For search on the F5 BIG IP entities, use the query string F5 BIG-IP Data Source. vRealize Network Insight does not support LLDP neighbors or the neighboring devices in the VM-VM path.
To add F5 BIG-IP as a data source:
Using vRealize Network Insight
VMware, Inc. 62
Prerequisites
n The user must have:
n the Guest role or Read Only permissions with access to all partitions.
n access to REST API.
n access to TMSH terminal access.
n Enable SSH on the device.
Enable password authentication for SSH as follows:
Note n Use root or the administrator role privilege for changing the SSHD configuration.
n Do not use the root user privilege while adding F5 BIG-IP data source in vRealize Network Insight .
n Root user does not have HTTP access. The root user privilege is used for the administrative purpose.
[root@bigip:Active] config # tmsh
root@bigip(Active)(/Common)(tmos)# edit sys sshd
## Adding the following configuration ##
modify sshd {
include ”
ChallengeResponseAuthentication no
PasswordAuthentication yes”
}
################################
Save changes? (y/n/e) y
root@bigip(Active)(/Common)(tmos)#
root@bigip(Active)(/Common)(tmos)# save sys config
root@bigip(Active)(/Common)(tmos)# show running-config sys sshd
sys sshd {
include ”
ChallengeResponseAuthentication no
PasswordAuthentication yes”
}
Procedure
1 On the Settings page, click Accounts and Data Sources.
2 Click Add Source.
3 Under Routers & Switches select F5 BIG-IP.
Using vRealize Network Insight
VMware, Inc. 63
4 Provide the following information:
Properties Description
Collector(Proxy) VM Select the proxy VM from the drop-down menu.
IP Address/FQDN Enter the IP Address or the FQDN details.
Username Enter the user name you want to use for this data source.
Password Enter the password.
5 After entering the information in the text boxes, click Validate.
6 If you enable SNMP for the data collection, select SNMP Version.
a If you select 2c, then enter the associated community string.
b If you select 3, then enter the following:
n Username
n Context Name
n Authentication Type
Note Ensure that you configure SNMP on the F5 BIG-IP UI console.
a Log in to F5.
b Navigate to System > SNMP.
c Go to SNMP > Agent > Acess (v1,v2c).
d Enter the community string.
e Enter the source IP address.
f Select the Read Only access.
g Click Finished.
7 Provide the Nickname and Notes as required. Click Submit.
Add ServiceNowServiceNow Configuration Management Database (CMDB) provides you the full visibility of software and hardware infrastructure and relation between them in your datacenter, which helps you to manage your inventory. With ServiceNow integration, vRealize Network Insight can discover applications available in ServiceNow CMDB to enable you to directly add them into vRealize Network Insight.
CMDB ConceptsBasically, a CMDB consists of:
n Configuration item: An entity or a component in a system. Example, a computer, a switch, a service, an application, a server, or a VM.
Using vRealize Network Insight
VMware, Inc. 64
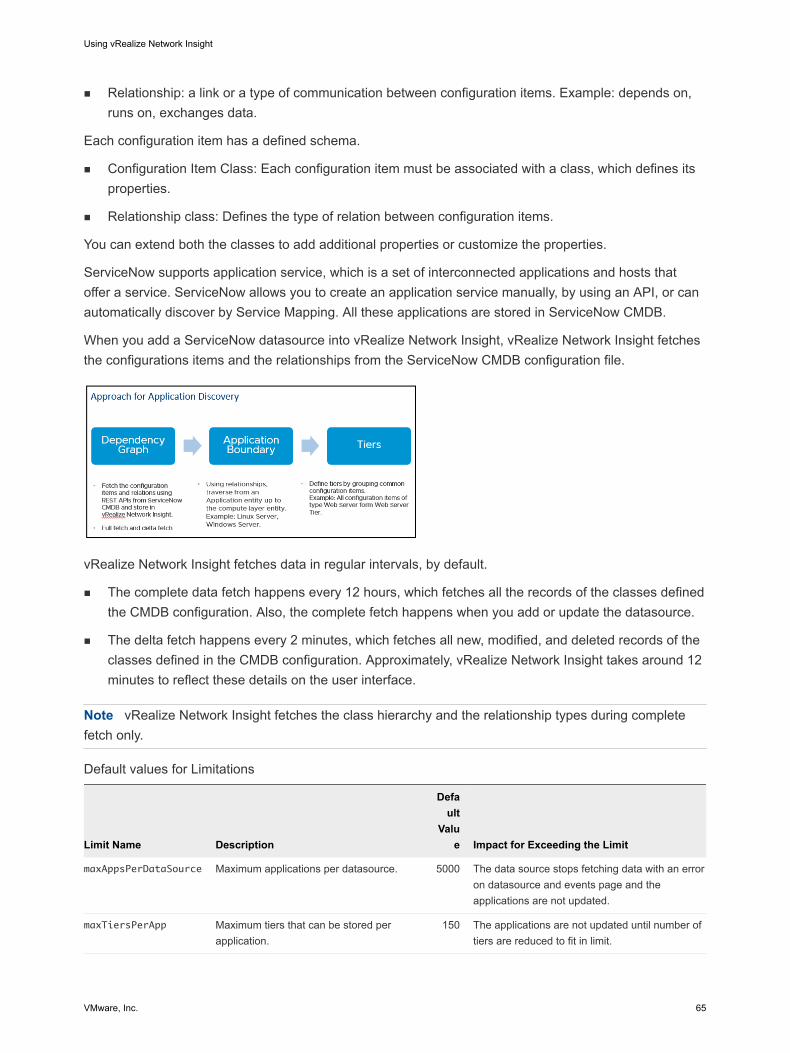
n Relationship: a link or a type of communication between configuration items. Example: depends on, runs on, exchanges data.
Each configuration item has a defined schema.
n Configuration Item Class: Each configuration item must be associated with a class, which defines its properties.
n Relationship class: Defines the type of relation between configuration items.
You can extend both the classes to add additional properties or customize the properties.
ServiceNow supports application service, which is a set of interconnected applications and hosts that offer a service. ServiceNow allows you to create an application service manually, by using an API, or can automatically discover by Service Mapping. All these applications are stored in ServiceNow CMDB.
When you add a ServiceNow datasource into vRealize Network Insight, vRealize Network Insight fetches the configurations items and the relationships from the ServiceNow CMDB configuration file.
vRealize Network Insight fetches data in regular intervals, by default.
n The complete data fetch happens every 12 hours, which fetches all the records of the classes defined the CMDB configuration. Also, the complete fetch happens when you add or update the datasource.
n The delta fetch happens every 2 minutes, which fetches all new, modified, and deleted records of the classes defined in the CMDB configuration. Approximately, vRealize Network Insight takes around 12 minutes to reflect these details on the user interface.
Note vRealize Network Insight fetches the class hierarchy and the relationship types during complete fetch only.
Default values for Limitations
Limit Name Description
Default
Value Impact for Exceeding the Limit
maxAppsPerDataSource Maximum applications per datasource. 5000 The data source stops fetching data with an error on datasource and events page and the applications are not updated.
maxTiersPerApp Maximum tiers that can be stored per application.
150 The applications are not updated until number of tiers are reduced to fit in limit.
Using vRealize Network Insight
VMware, Inc. 65
Limit Name Description
Default
Value Impact for Exceeding the Limit
maxMembersPerApp Maximum members that can be stored per application.
5000 The applications are not updated until number of members are reduced to fit in limit.
maxGraphTraversalSta
ckSize
Maximum size of stack used in graph traversal.
10000
The application will not get created and throws SizeLimitExceededException.
maxResponseAppCount Maximum apps that can be returned in API response.
5000 Only the number of applications that fits the limit are returned and UI shows error.
Adding ServiceNowYou can add ServiceNow as a data source into vRealize Network Insight and fetch your application and tier details.
Prerequisites
You must have the administrator privilege to add a data source.
Procedure
1 On the Settings page, click Accounts and Data Sources.
2 Click Add Source.
3 Under CMDB, select ServiceNow.
4 On the Add Data Source page, provide the following details:
Field Name Description
Collector (Proxy) VM The host URL of ServiceNow
IP Address/FQDN Enter the IP Address or the FQDN details.
Username Enter the user name you want to use for this data source.
Note The user you plan to add must be an Administrator or Read-Only Administrator in ServiceNow.
Password Enter the password.
5 Click Validate.
You see the Validation Successful message.
6 To add a customized CMDB configuration,
a Select Customize CMDB configuration.
b Click download to download the default configuration file.
c Update the file properties. See, Customizing the CMDB Configuration.
d On the Add Datasource page, browse to select the updated JSON file.
Using vRealize Network Insight
VMware, Inc. 66
7 Enter the nick name for the data source and add any notes for description.
8 Click Submit.
What to do next
After you add a ServiceNow datasource, vRealize Network Insight discovers the applications available in the ServiceNow CMDB, which you add into vRealize Network Insight. For more information, see Add Discovered Applications.
Default CMDB Configuration FilevRealize Network Insight supports ServiceNow customizations using the configuration file in the JSON format.
{
"fetchOnlyApprovedApplications": false,
"nameBasedSearchForVm": false,
"ignoreWorkloadCheck": false,
"ciGroup": [
{
"name": "applicationClasses",
"value": [
"cmdb_ci_service_discovered"
],
"valueType": "CI_CLASS",
"systemGenerated": true,
"expandCIClass": true
},
{
"name": "relationshipTypeClasses",
"value": [
"*"
],
"valueType": "CI_VALUE",
"systemGenerated": true,
"expandCIClass": false
},
{
"name": "workloadRelationshipTypeClasses",
"value": [
"Hosted on::Hosts",
"Instantiates::Instantiated by",
"Runs on::Runs",
"Virtualized by::Virtualizes"
],
"valueType": "CI_VALUE",
"systemGenerated": true,
"expandCIClass": false
},
{
"name": "workloadCIClasses",
"value": [
"cmdb_ci_computer",
"cmdb_ci_vm_instance",
Using vRealize Network Insight
VMware, Inc. 67
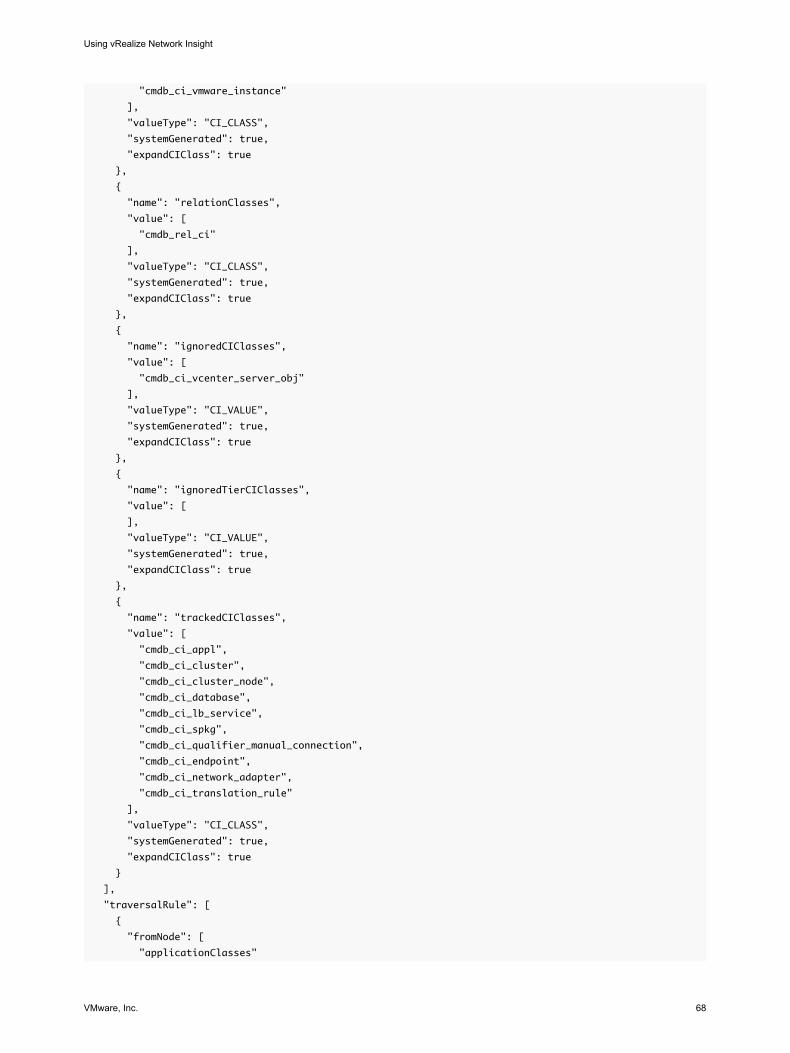
"cmdb_ci_vmware_instance"
],
"valueType": "CI_CLASS",
"systemGenerated": true,
"expandCIClass": true
},
{
"name": "relationClasses",
"value": [
"cmdb_rel_ci"
],
"valueType": "CI_CLASS",
"systemGenerated": true,
"expandCIClass": true
},
{
"name": "ignoredCIClasses",
"value": [
"cmdb_ci_vcenter_server_obj"
],
"valueType": "CI_VALUE",
"systemGenerated": true,
"expandCIClass": true
},
{
"name": "ignoredTierCIClasses",
"value": [
],
"valueType": "CI_VALUE",
"systemGenerated": true,
"expandCIClass": true
},
{
"name": "trackedCIClasses",
"value": [
"cmdb_ci_appl",
"cmdb_ci_cluster",
"cmdb_ci_cluster_node",
"cmdb_ci_database",
"cmdb_ci_lb_service",
"cmdb_ci_spkg",
"cmdb_ci_qualifier_manual_connection",
"cmdb_ci_endpoint",
"cmdb_ci_network_adapter",
"cmdb_ci_translation_rule"
],
"valueType": "CI_CLASS",
"systemGenerated": true,
"expandCIClass": true
}
],
"traversalRule": [
{
"fromNode": [
"applicationClasses"
Using vRealize Network Insight
VMware, Inc. 68
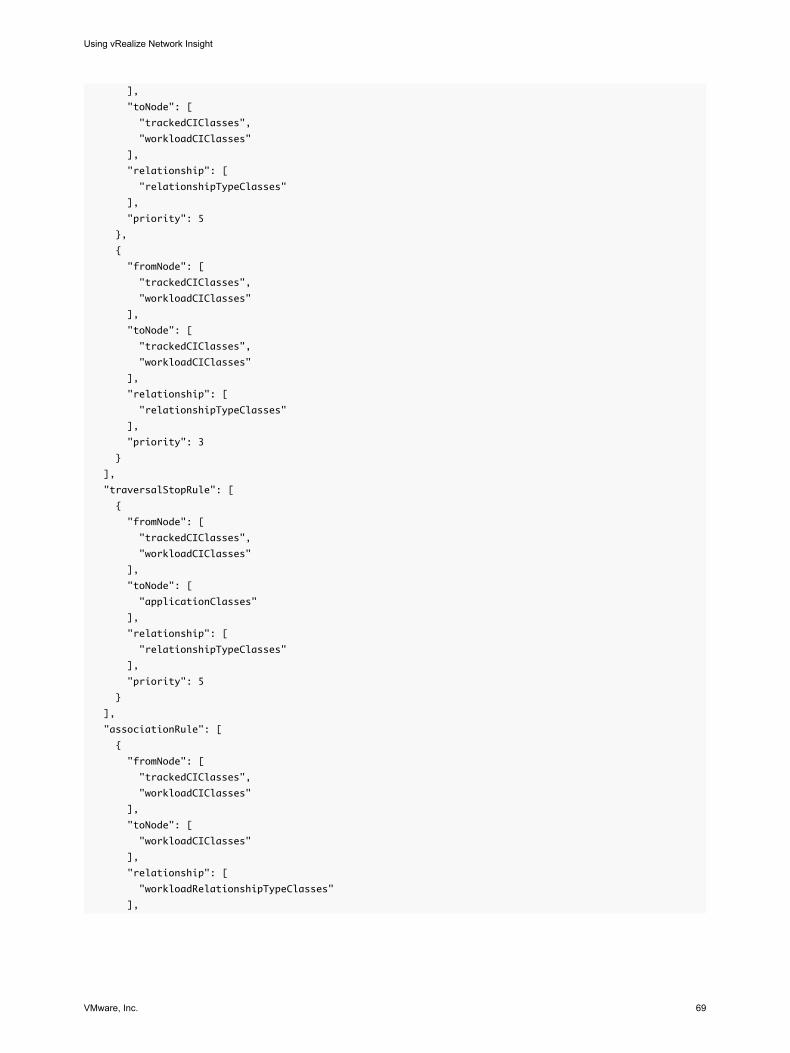
],
"toNode": [
"trackedCIClasses",
"workloadCIClasses"
],
"relationship": [
"relationshipTypeClasses"
],
"priority": 5
},
{
"fromNode": [
"trackedCIClasses",
"workloadCIClasses"
],
"toNode": [
"trackedCIClasses",
"workloadCIClasses"
],
"relationship": [
"relationshipTypeClasses"
],
"priority": 3
}
],
"traversalStopRule": [
{
"fromNode": [
"trackedCIClasses",
"workloadCIClasses"
],
"toNode": [
"applicationClasses"
],
"relationship": [
"relationshipTypeClasses"
],
"priority": 5
}
],
"associationRule": [
{
"fromNode": [
"trackedCIClasses",
"workloadCIClasses"
],
"toNode": [
"workloadCIClasses"
],
"relationship": [
"workloadRelationshipTypeClasses"
],
Using vRealize Network Insight
VMware, Inc. 69
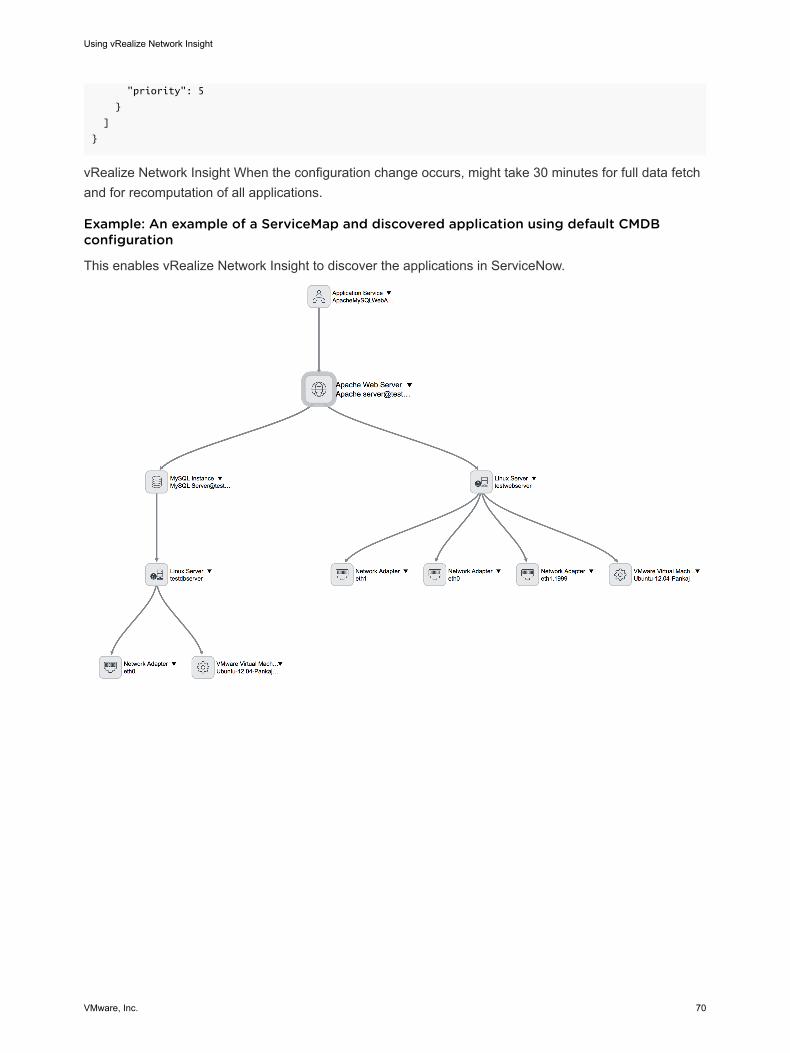
"priority": 5
}
]
}
vRealize Network Insight When the configuration change occurs, might take 30 minutes for full data fetch and for recomputation of all applications.
Example: An example of a ServiceMap and discovered application using default CMDB configuration
This enables vRealize Network Insight to discover the applications in ServiceNow.
Using vRealize Network Insight
VMware, Inc. 70
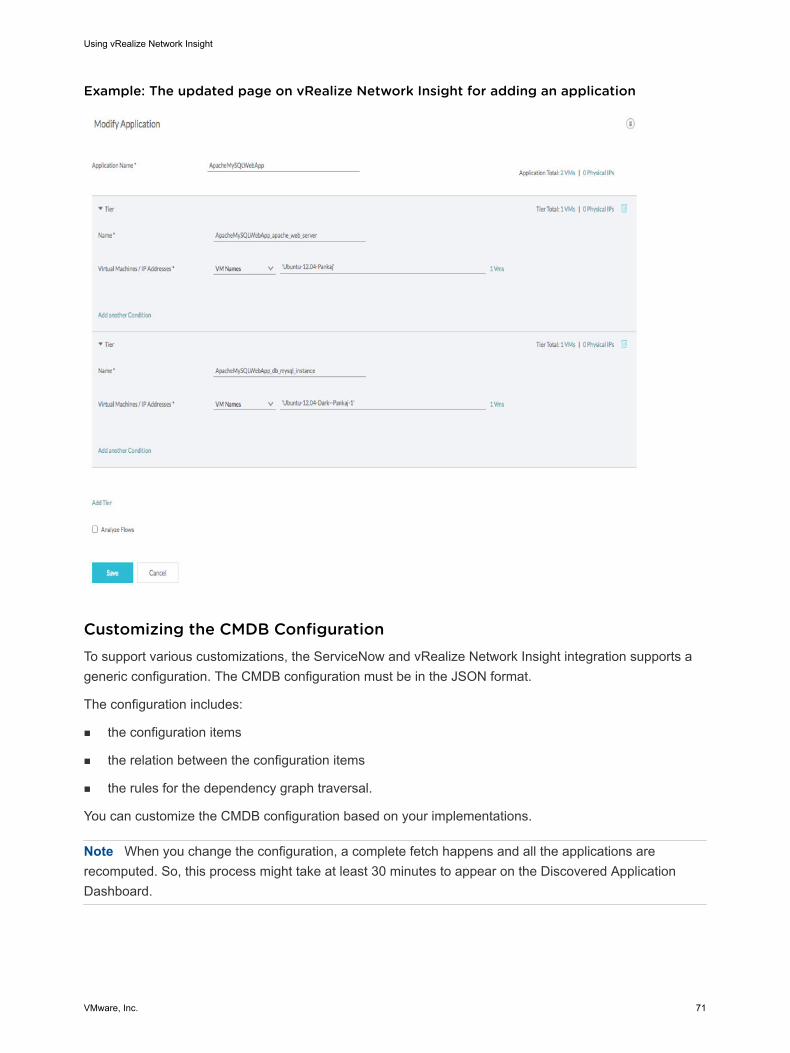
Example: The updated page on vRealize Network Insight for adding an application
Customizing the CMDB ConfigurationTo support various customizations, the ServiceNow and vRealize Network Insight integration supports a generic configuration. The CMDB configuration must be in the JSON format.
The configuration includes:
n the configuration items
n the relation between the configuration items
n the rules for the dependency graph traversal.
You can customize the CMDB configuration based on your implementations.
Note When you change the configuration, a complete fetch happens and all the applications are recomputed. So, this process might take at least 30 minutes to appear on the Discovered Application Dashboard.
Using vRealize Network Insight
VMware, Inc. 71
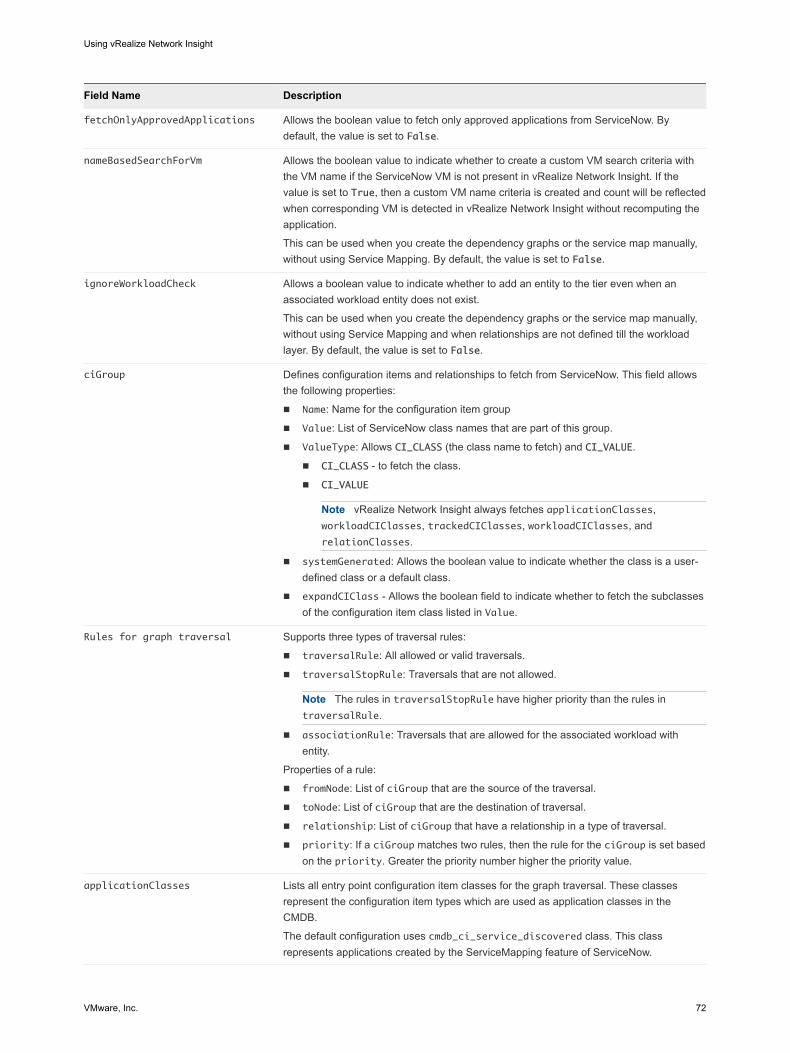
Field Name Description
fetchOnlyApprovedApplications Allows the boolean value to fetch only approved applications from ServiceNow. By default, the value is set to False.
nameBasedSearchForVm Allows the boolean value to indicate whether to create a custom VM search criteria with the VM name if the ServiceNow VM is not present in vRealize Network Insight. If the value is set to True, then a custom VM name criteria is created and count will be reflected when corresponding VM is detected in vRealize Network Insight without recomputing the application.
This can be used when you create the dependency graphs or the service map manually, without using Service Mapping. By default, the value is set to False.
ignoreWorkloadCheck Allows a boolean value to indicate whether to add an entity to the tier even when an associated workload entity does not exist.
This can be used when you create the dependency graphs or the service map manually, without using Service Mapping and when relationships are not defined till the workload layer. By default, the value is set to False.
ciGroup Defines configuration items and relationships to fetch from ServiceNow. This field allows the following properties:
n Name: Name for the configuration item group
n Value: List of ServiceNow class names that are part of this group.
n ValueType: Allows CI_CLASS (the class name to fetch) and CI_VALUE.
n CI_CLASS - to fetch the class.
n CI_VALUE
Note vRealize Network Insight always fetches applicationClasses, workloadCIClasses, trackedCIClasses, workloadCIClasses, and relationClasses.
n systemGenerated: Allows the boolean value to indicate whether the class is a user-defined class or a default class.
n expandCIClass - Allows the boolean field to indicate whether to fetch the subclasses of the configuration item class listed in Value.
Rules for graph traversal Supports three types of traversal rules:
n traversalRule: All allowed or valid traversals.
n traversalStopRule: Traversals that are not allowed.
Note The rules in traversalStopRule have higher priority than the rules in traversalRule.
n associationRule: Traversals that are allowed for the associated workload with entity.
Properties of a rule:
n fromNode: List of ciGroup that are the source of the traversal.
n toNode: List of ciGroup that are the destination of traversal.
n relationship: List of ciGroup that have a relationship in a type of traversal.
n priority: If a ciGroup matches two rules, then the rule for the ciGroup is set based on the priority. Greater the priority number higher the priority value.
applicationClasses Lists all entry point configuration item classes for the graph traversal. These classes represent the configuration item types which are used as application classes in the CMDB.
The default configuration uses cmdb_ci_service_discovered class. This class represents applications created by the ServiceMapping feature of ServiceNow.
Using vRealize Network Insight
VMware, Inc. 72
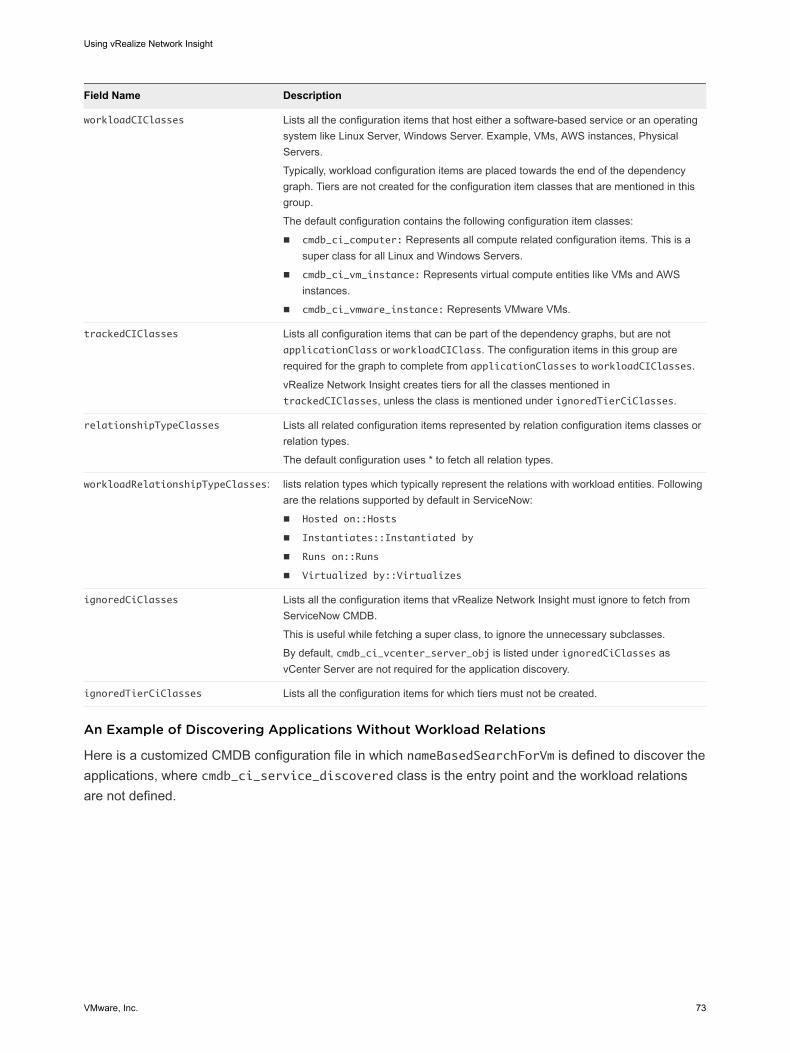
Field Name Description
workloadCIClasses Lists all the configuration items that host either a software-based service or an operating system like Linux Server, Windows Server. Example, VMs, AWS instances, Physical Servers.
Typically, workload configuration items are placed towards the end of the dependency graph. Tiers are not created for the configuration item classes that are mentioned in this group.
The default configuration contains the following configuration item classes:
n cmdb_ci_computer: Represents all compute related configuration items. This is a super class for all Linux and Windows Servers.
n cmdb_ci_vm_instance: Represents virtual compute entities like VMs and AWS instances.
n cmdb_ci_vmware_instance: Represents VMware VMs.
trackedCIClasses Lists all configuration items that can be part of the dependency graphs, but are not applicationClass or workloadCIClass. The configuration items in this group are required for the graph to complete from applicationClasses to workloadCIClasses.
vRealize Network Insight creates tiers for all the classes mentioned in trackedCIClasses, unless the class is mentioned under ignoredTierCiClasses.
relationshipTypeClasses Lists all related configuration items represented by relation configuration items classes or relation types.
The default configuration uses * to fetch all relation types.
workloadRelationshipTypeClasses: lists relation types which typically represent the relations with workload entities. Following are the relations supported by default in ServiceNow:
n Hosted on::Hosts
n Instantiates::Instantiated by
n Runs on::Runs
n Virtualized by::Virtualizes
ignoredCiClasses Lists all the configuration items that vRealize Network Insight must ignore to fetch from ServiceNow CMDB.
This is useful while fetching a super class, to ignore the unnecessary subclasses.
By default, cmdb_ci_vcenter_server_obj is listed under ignoredCiClasses as vCenter Server are not required for the application discovery.
ignoredTierCiClasses Lists all the configuration items for which tiers must not be created.
An Example of Discovering Applications Without Workload Relations
Here is a customized CMDB configuration file in which nameBasedSearchForVm is defined to discover the applications, where cmdb_ci_service_discovered class is the entry point and the workload relations are not defined.
Using vRealize Network Insight
VMware, Inc. 73
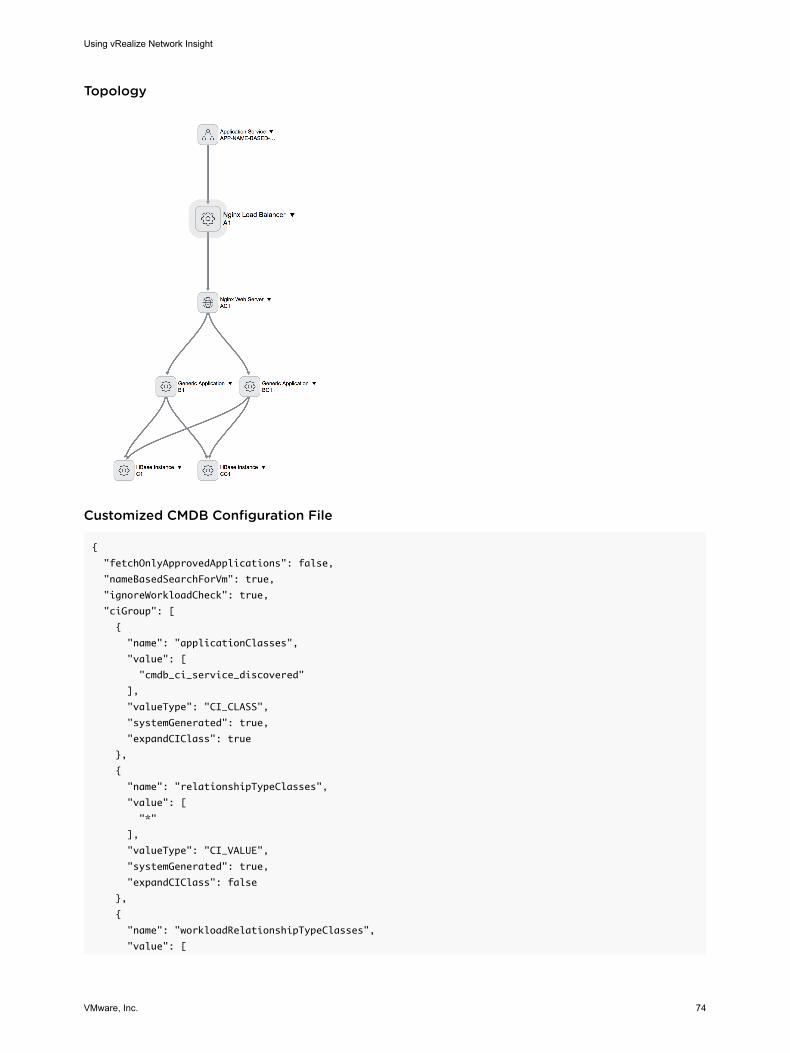
Topology
Customized CMDB Configuration File
{
"fetchOnlyApprovedApplications": false,
"nameBasedSearchForVm": true,
"ignoreWorkloadCheck": true,
"ciGroup": [
{
"name": "applicationClasses",
"value": [
"cmdb_ci_service_discovered"
],
"valueType": "CI_CLASS",
"systemGenerated": true,
"expandCIClass": true
},
{
"name": "relationshipTypeClasses",
"value": [
"*"
],
"valueType": "CI_VALUE",
"systemGenerated": true,
"expandCIClass": false
},
{
"name": "workloadRelationshipTypeClasses",
"value": [
Using vRealize Network Insight
VMware, Inc. 74
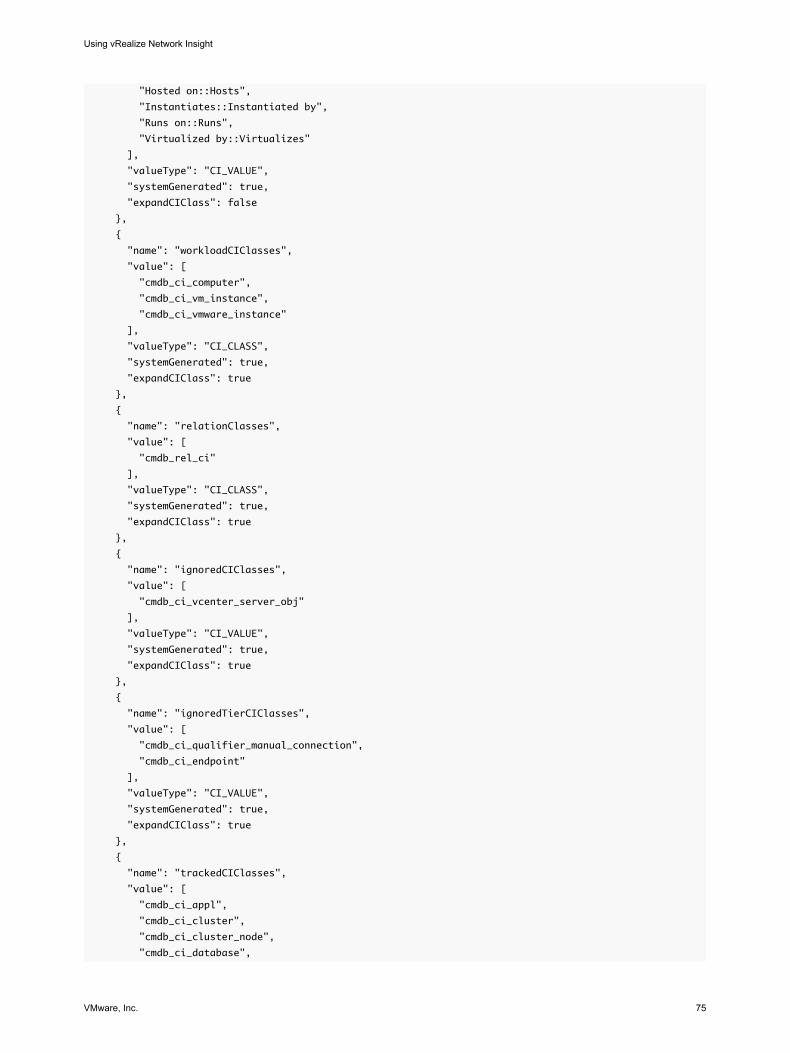
"Hosted on::Hosts",
"Instantiates::Instantiated by",
"Runs on::Runs",
"Virtualized by::Virtualizes"
],
"valueType": "CI_VALUE",
"systemGenerated": true,
"expandCIClass": false
},
{
"name": "workloadCIClasses",
"value": [
"cmdb_ci_computer",
"cmdb_ci_vm_instance",
"cmdb_ci_vmware_instance"
],
"valueType": "CI_CLASS",
"systemGenerated": true,
"expandCIClass": true
},
{
"name": "relationClasses",
"value": [
"cmdb_rel_ci"
],
"valueType": "CI_CLASS",
"systemGenerated": true,
"expandCIClass": true
},
{
"name": "ignoredCIClasses",
"value": [
"cmdb_ci_vcenter_server_obj"
],
"valueType": "CI_VALUE",
"systemGenerated": true,
"expandCIClass": true
},
{
"name": "ignoredTierCIClasses",
"value": [
"cmdb_ci_qualifier_manual_connection",
"cmdb_ci_endpoint"
],
"valueType": "CI_VALUE",
"systemGenerated": true,
"expandCIClass": true
},
{
"name": "trackedCIClasses",
"value": [
"cmdb_ci_appl",
"cmdb_ci_cluster",
"cmdb_ci_cluster_node",
"cmdb_ci_database",
Using vRealize Network Insight
VMware, Inc. 75
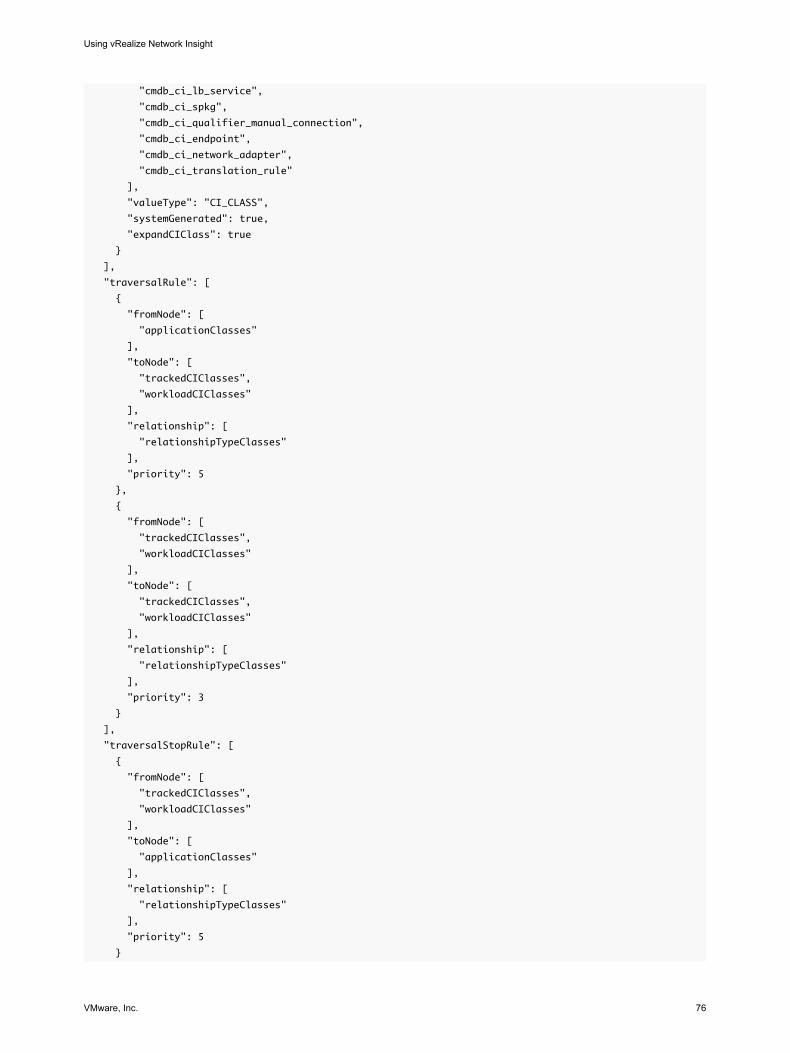
"cmdb_ci_lb_service",
"cmdb_ci_spkg",
"cmdb_ci_qualifier_manual_connection",
"cmdb_ci_endpoint",
"cmdb_ci_network_adapter",
"cmdb_ci_translation_rule"
],
"valueType": "CI_CLASS",
"systemGenerated": true,
"expandCIClass": true
}
],
"traversalRule": [
{
"fromNode": [
"applicationClasses"
],
"toNode": [
"trackedCIClasses",
"workloadCIClasses"
],
"relationship": [
"relationshipTypeClasses"
],
"priority": 5
},
{
"fromNode": [
"trackedCIClasses",
"workloadCIClasses"
],
"toNode": [
"trackedCIClasses",
"workloadCIClasses"
],
"relationship": [
"relationshipTypeClasses"
],
"priority": 3
}
],
"traversalStopRule": [
{
"fromNode": [
"trackedCIClasses",
"workloadCIClasses"
],
"toNode": [
"applicationClasses"
],
"relationship": [
"relationshipTypeClasses"
],
"priority": 5
}
Using vRealize Network Insight
VMware, Inc. 76
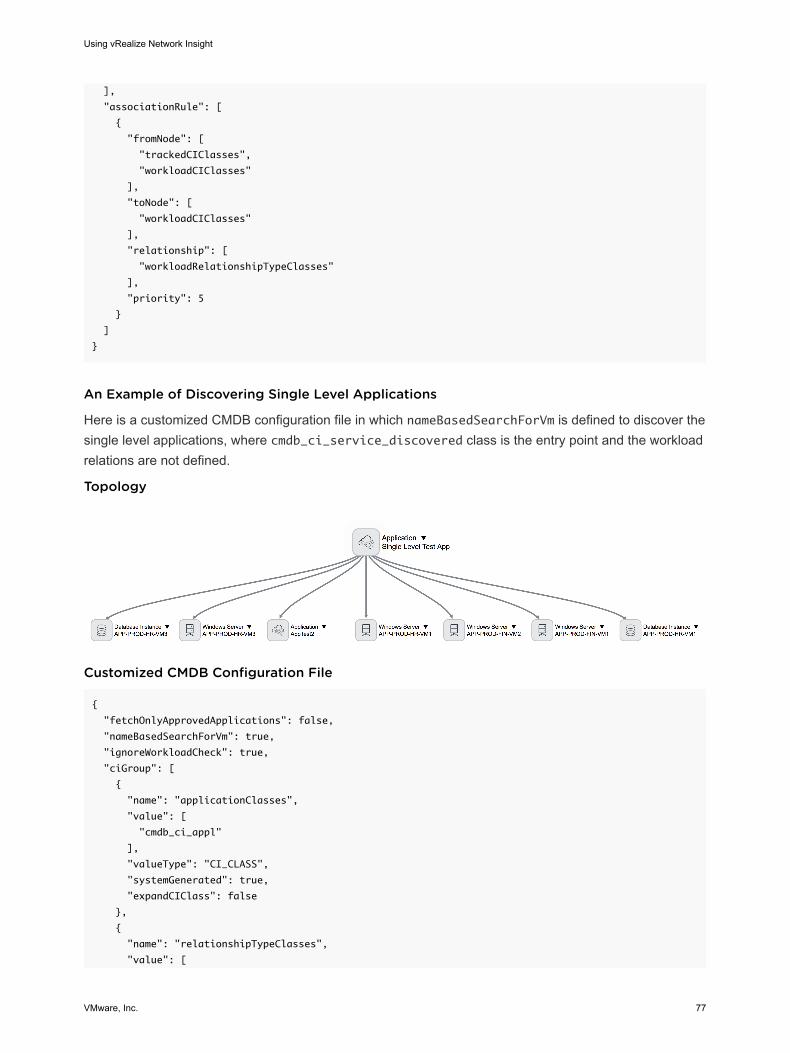
],
"associationRule": [
{
"fromNode": [
"trackedCIClasses",
"workloadCIClasses"
],
"toNode": [
"workloadCIClasses"
],
"relationship": [
"workloadRelationshipTypeClasses"
],
"priority": 5
}
]
}
An Example of Discovering Single Level Applications
Here is a customized CMDB configuration file in which nameBasedSearchForVm is defined to discover the single level applications, where cmdb_ci_service_discovered class is the entry point and the workload relations are not defined.
Topology
Customized CMDB Configuration File
{
"fetchOnlyApprovedApplications": false,
"nameBasedSearchForVm": true,
"ignoreWorkloadCheck": true,
"ciGroup": [
{
"name": "applicationClasses",
"value": [
"cmdb_ci_appl"
],
"valueType": "CI_CLASS",
"systemGenerated": true,
"expandCIClass": false
},
{
"name": "relationshipTypeClasses",
"value": [
Using vRealize Network Insight
VMware, Inc. 77
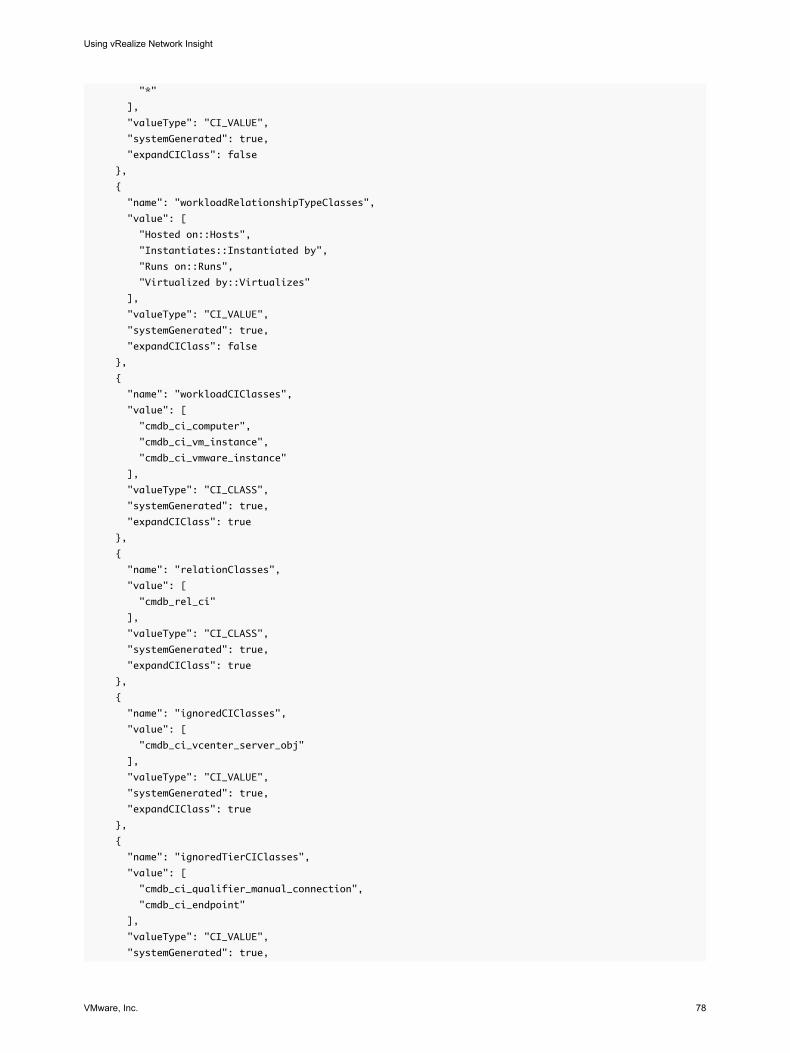
"*"
],
"valueType": "CI_VALUE",
"systemGenerated": true,
"expandCIClass": false
},
{
"name": "workloadRelationshipTypeClasses",
"value": [
"Hosted on::Hosts",
"Instantiates::Instantiated by",
"Runs on::Runs",
"Virtualized by::Virtualizes"
],
"valueType": "CI_VALUE",
"systemGenerated": true,
"expandCIClass": false
},
{
"name": "workloadCIClasses",
"value": [
"cmdb_ci_computer",
"cmdb_ci_vm_instance",
"cmdb_ci_vmware_instance"
],
"valueType": "CI_CLASS",
"systemGenerated": true,
"expandCIClass": true
},
{
"name": "relationClasses",
"value": [
"cmdb_rel_ci"
],
"valueType": "CI_CLASS",
"systemGenerated": true,
"expandCIClass": true
},
{
"name": "ignoredCIClasses",
"value": [
"cmdb_ci_vcenter_server_obj"
],
"valueType": "CI_VALUE",
"systemGenerated": true,
"expandCIClass": true
},
{
"name": "ignoredTierCIClasses",
"value": [
"cmdb_ci_qualifier_manual_connection",
"cmdb_ci_endpoint"
],
"valueType": "CI_VALUE",
"systemGenerated": true,
Using vRealize Network Insight
VMware, Inc. 78
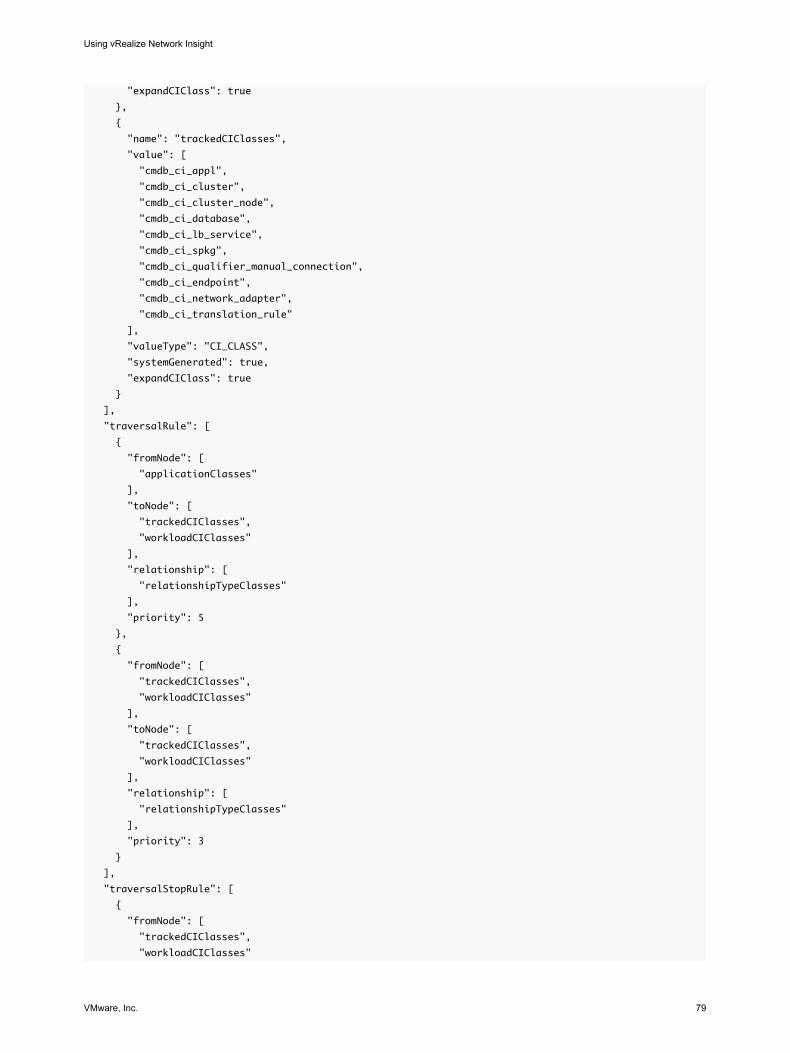
"expandCIClass": true
},
{
"name": "trackedCIClasses",
"value": [
"cmdb_ci_appl",
"cmdb_ci_cluster",
"cmdb_ci_cluster_node",
"cmdb_ci_database",
"cmdb_ci_lb_service",
"cmdb_ci_spkg",
"cmdb_ci_qualifier_manual_connection",
"cmdb_ci_endpoint",
"cmdb_ci_network_adapter",
"cmdb_ci_translation_rule"
],
"valueType": "CI_CLASS",
"systemGenerated": true,
"expandCIClass": true
}
],
"traversalRule": [
{
"fromNode": [
"applicationClasses"
],
"toNode": [
"trackedCIClasses",
"workloadCIClasses"
],
"relationship": [
"relationshipTypeClasses"
],
"priority": 5
},
{
"fromNode": [
"trackedCIClasses",
"workloadCIClasses"
],
"toNode": [
"trackedCIClasses",
"workloadCIClasses"
],
"relationship": [
"relationshipTypeClasses"
],
"priority": 3
}
],
"traversalStopRule": [
{
"fromNode": [
"trackedCIClasses",
"workloadCIClasses"
Using vRealize Network Insight
VMware, Inc. 79
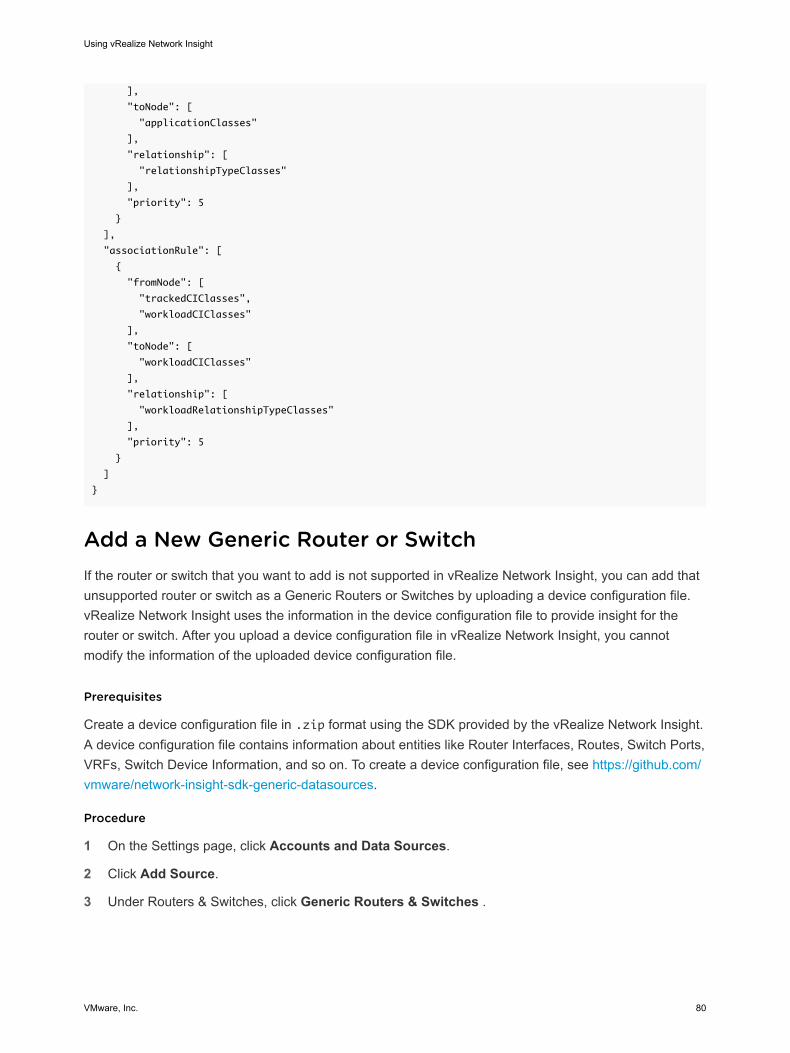
],
"toNode": [
"applicationClasses"
],
"relationship": [
"relationshipTypeClasses"
],
"priority": 5
}
],
"associationRule": [
{
"fromNode": [
"trackedCIClasses",
"workloadCIClasses"
],
"toNode": [
"workloadCIClasses"
],
"relationship": [
"workloadRelationshipTypeClasses"
],
"priority": 5
}
]
}
Add a New Generic Router or SwitchIf the router or switch that you want to add is not supported in vRealize Network Insight, you can add that unsupported router or switch as a Generic Routers or Switches by uploading a device configuration file. vRealize Network Insight uses the information in the device configuration file to provide insight for the router or switch. After you upload a device configuration file in vRealize Network Insight, you cannot modify the information of the uploaded device configuration file.
Prerequisites
Create a device configuration file in .zip format using the SDK provided by the vRealize Network Insight. A device configuration file contains information about entities like Router Interfaces, Routes, Switch Ports, VRFs, Switch Device Information, and so on. To create a device configuration file, see https://github.com/vmware/network-insight-sdk-generic-datasources.
Procedure
1 On the Settings page, click Accounts and Data Sources.
2 Click Add Source.
3 Under Routers & Switches, click Generic Routers & Switches .
Using vRealize Network Insight
VMware, Inc. 80
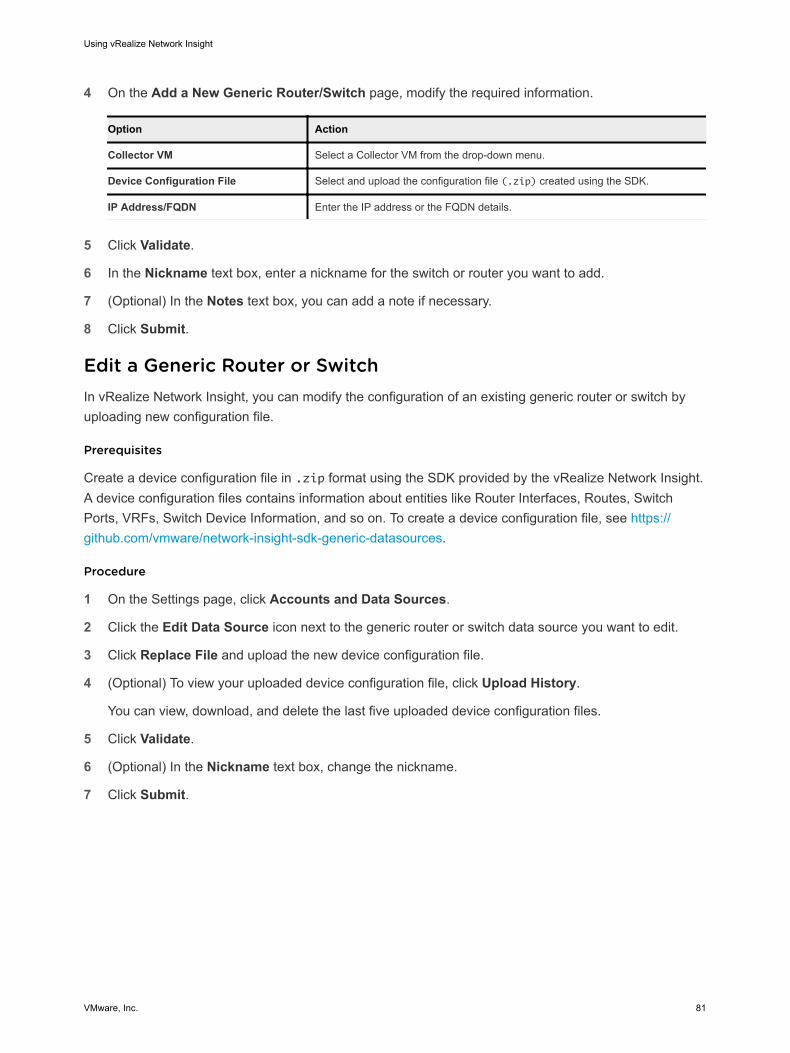
4 On the Add a New Generic Router/Switch page, modify the required information.
Option Action
Collector VM Select a Collector VM from the drop-down menu.
Device Configuration File Select and upload the configuration file (.zip) created using the SDK.
IP Address/FQDN Enter the IP address or the FQDN details.
5 Click Validate.
6 In the Nickname text box, enter a nickname for the switch or router you want to add.
7 (Optional) In the Notes text box, you can add a note if necessary.
8 Click Submit.
Edit a Generic Router or SwitchIn vRealize Network Insight, you can modify the configuration of an existing generic router or switch by uploading new configuration file.
Prerequisites
Create a device configuration file in .zip format using the SDK provided by the vRealize Network Insight. A device configuration files contains information about entities like Router Interfaces, Routes, Switch Ports, VRFs, Switch Device Information, and so on. To create a device configuration file, see https://github.com/vmware/network-insight-sdk-generic-datasources.
Procedure
1 On the Settings page, click Accounts and Data Sources.
2 Click the Edit Data Source icon next to the generic router or switch data source you want to edit.
3 Click Replace File and upload the new device configuration file.
4 (Optional) To view your uploaded device configuration file, click Upload History.
You can view, download, and delete the last five uploaded device configuration files.
5 Click Validate.
6 (Optional) In the Nickname text box, change the nickname.
7 Click Submit.
Using vRealize Network Insight
VMware, Inc. 81
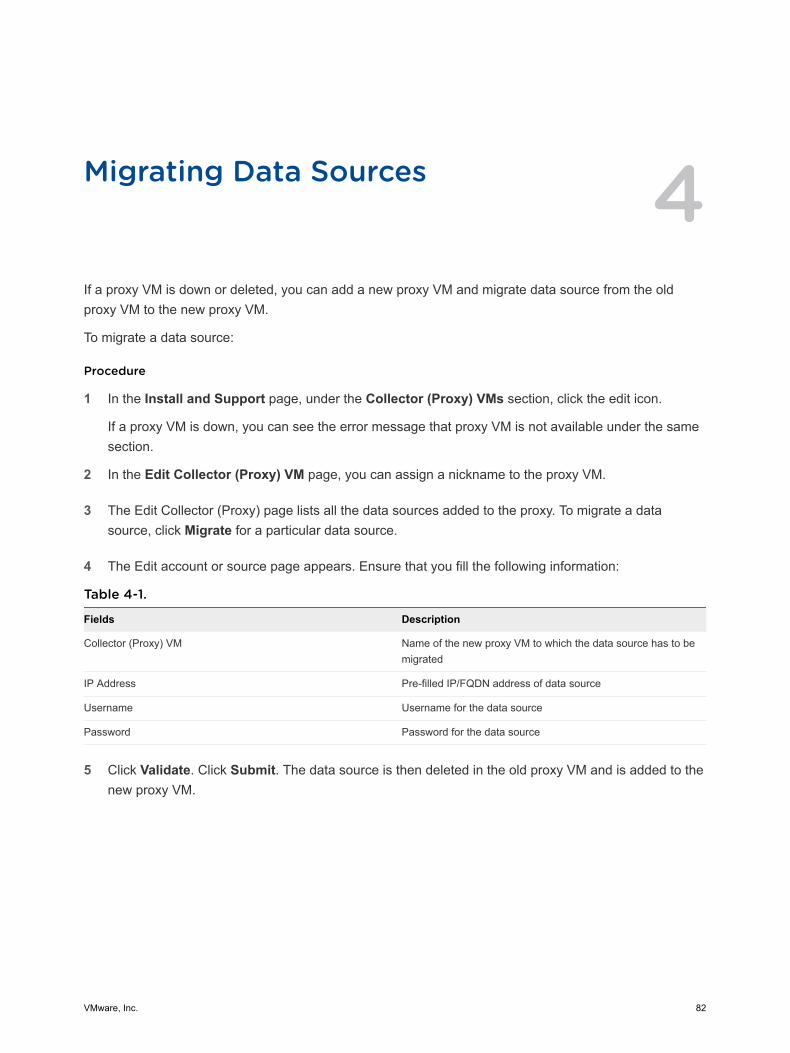
Migrating Data Sources 4If a proxy VM is down or deleted, you can add a new proxy VM and migrate data source from the old proxy VM to the new proxy VM.
To migrate a data source:
Procedure
1 In the Install and Support page, under the Collector (Proxy) VMs section, click the edit icon.
If a proxy VM is down, you can see the error message that proxy VM is not available under the same section.
2 In the Edit Collector (Proxy) VM page, you can assign a nickname to the proxy VM.
3 The Edit Collector (Proxy) page lists all the data sources added to the proxy. To migrate a data source, click Migrate for a particular data source.
4 The Edit account or source page appears. Ensure that you fill the following information:
Table 4-1.
Fields Description
Collector (Proxy) VM Name of the new proxy VM to which the data source has to be migrated
IP Address Pre-filled IP/FQDN address of data source
Username Username for the data source
Password Password for the data source
5 Click Validate. Click Submit. The data source is then deleted in the old proxy VM and is added to the new proxy VM.
VMware, Inc. 82
6 Once the migration is successful, you will see the new proxy VM against the data source in the Enabled column in the Accounts and Data Sources page.
Note n If you are migrating vCenter to another proxy VM, then sure that you migrate the corresponding
NSX Manager also to the same proxy VM.
n When you migrate NSX Manager to another proxy VM, the child data providers such as NSX Controller and NSX Edge are migrated as well to the new proxy VM.
Using vRealize Network Insight
VMware, Inc. 83
Delete a Data Source from vRealize Network Insight 5If you do not want to view data from a data source or a data source is not in use, you can delete the data source from vRealize Network Insight.
Note If any data source is no longer available in your environment, you must delete that data source form vRealize Network Insight.
Procedure
1 Sign in to the vRealize Network Insight web console.
2 Go to Settings > Accounts and Data Sources.
3 Click the Delete Data Source icon next to the data source you want to delete.
The vRealize Network Insight prompts you for confirmation.
4 Click Yes.
Note After you remove a data source from the system, you can add the same data provider back only after two or more hours.
VMware, Inc. 84
Configuring vRealize Network Insight Settings 6You can configure various aspects of vRealize Network Insight from the Settings page. To access the Settings page, click Profile > Settings.
This chapter includes the following topics:
n Viewing System Health
n Configure Data Retention Interval
n Configuring IP Properties and Subnets
n Configuring Events and Notifications
n Configuring Identity and Access management
n Configuring Logs
n Configure Mail Server
n Configure SNMP Trap Destination
n Managing Licenses
n Configure Auto-Refresh Interval
n Configure User Session Timeout
n Add Google Maps API Key
n Configure Data Source Certificate Validation
n View the Audit Logs
n Join or Leave the Customer Experience Improvement Program
n Viewing Health of your Setup
n Enabling the Support Tunnel
n Managing your Disk Utilization
n View the Node Details
n Create a Support Bundle
n Understanding Capacity for Collector and Platform Load
VMware, Inc. 85
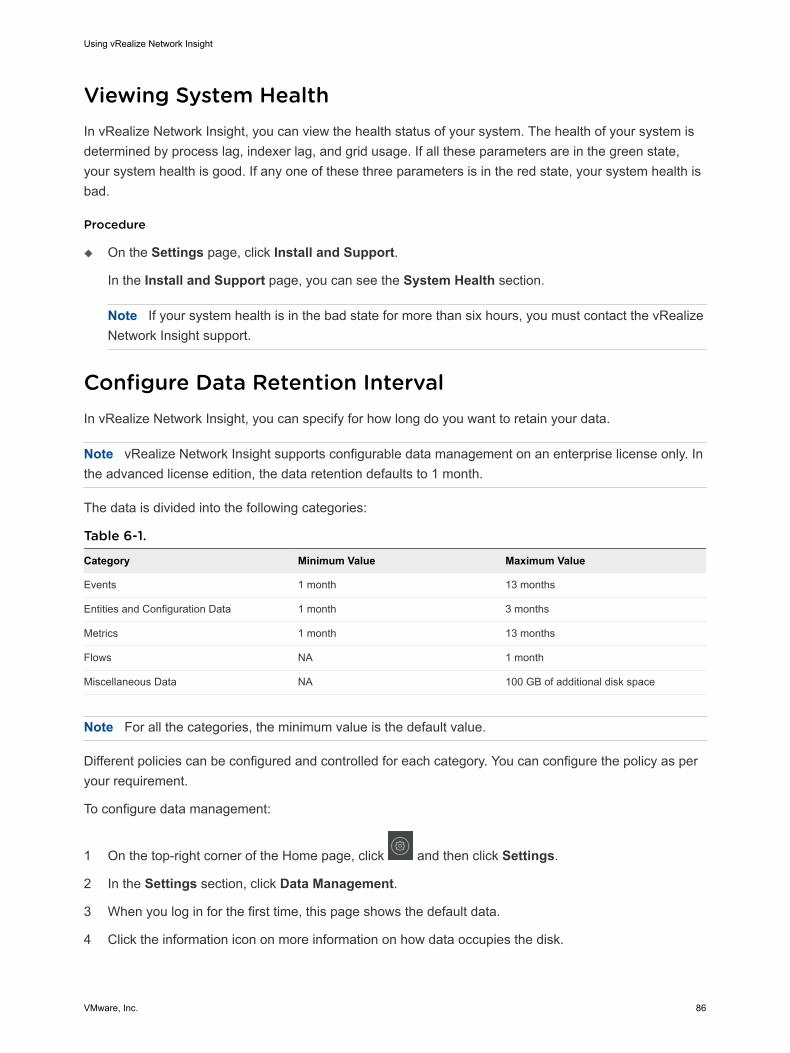
Viewing System HealthIn vRealize Network Insight, you can view the health status of your system. The health of your system is determined by process lag, indexer lag, and grid usage. If all these parameters are in the green state, your system health is good. If any one of these three parameters is in the red state, your system health is bad.
Procedure
u On the Settings page, click Install and Support.
In the Install and Support page, you can see the System Health section.
Note If your system health is in the bad state for more than six hours, you must contact the vRealize Network Insight support.
Configure Data Retention IntervalIn vRealize Network Insight, you can specify for how long do you want to retain your data.
Note vRealize Network Insight supports configurable data management on an enterprise license only. In the advanced license edition, the data retention defaults to 1 month.
The data is divided into the following categories:
Table 6-1.
Category Minimum Value Maximum Value
Events 1 month 13 months
Entities and Configuration Data 1 month 3 months
Metrics 1 month 13 months
Flows NA 1 month
Miscellaneous Data NA 100 GB of additional disk space
Note For all the categories, the minimum value is the default value.
Different policies can be configured and controlled for each category. You can configure the policy as per your requirement.
To configure data management:
1 On the top-right corner of the Home page, click and then click Settings.
2 In the Settings section, click Data Management.
3 When you log in for the first time, this page shows the default data.
4 Click the information icon on more information on how data occupies the disk.
Using vRealize Network Insight
VMware, Inc. 86
5 Click Change Policy to change the data retention period for the various categories of data. Once you make the changes, the information is recorded in the database.
6 Click Submit.
Note The retention period for low-resolution metrics is longer than the high-resolution metrics.
Configuring IP Properties and SubnetsIn vRealize Network Insight, you can configure different IP properties for better security planing and identification.
Import the DNS mapping fileTo provide the information for the flows between physical devices, you can import the DNS mapping file. The supported formats for the DNS mapping file are the Bind and CSV file format. Ensure that you have placed these files in a single ZIP file.
Note vRealize Network Insight does not support the password-protected ZIP files.
Procedure
1 In the Settings page, click IP Properties and Subnets..
2 Click Physical IP and DNS Mapping.
3 Click Upload and Replace to upload your DNS mapping file. After you select and upload the file, click Validate. The number of DNS records is displayed after the validation.
The Upload and Replace operation removes any existing DNS mappings and replaces them with the the mappings that are being imported. The DNS Mapping file consists of the following three fields:
n Host Name
n IP Address
n Domain Name
Configure Mapping Between Subnet and a VLANYou can define a mapping between subnet and a VLAN.
You can use this mapping for the following:
n Enriching the information about the IP entities that are learned from physical to physical flows by adding the source and destination subnets and the Layer2 networks associated with the flow.
n Planning the network topology based on the subnet and VLAN for physical addresses.
Using vRealize Network Insight
VMware, Inc. 87
Procedure
1 In the Settings page, click IP Properties and Subnets..
2 Click Physical IP and DNS Mapping.
3 In the Settings page, under IP Properties and Subnets, click Physical Subnets and VLANs.
This page lists all the subnets and the associated VLAN IDs.
4 Click Add to add the subnet and VLAN information.
5 After defining the mapping information, you can only edit the VLAN ID that is associated with the subnet. It is not possible to change to the subnet CIDR associated with the VLAN Id. To edit a subnet associated with the VLAN ID, delete the subnet to be edited and create a subnet VLAN mapping with the required values.
When the subnet-VLAN mapping information is updated, a new VLAN is created for the specified VLAN ID and the subnet information is associated with this VLAN.
6 To delete the subnet-VLAN ID mapping, click the delete icon.
Note All VLAN creation, updation, and deletion operations do not happen immediately after the subnet and VLAN mappings are created. It takes some time for the changes to be propagated and the corresponding VLAN being to be created or modified.
Configure East-West IPsThe IPs that are within the range of RFC1918 standard are considered private IPs. The IPs that are outside the RFC1918 are treated as Internet IPs. However, users can specify their East-West IPs (datacenter public IPs) that they want to be treated as non-Internet IPs while tagging flows and micro-segmentation, even if these are outside the private IP address range as defined by RFC1918.
To specify public IPs to be treated as non-internet IPs
1 On the top-right corner of Home page, click the Profile icon, and then click Settings.
2 In the Settings section, click East-West IPs.
3 In the IP Addresses box, enter specific IPs, or IP ranges, or subnets, which are to be treated as non-internet IPs.
4 Click Save. The IP Addresses Saved confirmation message is displayed upon successful saving.
Configure North-South IPsThe IPs that are in the RFC1918 space are categorized as North-South IPs. The users can specify their North-South IPs while tagging flows and micro-segmentation.
To specify North-South IPs:
1 On the top-right corner of Home page, click the Profile icon , and then click Settings.
Using vRealize Network Insight
VMware, Inc. 88
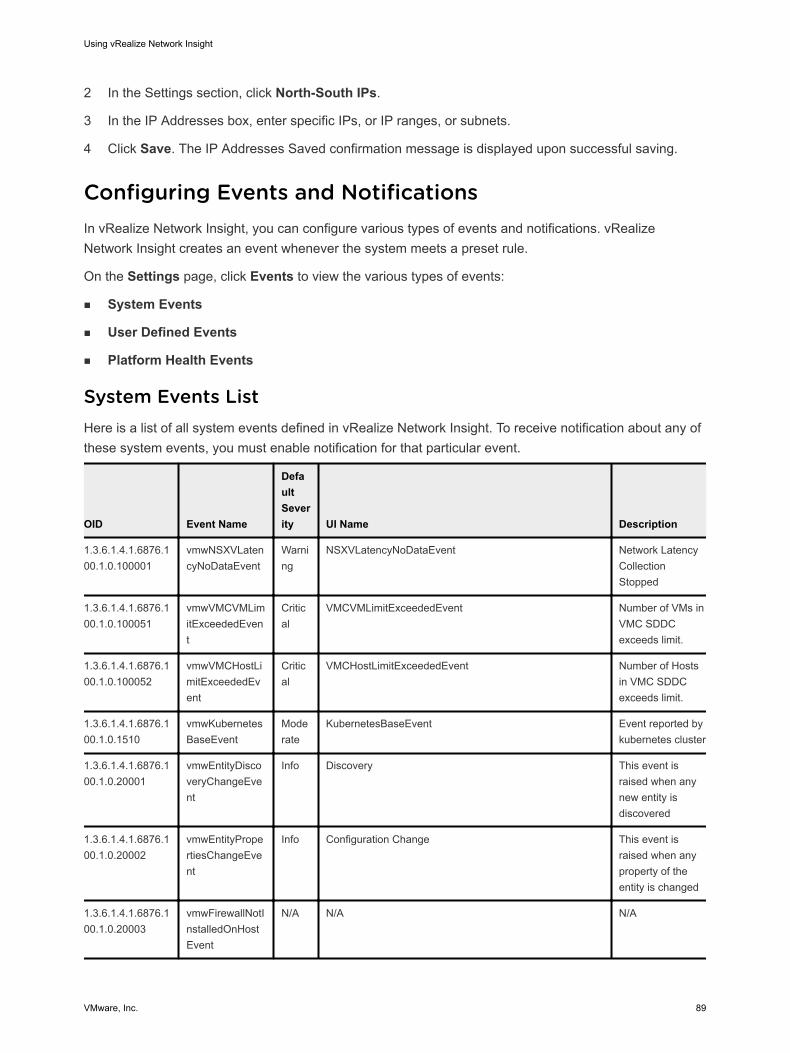
2 In the Settings section, click North-South IPs.
3 In the IP Addresses box, enter specific IPs, or IP ranges, or subnets.
4 Click Save. The IP Addresses Saved confirmation message is displayed upon successful saving.
Configuring Events and NotificationsIn vRealize Network Insight, you can configure various types of events and notifications. vRealize Network Insight creates an event whenever the system meets a preset rule.
On the Settings page, click Events to view the various types of events:
n System Events
n User Defined Events
n Platform Health Events
System Events ListHere is a list of all system events defined in vRealize Network Insight. To receive notification about any of these system events, you must enable notification for that particular event.
OID Event Name
Default Severity UI Name Description
1.3.6.1.4.1.6876.100.1.0.100001
vmwNSXVLatencyNoDataEvent
Warning
NSXVLatencyNoDataEvent Network Latency Collection Stopped
1.3.6.1.4.1.6876.100.1.0.100051
vmwVMCVMLimitExceededEvent
Critical
VMCVMLimitExceededEvent Number of VMs in VMC SDDC exceeds limit.
1.3.6.1.4.1.6876.100.1.0.100052
vmwVMCHostLimitExceededEvent
Critical
VMCHostLimitExceededEvent Number of Hosts in VMC SDDC exceeds limit.
1.3.6.1.4.1.6876.100.1.0.1510
vmwKubernetesBaseEvent
Moderate
KubernetesBaseEvent Event reported by kubernetes cluster
1.3.6.1.4.1.6876.100.1.0.20001
vmwEntityDiscoveryChangeEvent
Info Discovery This event is raised when any new entity is discovered
1.3.6.1.4.1.6876.100.1.0.20002
vmwEntityPropertiesChangeEvent
Info Configuration Change This event is raised when any property of the entity is changed
1.3.6.1.4.1.6876.100.1.0.20003
vmwFirewallNotInstalledOnHostEvent
N/A N/A N/A
Using vRealize Network Insight
VMware, Inc. 89
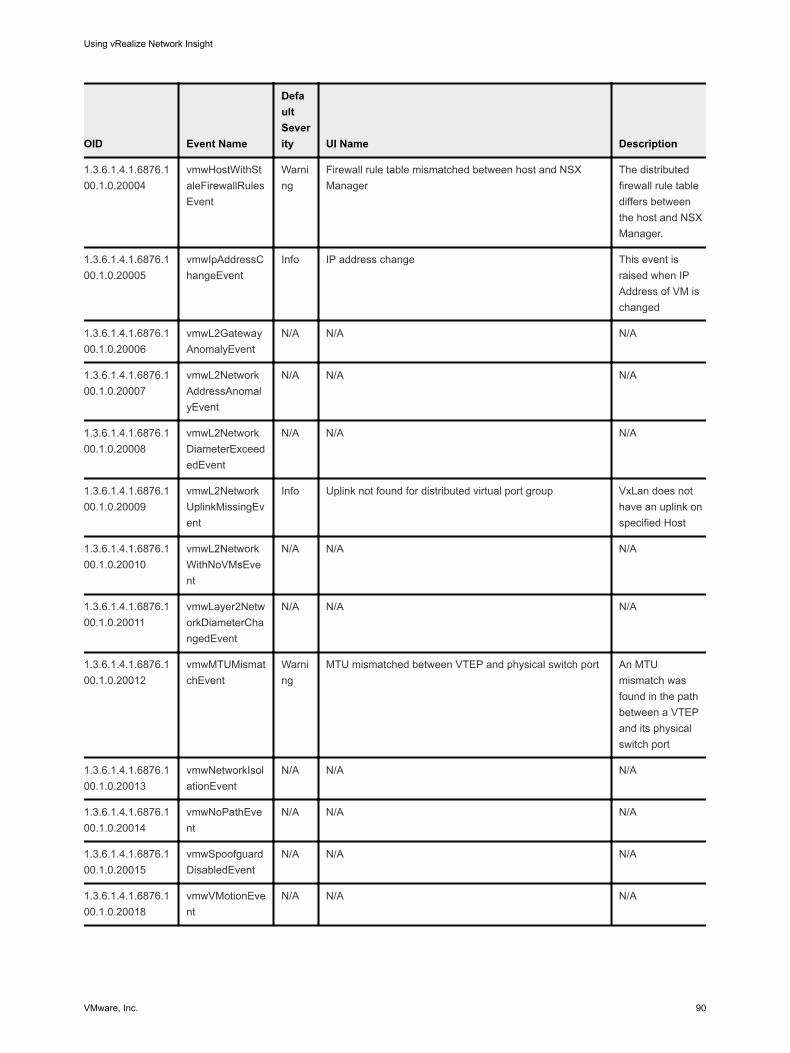
OID Event Name
Default Severity UI Name Description
1.3.6.1.4.1.6876.100.1.0.20004
vmwHostWithStaleFirewallRulesEvent
Warning
Firewall rule table mismatched between host and NSX Manager
The distributed firewall rule table differs between the host and NSX Manager.
1.3.6.1.4.1.6876.100.1.0.20005
vmwIpAddressChangeEvent
Info IP address change This event is raised when IP Address of VM is changed
1.3.6.1.4.1.6876.100.1.0.20006
vmwL2GatewayAnomalyEvent
N/A N/A N/A
1.3.6.1.4.1.6876.100.1.0.20007
vmwL2NetworkAddressAnomalyEvent
N/A N/A N/A
1.3.6.1.4.1.6876.100.1.0.20008
vmwL2NetworkDiameterExceededEvent
N/A N/A N/A
1.3.6.1.4.1.6876.100.1.0.20009
vmwL2NetworkUplinkMissingEvent
Info Uplink not found for distributed virtual port group VxLan does not have an uplink on specified Host
1.3.6.1.4.1.6876.100.1.0.20010
vmwL2NetworkWithNoVMsEvent
N/A N/A N/A
1.3.6.1.4.1.6876.100.1.0.20011
vmwLayer2NetworkDiameterChangedEvent
N/A N/A N/A
1.3.6.1.4.1.6876.100.1.0.20012
vmwMTUMismatchEvent
Warning
MTU mismatched between VTEP and physical switch port An MTU mismatch was found in the path between a VTEP and its physical switch port
1.3.6.1.4.1.6876.100.1.0.20013
vmwNetworkIsolationEvent
N/A N/A N/A
1.3.6.1.4.1.6876.100.1.0.20014
vmwNoPathEvent
N/A N/A N/A
1.3.6.1.4.1.6876.100.1.0.20015
vmwSpoofguardDisabledEvent
N/A N/A N/A
1.3.6.1.4.1.6876.100.1.0.20018
vmwVMotionEvent
N/A N/A N/A
Using vRealize Network Insight
VMware, Inc. 90
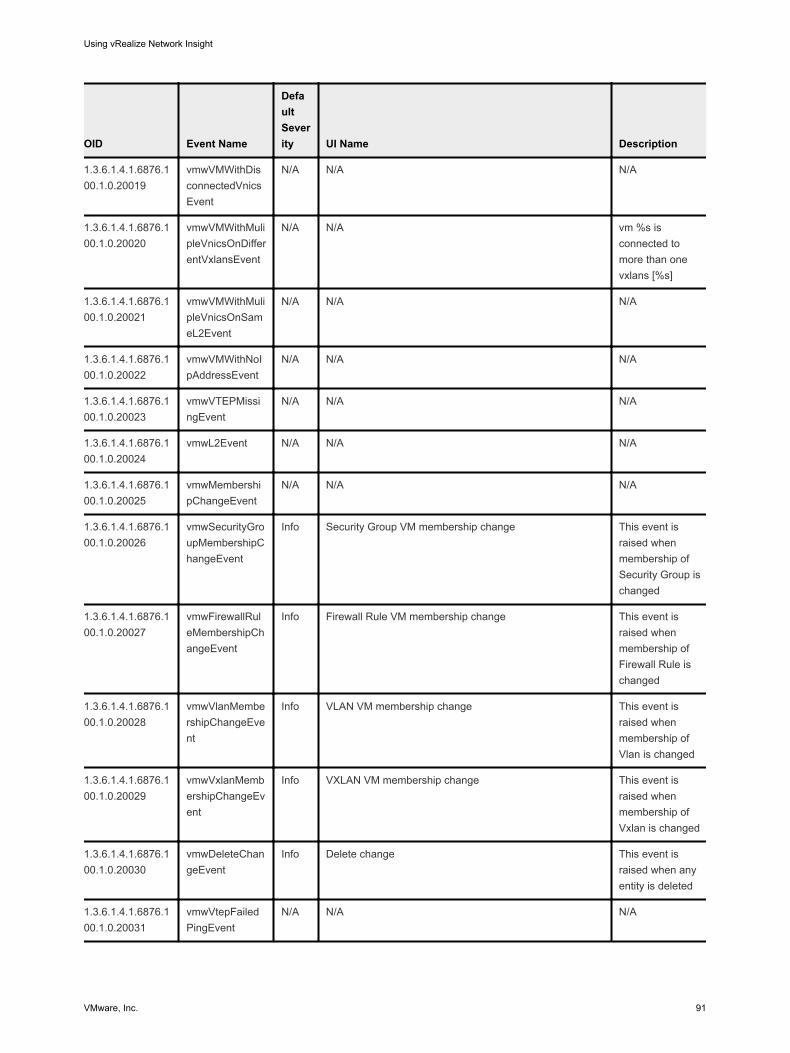
OID Event Name
Default Severity UI Name Description
1.3.6.1.4.1.6876.100.1.0.20019
vmwVMWithDisconnectedVnicsEvent
N/A N/A N/A
1.3.6.1.4.1.6876.100.1.0.20020
vmwVMWithMulipleVnicsOnDifferentVxlansEvent
N/A N/A vm %s is connected to more than one vxlans [%s]
1.3.6.1.4.1.6876.100.1.0.20021
vmwVMWithMulipleVnicsOnSameL2Event
N/A N/A N/A
1.3.6.1.4.1.6876.100.1.0.20022
vmwVMWithNoIpAddressEvent
N/A N/A N/A
1.3.6.1.4.1.6876.100.1.0.20023
vmwVTEPMissingEvent
N/A N/A N/A
1.3.6.1.4.1.6876.100.1.0.20024
vmwL2Event N/A N/A N/A
1.3.6.1.4.1.6876.100.1.0.20025
vmwMembershipChangeEvent
N/A N/A N/A
1.3.6.1.4.1.6876.100.1.0.20026
vmwSecurityGroupMembershipChangeEvent
Info Security Group VM membership change This event is raised when membership of Security Group is changed
1.3.6.1.4.1.6876.100.1.0.20027
vmwFirewallRuleMembershipChangeEvent
Info Firewall Rule VM membership change This event is raised when membership of Firewall Rule is changed
1.3.6.1.4.1.6876.100.1.0.20028
vmwVlanMembershipChangeEvent
Info VLAN VM membership change This event is raised when membership of Vlan is changed
1.3.6.1.4.1.6876.100.1.0.20029
vmwVxlanMembershipChangeEvent
Info VXLAN VM membership change This event is raised when membership of Vxlan is changed
1.3.6.1.4.1.6876.100.1.0.20030
vmwDeleteChangeEvent
Info Delete change This event is raised when any entity is deleted
1.3.6.1.4.1.6876.100.1.0.20031
vmwVtepFailedPingEvent
N/A N/A N/A
Using vRealize Network Insight
VMware, Inc. 91
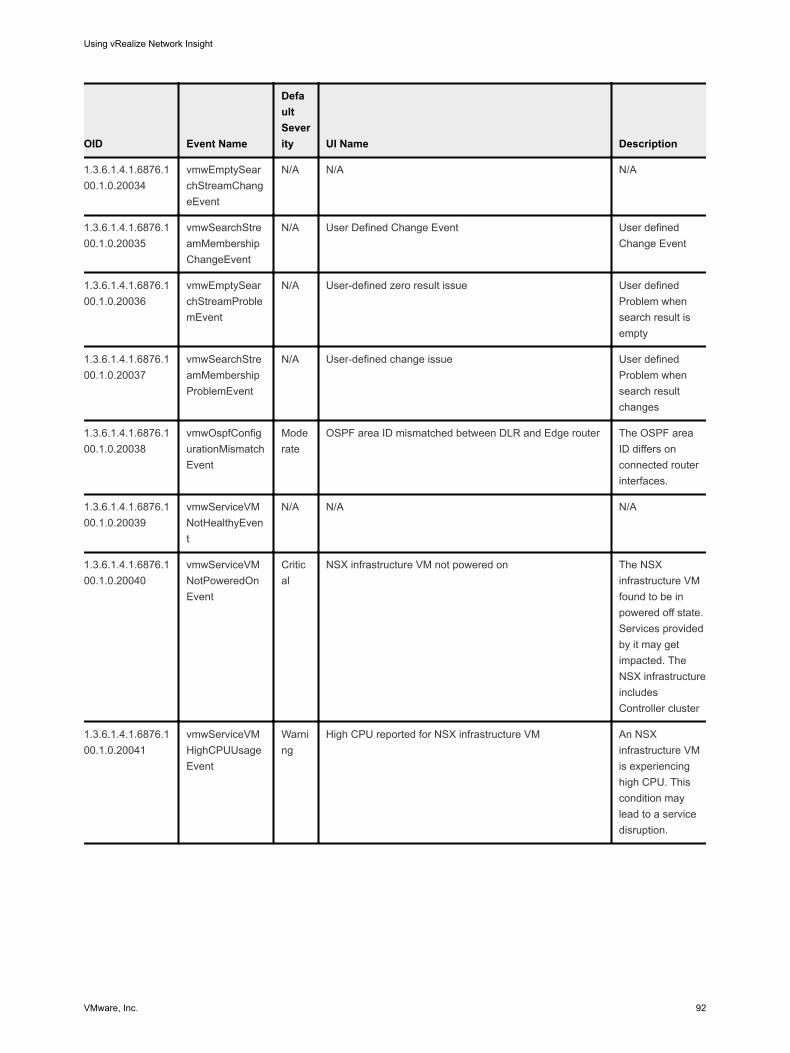
OID Event Name
Default Severity UI Name Description
1.3.6.1.4.1.6876.100.1.0.20034
vmwEmptySearchStreamChangeEvent
N/A N/A N/A
1.3.6.1.4.1.6876.100.1.0.20035
vmwSearchStreamMembershipChangeEvent
N/A User Defined Change Event User defined Change Event
1.3.6.1.4.1.6876.100.1.0.20036
vmwEmptySearchStreamProblemEvent
N/A User-defined zero result issue User defined Problem when search result is empty
1.3.6.1.4.1.6876.100.1.0.20037
vmwSearchStreamMembershipProblemEvent
N/A User-defined change issue User defined Problem when search result changes
1.3.6.1.4.1.6876.100.1.0.20038
vmwOspfConfigurationMismatchEvent
Moderate
OSPF area ID mismatched between DLR and Edge router The OSPF area ID differs on connected router interfaces.
1.3.6.1.4.1.6876.100.1.0.20039
vmwServiceVMNotHealthyEvent
N/A N/A N/A
1.3.6.1.4.1.6876.100.1.0.20040
vmwServiceVMNotPoweredOnEvent
Critical
NSX infrastructure VM not powered on The NSX infrastructure VM found to be in powered off state. Services provided by it may get impacted. The NSX infrastructure includes Controller cluster
1.3.6.1.4.1.6876.100.1.0.20041
vmwServiceVMHighCPUUsageEvent
Warning
High CPU reported for NSX infrastructure VM An NSX infrastructure VM is experiencing high CPU. This condition may lead to a service disruption.
Using vRealize Network Insight
VMware, Inc. 92
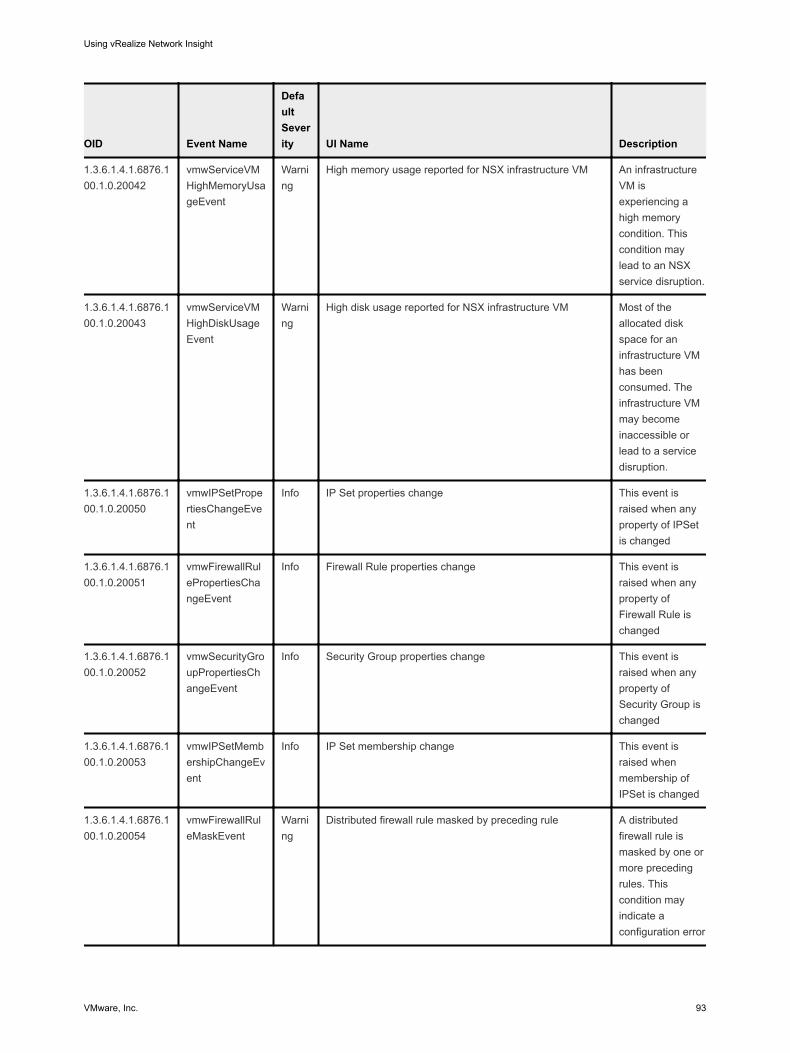
OID Event Name
Default Severity UI Name Description
1.3.6.1.4.1.6876.100.1.0.20042
vmwServiceVMHighMemoryUsageEvent
Warning
High memory usage reported for NSX infrastructure VM An infrastructure VM is experiencing a high memory condition. This condition may lead to an NSX service disruption.
1.3.6.1.4.1.6876.100.1.0.20043
vmwServiceVMHighDiskUsageEvent
Warning
High disk usage reported for NSX infrastructure VM Most of the allocated disk space for an infrastructure VM has been consumed. The infrastructure VM may become inaccessible or lead to a service disruption.
1.3.6.1.4.1.6876.100.1.0.20050
vmwIPSetPropertiesChangeEvent
Info IP Set properties change This event is raised when any property of IPSet is changed
1.3.6.1.4.1.6876.100.1.0.20051
vmwFirewallRulePropertiesChangeEvent
Info Firewall Rule properties change This event is raised when any property of Firewall Rule is changed
1.3.6.1.4.1.6876.100.1.0.20052
vmwSecurityGroupPropertiesChangeEvent
Info Security Group properties change This event is raised when any property of Security Group is changed
1.3.6.1.4.1.6876.100.1.0.20053
vmwIPSetMembershipChangeEvent
Info IP Set membership change This event is raised when membership of IPSet is changed
1.3.6.1.4.1.6876.100.1.0.20054
vmwFirewallRuleMaskEvent
Warning
Distributed firewall rule masked by preceding rule A distributed firewall rule is masked by one or more preceding rules. This condition may indicate a configuration error
Using vRealize Network Insight
VMware, Inc. 93
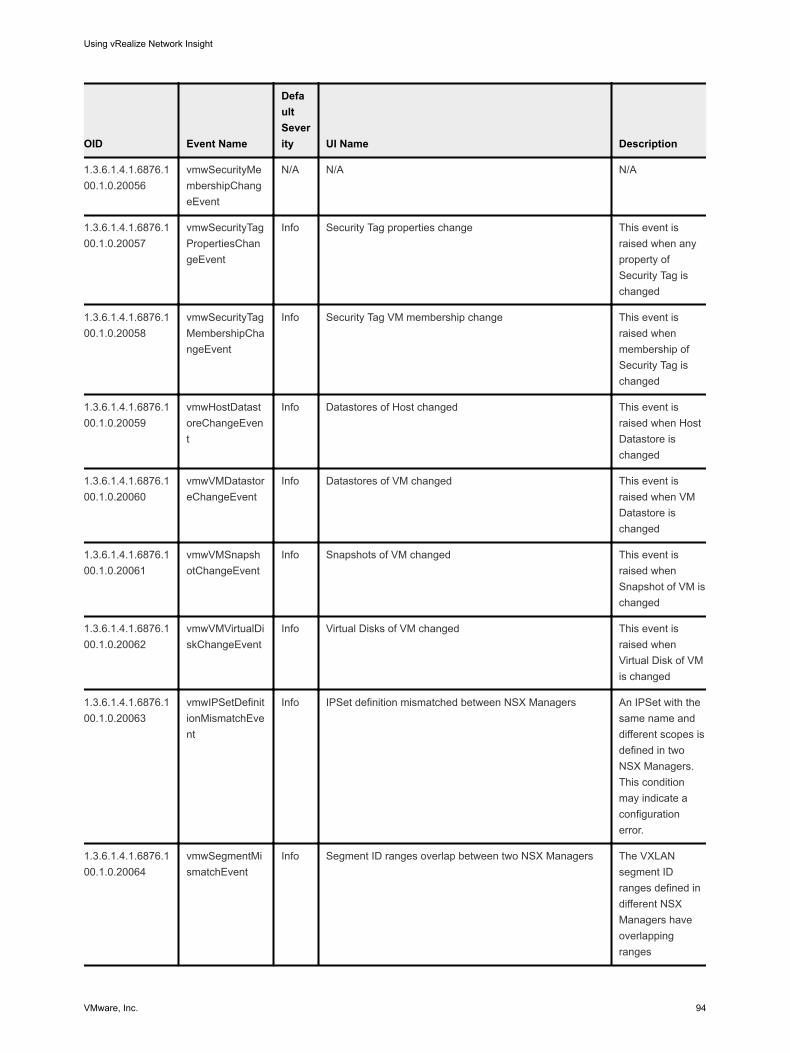
OID Event Name
Default Severity UI Name Description
1.3.6.1.4.1.6876.100.1.0.20056
vmwSecurityMembershipChangeEvent
N/A N/A N/A
1.3.6.1.4.1.6876.100.1.0.20057
vmwSecurityTagPropertiesChangeEvent
Info Security Tag properties change This event is raised when any property of Security Tag is changed
1.3.6.1.4.1.6876.100.1.0.20058
vmwSecurityTagMembershipChangeEvent
Info Security Tag VM membership change This event is raised when membership of Security Tag is changed
1.3.6.1.4.1.6876.100.1.0.20059
vmwHostDatastoreChangeEvent
Info Datastores of Host changed This event is raised when Host Datastore is changed
1.3.6.1.4.1.6876.100.1.0.20060
vmwVMDatastoreChangeEvent
Info Datastores of VM changed This event is raised when VM Datastore is changed
1.3.6.1.4.1.6876.100.1.0.20061
vmwVMSnapshotChangeEvent
Info Snapshots of VM changed This event is raised when Snapshot of VM is changed
1.3.6.1.4.1.6876.100.1.0.20062
vmwVMVirtualDiskChangeEvent
Info Virtual Disks of VM changed This event is raised when Virtual Disk of VM is changed
1.3.6.1.4.1.6876.100.1.0.20063
vmwIPSetDefinitionMismatchEvent
Info IPSet definition mismatched between NSX Managers An IPSet with the same name and different scopes is defined in two NSX Managers. This condition may indicate a configuration error.
1.3.6.1.4.1.6876.100.1.0.20064
vmwSegmentMismatchEvent
Info Segment ID ranges overlap between two NSX Managers The VXLAN segment ID ranges defined in different NSX Managers have overlapping ranges
Using vRealize Network Insight
VMware, Inc. 94
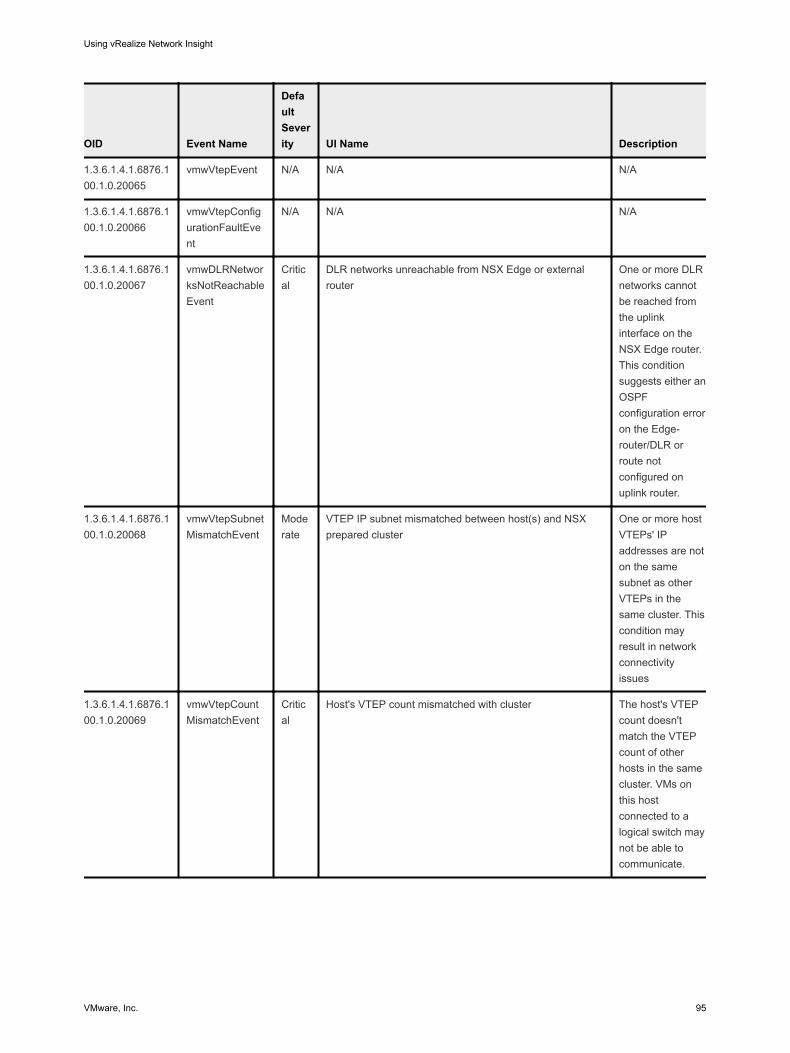
OID Event Name
Default Severity UI Name Description
1.3.6.1.4.1.6876.100.1.0.20065
vmwVtepEvent N/A N/A N/A
1.3.6.1.4.1.6876.100.1.0.20066
vmwVtepConfigurationFaultEvent
N/A N/A N/A
1.3.6.1.4.1.6876.100.1.0.20067
vmwDLRNetworksNotReachableEvent
Critical
DLR networks unreachable from NSX Edge or external router
One or more DLR networks cannot be reached from the uplink interface on the NSX Edge router. This condition suggests either an OSPF configuration error on the Edge-router/DLR or route not configured on uplink router.
1.3.6.1.4.1.6876.100.1.0.20068
vmwVtepSubnetMismatchEvent
Moderate
VTEP IP subnet mismatched between host(s) and NSX prepared cluster
One or more host VTEPs' IP addresses are not on the same subnet as other VTEPs in the same cluster. This condition may result in network connectivity issues
1.3.6.1.4.1.6876.100.1.0.20069
vmwVtepCountMismatchEvent
Critical
Host's VTEP count mismatched with cluster The host's VTEP count doesn't match the VTEP count of other hosts in the same cluster. VMs on this host connected to a logical switch may not be able to communicate.
Using vRealize Network Insight
VMware, Inc. 95
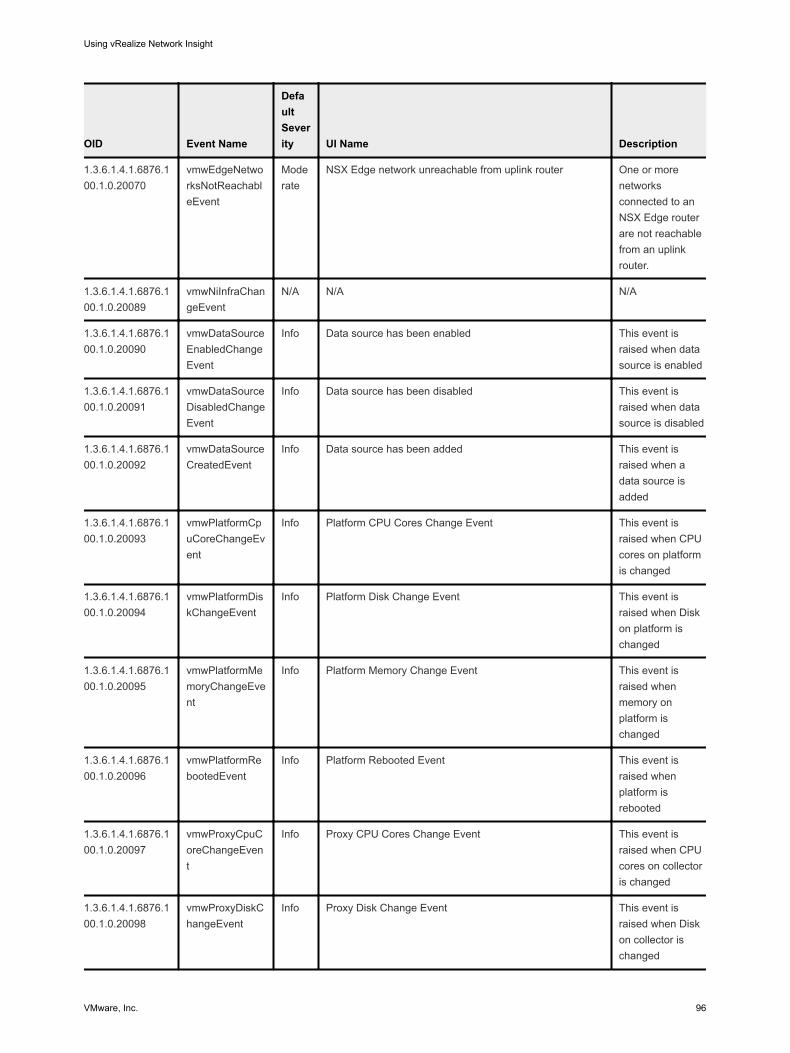
OID Event Name
Default Severity UI Name Description
1.3.6.1.4.1.6876.100.1.0.20070
vmwEdgeNetworksNotReachableEvent
Moderate
NSX Edge network unreachable from uplink router One or more networks connected to an NSX Edge router are not reachable from an uplink router.
1.3.6.1.4.1.6876.100.1.0.20089
vmwNiInfraChangeEvent
N/A N/A N/A
1.3.6.1.4.1.6876.100.1.0.20090
vmwDataSourceEnabledChangeEvent
Info Data source has been enabled This event is raised when data source is enabled
1.3.6.1.4.1.6876.100.1.0.20091
vmwDataSourceDisabledChangeEvent
Info Data source has been disabled This event is raised when data source is disabled
1.3.6.1.4.1.6876.100.1.0.20092
vmwDataSourceCreatedEvent
Info Data source has been added This event is raised when a data source is added
1.3.6.1.4.1.6876.100.1.0.20093
vmwPlatformCpuCoreChangeEvent
Info Platform CPU Cores Change Event This event is raised when CPU cores on platform is changed
1.3.6.1.4.1.6876.100.1.0.20094
vmwPlatformDiskChangeEvent
Info Platform Disk Change Event This event is raised when Disk on platform is changed
1.3.6.1.4.1.6876.100.1.0.20095
vmwPlatformMemoryChangeEvent
Info Platform Memory Change Event This event is raised when memory on platform is changed
1.3.6.1.4.1.6876.100.1.0.20096
vmwPlatformRebootedEvent
Info Platform Rebooted Event This event is raised when platform is rebooted
1.3.6.1.4.1.6876.100.1.0.20097
vmwProxyCpuCoreChangeEvent
Info Proxy CPU Cores Change Event This event is raised when CPU cores on collector is changed
1.3.6.1.4.1.6876.100.1.0.20098
vmwProxyDiskChangeEvent
Info Proxy Disk Change Event This event is raised when Disk on collector is changed
Using vRealize Network Insight
VMware, Inc. 96
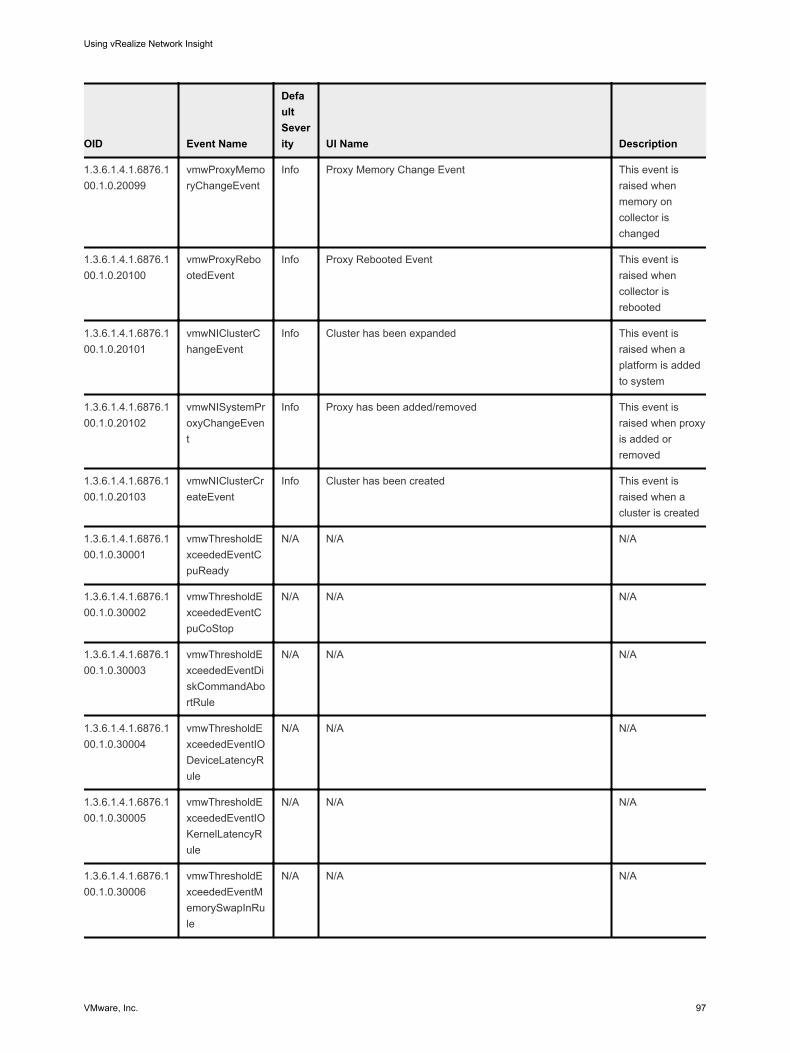
OID Event Name
Default Severity UI Name Description
1.3.6.1.4.1.6876.100.1.0.20099
vmwProxyMemoryChangeEvent
Info Proxy Memory Change Event This event is raised when memory on collector is changed
1.3.6.1.4.1.6876.100.1.0.20100
vmwProxyRebootedEvent
Info Proxy Rebooted Event This event is raised when collector is rebooted
1.3.6.1.4.1.6876.100.1.0.20101
vmwNIClusterChangeEvent
Info Cluster has been expanded This event is raised when a platform is added to system
1.3.6.1.4.1.6876.100.1.0.20102
vmwNISystemProxyChangeEvent
Info Proxy has been added/removed This event is raised when proxy is added or removed
1.3.6.1.4.1.6876.100.1.0.20103
vmwNIClusterCreateEvent
Info Cluster has been created This event is raised when a cluster is created
1.3.6.1.4.1.6876.100.1.0.30001
vmwThresholdExceededEventCpuReady
N/A N/A N/A
1.3.6.1.4.1.6876.100.1.0.30002
vmwThresholdExceededEventCpuCoStop
N/A N/A N/A
1.3.6.1.4.1.6876.100.1.0.30003
vmwThresholdExceededEventDiskCommandAbortRule
N/A N/A N/A
1.3.6.1.4.1.6876.100.1.0.30004
vmwThresholdExceededEventIODeviceLatencyRule
N/A N/A N/A
1.3.6.1.4.1.6876.100.1.0.30005
vmwThresholdExceededEventIOKernelLatencyRule
N/A N/A N/A
1.3.6.1.4.1.6876.100.1.0.30006
vmwThresholdExceededEventMemorySwapInRule
N/A N/A N/A
Using vRealize Network Insight
VMware, Inc. 97
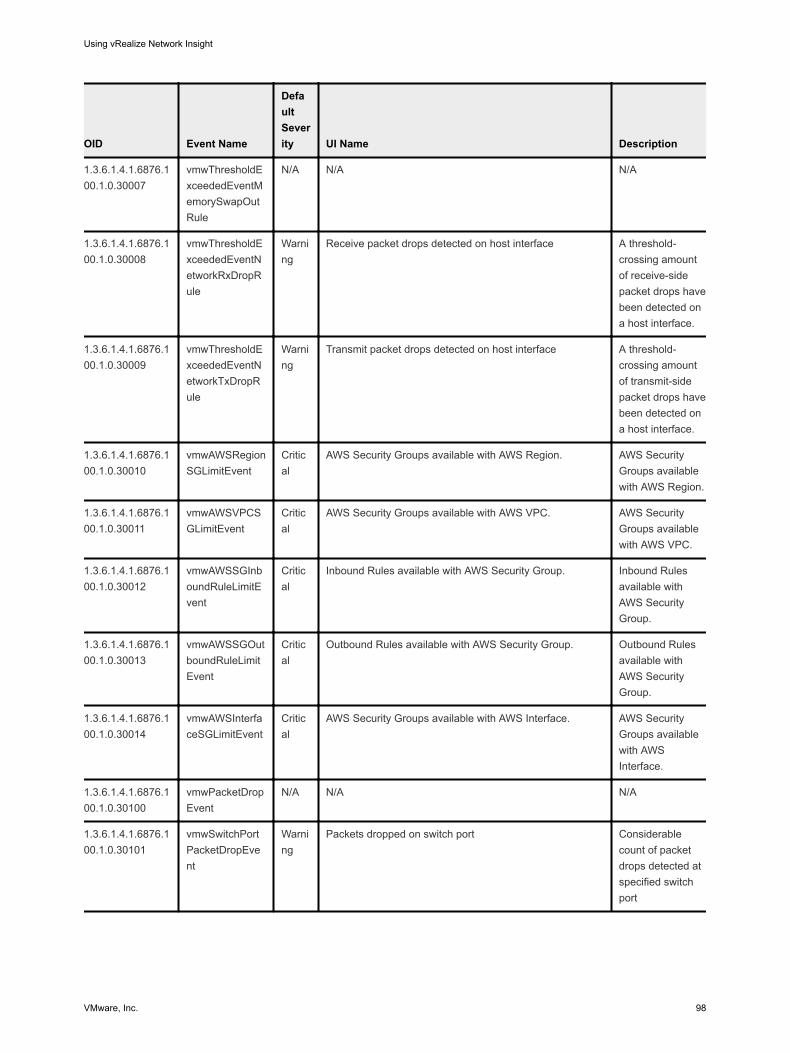
OID Event Name
Default Severity UI Name Description
1.3.6.1.4.1.6876.100.1.0.30007
vmwThresholdExceededEventMemorySwapOutRule
N/A N/A N/A
1.3.6.1.4.1.6876.100.1.0.30008
vmwThresholdExceededEventNetworkRxDropRule
Warning
Receive packet drops detected on host interface A threshold-crossing amount of receive-side packet drops have been detected on a host interface.
1.3.6.1.4.1.6876.100.1.0.30009
vmwThresholdExceededEventNetworkTxDropRule
Warning
Transmit packet drops detected on host interface A threshold-crossing amount of transmit-side packet drops have been detected on a host interface.
1.3.6.1.4.1.6876.100.1.0.30010
vmwAWSRegionSGLimitEvent
Critical
AWS Security Groups available with AWS Region. AWS Security Groups available with AWS Region.
1.3.6.1.4.1.6876.100.1.0.30011
vmwAWSVPCSGLimitEvent
Critical
AWS Security Groups available with AWS VPC. AWS Security Groups available with AWS VPC.
1.3.6.1.4.1.6876.100.1.0.30012
vmwAWSSGInboundRuleLimitEvent
Critical
Inbound Rules available with AWS Security Group. Inbound Rules available with AWS Security Group.
1.3.6.1.4.1.6876.100.1.0.30013
vmwAWSSGOutboundRuleLimitEvent
Critical
Outbound Rules available with AWS Security Group. Outbound Rules available with AWS Security Group.
1.3.6.1.4.1.6876.100.1.0.30014
vmwAWSInterfaceSGLimitEvent
Critical
AWS Security Groups available with AWS Interface. AWS Security Groups available with AWS Interface.
1.3.6.1.4.1.6876.100.1.0.30100
vmwPacketDropEvent
N/A N/A N/A
1.3.6.1.4.1.6876.100.1.0.30101
vmwSwitchPortPacketDropEvent
Warning
Packets dropped on switch port Considerable count of packet drops detected at specified switch port
Using vRealize Network Insight
VMware, Inc. 98
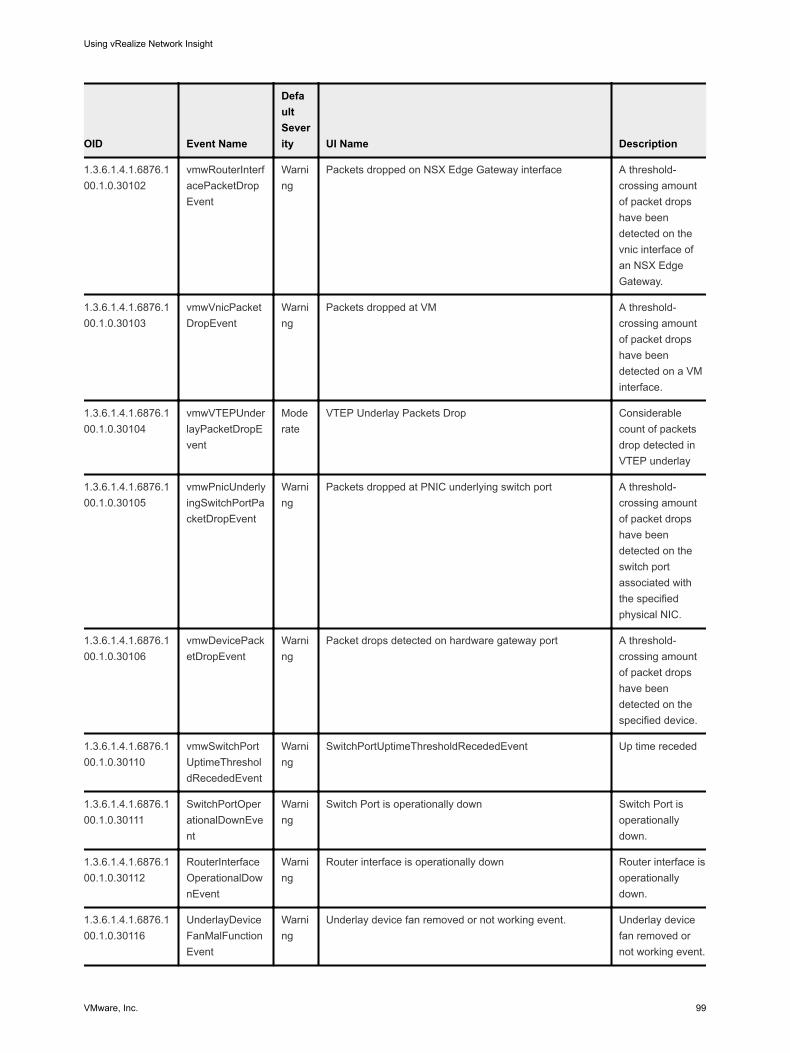
OID Event Name
Default Severity UI Name Description
1.3.6.1.4.1.6876.100.1.0.30102
vmwRouterInterfacePacketDropEvent
Warning
Packets dropped on NSX Edge Gateway interface A threshold-crossing amount of packet drops have been detected on the vnic interface of an NSX Edge Gateway.
1.3.6.1.4.1.6876.100.1.0.30103
vmwVnicPacketDropEvent
Warning
Packets dropped at VM A threshold-crossing amount of packet drops have been detected on a VM interface.
1.3.6.1.4.1.6876.100.1.0.30104
vmwVTEPUnderlayPacketDropEvent
Moderate
VTEP Underlay Packets Drop Considerable count of packets drop detected in VTEP underlay
1.3.6.1.4.1.6876.100.1.0.30105
vmwPnicUnderlyingSwitchPortPacketDropEvent
Warning
Packets dropped at PNIC underlying switch port A threshold-crossing amount of packet drops have been detected on the switch port associated with the specified physical NIC.
1.3.6.1.4.1.6876.100.1.0.30106
vmwDevicePacketDropEvent
Warning
Packet drops detected on hardware gateway port A threshold-crossing amount of packet drops have been detected on the specified device.
1.3.6.1.4.1.6876.100.1.0.30110
vmwSwitchPortUptimeThresholdRecededEvent
Warning
SwitchPortUptimeThresholdRecededEvent Up time receded
1.3.6.1.4.1.6876.100.1.0.30111
SwitchPortOperationalDownEvent
Warning
Switch Port is operationally down Switch Port is operationally down.
1.3.6.1.4.1.6876.100.1.0.30112
RouterInterfaceOperationalDownEvent
Warning
Router interface is operationally down Router interface is operationally down.
1.3.6.1.4.1.6876.100.1.0.30116
UnderlayDeviceFanMalFunctionEvent
Warning
Underlay device fan removed or not working event. Underlay device fan removed or not working event.
Using vRealize Network Insight
VMware, Inc. 99
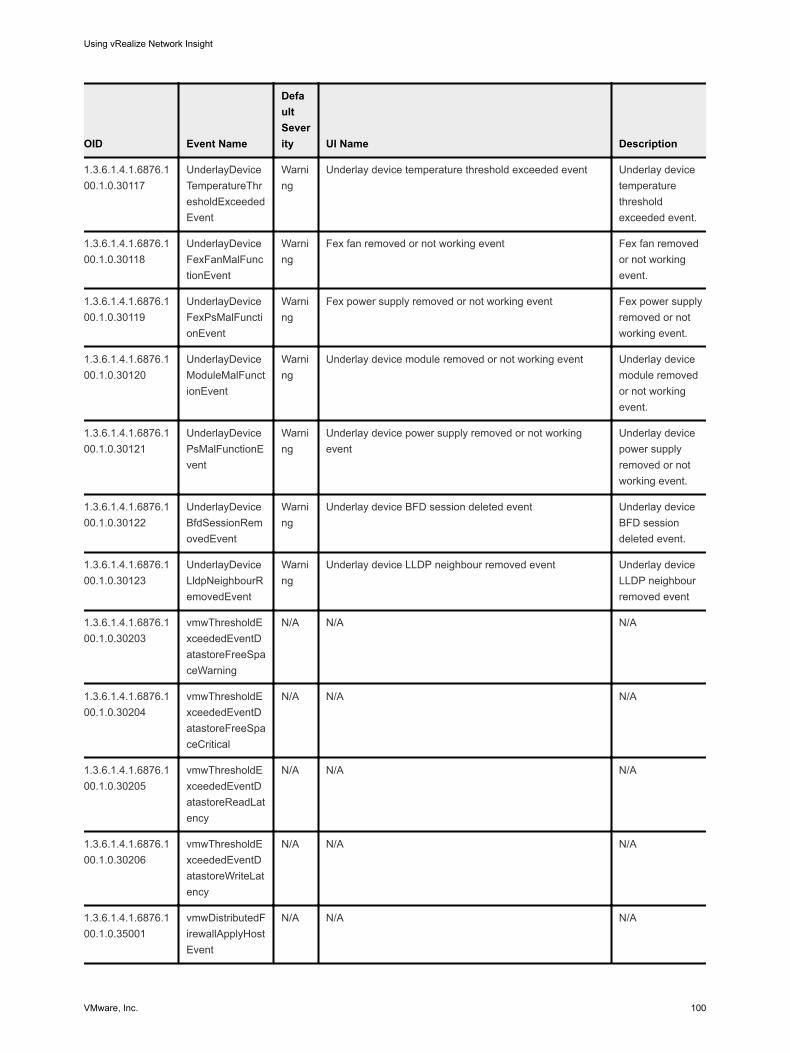
OID Event Name
Default Severity UI Name Description
1.3.6.1.4.1.6876.100.1.0.30117
UnderlayDeviceTemperatureThresholdExceededEvent
Warning
Underlay device temperature threshold exceeded event Underlay device temperature threshold exceeded event.
1.3.6.1.4.1.6876.100.1.0.30118
UnderlayDeviceFexFanMalFunctionEvent
Warning
Fex fan removed or not working event Fex fan removed or not working event.
1.3.6.1.4.1.6876.100.1.0.30119
UnderlayDeviceFexPsMalFunctionEvent
Warning
Fex power supply removed or not working event Fex power supply removed or not working event.
1.3.6.1.4.1.6876.100.1.0.30120
UnderlayDeviceModuleMalFunctionEvent
Warning
Underlay device module removed or not working event Underlay device module removed or not working event.
1.3.6.1.4.1.6876.100.1.0.30121
UnderlayDevicePsMalFunctionEvent
Warning
Underlay device power supply removed or not working event
Underlay device power supply removed or not working event.
1.3.6.1.4.1.6876.100.1.0.30122
UnderlayDeviceBfdSessionRemovedEvent
Warning
Underlay device BFD session deleted event Underlay device BFD session deleted event.
1.3.6.1.4.1.6876.100.1.0.30123
UnderlayDeviceLldpNeighbourRemovedEvent
Warning
Underlay device LLDP neighbour removed event Underlay device LLDP neighbour removed event
1.3.6.1.4.1.6876.100.1.0.30203
vmwThresholdExceededEventDatastoreFreeSpaceWarning
N/A N/A N/A
1.3.6.1.4.1.6876.100.1.0.30204
vmwThresholdExceededEventDatastoreFreeSpaceCritical
N/A N/A N/A
1.3.6.1.4.1.6876.100.1.0.30205
vmwThresholdExceededEventDatastoreReadLatency
N/A N/A N/A
1.3.6.1.4.1.6876.100.1.0.30206
vmwThresholdExceededEventDatastoreWriteLatency
N/A N/A N/A
1.3.6.1.4.1.6876.100.1.0.35001
vmwDistributedFirewallApplyHostEvent
N/A N/A N/A
Using vRealize Network Insight
VMware, Inc. 100
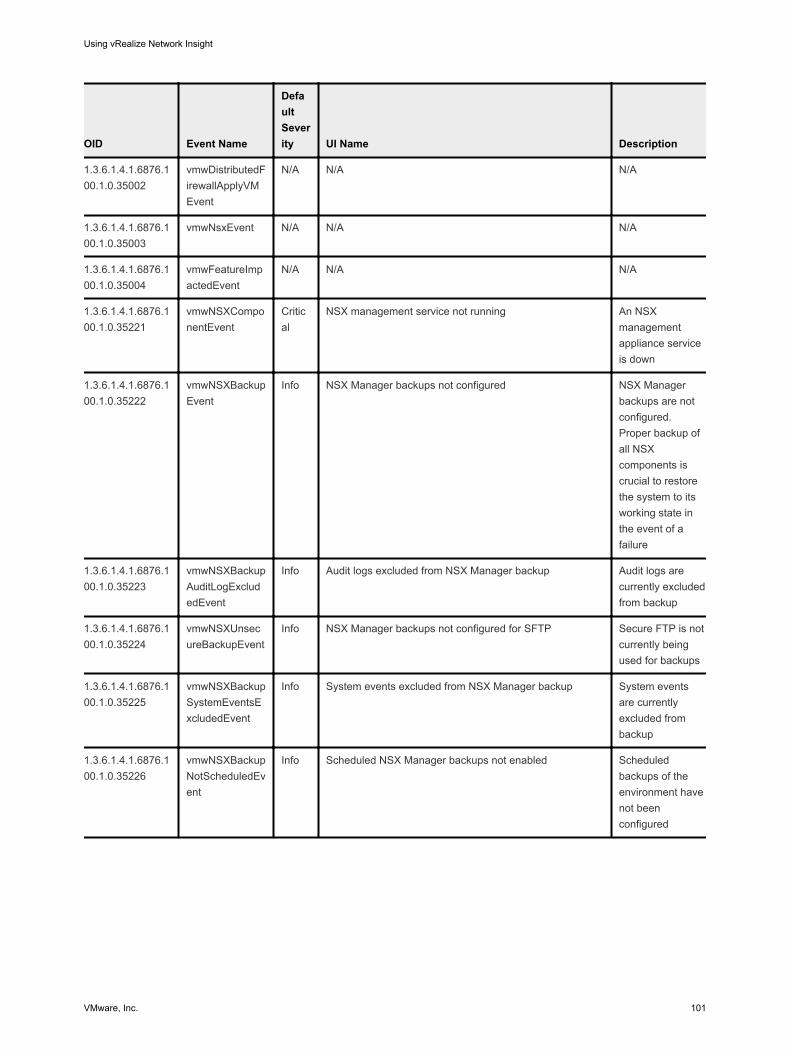
OID Event Name
Default Severity UI Name Description
1.3.6.1.4.1.6876.100.1.0.35002
vmwDistributedFirewallApplyVMEvent
N/A N/A N/A
1.3.6.1.4.1.6876.100.1.0.35003
vmwNsxEvent N/A N/A N/A
1.3.6.1.4.1.6876.100.1.0.35004
vmwFeatureImpactedEvent
N/A N/A N/A
1.3.6.1.4.1.6876.100.1.0.35221
vmwNSXComponentEvent
Critical
NSX management service not running An NSX management appliance service is down
1.3.6.1.4.1.6876.100.1.0.35222
vmwNSXBackupEvent
Info NSX Manager backups not configured NSX Manager backups are not configured. Proper backup of all NSX components is crucial to restore the system to its working state in the event of a failure
1.3.6.1.4.1.6876.100.1.0.35223
vmwNSXBackupAuditLogExcludedEvent
Info Audit logs excluded from NSX Manager backup Audit logs are currently excluded from backup
1.3.6.1.4.1.6876.100.1.0.35224
vmwNSXUnsecureBackupEvent
Info NSX Manager backups not configured for SFTP Secure FTP is not currently being used for backups
1.3.6.1.4.1.6876.100.1.0.35225
vmwNSXBackupSystemEventsExcludedEvent
Info System events excluded from NSX Manager backup System events are currently excluded from backup
1.3.6.1.4.1.6876.100.1.0.35226
vmwNSXBackupNotScheduledEvent
Info Scheduled NSX Manager backups not enabled Scheduled backups of the environment have not been configured
Using vRealize Network Insight
VMware, Inc. 101
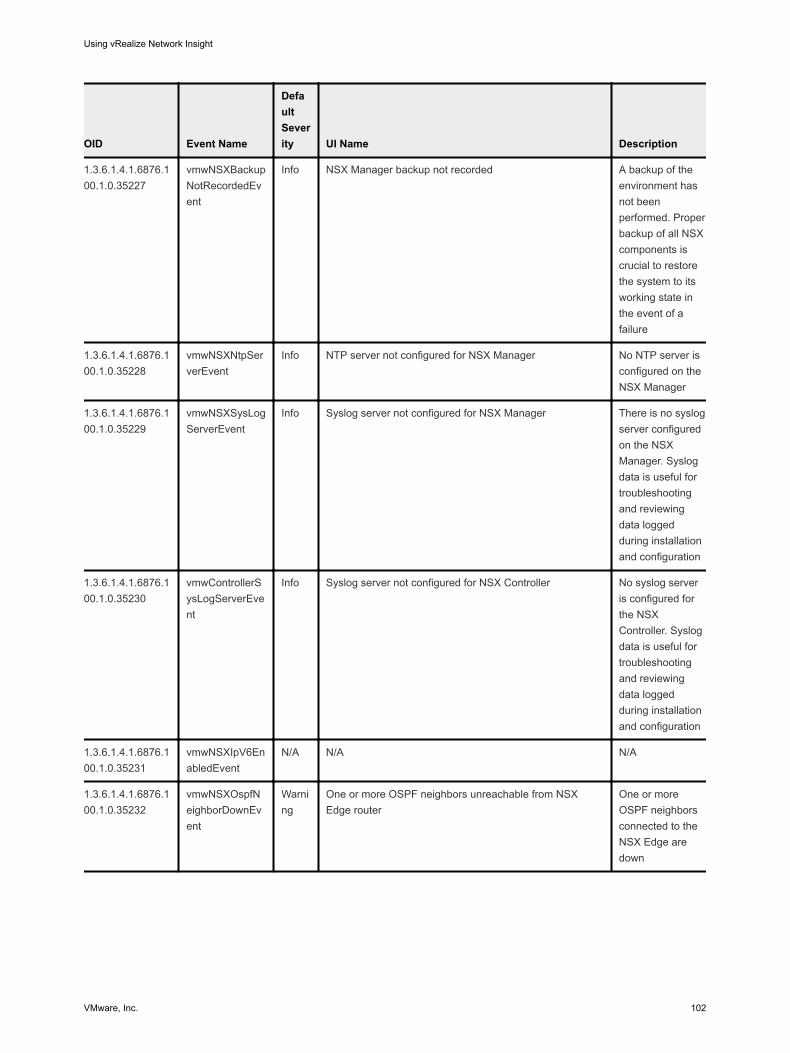
OID Event Name
Default Severity UI Name Description
1.3.6.1.4.1.6876.100.1.0.35227
vmwNSXBackupNotRecordedEvent
Info NSX Manager backup not recorded A backup of the environment has not been performed. Proper backup of all NSX components is crucial to restore the system to its working state in the event of a failure
1.3.6.1.4.1.6876.100.1.0.35228
vmwNSXNtpServerEvent
Info NTP server not configured for NSX Manager No NTP server is configured on the NSX Manager
1.3.6.1.4.1.6876.100.1.0.35229
vmwNSXSysLogServerEvent
Info Syslog server not configured for NSX Manager There is no syslog server configured on the NSX Manager. Syslog data is useful for troubleshooting and reviewing data logged during installation and configuration
1.3.6.1.4.1.6876.100.1.0.35230
vmwControllerSysLogServerEvent
Info Syslog server not configured for NSX Controller No syslog server is configured for the NSX Controller. Syslog data is useful for troubleshooting and reviewing data logged during installation and configuration
1.3.6.1.4.1.6876.100.1.0.35231
vmwNSXIpV6EnabledEvent
N/A N/A N/A
1.3.6.1.4.1.6876.100.1.0.35232
vmwNSXOspfNeighborDownEvent
Warning
One or more OSPF neighbors unreachable from NSX Edge router
One or more OSPF neighbors connected to the NSX Edge are down
Using vRealize Network Insight
VMware, Inc. 102
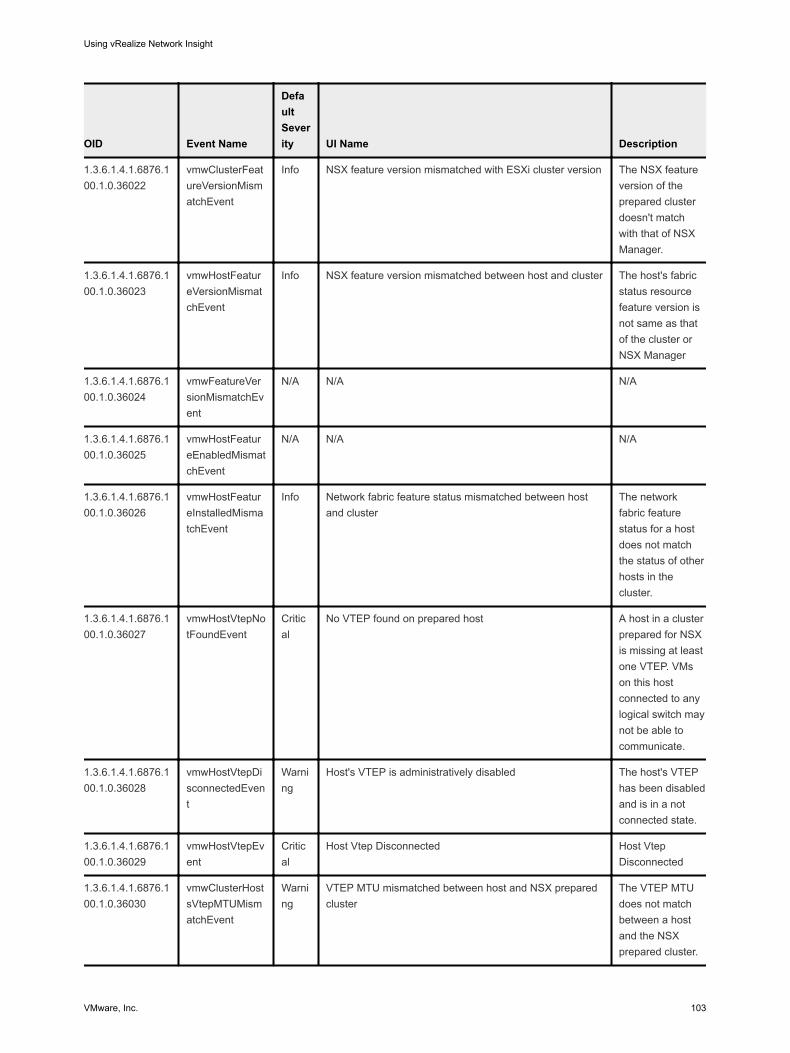
OID Event Name
Default Severity UI Name Description
1.3.6.1.4.1.6876.100.1.0.36022
vmwClusterFeatureVersionMismatchEvent
Info NSX feature version mismatched with ESXi cluster version The NSX feature version of the prepared cluster doesn't match with that of NSX Manager.
1.3.6.1.4.1.6876.100.1.0.36023
vmwHostFeatureVersionMismatchEvent
Info NSX feature version mismatched between host and cluster The host's fabric status resource feature version is not same as that of the cluster or NSX Manager
1.3.6.1.4.1.6876.100.1.0.36024
vmwFeatureVersionMismatchEvent
N/A N/A N/A
1.3.6.1.4.1.6876.100.1.0.36025
vmwHostFeatureEnabledMismatchEvent
N/A N/A N/A
1.3.6.1.4.1.6876.100.1.0.36026
vmwHostFeatureInstalledMismatchEvent
Info Network fabric feature status mismatched between host and cluster
The network fabric feature status for a host does not match the status of other hosts in the cluster.
1.3.6.1.4.1.6876.100.1.0.36027
vmwHostVtepNotFoundEvent
Critical
No VTEP found on prepared host A host in a cluster prepared for NSX is missing at least one VTEP. VMs on this host connected to any logical switch may not be able to communicate.
1.3.6.1.4.1.6876.100.1.0.36028
vmwHostVtepDisconnectedEvent
Warning
Host's VTEP is administratively disabled The host's VTEP has been disabled and is in a not connected state.
1.3.6.1.4.1.6876.100.1.0.36029
vmwHostVtepEvent
Critical
Host Vtep Disconnected Host Vtep Disconnected
1.3.6.1.4.1.6876.100.1.0.36030
vmwClusterHostsVtepMTUMismatchEvent
Warning
VTEP MTU mismatched between host and NSX prepared cluster
The VTEP MTU does not match between a host and the NSX prepared cluster.
Using vRealize Network Insight
VMware, Inc. 103
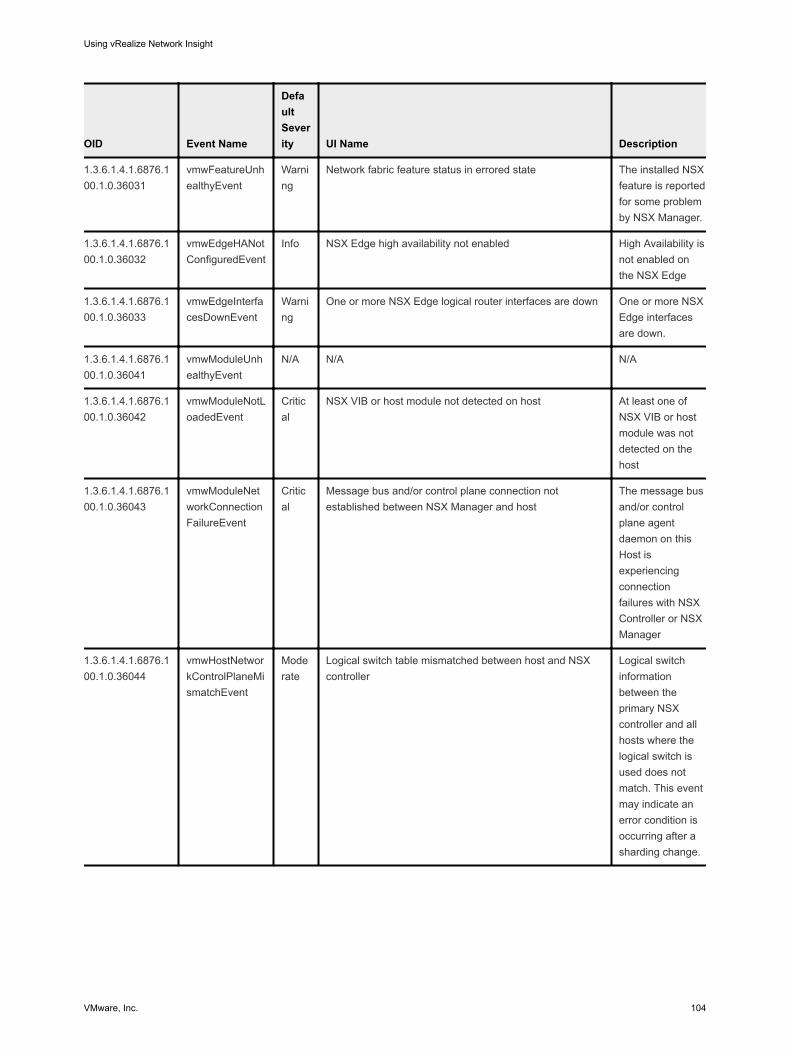
OID Event Name
Default Severity UI Name Description
1.3.6.1.4.1.6876.100.1.0.36031
vmwFeatureUnhealthyEvent
Warning
Network fabric feature status in errored state The installed NSX feature is reported for some problem by NSX Manager.
1.3.6.1.4.1.6876.100.1.0.36032
vmwEdgeHANotConfiguredEvent
Info NSX Edge high availability not enabled High Availability is not enabled on the NSX Edge
1.3.6.1.4.1.6876.100.1.0.36033
vmwEdgeInterfacesDownEvent
Warning
One or more NSX Edge logical router interfaces are down One or more NSX Edge interfaces are down.
1.3.6.1.4.1.6876.100.1.0.36041
vmwModuleUnhealthyEvent
N/A N/A N/A
1.3.6.1.4.1.6876.100.1.0.36042
vmwModuleNotLoadedEvent
Critical
NSX VIB or host module not detected on host At least one of NSX VIB or host module was not detected on the host
1.3.6.1.4.1.6876.100.1.0.36043
vmwModuleNetworkConnectionFailureEvent
Critical
Message bus and/or control plane connection not established between NSX Manager and host
The message bus and/or control plane agent daemon on this Host is experiencing connection failures with NSX Controller or NSX Manager
1.3.6.1.4.1.6876.100.1.0.36044
vmwHostNetworkControlPlaneMismatchEvent
Moderate
Logical switch table mismatched between host and NSX controller
Logical switch information between the primary NSX controller and all hosts where the logical switch is used does not match. This event may indicate an error condition is occurring after a sharding change.
Using vRealize Network Insight
VMware, Inc. 104
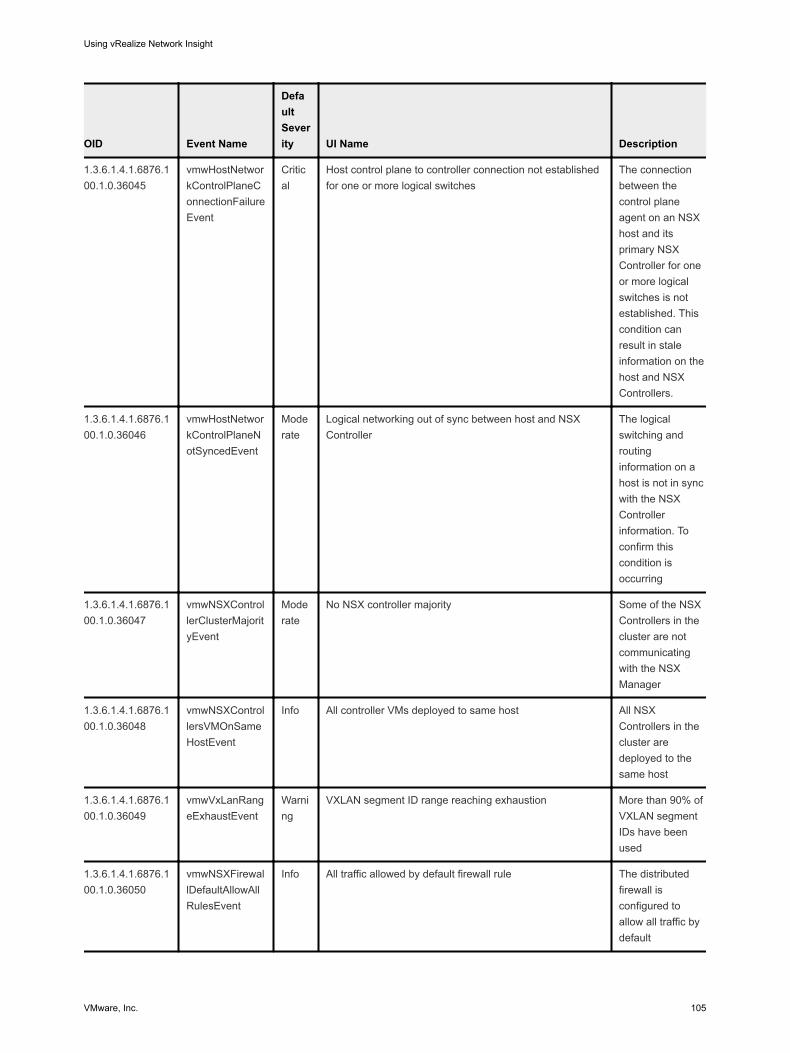
OID Event Name
Default Severity UI Name Description
1.3.6.1.4.1.6876.100.1.0.36045
vmwHostNetworkControlPlaneConnectionFailureEvent
Critical
Host control plane to controller connection not established for one or more logical switches
The connection between the control plane agent on an NSX host and its primary NSX Controller for one or more logical switches is not established. This condition can result in stale information on the host and NSX Controllers.
1.3.6.1.4.1.6876.100.1.0.36046
vmwHostNetworkControlPlaneNotSyncedEvent
Moderate
Logical networking out of sync between host and NSX Controller
The logical switching and routing information on a host is not in sync with the NSX Controller information. To confirm this condition is occurring
1.3.6.1.4.1.6876.100.1.0.36047
vmwNSXControllerClusterMajorityEvent
Moderate
No NSX controller majority Some of the NSX Controllers in the cluster are not communicating with the NSX Manager
1.3.6.1.4.1.6876.100.1.0.36048
vmwNSXControllersVMOnSameHostEvent
Info All controller VMs deployed to same host All NSX Controllers in the cluster are deployed to the same host
1.3.6.1.4.1.6876.100.1.0.36049
vmwVxLanRangeExhaustEvent
Warning
VXLAN segment ID range reaching exhaustion More than 90% of VXLAN segment IDs have been used
1.3.6.1.4.1.6876.100.1.0.36050
vmwNSXFirewallDefaultAllowAllRulesEvent
Info All traffic allowed by default firewall rule The distributed firewall is configured to allow all traffic by default
Using vRealize Network Insight
VMware, Inc. 105
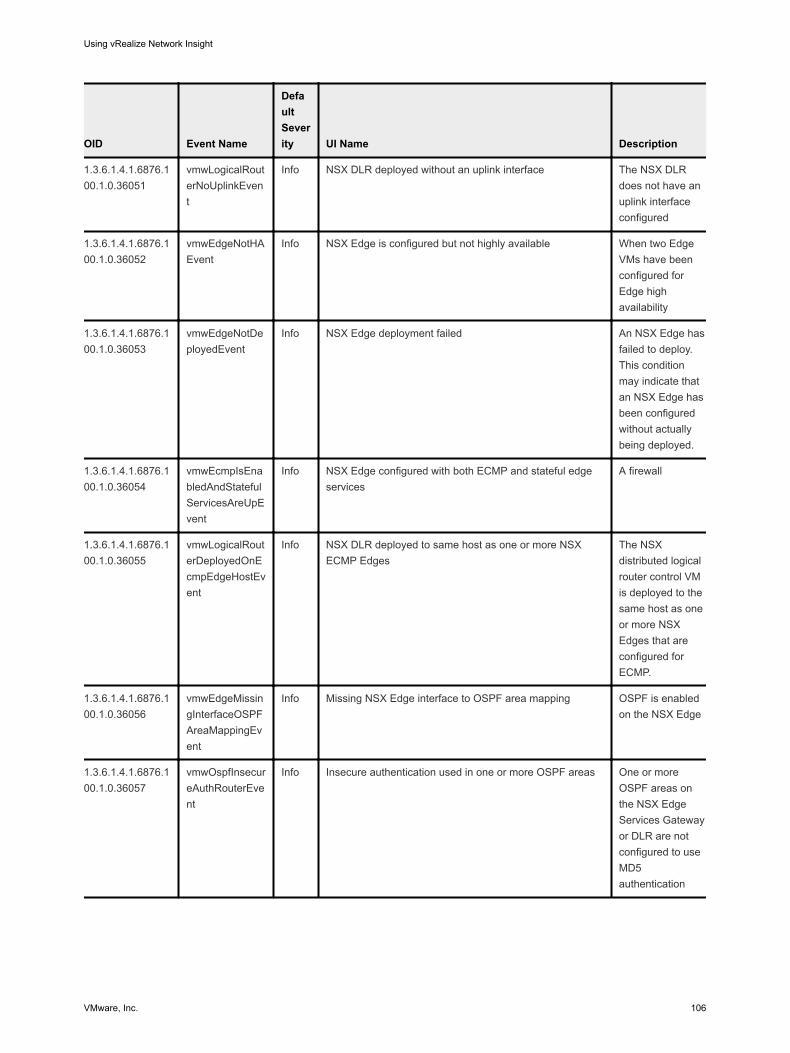
OID Event Name
Default Severity UI Name Description
1.3.6.1.4.1.6876.100.1.0.36051
vmwLogicalRouterNoUplinkEvent
Info NSX DLR deployed without an uplink interface The NSX DLR does not have an uplink interface configured
1.3.6.1.4.1.6876.100.1.0.36052
vmwEdgeNotHAEvent
Info NSX Edge is configured but not highly available When two Edge VMs have been configured for Edge high availability
1.3.6.1.4.1.6876.100.1.0.36053
vmwEdgeNotDeployedEvent
Info NSX Edge deployment failed An NSX Edge has failed to deploy. This condition may indicate that an NSX Edge has been configured without actually being deployed.
1.3.6.1.4.1.6876.100.1.0.36054
vmwEcmpIsEnabledAndStatefulServicesAreUpEvent
Info NSX Edge configured with both ECMP and stateful edge services
A firewall
1.3.6.1.4.1.6876.100.1.0.36055
vmwLogicalRouterDeployedOnEcmpEdgeHostEvent
Info NSX DLR deployed to same host as one or more NSX ECMP Edges
The NSX distributed logical router control VM is deployed to the same host as one or more NSX Edges that are configured for ECMP.
1.3.6.1.4.1.6876.100.1.0.36056
vmwEdgeMissingInterfaceOSPFAreaMappingEvent
Info Missing NSX Edge interface to OSPF area mapping OSPF is enabled on the NSX Edge
1.3.6.1.4.1.6876.100.1.0.36057
vmwOspfInsecureAuthRouterEvent
Info Insecure authentication used in one or more OSPF areas One or more OSPF areas on the NSX Edge Services Gateway or DLR are not configured to use MD5 authentication
Using vRealize Network Insight
VMware, Inc. 106
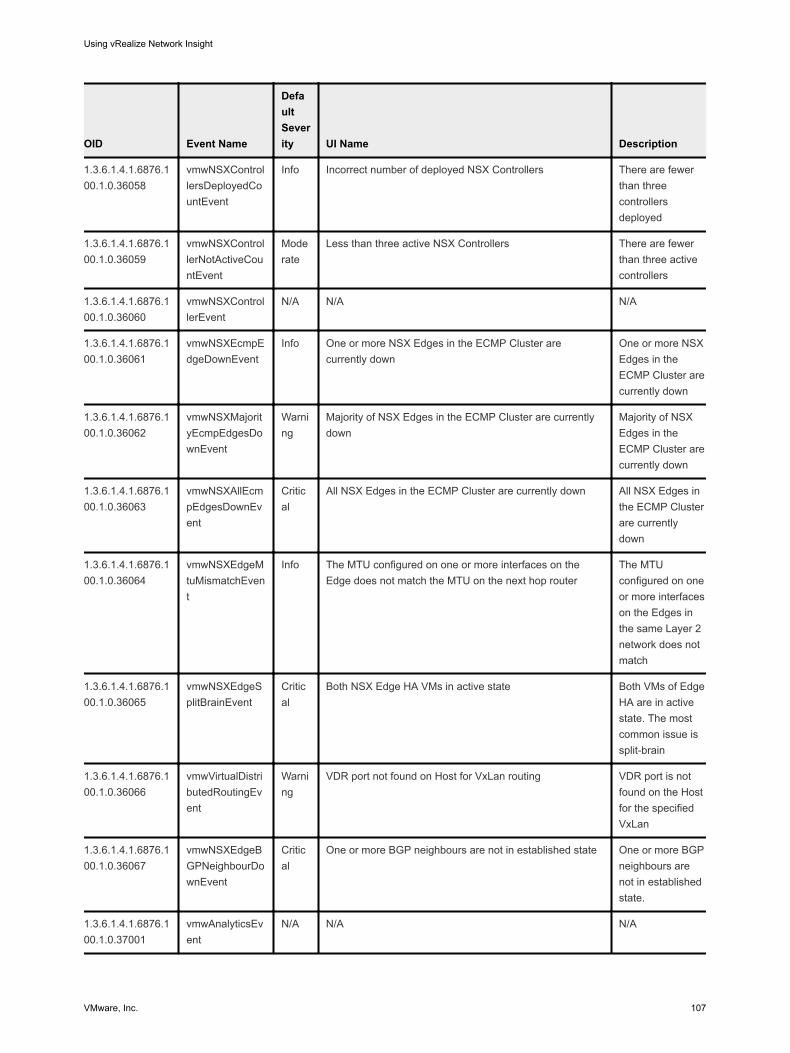
OID Event Name
Default Severity UI Name Description
1.3.6.1.4.1.6876.100.1.0.36058
vmwNSXControllersDeployedCountEvent
Info Incorrect number of deployed NSX Controllers There are fewer than three controllers deployed
1.3.6.1.4.1.6876.100.1.0.36059
vmwNSXControllerNotActiveCountEvent
Moderate
Less than three active NSX Controllers There are fewer than three active controllers
1.3.6.1.4.1.6876.100.1.0.36060
vmwNSXControllerEvent
N/A N/A N/A
1.3.6.1.4.1.6876.100.1.0.36061
vmwNSXEcmpEdgeDownEvent
Info One or more NSX Edges in the ECMP Cluster are currently down
One or more NSX Edges in the ECMP Cluster are currently down
1.3.6.1.4.1.6876.100.1.0.36062
vmwNSXMajorityEcmpEdgesDownEvent
Warning
Majority of NSX Edges in the ECMP Cluster are currently down
Majority of NSX Edges in the ECMP Cluster are currently down
1.3.6.1.4.1.6876.100.1.0.36063
vmwNSXAllEcmpEdgesDownEvent
Critical
All NSX Edges in the ECMP Cluster are currently down All NSX Edges in the ECMP Cluster are currently down
1.3.6.1.4.1.6876.100.1.0.36064
vmwNSXEdgeMtuMismatchEvent
Info The MTU configured on one or more interfaces on the Edge does not match the MTU on the next hop router
The MTU configured on one or more interfaces on the Edges in the same Layer 2 network does not match
1.3.6.1.4.1.6876.100.1.0.36065
vmwNSXEdgeSplitBrainEvent
Critical
Both NSX Edge HA VMs in active state Both VMs of Edge HA are in active state. The most common issue is split-brain
1.3.6.1.4.1.6876.100.1.0.36066
vmwVirtualDistributedRoutingEvent
Warning
VDR port not found on Host for VxLan routing VDR port is not found on the Host for the specified VxLan
1.3.6.1.4.1.6876.100.1.0.36067
vmwNSXEdgeBGPNeighbourDownEvent
Critical
One or more BGP neighbours are not in established state One or more BGP neighbours are not in established state.
1.3.6.1.4.1.6876.100.1.0.37001
vmwAnalyticsEvent
N/A N/A N/A
Using vRealize Network Insight
VMware, Inc. 107
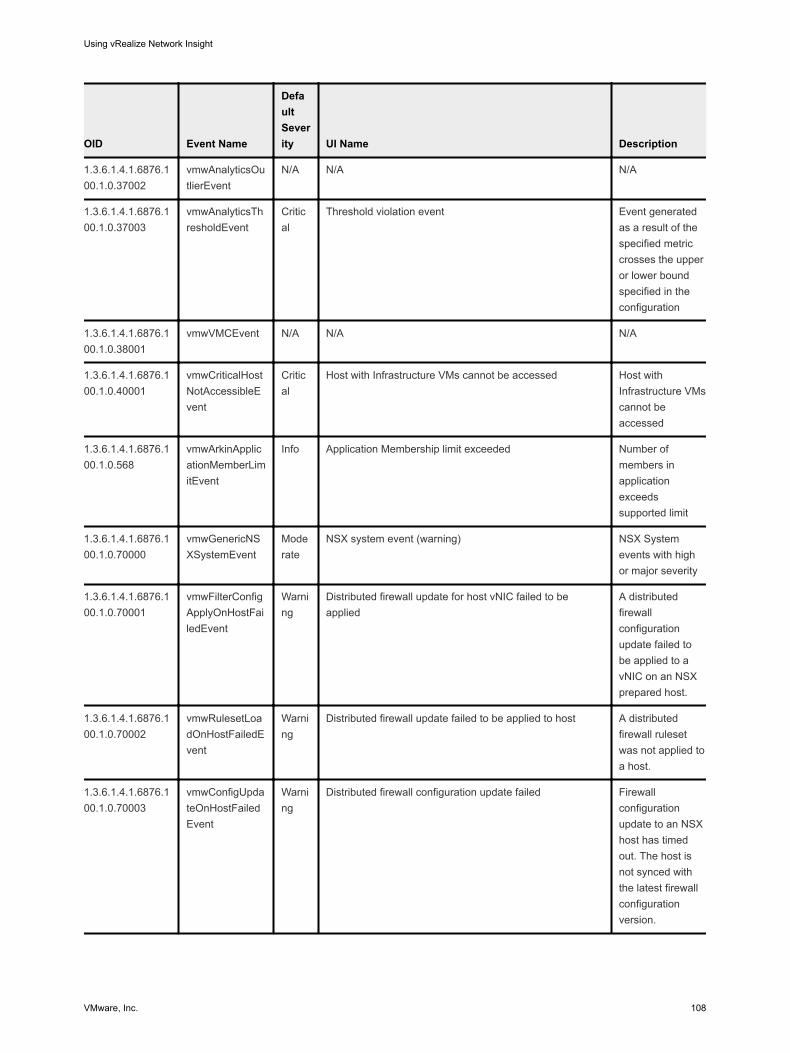
OID Event Name
Default Severity UI Name Description
1.3.6.1.4.1.6876.100.1.0.37002
vmwAnalyticsOutlierEvent
N/A N/A N/A
1.3.6.1.4.1.6876.100.1.0.37003
vmwAnalyticsThresholdEvent
Critical
Threshold violation event Event generated as a result of the specified metric crosses the upper or lower bound specified in the configuration
1.3.6.1.4.1.6876.100.1.0.38001
vmwVMCEvent N/A N/A N/A
1.3.6.1.4.1.6876.100.1.0.40001
vmwCriticalHostNotAccessibleEvent
Critical
Host with Infrastructure VMs cannot be accessed Host with Infrastructure VMs cannot be accessed
1.3.6.1.4.1.6876.100.1.0.568
vmwArkinApplicationMemberLimitEvent
Info Application Membership limit exceeded Number of members in application exceeds supported limit
1.3.6.1.4.1.6876.100.1.0.70000
vmwGenericNSXSystemEvent
Moderate
NSX system event (warning) NSX System events with high or major severity
1.3.6.1.4.1.6876.100.1.0.70001
vmwFilterConfigApplyOnHostFailedEvent
Warning
Distributed firewall update for host vNIC failed to be applied
A distributed firewall configuration update failed to be applied to a vNIC on an NSX prepared host.
1.3.6.1.4.1.6876.100.1.0.70002
vmwRulesetLoadOnHostFailedEvent
Warning
Distributed firewall update failed to be applied to host A distributed firewall ruleset was not applied to a host.
1.3.6.1.4.1.6876.100.1.0.70003
vmwConfigUpdateOnHostFailedEvent
Warning
Distributed firewall configuration update failed Firewall configuration update to an NSX host has timed out. The host is not synced with the latest firewall configuration version.
Using vRealize Network Insight
VMware, Inc. 108
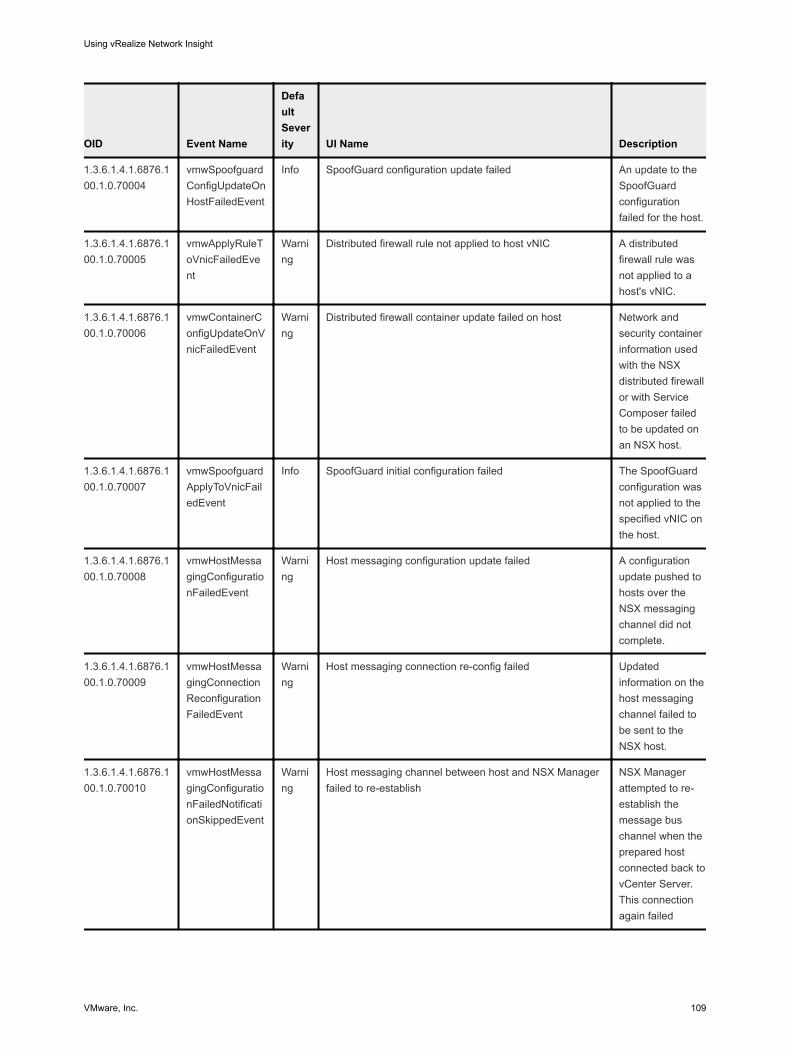
OID Event Name
Default Severity UI Name Description
1.3.6.1.4.1.6876.100.1.0.70004
vmwSpoofguardConfigUpdateOnHostFailedEvent
Info SpoofGuard configuration update failed An update to the SpoofGuard configuration failed for the host.
1.3.6.1.4.1.6876.100.1.0.70005
vmwApplyRuleToVnicFailedEvent
Warning
Distributed firewall rule not applied to host vNIC A distributed firewall rule was not applied to a host's vNIC.
1.3.6.1.4.1.6876.100.1.0.70006
vmwContainerConfigUpdateOnVnicFailedEvent
Warning
Distributed firewall container update failed on host Network and security container information used with the NSX distributed firewall or with Service Composer failed to be updated on an NSX host.
1.3.6.1.4.1.6876.100.1.0.70007
vmwSpoofguardApplyToVnicFailedEvent
Info SpoofGuard initial configuration failed The SpoofGuard configuration was not applied to the specified vNIC on the host.
1.3.6.1.4.1.6876.100.1.0.70008
vmwHostMessagingConfigurationFailedEvent
Warning
Host messaging configuration update failed A configuration update pushed to hosts over the NSX messaging channel did not complete.
1.3.6.1.4.1.6876.100.1.0.70009
vmwHostMessagingConnectionReconfigurationFailedEvent
Warning
Host messaging connection re-config failed Updated information on the host messaging channel failed to be sent to the NSX host.
1.3.6.1.4.1.6876.100.1.0.70010
vmwHostMessagingConfigurationFailedNotificationSkippedEvent
Warning
Host messaging channel between host and NSX Manager failed to re-establish
NSX Manager attempted to re-establish the message bus channel when the prepared host connected back to vCenter Server. This connection again failed
Using vRealize Network Insight
VMware, Inc. 109
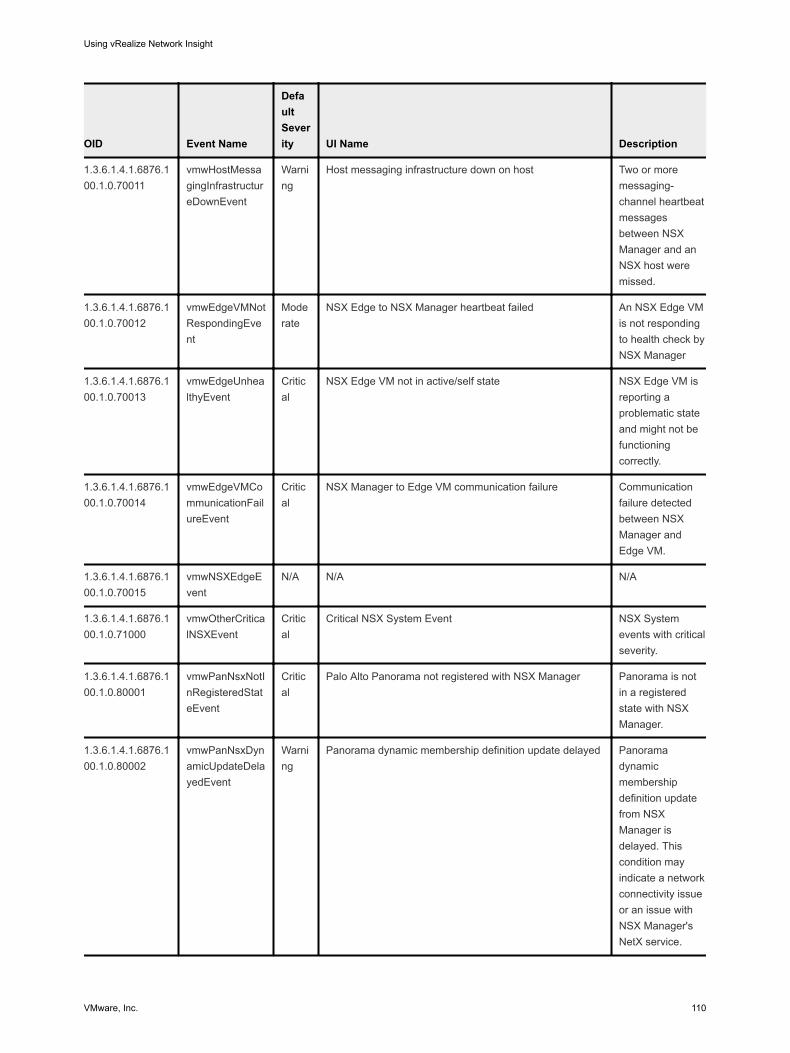
OID Event Name
Default Severity UI Name Description
1.3.6.1.4.1.6876.100.1.0.70011
vmwHostMessagingInfrastructureDownEvent
Warning
Host messaging infrastructure down on host Two or more messaging-channel heartbeat messages between NSX Manager and an NSX host were missed.
1.3.6.1.4.1.6876.100.1.0.70012
vmwEdgeVMNotRespondingEvent
Moderate
NSX Edge to NSX Manager heartbeat failed An NSX Edge VM is not responding to health check by NSX Manager
1.3.6.1.4.1.6876.100.1.0.70013
vmwEdgeUnhealthyEvent
Critical
NSX Edge VM not in active/self state NSX Edge VM is reporting a problematic state and might not be functioning correctly.
1.3.6.1.4.1.6876.100.1.0.70014
vmwEdgeVMCommunicationFailureEvent
Critical
NSX Manager to Edge VM communication failure Communication failure detected between NSX Manager and Edge VM.
1.3.6.1.4.1.6876.100.1.0.70015
vmwNSXEdgeEvent
N/A N/A N/A
1.3.6.1.4.1.6876.100.1.0.71000
vmwOtherCriticalNSXEvent
Critical
Critical NSX System Event NSX System events with critical severity.
1.3.6.1.4.1.6876.100.1.0.80001
vmwPanNsxNotInRegisteredStateEvent
Critical
Palo Alto Panorama not registered with NSX Manager Panorama is not in a registered state with NSX Manager.
1.3.6.1.4.1.6876.100.1.0.80002
vmwPanNsxDynamicUpdateDelayedEvent
Warning
Panorama dynamic membership definition update delayed Panorama dynamic membership definition update from NSX Manager is delayed. This condition may indicate a network connectivity issue or an issue with NSX Manager's NetX service.
Using vRealize Network Insight
VMware, Inc. 110
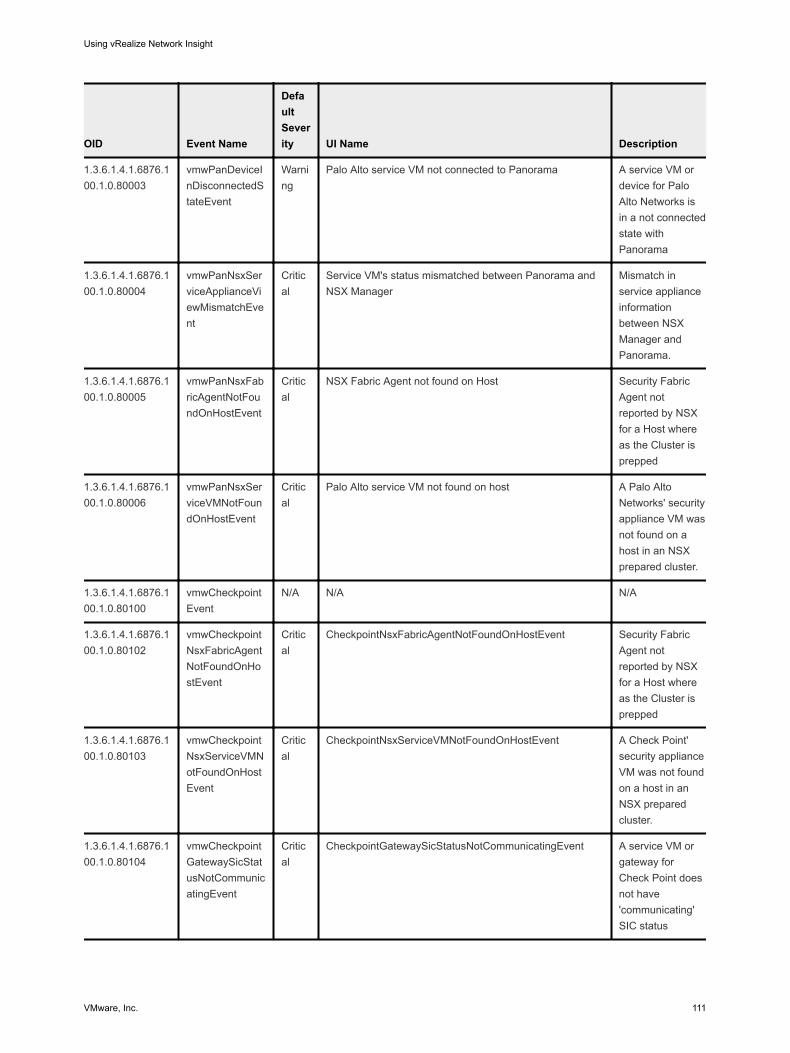
OID Event Name
Default Severity UI Name Description
1.3.6.1.4.1.6876.100.1.0.80003
vmwPanDeviceInDisconnectedStateEvent
Warning
Palo Alto service VM not connected to Panorama A service VM or device for Palo Alto Networks is in a not connected state with Panorama
1.3.6.1.4.1.6876.100.1.0.80004
vmwPanNsxServiceApplianceViewMismatchEvent
Critical
Service VM's status mismatched between Panorama and NSX Manager
Mismatch in service appliance information between NSX Manager and Panorama.
1.3.6.1.4.1.6876.100.1.0.80005
vmwPanNsxFabricAgentNotFoundOnHostEvent
Critical
NSX Fabric Agent not found on Host Security Fabric Agent not reported by NSX for a Host where as the Cluster is prepped
1.3.6.1.4.1.6876.100.1.0.80006
vmwPanNsxServiceVMNotFoundOnHostEvent
Critical
Palo Alto service VM not found on host A Palo Alto Networks' security appliance VM was not found on a host in an NSX prepared cluster.
1.3.6.1.4.1.6876.100.1.0.80100
vmwCheckpointEvent
N/A N/A N/A
1.3.6.1.4.1.6876.100.1.0.80102
vmwCheckpointNsxFabricAgentNotFoundOnHostEvent
Critical
CheckpointNsxFabricAgentNotFoundOnHostEvent Security Fabric Agent not reported by NSX for a Host where as the Cluster is prepped
1.3.6.1.4.1.6876.100.1.0.80103
vmwCheckpointNsxServiceVMNotFoundOnHostEvent
Critical
CheckpointNsxServiceVMNotFoundOnHostEvent A Check Point' security appliance VM was not found on a host in an NSX prepared cluster.
1.3.6.1.4.1.6876.100.1.0.80104
vmwCheckpointGatewaySicStatusNotCommunicatingEvent
Critical
CheckpointGatewaySicStatusNotCommunicatingEvent A service VM or gateway for Check Point does not have 'communicating' SIC status
Using vRealize Network Insight
VMware, Inc. 111
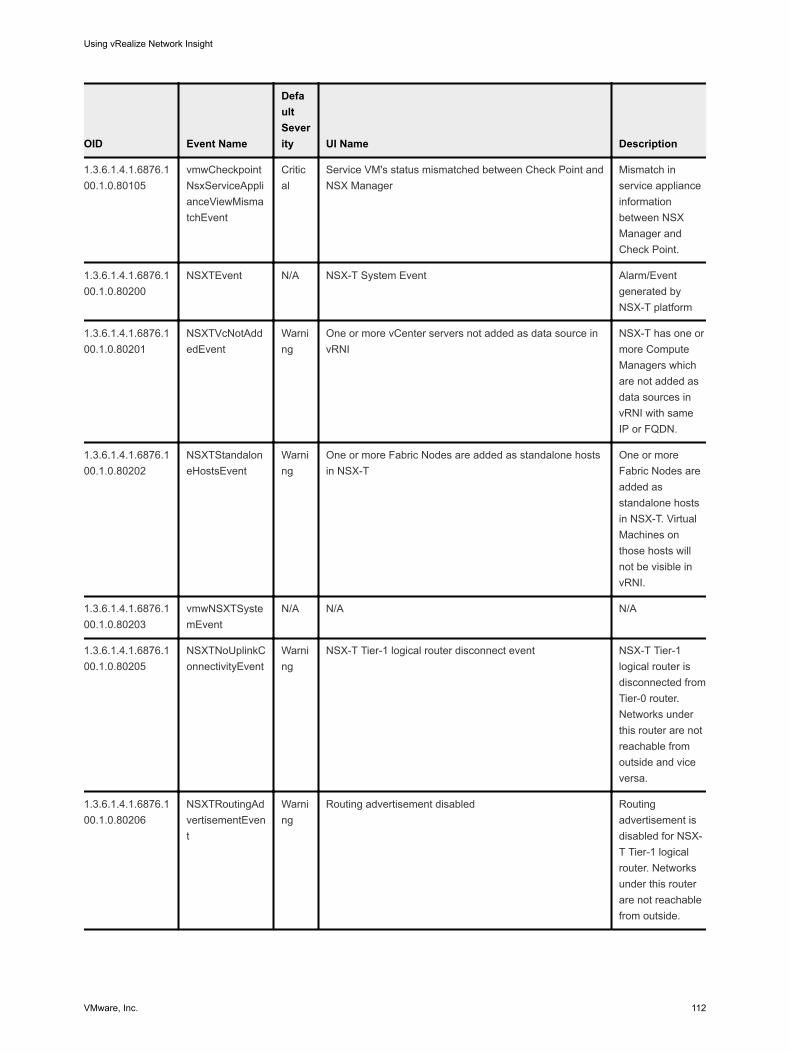
OID Event Name
Default Severity UI Name Description
1.3.6.1.4.1.6876.100.1.0.80105
vmwCheckpointNsxServiceApplianceViewMismatchEvent
Critical
Service VM's status mismatched between Check Point and NSX Manager
Mismatch in service appliance information between NSX Manager and Check Point.
1.3.6.1.4.1.6876.100.1.0.80200
NSXTEvent N/A NSX-T System Event Alarm/Event generated by NSX-T platform
1.3.6.1.4.1.6876.100.1.0.80201
NSXTVcNotAddedEvent
Warning
One or more vCenter servers not added as data source in vRNI
NSX-T has one or more Compute Managers which are not added as data sources in vRNI with same IP or FQDN.
1.3.6.1.4.1.6876.100.1.0.80202
NSXTStandaloneHostsEvent
Warning
One or more Fabric Nodes are added as standalone hosts in NSX-T
One or more Fabric Nodes are added as standalone hosts in NSX-T. Virtual Machines on those hosts will not be visible in vRNI.
1.3.6.1.4.1.6876.100.1.0.80203
vmwNSXTSystemEvent
N/A N/A N/A
1.3.6.1.4.1.6876.100.1.0.80205
NSXTNoUplinkConnectivityEvent
Warning
NSX-T Tier-1 logical router disconnect event NSX-T Tier-1 logical router is disconnected from Tier-0 router. Networks under this router are not reachable from outside and vice versa.
1.3.6.1.4.1.6876.100.1.0.80206
NSXTRoutingAdvertisementEvent
Warning
Routing advertisement disabled Routing advertisement is disabled for NSX-T Tier-1 logical router. Networks under this router are not reachable from outside.
Using vRealize Network Insight
VMware, Inc. 112
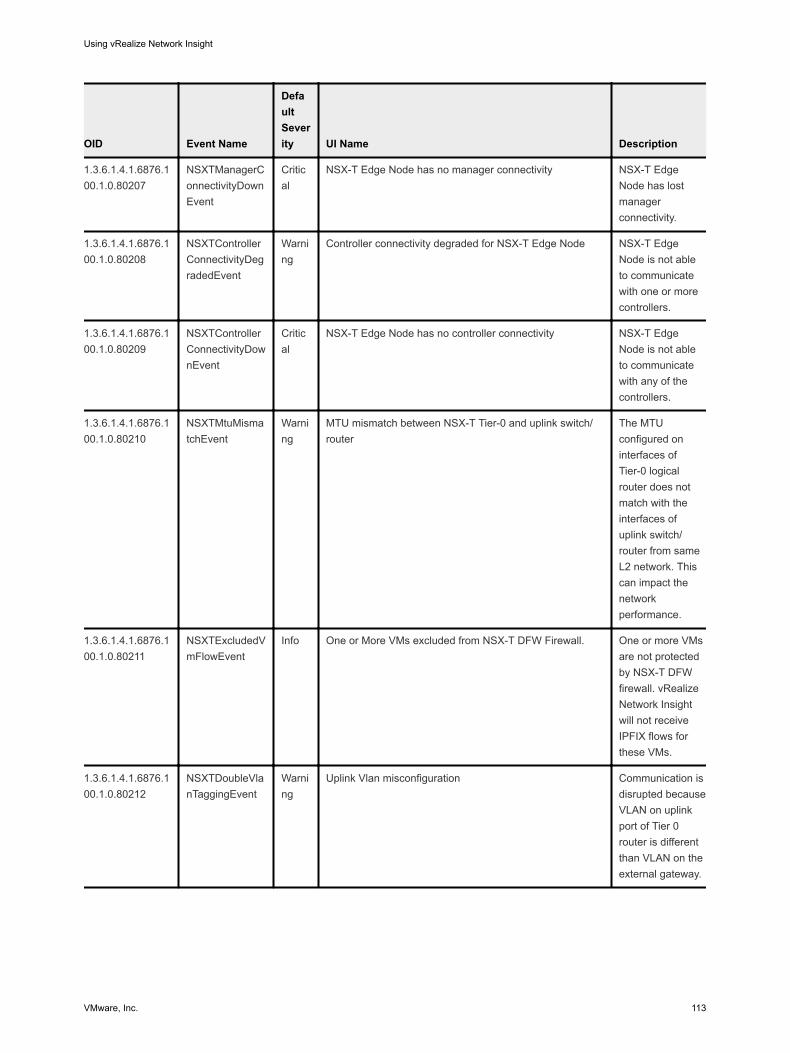
OID Event Name
Default Severity UI Name Description
1.3.6.1.4.1.6876.100.1.0.80207
NSXTManagerConnectivityDownEvent
Critical
NSX-T Edge Node has no manager connectivity NSX-T Edge Node has lost manager connectivity.
1.3.6.1.4.1.6876.100.1.0.80208
NSXTControllerConnectivityDegradedEvent
Warning
Controller connectivity degraded for NSX-T Edge Node NSX-T Edge Node is not able to communicate with one or more controllers.
1.3.6.1.4.1.6876.100.1.0.80209
NSXTControllerConnectivityDownEvent
Critical
NSX-T Edge Node has no controller connectivity NSX-T Edge Node is not able to communicate with any of the controllers.
1.3.6.1.4.1.6876.100.1.0.80210
NSXTMtuMismatchEvent
Warning
MTU mismatch between NSX-T Tier-0 and uplink switch/router
The MTU configured on interfaces of Tier-0 logical router does not match with the interfaces of uplink switch/router from same L2 network. This can impact the network performance.
1.3.6.1.4.1.6876.100.1.0.80211
NSXTExcludedVmFlowEvent
Info One or More VMs excluded from NSX-T DFW Firewall. One or more VMs are not protected by NSX-T DFW firewall. vRealize Network Insight will not receive IPFIX flows for these VMs.
1.3.6.1.4.1.6876.100.1.0.80212
NSXTDoubleVlanTaggingEvent
Warning
Uplink Vlan misconfiguration Communication is disrupted because VLAN on uplink port of Tier 0 router is different than VLAN on the external gateway.
Using vRealize Network Insight
VMware, Inc. 113
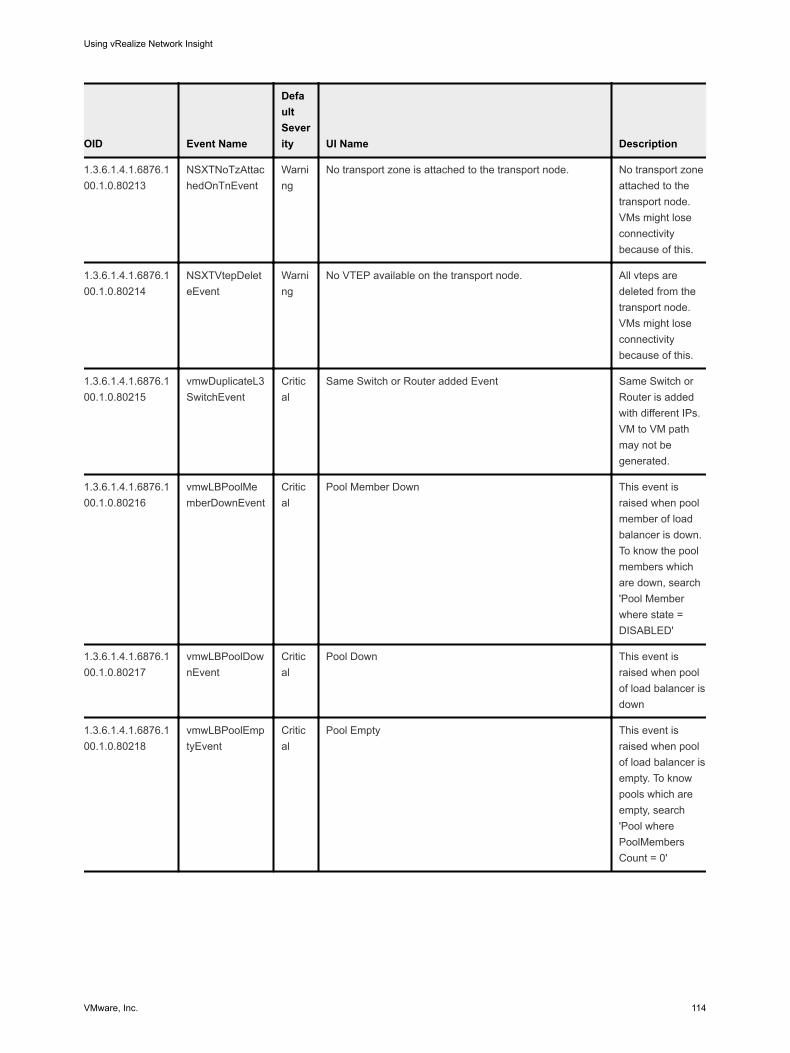
OID Event Name
Default Severity UI Name Description
1.3.6.1.4.1.6876.100.1.0.80213
NSXTNoTzAttachedOnTnEvent
Warning
No transport zone is attached to the transport node. No transport zone attached to the transport node. VMs might lose connectivity because of this.
1.3.6.1.4.1.6876.100.1.0.80214
NSXTVtepDeleteEvent
Warning
No VTEP available on the transport node. All vteps are deleted from the transport node. VMs might lose connectivity because of this.
1.3.6.1.4.1.6876.100.1.0.80215
vmwDuplicateL3SwitchEvent
Critical
Same Switch or Router added Event Same Switch or Router is added with different IPs. VM to VM path may not be generated.
1.3.6.1.4.1.6876.100.1.0.80216
vmwLBPoolMemberDownEvent
Critical
Pool Member Down This event is raised when pool member of load balancer is down. To know the pool members which are down, search 'Pool Member where state = DISABLED'
1.3.6.1.4.1.6876.100.1.0.80217
vmwLBPoolDownEvent
Critical
Pool Down This event is raised when pool of load balancer is down
1.3.6.1.4.1.6876.100.1.0.80218
vmwLBPoolEmptyEvent
Critical
Pool Empty This event is raised when pool of load balancer is empty. To know pools which are empty, search 'Pool where PoolMembers Count = 0'
Using vRealize Network Insight
VMware, Inc. 114
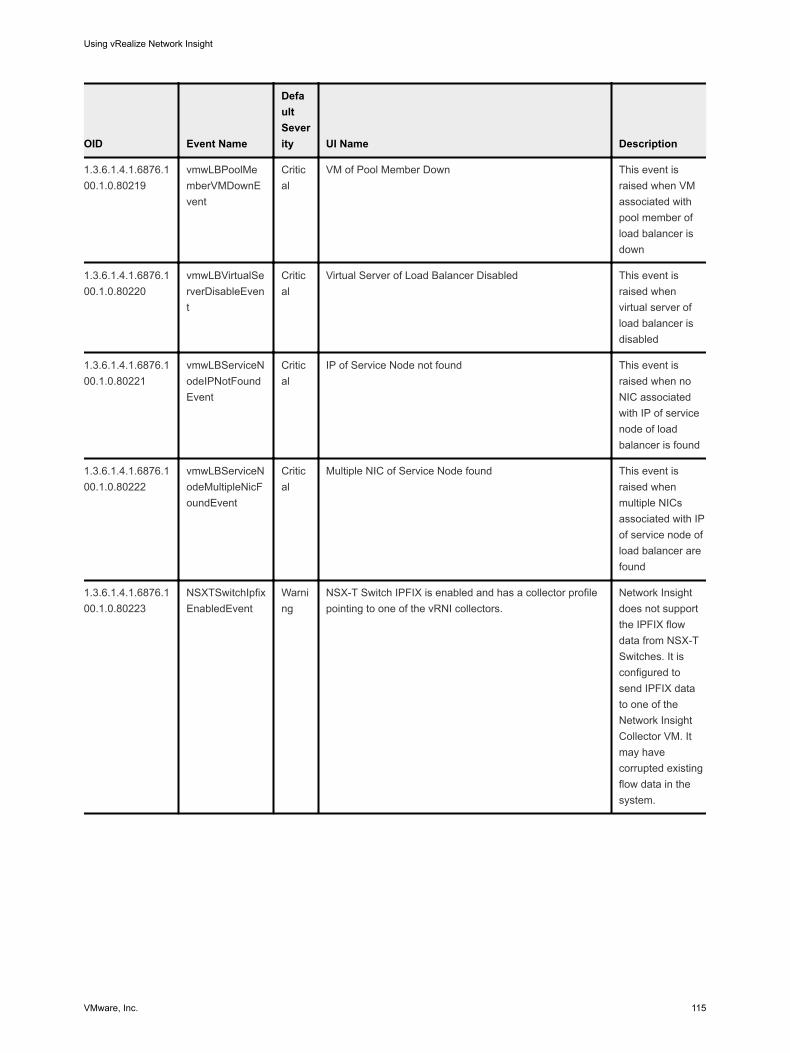
OID Event Name
Default Severity UI Name Description
1.3.6.1.4.1.6876.100.1.0.80219
vmwLBPoolMemberVMDownEvent
Critical
VM of Pool Member Down This event is raised when VM associated with pool member of load balancer is down
1.3.6.1.4.1.6876.100.1.0.80220
vmwLBVirtualServerDisableEvent
Critical
Virtual Server of Load Balancer Disabled This event is raised when virtual server of load balancer is disabled
1.3.6.1.4.1.6876.100.1.0.80221
vmwLBServiceNodeIPNotFoundEvent
Critical
IP of Service Node not found This event is raised when no NIC associated with IP of service node of load balancer is found
1.3.6.1.4.1.6876.100.1.0.80222
vmwLBServiceNodeMultipleNicFoundEvent
Critical
Multiple NIC of Service Node found This event is raised when multiple NICs associated with IP of service node of load balancer are found
1.3.6.1.4.1.6876.100.1.0.80223
NSXTSwitchIpfixEnabledEvent
Warning
NSX-T Switch IPFIX is enabled and has a collector profile pointing to one of the vRNI collectors.
Network Insight does not support the IPFIX flow data from NSX-T Switches. It is configured to send IPFIX data to one of the Network Insight Collector VM. It may have corrupted existing flow data in the system.
Using vRealize Network Insight
VMware, Inc. 115
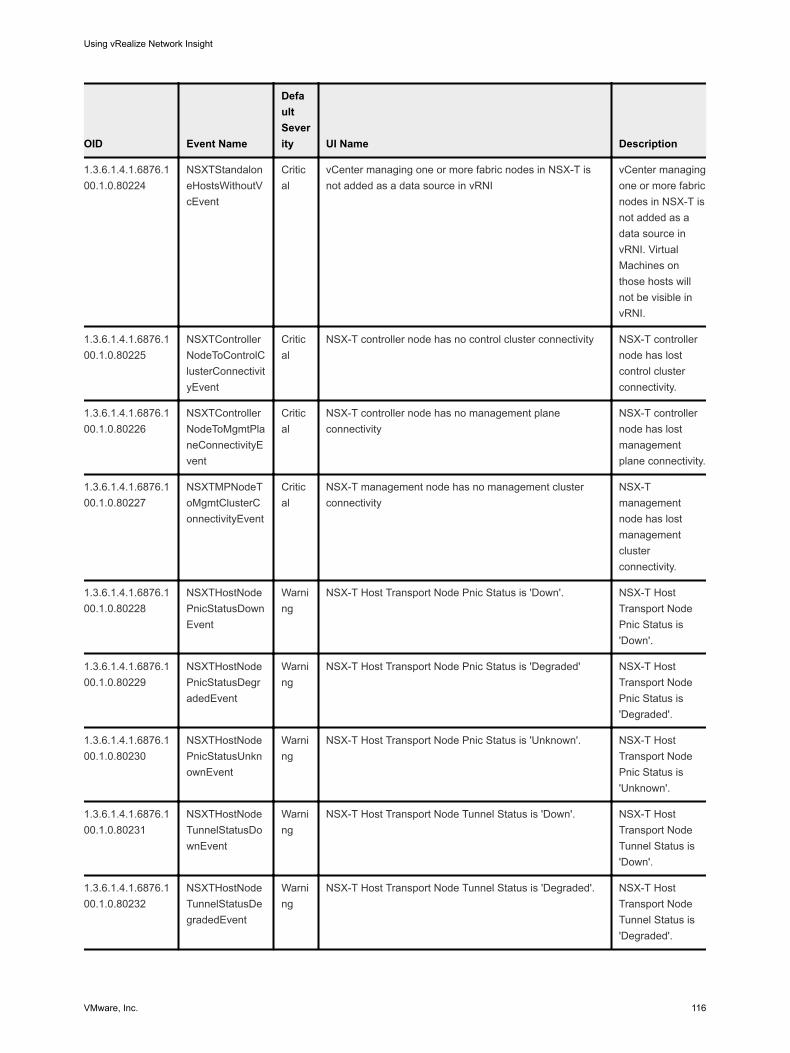
OID Event Name
Default Severity UI Name Description
1.3.6.1.4.1.6876.100.1.0.80224
NSXTStandaloneHostsWithoutVcEvent
Critical
vCenter managing one or more fabric nodes in NSX-T is not added as a data source in vRNI
vCenter managing one or more fabric nodes in NSX-T is not added as a data source in vRNI. Virtual Machines on those hosts will not be visible in vRNI.
1.3.6.1.4.1.6876.100.1.0.80225
NSXTControllerNodeToControlClusterConnectivityEvent
Critical
NSX-T controller node has no control cluster connectivity NSX-T controller node has lost control cluster connectivity.
1.3.6.1.4.1.6876.100.1.0.80226
NSXTControllerNodeToMgmtPlaneConnectivityEvent
Critical
NSX-T controller node has no management plane connectivity
NSX-T controller node has lost management plane connectivity.
1.3.6.1.4.1.6876.100.1.0.80227
NSXTMPNodeToMgmtClusterConnectivityEvent
Critical
NSX-T management node has no management cluster connectivity
NSX-T management node has lost management cluster connectivity.
1.3.6.1.4.1.6876.100.1.0.80228
NSXTHostNodePnicStatusDownEvent
Warning
NSX-T Host Transport Node Pnic Status is 'Down'. NSX-T Host Transport Node Pnic Status is 'Down'.
1.3.6.1.4.1.6876.100.1.0.80229
NSXTHostNodePnicStatusDegradedEvent
Warning
NSX-T Host Transport Node Pnic Status is 'Degraded' NSX-T Host Transport Node Pnic Status is 'Degraded'.
1.3.6.1.4.1.6876.100.1.0.80230
NSXTHostNodePnicStatusUnknownEvent
Warning
NSX-T Host Transport Node Pnic Status is 'Unknown'. NSX-T Host Transport Node Pnic Status is 'Unknown'.
1.3.6.1.4.1.6876.100.1.0.80231
NSXTHostNodeTunnelStatusDownEvent
Warning
NSX-T Host Transport Node Tunnel Status is 'Down'. NSX-T Host Transport Node Tunnel Status is 'Down'.
1.3.6.1.4.1.6876.100.1.0.80232
NSXTHostNodeTunnelStatusDegradedEvent
Warning
NSX-T Host Transport Node Tunnel Status is 'Degraded'. NSX-T Host Transport Node Tunnel Status is 'Degraded'.
Using vRealize Network Insight
VMware, Inc. 116
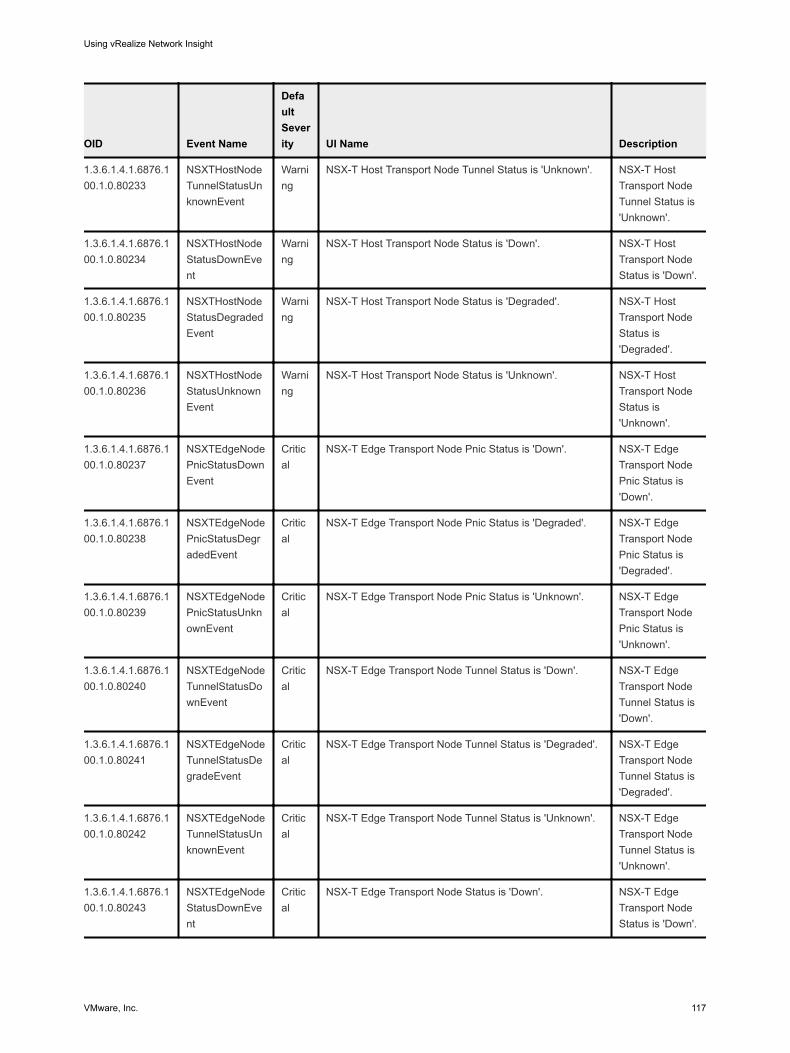
OID Event Name
Default Severity UI Name Description
1.3.6.1.4.1.6876.100.1.0.80233
NSXTHostNodeTunnelStatusUnknownEvent
Warning
NSX-T Host Transport Node Tunnel Status is 'Unknown'. NSX-T Host Transport Node Tunnel Status is 'Unknown'.
1.3.6.1.4.1.6876.100.1.0.80234
NSXTHostNodeStatusDownEvent
Warning
NSX-T Host Transport Node Status is 'Down'. NSX-T Host Transport Node Status is 'Down'.
1.3.6.1.4.1.6876.100.1.0.80235
NSXTHostNodeStatusDegradedEvent
Warning
NSX-T Host Transport Node Status is 'Degraded'. NSX-T Host Transport Node Status is 'Degraded'.
1.3.6.1.4.1.6876.100.1.0.80236
NSXTHostNodeStatusUnknownEvent
Warning
NSX-T Host Transport Node Status is 'Unknown'. NSX-T Host Transport Node Status is 'Unknown'.
1.3.6.1.4.1.6876.100.1.0.80237
NSXTEdgeNodePnicStatusDownEvent
Critical
NSX-T Edge Transport Node Pnic Status is 'Down'. NSX-T Edge Transport Node Pnic Status is 'Down'.
1.3.6.1.4.1.6876.100.1.0.80238
NSXTEdgeNodePnicStatusDegradedEvent
Critical
NSX-T Edge Transport Node Pnic Status is 'Degraded'. NSX-T Edge Transport Node Pnic Status is 'Degraded'.
1.3.6.1.4.1.6876.100.1.0.80239
NSXTEdgeNodePnicStatusUnknownEvent
Critical
NSX-T Edge Transport Node Pnic Status is 'Unknown'. NSX-T Edge Transport Node Pnic Status is 'Unknown'.
1.3.6.1.4.1.6876.100.1.0.80240
NSXTEdgeNodeTunnelStatusDownEvent
Critical
NSX-T Edge Transport Node Tunnel Status is 'Down'. NSX-T Edge Transport Node Tunnel Status is 'Down'.
1.3.6.1.4.1.6876.100.1.0.80241
NSXTEdgeNodeTunnelStatusDegradeEvent
Critical
NSX-T Edge Transport Node Tunnel Status is 'Degraded'. NSX-T Edge Transport Node Tunnel Status is 'Degraded'.
1.3.6.1.4.1.6876.100.1.0.80242
NSXTEdgeNodeTunnelStatusUnknownEvent
Critical
NSX-T Edge Transport Node Tunnel Status is 'Unknown'. NSX-T Edge Transport Node Tunnel Status is 'Unknown'.
1.3.6.1.4.1.6876.100.1.0.80243
NSXTEdgeNodeStatusDownEvent
Critical
NSX-T Edge Transport Node Status is 'Down'. NSX-T Edge Transport Node Status is 'Down'.
Using vRealize Network Insight
VMware, Inc. 117
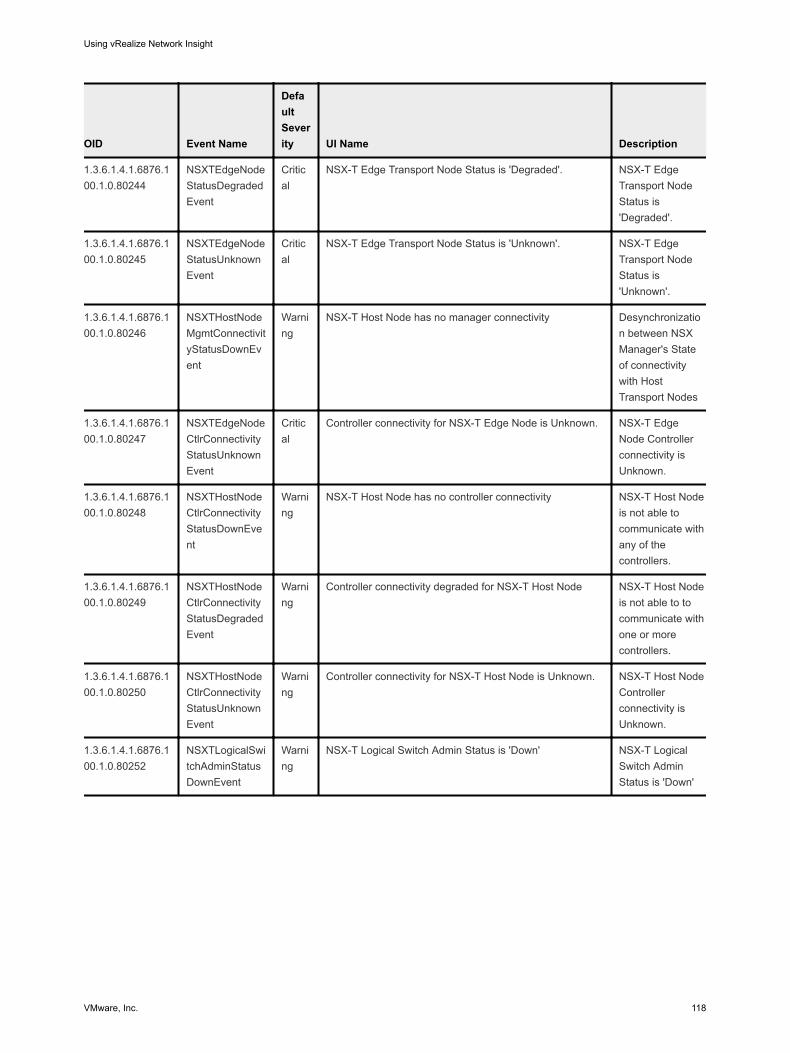
OID Event Name
Default Severity UI Name Description
1.3.6.1.4.1.6876.100.1.0.80244
NSXTEdgeNodeStatusDegradedEvent
Critical
NSX-T Edge Transport Node Status is 'Degraded'. NSX-T Edge Transport Node Status is 'Degraded'.
1.3.6.1.4.1.6876.100.1.0.80245
NSXTEdgeNodeStatusUnknownEvent
Critical
NSX-T Edge Transport Node Status is 'Unknown'. NSX-T Edge Transport Node Status is 'Unknown'.
1.3.6.1.4.1.6876.100.1.0.80246
NSXTHostNodeMgmtConnectivityStatusDownEvent
Warning
NSX-T Host Node has no manager connectivity Desynchronization between NSX Manager's State of connectivity with Host Transport Nodes
1.3.6.1.4.1.6876.100.1.0.80247
NSXTEdgeNodeCtlrConnectivityStatusUnknownEvent
Critical
Controller connectivity for NSX-T Edge Node is Unknown. NSX-T Edge Node Controller connectivity is Unknown.
1.3.6.1.4.1.6876.100.1.0.80248
NSXTHostNodeCtlrConnectivityStatusDownEvent
Warning
NSX-T Host Node has no controller connectivity NSX-T Host Node is not able to communicate with any of the controllers.
1.3.6.1.4.1.6876.100.1.0.80249
NSXTHostNodeCtlrConnectivityStatusDegradedEvent
Warning
Controller connectivity degraded for NSX-T Host Node NSX-T Host Node is not able to to communicate with one or more controllers.
1.3.6.1.4.1.6876.100.1.0.80250
NSXTHostNodeCtlrConnectivityStatusUnknownEvent
Warning
Controller connectivity for NSX-T Host Node is Unknown. NSX-T Host Node Controller connectivity is Unknown.
1.3.6.1.4.1.6876.100.1.0.80252
NSXTLogicalSwitchAdminStatusDownEvent
Warning
NSX-T Logical Switch Admin Status is 'Down' NSX-T Logical Switch Admin Status is 'Down'
Using vRealize Network Insight
VMware, Inc. 118
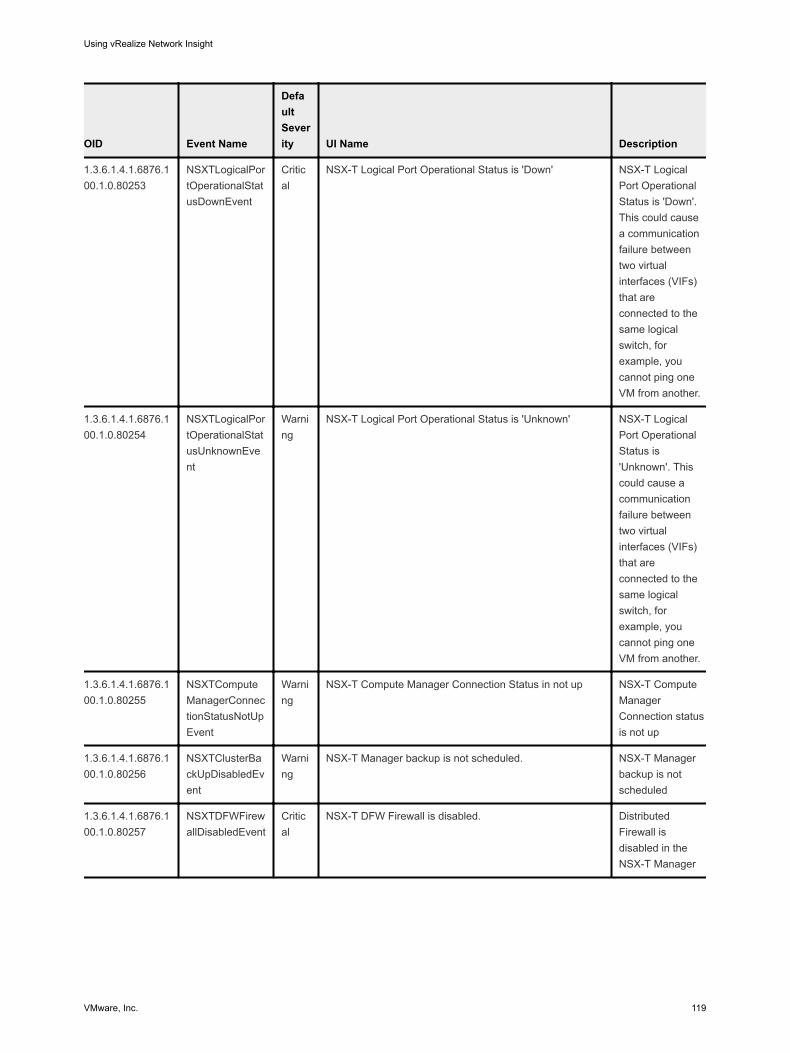
OID Event Name
Default Severity UI Name Description
1.3.6.1.4.1.6876.100.1.0.80253
NSXTLogicalPortOperationalStatusDownEvent
Critical
NSX-T Logical Port Operational Status is 'Down' NSX-T Logical Port Operational Status is 'Down'. This could cause a communication failure between two virtual interfaces (VIFs) that are connected to the same logical switch, for example, you cannot ping one VM from another.
1.3.6.1.4.1.6876.100.1.0.80254
NSXTLogicalPortOperationalStatusUnknownEvent
Warning
NSX-T Logical Port Operational Status is 'Unknown' NSX-T Logical Port Operational Status is 'Unknown'. This could cause a communication failure between two virtual interfaces (VIFs) that are connected to the same logical switch, for example, you cannot ping one VM from another.
1.3.6.1.4.1.6876.100.1.0.80255
NSXTComputeManagerConnectionStatusNotUpEvent
Warning
NSX-T Compute Manager Connection Status in not up NSX-T Compute Manager Connection status is not up
1.3.6.1.4.1.6876.100.1.0.80256
NSXTClusterBackUpDisabledEvent
Warning
NSX-T Manager backup is not scheduled. NSX-T Manager backup is not scheduled
1.3.6.1.4.1.6876.100.1.0.80257
NSXTDFWFirewallDisabledEvent
Critical
NSX-T DFW Firewall is disabled. Distributed Firewall is disabled in the NSX-T Manager
Using vRealize Network Insight
VMware, Inc. 119
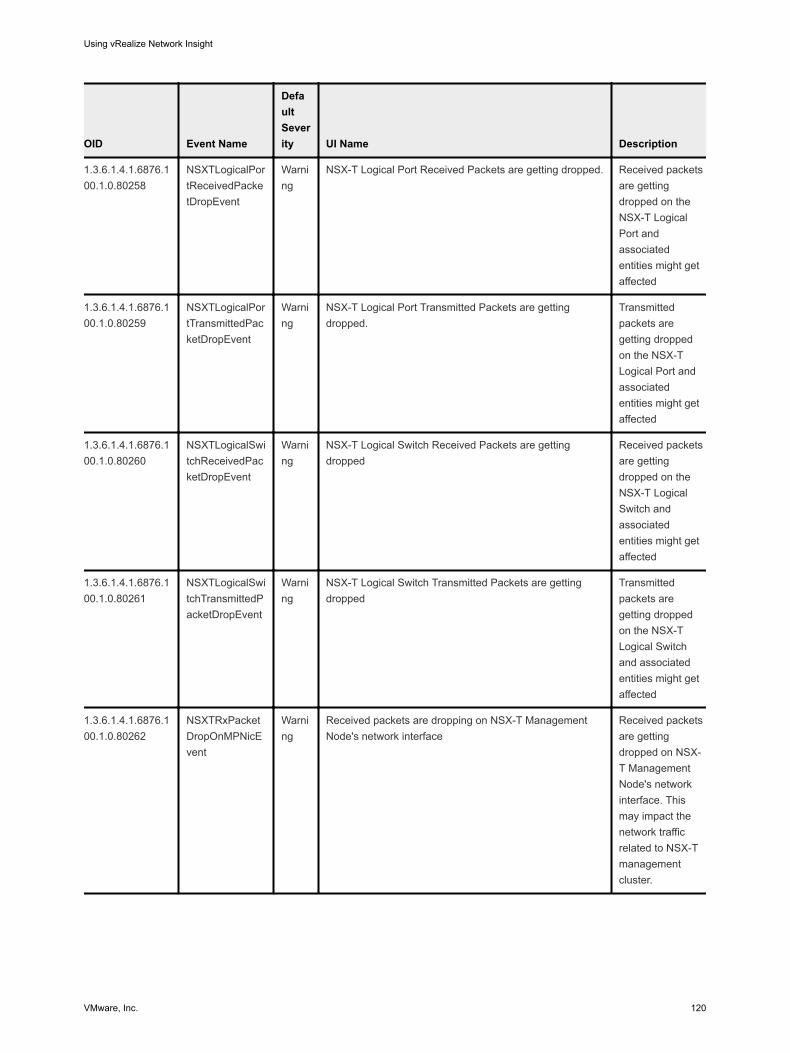
OID Event Name
Default Severity UI Name Description
1.3.6.1.4.1.6876.100.1.0.80258
NSXTLogicalPortReceivedPacketDropEvent
Warning
NSX-T Logical Port Received Packets are getting dropped. Received packets are getting dropped on the NSX-T Logical Port and associated entities might get affected
1.3.6.1.4.1.6876.100.1.0.80259
NSXTLogicalPortTransmittedPacketDropEvent
Warning
NSX-T Logical Port Transmitted Packets are getting dropped.
Transmitted packets are getting dropped on the NSX-T Logical Port and associated entities might get affected
1.3.6.1.4.1.6876.100.1.0.80260
NSXTLogicalSwitchReceivedPacketDropEvent
Warning
NSX-T Logical Switch Received Packets are getting dropped
Received packets are getting dropped on the NSX-T Logical Switch and associated entities might get affected
1.3.6.1.4.1.6876.100.1.0.80261
NSXTLogicalSwitchTransmittedPacketDropEvent
Warning
NSX-T Logical Switch Transmitted Packets are getting dropped
Transmitted packets are getting dropped on the NSX-T Logical Switch and associated entities might get affected
1.3.6.1.4.1.6876.100.1.0.80262
NSXTRxPacketDropOnMPNicEvent
Warning
Received packets are dropping on NSX-T Management Node's network interface
Received packets are getting dropped on NSX-T Management Node's network interface. This may impact the network traffic related to NSX-T management cluster.
Using vRealize Network Insight
VMware, Inc. 120
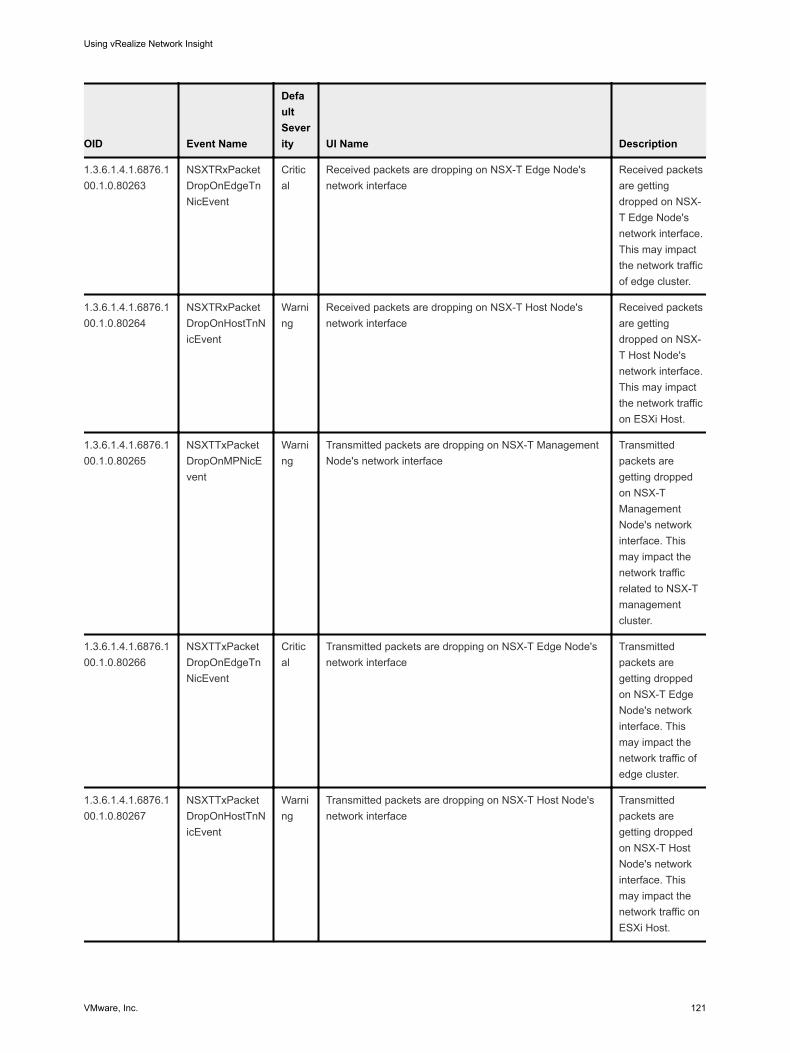
OID Event Name
Default Severity UI Name Description
1.3.6.1.4.1.6876.100.1.0.80263
NSXTRxPacketDropOnEdgeTnNicEvent
Critical
Received packets are dropping on NSX-T Edge Node's network interface
Received packets are getting dropped on NSX-T Edge Node's network interface. This may impact the network traffic of edge cluster.
1.3.6.1.4.1.6876.100.1.0.80264
NSXTRxPacketDropOnHostTnNicEvent
Warning
Received packets are dropping on NSX-T Host Node's network interface
Received packets are getting dropped on NSX-T Host Node's network interface. This may impact the network traffic on ESXi Host.
1.3.6.1.4.1.6876.100.1.0.80265
NSXTTxPacketDropOnMPNicEvent
Warning
Transmitted packets are dropping on NSX-T Management Node's network interface
Transmitted packets are getting dropped on NSX-T Management Node's network interface. This may impact the network traffic related to NSX-T management cluster.
1.3.6.1.4.1.6876.100.1.0.80266
NSXTTxPacketDropOnEdgeTnNicEvent
Critical
Transmitted packets are dropping on NSX-T Edge Node's network interface
Transmitted packets are getting dropped on NSX-T Edge Node's network interface. This may impact the network traffic of edge cluster.
1.3.6.1.4.1.6876.100.1.0.80267
NSXTTxPacketDropOnHostTnNicEvent
Warning
Transmitted packets are dropping on NSX-T Host Node's network interface
Transmitted packets are getting dropped on NSX-T Host Node's network interface. This may impact the network traffic on ESXi Host.
Using vRealize Network Insight
VMware, Inc. 121
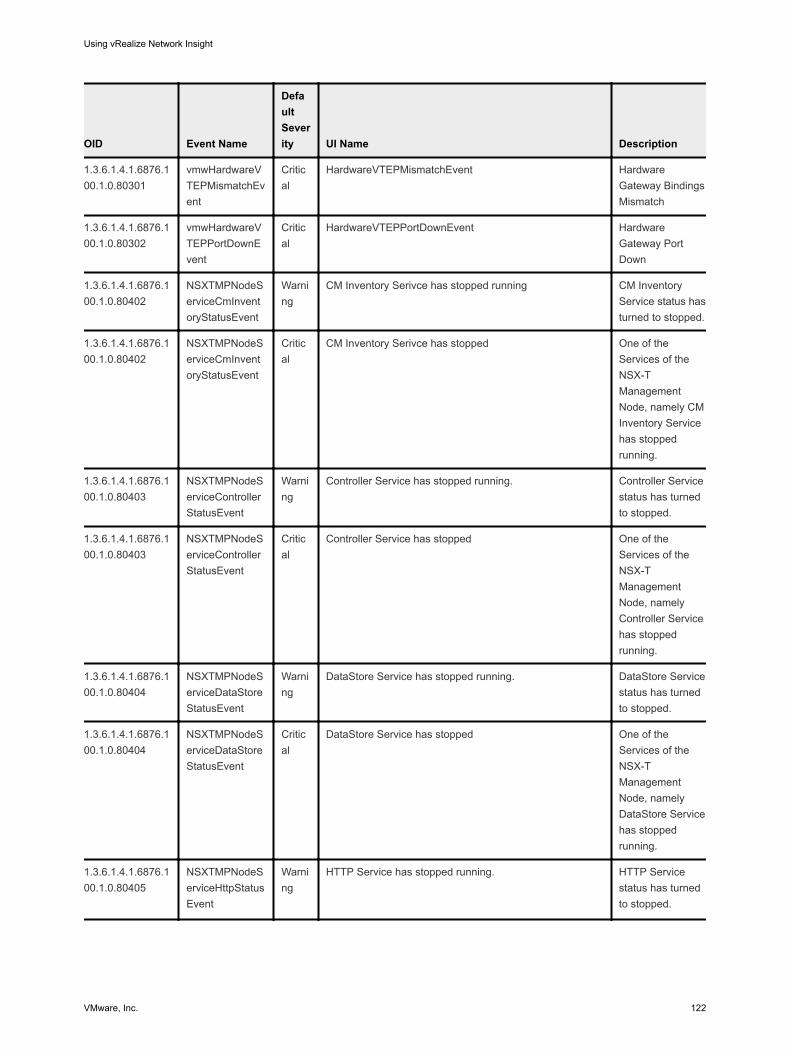
OID Event Name
Default Severity UI Name Description
1.3.6.1.4.1.6876.100.1.0.80301
vmwHardwareVTEPMismatchEvent
Critical
HardwareVTEPMismatchEvent Hardware Gateway Bindings Mismatch
1.3.6.1.4.1.6876.100.1.0.80302
vmwHardwareVTEPPortDownEvent
Critical
HardwareVTEPPortDownEvent Hardware Gateway Port Down
1.3.6.1.4.1.6876.100.1.0.80402
NSXTMPNodeServiceCmInventoryStatusEvent
Warning
CM Inventory Serivce has stopped running CM Inventory Service status has turned to stopped.
1.3.6.1.4.1.6876.100.1.0.80402
NSXTMPNodeServiceCmInventoryStatusEvent
Critical
CM Inventory Serivce has stopped One of the Services of the NSX-T Management Node, namely CM Inventory Service has stopped running.
1.3.6.1.4.1.6876.100.1.0.80403
NSXTMPNodeServiceControllerStatusEvent
Warning
Controller Service has stopped running. Controller Service status has turned to stopped.
1.3.6.1.4.1.6876.100.1.0.80403
NSXTMPNodeServiceControllerStatusEvent
Critical
Controller Service has stopped One of the Services of the NSX-T Management Node, namely Controller Service has stopped running.
1.3.6.1.4.1.6876.100.1.0.80404
NSXTMPNodeServiceDataStoreStatusEvent
Warning
DataStore Service has stopped running. DataStore Service status has turned to stopped.
1.3.6.1.4.1.6876.100.1.0.80404
NSXTMPNodeServiceDataStoreStatusEvent
Critical
DataStore Service has stopped One of the Services of the NSX-T Management Node, namely DataStore Service has stopped running.
1.3.6.1.4.1.6876.100.1.0.80405
NSXTMPNodeServiceHttpStatusEvent
Warning
HTTP Service has stopped running. HTTP Service status has turned to stopped.
Using vRealize Network Insight
VMware, Inc. 122
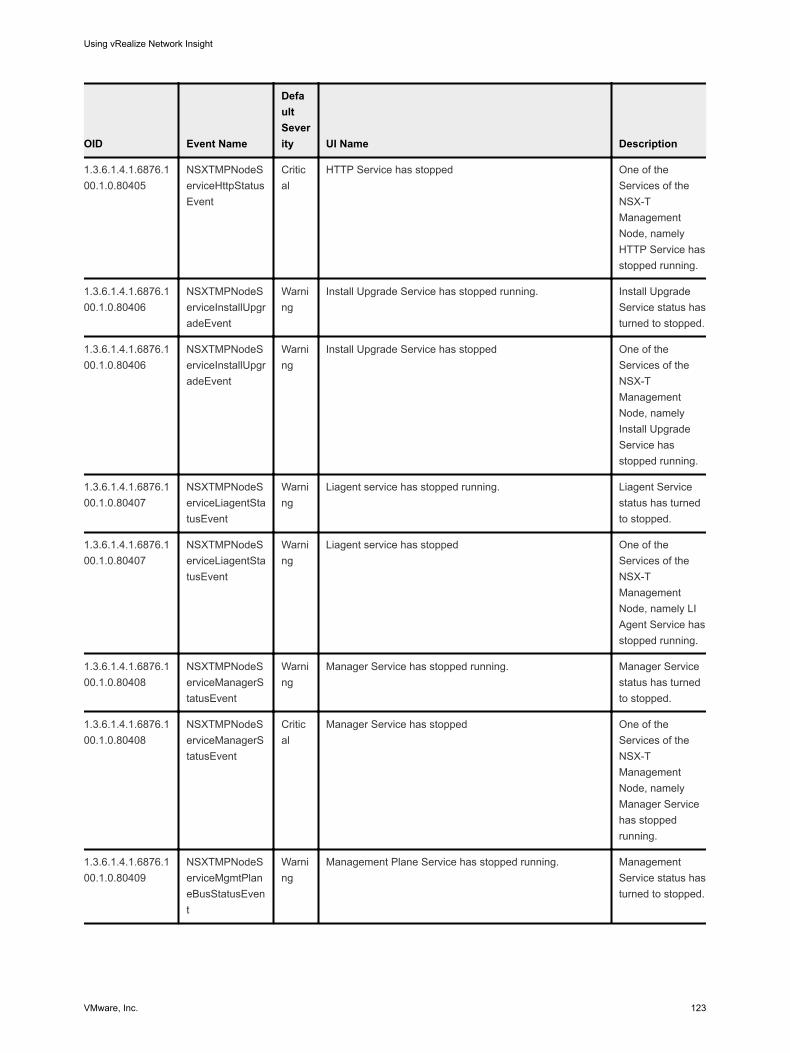
OID Event Name
Default Severity UI Name Description
1.3.6.1.4.1.6876.100.1.0.80405
NSXTMPNodeServiceHttpStatusEvent
Critical
HTTP Service has stopped One of the Services of the NSX-T Management Node, namely HTTP Service has stopped running.
1.3.6.1.4.1.6876.100.1.0.80406
NSXTMPNodeServiceInstallUpgradeEvent
Warning
Install Upgrade Service has stopped running. Install Upgrade Service status has turned to stopped.
1.3.6.1.4.1.6876.100.1.0.80406
NSXTMPNodeServiceInstallUpgradeEvent
Warning
Install Upgrade Service has stopped One of the Services of the NSX-T Management Node, namely Install Upgrade Service has stopped running.
1.3.6.1.4.1.6876.100.1.0.80407
NSXTMPNodeServiceLiagentStatusEvent
Warning
Liagent service has stopped running. Liagent Service status has turned to stopped.
1.3.6.1.4.1.6876.100.1.0.80407
NSXTMPNodeServiceLiagentStatusEvent
Warning
Liagent service has stopped One of the Services of the NSX-T Management Node, namely LI Agent Service has stopped running.
1.3.6.1.4.1.6876.100.1.0.80408
NSXTMPNodeServiceManagerStatusEvent
Warning
Manager Service has stopped running. Manager Service status has turned to stopped.
1.3.6.1.4.1.6876.100.1.0.80408
NSXTMPNodeServiceManagerStatusEvent
Critical
Manager Service has stopped One of the Services of the NSX-T Management Node, namely Manager Service has stopped running.
1.3.6.1.4.1.6876.100.1.0.80409
NSXTMPNodeServiceMgmtPlaneBusStatusEvent
Warning
Management Plane Service has stopped running. Management Service status has turned to stopped.
Using vRealize Network Insight
VMware, Inc. 123
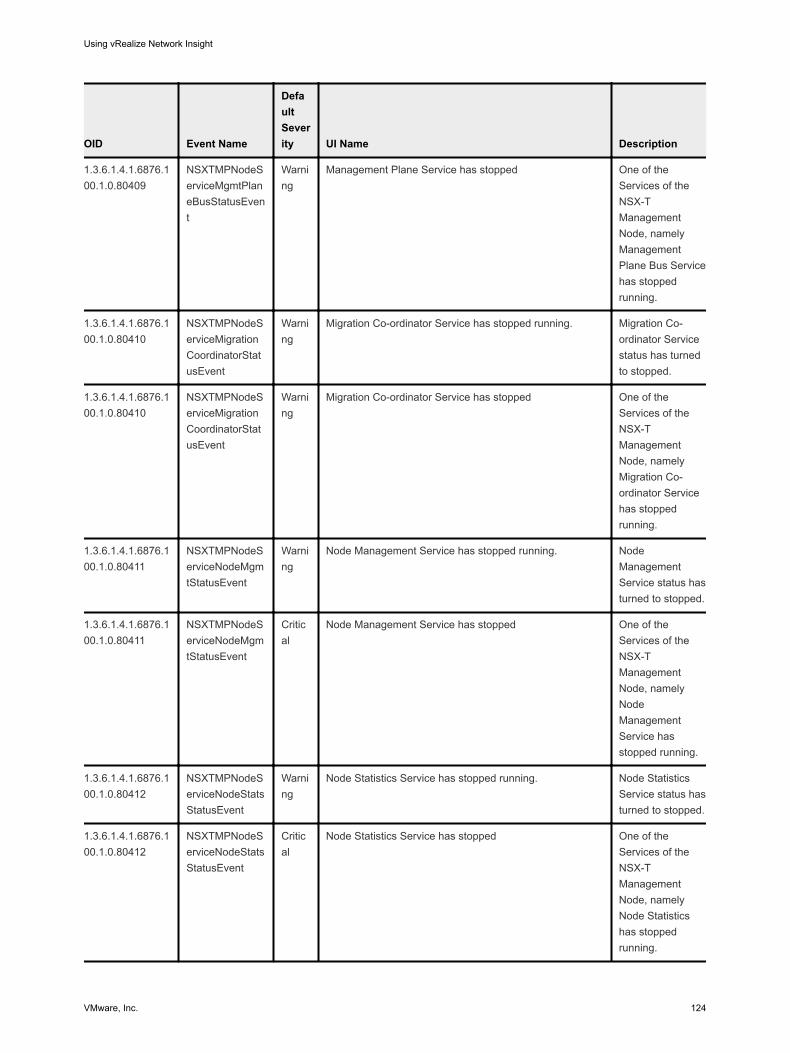
OID Event Name
Default Severity UI Name Description
1.3.6.1.4.1.6876.100.1.0.80409
NSXTMPNodeServiceMgmtPlaneBusStatusEvent
Warning
Management Plane Service has stopped One of the Services of the NSX-T Management Node, namely Management Plane Bus Service has stopped running.
1.3.6.1.4.1.6876.100.1.0.80410
NSXTMPNodeServiceMigrationCoordinatorStatusEvent
Warning
Migration Co-ordinator Service has stopped running. Migration Co-ordinator Service status has turned to stopped.
1.3.6.1.4.1.6876.100.1.0.80410
NSXTMPNodeServiceMigrationCoordinatorStatusEvent
Warning
Migration Co-ordinator Service has stopped One of the Services of the NSX-T Management Node, namely Migration Co-ordinator Service has stopped running.
1.3.6.1.4.1.6876.100.1.0.80411
NSXTMPNodeServiceNodeMgmtStatusEvent
Warning
Node Management Service has stopped running. Node Management Service status has turned to stopped.
1.3.6.1.4.1.6876.100.1.0.80411
NSXTMPNodeServiceNodeMgmtStatusEvent
Critical
Node Management Service has stopped One of the Services of the NSX-T Management Node, namely Node Management Service has stopped running.
1.3.6.1.4.1.6876.100.1.0.80412
NSXTMPNodeServiceNodeStatsStatusEvent
Warning
Node Statistics Service has stopped running. Node Statistics Service status has turned to stopped.
1.3.6.1.4.1.6876.100.1.0.80412
NSXTMPNodeServiceNodeStatsStatusEvent
Critical
Node Statistics Service has stopped One of the Services of the NSX-T Management Node, namely Node Statistics has stopped running.
Using vRealize Network Insight
VMware, Inc. 124
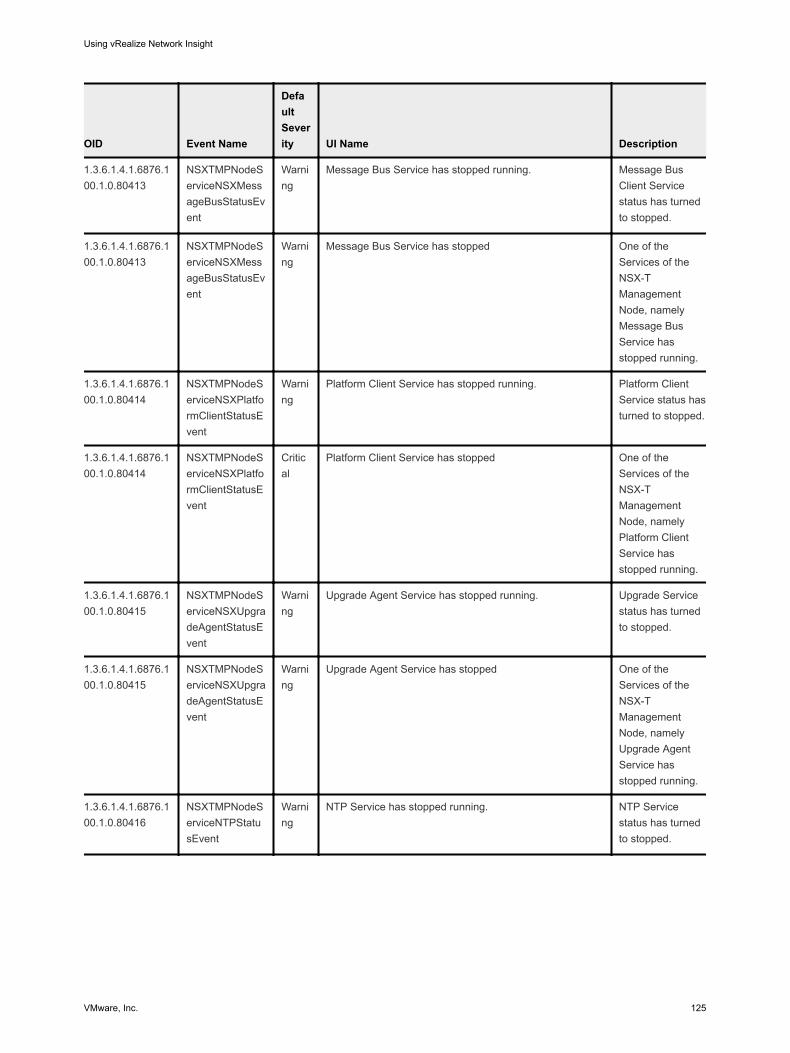
OID Event Name
Default Severity UI Name Description
1.3.6.1.4.1.6876.100.1.0.80413
NSXTMPNodeServiceNSXMessageBusStatusEvent
Warning
Message Bus Service has stopped running. Message Bus Client Service status has turned to stopped.
1.3.6.1.4.1.6876.100.1.0.80413
NSXTMPNodeServiceNSXMessageBusStatusEvent
Warning
Message Bus Service has stopped One of the Services of the NSX-T Management Node, namely Message Bus Service has stopped running.
1.3.6.1.4.1.6876.100.1.0.80414
NSXTMPNodeServiceNSXPlatformClientStatusEvent
Warning
Platform Client Service has stopped running. Platform Client Service status has turned to stopped.
1.3.6.1.4.1.6876.100.1.0.80414
NSXTMPNodeServiceNSXPlatformClientStatusEvent
Critical
Platform Client Service has stopped One of the Services of the NSX-T Management Node, namely Platform Client Service has stopped running.
1.3.6.1.4.1.6876.100.1.0.80415
NSXTMPNodeServiceNSXUpgradeAgentStatusEvent
Warning
Upgrade Agent Service has stopped running. Upgrade Service status has turned to stopped.
1.3.6.1.4.1.6876.100.1.0.80415
NSXTMPNodeServiceNSXUpgradeAgentStatusEvent
Warning
Upgrade Agent Service has stopped One of the Services of the NSX-T Management Node, namely Upgrade Agent Service has stopped running.
1.3.6.1.4.1.6876.100.1.0.80416
NSXTMPNodeServiceNTPStatusEvent
Warning
NTP Service has stopped running. NTP Service status has turned to stopped.
Using vRealize Network Insight
VMware, Inc. 125
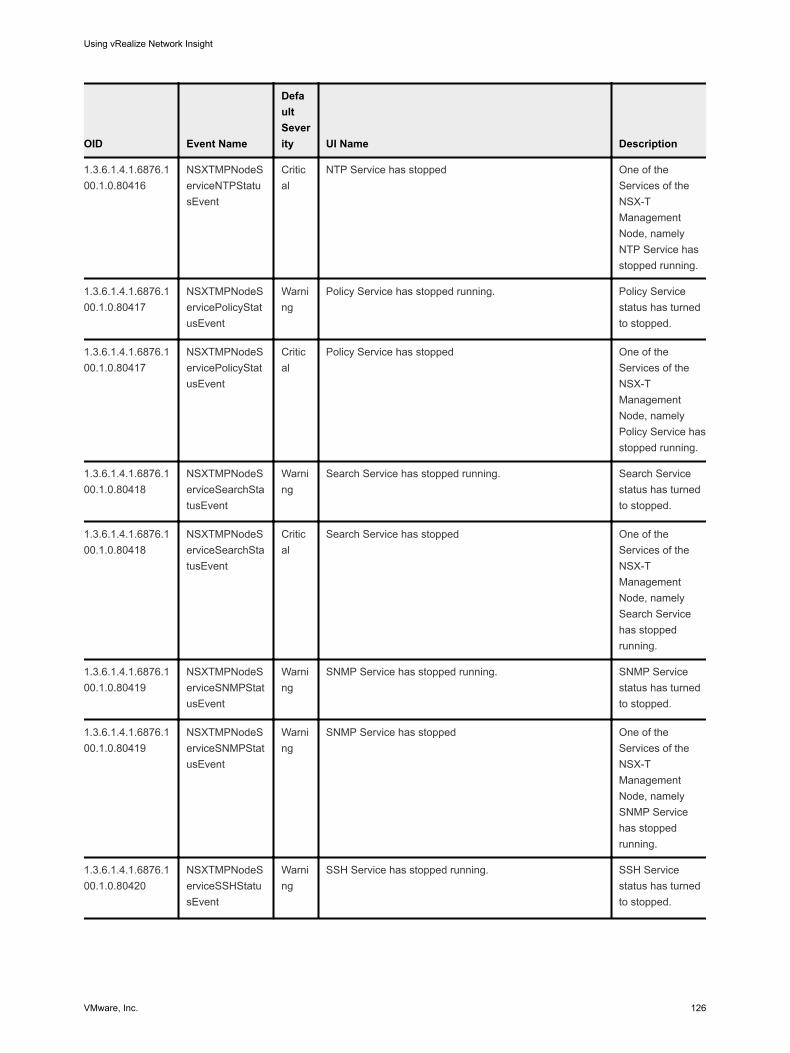
OID Event Name
Default Severity UI Name Description
1.3.6.1.4.1.6876.100.1.0.80416
NSXTMPNodeServiceNTPStatusEvent
Critical
NTP Service has stopped One of the Services of the NSX-T Management Node, namely NTP Service has stopped running.
1.3.6.1.4.1.6876.100.1.0.80417
NSXTMPNodeServicePolicyStatusEvent
Warning
Policy Service has stopped running. Policy Service status has turned to stopped.
1.3.6.1.4.1.6876.100.1.0.80417
NSXTMPNodeServicePolicyStatusEvent
Critical
Policy Service has stopped One of the Services of the NSX-T Management Node, namely Policy Service has stopped running.
1.3.6.1.4.1.6876.100.1.0.80418
NSXTMPNodeServiceSearchStatusEvent
Warning
Search Service has stopped running. Search Service status has turned to stopped.
1.3.6.1.4.1.6876.100.1.0.80418
NSXTMPNodeServiceSearchStatusEvent
Critical
Search Service has stopped One of the Services of the NSX-T Management Node, namely Search Service has stopped running.
1.3.6.1.4.1.6876.100.1.0.80419
NSXTMPNodeServiceSNMPStatusEvent
Warning
SNMP Service has stopped running. SNMP Service status has turned to stopped.
1.3.6.1.4.1.6876.100.1.0.80419
NSXTMPNodeServiceSNMPStatusEvent
Warning
SNMP Service has stopped One of the Services of the NSX-T Management Node, namely SNMP Service has stopped running.
1.3.6.1.4.1.6876.100.1.0.80420
NSXTMPNodeServiceSSHStatusEvent
Warning
SSH Service has stopped running. SSH Service status has turned to stopped.
Using vRealize Network Insight
VMware, Inc. 126
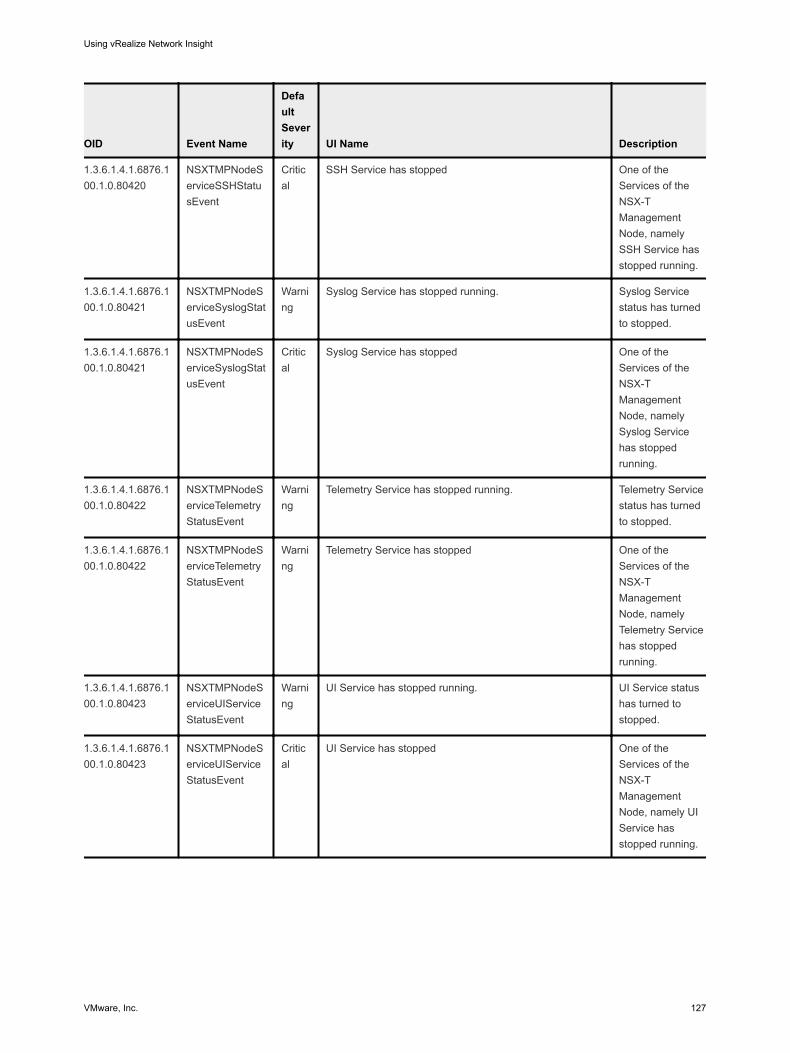
OID Event Name
Default Severity UI Name Description
1.3.6.1.4.1.6876.100.1.0.80420
NSXTMPNodeServiceSSHStatusEvent
Critical
SSH Service has stopped One of the Services of the NSX-T Management Node, namely SSH Service has stopped running.
1.3.6.1.4.1.6876.100.1.0.80421
NSXTMPNodeServiceSyslogStatusEvent
Warning
Syslog Service has stopped running. Syslog Service status has turned to stopped.
1.3.6.1.4.1.6876.100.1.0.80421
NSXTMPNodeServiceSyslogStatusEvent
Critical
Syslog Service has stopped One of the Services of the NSX-T Management Node, namely Syslog Service has stopped running.
1.3.6.1.4.1.6876.100.1.0.80422
NSXTMPNodeServiceTelemetryStatusEvent
Warning
Telemetry Service has stopped running. Telemetry Service status has turned to stopped.
1.3.6.1.4.1.6876.100.1.0.80422
NSXTMPNodeServiceTelemetryStatusEvent
Warning
Telemetry Service has stopped One of the Services of the NSX-T Management Node, namely Telemetry Service has stopped running.
1.3.6.1.4.1.6876.100.1.0.80423
NSXTMPNodeServiceUIServiceStatusEvent
Warning
UI Service has stopped running. UI Service status has turned to stopped.
1.3.6.1.4.1.6876.100.1.0.80423
NSXTMPNodeServiceUIServiceStatusEvent
Critical
UI Service has stopped One of the Services of the NSX-T Management Node, namely UI Service has stopped running.
Using vRealize Network Insight
VMware, Inc. 127
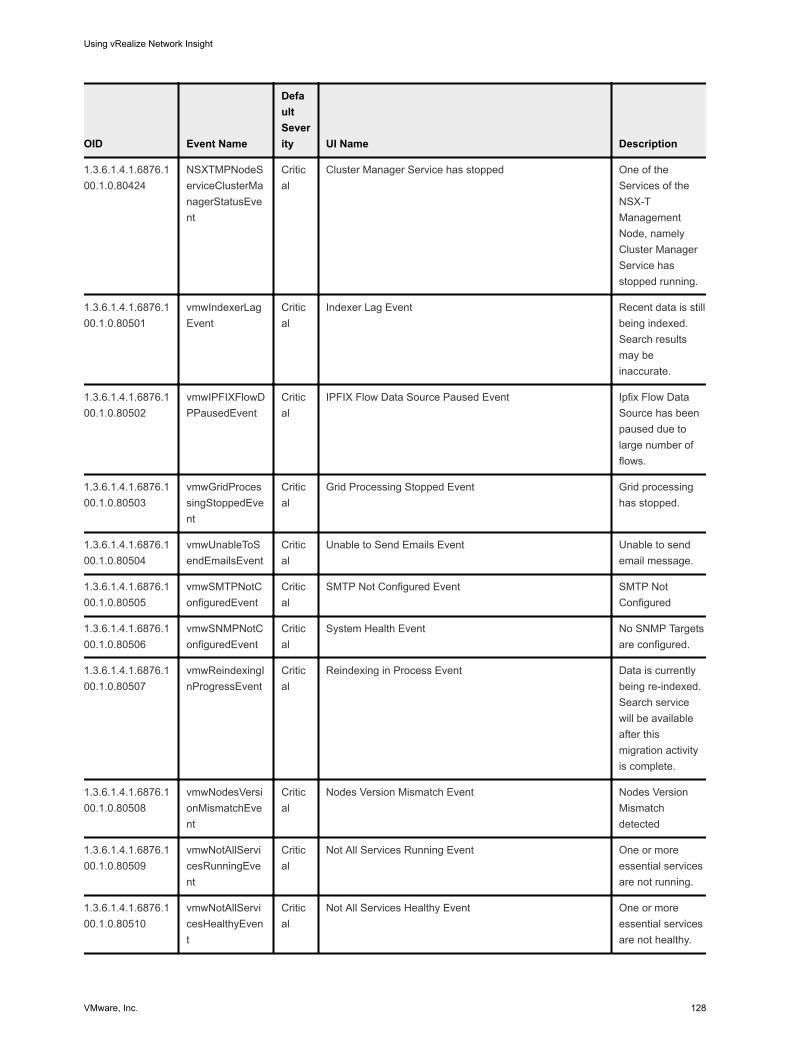
OID Event Name
Default Severity UI Name Description
1.3.6.1.4.1.6876.100.1.0.80424
NSXTMPNodeServiceClusterManagerStatusEvent
Critical
Cluster Manager Service has stopped One of the Services of the NSX-T Management Node, namely Cluster Manager Service has stopped running.
1.3.6.1.4.1.6876.100.1.0.80501
vmwIndexerLagEvent
Critical
Indexer Lag Event Recent data is still being indexed. Search results may be inaccurate.
1.3.6.1.4.1.6876.100.1.0.80502
vmwIPFIXFlowDPPausedEvent
Critical
IPFIX Flow Data Source Paused Event Ipfix Flow Data Source has been paused due to large number of flows.
1.3.6.1.4.1.6876.100.1.0.80503
vmwGridProcessingStoppedEvent
Critical
Grid Processing Stopped Event Grid processing has stopped.
1.3.6.1.4.1.6876.100.1.0.80504
vmwUnableToSendEmailsEvent
Critical
Unable to Send Emails Event Unable to send email message.
1.3.6.1.4.1.6876.100.1.0.80505
vmwSMTPNotConfiguredEvent
Critical
SMTP Not Configured Event SMTP Not Configured
1.3.6.1.4.1.6876.100.1.0.80506
vmwSNMPNotConfiguredEvent
Critical
System Health Event No SNMP Targets are configured.
1.3.6.1.4.1.6876.100.1.0.80507
vmwReindexingInProgressEvent
Critical
Reindexing in Process Event Data is currently being re-indexed. Search service will be available after this migration activity is complete.
1.3.6.1.4.1.6876.100.1.0.80508
vmwNodesVersionMismatchEvent
Critical
Nodes Version Mismatch Event Nodes Version Mismatch detected
1.3.6.1.4.1.6876.100.1.0.80509
vmwNotAllServicesRunningEvent
Critical
Not All Services Running Event One or more essential services are not running.
1.3.6.1.4.1.6876.100.1.0.80510
vmwNotAllServicesHealthyEvent
Critical
Not All Services Healthy Event One or more essential services are not healthy.
Using vRealize Network Insight
VMware, Inc. 128
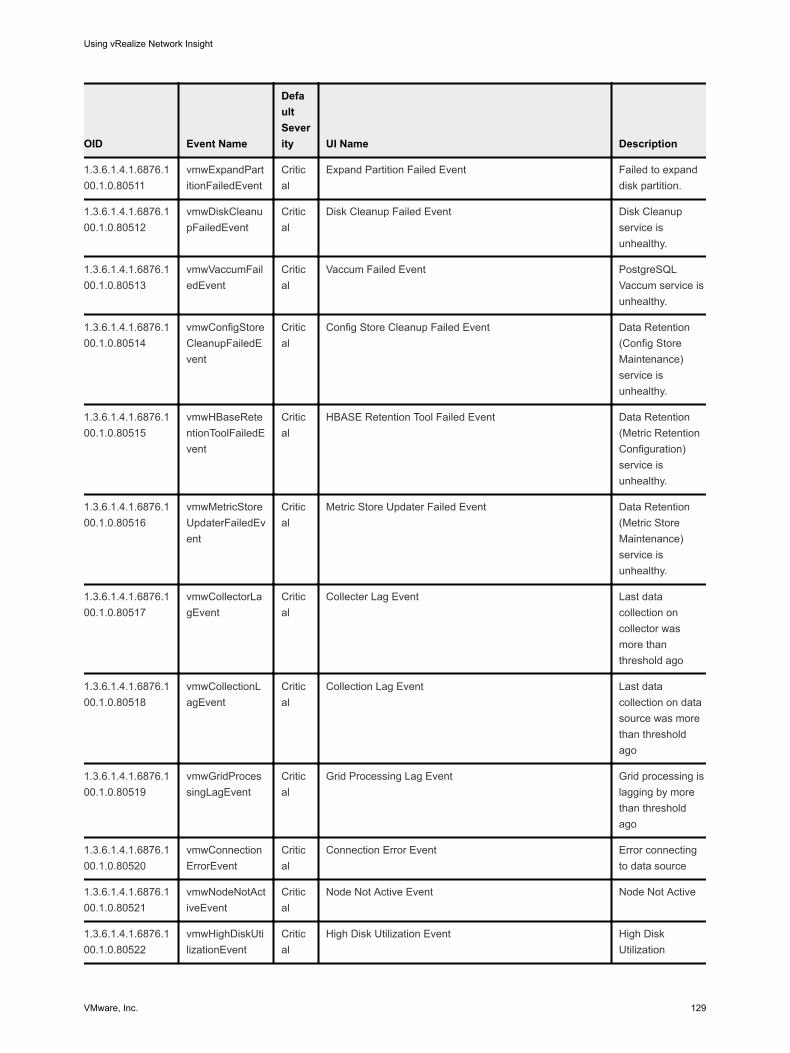
OID Event Name
Default Severity UI Name Description
1.3.6.1.4.1.6876.100.1.0.80511
vmwExpandPartitionFailedEvent
Critical
Expand Partition Failed Event Failed to expand disk partition.
1.3.6.1.4.1.6876.100.1.0.80512
vmwDiskCleanupFailedEvent
Critical
Disk Cleanup Failed Event Disk Cleanup service is unhealthy.
1.3.6.1.4.1.6876.100.1.0.80513
vmwVaccumFailedEvent
Critical
Vaccum Failed Event PostgreSQL Vaccum service is unhealthy.
1.3.6.1.4.1.6876.100.1.0.80514
vmwConfigStoreCleanupFailedEvent
Critical
Config Store Cleanup Failed Event Data Retention (Config Store Maintenance) service is unhealthy.
1.3.6.1.4.1.6876.100.1.0.80515
vmwHBaseRetentionToolFailedEvent
Critical
HBASE Retention Tool Failed Event Data Retention (Metric Retention Configuration) service is unhealthy.
1.3.6.1.4.1.6876.100.1.0.80516
vmwMetricStoreUpdaterFailedEvent
Critical
Metric Store Updater Failed Event Data Retention (Metric Store Maintenance) service is unhealthy.
1.3.6.1.4.1.6876.100.1.0.80517
vmwCollectorLagEvent
Critical
Collecter Lag Event Last data collection on collector was more than threshold ago
1.3.6.1.4.1.6876.100.1.0.80518
vmwCollectionLagEvent
Critical
Collection Lag Event Last data collection on data source was more than threshold ago
1.3.6.1.4.1.6876.100.1.0.80519
vmwGridProcessingLagEvent
Critical
Grid Processing Lag Event Grid processing is lagging by more than threshold ago
1.3.6.1.4.1.6876.100.1.0.80520
vmwConnectionErrorEvent
Critical
Connection Error Event Error connecting to data source
1.3.6.1.4.1.6876.100.1.0.80521
vmwNodeNotActiveEvent
Critical
Node Not Active Event Node Not Active
1.3.6.1.4.1.6876.100.1.0.80522
vmwHighDiskUtilizationEvent
Critical
High Disk Utilization Event High Disk Utilization
Using vRealize Network Insight
VMware, Inc. 129
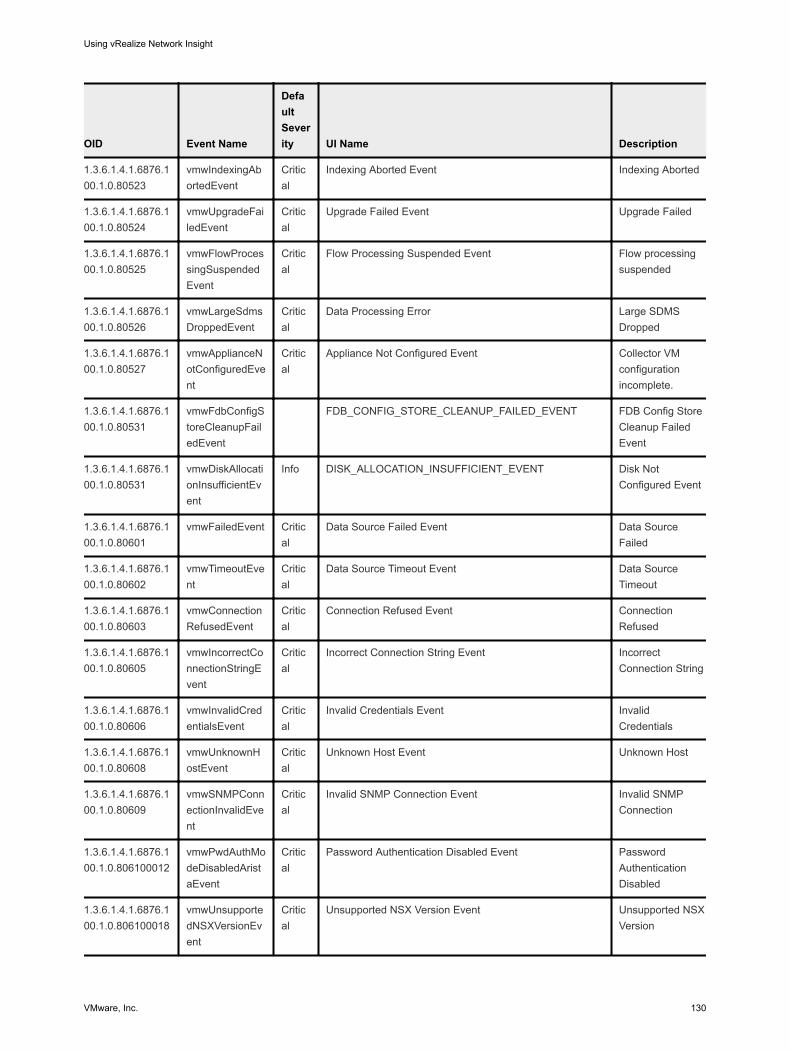
OID Event Name
Default Severity UI Name Description
1.3.6.1.4.1.6876.100.1.0.80523
vmwIndexingAbortedEvent
Critical
Indexing Aborted Event Indexing Aborted
1.3.6.1.4.1.6876.100.1.0.80524
vmwUpgradeFailedEvent
Critical
Upgrade Failed Event Upgrade Failed
1.3.6.1.4.1.6876.100.1.0.80525
vmwFlowProcessingSuspendedEvent
Critical
Flow Processing Suspended Event Flow processing suspended
1.3.6.1.4.1.6876.100.1.0.80526
vmwLargeSdmsDroppedEvent
Critical
Data Processing Error Large SDMS Dropped
1.3.6.1.4.1.6876.100.1.0.80527
vmwApplianceNotConfiguredEvent
Critical
Appliance Not Configured Event Collector VM configuration incomplete.
1.3.6.1.4.1.6876.100.1.0.80531
vmwFdbConfigStoreCleanupFailedEvent
FDB_CONFIG_STORE_CLEANUP_FAILED_EVENT FDB Config Store Cleanup Failed Event
1.3.6.1.4.1.6876.100.1.0.80531
vmwDiskAllocationInsufficientEvent
Info DISK_ALLOCATION_INSUFFICIENT_EVENT Disk Not Configured Event
1.3.6.1.4.1.6876.100.1.0.80601
vmwFailedEvent Critical
Data Source Failed Event Data Source Failed
1.3.6.1.4.1.6876.100.1.0.80602
vmwTimeoutEvent
Critical
Data Source Timeout Event Data Source Timeout
1.3.6.1.4.1.6876.100.1.0.80603
vmwConnectionRefusedEvent
Critical
Connection Refused Event Connection Refused
1.3.6.1.4.1.6876.100.1.0.80605
vmwIncorrectConnectionStringEvent
Critical
Incorrect Connection String Event Incorrect Connection String
1.3.6.1.4.1.6876.100.1.0.80606
vmwInvalidCredentialsEvent
Critical
Invalid Credentials Event Invalid Credentials
1.3.6.1.4.1.6876.100.1.0.80608
vmwUnknownHostEvent
Critical
Unknown Host Event Unknown Host
1.3.6.1.4.1.6876.100.1.0.80609
vmwSNMPConnectionInvalidEvent
Critical
Invalid SNMP Connection Event Invalid SNMP Connection
1.3.6.1.4.1.6876.100.1.0.806100012
vmwPwdAuthModeDisabledAristaEvent
Critical
Password Authentication Disabled Event Password Authentication Disabled
1.3.6.1.4.1.6876.100.1.0.806100018
vmwUnsupportedNSXVersionEvent
Critical
Unsupported NSX Version Event Unsupported NSX Version
Using vRealize Network Insight
VMware, Inc. 130
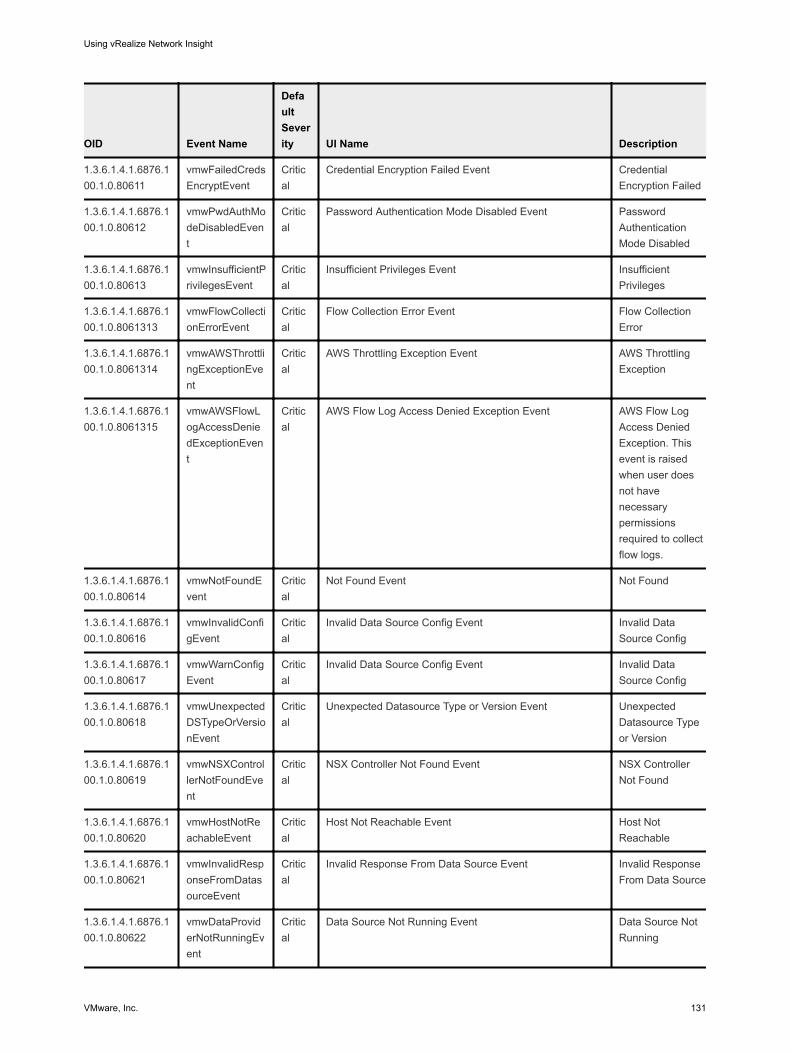
OID Event Name
Default Severity UI Name Description
1.3.6.1.4.1.6876.100.1.0.80611
vmwFailedCredsEncryptEvent
Critical
Credential Encryption Failed Event Credential Encryption Failed
1.3.6.1.4.1.6876.100.1.0.80612
vmwPwdAuthModeDisabledEvent
Critical
Password Authentication Mode Disabled Event Password Authentication Mode Disabled
1.3.6.1.4.1.6876.100.1.0.80613
vmwInsufficientPrivilegesEvent
Critical
Insufficient Privileges Event Insufficient Privileges
1.3.6.1.4.1.6876.100.1.0.8061313
vmwFlowCollectionErrorEvent
Critical
Flow Collection Error Event Flow Collection Error
1.3.6.1.4.1.6876.100.1.0.8061314
vmwAWSThrottlingExceptionEvent
Critical
AWS Throttling Exception Event AWS Throttling Exception
1.3.6.1.4.1.6876.100.1.0.8061315
vmwAWSFlowLogAccessDeniedExceptionEvent
Critical
AWS Flow Log Access Denied Exception Event AWS Flow Log Access Denied Exception. This event is raised when user does not have necessary permissions required to collect flow logs.
1.3.6.1.4.1.6876.100.1.0.80614
vmwNotFoundEvent
Critical
Not Found Event Not Found
1.3.6.1.4.1.6876.100.1.0.80616
vmwInvalidConfigEvent
Critical
Invalid Data Source Config Event Invalid Data Source Config
1.3.6.1.4.1.6876.100.1.0.80617
vmwWarnConfigEvent
Critical
Invalid Data Source Config Event Invalid Data Source Config
1.3.6.1.4.1.6876.100.1.0.80618
vmwUnexpectedDSTypeOrVersionEvent
Critical
Unexpected Datasource Type or Version Event Unexpected Datasource Type or Version
1.3.6.1.4.1.6876.100.1.0.80619
vmwNSXControllerNotFoundEvent
Critical
NSX Controller Not Found Event NSX Controller Not Found
1.3.6.1.4.1.6876.100.1.0.80620
vmwHostNotReachableEvent
Critical
Host Not Reachable Event Host Not Reachable
1.3.6.1.4.1.6876.100.1.0.80621
vmwInvalidResponseFromDatasourceEvent
Critical
Invalid Response From Data Source Event Invalid Response From Data Source
1.3.6.1.4.1.6876.100.1.0.80622
vmwDataProviderNotRunningEvent
Critical
Data Source Not Running Event Data Source Not Running
Using vRealize Network Insight
VMware, Inc. 131
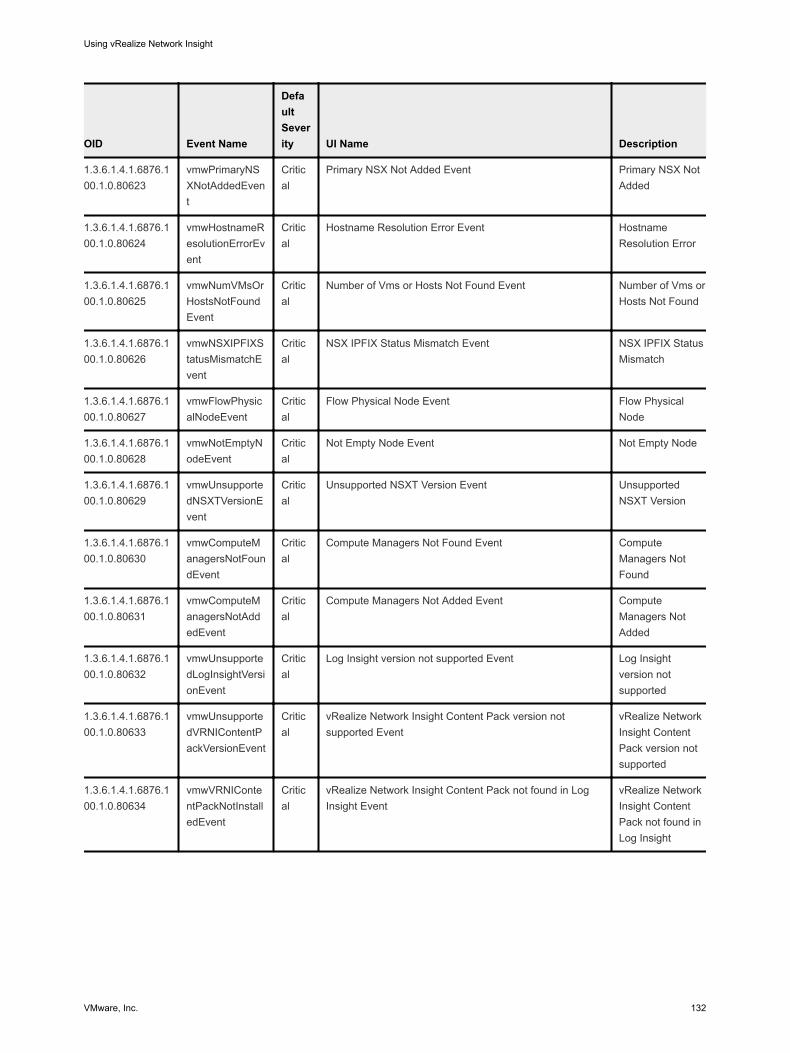
OID Event Name
Default Severity UI Name Description
1.3.6.1.4.1.6876.100.1.0.80623
vmwPrimaryNSXNotAddedEvent
Critical
Primary NSX Not Added Event Primary NSX Not Added
1.3.6.1.4.1.6876.100.1.0.80624
vmwHostnameResolutionErrorEvent
Critical
Hostname Resolution Error Event Hostname Resolution Error
1.3.6.1.4.1.6876.100.1.0.80625
vmwNumVMsOrHostsNotFoundEvent
Critical
Number of Vms or Hosts Not Found Event Number of Vms or Hosts Not Found
1.3.6.1.4.1.6876.100.1.0.80626
vmwNSXIPFIXStatusMismatchEvent
Critical
NSX IPFIX Status Mismatch Event NSX IPFIX Status Mismatch
1.3.6.1.4.1.6876.100.1.0.80627
vmwFlowPhysicalNodeEvent
Critical
Flow Physical Node Event Flow Physical Node
1.3.6.1.4.1.6876.100.1.0.80628
vmwNotEmptyNodeEvent
Critical
Not Empty Node Event Not Empty Node
1.3.6.1.4.1.6876.100.1.0.80629
vmwUnsupportedNSXTVersionEvent
Critical
Unsupported NSXT Version Event Unsupported NSXT Version
1.3.6.1.4.1.6876.100.1.0.80630
vmwComputeManagersNotFoundEvent
Critical
Compute Managers Not Found Event Compute Managers Not Found
1.3.6.1.4.1.6876.100.1.0.80631
vmwComputeManagersNotAddedEvent
Critical
Compute Managers Not Added Event Compute Managers Not Added
1.3.6.1.4.1.6876.100.1.0.80632
vmwUnsupportedLogInsightVersionEvent
Critical
Log Insight version not supported Event Log Insight version not supported
1.3.6.1.4.1.6876.100.1.0.80633
vmwUnsupportedVRNIContentPackVersionEvent
Critical
vRealize Network Insight Content Pack version not supported Event
vRealize Network Insight Content Pack version not supported
1.3.6.1.4.1.6876.100.1.0.80634
vmwVRNIContentPackNotInstalledEvent
Critical
vRealize Network Insight Content Pack not found in Log Insight Event
vRealize Network Insight Content Pack not found in Log Insight
Using vRealize Network Insight
VMware, Inc. 132
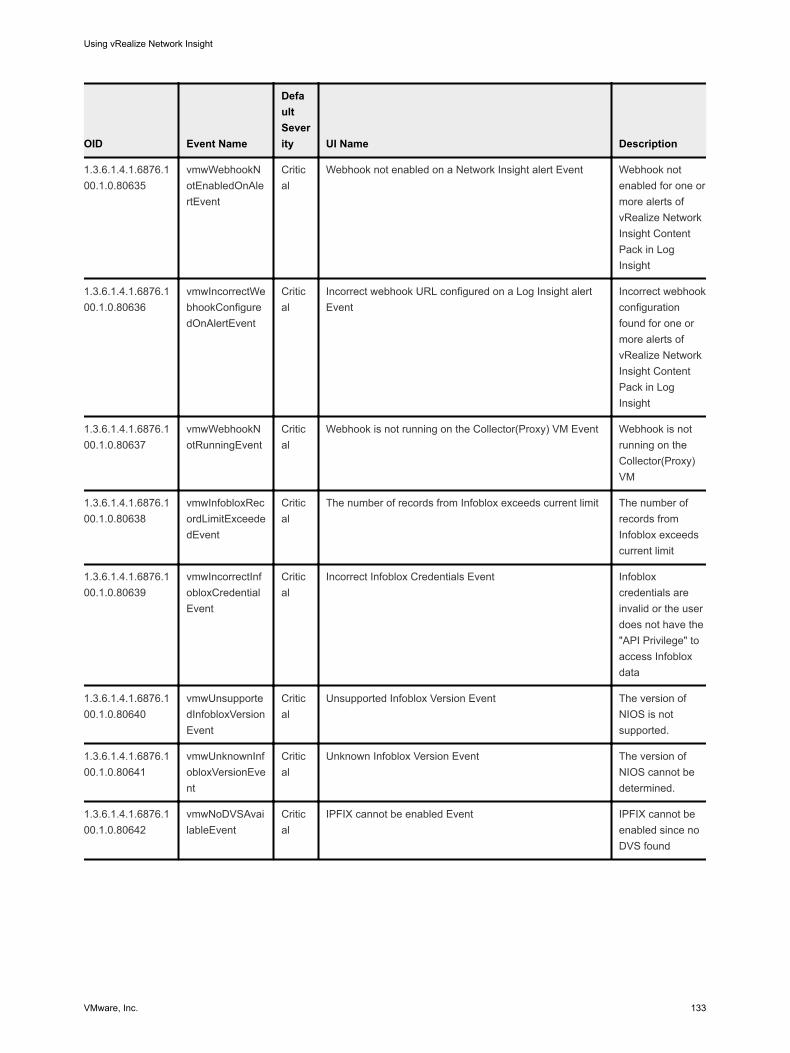
OID Event Name
Default Severity UI Name Description
1.3.6.1.4.1.6876.100.1.0.80635
vmwWebhookNotEnabledOnAlertEvent
Critical
Webhook not enabled on a Network Insight alert Event Webhook not enabled for one or more alerts of vRealize Network Insight Content Pack in Log Insight
1.3.6.1.4.1.6876.100.1.0.80636
vmwIncorrectWebhookConfiguredOnAlertEvent
Critical
Incorrect webhook URL configured on a Log Insight alert Event
Incorrect webhook configuration found for one or more alerts of vRealize Network Insight Content Pack in Log Insight
1.3.6.1.4.1.6876.100.1.0.80637
vmwWebhookNotRunningEvent
Critical
Webhook is not running on the Collector(Proxy) VM Event Webhook is not running on the Collector(Proxy) VM
1.3.6.1.4.1.6876.100.1.0.80638
vmwInfobloxRecordLimitExceededEvent
Critical
The number of records from Infoblox exceeds current limit The number of records from Infoblox exceeds current limit
1.3.6.1.4.1.6876.100.1.0.80639
vmwIncorrectInfobloxCredentialEvent
Critical
Incorrect Infoblox Credentials Event Infoblox credentials are invalid or the user does not have the "API Privilege" to access Infoblox data
1.3.6.1.4.1.6876.100.1.0.80640
vmwUnsupportedInfobloxVersionEvent
Critical
Unsupported Infoblox Version Event The version of NIOS is not supported.
1.3.6.1.4.1.6876.100.1.0.80641
vmwUnknownInfobloxVersionEvent
Critical
Unknown Infoblox Version Event The version of NIOS cannot be determined.
1.3.6.1.4.1.6876.100.1.0.80642
vmwNoDVSAvailableEvent
Critical
IPFIX cannot be enabled Event IPFIX cannot be enabled since no DVS found
Using vRealize Network Insight
VMware, Inc. 133
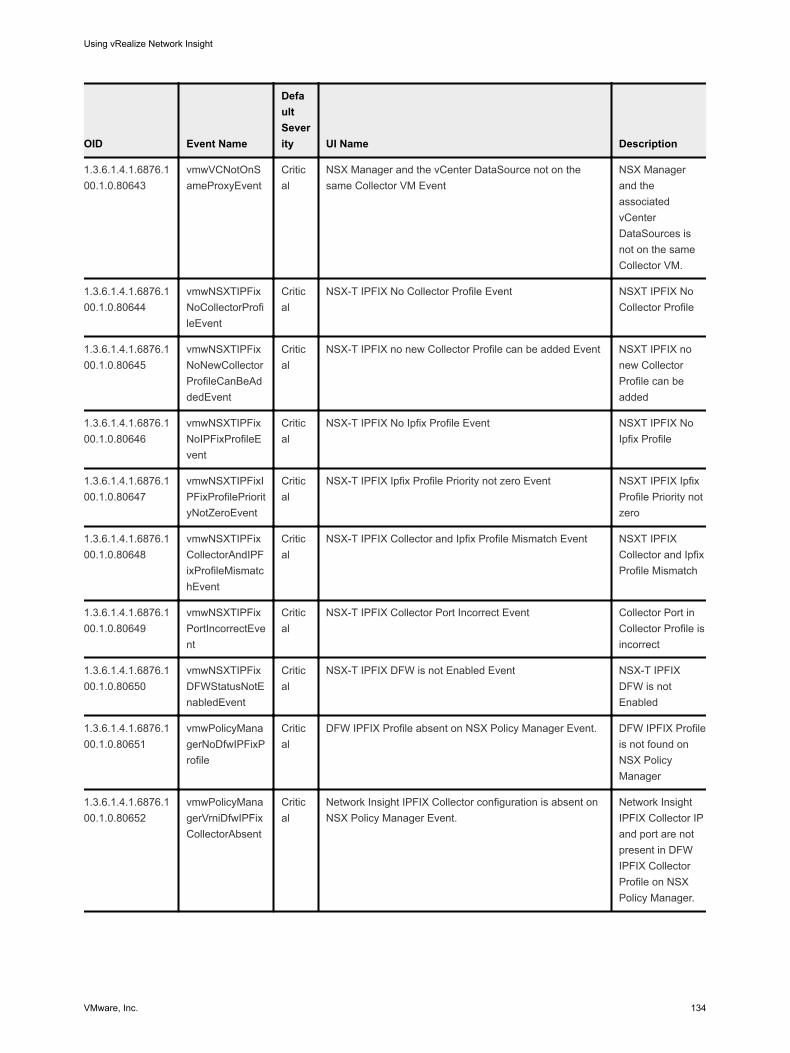
OID Event Name
Default Severity UI Name Description
1.3.6.1.4.1.6876.100.1.0.80643
vmwVCNotOnSameProxyEvent
Critical
NSX Manager and the vCenter DataSource not on the same Collector VM Event
NSX Manager and the associated vCenter DataSources is not on the same Collector VM.
1.3.6.1.4.1.6876.100.1.0.80644
vmwNSXTIPFixNoCollectorProfileEvent
Critical
NSX-T IPFIX No Collector Profile Event NSXT IPFIX No Collector Profile
1.3.6.1.4.1.6876.100.1.0.80645
vmwNSXTIPFixNoNewCollectorProfileCanBeAddedEvent
Critical
NSX-T IPFIX no new Collector Profile can be added Event NSXT IPFIX no new Collector Profile can be added
1.3.6.1.4.1.6876.100.1.0.80646
vmwNSXTIPFixNoIPFixProfileEvent
Critical
NSX-T IPFIX No Ipfix Profile Event NSXT IPFIX No Ipfix Profile
1.3.6.1.4.1.6876.100.1.0.80647
vmwNSXTIPFixIPFixProfilePriorityNotZeroEvent
Critical
NSX-T IPFIX Ipfix Profile Priority not zero Event NSXT IPFIX Ipfix Profile Priority not zero
1.3.6.1.4.1.6876.100.1.0.80648
vmwNSXTIPFixCollectorAndIPFixProfileMismatchEvent
Critical
NSX-T IPFIX Collector and Ipfix Profile Mismatch Event NSXT IPFIX Collector and Ipfix Profile Mismatch
1.3.6.1.4.1.6876.100.1.0.80649
vmwNSXTIPFixPortIncorrectEvent
Critical
NSX-T IPFIX Collector Port Incorrect Event Collector Port in Collector Profile is incorrect
1.3.6.1.4.1.6876.100.1.0.80650
vmwNSXTIPFixDFWStatusNotEnabledEvent
Critical
NSX-T IPFIX DFW is not Enabled Event NSX-T IPFIX DFW is not Enabled
1.3.6.1.4.1.6876.100.1.0.80651
vmwPolicyManagerNoDfwIPFixProfile
Critical
DFW IPFIX Profile absent on NSX Policy Manager Event. DFW IPFIX Profile is not found on NSX Policy Manager
1.3.6.1.4.1.6876.100.1.0.80652
vmwPolicyManagerVrniDfwIPFixCollectorAbsent
Critical
Network Insight IPFIX Collector configuration is absent on NSX Policy Manager Event.
Network Insight IPFIX Collector IP and port are not present in DFW IPFIX Collector Profile on NSX Policy Manager.
Using vRealize Network Insight
VMware, Inc. 134
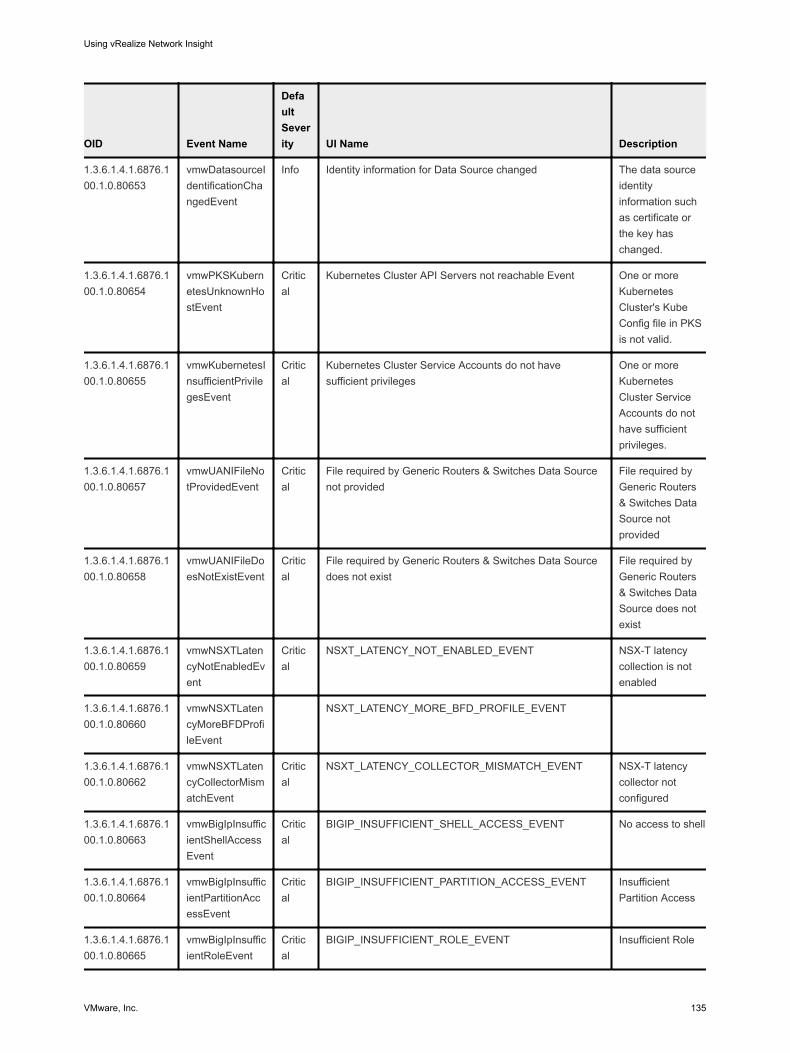
OID Event Name
Default Severity UI Name Description
1.3.6.1.4.1.6876.100.1.0.80653
vmwDatasourceIdentificationChangedEvent
Info Identity information for Data Source changed The data source identity information such as certificate or the key has changed.
1.3.6.1.4.1.6876.100.1.0.80654
vmwPKSKubernetesUnknownHostEvent
Critical
Kubernetes Cluster API Servers not reachable Event One or more Kubernetes Cluster's Kube Config file in PKS is not valid.
1.3.6.1.4.1.6876.100.1.0.80655
vmwKubernetesInsufficientPrivilegesEvent
Critical
Kubernetes Cluster Service Accounts do not have sufficient privileges
One or more Kubernetes Cluster Service Accounts do not have sufficient privileges.
1.3.6.1.4.1.6876.100.1.0.80657
vmwUANIFileNotProvidedEvent
Critical
File required by Generic Routers & Switches Data Source not provided
File required by Generic Routers & Switches Data Source not provided
1.3.6.1.4.1.6876.100.1.0.80658
vmwUANIFileDoesNotExistEvent
Critical
File required by Generic Routers & Switches Data Source does not exist
File required by Generic Routers & Switches Data Source does not exist
1.3.6.1.4.1.6876.100.1.0.80659
vmwNSXTLatencyNotEnabledEvent
Critical
NSXT_LATENCY_NOT_ENABLED_EVENT NSX-T latency collection is not enabled
1.3.6.1.4.1.6876.100.1.0.80660
vmwNSXTLatencyMoreBFDProfileEvent
NSXT_LATENCY_MORE_BFD_PROFILE_EVENT
1.3.6.1.4.1.6876.100.1.0.80662
vmwNSXTLatencyCollectorMismatchEvent
Critical
NSXT_LATENCY_COLLECTOR_MISMATCH_EVENT NSX-T latency collector not configured
1.3.6.1.4.1.6876.100.1.0.80663
vmwBigIpInsufficientShellAccessEvent
Critical
BIGIP_INSUFFICIENT_SHELL_ACCESS_EVENT No access to shell
1.3.6.1.4.1.6876.100.1.0.80664
vmwBigIpInsufficientPartitionAccessEvent
Critical
BIGIP_INSUFFICIENT_PARTITION_ACCESS_EVENT Insufficient Partition Access
1.3.6.1.4.1.6876.100.1.0.80665
vmwBigIpInsufficientRoleEvent
Critical
BIGIP_INSUFFICIENT_ROLE_EVENT Insufficient Role
Using vRealize Network Insight
VMware, Inc. 135
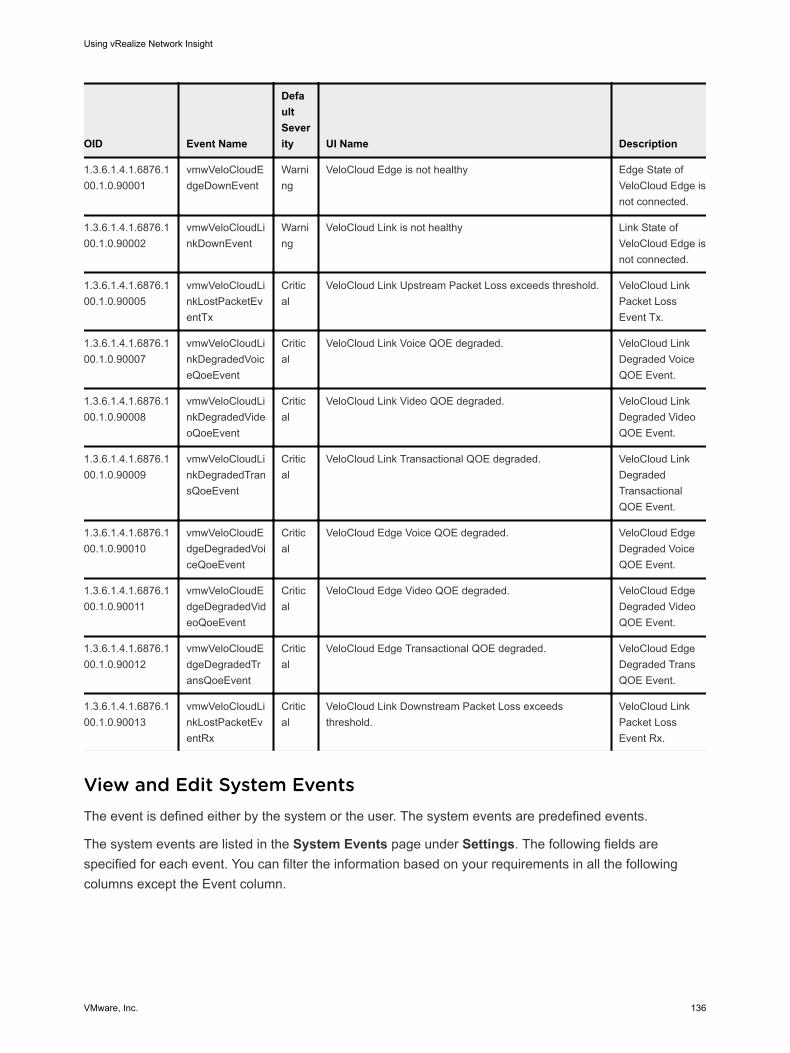
OID Event Name
Default Severity UI Name Description
1.3.6.1.4.1.6876.100.1.0.90001
vmwVeloCloudEdgeDownEvent
Warning
VeloCloud Edge is not healthy Edge State of VeloCloud Edge is not connected.
1.3.6.1.4.1.6876.100.1.0.90002
vmwVeloCloudLinkDownEvent
Warning
VeloCloud Link is not healthy Link State of VeloCloud Edge is not connected.
1.3.6.1.4.1.6876.100.1.0.90005
vmwVeloCloudLinkLostPacketEventTx
Critical
VeloCloud Link Upstream Packet Loss exceeds threshold. VeloCloud Link Packet Loss Event Tx.
1.3.6.1.4.1.6876.100.1.0.90007
vmwVeloCloudLinkDegradedVoiceQoeEvent
Critical
VeloCloud Link Voice QOE degraded. VeloCloud Link Degraded Voice QOE Event.
1.3.6.1.4.1.6876.100.1.0.90008
vmwVeloCloudLinkDegradedVideoQoeEvent
Critical
VeloCloud Link Video QOE degraded. VeloCloud Link Degraded Video QOE Event.
1.3.6.1.4.1.6876.100.1.0.90009
vmwVeloCloudLinkDegradedTransQoeEvent
Critical
VeloCloud Link Transactional QOE degraded. VeloCloud Link Degraded Transactional QOE Event.
1.3.6.1.4.1.6876.100.1.0.90010
vmwVeloCloudEdgeDegradedVoiceQoeEvent
Critical
VeloCloud Edge Voice QOE degraded. VeloCloud Edge Degraded Voice QOE Event.
1.3.6.1.4.1.6876.100.1.0.90011
vmwVeloCloudEdgeDegradedVideoQoeEvent
Critical
VeloCloud Edge Video QOE degraded. VeloCloud Edge Degraded Video QOE Event.
1.3.6.1.4.1.6876.100.1.0.90012
vmwVeloCloudEdgeDegradedTransQoeEvent
Critical
VeloCloud Edge Transactional QOE degraded. VeloCloud Edge Degraded Trans QOE Event.
1.3.6.1.4.1.6876.100.1.0.90013
vmwVeloCloudLinkLostPacketEventRx
Critical
VeloCloud Link Downstream Packet Loss exceeds threshold.
VeloCloud Link Packet Loss Event Rx.
View and Edit System EventsThe event is defined either by the system or the user. The system events are predefined events.
The system events are listed in the System Events page under Settings. The following fields are specified for each event. You can filter the information based on your requirements in all the following columns except the Event column.
Using vRealize Network Insight
VMware, Inc. 136
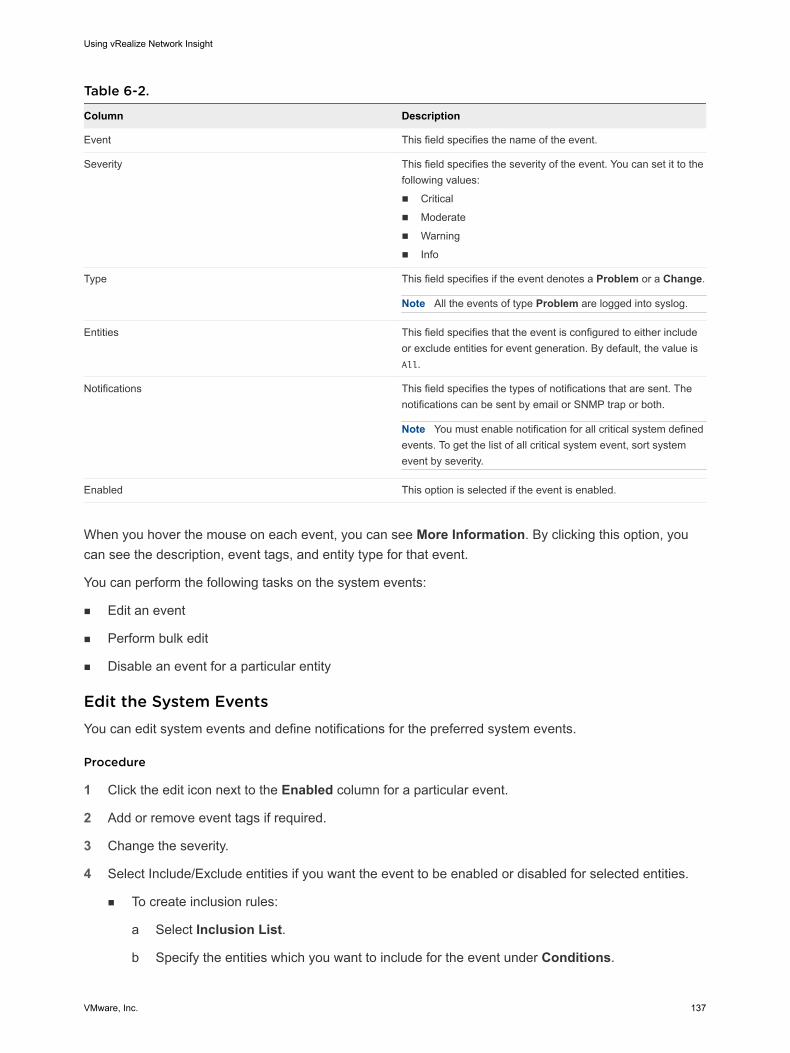
Table 6-2.
Column Description
Event This field specifies the name of the event.
Severity This field specifies the severity of the event. You can set it to the following values:
n Critical
n Moderate
n Warning
n Info
Type This field specifies if the event denotes a Problem or a Change.
Note All the events of type Problem are logged into syslog.
Entities This field specifies that the event is configured to either include or exclude entities for event generation. By default, the value is All.
Notifications This field specifies the types of notifications that are sent. The notifications can be sent by email or SNMP trap or both.
Note You must enable notification for all critical system defined events. To get the list of all critical system event, sort system event by severity.
Enabled This option is selected if the event is enabled.
When you hover the mouse on each event, you can see More Information. By clicking this option, you can see the description, event tags, and entity type for that event.
You can perform the following tasks on the system events:
n Edit an event
n Perform bulk edit
n Disable an event for a particular entity
Edit the System EventsYou can edit system events and define notifications for the preferred system events.
Procedure
1 Click the edit icon next to the Enabled column for a particular event.
2 Add or remove event tags if required.
3 Change the severity.
4 Select Include/Exclude entities if you want the event to be enabled or disabled for selected entities.
n To create inclusion rules:
a Select Inclusion List.
b Specify the entities which you want to include for the event under Conditions.
Using vRealize Network Insight
VMware, Inc. 137
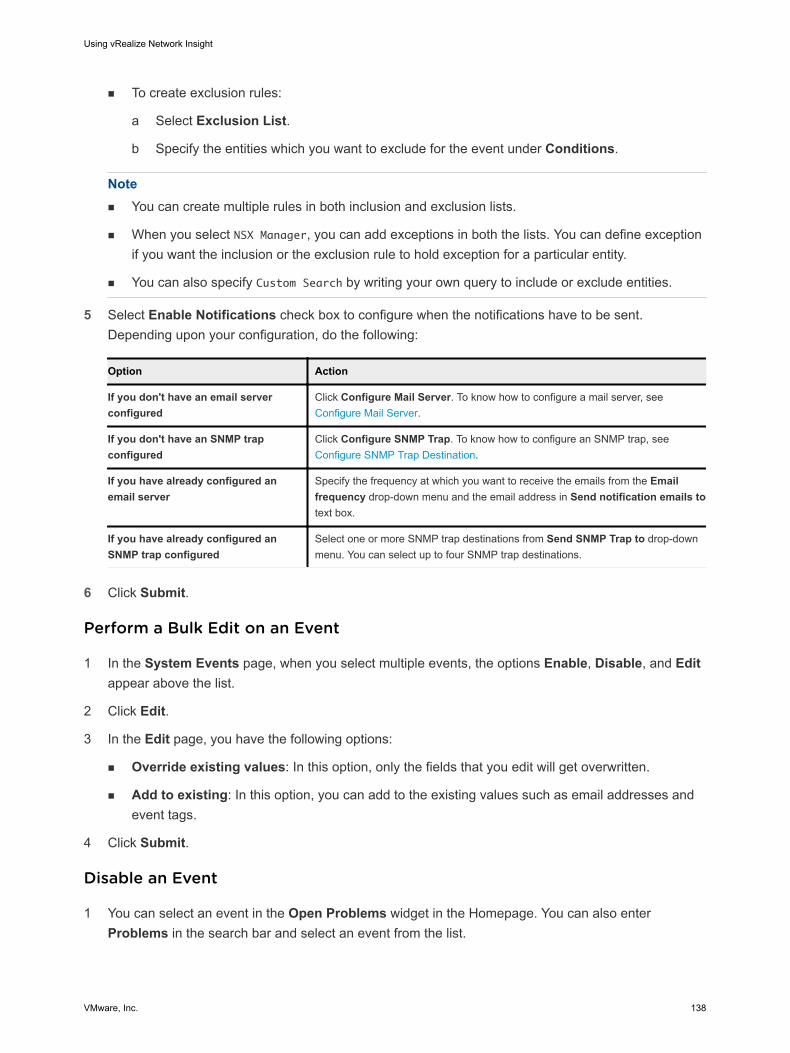
n To create exclusion rules:
a Select Exclusion List.
b Specify the entities which you want to exclude for the event under Conditions.
Note n You can create multiple rules in both inclusion and exclusion lists.
n When you select NSX Manager, you can add exceptions in both the lists. You can define exception if you want the inclusion or the exclusion rule to hold exception for a particular entity.
n You can also specify Custom Search by writing your own query to include or exclude entities.
5 Select Enable Notifications check box to configure when the notifications have to be sent. Depending upon your configuration, do the following:
Option Action
If you don't have an email server configured
Click Configure Mail Server. To know how to configure a mail server, see Configure Mail Server.
If you don't have an SNMP trap configured
Click Configure SNMP Trap. To know how to configure an SNMP trap, see Configure SNMP Trap Destination.
If you have already configured an email server
Specify the frequency at which you want to receive the emails from the Email frequency drop-down menu and the email address in Send notification emails to text box.
If you have already configured an SNMP trap configured
Select one or more SNMP trap destinations from Send SNMP Trap to drop-down menu. You can select up to four SNMP trap destinations.
6 Click Submit.
Perform a Bulk Edit on an Event
1 In the System Events page, when you select multiple events, the options Enable, Disable, and Edit appear above the list.
2 Click Edit.
3 In the Edit page, you have the following options:
n Override existing values: In this option, only the fields that you edit will get overwritten.
n Add to existing: In this option, you can add to the existing values such as email addresses and event tags.
4 Click Submit.
Disable an Event
1 You can select an event in the Open Problems widget in the Homepage. You can also enter Problems in the search bar and select an event from the list.
Using vRealize Network Insight
VMware, Inc. 138
2 Select a particular event and click Archive.
3 Select Disable all events of this type in future for and select an entity or all entities.
4 Click Save.
Note The changes made in severity, tags, or inclusion/exclusion rules will reflect for the future events. The existing events continue to show the old configuration.
Event LimitationsThis section provides the limitations for the various system defined events.
Distributed firewall rule masked by preceding rule event limitation
This event has the following limitations:
n This event is supported only for NSX-V distributed firewall rules. Other firewall vendors are not supported.
n The following firewall rule properties are currently supported for masking computation:
n Source
n Destination
n Applied To
n Service protocol and Port ranges
n Packet type
n Layer-7 application IDs
n Rules with source or destination inversion are not supported.
n Disabled rules are ignored.
n Rules with security groups containing excluded members directly or indirectly in Source/Destination or Applied To is not supported.
n The masking computation for Source, Destination, and Applied To properties are based on the static membership and IP range overlap of member IPSets. Dynamic membership of a security group are not considered for masking.
Edit User Defined EventsThe user-defined events are based on search.
All the user-defined events are listed on the User-defined Events page under Settings. The following fields are specified for each event.
Using vRealize Network Insight
VMware, Inc. 139
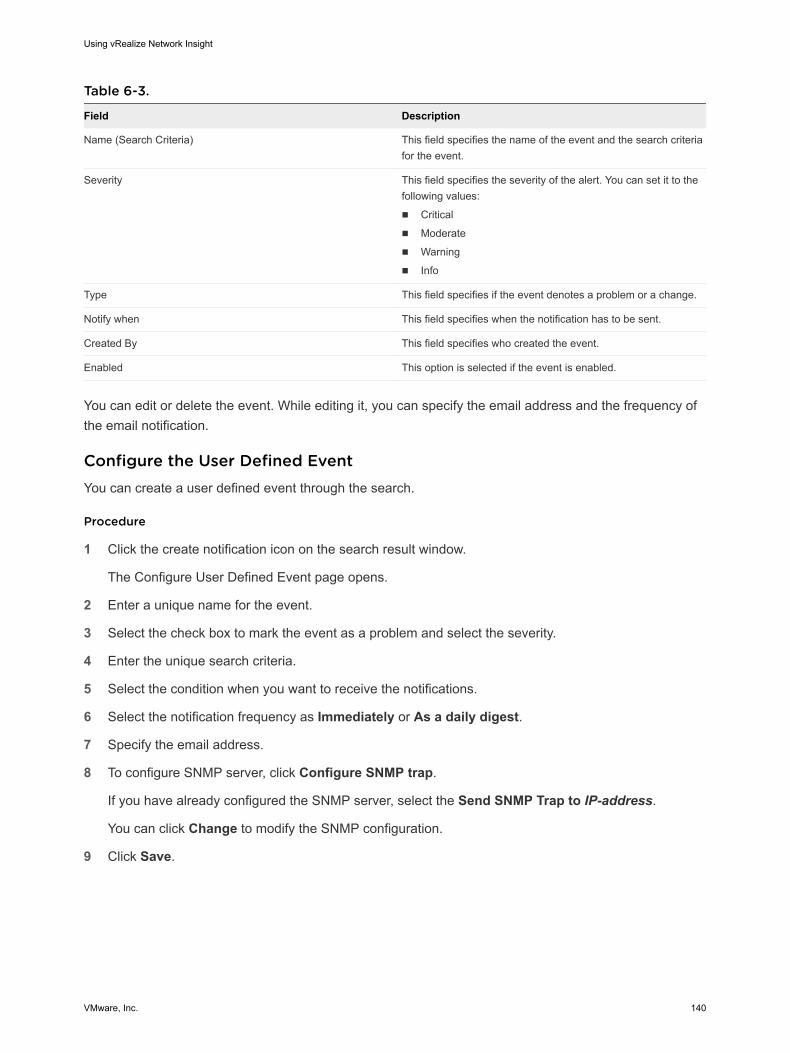
Table 6-3.
Field Description
Name (Search Criteria) This field specifies the name of the event and the search criteria for the event.
Severity This field specifies the severity of the alert. You can set it to the following values:
n Critical
n Moderate
n Warning
n Info
Type This field specifies if the event denotes a problem or a change.
Notify when This field specifies when the notification has to be sent.
Created By This field specifies who created the event.
Enabled This option is selected if the event is enabled.
You can edit or delete the event. While editing it, you can specify the email address and the frequency of the email notification.
Configure the User Defined EventYou can create a user defined event through the search.
Procedure
1 Click the create notification icon on the search result window.
The Configure User Defined Event page opens.
2 Enter a unique name for the event.
3 Select the check box to mark the event as a problem and select the severity.
4 Enter the unique search criteria.
5 Select the condition when you want to receive the notifications.
6 Select the notification frequency as Immediately or As a daily digest.
7 Specify the email address.
8 To configure SNMP server, click Configure SNMP trap.
If you have already configured the SNMP server, select the Send SNMP Trap to IP-address.
You can click Change to modify the SNMP configuration.
9 Click Save.
Using vRealize Network Insight
VMware, Inc. 140
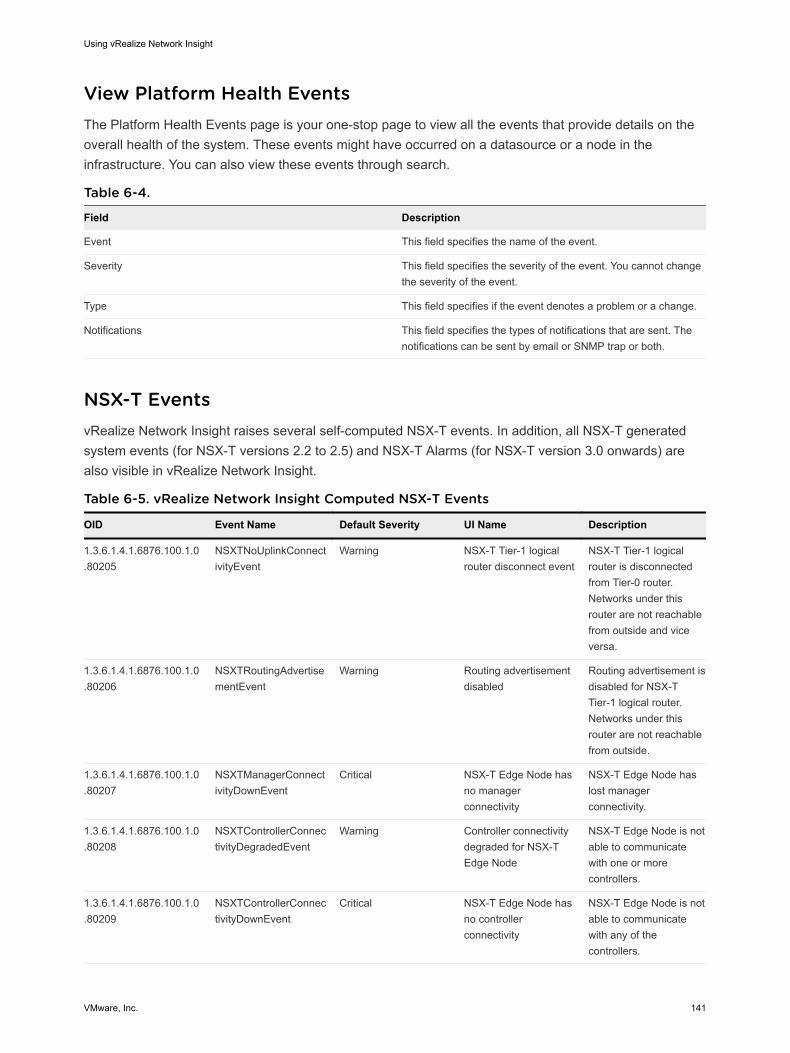
View Platform Health EventsThe Platform Health Events page is your one-stop page to view all the events that provide details on the overall health of the system. These events might have occurred on a datasource or a node in the infrastructure. You can also view these events through search.
Table 6-4.
Field Description
Event This field specifies the name of the event.
Severity This field specifies the severity of the event. You cannot change the severity of the event.
Type This field specifies if the event denotes a problem or a change.
Notifications This field specifies the types of notifications that are sent. The notifications can be sent by email or SNMP trap or both.
NSX-T EventsvRealize Network Insight raises several self-computed NSX-T events. In addition, all NSX-T generated system events (for NSX-T versions 2.2 to 2.5) and NSX-T Alarms (for NSX-T version 3.0 onwards) are also visible in vRealize Network Insight.
Table 6-5. vRealize Network Insight Computed NSX-T Events
OID Event Name Default Severity UI Name Description
1.3.6.1.4.1.6876.100.1.0.80205
NSXTNoUplinkConnectivityEvent
Warning NSX-T Tier-1 logical router disconnect event
NSX-T Tier-1 logical router is disconnected from Tier-0 router. Networks under this router are not reachable from outside and vice versa.
1.3.6.1.4.1.6876.100.1.0.80206
NSXTRoutingAdvertisementEvent
Warning Routing advertisement disabled
Routing advertisement is disabled for NSX-T Tier-1 logical router. Networks under this router are not reachable from outside.
1.3.6.1.4.1.6876.100.1.0.80207
NSXTManagerConnectivityDownEvent
Critical NSX-T Edge Node has no manager connectivity
NSX-T Edge Node has lost manager connectivity.
1.3.6.1.4.1.6876.100.1.0.80208
NSXTControllerConnectivityDegradedEvent
Warning Controller connectivity degraded for NSX-T Edge Node
NSX-T Edge Node is not able to communicate with one or more controllers.
1.3.6.1.4.1.6876.100.1.0.80209
NSXTControllerConnectivityDownEvent
Critical NSX-T Edge Node has no controller connectivity
NSX-T Edge Node is not able to communicate with any of the controllers.
Using vRealize Network Insight
VMware, Inc. 141
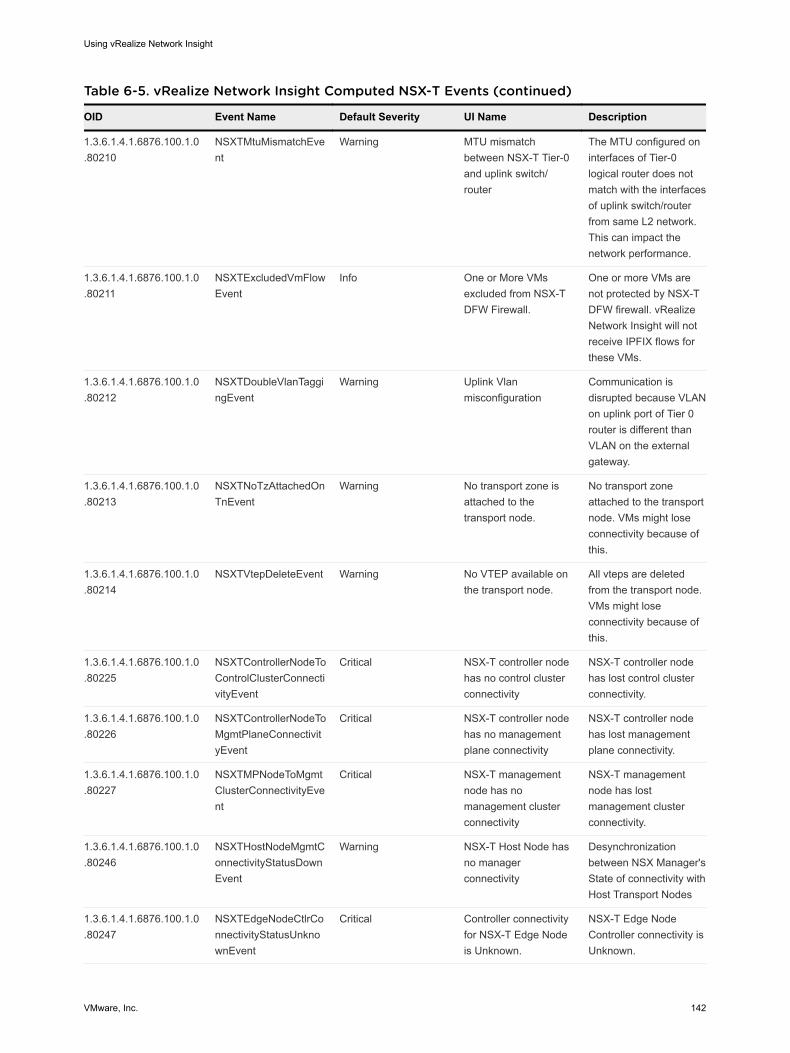
Table 6-5. vRealize Network Insight Computed NSX-T Events (continued)
OID Event Name Default Severity UI Name Description
1.3.6.1.4.1.6876.100.1.0.80210
NSXTMtuMismatchEvent
Warning MTU mismatch between NSX-T Tier-0 and uplink switch/router
The MTU configured on interfaces of Tier-0 logical router does not match with the interfaces of uplink switch/router from same L2 network. This can impact the network performance.
1.3.6.1.4.1.6876.100.1.0.80211
NSXTExcludedVmFlowEvent
Info One or More VMs excluded from NSX-T DFW Firewall.
One or more VMs are not protected by NSX-T DFW firewall. vRealize Network Insight will not receive IPFIX flows for these VMs.
1.3.6.1.4.1.6876.100.1.0.80212
NSXTDoubleVlanTaggingEvent
Warning Uplink Vlan misconfiguration
Communication is disrupted because VLAN on uplink port of Tier 0 router is different than VLAN on the external gateway.
1.3.6.1.4.1.6876.100.1.0.80213
NSXTNoTzAttachedOnTnEvent
Warning No transport zone is attached to the transport node.
No transport zone attached to the transport node. VMs might lose connectivity because of this.
1.3.6.1.4.1.6876.100.1.0.80214
NSXTVtepDeleteEvent Warning No VTEP available on the transport node.
All vteps are deleted from the transport node. VMs might lose connectivity because of this.
1.3.6.1.4.1.6876.100.1.0.80225
NSXTControllerNodeToControlClusterConnectivityEvent
Critical NSX-T controller node has no control cluster connectivity
NSX-T controller node has lost control cluster connectivity.
1.3.6.1.4.1.6876.100.1.0.80226
NSXTControllerNodeToMgmtPlaneConnectivityEvent
Critical NSX-T controller node has no management plane connectivity
NSX-T controller node has lost management plane connectivity.
1.3.6.1.4.1.6876.100.1.0.80227
NSXTMPNodeToMgmtClusterConnectivityEvent
Critical NSX-T management node has no management cluster connectivity
NSX-T management node has lost management cluster connectivity.
1.3.6.1.4.1.6876.100.1.0.80246
NSXTHostNodeMgmtConnectivityStatusDownEvent
Warning NSX-T Host Node has no manager connectivity
Desynchronization between NSX Manager's State of connectivity with Host Transport Nodes
1.3.6.1.4.1.6876.100.1.0.80247
NSXTEdgeNodeCtlrConnectivityStatusUnknownEvent
Critical Controller connectivity for NSX-T Edge Node is Unknown.
NSX-T Edge Node Controller connectivity is Unknown.
Using vRealize Network Insight
VMware, Inc. 142
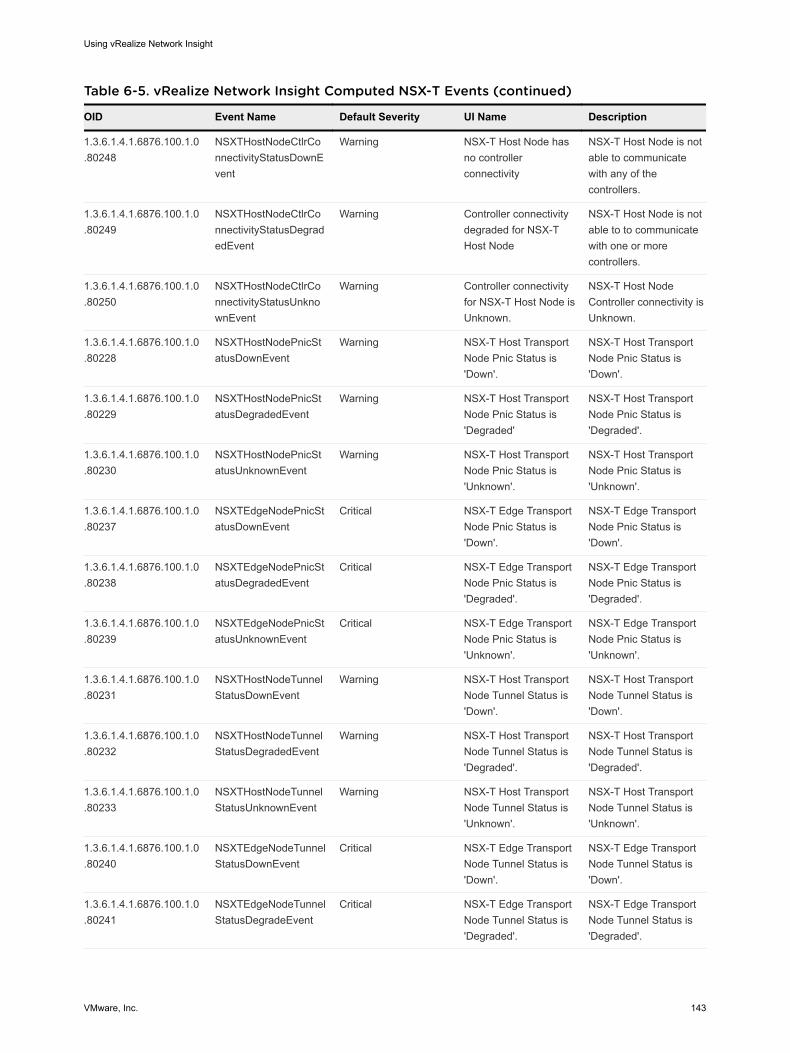
Table 6-5. vRealize Network Insight Computed NSX-T Events (continued)
OID Event Name Default Severity UI Name Description
1.3.6.1.4.1.6876.100.1.0.80248
NSXTHostNodeCtlrConnectivityStatusDownEvent
Warning NSX-T Host Node has no controller connectivity
NSX-T Host Node is not able to communicate with any of the controllers.
1.3.6.1.4.1.6876.100.1.0.80249
NSXTHostNodeCtlrConnectivityStatusDegradedEvent
Warning Controller connectivity degraded for NSX-T Host Node
NSX-T Host Node is not able to to communicate with one or more controllers.
1.3.6.1.4.1.6876.100.1.0.80250
NSXTHostNodeCtlrConnectivityStatusUnknownEvent
Warning Controller connectivity for NSX-T Host Node is Unknown.
NSX-T Host Node Controller connectivity is Unknown.
1.3.6.1.4.1.6876.100.1.0.80228
NSXTHostNodePnicStatusDownEvent
Warning NSX-T Host Transport Node Pnic Status is 'Down'.
NSX-T Host Transport Node Pnic Status is 'Down'.
1.3.6.1.4.1.6876.100.1.0.80229
NSXTHostNodePnicStatusDegradedEvent
Warning NSX-T Host Transport Node Pnic Status is 'Degraded'
NSX-T Host Transport Node Pnic Status is 'Degraded'.
1.3.6.1.4.1.6876.100.1.0.80230
NSXTHostNodePnicStatusUnknownEvent
Warning NSX-T Host Transport Node Pnic Status is 'Unknown'.
NSX-T Host Transport Node Pnic Status is 'Unknown'.
1.3.6.1.4.1.6876.100.1.0.80237
NSXTEdgeNodePnicStatusDownEvent
Critical NSX-T Edge Transport Node Pnic Status is 'Down'.
NSX-T Edge Transport Node Pnic Status is 'Down'.
1.3.6.1.4.1.6876.100.1.0.80238
NSXTEdgeNodePnicStatusDegradedEvent
Critical NSX-T Edge Transport Node Pnic Status is 'Degraded'.
NSX-T Edge Transport Node Pnic Status is 'Degraded'.
1.3.6.1.4.1.6876.100.1.0.80239
NSXTEdgeNodePnicStatusUnknownEvent
Critical NSX-T Edge Transport Node Pnic Status is 'Unknown'.
NSX-T Edge Transport Node Pnic Status is 'Unknown'.
1.3.6.1.4.1.6876.100.1.0.80231
NSXTHostNodeTunnelStatusDownEvent
Warning NSX-T Host Transport Node Tunnel Status is 'Down'.
NSX-T Host Transport Node Tunnel Status is 'Down'.
1.3.6.1.4.1.6876.100.1.0.80232
NSXTHostNodeTunnelStatusDegradedEvent
Warning NSX-T Host Transport Node Tunnel Status is 'Degraded'.
NSX-T Host Transport Node Tunnel Status is 'Degraded'.
1.3.6.1.4.1.6876.100.1.0.80233
NSXTHostNodeTunnelStatusUnknownEvent
Warning NSX-T Host Transport Node Tunnel Status is 'Unknown'.
NSX-T Host Transport Node Tunnel Status is 'Unknown'.
1.3.6.1.4.1.6876.100.1.0.80240
NSXTEdgeNodeTunnelStatusDownEvent
Critical NSX-T Edge Transport Node Tunnel Status is 'Down'.
NSX-T Edge Transport Node Tunnel Status is 'Down'.
1.3.6.1.4.1.6876.100.1.0.80241
NSXTEdgeNodeTunnelStatusDegradeEvent
Critical NSX-T Edge Transport Node Tunnel Status is 'Degraded'.
NSX-T Edge Transport Node Tunnel Status is 'Degraded'.
Using vRealize Network Insight
VMware, Inc. 143
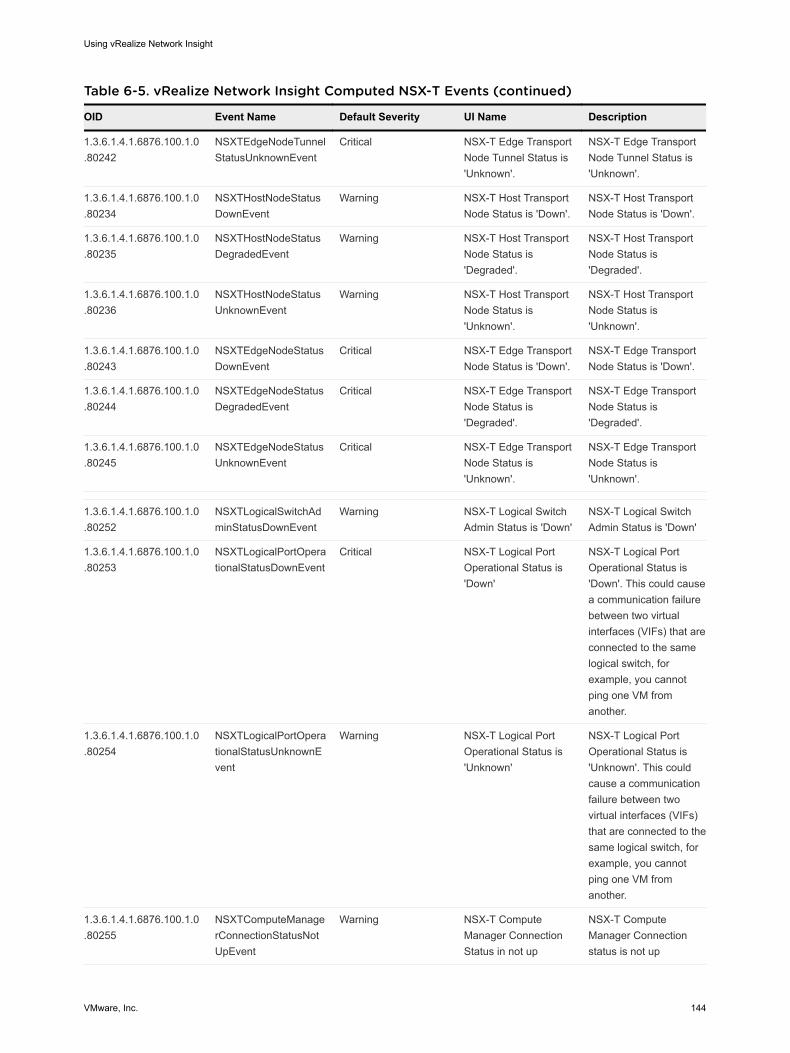
Table 6-5. vRealize Network Insight Computed NSX-T Events (continued)
OID Event Name Default Severity UI Name Description
1.3.6.1.4.1.6876.100.1.0.80242
NSXTEdgeNodeTunnelStatusUnknownEvent
Critical NSX-T Edge Transport Node Tunnel Status is 'Unknown'.
NSX-T Edge Transport Node Tunnel Status is 'Unknown'.
1.3.6.1.4.1.6876.100.1.0.80234
NSXTHostNodeStatusDownEvent
Warning NSX-T Host Transport Node Status is 'Down'.
NSX-T Host Transport Node Status is 'Down'.
1.3.6.1.4.1.6876.100.1.0.80235
NSXTHostNodeStatusDegradedEvent
Warning NSX-T Host Transport Node Status is 'Degraded'.
NSX-T Host Transport Node Status is 'Degraded'.
1.3.6.1.4.1.6876.100.1.0.80236
NSXTHostNodeStatusUnknownEvent
Warning NSX-T Host Transport Node Status is 'Unknown'.
NSX-T Host Transport Node Status is 'Unknown'.
1.3.6.1.4.1.6876.100.1.0.80243
NSXTEdgeNodeStatusDownEvent
Critical NSX-T Edge Transport Node Status is 'Down'.
NSX-T Edge Transport Node Status is 'Down'.
1.3.6.1.4.1.6876.100.1.0.80244
NSXTEdgeNodeStatusDegradedEvent
Critical NSX-T Edge Transport Node Status is 'Degraded'.
NSX-T Edge Transport Node Status is 'Degraded'.
1.3.6.1.4.1.6876.100.1.0.80245
NSXTEdgeNodeStatusUnknownEvent
Critical NSX-T Edge Transport Node Status is 'Unknown'.
NSX-T Edge Transport Node Status is 'Unknown'.
1.3.6.1.4.1.6876.100.1.0.80252
NSXTLogicalSwitchAdminStatusDownEvent
Warning NSX-T Logical Switch Admin Status is 'Down'
NSX-T Logical Switch Admin Status is 'Down'
1.3.6.1.4.1.6876.100.1.0.80253
NSXTLogicalPortOperationalStatusDownEvent
Critical NSX-T Logical Port Operational Status is 'Down'
NSX-T Logical Port Operational Status is 'Down'. This could cause a communication failure between two virtual interfaces (VIFs) that are connected to the same logical switch, for example, you cannot ping one VM from another.
1.3.6.1.4.1.6876.100.1.0.80254
NSXTLogicalPortOperationalStatusUnknownEvent
Warning NSX-T Logical Port Operational Status is 'Unknown'
NSX-T Logical Port Operational Status is 'Unknown'. This could cause a communication failure between two virtual interfaces (VIFs) that are connected to the same logical switch, for example, you cannot ping one VM from another.
1.3.6.1.4.1.6876.100.1.0.80255
NSXTComputeManagerConnectionStatusNotUpEvent
Warning NSX-T Compute Manager Connection Status in not up
NSX-T Compute Manager Connection status is not up
Using vRealize Network Insight
VMware, Inc. 144
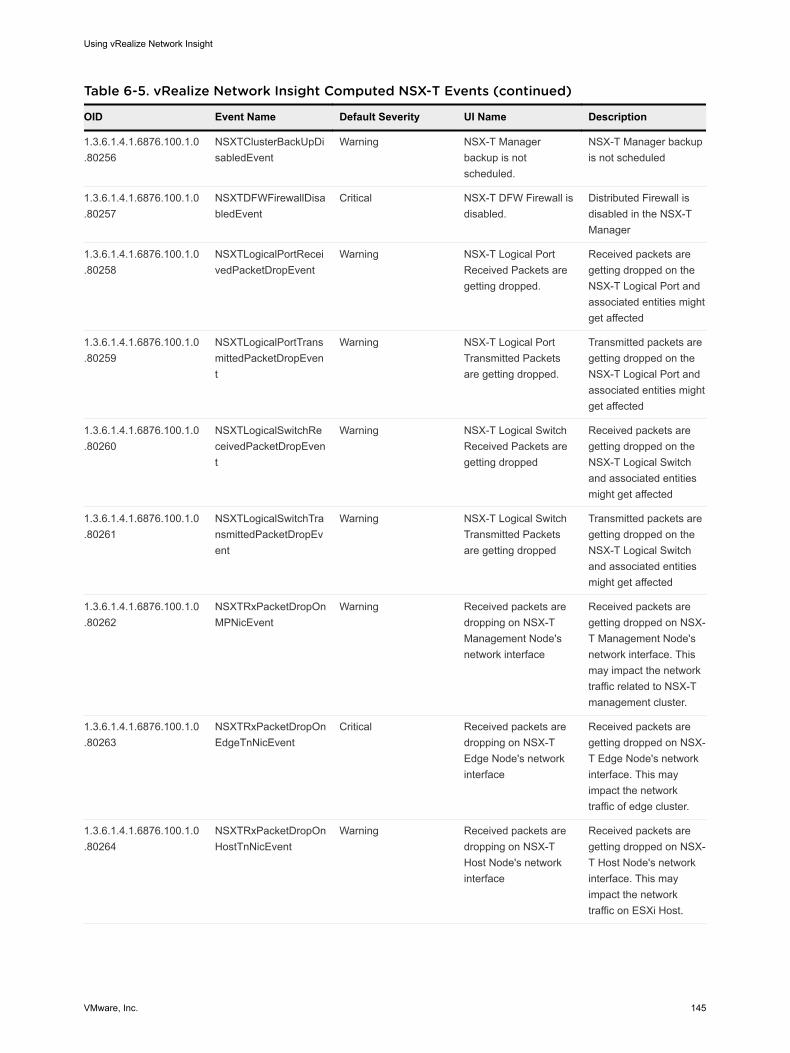
Table 6-5. vRealize Network Insight Computed NSX-T Events (continued)
OID Event Name Default Severity UI Name Description
1.3.6.1.4.1.6876.100.1.0.80256
NSXTClusterBackUpDisabledEvent
Warning NSX-T Manager backup is not scheduled.
NSX-T Manager backup is not scheduled
1.3.6.1.4.1.6876.100.1.0.80257
NSXTDFWFirewallDisabledEvent
Critical NSX-T DFW Firewall is disabled.
Distributed Firewall is disabled in the NSX-T Manager
1.3.6.1.4.1.6876.100.1.0.80258
NSXTLogicalPortReceivedPacketDropEvent
Warning NSX-T Logical Port Received Packets are getting dropped.
Received packets are getting dropped on the NSX-T Logical Port and associated entities might get affected
1.3.6.1.4.1.6876.100.1.0.80259
NSXTLogicalPortTransmittedPacketDropEvent
Warning NSX-T Logical Port Transmitted Packets are getting dropped.
Transmitted packets are getting dropped on the NSX-T Logical Port and associated entities might get affected
1.3.6.1.4.1.6876.100.1.0.80260
NSXTLogicalSwitchReceivedPacketDropEvent
Warning NSX-T Logical Switch Received Packets are getting dropped
Received packets are getting dropped on the NSX-T Logical Switch and associated entities might get affected
1.3.6.1.4.1.6876.100.1.0.80261
NSXTLogicalSwitchTransmittedPacketDropEvent
Warning NSX-T Logical Switch Transmitted Packets are getting dropped
Transmitted packets are getting dropped on the NSX-T Logical Switch and associated entities might get affected
1.3.6.1.4.1.6876.100.1.0.80262
NSXTRxPacketDropOnMPNicEvent
Warning Received packets are dropping on NSX-T Management Node's network interface
Received packets are getting dropped on NSX-T Management Node's network interface. This may impact the network traffic related to NSX-T management cluster.
1.3.6.1.4.1.6876.100.1.0.80263
NSXTRxPacketDropOnEdgeTnNicEvent
Critical Received packets are dropping on NSX-T Edge Node's network interface
Received packets are getting dropped on NSX-T Edge Node's network interface. This may impact the network traffic of edge cluster.
1.3.6.1.4.1.6876.100.1.0.80264
NSXTRxPacketDropOnHostTnNicEvent
Warning Received packets are dropping on NSX-T Host Node's network interface
Received packets are getting dropped on NSX-T Host Node's network interface. This may impact the network traffic on ESXi Host.
Using vRealize Network Insight
VMware, Inc. 145
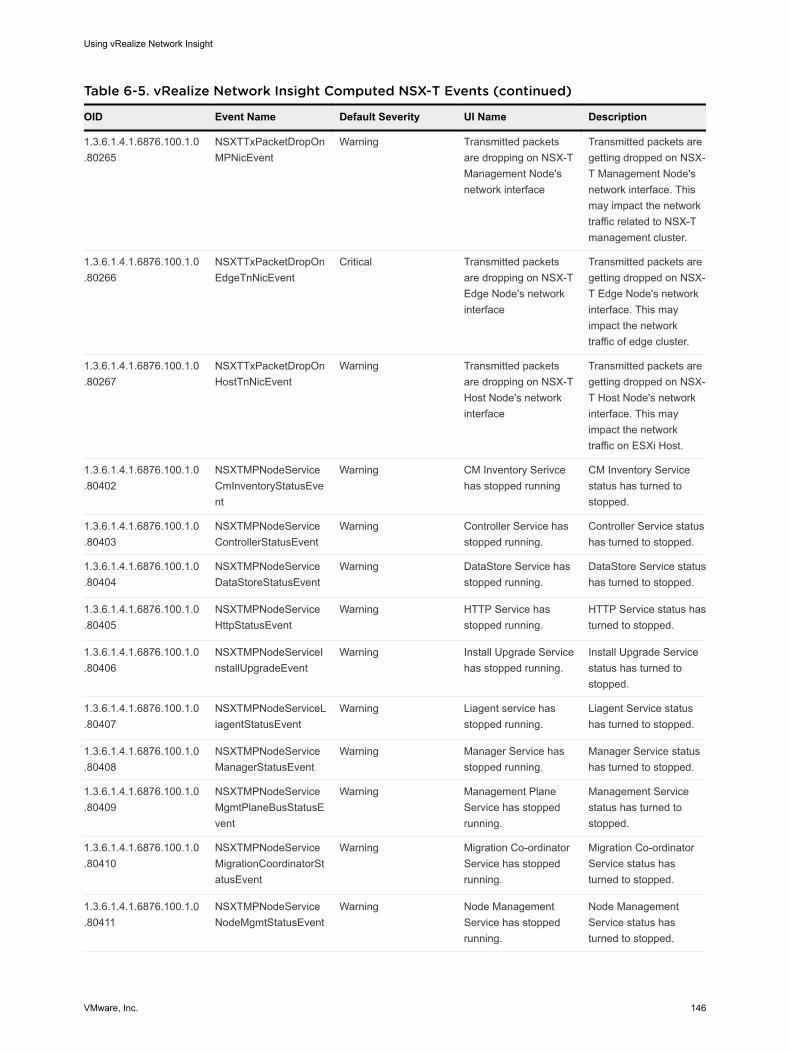
Table 6-5. vRealize Network Insight Computed NSX-T Events (continued)
OID Event Name Default Severity UI Name Description
1.3.6.1.4.1.6876.100.1.0.80265
NSXTTxPacketDropOnMPNicEvent
Warning Transmitted packets are dropping on NSX-T Management Node's network interface
Transmitted packets are getting dropped on NSX-T Management Node's network interface. This may impact the network traffic related to NSX-T management cluster.
1.3.6.1.4.1.6876.100.1.0.80266
NSXTTxPacketDropOnEdgeTnNicEvent
Critical Transmitted packets are dropping on NSX-T Edge Node's network interface
Transmitted packets are getting dropped on NSX-T Edge Node's network interface. This may impact the network traffic of edge cluster.
1.3.6.1.4.1.6876.100.1.0.80267
NSXTTxPacketDropOnHostTnNicEvent
Warning Transmitted packets are dropping on NSX-T Host Node's network interface
Transmitted packets are getting dropped on NSX-T Host Node's network interface. This may impact the network traffic on ESXi Host.
1.3.6.1.4.1.6876.100.1.0.80402
NSXTMPNodeServiceCmInventoryStatusEvent
Warning CM Inventory Serivce has stopped running
CM Inventory Service status has turned to stopped.
1.3.6.1.4.1.6876.100.1.0.80403
NSXTMPNodeServiceControllerStatusEvent
Warning Controller Service has stopped running.
Controller Service status has turned to stopped.
1.3.6.1.4.1.6876.100.1.0.80404
NSXTMPNodeServiceDataStoreStatusEvent
Warning DataStore Service has stopped running.
DataStore Service status has turned to stopped.
1.3.6.1.4.1.6876.100.1.0.80405
NSXTMPNodeServiceHttpStatusEvent
Warning HTTP Service has stopped running.
HTTP Service status has turned to stopped.
1.3.6.1.4.1.6876.100.1.0.80406
NSXTMPNodeServiceInstallUpgradeEvent
Warning Install Upgrade Service has stopped running.
Install Upgrade Service status has turned to stopped.
1.3.6.1.4.1.6876.100.1.0.80407
NSXTMPNodeServiceLiagentStatusEvent
Warning Liagent service has stopped running.
Liagent Service status has turned to stopped.
1.3.6.1.4.1.6876.100.1.0.80408
NSXTMPNodeServiceManagerStatusEvent
Warning Manager Service has stopped running.
Manager Service status has turned to stopped.
1.3.6.1.4.1.6876.100.1.0.80409
NSXTMPNodeServiceMgmtPlaneBusStatusEvent
Warning Management Plane Service has stopped running.
Management Service status has turned to stopped.
1.3.6.1.4.1.6876.100.1.0.80410
NSXTMPNodeServiceMigrationCoordinatorStatusEvent
Warning Migration Co-ordinator Service has stopped running.
Migration Co-ordinator Service status has turned to stopped.
1.3.6.1.4.1.6876.100.1.0.80411
NSXTMPNodeServiceNodeMgmtStatusEvent
Warning Node Management Service has stopped running.
Node Management Service status has turned to stopped.
Using vRealize Network Insight
VMware, Inc. 146
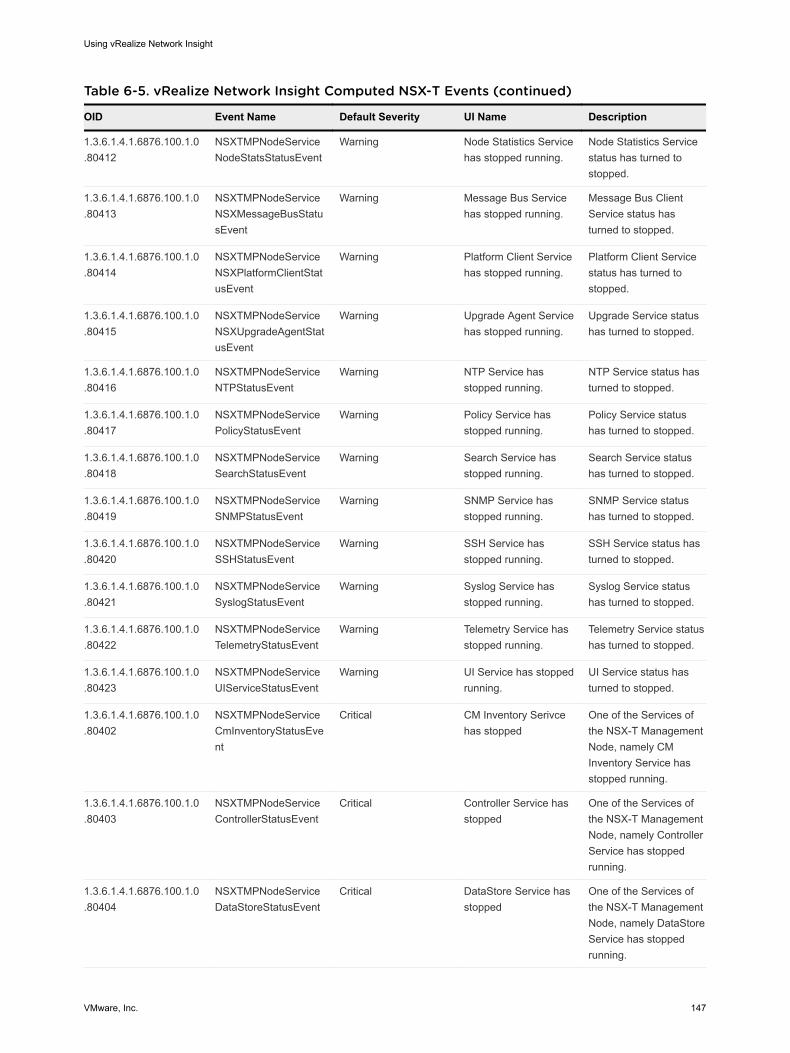
Table 6-5. vRealize Network Insight Computed NSX-T Events (continued)
OID Event Name Default Severity UI Name Description
1.3.6.1.4.1.6876.100.1.0.80412
NSXTMPNodeServiceNodeStatsStatusEvent
Warning Node Statistics Service has stopped running.
Node Statistics Service status has turned to stopped.
1.3.6.1.4.1.6876.100.1.0.80413
NSXTMPNodeServiceNSXMessageBusStatusEvent
Warning Message Bus Service has stopped running.
Message Bus Client Service status has turned to stopped.
1.3.6.1.4.1.6876.100.1.0.80414
NSXTMPNodeServiceNSXPlatformClientStatusEvent
Warning Platform Client Service has stopped running.
Platform Client Service status has turned to stopped.
1.3.6.1.4.1.6876.100.1.0.80415
NSXTMPNodeServiceNSXUpgradeAgentStatusEvent
Warning Upgrade Agent Service has stopped running.
Upgrade Service status has turned to stopped.
1.3.6.1.4.1.6876.100.1.0.80416
NSXTMPNodeServiceNTPStatusEvent
Warning NTP Service has stopped running.
NTP Service status has turned to stopped.
1.3.6.1.4.1.6876.100.1.0.80417
NSXTMPNodeServicePolicyStatusEvent
Warning Policy Service has stopped running.
Policy Service status has turned to stopped.
1.3.6.1.4.1.6876.100.1.0.80418
NSXTMPNodeServiceSearchStatusEvent
Warning Search Service has stopped running.
Search Service status has turned to stopped.
1.3.6.1.4.1.6876.100.1.0.80419
NSXTMPNodeServiceSNMPStatusEvent
Warning SNMP Service has stopped running.
SNMP Service status has turned to stopped.
1.3.6.1.4.1.6876.100.1.0.80420
NSXTMPNodeServiceSSHStatusEvent
Warning SSH Service has stopped running.
SSH Service status has turned to stopped.
1.3.6.1.4.1.6876.100.1.0.80421
NSXTMPNodeServiceSyslogStatusEvent
Warning Syslog Service has stopped running.
Syslog Service status has turned to stopped.
1.3.6.1.4.1.6876.100.1.0.80422
NSXTMPNodeServiceTelemetryStatusEvent
Warning Telemetry Service has stopped running.
Telemetry Service status has turned to stopped.
1.3.6.1.4.1.6876.100.1.0.80423
NSXTMPNodeServiceUIServiceStatusEvent
Warning UI Service has stopped running.
UI Service status has turned to stopped.
1.3.6.1.4.1.6876.100.1.0.80402
NSXTMPNodeServiceCmInventoryStatusEvent
Critical CM Inventory Serivce has stopped
One of the Services of the NSX-T Management Node, namely CM Inventory Service has stopped running.
1.3.6.1.4.1.6876.100.1.0.80403
NSXTMPNodeServiceControllerStatusEvent
Critical Controller Service has stopped
One of the Services of the NSX-T Management Node, namely Controller Service has stopped running.
1.3.6.1.4.1.6876.100.1.0.80404
NSXTMPNodeServiceDataStoreStatusEvent
Critical DataStore Service has stopped
One of the Services of the NSX-T Management Node, namely DataStore Service has stopped running.
Using vRealize Network Insight
VMware, Inc. 147
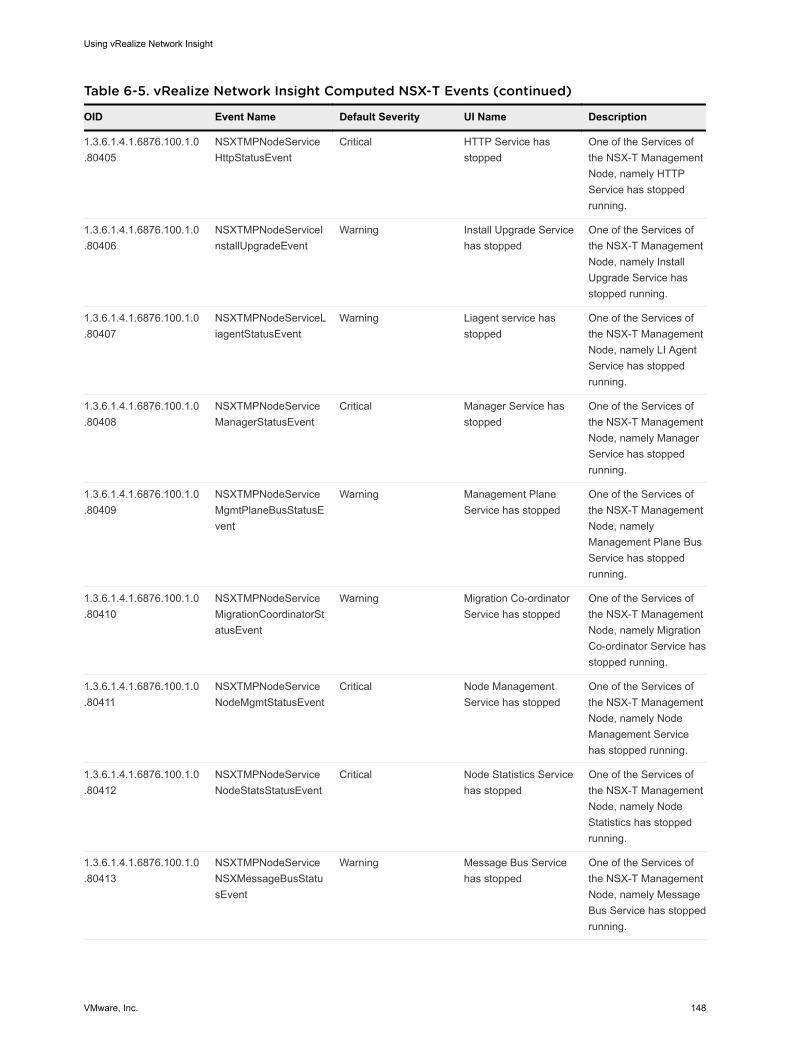
Table 6-5. vRealize Network Insight Computed NSX-T Events (continued)
OID Event Name Default Severity UI Name Description
1.3.6.1.4.1.6876.100.1.0.80405
NSXTMPNodeServiceHttpStatusEvent
Critical HTTP Service has stopped
One of the Services of the NSX-T Management Node, namely HTTP Service has stopped running.
1.3.6.1.4.1.6876.100.1.0.80406
NSXTMPNodeServiceInstallUpgradeEvent
Warning Install Upgrade Service has stopped
One of the Services of the NSX-T Management Node, namely Install Upgrade Service has stopped running.
1.3.6.1.4.1.6876.100.1.0.80407
NSXTMPNodeServiceLiagentStatusEvent
Warning Liagent service has stopped
One of the Services of the NSX-T Management Node, namely LI Agent Service has stopped running.
1.3.6.1.4.1.6876.100.1.0.80408
NSXTMPNodeServiceManagerStatusEvent
Critical Manager Service has stopped
One of the Services of the NSX-T Management Node, namely Manager Service has stopped running.
1.3.6.1.4.1.6876.100.1.0.80409
NSXTMPNodeServiceMgmtPlaneBusStatusEvent
Warning Management Plane Service has stopped
One of the Services of the NSX-T Management Node, namely Management Plane Bus Service has stopped running.
1.3.6.1.4.1.6876.100.1.0.80410
NSXTMPNodeServiceMigrationCoordinatorStatusEvent
Warning Migration Co-ordinator Service has stopped
One of the Services of the NSX-T Management Node, namely Migration Co-ordinator Service has stopped running.
1.3.6.1.4.1.6876.100.1.0.80411
NSXTMPNodeServiceNodeMgmtStatusEvent
Critical Node Management Service has stopped
One of the Services of the NSX-T Management Node, namely Node Management Service has stopped running.
1.3.6.1.4.1.6876.100.1.0.80412
NSXTMPNodeServiceNodeStatsStatusEvent
Critical Node Statistics Service has stopped
One of the Services of the NSX-T Management Node, namely Node Statistics has stopped running.
1.3.6.1.4.1.6876.100.1.0.80413
NSXTMPNodeServiceNSXMessageBusStatusEvent
Warning Message Bus Service has stopped
One of the Services of the NSX-T Management Node, namely Message Bus Service has stopped running.
Using vRealize Network Insight
VMware, Inc. 148
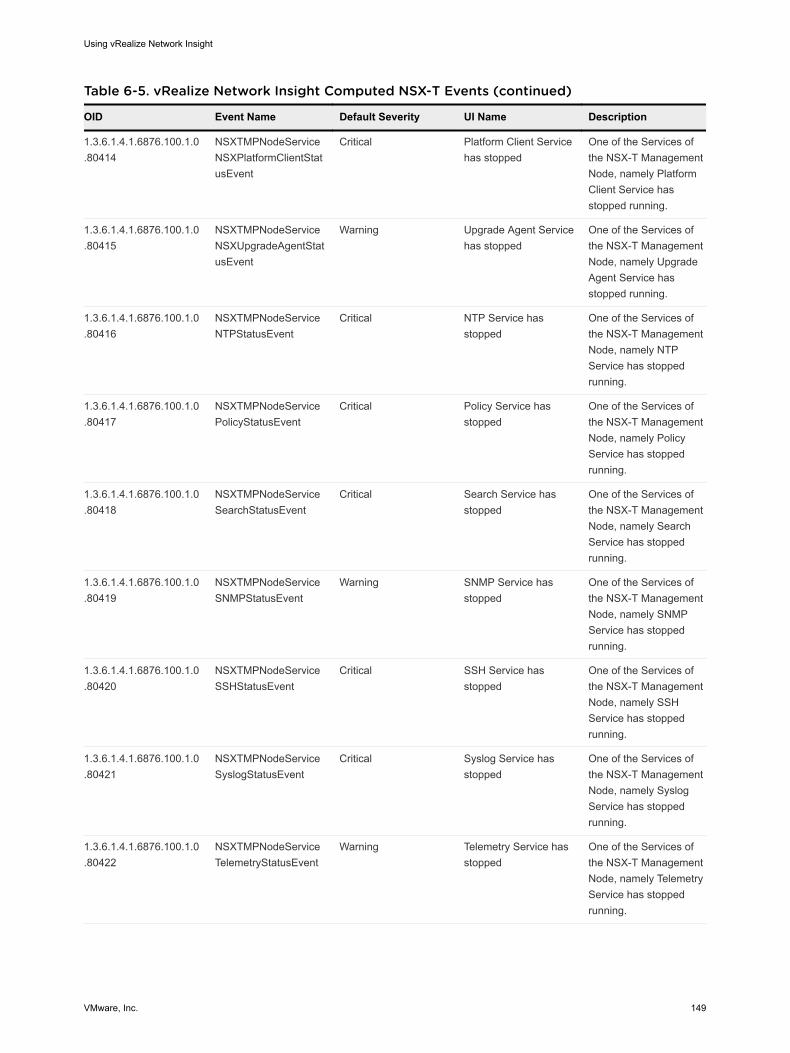
Table 6-5. vRealize Network Insight Computed NSX-T Events (continued)
OID Event Name Default Severity UI Name Description
1.3.6.1.4.1.6876.100.1.0.80414
NSXTMPNodeServiceNSXPlatformClientStatusEvent
Critical Platform Client Service has stopped
One of the Services of the NSX-T Management Node, namely Platform Client Service has stopped running.
1.3.6.1.4.1.6876.100.1.0.80415
NSXTMPNodeServiceNSXUpgradeAgentStatusEvent
Warning Upgrade Agent Service has stopped
One of the Services of the NSX-T Management Node, namely Upgrade Agent Service has stopped running.
1.3.6.1.4.1.6876.100.1.0.80416
NSXTMPNodeServiceNTPStatusEvent
Critical NTP Service has stopped
One of the Services of the NSX-T Management Node, namely NTP Service has stopped running.
1.3.6.1.4.1.6876.100.1.0.80417
NSXTMPNodeServicePolicyStatusEvent
Critical Policy Service has stopped
One of the Services of the NSX-T Management Node, namely Policy Service has stopped running.
1.3.6.1.4.1.6876.100.1.0.80418
NSXTMPNodeServiceSearchStatusEvent
Critical Search Service has stopped
One of the Services of the NSX-T Management Node, namely Search Service has stopped running.
1.3.6.1.4.1.6876.100.1.0.80419
NSXTMPNodeServiceSNMPStatusEvent
Warning SNMP Service has stopped
One of the Services of the NSX-T Management Node, namely SNMP Service has stopped running.
1.3.6.1.4.1.6876.100.1.0.80420
NSXTMPNodeServiceSSHStatusEvent
Critical SSH Service has stopped
One of the Services of the NSX-T Management Node, namely SSH Service has stopped running.
1.3.6.1.4.1.6876.100.1.0.80421
NSXTMPNodeServiceSyslogStatusEvent
Critical Syslog Service has stopped
One of the Services of the NSX-T Management Node, namely Syslog Service has stopped running.
1.3.6.1.4.1.6876.100.1.0.80422
NSXTMPNodeServiceTelemetryStatusEvent
Warning Telemetry Service has stopped
One of the Services of the NSX-T Management Node, namely Telemetry Service has stopped running.
Using vRealize Network Insight
VMware, Inc. 149
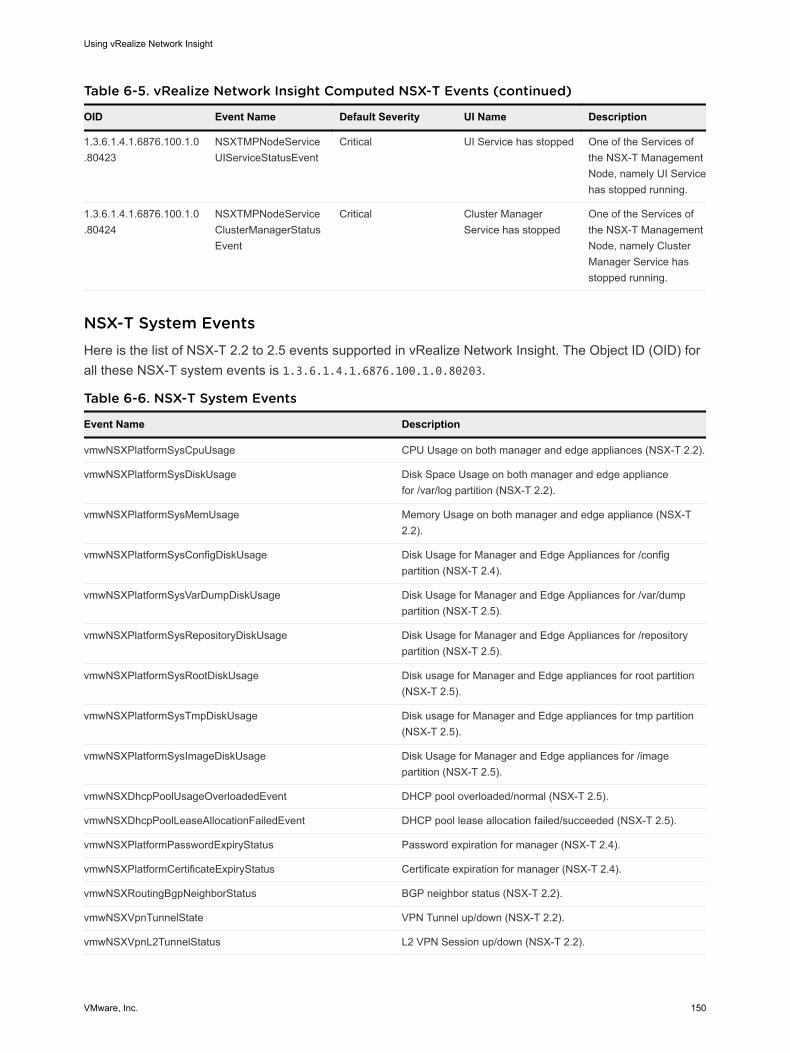
Table 6-5. vRealize Network Insight Computed NSX-T Events (continued)
OID Event Name Default Severity UI Name Description
1.3.6.1.4.1.6876.100.1.0.80423
NSXTMPNodeServiceUIServiceStatusEvent
Critical UI Service has stopped One of the Services of the NSX-T Management Node, namely UI Service has stopped running.
1.3.6.1.4.1.6876.100.1.0.80424
NSXTMPNodeServiceClusterManagerStatusEvent
Critical Cluster Manager Service has stopped
One of the Services of the NSX-T Management Node, namely Cluster Manager Service has stopped running.
NSX-T System EventsHere is the list of NSX-T 2.2 to 2.5 events supported in vRealize Network Insight. The Object ID (OID) for all these NSX-T system events is 1.3.6.1.4.1.6876.100.1.0.80203.
Table 6-6. NSX-T System Events
Event Name Description
vmwNSXPlatformSysCpuUsage CPU Usage on both manager and edge appliances (NSX-T 2.2).
vmwNSXPlatformSysDiskUsage Disk Space Usage on both manager and edge appliance for /var/log partition (NSX-T 2.2).
vmwNSXPlatformSysMemUsage Memory Usage on both manager and edge appliance (NSX-T 2.2).
vmwNSXPlatformSysConfigDiskUsage Disk Usage for Manager and Edge Appliances for /config partition (NSX-T 2.4).
vmwNSXPlatformSysVarDumpDiskUsage Disk Usage for Manager and Edge Appliances for /var/dump partition (NSX-T 2.5).
vmwNSXPlatformSysRepositoryDiskUsage Disk Usage for Manager and Edge Appliances for /repository partition (NSX-T 2.5).
vmwNSXPlatformSysRootDiskUsage Disk usage for Manager and Edge appliances for root partition (NSX-T 2.5).
vmwNSXPlatformSysTmpDiskUsage Disk usage for Manager and Edge appliances for tmp partition (NSX-T 2.5).
vmwNSXPlatformSysImageDiskUsage Disk Usage for Manager and Edge appliances for /image partition (NSX-T 2.5).
vmwNSXDhcpPoolUsageOverloadedEvent DHCP pool overloaded/normal (NSX-T 2.5).
vmwNSXDhcpPoolLeaseAllocationFailedEvent DHCP pool lease allocation failed/succeeded (NSX-T 2.5).
vmwNSXPlatformPasswordExpiryStatus Password expiration for manager (NSX-T 2.4).
vmwNSXPlatformCertificateExpiryStatus Certificate expiration for manager (NSX-T 2.4).
vmwNSXRoutingBgpNeighborStatus BGP neighbor status (NSX-T 2.2).
vmwNSXVpnTunnelState VPN Tunnel up/down (NSX-T 2.2).
vmwNSXVpnL2TunnelStatus L2 VPN Session up/down (NSX-T 2.2).
Using vRealize Network Insight
VMware, Inc. 150
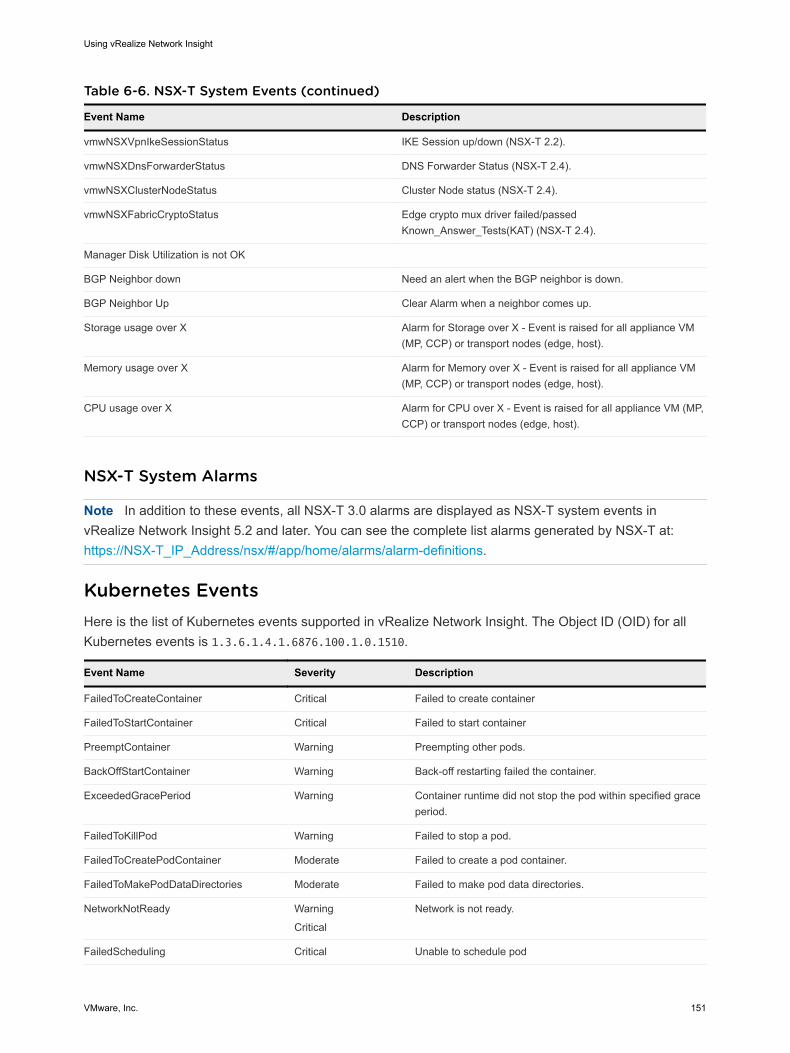
Table 6-6. NSX-T System Events (continued)
Event Name Description
vmwNSXVpnIkeSessionStatus IKE Session up/down (NSX-T 2.2).
vmwNSXDnsForwarderStatus DNS Forwarder Status (NSX-T 2.4).
vmwNSXClusterNodeStatus Cluster Node status (NSX-T 2.4).
vmwNSXFabricCryptoStatus Edge crypto mux driver failed/passed Known_Answer_Tests(KAT) (NSX-T 2.4).
Manager Disk Utilization is not OK
BGP Neighbor down Need an alert when the BGP neighbor is down.
BGP Neighbor Up Clear Alarm when a neighbor comes up.
Storage usage over X Alarm for Storage over X - Event is raised for all appliance VM (MP, CCP) or transport nodes (edge, host).
Memory usage over X Alarm for Memory over X - Event is raised for all appliance VM (MP, CCP) or transport nodes (edge, host).
CPU usage over X Alarm for CPU over X - Event is raised for all appliance VM (MP, CCP) or transport nodes (edge, host).
NSX-T System Alarms
Note In addition to these events, all NSX-T 3.0 alarms are displayed as NSX-T system events in vRealize Network Insight 5.2 and later. You can see the complete list alarms generated by NSX-T at: https://NSX-T_IP_Address/nsx/#/app/home/alarms/alarm-definitions.
Kubernetes EventsHere is the list of Kubernetes events supported in vRealize Network Insight. The Object ID (OID) for all Kubernetes events is 1.3.6.1.4.1.6876.100.1.0.1510.
Event Name Severity Description
FailedToCreateContainer Critical Failed to create container
FailedToStartContainer Critical Failed to start container
PreemptContainer Warning Preempting other pods.
BackOffStartContainer Warning Back-off restarting failed the container.
ExceededGracePeriod Warning Container runtime did not stop the pod within specified grace period.
FailedToKillPod Warning Failed to stop a pod.
FailedToCreatePodContainer Moderate Failed to create a pod container.
FailedToMakePodDataDirectories Moderate Failed to make pod data directories.
NetworkNotReady Warning
Critical
Network is not ready.
FailedScheduling Critical Unable to schedule pod
Using vRealize Network Insight
VMware, Inc. 151
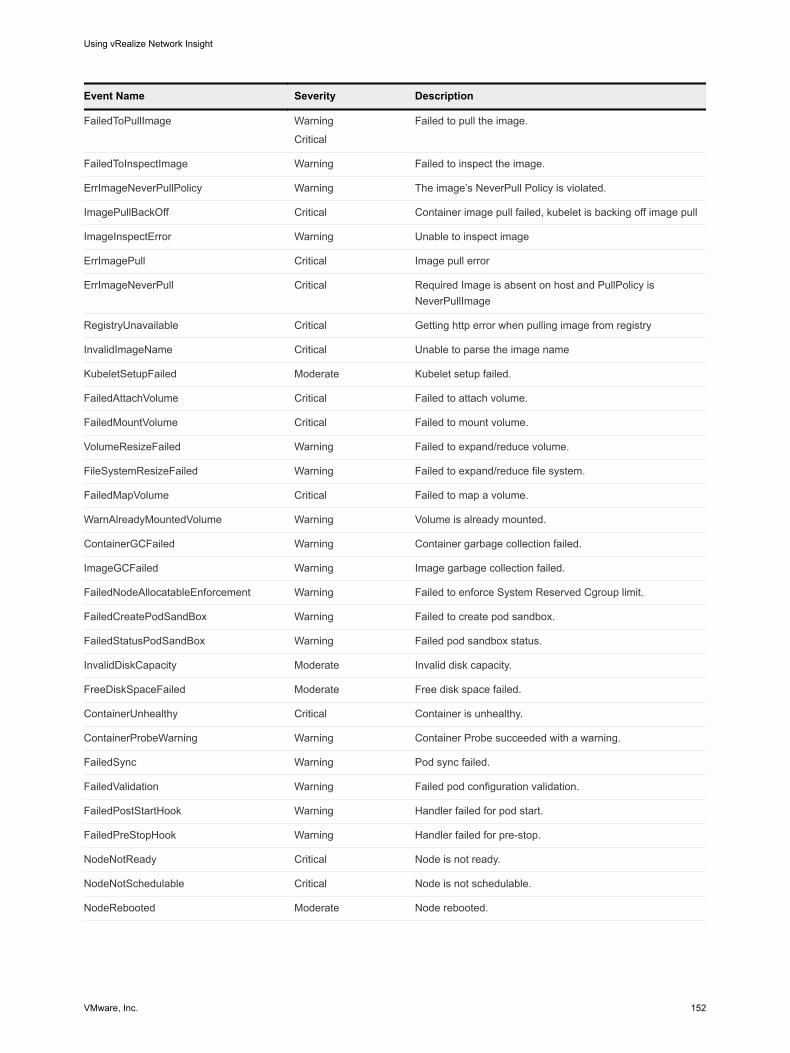
Event Name Severity Description
FailedToPullImage Warning
Critical
Failed to pull the image.
FailedToInspectImage Warning Failed to inspect the image.
ErrImageNeverPullPolicy Warning The image’s NeverPull Policy is violated.
ImagePullBackOff Critical Container image pull failed, kubelet is backing off image pull
ImageInspectError Warning Unable to inspect image
ErrImagePull Critical Image pull error
ErrImageNeverPull Critical Required Image is absent on host and PullPolicy is NeverPullImage
RegistryUnavailable Critical Getting http error when pulling image from registry
InvalidImageName Critical Unable to parse the image name
KubeletSetupFailed Moderate Kubelet setup failed.
FailedAttachVolume Critical Failed to attach volume.
FailedMountVolume Critical Failed to mount volume.
VolumeResizeFailed Warning Failed to expand/reduce volume.
FileSystemResizeFailed Warning Failed to expand/reduce file system.
FailedMapVolume Critical Failed to map a volume.
WarnAlreadyMountedVolume Warning Volume is already mounted.
ContainerGCFailed Warning Container garbage collection failed.
ImageGCFailed Warning Image garbage collection failed.
FailedNodeAllocatableEnforcement Warning Failed to enforce System Reserved Cgroup limit.
FailedCreatePodSandBox Warning Failed to create pod sandbox.
FailedStatusPodSandBox Warning Failed pod sandbox status.
InvalidDiskCapacity Moderate Invalid disk capacity.
FreeDiskSpaceFailed Moderate Free disk space failed.
ContainerUnhealthy Critical Container is unhealthy.
ContainerProbeWarning Warning Container Probe succeeded with a warning.
FailedSync Warning Pod sync failed.
FailedValidation Warning Failed pod configuration validation.
FailedPostStartHook Warning Handler failed for pod start.
FailedPreStopHook Warning Handler failed for pre-stop.
NodeNotReady Critical Node is not ready.
NodeNotSchedulable Critical Node is not schedulable.
NodeRebooted Moderate Node rebooted.
Using vRealize Network Insight
VMware, Inc. 152
Notifications
Search-based NotificationsThe search-based notifications can be categorized as follows:
n System-based notification
n User-defined notification
System-based notification parameters are predefined and upon activating notification alert, notification in the form of mails are sent. User-defined notifications are set by users, based on their requirements. You can create email notifications based on your search query. After you run a search, on the Results page, the Create notification option is displayed. For each search, you can:
n Select the condition when you want to receive the notifications.
n Define how frequently you want to receive the notifications.
n Enter the email recipients for each notification (by default, your email ID is present in the receiver's list; you can also add multiple email IDs).
For a user-defined search:
n It is mandatory for you to assign a name to the search-based notification.
n It is mandatory to select the severity of a search-based event that is marked as a problem.
n The user-defined events are uniquely identified by the search criteria.
n You can specify the notification frequency as Immediately or As a daily digest.
You can manage your notifications from the Settings > Search-based Notifications page. On the Search-based Notifications page, you can view the existing notifications, edit them, activate or deactivate them, and also delete unwanted notifications.
Configure the Event NotificationThe notifications are sent in the form of emails.
To set up the notification, you must first configure the mail server. To know how to configure mail server, see Configure Mail Server.
Specifying Notification Events for Emails to be sent
Users can specify events for which mail notifications are to be sent.
To specify events
1 On the Settings page, click Search-based Notifications, or simply search for any information using the Search box.
2 On the Search-based Notifications page, click the Create Notification icon. A notification dialog box is displayed.
Using vRealize Network Insight
VMware, Inc. 153
3 In the Receive notification when box, select the event on the occurrence of which notifications are to be sent.
4 In the Notify box, select the frequency at which the notifications are to be sent.
5 If the event is undesirable, select the Mark it as a problem check box.
6 Enter the email addresses to which the notifications are to be sent, and then click Save.
Note To verify whether the notification mail is correctly set up, click Send test Email.
Event NotificationsvRealize Network Insight contains a list of predefined system events (system problems and system changes) for which you can receive automated email notifications every four hours, which you an modify.
You can view the list of notifications on the Settings > System Notifications page.
If you have not configured any e-mail or SNMP notifications for an event, you see an alerting message on the home page that reminds and allows you to define notifications. You can click Enable Notifications on the alert message to directly navigate to the System Events page and subscribe notifications for the preferred events.
To disable the reminder, select the Don't show this message again option. The alert message will not appear for that particular user. To define notifications later, navigate to Settings > Events.
Archiving Problems
Archiving a Problem
1 Click the Show All link (if there is more than one instance of an event) to display all instances of the event.
2 Hover on the instance of the event that you want to archive to display a set of icons, and then click the Archive icon .
3 In the Event specific dialog box
a Select This event from the You are about to archive list, if you want to archive only this event.
b Select All events of this type from the You are about to archive list, if you want to archive all events of the same type in the system.
4 Click Save.
Viewing all archived events
1 On the Home page, type events in Search box and press Enter. A list of events is displayed.
2 On the left hand pane, in the Archived facet, select True checkbox (highlighted in the screenshot below).
You can view all archived events here.
Using vRealize Network Insight
VMware, Inc. 154
To restore an archived event
1 On the Archived event, click the Archived icon . (See the preceding section on To view an archived event to know how to go to the Archived events page).
2 In the Event specific dialog box
a Select This event from the You are about to restore from archive list, if you want to restore only this event.
b Select All events of this type from the You are about to restore from archive list, if you want to restore all similar type of events.
c Click Save to complete restoring.
Disabling Events
Users can selectively disable events and prevent notifications from being sent in future.
To disable event notification
Method 1
1 On the event, click the Show All link (if there is more than one instance of an event) to display all instances of the event.
2 Hover on the instance of the event, whose notification you want to disable. This displays a set of icons, click the Archive icon .
3 In the Event specific dialog box, select the Disable all events of this type in future checkbox, and then click Save.
Method 2
1 On the top-right corner of Home page, click the Profile icon, and then click Settings.
2 In the Settings section, click Event Notifications to see a list of all enabled and disabled events.
3 On the enabled event that you want to disable, in the Enabled column, click the left-side space of the respective slider.
4 In the Confirm Action dialog box, click Yes.
Configuring Event Notification Service
Users can enable customer notifications for different events
To set notification services
1 On Settings, go to Event Notification, and click the (edit) icon corresponding to the problem, for which you want to enable e-mail notifications and SNMP.
2 In the Edit System Notification dialog box, enter the email address to which you want the email notification to be sent. In the Email Frequency box, select the time frequency at which you want to receive notifications.
3 Select the Enable SNMP trap for this event checkbox to set SNMP notifications.
4 Click Save.
Using vRealize Network Insight
VMware, Inc. 155
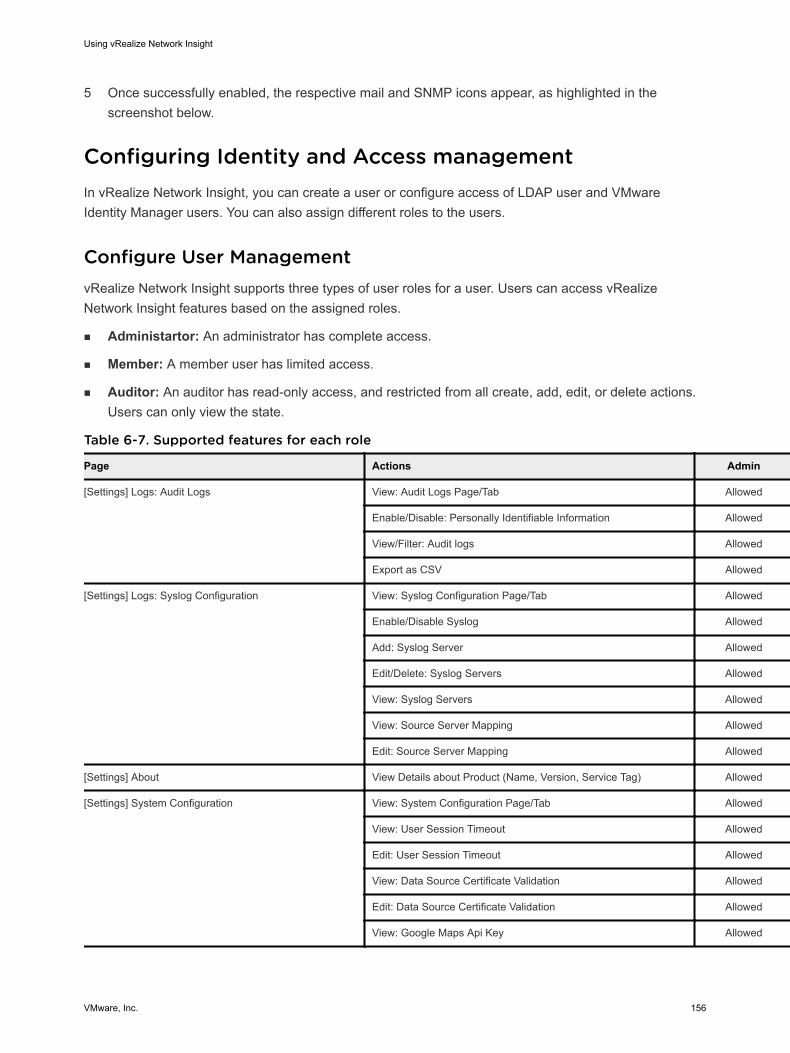
5 Once successfully enabled, the respective mail and SNMP icons appear, as highlighted in the screenshot below.
Configuring Identity and Access managementIn vRealize Network Insight, you can create a user or configure access of LDAP user and VMware Identity Manager users. You can also assign different roles to the users.
Configure User ManagementvRealize Network Insight supports three types of user roles for a user. Users can access vRealize Network Insight features based on the assigned roles.
n Administartor: An administrator has complete access.
n Member: A member user has limited access.
n Auditor: An auditor has read-only access, and restricted from all create, add, edit, or delete actions. Users can only view the state.
Table 6-7. Supported features for each role
Page Actions Admin Member Auditor
[Settings] Logs: Audit Logs View: Audit Logs Page/Tab Allowed -NA- Allowed
Enable/Disable: Personally Identifiable Information Allowed -NA- View only
View/Filter: Audit logs Allowed -NA- Allowed
Export as CSV Allowed -NA- Allowed
[Settings] Logs: Syslog Configuration View: Syslog Configuration Page/Tab Allowed -NA- Allowed
Enable/Disable Syslog Allowed -NA- View only
Add: Syslog Server Allowed -NA- -NA-
Edit/Delete: Syslog Servers Allowed -NA- -NA-
View: Syslog Servers Allowed -NA- Allowed
View: Source Server Mapping Allowed -NA- Allowed
Edit: Source Server Mapping Allowed -NA- -NA-
[Settings] About View Details about Product (Name, Version, Service Tag) Allowed Allowed Allowed
[Settings] System Configuration View: System Configuration Page/Tab Allowed -NA- Allowed
View: User Session Timeout Allowed -NA- Allowed
Edit: User Session Timeout Allowed -NA- -NA-
View: Data Source Certificate Validation Allowed -NA- Allowed
Edit: Data Source Certificate Validation Allowed -NA- -NA-
View: Google Maps Api Key Allowed -NA- Allowed
Using vRealize Network Insight
VMware, Inc. 156
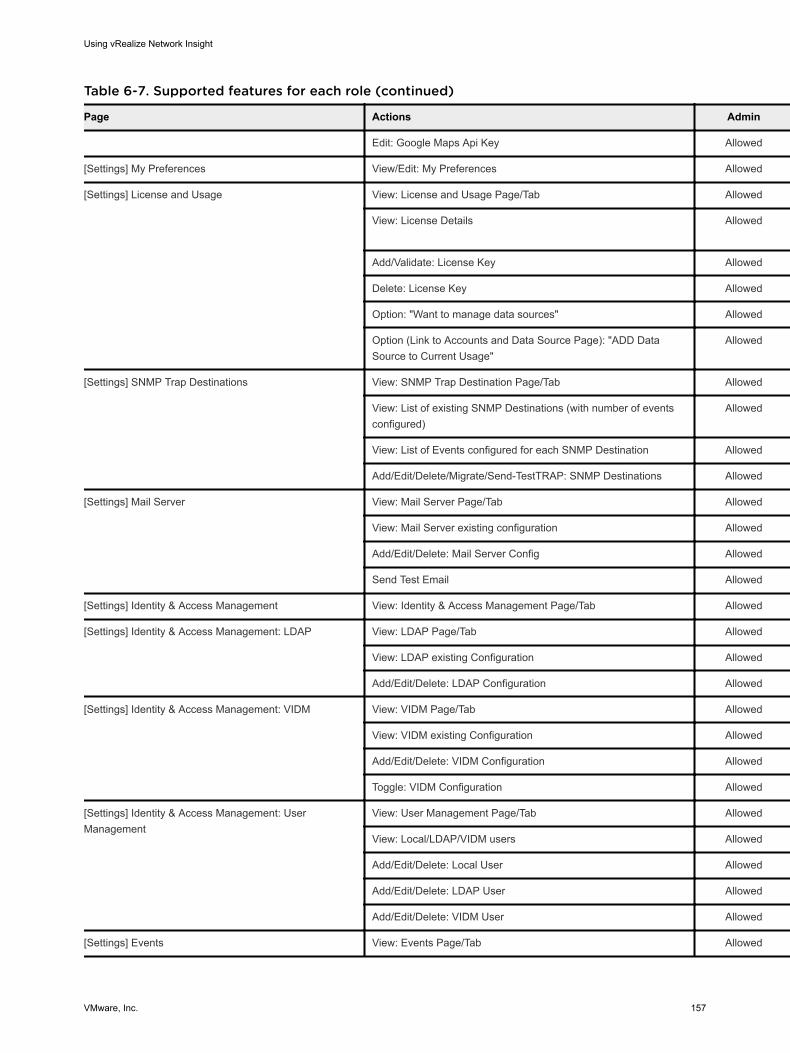
Table 6-7. Supported features for each role (continued)
Page Actions Admin Member Auditor
Edit: Google Maps Api Key Allowed -NA- -NA-
[Settings] My Preferences View/Edit: My Preferences Allowed Allowed Allowed
[Settings] License and Usage View: License and Usage Page/Tab Allowed -NA- Allowed
View: License Details Allowed -NA- Allowed(License Key:"Non-Null")
Add/Validate: License Key Allowed -NA- -NA-
Delete: License Key Allowed -NA- -NA-
Option: "Want to manage data sources" Allowed -NA- -NA-
Option (Link to Accounts and Data Source Page): "ADD Data Source to Current Usage"
Allowed -NA- View Only
[Settings] SNMP Trap Destinations View: SNMP Trap Destination Page/Tab Allowed -NA- Allowed
View: List of existing SNMP Destinations (with number of events configured)
Allowed -NA- Allowed
View: List of Events configured for each SNMP Destination Allowed -NA- Allowed
Add/Edit/Delete/Migrate/Send-TestTRAP: SNMP Destinations Allowed -NA- -NA-
[Settings] Mail Server View: Mail Server Page/Tab Allowed -NA- Allowed
View: Mail Server existing configuration Allowed -NA- Allowed
Add/Edit/Delete: Mail Server Config Allowed -NA- -NA-
Send Test Email Allowed -NA- -NA-
[Settings] Identity & Access Management View: Identity & Access Management Page/Tab Allowed -NA- Allowed
[Settings] Identity & Access Management: LDAP View: LDAP Page/Tab Allowed -NA- Allowed
View: LDAP existing Configuration Allowed -NA- Allowed
Add/Edit/Delete: LDAP Configuration Allowed -NA- -NA-
[Settings] Identity & Access Management: VIDM View: VIDM Page/Tab Allowed -NA- Allowed
View: VIDM existing Configuration Allowed -NA- Allowed
Add/Edit/Delete: VIDM Configuration Allowed -NA- -NA-
Toggle: VIDM Configuration Allowed -NA- Status View Only
[Settings] Identity & Access Management: User Management
View: User Management Page/Tab Allowed -NA- Allowed
View: Local/LDAP/VIDM users Allowed -NA- Allowed
Add/Edit/Delete: Local User Allowed -NA- -NA-
Add/Edit/Delete: LDAP User Allowed -NA- -NA-
Add/Edit/Delete: VIDM User Allowed -NA- -NA-
[Settings] Events View: Events Page/Tab Allowed Allowed Allowed
Using vRealize Network Insight
VMware, Inc. 157
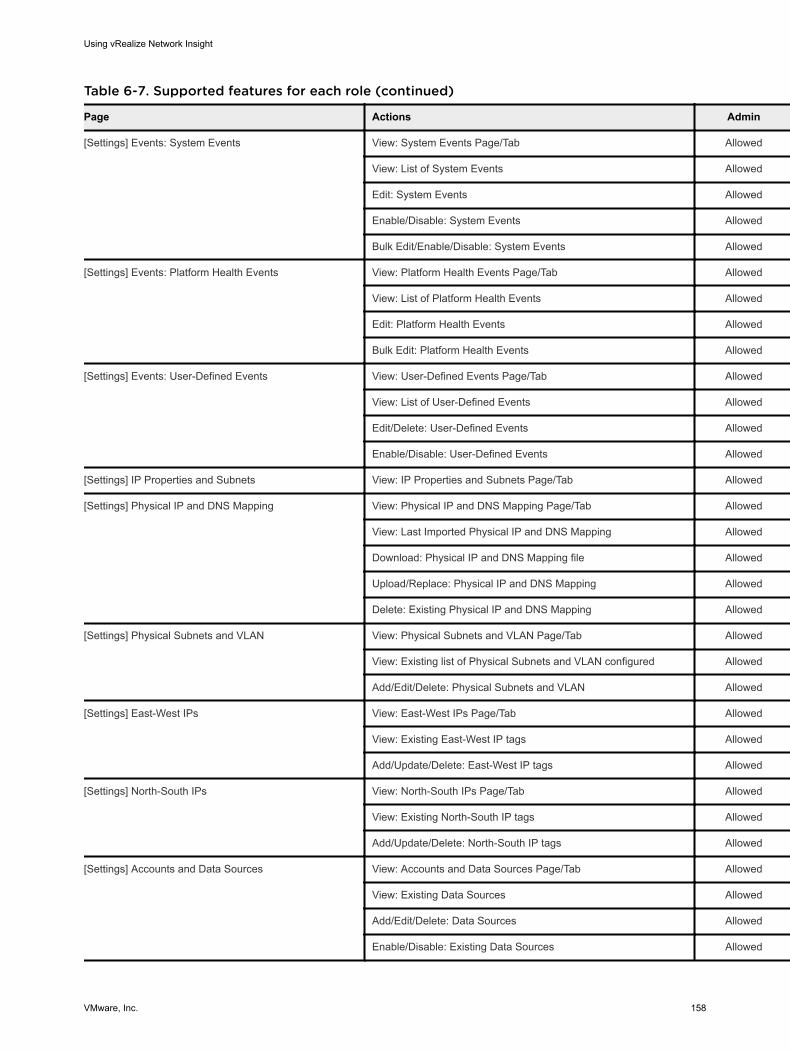
Table 6-7. Supported features for each role (continued)
Page Actions Admin Member Auditor
[Settings] Events: System Events View: System Events Page/Tab Allowed Allowed Allowed
View: List of System Events Allowed Allowed Allowed
Edit: System Events Allowed Allowed -NA-
Enable/Disable: System Events Allowed Allowed Status View Only
Bulk Edit/Enable/Disable: System Events Allowed Allowed -NA-
[Settings] Events: Platform Health Events View: Platform Health Events Page/Tab Allowed Allowed Allowed
View: List of Platform Health Events Allowed Allowed Allowed
Edit: Platform Health Events Allowed Allowed -NA-
Bulk Edit: Platform Health Events Allowed Allowed -NA-
[Settings] Events: User-Defined Events View: User-Defined Events Page/Tab Allowed Allowed Allowed
View: List of User-Defined Events Allowed Allowed Allowed
Edit/Delete: User-Defined Events Allowed Allowed -NA-
Enable/Disable: User-Defined Events Allowed Allowed Status View Only
[Settings] IP Properties and Subnets View: IP Properties and Subnets Page/Tab Allowed -NA- Allowed
[Settings] Physical IP and DNS Mapping View: Physical IP and DNS Mapping Page/Tab Allowed -NA- Allowed
View: Last Imported Physical IP and DNS Mapping Allowed -NA- Allowed
Download: Physical IP and DNS Mapping file Allowed -NA- Allowed
Upload/Replace: Physical IP and DNS Mapping Allowed -NA- -NA-
Delete: Existing Physical IP and DNS Mapping Allowed -NA- -NA-
[Settings] Physical Subnets and VLAN View: Physical Subnets and VLAN Page/Tab Allowed -NA- Allowed
View: Existing list of Physical Subnets and VLAN configured Allowed -NA- Allowed
Add/Edit/Delete: Physical Subnets and VLAN Allowed -NA- -NA-
[Settings] East-West IPs View: East-West IPs Page/Tab Allowed -NA- Allowed
View: Existing East-West IP tags Allowed -NA- Allowed
Add/Update/Delete: East-West IP tags Allowed -NA- -NA-
[Settings] North-South IPs View: North-South IPs Page/Tab Allowed -NA- Allowed
View: Existing North-South IP tags Allowed -NA- Allowed
Add/Update/Delete: North-South IP tags Allowed -NA- -NA-
[Settings] Accounts and Data Sources View: Accounts and Data Sources Page/Tab Allowed -NA- Allowed
View: Existing Data Sources Allowed -NA- Allowed
Add/Edit/Delete: Data Sources Allowed -NA- -NA-
Enable/Disable: Existing Data Sources Allowed -NA- Status View Only
Using vRealize Network Insight
VMware, Inc. 158
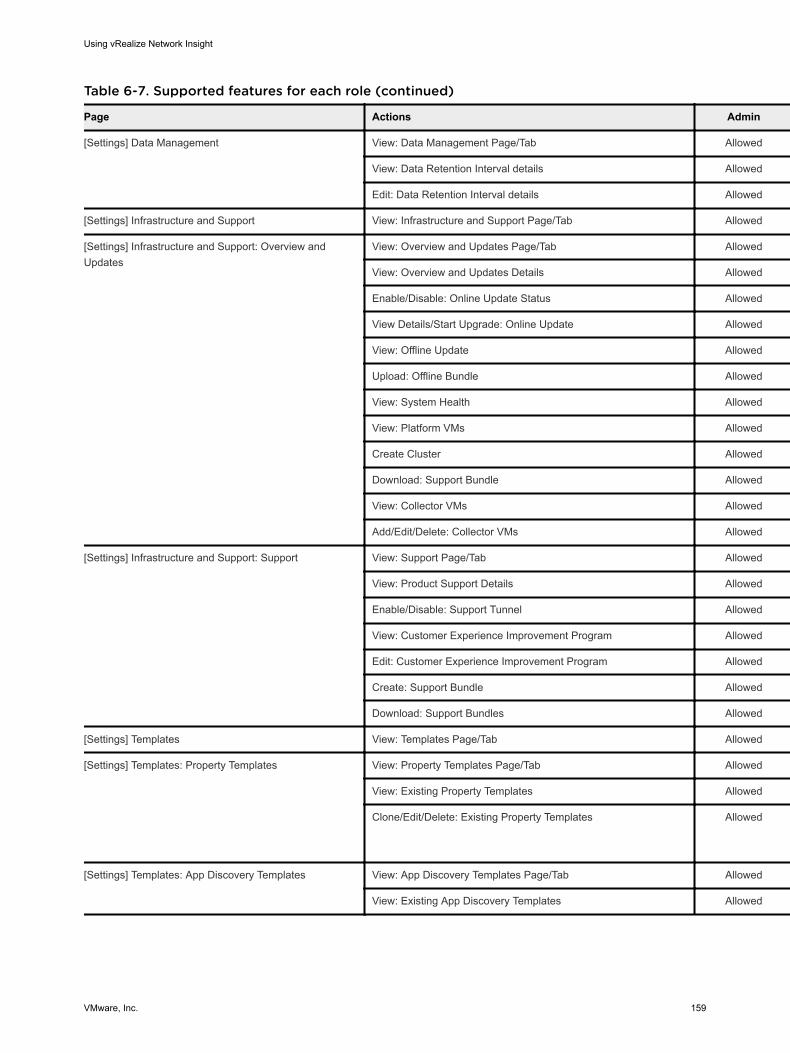
Table 6-7. Supported features for each role (continued)
Page Actions Admin Member Auditor
[Settings] Data Management View: Data Management Page/Tab Allowed -NA- Allowed
View: Data Retention Interval details Allowed -NA- Allowed
Edit: Data Retention Interval details Allowed -NA- -NA-
[Settings] Infrastructure and Support View: Infrastructure and Support Page/Tab Allowed -NA- Allowed
[Settings] Infrastructure and Support: Overview and Updates
View: Overview and Updates Page/Tab Allowed -NA- Allowed
View: Overview and Updates Details Allowed -NA- Allowed
Enable/Disable: Online Update Status Allowed -NA- Status View Only
View Details/Start Upgrade: Online Update Allowed -NA- -NA-
View: Offline Update Allowed -NA- -NA-
Upload: Offline Bundle Allowed -NA- -NA-
View: System Health Allowed -NA- Allowed
View: Platform VMs Allowed -NA- Allowed
Create Cluster Allowed -NA- -NA-
Download: Support Bundle Allowed -NA- Allowed
View: Collector VMs Allowed -NA- Allowed
Add/Edit/Delete: Collector VMs Allowed -NA- -NA-
[Settings] Infrastructure and Support: Support View: Support Page/Tab Allowed -NA- Allowed
View: Product Support Details Allowed -NA- Allowed
Enable/Disable: Support Tunnel Allowed -NA- Status View Only
View: Customer Experience Improvement Program Allowed -NA- Allowed
Edit: Customer Experience Improvement Program Allowed -NA- -NA-
Create: Support Bundle Allowed -NA- -NA-
Download: Support Bundles Allowed -NA- Allowed
[Settings] Templates View: Templates Page/Tab Allowed Allowed Allowed
[Settings] Templates: Property Templates View: Property Templates Page/Tab Allowed Allowed Allowed
View: Existing Property Templates Allowed Allowed Allowed
Clone/Edit/Delete: Existing Property Templates Allowed Allowed (Self
created)
-NA-
[Settings] Templates: App Discovery Templates View: App Discovery Templates Page/Tab Allowed Allowed Allowed
View: Existing App Discovery Templates Allowed Allowed Allowed
Using vRealize Network Insight
VMware, Inc. 159
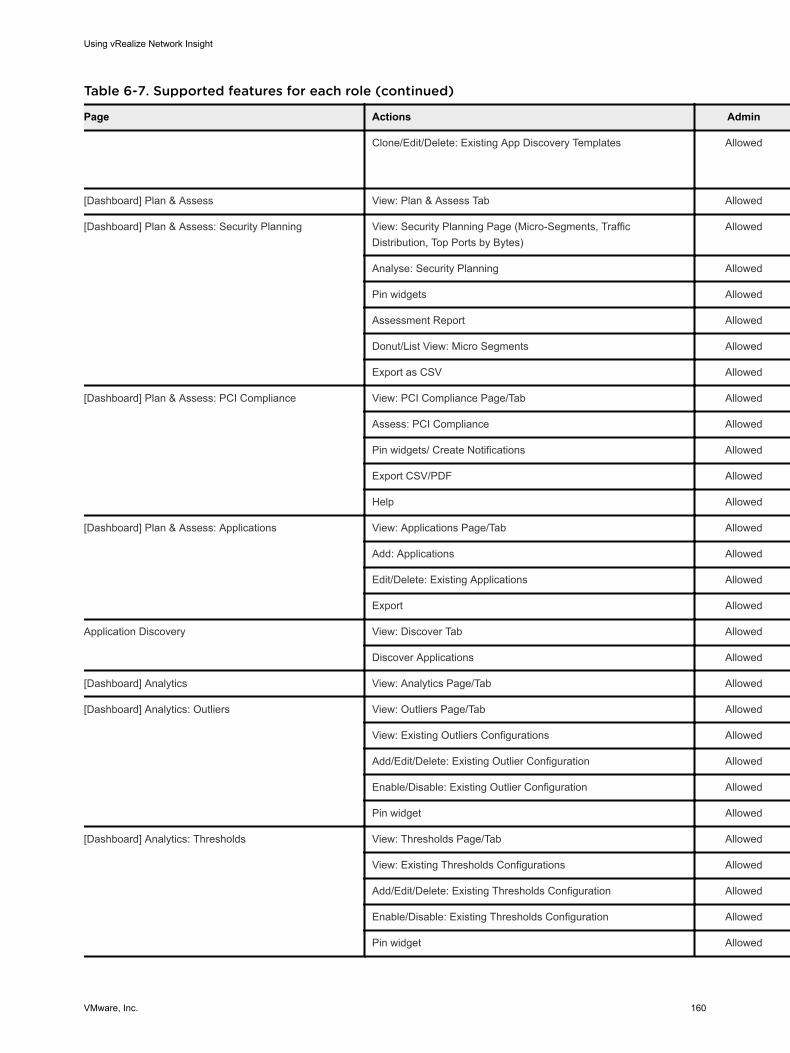
Table 6-7. Supported features for each role (continued)
Page Actions Admin Member Auditor
Clone/Edit/Delete: Existing App Discovery Templates Allowed Allowed (Self
created)
-NA-
[Dashboard] Plan & Assess View: Plan & Assess Tab Allowed Allowed Allowed
[Dashboard] Plan & Assess: Security Planning View: Security Planning Page (Micro-Segments, Traffic Distribution, Top Ports by Bytes)
Allowed Allowed Allowed
Analyse: Security Planning Allowed Allowed Allowed
Pin widgets Allowed Allowed -NA-
Assessment Report Allowed Allowed Allowed
Donut/List View: Micro Segments Allowed Allowed Allowed
Export as CSV Allowed Allowed Allowed
[Dashboard] Plan & Assess: PCI Compliance View: PCI Compliance Page/Tab Allowed Allowed Allowed
Assess: PCI Compliance Allowed Allowed Allowed
Pin widgets/ Create Notifications Allowed Allowed -NA-
Export CSV/PDF Allowed Allowed Allowed
Help Allowed Allowed Allowed
[Dashboard] Plan & Assess: Applications View: Applications Page/Tab Allowed Allowed Allowed
Add: Applications Allowed Allowed -NA-
Edit/Delete: Existing Applications Allowed Allowed -NA-
Export Allowed Allowed Allowed
Application Discovery View: Discover Tab Allowed Allowed -NA-
Discover Applications Allowed Allowed -NA-
[Dashboard] Analytics View: Analytics Page/Tab Allowed Allowed Allowed
[Dashboard] Analytics: Outliers View: Outliers Page/Tab Allowed Allowed Allowed
View: Existing Outliers Configurations Allowed Allowed Allowed
Add/Edit/Delete: Existing Outlier Configuration Allowed Allowed -NA-
Enable/Disable: Existing Outlier Configuration Allowed Allowed Status View Only
Pin widget Allowed Allowed -NA-
[Dashboard] Analytics: Thresholds View: Thresholds Page/Tab Allowed Allowed Allowed
View: Existing Thresholds Configurations Allowed Allowed Allowed
Add/Edit/Delete: Existing Thresholds Configuration Allowed Allowed -NA-
Enable/Disable: Existing Thresholds Configuration Allowed Allowed Status View Only
Pin widget Allowed Allowed -NA-
Using vRealize Network Insight
VMware, Inc. 160
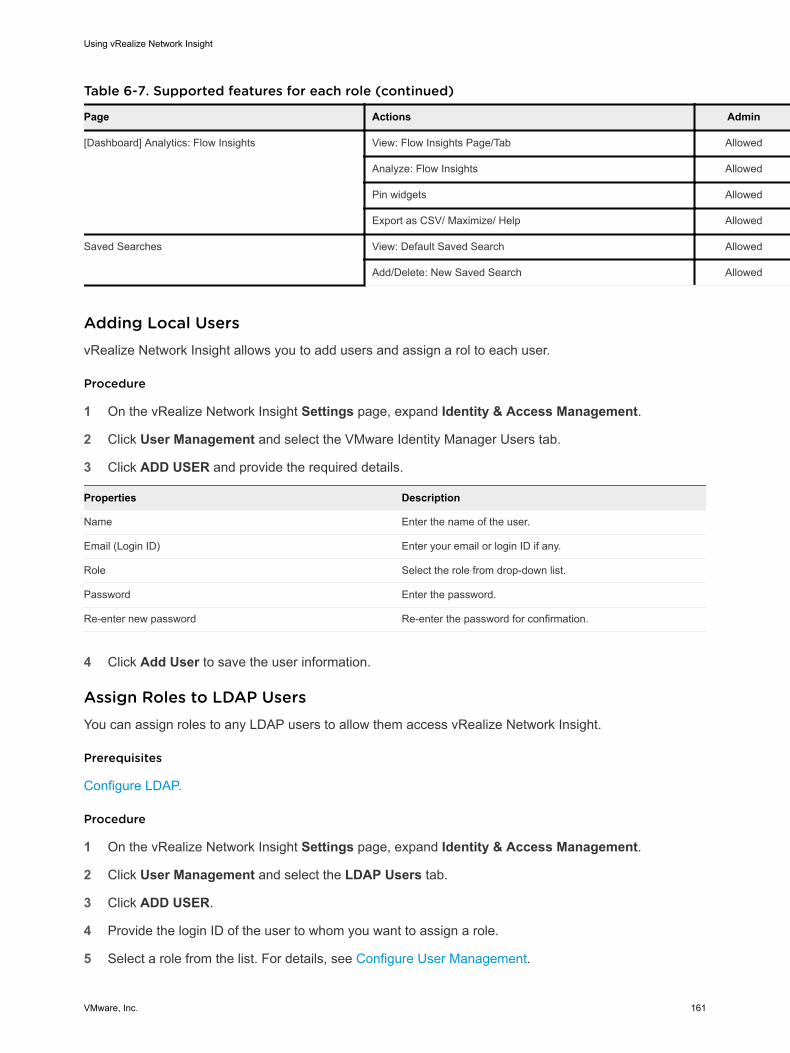
Table 6-7. Supported features for each role (continued)
Page Actions Admin Member Auditor
[Dashboard] Analytics: Flow Insights View: Flow Insights Page/Tab Allowed Allowed Allowed
Analyze: Flow Insights Allowed Allowed Allowed
Pin widgets Allowed Allowed -NA-
Export as CSV/ Maximize/ Help Allowed Allowed Allowed
Saved Searches View: Default Saved Search Allowed Allowed Allowed
Add/Delete: New Saved Search Allowed Allowed -NA-
Adding Local UsersvRealize Network Insight allows you to add users and assign a rol to each user.
Procedure
1 On the vRealize Network Insight Settings page, expand Identity & Access Management.
2 Click User Management and select the VMware Identity Manager Users tab.
3 Click ADD USER and provide the required details.
Properties Description
Name Enter the name of the user.
Email (Login ID) Enter your email or login ID if any.
Role Select the role from drop-down list.
Password Enter the password.
Re-enter new password Re-enter the password for confirmation.
4 Click Add User to save the user information.
Assign Roles to LDAP UsersYou can assign roles to any LDAP users to allow them access vRealize Network Insight.
Prerequisites
Configure LDAP.
Procedure
1 On the vRealize Network Insight Settings page, expand Identity & Access Management.
2 Click User Management and select the LDAP Users tab.
3 Click ADD USER.
4 Provide the login ID of the user to whom you want to assign a role.
5 Select a role from the list. For details, see Configure User Management.
Using vRealize Network Insight
VMware, Inc. 161
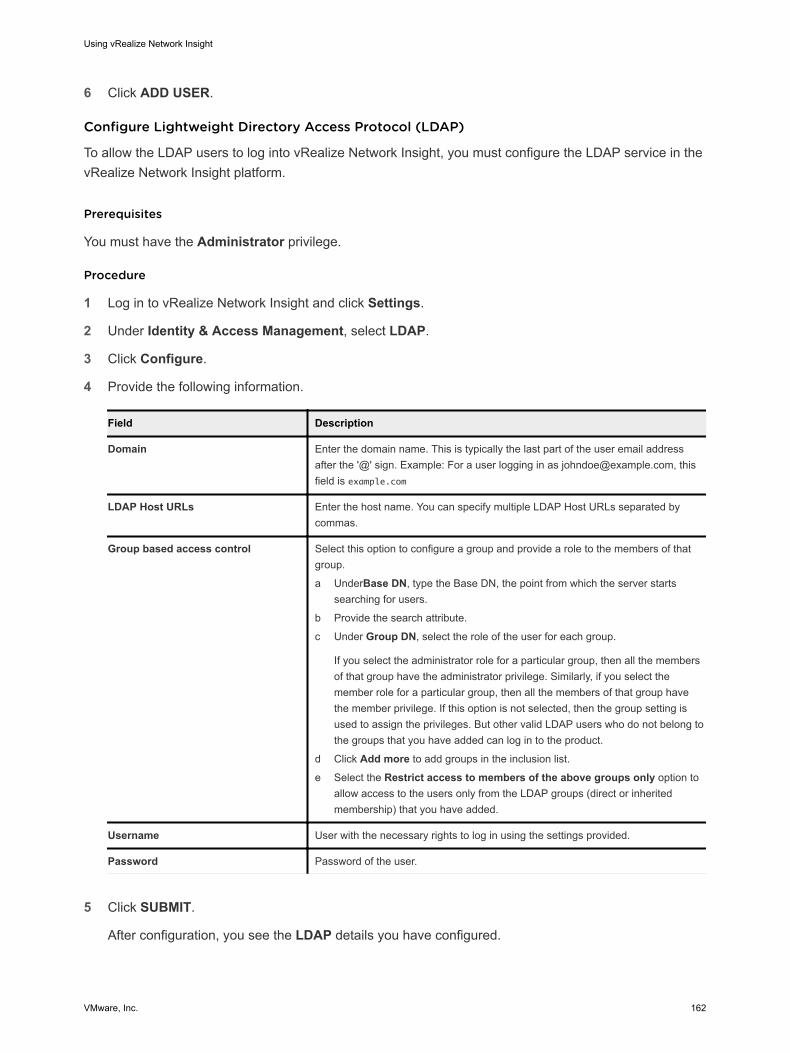
6 Click ADD USER.
Configure Lightweight Directory Access Protocol (LDAP)
To allow the LDAP users to log into vRealize Network Insight, you must configure the LDAP service in the vRealize Network Insight platform.
Prerequisites
You must have the Administrator privilege.
Procedure
1 Log in to vRealize Network Insight and click Settings.
2 Under Identity & Access Management, select LDAP.
3 Click Configure.
4 Provide the following information.
Field Description
Domain Enter the domain name. This is typically the last part of the user email address after the '@' sign. Example: For a user logging in as [email protected], this field is example.com
LDAP Host URLs Enter the host name. You can specify multiple LDAP Host URLs separated by commas.
Group based access control Select this option to configure a group and provide a role to the members of that group.
a UnderBase DN, type the Base DN, the point from which the server starts searching for users.
b Provide the search attribute.
c Under Group DN, select the role of the user for each group.
If you select the administrator role for a particular group, then all the members of that group have the administrator privilege. Similarly, if you select the member role for a particular group, then all the members of that group have the member privilege. If this option is not selected, then the group setting is used to assign the privileges. But other valid LDAP users who do not belong to the groups that you have added can log in to the product.
d Click Add more to add groups in the inclusion list.
e Select the Restrict access to members of the above groups only option to allow access to the users only from the LDAP groups (direct or inherited membership) that you have added.
Username User with the necessary rights to log in using the settings provided.
Password Password of the user.
5 Click SUBMIT.
After configuration, you see the LDAP details you have configured.
Using vRealize Network Insight
VMware, Inc. 162
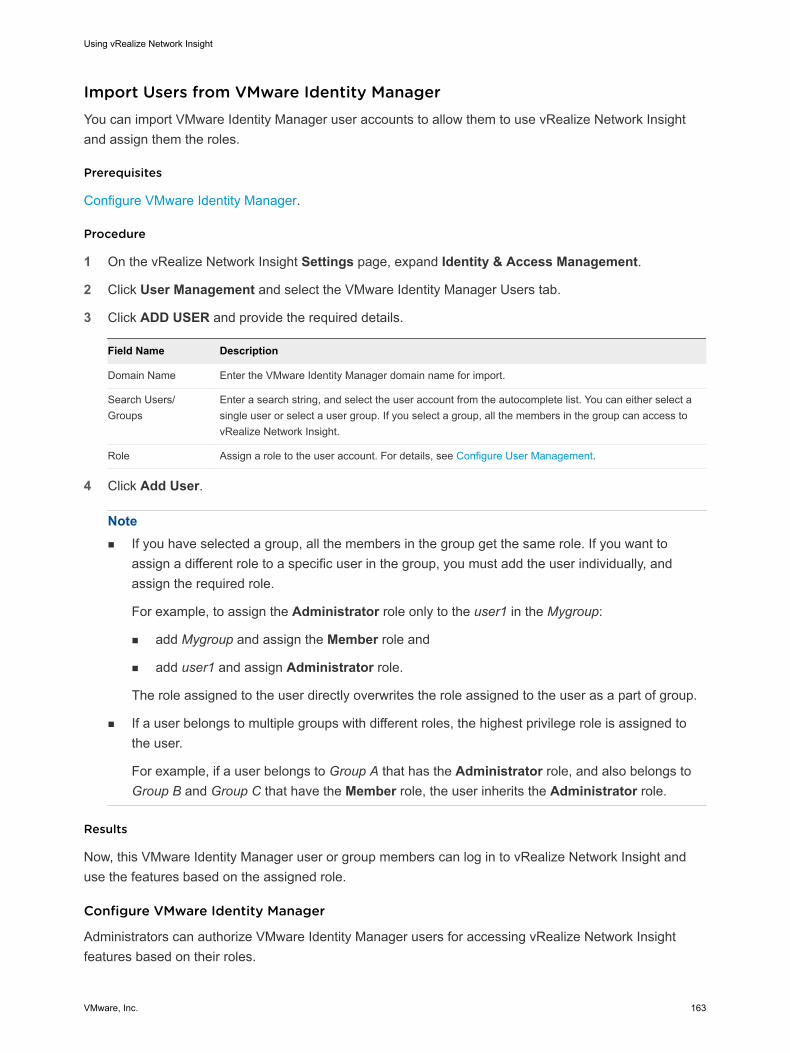
Import Users from VMware Identity ManagerYou can import VMware Identity Manager user accounts to allow them to use vRealize Network Insight and assign them the roles.
Prerequisites
Configure VMware Identity Manager.
Procedure
1 On the vRealize Network Insight Settings page, expand Identity & Access Management.
2 Click User Management and select the VMware Identity Manager Users tab.
3 Click ADD USER and provide the required details.
Field Name Description
Domain Name Enter the VMware Identity Manager domain name for import.
Search Users/Groups
Enter a search string, and select the user account from the autocomplete list. You can either select a single user or select a user group. If you select a group, all the members in the group can access to vRealize Network Insight.
Role Assign a role to the user account. For details, see Configure User Management.
4 Click Add User.
Note n If you have selected a group, all the members in the group get the same role. If you want to
assign a different role to a specific user in the group, you must add the user individually, and assign the required role.
For example, to assign the Administrator role only to the user1 in the Mygroup:
n add Mygroup and assign the Member role and
n add user1 and assign Administrator role.
The role assigned to the user directly overwrites the role assigned to the user as a part of group.
n If a user belongs to multiple groups with different roles, the highest privilege role is assigned to the user.
For example, if a user belongs to Group A that has the Administrator role, and also belongs to Group B and Group C that have the Member role, the user inherits the Administrator role.
Results
Now, this VMware Identity Manager user or group members can log in to vRealize Network Insight and use the features based on the assigned role.
Configure VMware Identity Manager
Administrators can authorize VMware Identity Manager users for accessing vRealize Network Insight features based on their roles.
Using vRealize Network Insight
VMware, Inc. 163
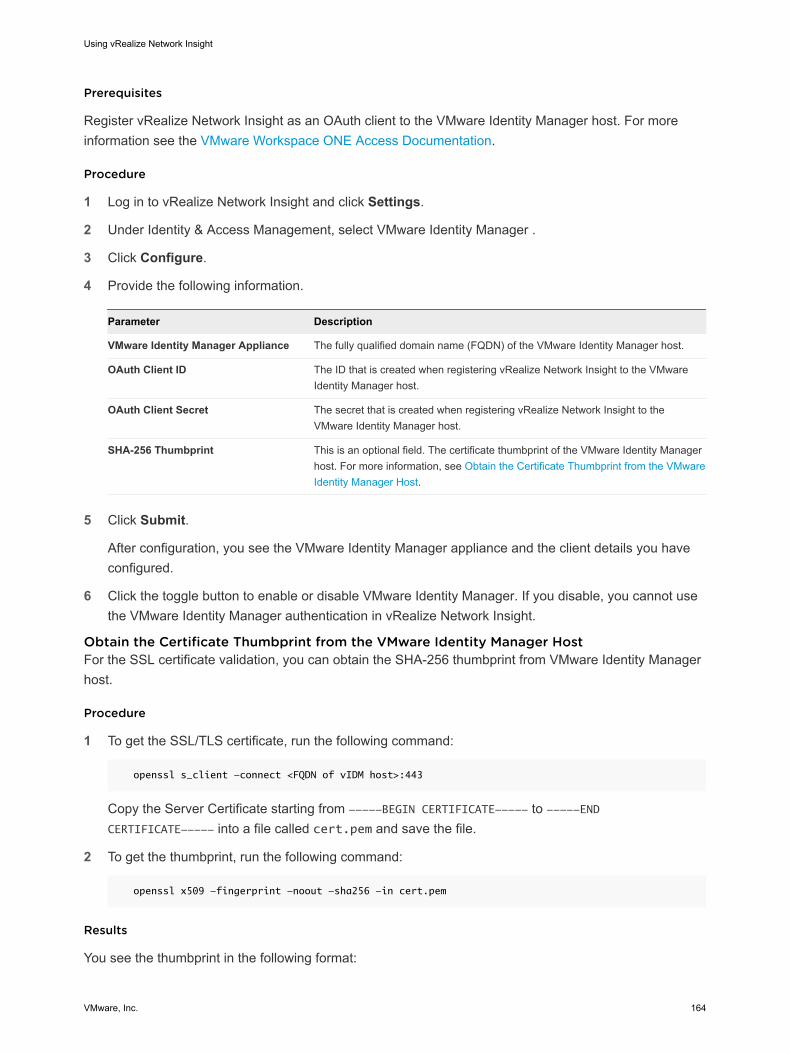
Prerequisites
Register vRealize Network Insight as an OAuth client to the VMware Identity Manager host. For more information see the VMware Workspace ONE Access Documentation.
Procedure
1 Log in to vRealize Network Insight and click Settings.
2 Under Identity & Access Management, select VMware Identity Manager .
3 Click Configure.
4 Provide the following information.
Parameter Description
VMware Identity Manager Appliance The fully qualified domain name (FQDN) of the VMware Identity Manager host.
OAuth Client ID The ID that is created when registering vRealize Network Insight to the VMware Identity Manager host.
OAuth Client Secret The secret that is created when registering vRealize Network Insight to the VMware Identity Manager host.
SHA-256 Thumbprint This is an optional field. The certificate thumbprint of the VMware Identity Manager host. For more information, see Obtain the Certificate Thumbprint from the VMware Identity Manager Host.
5 Click Submit.
After configuration, you see the VMware Identity Manager appliance and the client details you have configured.
6 Click the toggle button to enable or disable VMware Identity Manager. If you disable, you cannot use the VMware Identity Manager authentication in vRealize Network Insight.
Obtain the Certificate Thumbprint from the VMware Identity Manager HostFor the SSL certificate validation, you can obtain the SHA-256 thumbprint from VMware Identity Manager host.
Procedure
1 To get the SSL/TLS certificate, run the following command:
openssl s_client -connect <FQDN of vIDM host>:443
Copy the Server Certificate starting from -----BEGIN CERTIFICATE----- to -----END CERTIFICATE----- into a file called cert.pem and save the file.
2 To get the thumbprint, run the following command:
openssl x509 -fingerprint -noout -sha256 -in cert.pem
Results
You see the thumbprint in the following format:
Using vRealize Network Insight
VMware, Inc. 164
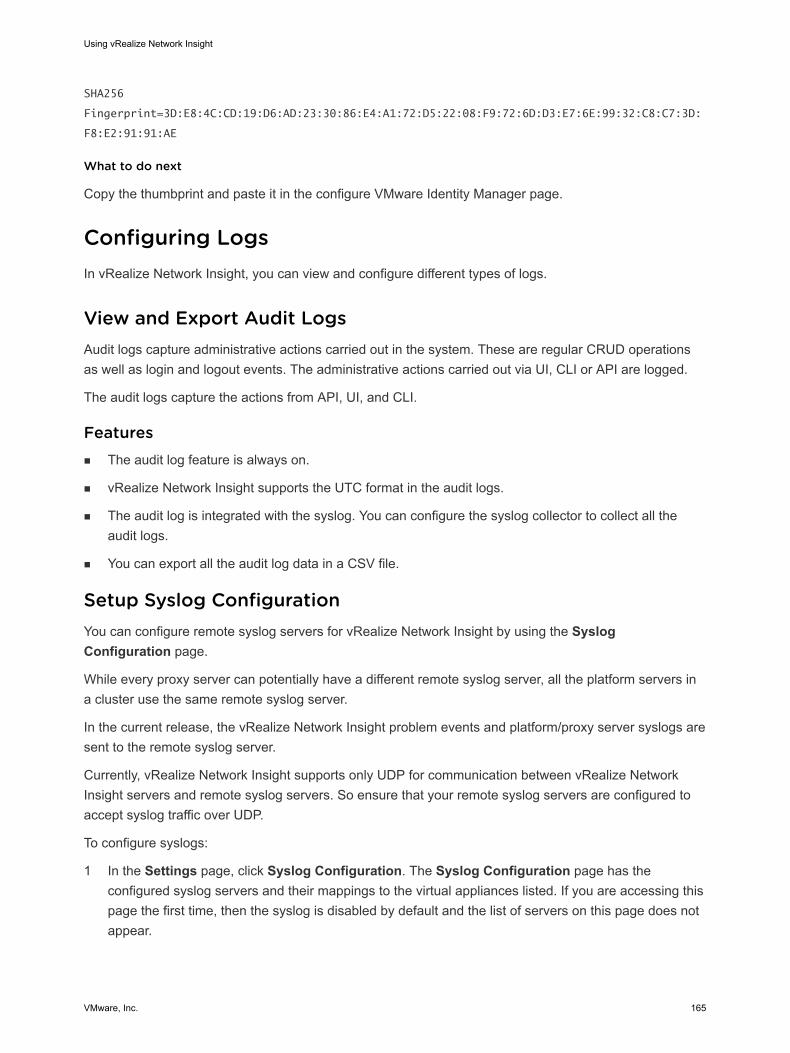
SHA256
Fingerprint=3D:E8:4C:CD:19:D6:AD:23:30:86:E4:A1:72:D5:22:08:F9:72:6D:D3:E7:6E:99:32:C8:C7:3D:
F8:E2:91:91:AE
What to do next
Copy the thumbprint and paste it in the configure VMware Identity Manager page.
Configuring LogsIn vRealize Network Insight, you can view and configure different types of logs.
View and Export Audit LogsAudit logs capture administrative actions carried out in the system. These are regular CRUD operations as well as login and logout events. The administrative actions carried out via UI, CLI or API are logged.
The audit logs capture the actions from API, UI, and CLI.
Featuresn The audit log feature is always on.
n vRealize Network Insight supports the UTC format in the audit logs.
n The audit log is integrated with the syslog. You can configure the syslog collector to collect all the audit logs.
n You can export all the audit log data in a CSV file.
Setup Syslog ConfigurationYou can configure remote syslog servers for vRealize Network Insight by using the Syslog Configuration page.
While every proxy server can potentially have a different remote syslog server, all the platform servers in a cluster use the same remote syslog server.
In the current release, the vRealize Network Insight problem events and platform/proxy server syslogs are sent to the remote syslog server.
Currently, vRealize Network Insight supports only UDP for communication between vRealize Network Insight servers and remote syslog servers. So ensure that your remote syslog servers are configured to accept syslog traffic over UDP.
To configure syslogs:
1 In the Settings page, click Syslog Configuration. The Syslog Configuration page has the configured syslog servers and their mappings to the virtual appliances listed. If you are accessing this page the first time, then the syslog is disabled by default and the list of servers on this page does not appear.
Using vRealize Network Insight
VMware, Inc. 165
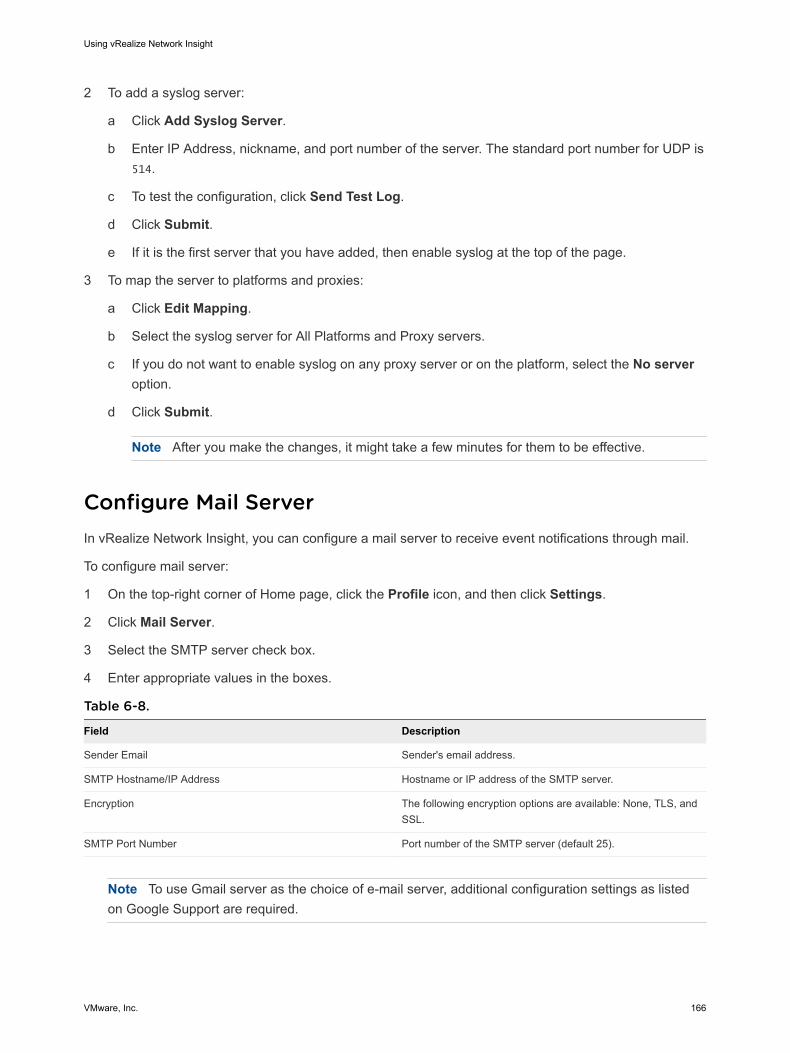
2 To add a syslog server:
a Click Add Syslog Server.
b Enter IP Address, nickname, and port number of the server. The standard port number for UDP is 514.
c To test the configuration, click Send Test Log.
d Click Submit.
e If it is the first server that you have added, then enable syslog at the top of the page.
3 To map the server to platforms and proxies:
a Click Edit Mapping.
b Select the syslog server for All Platforms and Proxy servers.
c If you do not want to enable syslog on any proxy server or on the platform, select the No server option.
d Click Submit.
Note After you make the changes, it might take a few minutes for them to be effective.
Configure Mail ServerIn vRealize Network Insight, you can configure a mail server to receive event notifications through mail.
To configure mail server:
1 On the top-right corner of Home page, click the Profile icon, and then click Settings.
2 Click Mail Server.
3 Select the SMTP server check box.
4 Enter appropriate values in the boxes.
Table 6-8.
Field Description
Sender Email Sender's email address.
SMTP Hostname/IP Address Hostname or IP address of the SMTP server.
Encryption The following encryption options are available: None, TLS, and SSL.
SMTP Port Number Port number of the SMTP server (default 25).
Note To use Gmail server as the choice of e-mail server, additional configuration settings as listed on Google Support are required.
Using vRealize Network Insight
VMware, Inc. 166
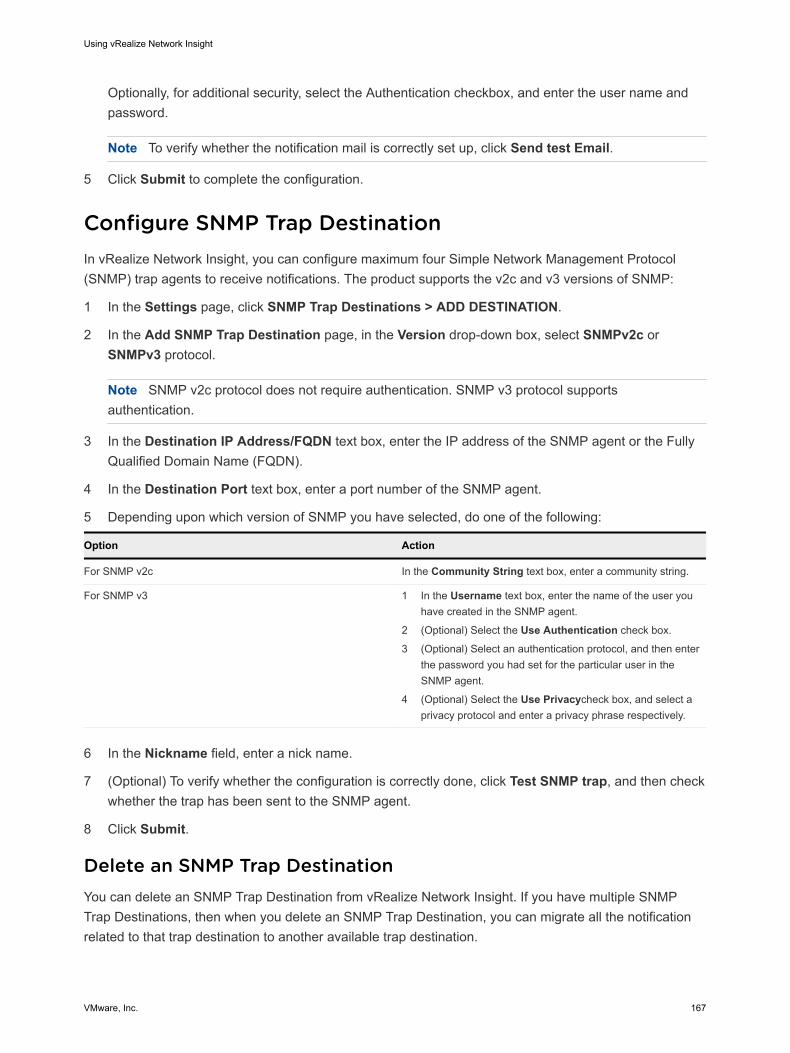
Optionally, for additional security, select the Authentication checkbox, and enter the user name and password.
Note To verify whether the notification mail is correctly set up, click Send test Email.
5 Click Submit to complete the configuration.
Configure SNMP Trap DestinationIn vRealize Network Insight, you can configure maximum four Simple Network Management Protocol (SNMP) trap agents to receive notifications. The product supports the v2c and v3 versions of SNMP:
1 In the Settings page, click SNMP Trap Destinations > ADD DESTINATION.
2 In the Add SNMP Trap Destination page, in the Version drop-down box, select SNMPv2c or SNMPv3 protocol.
Note SNMP v2c protocol does not require authentication. SNMP v3 protocol supports authentication.
3 In the Destination IP Address/FQDN text box, enter the IP address of the SNMP agent or the Fully Qualified Domain Name (FQDN).
4 In the Destination Port text box, enter a port number of the SNMP agent.
5 Depending upon which version of SNMP you have selected, do one of the following:
Option Action
For SNMP v2c In the Community String text box, enter a community string.
For SNMP v3 1 In the Username text box, enter the name of the user you have created in the SNMP agent.
2 (Optional) Select the Use Authentication check box.
3 (Optional) Select an authentication protocol, and then enter the password you had set for the particular user in the SNMP agent.
4 (Optional) Select the Use Privacycheck box, and select a privacy protocol and enter a privacy phrase respectively.
6 In the Nickname field, enter a nick name.
7 (Optional) To verify whether the configuration is correctly done, click Test SNMP trap, and then check whether the trap has been sent to the SNMP agent.
8 Click Submit.
Delete an SNMP Trap DestinationYou can delete an SNMP Trap Destination from vRealize Network Insight. If you have multiple SNMP Trap Destinations, then when you delete an SNMP Trap Destination, you can migrate all the notification related to that trap destination to another available trap destination.
Using vRealize Network Insight
VMware, Inc. 167
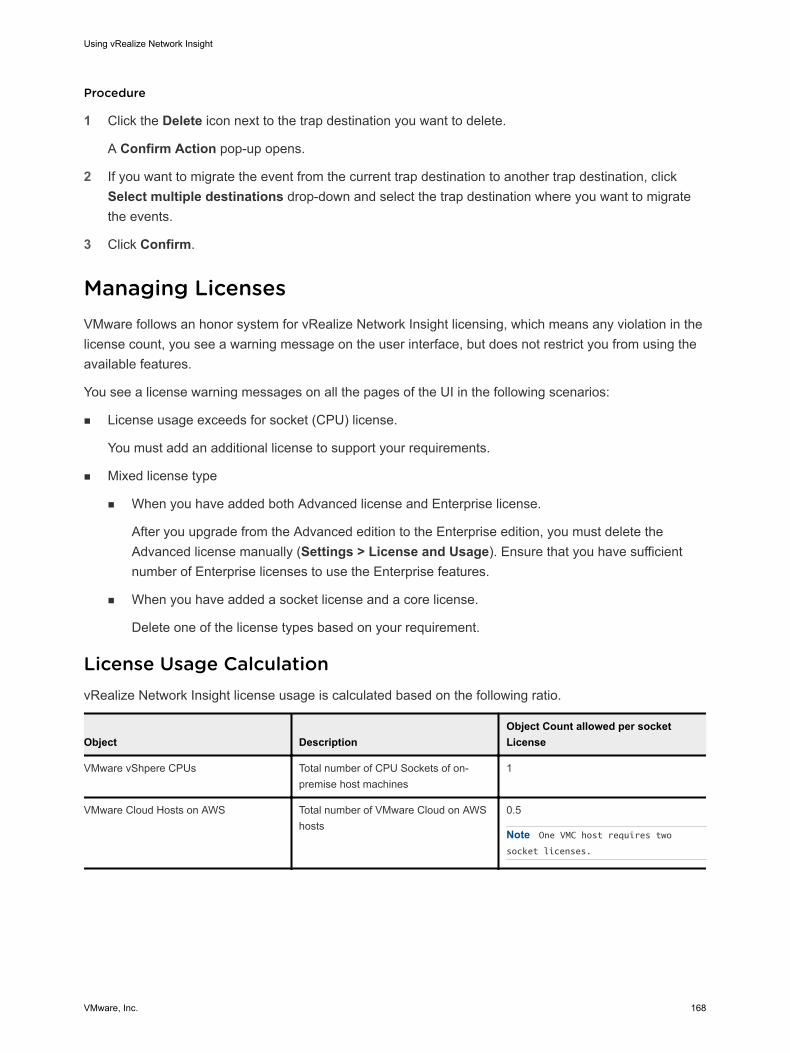
Procedure
1 Click the Delete icon next to the trap destination you want to delete.
A Confirm Action pop-up opens.
2 If you want to migrate the event from the current trap destination to another trap destination, click Select multiple destinations drop-down and select the trap destination where you want to migrate the events.
3 Click Confirm.
Managing LicensesVMware follows an honor system for vRealize Network Insight licensing, which means any violation in the license count, you see a warning message on the user interface, but does not restrict you from using the available features.
You see a license warning messages on all the pages of the UI in the following scenarios:
n License usage exceeds for socket (CPU) license.
You must add an additional license to support your requirements.
n Mixed license type
n When you have added both Advanced license and Enterprise license.
After you upgrade from the Advanced edition to the Enterprise edition, you must delete the Advanced license manually (Settings > License and Usage). Ensure that you have sufficient number of Enterprise licenses to use the Enterprise features.
n When you have added a socket license and a core license.
Delete one of the license types based on your requirement.
License Usage CalculationvRealize Network Insight license usage is calculated based on the following ratio.
Object DescriptionObject Count allowed per socket License
VMware vShpere CPUs Total number of CPU Sockets of on-premise host machines
1
VMware Cloud Hosts on AWS Total number of VMware Cloud on AWS hosts
0.5
Note One VMC host requires two socket licenses.
Using vRealize Network Insight
VMware, Inc. 168
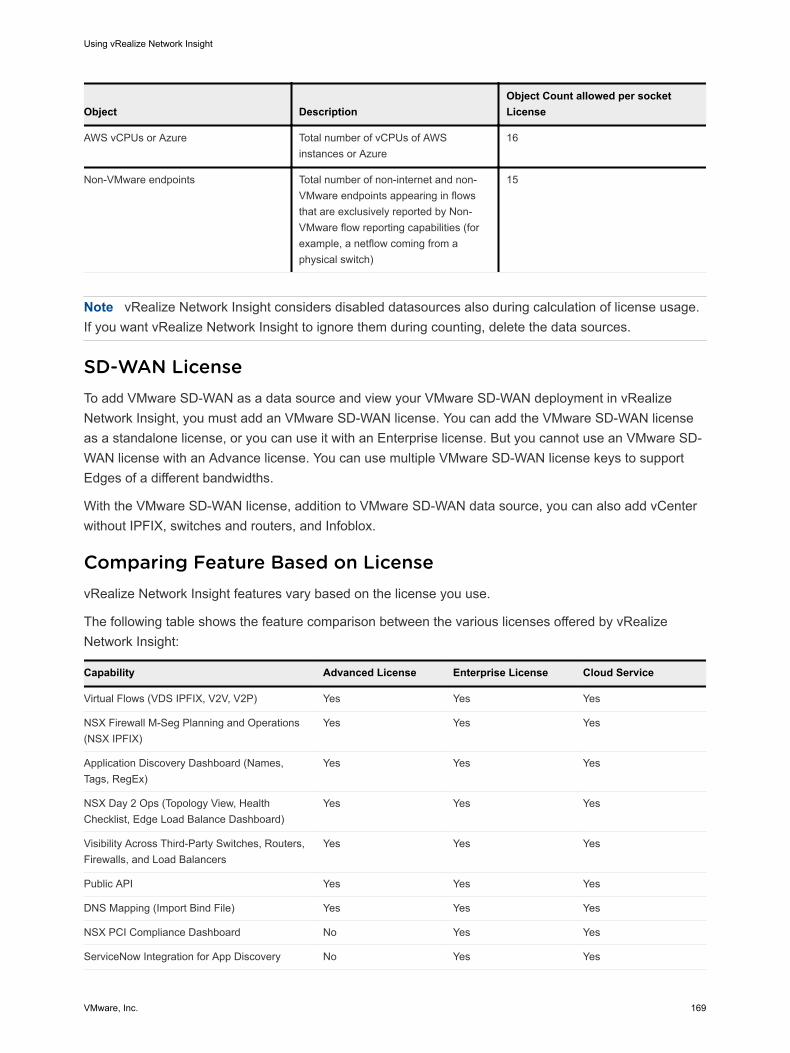
Object DescriptionObject Count allowed per socket License
AWS vCPUs or Azure Total number of vCPUs of AWS instances or Azure
16
Non-VMware endpoints Total number of non-internet and non-VMware endpoints appearing in flows that are exclusively reported by Non-VMware flow reporting capabilities (for example, a netflow coming from a physical switch)
15
Note vRealize Network Insight considers disabled datasources also during calculation of license usage. If you want vRealize Network Insight to ignore them during counting, delete the data sources.
SD-WAN LicenseTo add VMware SD-WAN as a data source and view your VMware SD-WAN deployment in vRealize Network Insight, you must add an VMware SD-WAN license. You can add the VMware SD-WAN license as a standalone license, or you can use it with an Enterprise license. But you cannot use an VMware SD-WAN license with an Advance license. You can use multiple VMware SD-WAN license keys to support Edges of a different bandwidths.
With the VMware SD-WAN license, addition to VMware SD-WAN data source, you can also add vCenter without IPFIX, switches and routers, and Infoblox.
Comparing Feature Based on LicensevRealize Network Insight features vary based on the license you use.
The following table shows the feature comparison between the various licenses offered by vRealize Network Insight:
Capability Advanced License Enterprise License Cloud Service
Virtual Flows (VDS IPFIX, V2V, V2P) Yes Yes Yes
NSX Firewall M-Seg Planning and Operations (NSX IPFIX)
Yes Yes Yes
Application Discovery Dashboard (Names, Tags, RegEx)
Yes Yes Yes
NSX Day 2 Ops (Topology View, Health Checklist, Edge Load Balance Dashboard)
Yes Yes Yes
Visibility Across Third-Party Switches, Routers, Firewalls, and Load Balancers
Yes Yes Yes
Public API Yes Yes Yes
DNS Mapping (Import Bind File) Yes Yes Yes
NSX PCI Compliance Dashboard No Yes Yes
ServiceNow Integration for App Discovery No Yes Yes
Using vRealize Network Insight
VMware, Inc. 169
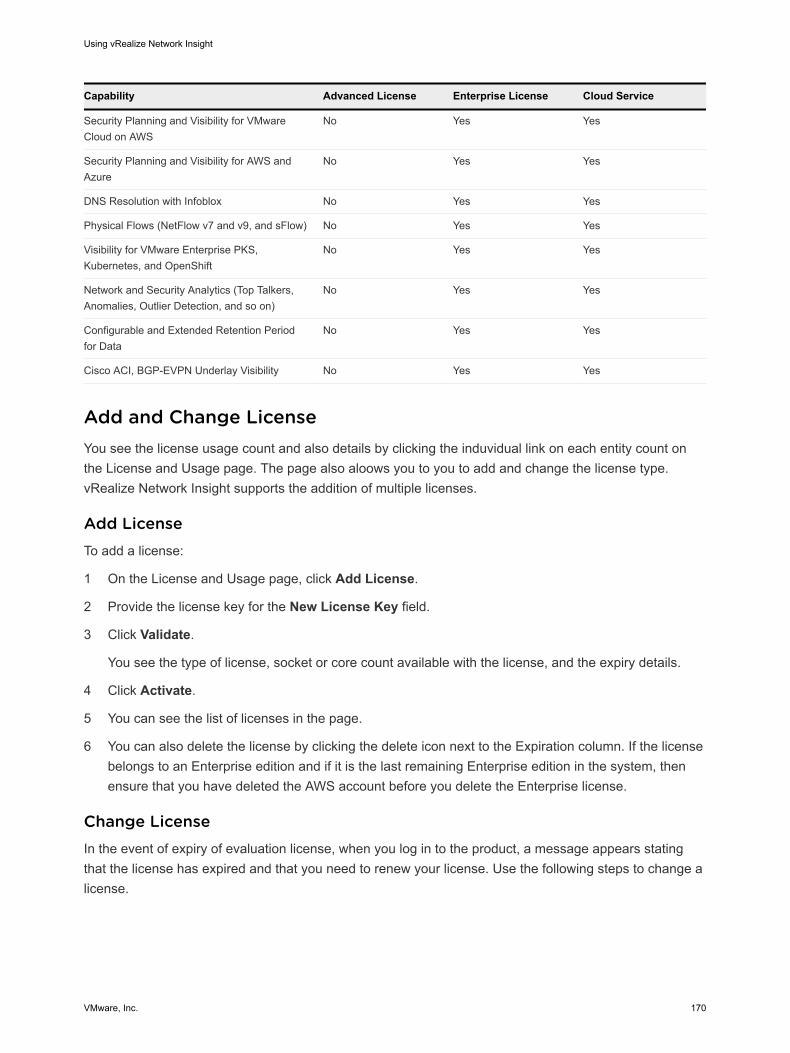
Capability Advanced License Enterprise License Cloud Service
Security Planning and Visibility for VMware Cloud on AWS
No Yes Yes
Security Planning and Visibility for AWS and Azure
No Yes Yes
DNS Resolution with Infoblox No Yes Yes
Physical Flows (NetFlow v7 and v9, and sFlow) No Yes Yes
Visibility for VMware Enterprise PKS, Kubernetes, and OpenShift
No Yes Yes
Network and Security Analytics (Top Talkers, Anomalies, Outlier Detection, and so on)
No Yes Yes
Configurable and Extended Retention Period for Data
No Yes Yes
Cisco ACI, BGP-EVPN Underlay Visibility No Yes Yes
Add and Change LicenseYou see the license usage count and also details by clicking the induvidual link on each entity count on the License and Usage page. The page also aloows you to you to add and change the license type. vRealize Network Insight supports the addition of multiple licenses.
Add LicenseTo add a license:
1 On the License and Usage page, click Add License.
2 Provide the license key for the New License Key field.
3 Click Validate.
You see the type of license, socket or core count available with the license, and the expiry details.
4 Click Activate.
5 You can see the list of licenses in the page.
6 You can also delete the license by clicking the delete icon next to the Expiration column. If the license belongs to an Enterprise edition and if it is the last remaining Enterprise edition in the system, then ensure that you have deleted the AWS account before you delete the Enterprise license.
Change LicenseIn the event of expiry of evaluation license, when you log in to the product, a message appears stating that the license has expired and that you need to renew your license. Use the following steps to change a license.
Using vRealize Network Insight
VMware, Inc. 170
To change a license:
1 Click the link contained in the Expiry message to go to the Change License page. Alternatively, in Settings, click License and Usage, and then click Change License.
2 In the Change License page, in New License Key, enter the new license key you received from VMware.
3 Click Validate.
4 Click Activate.
Note Upon the expiry of the Evaluation license, the data providers are disabled and they stop collecting data. After renewing the license, the data providers must be enabled again from the UI to start data collection.
Configure Auto-Refresh IntervalIn vRealize Network Insight, you can configure auto-refresh interval for entity pages and pinboards.
vRealize Network Insight provides the auto-refresh feature for the entity dashboards and pinboards. The dashboard refreshes automatically once in every n minutes specified on the header bar.
You can specify the time interval for which you want all your dashboards to perform an auto refresh. After the specified time interval (n minutes), all the open widgets on the dashboard will reload automatically.
Note n You cannot change the auto-refresh time interval for a particular dashboard.
n Auto-refresh is paused if you select a past time interval in timeline slider.
You can pause auto-refresh if you do not require it for a particular dashboard. On the header bar, set Pause to ON. The auto-refresh counter resets once you set Pause to OFF.
If you are viewing a pinboard and if another user is making changes to it such as changing the layout of the pinboard, the auto-refresh feature not only updates the content but also refreshes the entire pinboard. This occurs only if sharing and collaboration exists between you and the other user.
Procedure
1 On the Settings page, click My Preferences. Or on the respective dashboard, click Modify next to Auto-Refresh in the header bar.
2 Click Edit to change the time interval for auto-refresh. Select the time interval from the drop-down menu. Click Save.
3 To disable the auto-refresh option, select Disabled from the drop-down menu. All the dashboards are disabled from refreshing automatically if you select this option.
Using vRealize Network Insight
VMware, Inc. 171
Configure User Session TimeoutBy default, the user session timeout is set to 15 minutes. You can modify this value according to your preference.
Procedure
1 On the Settings page, click System Configuration.
Note The System Configuration tab is visible only to the admin user.
2 Click the edit icon to change your preference for the user session timeout.
3 Drag the slider bar to set the timeout value for the session. The value ranges from 15 minutes to 24 hours.
4 You can also view the details on who modified the timeout value and when in the Last Modified field.
5 Click Submit. The Success message appears to confirm that the updated session duration will be effective from the next login.
Note The new value for the user session timeout will come into effect only after you log out and log in again.
Add Google Maps API KeyTo get the map view of your SD-WAN deployment, you must add a Google Maps API key in vRealize Network Insight.
Prerequisites
Ensure the following:
n You are a member of Google Cloud Platform and billing is enabled in your account.
n You have the Google map API key. To get the API key, see Get an API key procedure in Google Maps Platform documentation.
n You have restricted the API key to prevent any misuse. To know more, see Restrict the API key in Google Maps Platform documentation.
Procedure
1 On the Settings page, click System Configuration.
2 In the Google Maps API Key, enter the API key and click Save.
Configure Data Source Certificate ValidationWhen you add a data source in vRealize Network Insight, all the certificates (HTTPs certificates or SSH public keys) related to that data source are automatically added as a trust on first use. After you add the
Using vRealize Network Insight
VMware, Inc. 172
data source in vRealize Network Insight, every time there is any change in the certificate, the system validates the certificate.
There are two ways you can configure certificate validation: Automatic Acceptance and Manual Acceptance. In Automatic Acceptance, system automatically accepts all the detected certificate changes, and in Manual Acceptance, system stops the data source and shows you an alert message notification to accept the certificate manually. When you accept the certificate, the system starts the data source.
Procedure
1 Go to Settings > System Configurations.
2 From Data Source Certificate Validation drop-down menu, select one of the data source validation methods:
n Automatic Acceptance
n Manual Acceptance
3 Click Save.
Note If you change the certificate validation method from Manual Acceptance to Automatic Acceptance, you must accept all the available certificate changes manually before you change the certificate validation method.
If you change the Data Source Certificate Validation from Manual Acceptance to Automatic Acceptance without accepting the pending detected certificate changes, then you have to delete all the data source with pending certificate and add them again to get the insight about those data sources.
Accept a Data Source Certificate ManuallyIf you have configured Data Source Certificate Validation as Manual Acceptance, you must accept new certificate (HTTPs certificate or SSH public key) for each data source for which certificate change is detected by the system.
If you have configured Data Source Certificate Validation as Manual Acceptance, whenever vRealize Network Insight detects any change in the certificate, you see an alert message notification. You can also see the certificate change alert in Accounts and Data Sources page. Use this procedure to accept the certificate.
Using vRealize Network Insight
VMware, Inc. 173
Procedure
u In the Data source certificate update available alert message notification, click REVIEW.
If the number of certificates update available is up to two:
a You see a Data Source Certificate window with current certificate and new certificate details.
b Review the new certificate and click ACCEPT.
If the number of certificates update available is more than two:
a In the Accounts and Data Source page, you see
Certificate update available. Click here to review and accept
message under the data source where certificate update is available.
b Click Click here to review and accept for the data source you want to review and accept the updated certificate.
c You see a Data Source Certificate window with the current certificate and new certificate details.
d Review the new certificate and click ACCEPT.
Results
When you accept the new certificate, you see Successfully updated the certificate message.
View the Audit LogsAudit logs capture administrative actions carried out in the system. These actions are regular CRUD operations, login and logout events. The audit logs capture the actions from API, UI, and CLI.
n The audit log feature is always on.
n vRealize Network Insight supports the UTC format in the audit logs.
n The audit log is integrated with the syslog. You can configure the syslog collector to collect all the audit logs.
n You can export all the audit log data in a CSV file.
Currently, the following administrative actions are not captured in audit logs:
n SSH login logs. You can find the SSH logs in /var/log/auth.log.
n Changes in Physical IP and DNS Mapping.
n Changes in Physical Subnets and VLANS.
Procedure
1 On the Settings page, click Audit Logs under Logs.
Using vRealize Network Insight
VMware, Inc. 174
2 The following details are shown on the Audit Logs page:
Information Description
Date & Time Timestamp of the actual action performed.
IP Address IP address of the client from which the connection is established such as the CLI or the browser.
User Name User who is performing the action.
Object Type Object on which the action is being performed.
Operation Different actions that the user performs on the object.
Object Identifier Unique identifier for that particular object on which the action is being performed.
Response Indicator for success or failure of the operation
Details Details of the settings that have been changed such as the nickname or a property.
3 To allow the collection of information when the user logs in through a browser or CLI, enable Allow collection of Personally Identifiable Information. This option is disabled by default.
Note The IP Address and the User Name columns are blank if this option is disabled.
4 Click Export as CSV to export the audit log data in the CSV format.
Join or Leave the Customer Experience Improvement ProgramThis product participates in VMware's Customer Experience Improvement Program (CEIP). The CEIP provides VMware with information that enables VMware to improve its products and services, to fix problems, and to advise you on how best to deploy and use our products. As part of the CEIP, VMware collects the technical information about your organization's use of the VMware products and services regularly in association with your organization's VMware license keys. This information does not personally identify any individual.
Details regarding the data collected through CEIP and the purposes for which it is used by VMware are set forth at the Trust & Assurance Center at https://www.vmware.com/solutions/trustvmware/ceip.html.
You can join or leave the Customer Experience Improvement Program (CEIP) for vRealize Network Insight.
1 In the About page, under Customer Experience Improvement Program, click Modify.
2 The CEIP window pops up. To join CEIP, check Enable. This action activates CEIP and sends data to https://vmware.com.
3 To leave CEIP, uncheck Enable.
4 Click Submit.
Using vRealize Network Insight
VMware, Inc. 175
Viewing Health of your SetupThe Health indicator is available in the Overview section on the Install and Support page.
The Health indicator turns red if any of the following malfunctioning events occur:
n If proxy stops collecting flow data
n If platform stops processing data due to some reason; for example, insufficient disk space
n If search indexer lags behind, resulting in outdated search result
The overall health indicator displays the number of irregularities, with a Red light on. The individual irregularities are listed with their details, when the number of problems against overall health, is clicked on. In case of normal functioning, the health indicator shines a Green light.
Note vRealize Network Insight might not detect an out-of-sync system clock sometimes. If the clock is not in sync with NTP, some services may become unhealthy or stop working.
Enabling the Support TunnelThe support tunnel allows VMware to remotely connect to your platform and collector VMs on the SSL secured connection for advanced troubleshooting or debugging.
To request the advanced support, toggle the Support Tunnel option in the Overview section of the Install and Support page.
Note Ensure that the traffic to support2.ni.vmware.com on port 443 is allowed.
Managing your Disk UtilizationIf the disk utilization is high for a platform or a collector, an event is triggered to warn the user. Also, a recommendation of how much more disk space needs to be added is provided. You can view the event in the platform or the collector dashboard. The alert is also shown in the corresponding collector or the platform section in the Install and Support page.
Using vRealize Network Insight
VMware, Inc. 176
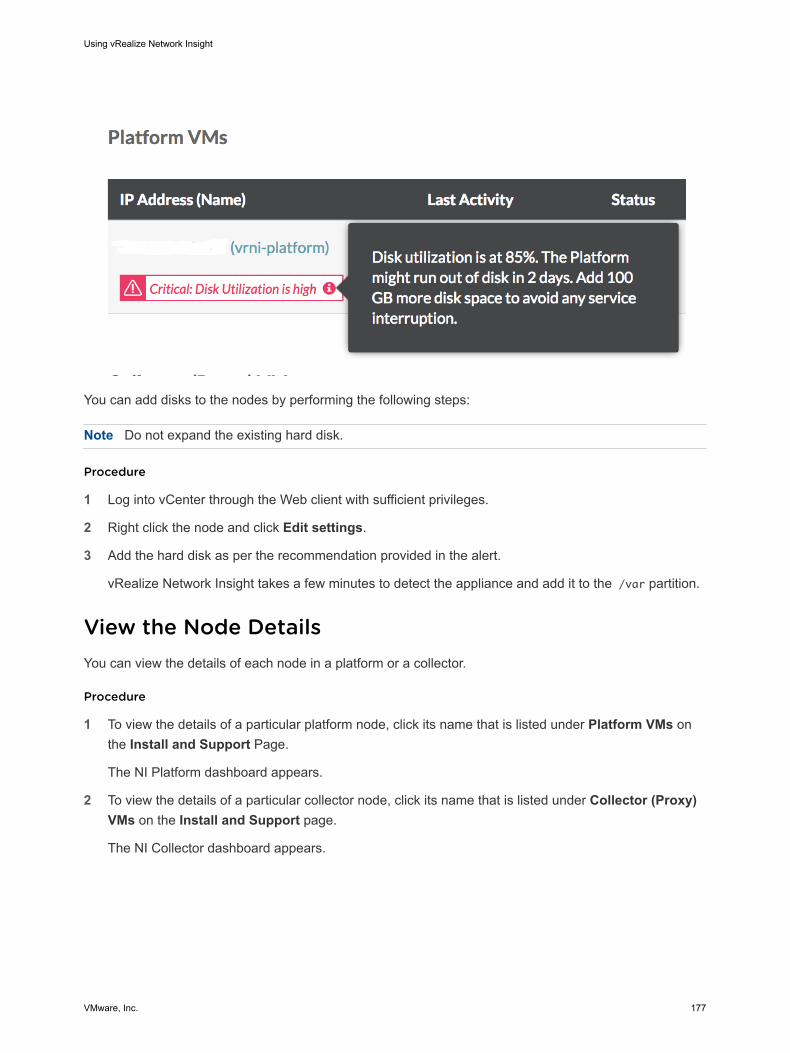
You can add disks to the nodes by performing the following steps:
Note Do not expand the existing hard disk.
Procedure
1 Log into vCenter through the Web client with sufficient privileges.
2 Right click the node and click Edit settings.
3 Add the hard disk as per the recommendation provided in the alert.
vRealize Network Insight takes a few minutes to detect the appliance and add it to the /var partition.
View the Node DetailsYou can view the details of each node in a platform or a collector.
Procedure
1 To view the details of a particular platform node, click its name that is listed under Platform VMs on the Install and Support Page.
The NI Platform dashboard appears.
2 To view the details of a particular collector node, click its name that is listed under Collector (Proxy) VMs on the Install and Support page.
The NI Collector dashboard appears.
Using vRealize Network Insight
VMware, Inc. 177
Create a Support BundleYou can create a support bundle that collects diagnostic information such as product-specific logs, configuration files of your setup. When you raise a support request, VMware Technical Support uses this information to troubleshoot your setup issues.
Procedure
1 On the Settings page, click Install and Support.
2 Click Create Support Bundle.
3 Select the platform VMs and the collector VMs for which you want to create the support bundle.
To select all VMs, click the check box in the header of the platform VMs and the collector VMs tables.
4 Click Create.
5 Click Yes to confirm creation of a new support bundle.
vRealize Network Insight takes some time to complete the creation of the bundle.
Results
A new support bundle is created displaying date and time. To initiate the download of support bundle, click the Download link next to the respective VM.
Note n The support bundle creation on a medium sized system can take in excess of fifteen minutes.
n Only two support bundles can be present at one given time. So, while creating a new one, if there are already two support bundles present, the older one is deleted.
What to do next
Attach the support bundle to your service request for VMware to access the details.
Understanding Capacity for Collector and Platform LoadvRealize Network Insight provides the approximate capacity and load information of a collector node and a platform. This limits-based information helps you to prevent the performance and experience issues later.
Understanding CapacityThere are two kinds of capacity:
n VM capacity: It is defined as the number of discovered VMs that a node or a setup can handle.
n Flow capacity: It is defined as the number of flows that a node or a setup can handle.
Using vRealize Network Insight
VMware, Inc. 178
The capacity is defined as follows:
n Single platform with one or more proxy nodes: The capacity of a proxy node or the platform is the number of discovered VMs that it can handle without the degradation of performance.
n Cluster setup: The capacity of the platform in a cluster setup is the aggregation of all the capacities of all the platform nodes while the capacity of proxy nodes is considered at the level of an individual node.
Accessing the Capacity InformationYou can view VM Capacity and Flow Capacity on the Install and Support page.
For every collector node listed under Collector (Proxy) VMs, only the VM capacity information is provided.
Note When the number of discovered VMs from the data sources across the deployment exceed the capacity of either the system or the collector or both, you will not be allowed to trigger the upgrade.
To view the discovered VMs for a data source:
1 In the Accounts and Data Sources page, you can see the number of VMs that have been discovered for a particular data source which is already added and currently active. This column will have a value only if the data source is vCenter or AWS source.
Note The discovered VM count includes placeholder and template VMs. So it can be different from the count of VMs in the product.
Using vRealize Network Insight
VMware, Inc. 179
Direct Connect Support in vRealize Network Insight 7Direct Connect is a mechanism to provide data transfer connection between an on-premise location and public cloud services. Starting from the 5.2 release, vRealize Network Insight supports the Direct Connect feature for VMware Cloud on AWS.
Direct Connect support enables you to:
n identify flows that pass over Direct Connect between on-premise data center and VMware Cloud on AWS SDDC.
n run the flow analytics to understand the flow bandwidth and the packet rate.
n view the detailed path topology between virtual machines that communicate over Direct Connect.
n view details about Direct Connect and associated events.
Direct Connect data fetch mechanismvRealize Network Insight fetches Direct Connect information by using the VMware Cloud on AWS NSX APIs. So you must add the VMware Cloud on AWS related data sources (vCenter and NSX Manager) to get the Direct Connect information.
Note You do not have to add an AWS account or any other additional data sources for Direct Connect support.
However, to get the path topology information, you must add colocation routers such as Cisco N9k and Cisco ASR 9k (Generic router).
What data is collected with Direct Connect supportn Direct Connect related configuration details in the VMware Cloud on AWS SDDC.
n Advertised and learnt subnets for Direct Connect at the SDDC level.
n Configuration information of Direct Connect Interfaces (VIFs) associated with the SDDC.
VMware, Inc. 180
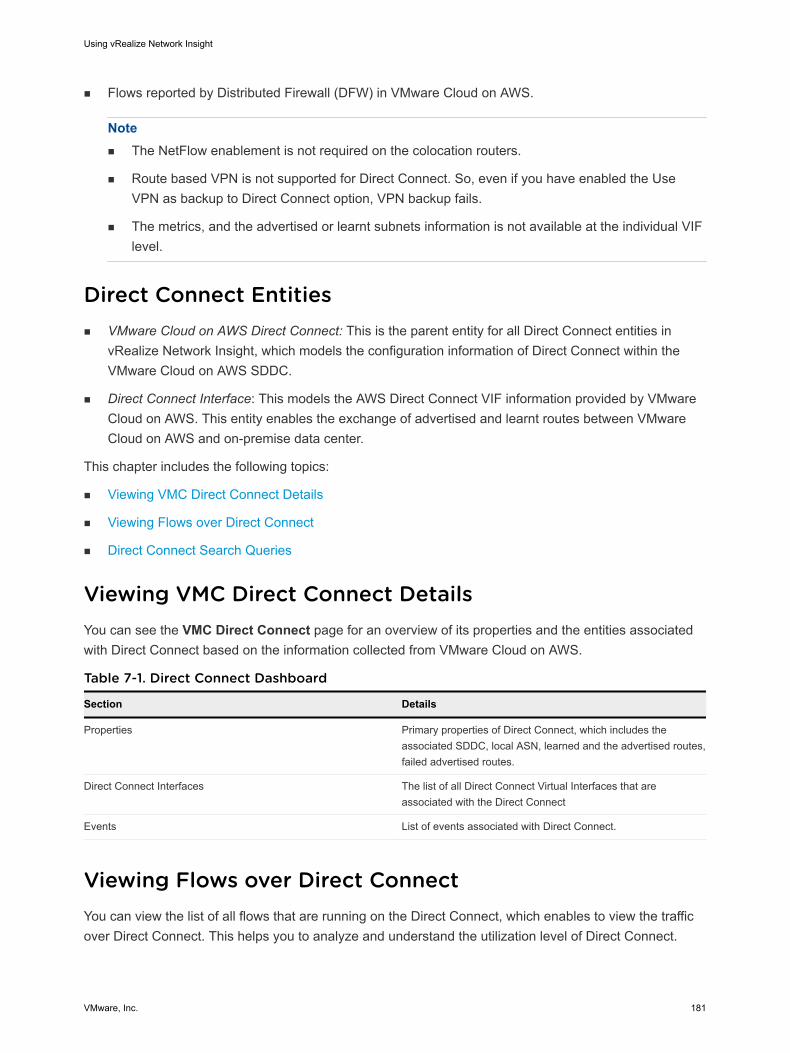
n Flows reported by Distributed Firewall (DFW) in VMware Cloud on AWS.
Note n The NetFlow enablement is not required on the colocation routers.
n Route based VPN is not supported for Direct Connect. So, even if you have enabled the Use VPN as backup to Direct Connect option, VPN backup fails.
n The metrics, and the advertised or learnt subnets information is not available at the individual VIF level.
Direct Connect Entitiesn VMware Cloud on AWS Direct Connect: This is the parent entity for all Direct Connect entities in
vRealize Network Insight, which models the configuration information of Direct Connect within the VMware Cloud on AWS SDDC.
n Direct Connect Interface: This models the AWS Direct Connect VIF information provided by VMware Cloud on AWS. This entity enables the exchange of advertised and learnt routes between VMware Cloud on AWS and on-premise data center.
This chapter includes the following topics:
n Viewing VMC Direct Connect Details
n Viewing Flows over Direct Connect
n Direct Connect Search Queries
Viewing VMC Direct Connect DetailsYou can see the VMC Direct Connect page for an overview of its properties and the entities associated with Direct Connect based on the information collected from VMware Cloud on AWS.
Table 7-1. Direct Connect Dashboard
Section Details
Properties Primary properties of Direct Connect, which includes the associated SDDC, local ASN, learned and the advertised routes, failed advertised routes.
Direct Connect Interfaces The list of all Direct Connect Virtual Interfaces that are associated with the Direct Connect
Events List of events associated with Direct Connect.
Viewing Flows over Direct ConnectYou can view the list of all flows that are running on the Direct Connect, which enables to view the traffic over Direct Connect. This helps you to analyze and understand the utilization level of Direct Connect.
Using vRealize Network Insight
VMware, Inc. 181
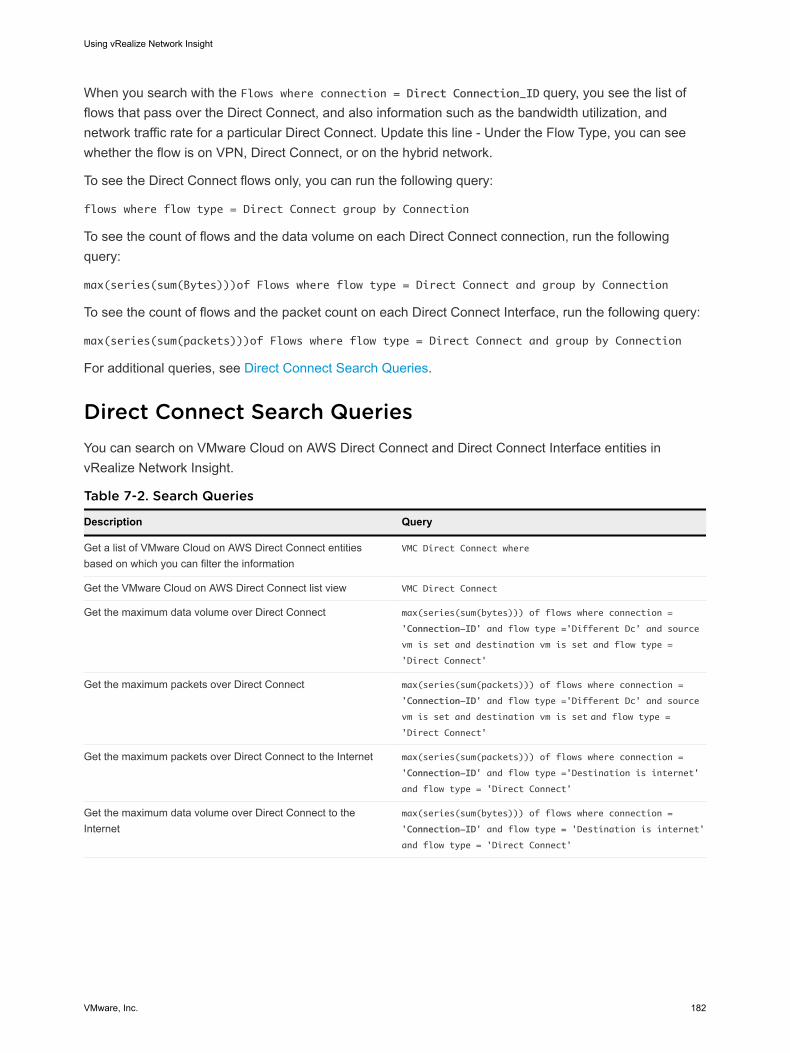
When you search with the Flows where connection = Direct Connection_ID query, you see the list of flows that pass over the Direct Connect, and also information such as the bandwidth utilization, and network traffic rate for a particular Direct Connect. Update this line - Under the Flow Type, you can see whether the flow is on VPN, Direct Connect, or on the hybrid network.
To see the Direct Connect flows only, you can run the following query:
flows where flow type = Direct Connect group by Connection
To see the count of flows and the data volume on each Direct Connect connection, run the following query:
max(series(sum(Bytes)))of Flows where flow type = Direct Connect and group by Connection
To see the count of flows and the packet count on each Direct Connect Interface, run the following query:
max(series(sum(packets)))of Flows where flow type = Direct Connect and group by Connection
For additional queries, see Direct Connect Search Queries.
Direct Connect Search QueriesYou can search on VMware Cloud on AWS Direct Connect and Direct Connect Interface entities in vRealize Network Insight.
Table 7-2. Search Queries
Description Query
Get a list of VMware Cloud on AWS Direct Connect entities based on which you can filter the information
VMC Direct Connect where
Get the VMware Cloud on AWS Direct Connect list view VMC Direct Connect
Get the maximum data volume over Direct Connect max(series(sum(bytes))) of flows where connection =
'Connection-ID' and flow type ='Different Dc' and source
vm is set and destination vm is set and flow type =
'Direct Connect'
Get the maximum packets over Direct Connect max(series(sum(packets))) of flows where connection =
'Connection-ID' and flow type ='Different Dc' and source
vm is set and destination vm is set and flow type = 'Direct Connect'
Get the maximum packets over Direct Connect to the Internet max(series(sum(packets))) of flows where connection =
'Connection-ID' and flow type ='Destination is internet'
and flow type = 'Direct Connect'
Get the maximum data volume over Direct Connect to the Internet
max(series(sum(bytes))) of flows where connection =
'Connection-ID' and flow type = 'Destination is internet'
and flow type = 'Direct Connect'
Using vRealize Network Insight
VMware, Inc. 182
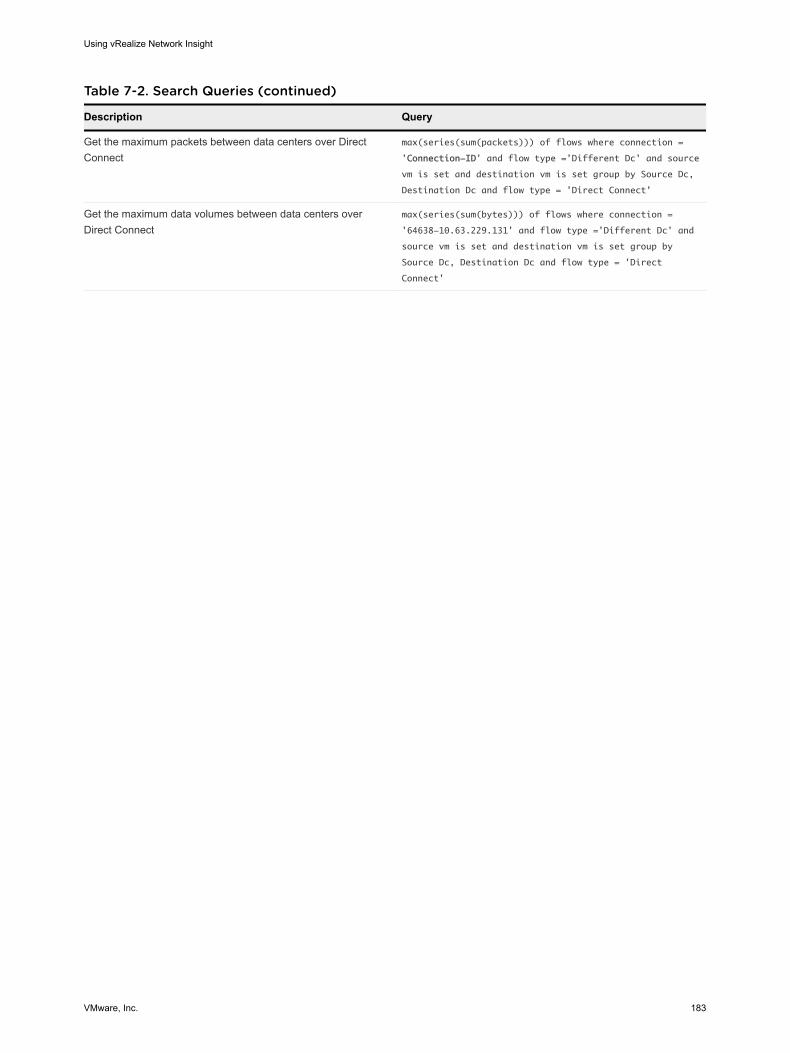
Table 7-2. Search Queries (continued)
Description Query
Get the maximum packets between data centers over Direct Connect
max(series(sum(packets))) of flows where connection =
'Connection-ID' and flow type ='Different Dc' and source
vm is set and destination vm is set group by Source Dc,
Destination Dc and flow type = 'Direct Connect'
Get the maximum data volumes between data centers over Direct Connect
max(series(sum(bytes))) of flows where connection =
'64638-10.63.229.131' and flow type ='Different Dc' and
source vm is set and destination vm is set group by
Source Dc, Destination Dc and flow type = 'Direct
Connect'
Using vRealize Network Insight
VMware, Inc. 183
vRealize Operations Manager Integration 8With vRealize Operations Manager, you can see the vRealize Network Insight alerts in vRealize Operations Manager. And also, you can see the network information in vRealize Operations Manager from vRealize Network Insight.
vRealize Operations Manager consumes a set of vRealize Network Insight APIs and displays lists of alerts on the Alerts Dashboard. You can identify the vRealize Network Insight alerts with the vrni- prefix in the alert names. In addition, you can see the entity on which the alert was triggered.
For the list of vRealize Network Insight APIs, see vRealize Network Insight API Guide.
You can use the Launch-in-vRNI-context option from the entity pages, such as VMs, Hosts, NSX-V, and NSX-T, you can view the dashboard of that particular entity. This enables you to see the network health and to debug a network issue.
For information about how to integrate vRealize Network Insight with vRealize Operations Manager, see the VMware vRealize Operations Management Pack for vRealize Network Insight. For information about supportedvRealize Operations Manager versions, see VMware Product Interoperability Matrix.
Note You must add the vRealize Operations Manager user into vRealize Network Insight and the user must least a have Member privilege to use the feature in vRealize Operations Manager.
VMware, Inc. 184
Creating and Expanding Clusters 9This chapter includes the following topics:
n Create Clusters
n Expand Clusters
Create ClustersYou can create clusters from the Install and Support page.
PrerequisitesAt least two additional platforms are required. The additional platform VMs should be deployed and powered on.
To create cluster1 Click Create Cluster for Platform VMs.
2 On the Create Cluster page, enter the following information:
n IP Address: Enter the IP address of the new platform that you want to add.
n Password: Enter the support user password of the platform VM. If you have not changed the password yet, then refer the Default Login Credentials section in vRealize Network Insight Installation Guide for the password.
3 To keep adding more platforms, click Add more and enter the IP address and the support user password.
4 Click Submit. Click Yes.
VMware, Inc. 185
5 After creating a cluster, the user needs to log in to the product again.
Note n The create cluster option is enabled only when the platform is of large brick size. All platforms
should be of large brick to create cluster.
n Enabling telemetry on a single node enables it on all the nodes.
n To expand clusters, refer the Expanding a Cluster section in the vRealize Network Insight Installation Guide.
Expand ClustersOnce the cluster is created, you can expand the cluster by adding more platform nodes to it.
Note You must perform the expand cluster operation only from Platform 1 (P1) node.
Procedure
1 On the Install and Support page, click Expand Cluster for Platform VMs.
2 The IP addresses of the VMs that are part of the cluster already are listed on the Expand Cluster page. To add one or more nodes to the existing cluster, provide the IP address of the node and the support user password.
Note n Currently, vRealize Network Insight supports 10 nodes in an existing cluster. Once the limit is
reached, the Add more button is disabled.
n Ensure that all the new nodes are non-provisioned and are reachable through SSH.
n Ensure that you have taken a backup of the existing platform VMs before you go ahead with the cluster expansion.
3 Click Submit.
The step-by-step progress is displayed.
4 Once the cluster expansion link is completed, a message indicating success is displayed.
While the cluster expansion is in progress, the application cannot be used for any other operation.
Using vRealize Network Insight
VMware, Inc. 186
Configuring Flows in vRealize Network Insight 10This chapter includes the following topics:
n Enabling IPFIX Configuration
n Flow Support for Physical Servers
n View Blocked and Protected Flows
n Network Address Translation (NAT)
n VMware Cloud on AWS Flows
n Create VPC Flow Log
n Sending Flow Records from F5 To vRealize Network Insight Collectors
Enabling IPFIX ConfigurationIPFIX is an IETF protocol for exporting flow information.
A flow is defined as a set of packets transmitted in a specific timeslot, and sharing the same 5-tuple values - source IP address, source port, destination IP address, destination port, and protocol. The flow information may include properties such as timestamps, packets/bytes count, Input/Output interfaces, TCP Flags, VXLAN ID, Encapsulated flow information, and so on.
IPFIX Configuration on VDS and DVPG
A VDS in vSphere environment can be configured to export flow information using IPFIX. Flow monitoring has to be enabled on all the port groups attached to the VDS. If packets arrive on port X of a VDS and exit from port Y, a corresponding flow record is emitted if flow monitoring is enabled on port Y.
To analyze the complete information of any session, the IPFIX data about packets in both the directions is required. Refer the following diagram where VM-A is connected to DVPG-A and is talking to VM-C. Here DVPG-A will only provide data about the C→A packets, and DVPG-Uplink will provide data about A→C packets. To get the complete information of A's traffic, IPFIX should be enabled on DVPG-A, DVPG-uplink.
VMware, Inc. 187
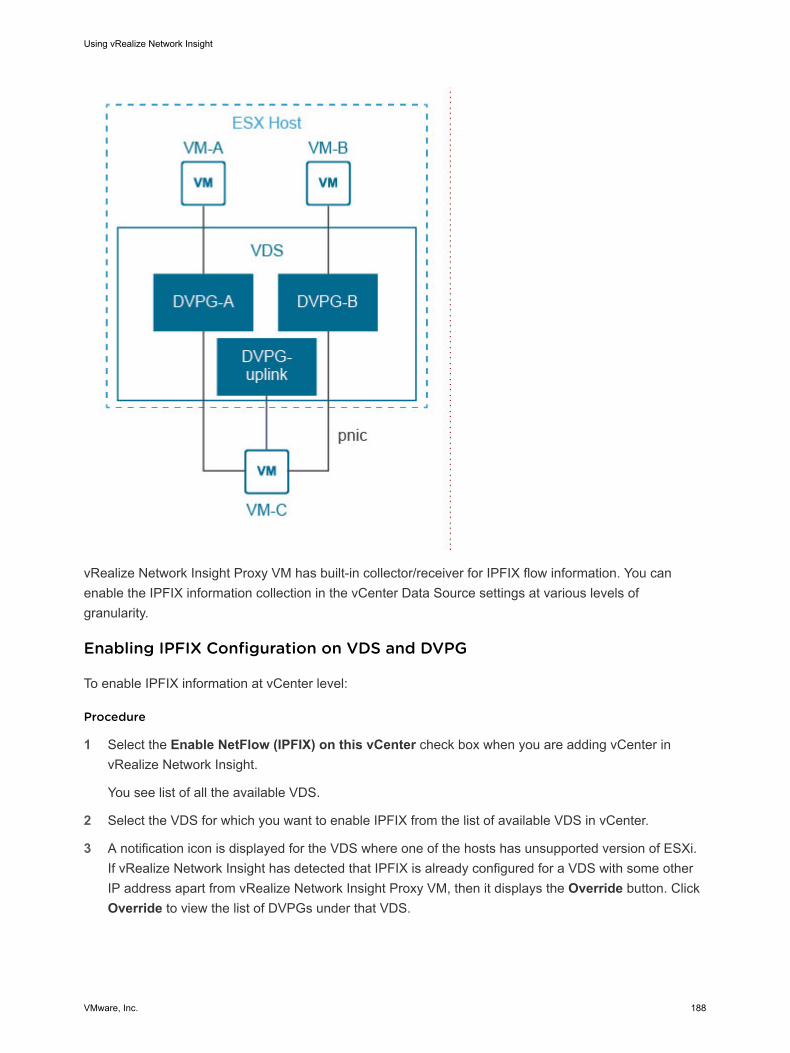
vRealize Network Insight Proxy VM has built-in collector/receiver for IPFIX flow information. You can enable the IPFIX information collection in the vCenter Data Source settings at various levels of granularity.
Enabling IPFIX Configuration on VDS and DVPG
To enable IPFIX information at vCenter level:
Procedure
1 Select the Enable NetFlow (IPFIX) on this vCenter check box when you are adding vCenter in vRealize Network Insight.
You see list of all the available VDS.
2 Select the VDS for which you want to enable IPFIX from the list of available VDS in vCenter.
3 A notification icon is displayed for the VDS where one of the hosts has unsupported version of ESXi. If vRealize Network Insight has detected that IPFIX is already configured for a VDS with some other IP address apart from vRealize Network Insight Proxy VM, then it displays the Override button. Click Override to view the list of DVPGs under that VDS.
Using vRealize Network Insight
VMware, Inc. 188
4 The list of available DVPGs for the selected VDS is displayed. All the DVPGs are selected by default. Turn Manual Selection on to select specific DVPGs for which you want to enable IPFIX. Select the desired DVPGs and click Submit.
Note The DVPG with a notification icon denotes that it is the uplink DVPG and it has to be selected.
VMware NSX IPFIX ConfigurationVMware NSX IPFIX provides network monitoring data similar to that provided by physical devices and gives administrators a clear view of virtual network conditions.
VMware NSX virtualizes the network by allowing the network administrator the ability to decouple the network from physical hardware. This functionality makes it easy to grow and shrink the network as needed and making the network transparent to the applications traversing it.
By using NSX IPFIX in a virtualized network, the network administrators gain visibility into the virtual overlay network. The VXLAN IPFIX reporting using Netflow is enabled on the host uplink. It provides visibility on the VTEP that is encapsulating the packet, and the details of the VM that generated the inter-host traffic on an NSX Logical Switch (VXLAN).
The distributed firewall implements stateful tracking of flows. As these tracked flows go through a set of state changes, IPFIX can be used to export data about the status of that flow.
The tracked events include flow creation, flow denial, flow update, and flow teardown. The denied events are exported as syslogs.
Enabling VMware NSX-V IPFIX
To enable VMware NSX-V IPFIX in vRealize Network Insight:
Prerequisites
n Ensure that you have the security administrator or enterprise administrator credentials.
n It is recommended that you enable VDS IPFIX on all the DVS and DVPGs from which NSX IPFIX data has to be collected. You can enable VDS IPFIX from the details page of the associated vCenter.
Procedure
u Select Enable IPFIX when adding or editing a NSX-V Manager data source.
Enabling VMware NSX-T DFW IPFIX
To enable VMware NSX-T IPFIX in vRealize Network Insight:
Prerequisites
n Ensure that you have any one of the following privileges:
n enterprise_admin
n network_engineer
Using vRealize Network Insight
VMware, Inc. 189
n security_engineer
n Ensure that the Distributed (DFW) firewall is enabled.
n Ensure that priority 0 is available for the Network Insight IPFIX profile. If there is another IPFIX profile with priority 0, then you have to change it to some other value.
Procedure
u Select Enable IPFIX when adding or editing an NSX-T Manager data source.
What to do next
After you enable IPFIX, vRealize Network Insight creates its own Network Insight Collector profile and Network Insight IPFIX profile on NSX-T. Ensure that you do not modify any of these profiles.
After enabling IPFIX on NSX-T, if the flows are not seen in vRealize Network Insight, then the following events may occur:
n Network Insight Collector Profile is not registered in the NSX-T Manager.
n Network Insight IPFIX Profile is not registered in the NSX-T Manager.
n Network Insight IPFIX Profile port number has changed.
n Network Insight Collector Profile does not match in the Network Insight IPFIX profile in the NSX-T Manager.
Note To resolve all the above issues, enable NSX-T IPFIX again.
n Network Insight IPFIX Profile priority is not zero in the NSX-T Manager.
To resolve this issue, log into NSX-T Manager and set the priority of Network Insight IPFIX Profile to zero.
n Network Insight Collector IP cannot be added in existing Network Insight Collector Profile in the NSX-T Manager.
Delete one of the collectors from the Network Insight Collector Profile in the NSX-T Manager and re-enable NSX-T IPFIX from data source page.
n Distributed Firewall is disabled in NSX-T Manager.
Log into NSX-T Manager and enable the DFW firewall.
With NSX-T 2.4, after enabling IPFIX on NSX-T, if the flows are not seen in vRealize Network Insight Network Insight, then the following events may occur:
n Network Insight IPFIX Collector configuration is absent in NSX-T Manager collector profile.
n DFW IPFIX Profile is absent in NSX-T Manager.
To resolve these issues, enable DFW IPFIX again.
Note All the logical switches present in NSX-T are appended in the IPFIX profile within 10-15 minutes.
Using vRealize Network Insight
VMware, Inc. 190
Flow Support for Physical ServersvRealize Network Insight supports the device that sends the NetFlow data of versions v5, v7, and v9. If the DNS Mapping and Subnet-VLAN mapping information is provided, vRealize Network Insight can enrich the NetFlow data with DNS Domains, DNS Host Names, Subnets, and Layer 2 networks. This feature is available for the Enterprise License users only.
To configure NetFlow in vRealize Network Insight, perform the following steps:
1 Add a Physical Flow Collector for NetFlow and sFlow.
2 Configuring a NetFlow Collector in a Physical Device.
3 Import the DNS mapping file.
4 Configure Mapping Between Subnet and a VLAN.
Configuring a NetFlow Collector in a Physical Device
To send the NetFlow information to the vRealize Network Insight NetFlow collector, configure the physical device manually. Here are the steps for the configuration in most of the physical devices:
1 Create a flow record.
The required fields for a flow record are as follows:
n Mark the following fields as Match.
n ipv4 protocol
n ipv4 source address
n ipv4 destination address
n transport source-port
n transport destination-port
n interface input
n Mark the following fields as Collect.
n direction
n counter bytes
n counter packets
n timestamp sys-uptime first
n timestamp sys-uptime last
n Mark the following field as Match or Collect. If not, skip it.
n transport tcp flags
2 Create a flow exporter.
n Provide vRealize Network Insight NetFlow Proxy IP and Port 2055.
Using vRealize Network Insight
VMware, Inc. 191
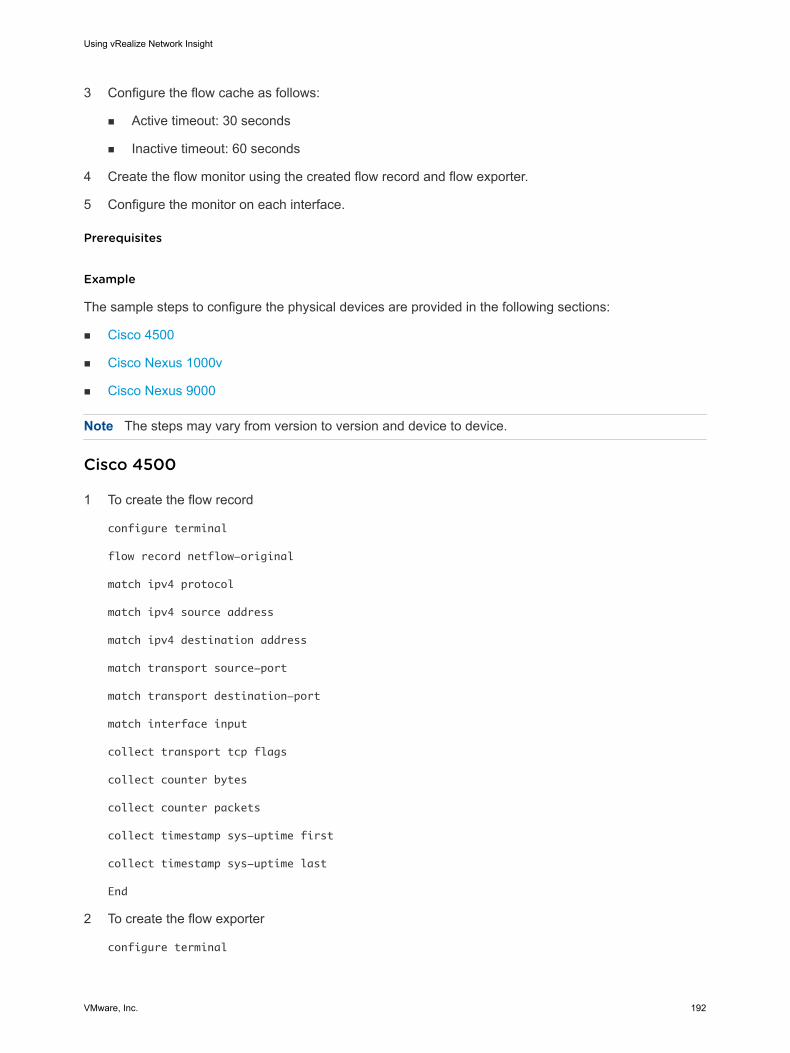
3 Configure the flow cache as follows:
n Active timeout: 30 seconds
n Inactive timeout: 60 seconds
4 Create the flow monitor using the created flow record and flow exporter.
5 Configure the monitor on each interface.
Prerequisites
Example
The sample steps to configure the physical devices are provided in the following sections:
n Cisco 4500
n Cisco Nexus 1000v
n Cisco Nexus 9000
Note The steps may vary from version to version and device to device.
Cisco 4500
1 To create the flow record
configure terminal
flow record netflow-original
match ipv4 protocol
match ipv4 source address
match ipv4 destination address
match transport source-port
match transport destination-port
match interface input
collect transport tcp flags
collect counter bytes
collect counter packets
collect timestamp sys-uptime first
collect timestamp sys-uptime last
End
2 To create the flow exporter
configure terminal
Using vRealize Network Insight
VMware, Inc. 192
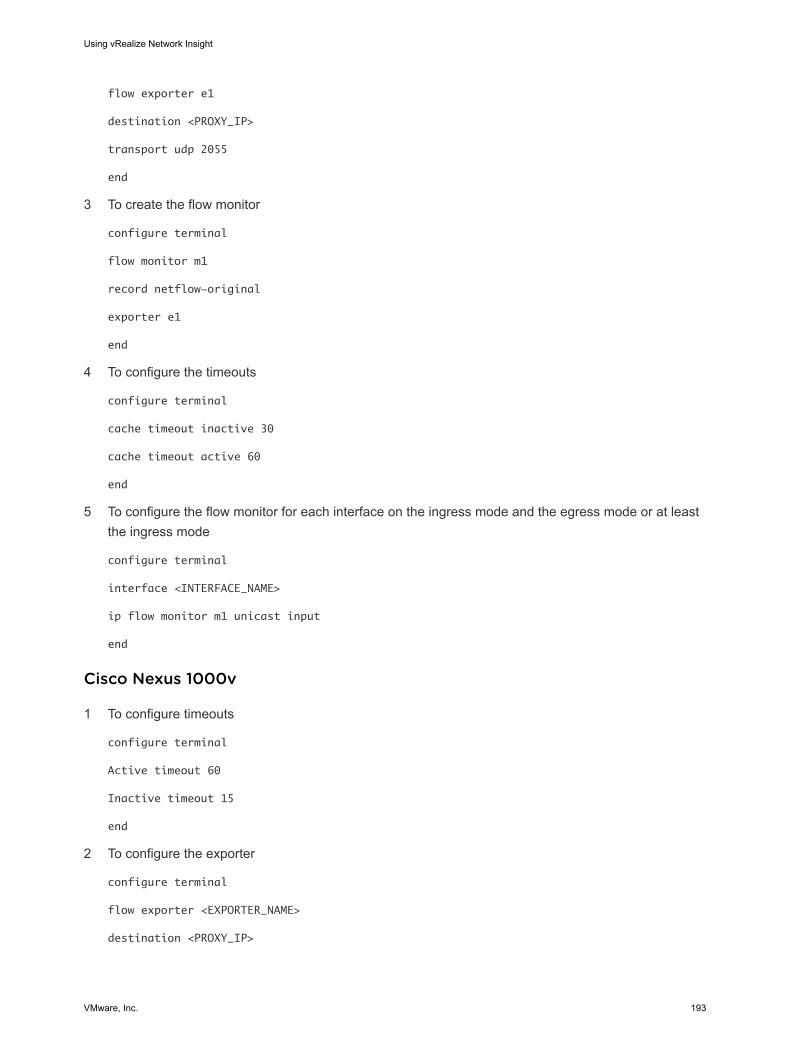
flow exporter e1
destination <PROXY_IP>
transport udp 2055
end
3 To create the flow monitor
configure terminal
flow monitor m1
record netflow-original
exporter e1
end
4 To configure the timeouts
configure terminal
cache timeout inactive 30
cache timeout active 60
end
5 To configure the flow monitor for each interface on the ingress mode and the egress mode or at least the ingress mode
configure terminal
interface <INTERFACE_NAME>
ip flow monitor m1 unicast input
end
Cisco Nexus 1000v
1 To configure timeouts
configure terminal
Active timeout 60
Inactive timeout 15
end
2 To configure the exporter
configure terminal
flow exporter <EXPORTER_NAME>
destination <PROXY_IP>
Using vRealize Network Insight
VMware, Inc. 193
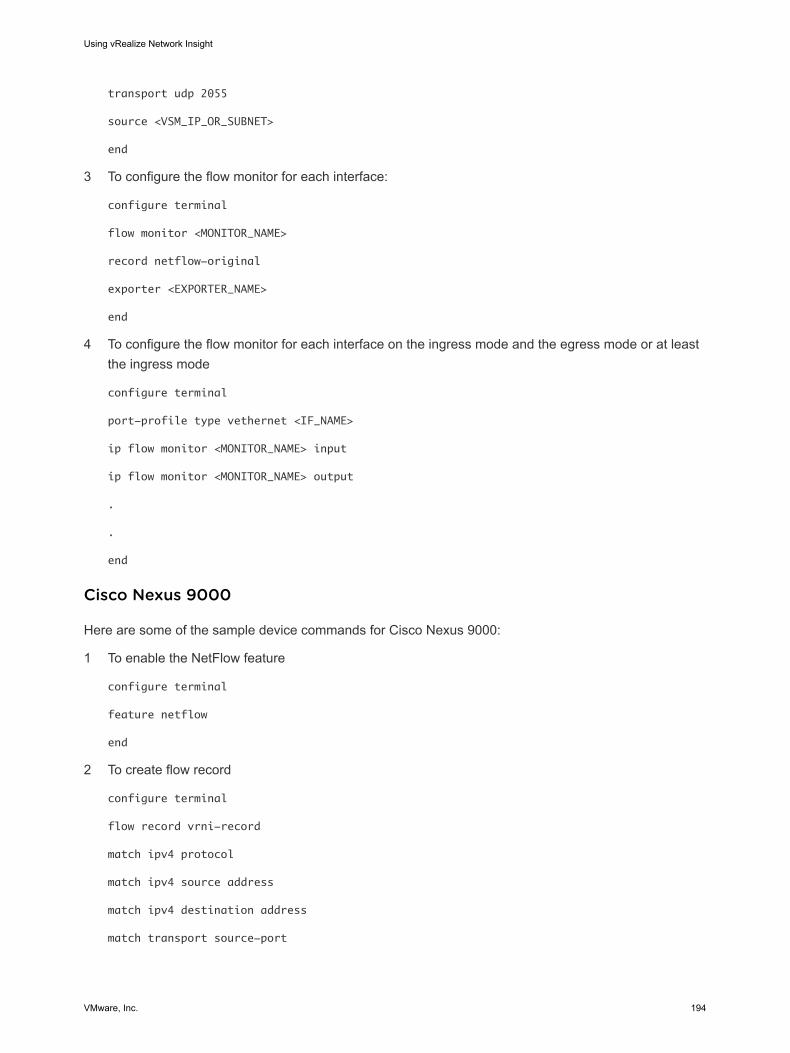
transport udp 2055
source <VSM_IP_OR_SUBNET>
end
3 To configure the flow monitor for each interface:
configure terminal
flow monitor <MONITOR_NAME>
record netflow-original
exporter <EXPORTER_NAME>
end
4 To configure the flow monitor for each interface on the ingress mode and the egress mode or at least the ingress mode
configure terminal
port-profile type vethernet <IF_NAME>
ip flow monitor <MONITOR_NAME> input
ip flow monitor <MONITOR_NAME> output
.
.
end
Cisco Nexus 9000
Here are some of the sample device commands for Cisco Nexus 9000:
1 To enable the NetFlow feature
configure terminal
feature netflow
end
2 To create flow record
configure terminal
flow record vrni-record
match ipv4 protocol
match ipv4 source address
match ipv4 destination address
match transport source-port
Using vRealize Network Insight
VMware, Inc. 194
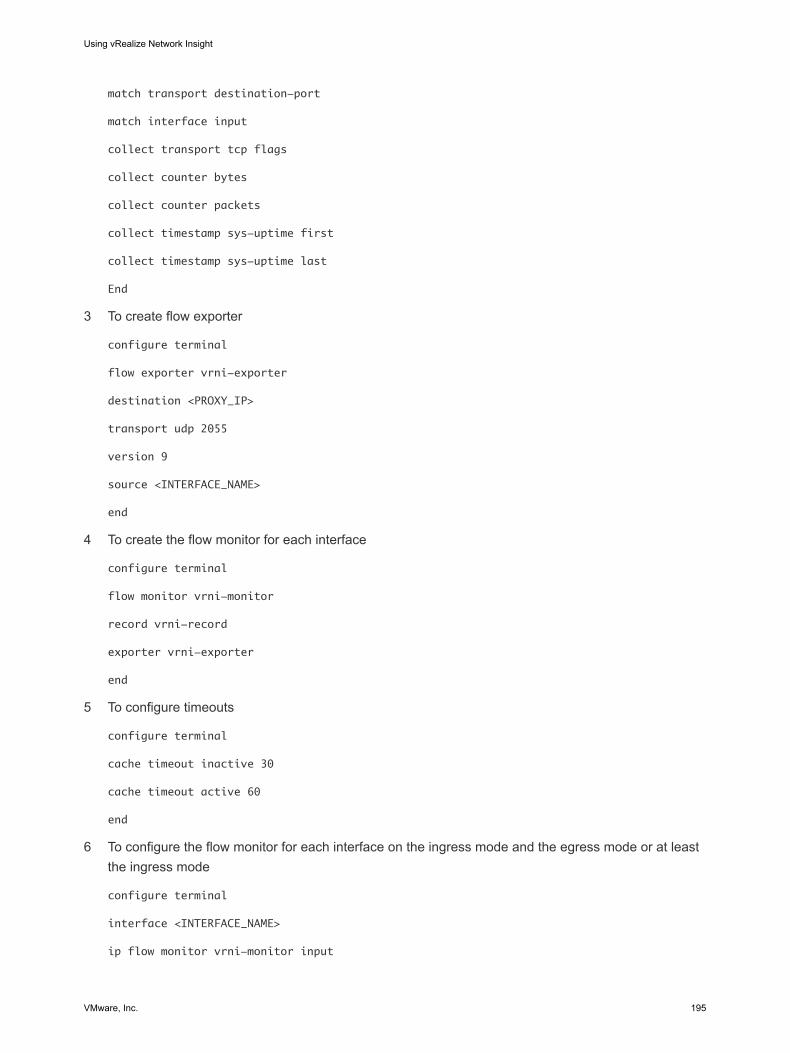
match transport destination-port
match interface input
collect transport tcp flags
collect counter bytes
collect counter packets
collect timestamp sys-uptime first
collect timestamp sys-uptime last
End
3 To create flow exporter
configure terminal
flow exporter vrni-exporter
destination <PROXY_IP>
transport udp 2055
version 9
source <INTERFACE_NAME>
end
4 To create the flow monitor for each interface
configure terminal
flow monitor vrni-monitor
record vrni-record
exporter vrni-exporter
end
5 To configure timeouts
configure terminal
cache timeout inactive 30
cache timeout active 60
end
6 To configure the flow monitor for each interface on the ingress mode and the egress mode or at least the ingress mode
configure terminal
interface <INTERFACE_NAME>
ip flow monitor vrni-monitor input
Using vRealize Network Insight
VMware, Inc. 195
end
Enriching Flows and IP Endpoints
You can import the DNS mapping and the subnet-VLAN mapping information through the UI.
The flow information is enriched with the following types of information based on the import of the DNS data and the specification of subnet-VLAN mappings.
n Source DNS Domain
n Source DNS Host Name
n Destination DNS Domain
n Destination DNS Host Name
n Source L2 Network
n Source Subnet network
n Destination L2 Network
n Destination Subnet network
The IP Endpoint information is enriched with the following types of information based on the import of the DNS data and the specification of subnet-VLAN mappings.
n DNS Domain
n DNS Host Name
n FQDN
n L2 Network
n Subnet network
For more information on enriching flows through the DNS information, refer Import the DNS mapping file.
For more information on enriching flows through the Subnet-VLAN mapping, refer Configure Mapping Between Subnet and a VLAN.
Note n The DNS mapping and subnet information are enhanced only for the physical IPs. No subnet or DNS
mapping information is associated with any virtual NIC.
n The information is enriched only for flows that have been seen by vRNI after this information has been imported.
Search for Physical to Physical Flows
You can search for the physical to physical flows based on the following attributes:
n Source DNS Host
Using vRealize Network Insight
VMware, Inc. 196
n Destination DNS Host
n Source DNS Domain
n Destination DNS Domain
n Source Subnet Network
n Destination Subnet Network
You can search for Physical-Physical flows based on the following attributes. A few examples of flow search query using the enriched DNS and Subnet-VLAN mapping information are as follows:
bytes,Dns Domain,Dns Host,l2 network of flows where flow type = 'Physical-Physical'
bytes,Dns Domain,Dns Host,l2 network of flows where flow type = 'Source is VM' and flow type
= 'Destination is Physical'
bytes,Dns Domain,Dns Host,l2 network of flows where flow type = 'Source is Internet' and flow
type = 'Destination is Physical'
View Blocked and Protected FlowsThe NSX-IPFIX integration enables the visibility of the blocked and protected flows in the system.
The basic filters in the Micro-Segmentation Planning page are as follows:
n All Allowed Flows: This option is selected by default. To see all the flows for which the action in the firewall rules is set to Alllowed, select this option.
n Dropped Flows: This option helps to detect the dropped flows and planning the security in a better way.
n All Protected Flows: This option helps to detect all the flows which have a rule other than of the type any(source) any(dest) any(service) allow associated with it. Such flows are known as protected flows.
n All Unprotected Flows: This option helps to detect all the flows that have the default rules of the type any(source) any(dest) any(service) allow. Such flows are known as unprotected flows.
The firewall rules are visible only for the allowed and unprotected flows.
For example, if you are in the planning phase and you want to see the allowed flows in the system, perform the following steps:
1 On the Micro-Segmentation Planning page, for a particular group, select All Allowed Flows from the drop-down menu.
2 Click the dropped flows in the topology diagram to see the corresponding recommended firewall rules.
3 Implement those firewall rules by exporting them into NSX manager.
Using vRealize Network Insight
VMware, Inc. 197
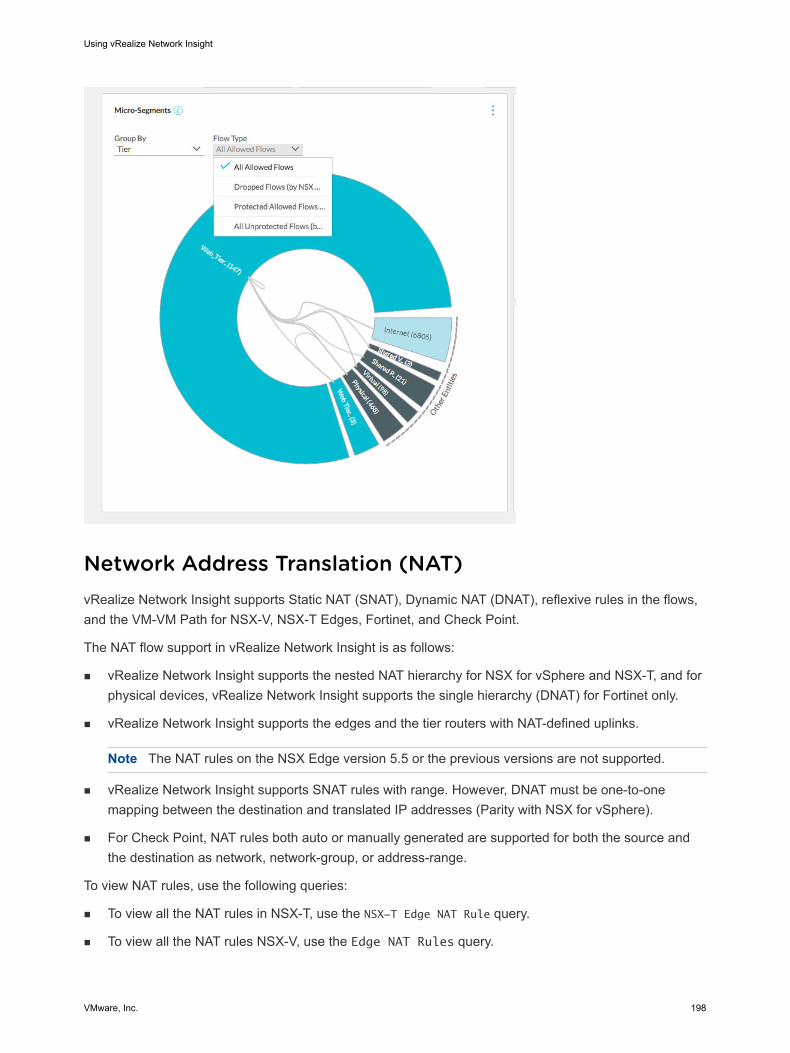
Network Address Translation (NAT)vRealize Network Insight supports Static NAT (SNAT), Dynamic NAT (DNAT), reflexive rules in the flows, and the VM-VM Path for NSX-V, NSX-T Edges, Fortinet, and Check Point.
The NAT flow support in vRealize Network Insight is as follows:
n vRealize Network Insight supports the nested NAT hierarchy for NSX for vSphere and NSX-T, and for physical devices, vRealize Network Insight supports the single hierarchy (DNAT) for Fortinet only.
n vRealize Network Insight supports the edges and the tier routers with NAT-defined uplinks.
Note The NAT rules on the NSX Edge version 5.5 or the previous versions are not supported.
n vRealize Network Insight supports SNAT rules with range. However, DNAT must be one-to-one mapping between the destination and translated IP addresses (Parity with NSX for vSphere).
n For Check Point, NAT rules both auto or manually generated are supported for both the source and the destination as network, network-group, or address-range.
To view NAT rules, use the following queries:
n To view all the NAT rules in NSX-T, use the NSX-T Edge NAT Rule query.
n To view all the NAT rules NSX-V, use the Edge NAT Rules query.
Using vRealize Network Insight
VMware, Inc. 198
n To view all the NAT rules in Fortinet, use the Fortinet NAT Rule query.
n To view all the NAT rules in Check Point, use the Check Point NAT Rule query.
n To view all the NAT rules, use the NAT Rule query.
QueriesTo view NAT rules, use the following queries:
n To view all the NAT rules in NSX-T, use the NSX-T Edge NAT Rule query.
n To view all the NAT rules NSX-V, use the Edge NAT Rules query.
n To view all the NAT rules in Fortinet, use the Fortinet NAT Rule query.
n To view all the NAT rules in Check Point, use the Check Point NAT Rule query.
n To view all the NAT rules, use the NAT Rule query.
Considerationn vRealize Network Insight does not support the following use cases:
n In NSX-T, NAT rules can be applied at the service level. For example, in NSX-T, L4 ports set is a type of service and the associated protocols can be TCP or UDP. So in the VM-VM path, the service level details are not supported.
n Any port level translation is not supported.
n The SNAT match destination address and the DNAT match source address are not supported. Use the SNAT match destination address as the destination IP address when you specify the SNAT rule. Use the DNAT match source address as the source IP address when you specify the DNAT rule. For example, if there is a destination IP address mentioned in the SNAT rule, vRealize Network Insight applies the SNAT rule irrespective of whether the packet has the destination address as the destination IP address.
n NSX-T Edge firewall has implications for the data path when enabled with the NAT service on the same logical router. If a flow matches both NAT and Edge firewall, the NAT lookup result takes precedence over firewall. So the firewall is not applied to that flow. If the flow matches only a firewall rule, then the firewall lookup result is honored for that flow.
n Service translation is not supported.
n vSEC NAT is not supported.
NAT Flow Support - ExamplesThis section consists of few examples for the supported NAT flow in vRealize Network Insight.
Using vRealize Network Insight
VMware, Inc. 199
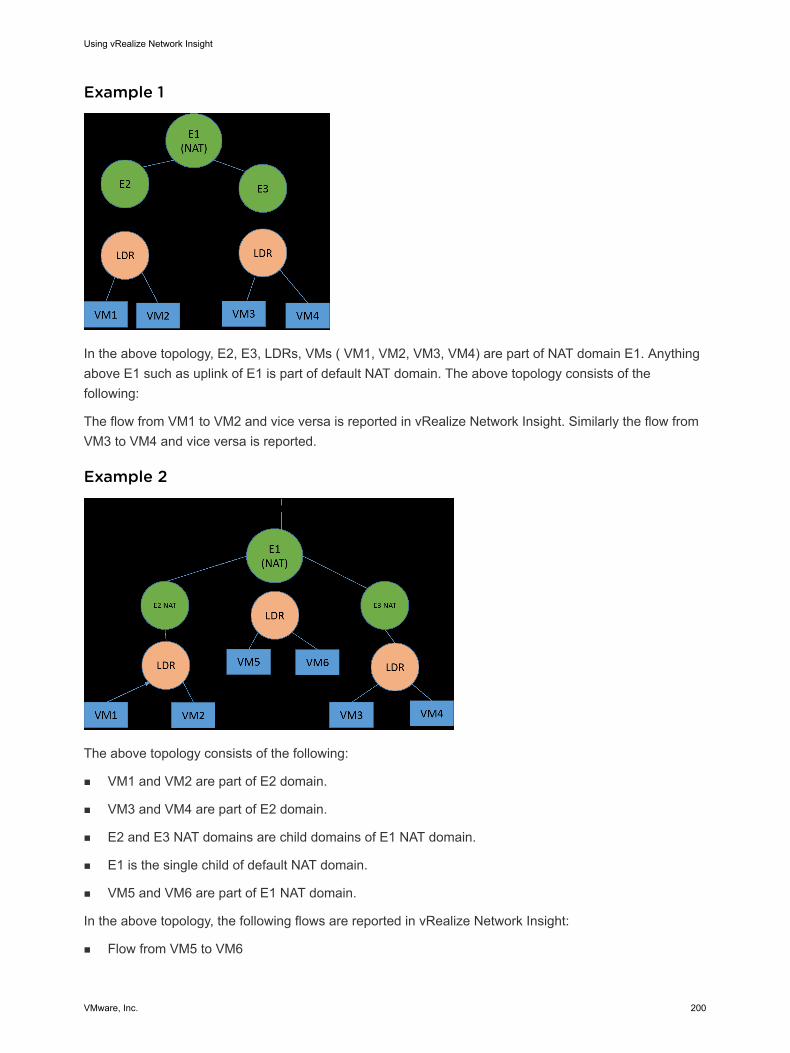
Example 1
In the above topology, E2, E3, LDRs, VMs ( VM1, VM2, VM3, VM4) are part of NAT domain E1. Anything above E1 such as uplink of E1 is part of default NAT domain. The above topology consists of the following:
The flow from VM1 to VM2 and vice versa is reported in vRealize Network Insight. Similarly the flow from VM3 to VM4 and vice versa is reported.
Example 2
The above topology consists of the following:
n VM1 and VM2 are part of E2 domain.
n VM3 and VM4 are part of E2 domain.
n E2 and E3 NAT domains are child domains of E1 NAT domain.
n E1 is the single child of default NAT domain.
n VM5 and VM6 are part of E1 NAT domain.
In the above topology, the following flows are reported in vRealize Network Insight:
n Flow from VM5 to VM6
Using vRealize Network Insight
VMware, Inc. 200
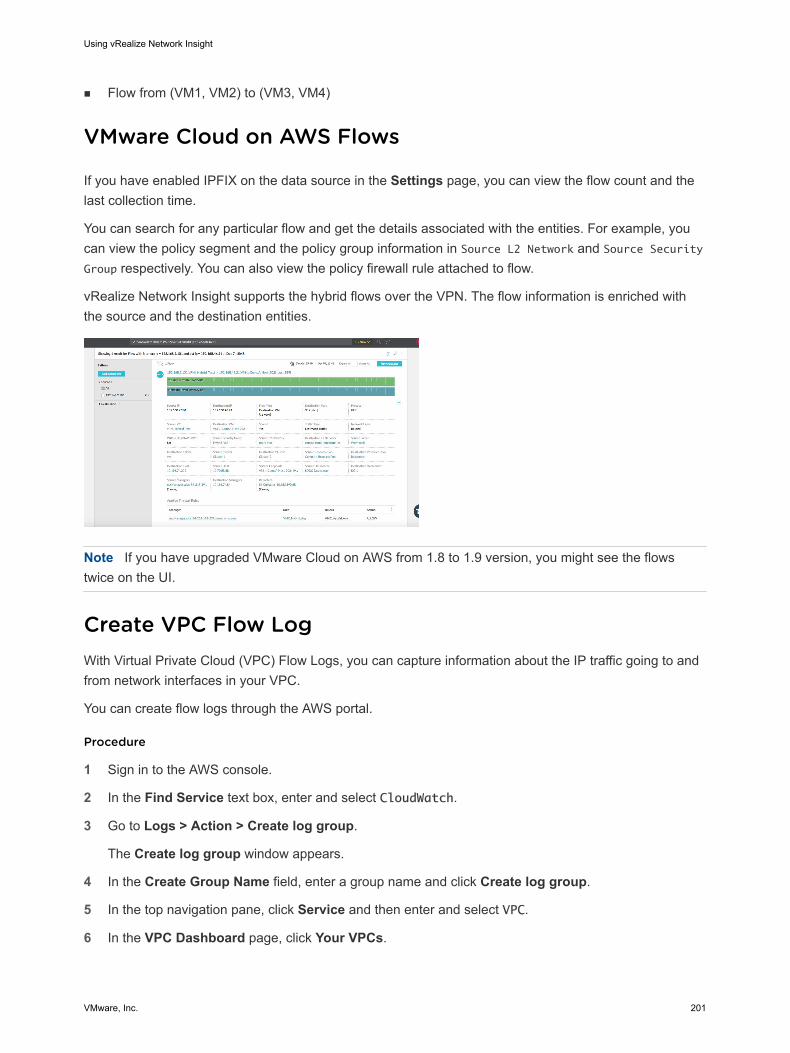
n Flow from (VM1, VM2) to (VM3, VM4)
VMware Cloud on AWS Flows
If you have enabled IPFIX on the data source in the Settings page, you can view the flow count and the last collection time.
You can search for any particular flow and get the details associated with the entities. For example, you can view the policy segment and the policy group information in Source L2 Network and Source Security Group respectively. You can also view the policy firewall rule attached to flow.
vRealize Network Insight supports the hybrid flows over the VPN. The flow information is enriched with the source and the destination entities.
Note If you have upgraded VMware Cloud on AWS from 1.8 to 1.9 version, you might see the flows twice on the UI.
Create VPC Flow LogWith Virtual Private Cloud (VPC) Flow Logs, you can capture information about the IP traffic going to and from network interfaces in your VPC.
You can create flow logs through the AWS portal.
Procedure
1 Sign in to the AWS console.
2 In the Find Service text box, enter and select CloudWatch.
3 Go to Logs > Action > Create log group.
The Create log group window appears.
4 In the Create Group Name field, enter a group name and click Create log group.
5 In the top navigation pane, click Service and then enter and select VPC.
6 In the VPC Dashboard page, click Your VPCs.
Using vRealize Network Insight
VMware, Inc. 201
7 Select the VPC that you want to modify, and click Flow Logs > Create flow log.
8 In the Create flow log window, configure the flow log:
Option Action
Filter Select one of the following: Accept, Reject, or All.
Destination Select Send to CloudWatch Logs.
Destination log group Select the log group you created.
9 Click Set Up Permissions.
The system opens the VPC Flow Logs is requesting permission to use resources in your account page.
10 Create an IAM role.
a In the VPC Flow Logs is requesting permission to use resources in your account page, in the IAM Role, select Create a new IAM Role.
b In the Role Name text box, enter a role name.
a Click Allow.
11 On the Create flow log page, in the IAM role drop-down, select the role you created.
12 Click Create
Results
Flow log starts publishing on the selected log group. For more information about VPC Flow Log, see the AWS documentation at https://docs.aws.amazon.com/vpc/latest/userguide/flow-logs.html#create-flow-log.
Sending Flow Records from F5 To vRealize Network Insight Collectors
To send the flow records, you must do the following:
Sl No. Task Link
1 Create a pool of IPFIX collectors to receive the IPFIX log messages from the BIG-IP system.
Create a pool of IPFIX Collectors
2 Create a log destination to format the logs in IPFIX templates.
Create an IPFIX Log Destination
3 Create a log publisher to send logs to a specified log destinations.
Create a Log Publisher
4 Create an iRule to send the flow information to the configured vRealize Network Insight collector.
Create iRules
Using vRealize Network Insight
VMware, Inc. 202
Sl No. Task Link
5 Add the iRule to a virtual server configuration so that the iRule parses all of the virtual server's network traffic.
Add the iRule To a Virtual Server
6 If the collector VM is unreachable from F5, you must create a route entry for the collector to send the flow records.
Create a Route Entry
Create a pool of IPFIX CollectorsCreate a pool of IPFIX collector. The BIG-IP system sends IPFIX log messages to this pool.
Procedure
1 Log in to a F5 console.
2 Click Main > Local Traffic > Pools > Pool Lists > Create.
The New Pool screen opens.
3 In the Name text box, enter a unique name for the pool.
4 In Health Monitors, select gateway_icmp and move it in the Active box.
5 In the New Member section, configure the collector IP address and click Add.
Option Action
Node Name Enter the Collector IP address.
Service Port 2055
6 Click Finished.
Create an IPFIX Log DestinationCreate a log destination to format the logs in IPFIX templates. After the formatting, these logs are sent to the IPFIX collector.
Procedure
1 In the F5 console, click Main > System > Logs > Configuration > Log Destinations > Create.
The Log Destinations screen appears.
2 In the Name text box, enter a unique name.
3 In the Type list, click IPFIX.
Using vRealize Network Insight
VMware, Inc. 203
4 Configure the IPFIX Settings.
Option Action
Protocol Click Netflow V9.
Pool Name Click the pool name you created in the previous step.
5 Click Finished.
Create a Log PublisherTo send the logs to a specified log destination, you need to create a log publisher .
Procedure
1 In the F5 console, click Main > System > Logs > Configuration > Log Publishers > Create.
The Log Publishers screen appears.
2 In the Name field, enter a unique name.
3 In the Destination box, select the log destination you created previously from the Available box, and move it in the Selected box.
4 Click Finished.
Create iRulesTo send the flow information to the configured vRealize Network Insight collector, you must create a iRule. You must create two iRules. One iRule for the TCP protocol and another iRule for the UDP protocol.
Procedure
1 In the F5 console, click Main > iRules > iRule List > Create.
The New iRule screen appears.
2 In the Name text box, enter a unique name.
3 In the Definition text box, enter the TCP rules for the TCP protocol and the UDP rule for the UDP protocol. For information on the rules, see iRules for TCP and UDP protocol.
Ensure the iRule points to the publisher created previously.
4 Click Finished.
iRules for TCP and UDP protocolUse these to create iRules for TCP and UDP protocol
Using vRealize Network Insight
VMware, Inc. 204
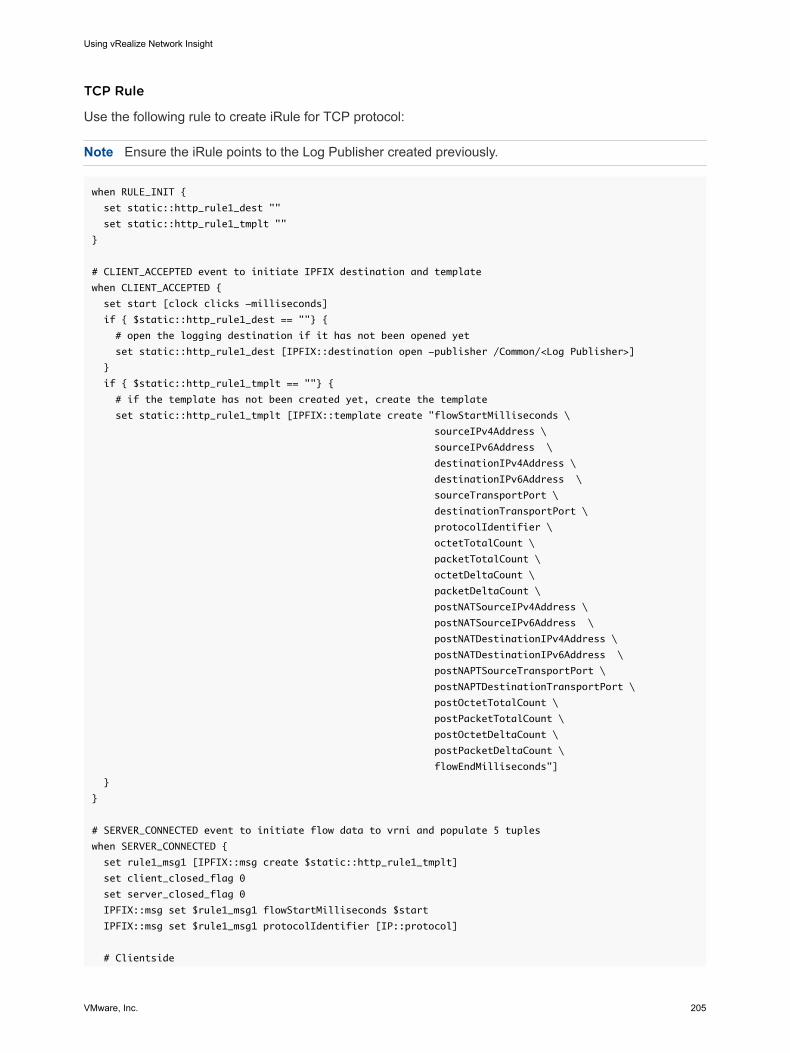
TCP Rule
Use the following rule to create iRule for TCP protocol:
Note Ensure the iRule points to the Log Publisher created previously.
when RULE_INIT {
set static::http_rule1_dest ""
set static::http_rule1_tmplt ""
}
# CLIENT_ACCEPTED event to initiate IPFIX destination and template
when CLIENT_ACCEPTED {
set start [clock clicks -milliseconds]
if { $static::http_rule1_dest == ""} {
# open the logging destination if it has not been opened yet
set static::http_rule1_dest [IPFIX::destination open -publisher /Common/<Log Publisher>]
}
if { $static::http_rule1_tmplt == ""} {
# if the template has not been created yet, create the template
set static::http_rule1_tmplt [IPFIX::template create "flowStartMilliseconds \
sourceIPv4Address \
sourceIPv6Address \
destinationIPv4Address \
destinationIPv6Address \
sourceTransportPort \
destinationTransportPort \
protocolIdentifier \
octetTotalCount \
packetTotalCount \
octetDeltaCount \
packetDeltaCount \
postNATSourceIPv4Address \
postNATSourceIPv6Address \
postNATDestinationIPv4Address \
postNATDestinationIPv6Address \
postNAPTSourceTransportPort \
postNAPTDestinationTransportPort \
postOctetTotalCount \
postPacketTotalCount \
postOctetDeltaCount \
postPacketDeltaCount \
flowEndMilliseconds"]
}
}
# SERVER_CONNECTED event to initiate flow data to vrni and populate 5 tuples
when SERVER_CONNECTED {
set rule1_msg1 [IPFIX::msg create $static::http_rule1_tmplt]
set client_closed_flag 0
set server_closed_flag 0
IPFIX::msg set $rule1_msg1 flowStartMilliseconds $start
IPFIX::msg set $rule1_msg1 protocolIdentifier [IP::protocol]
# Clientside
Using vRealize Network Insight
VMware, Inc. 205
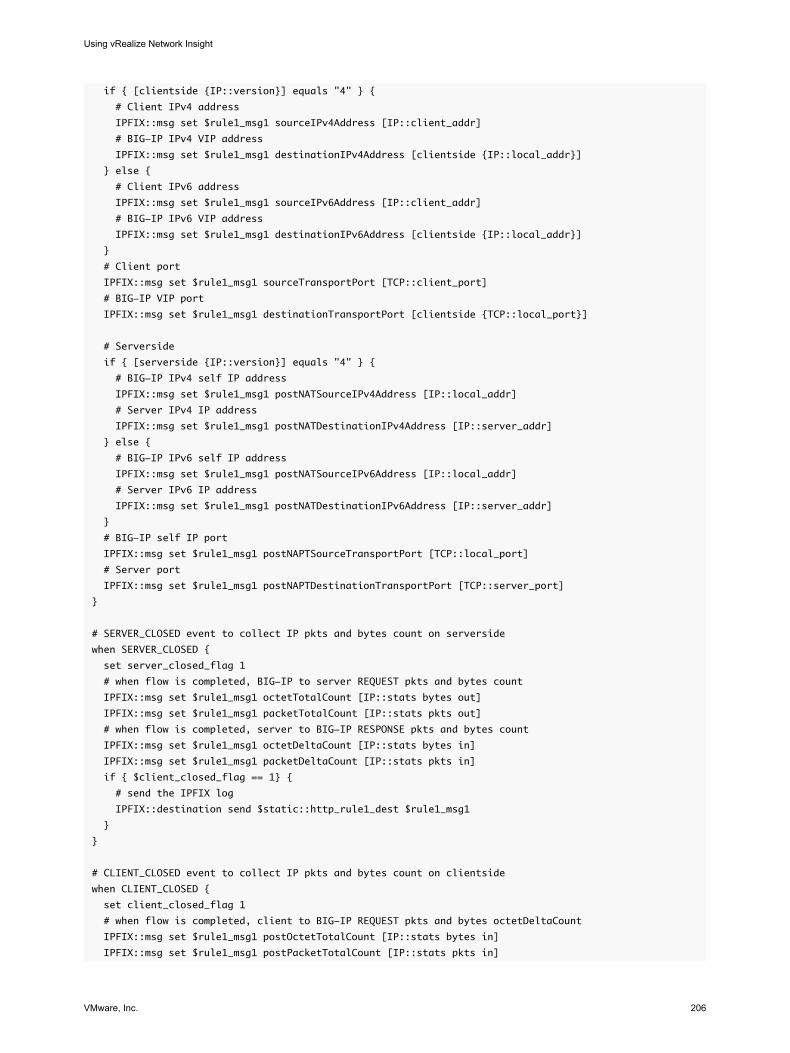
if { [clientside {IP::version}] equals "4" } {
# Client IPv4 address
IPFIX::msg set $rule1_msg1 sourceIPv4Address [IP::client_addr]
# BIG-IP IPv4 VIP address
IPFIX::msg set $rule1_msg1 destinationIPv4Address [clientside {IP::local_addr}]
} else {
# Client IPv6 address
IPFIX::msg set $rule1_msg1 sourceIPv6Address [IP::client_addr]
# BIG-IP IPv6 VIP address
IPFIX::msg set $rule1_msg1 destinationIPv6Address [clientside {IP::local_addr}]
}
# Client port
IPFIX::msg set $rule1_msg1 sourceTransportPort [TCP::client_port]
# BIG-IP VIP port
IPFIX::msg set $rule1_msg1 destinationTransportPort [clientside {TCP::local_port}]
# Serverside
if { [serverside {IP::version}] equals "4" } {
# BIG-IP IPv4 self IP address
IPFIX::msg set $rule1_msg1 postNATSourceIPv4Address [IP::local_addr]
# Server IPv4 IP address
IPFIX::msg set $rule1_msg1 postNATDestinationIPv4Address [IP::server_addr]
} else {
# BIG-IP IPv6 self IP address
IPFIX::msg set $rule1_msg1 postNATSourceIPv6Address [IP::local_addr]
# Server IPv6 IP address
IPFIX::msg set $rule1_msg1 postNATDestinationIPv6Address [IP::server_addr]
}
# BIG-IP self IP port
IPFIX::msg set $rule1_msg1 postNAPTSourceTransportPort [TCP::local_port]
# Server port
IPFIX::msg set $rule1_msg1 postNAPTDestinationTransportPort [TCP::server_port]
}
# SERVER_CLOSED event to collect IP pkts and bytes count on serverside
when SERVER_CLOSED {
set server_closed_flag 1
# when flow is completed, BIG-IP to server REQUEST pkts and bytes count
IPFIX::msg set $rule1_msg1 octetTotalCount [IP::stats bytes out]
IPFIX::msg set $rule1_msg1 packetTotalCount [IP::stats pkts out]
# when flow is completed, server to BIG-IP RESPONSE pkts and bytes count
IPFIX::msg set $rule1_msg1 octetDeltaCount [IP::stats bytes in]
IPFIX::msg set $rule1_msg1 packetDeltaCount [IP::stats pkts in]
if { $client_closed_flag == 1} {
# send the IPFIX log
IPFIX::destination send $static::http_rule1_dest $rule1_msg1
}
}
# CLIENT_CLOSED event to collect IP pkts and bytes count on clientside
when CLIENT_CLOSED {
set client_closed_flag 1
# when flow is completed, client to BIG-IP REQUEST pkts and bytes octetDeltaCount
IPFIX::msg set $rule1_msg1 postOctetTotalCount [IP::stats bytes in]
IPFIX::msg set $rule1_msg1 postPacketTotalCount [IP::stats pkts in]
Using vRealize Network Insight
VMware, Inc. 206
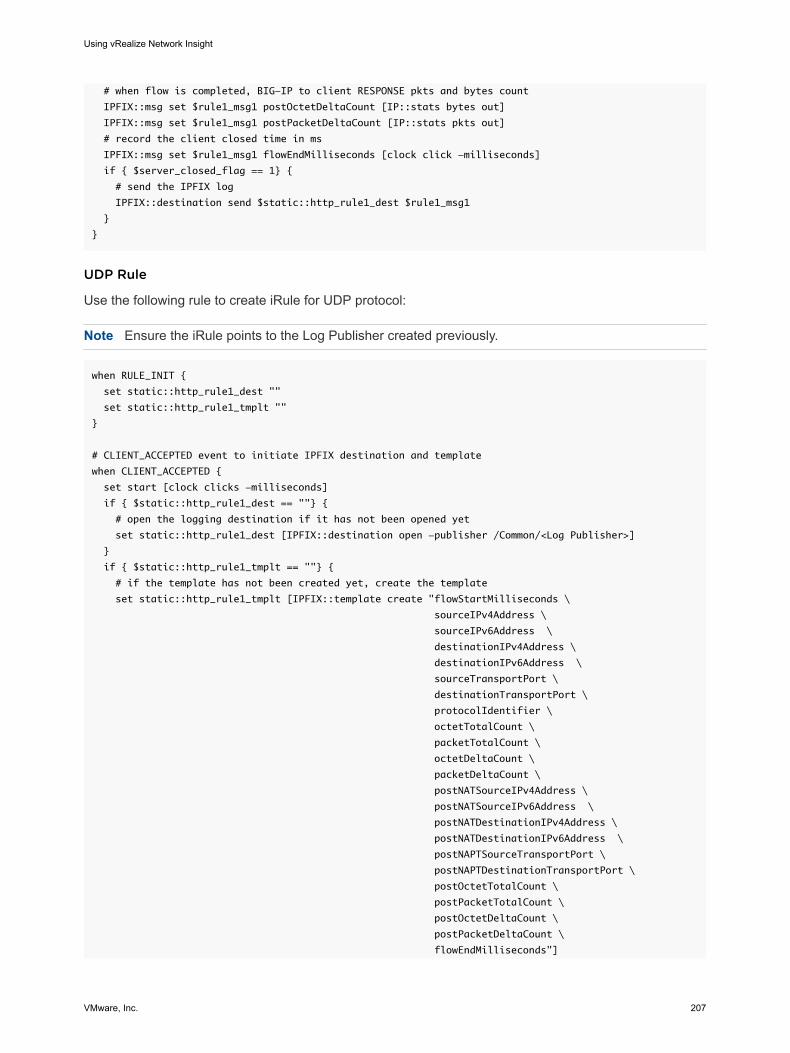
# when flow is completed, BIG-IP to client RESPONSE pkts and bytes count
IPFIX::msg set $rule1_msg1 postOctetDeltaCount [IP::stats bytes out]
IPFIX::msg set $rule1_msg1 postPacketDeltaCount [IP::stats pkts out]
# record the client closed time in ms
IPFIX::msg set $rule1_msg1 flowEndMilliseconds [clock click -milliseconds]
if { $server_closed_flag == 1} {
# send the IPFIX log
IPFIX::destination send $static::http_rule1_dest $rule1_msg1
}
}
UDP Rule
Use the following rule to create iRule for UDP protocol:
Note Ensure the iRule points to the Log Publisher created previously.
when RULE_INIT {
set static::http_rule1_dest ""
set static::http_rule1_tmplt ""
}
# CLIENT_ACCEPTED event to initiate IPFIX destination and template
when CLIENT_ACCEPTED {
set start [clock clicks -milliseconds]
if { $static::http_rule1_dest == ""} {
# open the logging destination if it has not been opened yet
set static::http_rule1_dest [IPFIX::destination open -publisher /Common/<Log Publisher>]
}
if { $static::http_rule1_tmplt == ""} {
# if the template has not been created yet, create the template
set static::http_rule1_tmplt [IPFIX::template create "flowStartMilliseconds \
sourceIPv4Address \
sourceIPv6Address \
destinationIPv4Address \
destinationIPv6Address \
sourceTransportPort \
destinationTransportPort \
protocolIdentifier \
octetTotalCount \
packetTotalCount \
octetDeltaCount \
packetDeltaCount \
postNATSourceIPv4Address \
postNATSourceIPv6Address \
postNATDestinationIPv4Address \
postNATDestinationIPv6Address \
postNAPTSourceTransportPort \
postNAPTDestinationTransportPort \
postOctetTotalCount \
postPacketTotalCount \
postOctetDeltaCount \
postPacketDeltaCount \
flowEndMilliseconds"]
Using vRealize Network Insight
VMware, Inc. 207
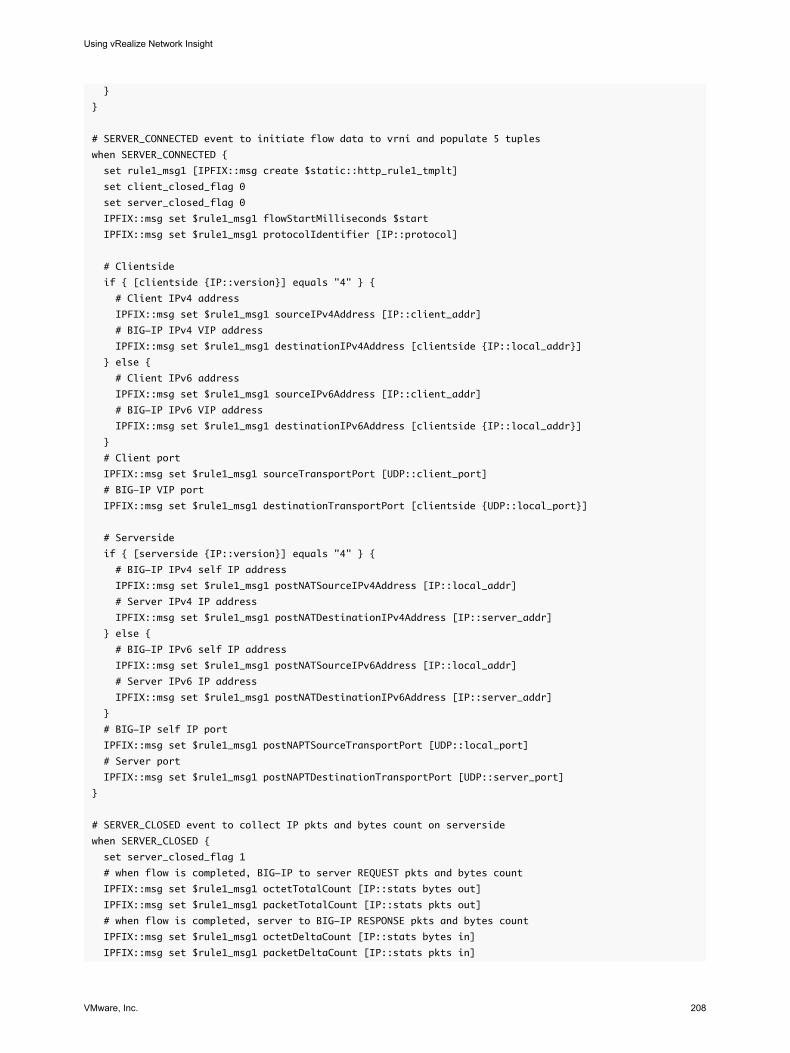
}
}
# SERVER_CONNECTED event to initiate flow data to vrni and populate 5 tuples
when SERVER_CONNECTED {
set rule1_msg1 [IPFIX::msg create $static::http_rule1_tmplt]
set client_closed_flag 0
set server_closed_flag 0
IPFIX::msg set $rule1_msg1 flowStartMilliseconds $start
IPFIX::msg set $rule1_msg1 protocolIdentifier [IP::protocol]
# Clientside
if { [clientside {IP::version}] equals "4" } {
# Client IPv4 address
IPFIX::msg set $rule1_msg1 sourceIPv4Address [IP::client_addr]
# BIG-IP IPv4 VIP address
IPFIX::msg set $rule1_msg1 destinationIPv4Address [clientside {IP::local_addr}]
} else {
# Client IPv6 address
IPFIX::msg set $rule1_msg1 sourceIPv6Address [IP::client_addr]
# BIG-IP IPv6 VIP address
IPFIX::msg set $rule1_msg1 destinationIPv6Address [clientside {IP::local_addr}]
}
# Client port
IPFIX::msg set $rule1_msg1 sourceTransportPort [UDP::client_port]
# BIG-IP VIP port
IPFIX::msg set $rule1_msg1 destinationTransportPort [clientside {UDP::local_port}]
# Serverside
if { [serverside {IP::version}] equals "4" } {
# BIG-IP IPv4 self IP address
IPFIX::msg set $rule1_msg1 postNATSourceIPv4Address [IP::local_addr]
# Server IPv4 IP address
IPFIX::msg set $rule1_msg1 postNATDestinationIPv4Address [IP::server_addr]
} else {
# BIG-IP IPv6 self IP address
IPFIX::msg set $rule1_msg1 postNATSourceIPv6Address [IP::local_addr]
# Server IPv6 IP address
IPFIX::msg set $rule1_msg1 postNATDestinationIPv6Address [IP::server_addr]
}
# BIG-IP self IP port
IPFIX::msg set $rule1_msg1 postNAPTSourceTransportPort [UDP::local_port]
# Server port
IPFIX::msg set $rule1_msg1 postNAPTDestinationTransportPort [UDP::server_port]
}
# SERVER_CLOSED event to collect IP pkts and bytes count on serverside
when SERVER_CLOSED {
set server_closed_flag 1
# when flow is completed, BIG-IP to server REQUEST pkts and bytes count
IPFIX::msg set $rule1_msg1 octetTotalCount [IP::stats bytes out]
IPFIX::msg set $rule1_msg1 packetTotalCount [IP::stats pkts out]
# when flow is completed, server to BIG-IP RESPONSE pkts and bytes count
IPFIX::msg set $rule1_msg1 octetDeltaCount [IP::stats bytes in]
IPFIX::msg set $rule1_msg1 packetDeltaCount [IP::stats pkts in]
Using vRealize Network Insight
VMware, Inc. 208
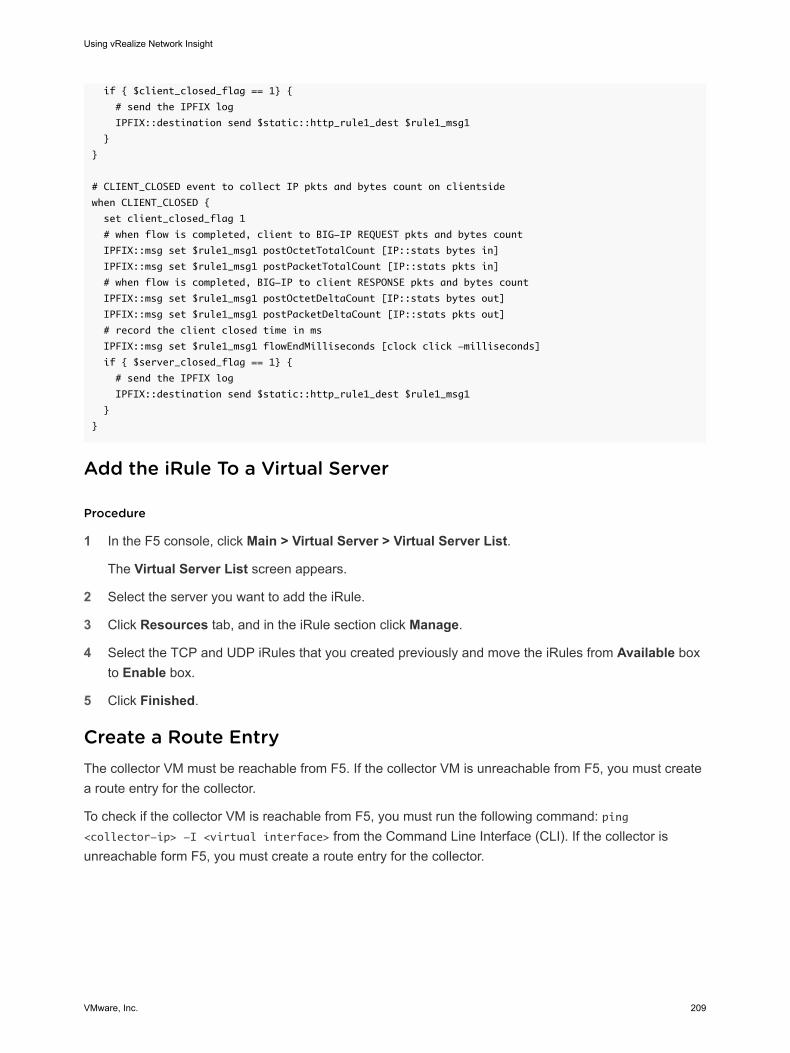
if { $client_closed_flag == 1} {
# send the IPFIX log
IPFIX::destination send $static::http_rule1_dest $rule1_msg1
}
}
# CLIENT_CLOSED event to collect IP pkts and bytes count on clientside
when CLIENT_CLOSED {
set client_closed_flag 1
# when flow is completed, client to BIG-IP REQUEST pkts and bytes count
IPFIX::msg set $rule1_msg1 postOctetTotalCount [IP::stats bytes in]
IPFIX::msg set $rule1_msg1 postPacketTotalCount [IP::stats pkts in]
# when flow is completed, BIG-IP to client RESPONSE pkts and bytes count
IPFIX::msg set $rule1_msg1 postOctetDeltaCount [IP::stats bytes out]
IPFIX::msg set $rule1_msg1 postPacketDeltaCount [IP::stats pkts out]
# record the client closed time in ms
IPFIX::msg set $rule1_msg1 flowEndMilliseconds [clock click -milliseconds]
if { $server_closed_flag == 1} {
# send the IPFIX log
IPFIX::destination send $static::http_rule1_dest $rule1_msg1
}
}
Add the iRule To a Virtual Server
Procedure
1 In the F5 console, click Main > Virtual Server > Virtual Server List.
The Virtual Server List screen appears.
2 Select the server you want to add the iRule.
3 Click Resources tab, and in the iRule section click Manage.
4 Select the TCP and UDP iRules that you created previously and move the iRules from Available box to Enable box.
5 Click Finished.
Create a Route EntryThe collector VM must be reachable from F5. If the collector VM is unreachable from F5, you must create a route entry for the collector.
To check if the collector VM is reachable from F5, you must run the following command: ping <collector-ip> -I <virtual interface> from the Command Line Interface (CLI). If the collector is unreachable form F5, you must create a route entry for the collector.
Using vRealize Network Insight
VMware, Inc. 209
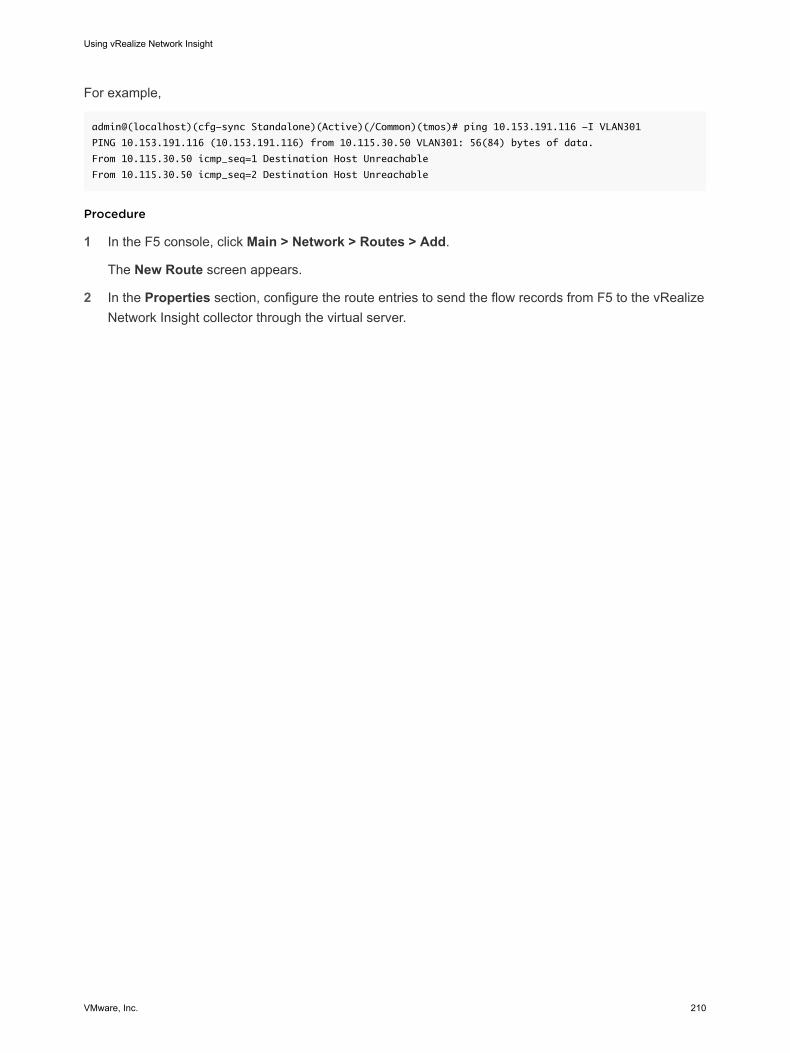
For example,
admin@(localhost)(cfg-sync Standalone)(Active)(/Common)(tmos)# ping 10.153.191.116 -I VLAN301
PING 10.153.191.116 (10.153.191.116) from 10.115.30.50 VLAN301: 56(84) bytes of data.
From 10.115.30.50 icmp_seq=1 Destination Host Unreachable
From 10.115.30.50 icmp_seq=2 Destination Host Unreachable
Procedure
1 In the F5 console, click Main > Network > Routes > Add.
The New Route screen appears.
2 In the Properties section, configure the route entries to send the flow records from F5 to the vRealize Network Insight collector through the virtual server.
Using vRealize Network Insight
VMware, Inc. 210
Kubernetes and VMware PKS Scoping and Flow Information 11You can perform scoping of container entities and view the flow information in vRealize Network Insight.
VMware PKS and Kubernetes Flow InformationvRealize Network Insight supports the following flow types for Kubernetes entities.
n VM to Kubernetes Pod
n Kubernetes Pod to Pod
n Destination is Kubernetes Pod
n Source is Kubernetes Pod
You can use these flow types to search for a particular Kubernetes entities.
For example, flows where flow type = x where x is one of the flow types
vRealize Network Insight can provide flow information such as metrics, time-series and relations for all entities, which includes the container source and destination details and its entities details.
Also, tou can view the top talkers by Kubernetes Cluster, Namespace, Service and Node on the Flow Analytics Dashboard.
Planning and Micro-segmentation of Kubernetes EntitiesYou can plan for a specific Kubernetes entity type by selecting Kubernetes Cluster, Kubernetes Service, Kubernetes Namespace, or Kubernetes Node as the scope and Micro-Segments in the Plan Security page. Also, you can plan or analyze data for the application and define grouping based on Kubernetes entities to view the application flow information.
Also, you can export the recommended firewall rules related to Kubernetes entities in the YAML format from Micro-Segments in the Plan Security page.
Note You cannot export the application scope in the YAML format if it contains VMs or VM members. If the application contains only container entities, exporting to YAML format is available.
VMware, Inc. 211
Viewing Entity Details 12The entity pages provide a comprehensive outlook of the entities that are present in your data center. This information can range from detailed topologies to show relationships with other entities of your data center to detailed metrics about a particular entity.
Each entity page is a collection widgets and each widget shows specific information related to the entity. The information provided is both real time and historical, and an exhaustive list of metrics and properties for the entity.
If you want to see more information about entities, then click Profile > Help on the top-right corner of the page.
TimelineThe timeline provides you the following information:
n The state of the data center at a particular time in the past.
n A bird’s eye view of events that were detected across a selected time range.
Select the time range of the timeline that you want to view.
To view a particular timeline, select the time range by using the Time Range option.
Property WidgetThe property widgets display important attributes in a two-column layout. Some property pins might also display only a singular attribute value. An example of the property pin is the VM Properties pin. The VM Property pin displays the properties of a VM, such as operating system, IP address, default gateway, logical switches, CPU, memory, power state, and so on.
This chapter includes the following topics:
n Viewing vRealize Network Insight System (NI-System) Details
n Viewing Platform VM details
n Viewing Collector VM Details
n Viewing VMware vCenter Data Source Details
n Viewing PCI Compliance Details
VMware, Inc. 212
n Viewing Kubernetes Details
n Viewing Load Balancer Details
n Viewing VM Details
n Viewing Edge Device Details
n Viewing NSX Manager Details
n Viewing VMware NSX-T Manager Details
n Viewing NSX-T Management Node Details
n Viewing NSX-T Transport Details
n Viewing Virtual Server Details
n Viewing Pool Members Details
n Viewing Microsoft Azure Details
n Viewing VeloCloud Enterprise Details
n Viewing SD-WAN and Edge SD-WAN Application Details
n Viewing SD-WAN Assessment Details
n Viewing VeloCloud Link Application Details
n Viewing VeloCloud Business Policy Details
n Viewing VMC Sddc Details
n Viewing Arista Hardware Gateway and Arista Hardware Gateway Binding Details
n Viewing Flow Insight Details
n Viewing Micro-Segmentation Details
n Viewing Application Details
n Analytics - Outlier Detection
n Analytics: Static and Dynamic Thresholds
Viewing vRealize Network Insight System (NI-System) Details
The vRealize Network Insight System (NI System) page provides a snapshot of all the information related to the system. To access the vRealize Network Insight System page:
n On the Install and Support page, click View Details next to Overview. The NI System page appears.
n Provide NI-System as the search query to view the vRealize Network Insight System page.
Using vRealize Network Insight
VMware, Inc. 213
The NI System page is divided into three sections:
n Overview: This section consists of information on the key properties, the data sources, the problems that are open, and all the changes and the problems related to the system. View the details of each data source by clicking it.
n Events: This section lists all the problems and changes in the system, data sources, platforms, and the collectors.
n Platforms and Collectors: This section lists all the platforms and the collectors associated with the system. To view more details about any platform or collector, click it.
Viewing Platform VM detailsThe Platform VM page provides a snapshot of the properties, changes, and problems of a particular platform node.
In the Platform VM page, you see:
n Important information about the selected platform node, such as name, IP address, CPU cores, memory, the last upgraded time, and the version.
n Open problems that are associated with the platforms and are open.
n The list of events related to the selected platform node.
n The graphical representation of the metrics such as CPU Usage, Memory Usage, and Data Disk Usage.
Viewing Collector VM DetailsThe Collector VM page provides a snapshot of the properties, changes, and problems of a particular collector node.
In the Collector VM page, you see:
n Important information about the selected platform node, such as name, IP address, CPU cores, memory, the last upgraded time, and the version.
n Number of open problems related to the collector and the problem details.
n Number of open problems related to the data sources and the problem details.
n List of the changes that occurred in the data source in the last seven days.
n Details of the data sources and the NetFlow reporters available in the collector. The number of flows are shown for each NetFlow reporter. For data sources, the number of flows and the discovered VMs are shown.
n The graphical representation of the metrics such as CPU Usage, Memory Usage, and Data Disk Usage
Using vRealize Network Insight
VMware, Inc. 214
Viewing VMware vCenter Data Source DetailsThe VMware vCenter Data Source page provides a snapshot of the properties, changes, and problems of a particular data source.
In the VMware vCenter Data Source page, you see:
n Important information about the selected VMware vCenter Data Source, such as IP Address/FQDN, Collector Name, Enabled, number of discovered VMs, IPFIX Enabled Status, and so on.
n All the open problems associated to the data source.
n All the changes and the problems encountered in a particular data source in the last seven days.
Viewing PCI Compliance DetailsThe PCI Compliance page is available only for the Enterprise License users.
Access the PCI Compliance1 In the navigation panel on the left of the Homepage, select Security > PCI Compliance.
2 The PCI Compliance window appears. Select the required scope, the corresponding entity, and the duration for which you require the data. Click Assess.
3 The PCI Compliance page appears.
PCI Compliance page detailsThe PCI Compliance page helps in assessing compliance against the PCI requirements only in the NSX environment. These requirements are mentioned under the first pin in the dashboard. The rest of the pins in the dashboard that provide data for the assessment of these requirements are as follows:
n Network flow diagram: It shows the data flow, firewalls, connections, and other details associated with a network.
n Flows: It lists the flows that you view in the network flow diagram.
n Clear text protocol flows based on the destination port: The traffic that flows on certain ports are in clear text. This pin displays the clear text protocol flows based on a particular destination port.
n Virtual machines in scope: It shows the virtual machines in the scope that you have selected in the query. This pin shows the outgoing rules, incoming rules, and security groups for virtual machines in that scope.
n Security groups of virtual machines: It lists the security groups of the virtual machines.
n Virtual machine count by Security Groups: You can view the list of the virtual machines in a security group by clicking Count in this pin.
n Virtual machine count by Security Tags: You can view the list of virtual machines with security tags by clicking Count in this pin.
Using vRealize Network Insight
VMware, Inc. 215
n Firewall rules applied on internal traffic : You can view the firewall rules for the traffic between the virtual machines within the selected scope.
n Firewall rules applied on incoming traffic: You can view the firewall rules for the traffic that is coming from a virtual machine outside the scope to the virtual machine within the selected scope.
n Firewall rules applied on outgoing traffic: You can view the firewall rules for the traffic that is going to a virtual machine outside the scope from the virtual machine within the selected scope.
n Security tag membership changes: The changes related to the membership for security tags are shown in this pin.
n Security group membership changes: The changes related to the membership of a security group are shown in this pin.
n Firewall rule changes: The changes related to any firewall rule is listed in this pin.
Note If NSX has nested security groups, then the scope of PCI Compliance should be other than security group.
Export as PDF
vRealize Network Insight enables you to create and export the information on the PCI Compliance dashboard as a PDF report.
Procedure
1 In the PCI Compliance dashboard, click Export as PDF on the right top side of the page. The Export to PDF window appears.
2 The Export to PDF window lists all the widgets and their respective properties available on the PCI Compliance dashboard. Select the widgets and the properties that you want to export.
Note n You have to select at least one property.
n The maximum number of properties that you can select is 20.
n The maximum number of entries in the list view that can be exported is 100.
n Certain widgets do not allow you to select the properties. In such instances, specify only the number of entries.
3 Provide a title for the PDF report.
Note n The maximum number of characters in the title is 200.
n The maximum number of pages that can be generated in the report are 50.
4 Click Preview. You can see the preview of the complete report.
Using vRealize Network Insight
VMware, Inc. 216
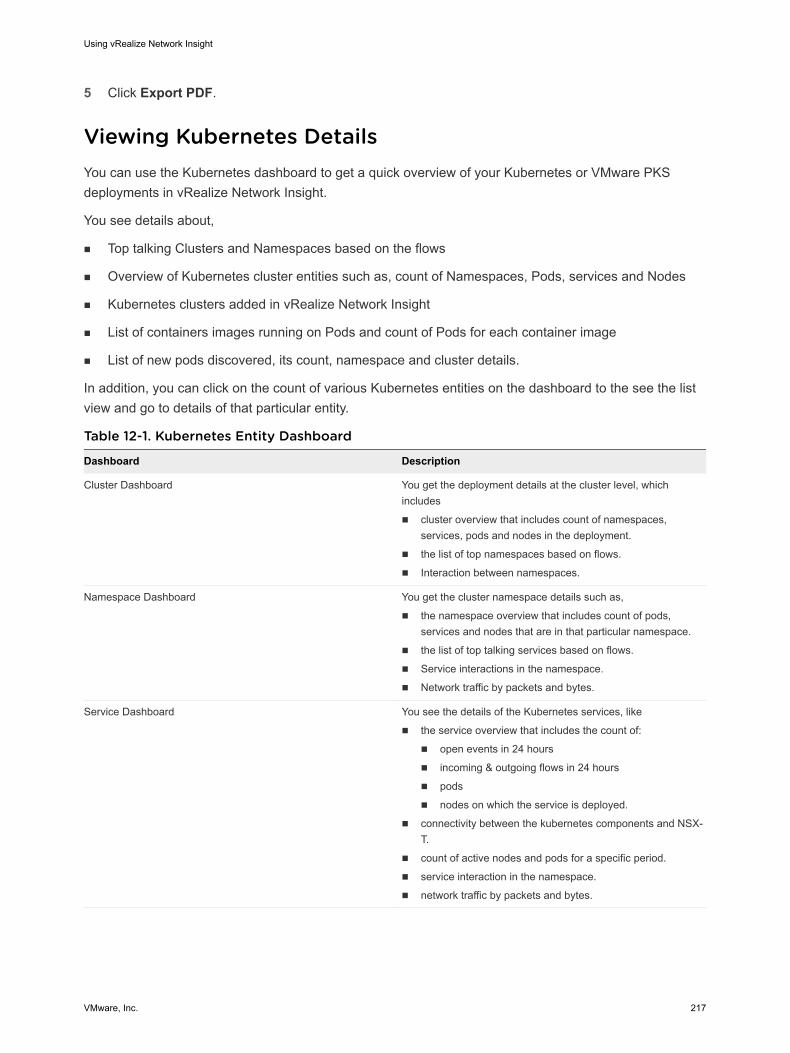
5 Click Export PDF.
Viewing Kubernetes DetailsYou can use the Kubernetes dashboard to get a quick overview of your Kubernetes or VMware PKS deployments in vRealize Network Insight.
You see details about,
n Top talking Clusters and Namespaces based on the flows
n Overview of Kubernetes cluster entities such as, count of Namespaces, Pods, services and Nodes
n Kubernetes clusters added in vRealize Network Insight
n List of containers images running on Pods and count of Pods for each container image
n List of new pods discovered, its count, namespace and cluster details.
In addition, you can click on the count of various Kubernetes entities on the dashboard to the see the list view and go to details of that particular entity.
Table 12-1. Kubernetes Entity Dashboard
Dashboard Description
Cluster Dashboard You get the deployment details at the cluster level, which includes
n cluster overview that includes count of namespaces, services, pods and nodes in the deployment.
n the list of top namespaces based on flows.
n Interaction between namespaces.
Namespace Dashboard You get the cluster namespace details such as,
n the namespace overview that includes count of pods, services and nodes that are in that particular namespace.
n the list of top talking services based on flows.
n Service interactions in the namespace.
n Network traffic by packets and bytes.
Service Dashboard You see the details of the Kubernetes services, like
n the service overview that includes the count of:
n open events in 24 hours
n incoming & outgoing flows in 24 hours
n pods
n nodes on which the service is deployed.
n connectivity between the kubernetes components and NSX-T.
n count of active nodes and pods for a specific period.
n service interaction in the namespace.
n network traffic by packets and bytes.
Using vRealize Network Insight
VMware, Inc. 217
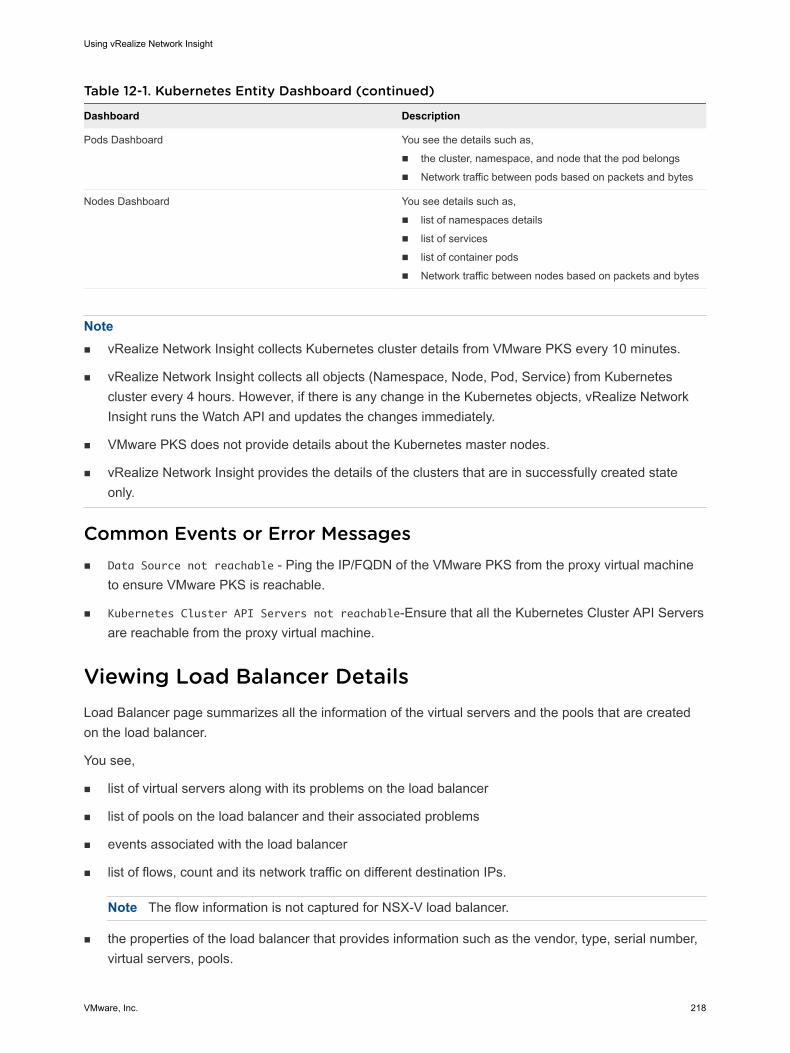
Table 12-1. Kubernetes Entity Dashboard (continued)
Dashboard Description
Pods Dashboard You see the details such as,
n the cluster, namespace, and node that the pod belongs
n Network traffic between pods based on packets and bytes
Nodes Dashboard You see details such as,
n list of namespaces details
n list of services
n list of container pods
n Network traffic between nodes based on packets and bytes
Note n vRealize Network Insight collects Kubernetes cluster details from VMware PKS every 10 minutes.
n vRealize Network Insight collects all objects (Namespace, Node, Pod, Service) from Kubernetes cluster every 4 hours. However, if there is any change in the Kubernetes objects, vRealize Network Insight runs the Watch API and updates the changes immediately.
n VMware PKS does not provide details about the Kubernetes master nodes.
n vRealize Network Insight provides the details of the clusters that are in successfully created state only.
Common Events or Error Messagesn Data Source not reachable - Ping the IP/FQDN of the VMware PKS from the proxy virtual machine
to ensure VMware PKS is reachable.
n Kubernetes Cluster API Servers not reachable-Ensure that all the Kubernetes Cluster API Servers are reachable from the proxy virtual machine.
Viewing Load Balancer DetailsLoad Balancer page summarizes all the information of the virtual servers and the pools that are created on the load balancer.
You see,
n list of virtual servers along with its problems on the load balancer
n list of pools on the load balancer and their associated problems
n events associated with the load balancer
n list of flows, count and its network traffic on different destination IPs.
Note The flow information is not captured for NSX-V load balancer.
n the properties of the load balancer that provides information such as the vendor, type, serial number, virtual servers, pools.
Using vRealize Network Insight
VMware, Inc. 218
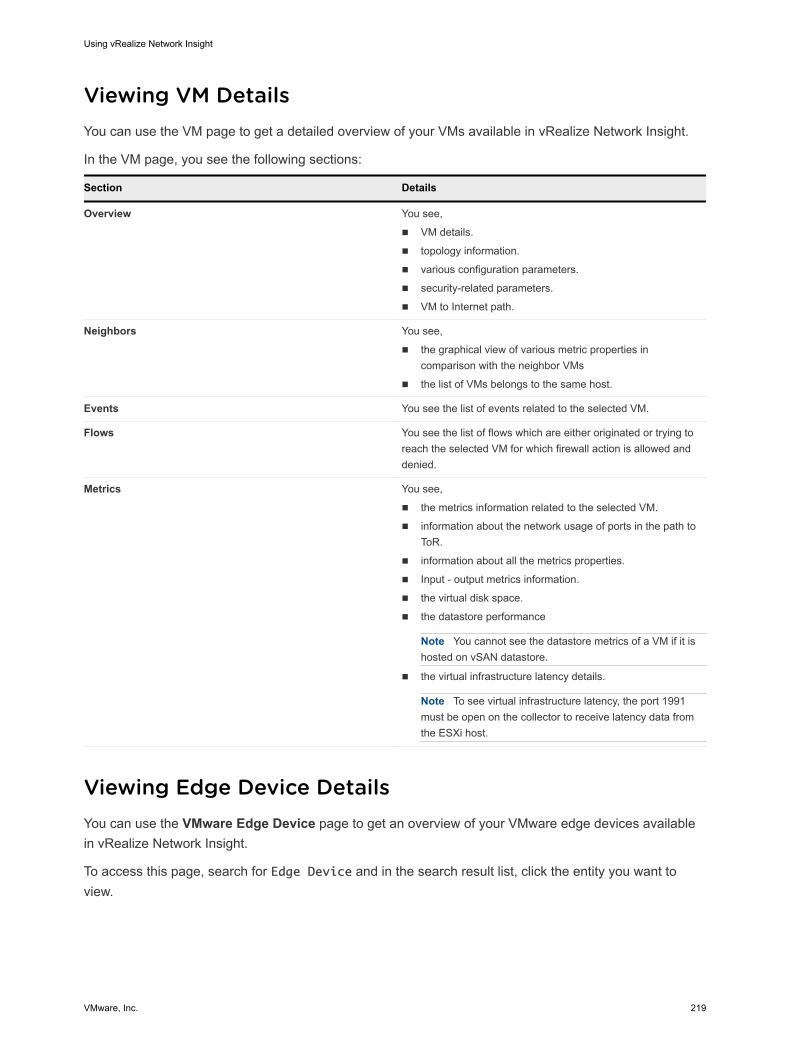
Viewing VM DetailsYou can use the VM page to get a detailed overview of your VMs available in vRealize Network Insight.
In the VM page, you see the following sections:
Section Details
Overview You see,
n VM details.
n topology information.
n various configuration parameters.
n security-related parameters.
n VM to Internet path.
Neighbors You see,
n the graphical view of various metric properties in comparison with the neighbor VMs
n the list of VMs belongs to the same host.
Events You see the list of events related to the selected VM.
Flows You see the list of flows which are either originated or trying to reach the selected VM for which firewall action is allowed and denied.
Metrics You see,
n the metrics information related to the selected VM.
n information about the network usage of ports in the path to ToR.
n information about all the metrics properties.
n Input - output metrics information.
n the virtual disk space.
n the datastore performance
Note You cannot see the datastore metrics of a VM if it is hosted on vSAN datastore.
n the virtual infrastructure latency details.
Note To see virtual infrastructure latency, the port 1991 must be open on the collector to receive latency data from the ESXi host.
Viewing Edge Device DetailsYou can use the VMware Edge Device page to get an overview of your VMware edge devices available in vRealize Network Insight.
To access this page, search for Edge Device and in the search result list, click the entity you want to view.
Using vRealize Network Insight
VMware, Inc. 219
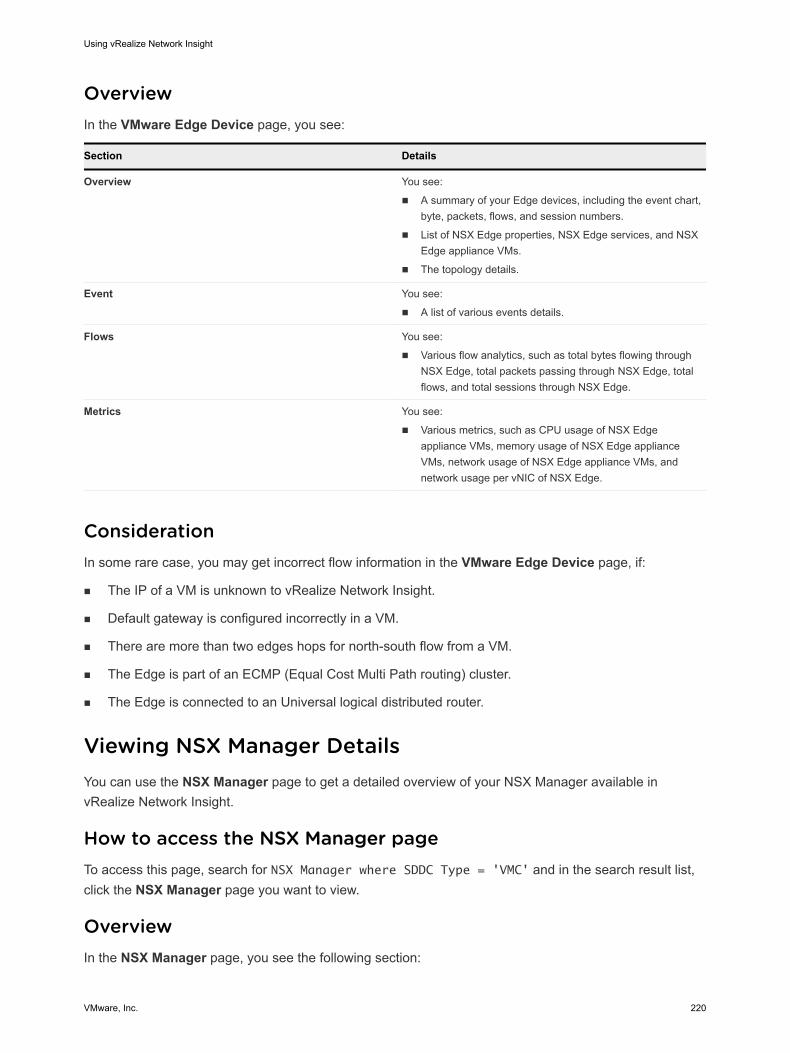
OverviewIn the VMware Edge Device page, you see:
Section Details
Overview You see:
n A summary of your Edge devices, including the event chart, byte, packets, flows, and session numbers.
n List of NSX Edge properties, NSX Edge services, and NSX Edge appliance VMs.
n The topology details.
Event You see:
n A list of various events details.
Flows You see:
n Various flow analytics, such as total bytes flowing through NSX Edge, total packets passing through NSX Edge, total flows, and total sessions through NSX Edge.
Metrics You see:
n Various metrics, such as CPU usage of NSX Edge appliance VMs, memory usage of NSX Edge appliance VMs, network usage of NSX Edge appliance VMs, and network usage per vNIC of NSX Edge.
ConsiderationIn some rare case, you may get incorrect flow information in the VMware Edge Device page, if:
n The IP of a VM is unknown to vRealize Network Insight.
n Default gateway is configured incorrectly in a VM.
n There are more than two edges hops for north-south flow from a VM.
n The Edge is part of an ECMP (Equal Cost Multi Path routing) cluster.
n The Edge is connected to an Universal logical distributed router.
Viewing NSX Manager DetailsYou can use the NSX Manager page to get a detailed overview of your NSX Manager available in vRealize Network Insight.
How to access the NSX Manager pageTo access this page, search for NSX Manager where SDDC Type = 'VMC' and in the search result list, click the NSX Manager page you want to view.
OverviewIn the NSX Manager page, you see the following section:
Using vRealize Network Insight
VMware, Inc. 220
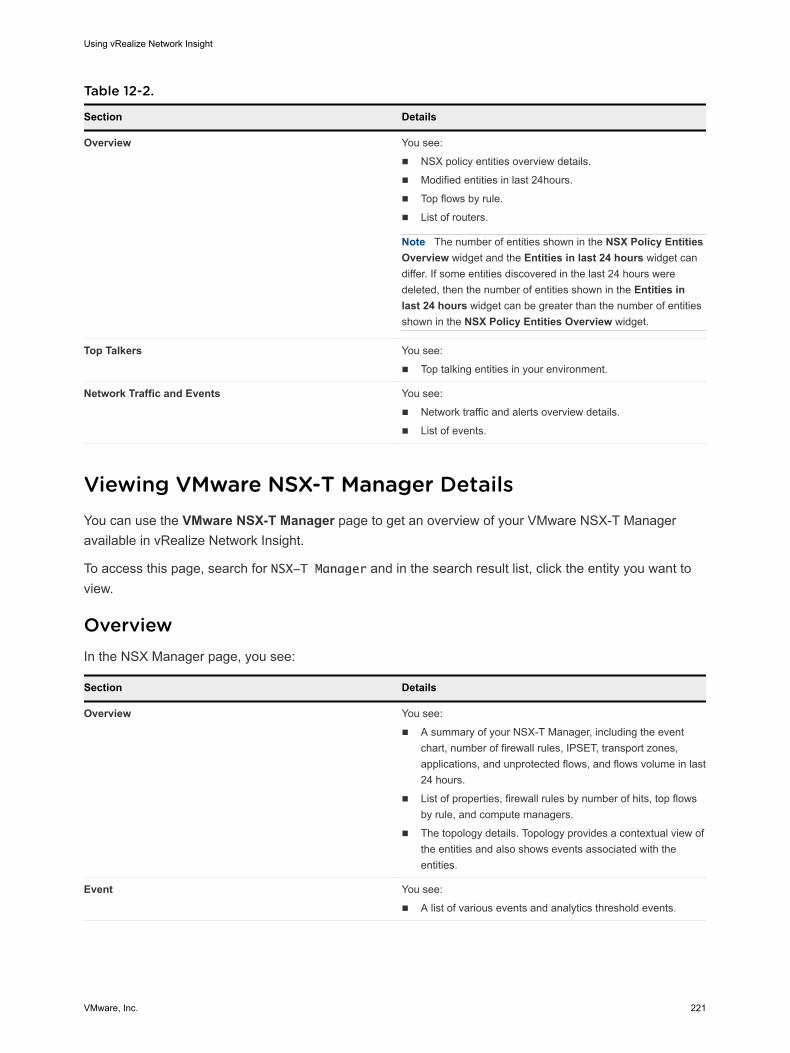
Table 12-2.
Section Details
Overview You see:
n NSX policy entities overview details.
n Modified entities in last 24hours.
n Top flows by rule.
n List of routers.
Note The number of entities shown in the NSX Policy Entities Overview widget and the Entities in last 24 hours widget can differ. If some entities discovered in the last 24 hours were deleted, then the number of entities shown in the Entities in last 24 hours widget can be greater than the number of entities shown in the NSX Policy Entities Overview widget.
Top Talkers You see:
n Top talking entities in your environment.
Network Traffic and Events You see:
n Network traffic and alerts overview details.
n List of events.
Viewing VMware NSX-T Manager DetailsYou can use the VMware NSX-T Manager page to get an overview of your VMware NSX-T Manager available in vRealize Network Insight.
To access this page, search for NSX-T Manager and in the search result list, click the entity you want to view.
OverviewIn the NSX Manager page, you see:
Section Details
Overview You see:
n A summary of your NSX-T Manager, including the event chart, number of firewall rules, IPSET, transport zones, applications, and unprotected flows, and flows volume in last 24 hours.
n List of properties, firewall rules by number of hits, top flows by rule, and compute managers.
n The topology details. Topology provides a contextual view of the entities and also shows events associated with the entities.
Event You see:
n A list of various events and analytics threshold events.
Using vRealize Network Insight
VMware, Inc. 221
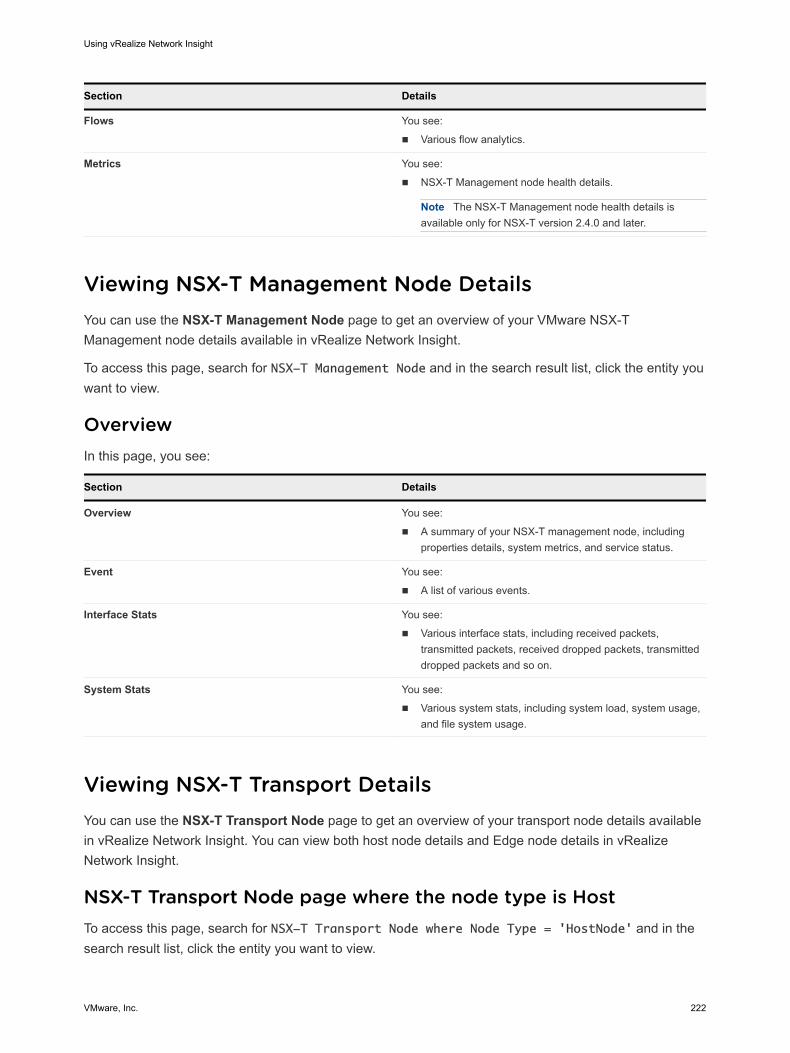
Section Details
Flows You see:
n Various flow analytics.
Metrics You see:
n NSX-T Management node health details.
Note The NSX-T Management node health details is available only for NSX-T version 2.4.0 and later.
Viewing NSX-T Management Node DetailsYou can use the NSX-T Management Node page to get an overview of your VMware NSX-T Management node details available in vRealize Network Insight.
To access this page, search for NSX-T Management Node and in the search result list, click the entity you want to view.
OverviewIn this page, you see:
Section Details
Overview You see:
n A summary of your NSX-T management node, including properties details, system metrics, and service status.
Event You see:
n A list of various events.
Interface Stats You see:
n Various interface stats, including received packets, transmitted packets, received dropped packets, transmitted dropped packets and so on.
System Stats You see:
n Various system stats, including system load, system usage, and file system usage.
Viewing NSX-T Transport DetailsYou can use the NSX-T Transport Node page to get an overview of your transport node details available in vRealize Network Insight. You can view both host node details and Edge node details in vRealize Network Insight.
NSX-T Transport Node page where the node type is HostTo access this page, search for NSX-T Transport Node where Node Type = 'HostNode' and in the search result list, click the entity you want to view.
Using vRealize Network Insight
VMware, Inc. 222
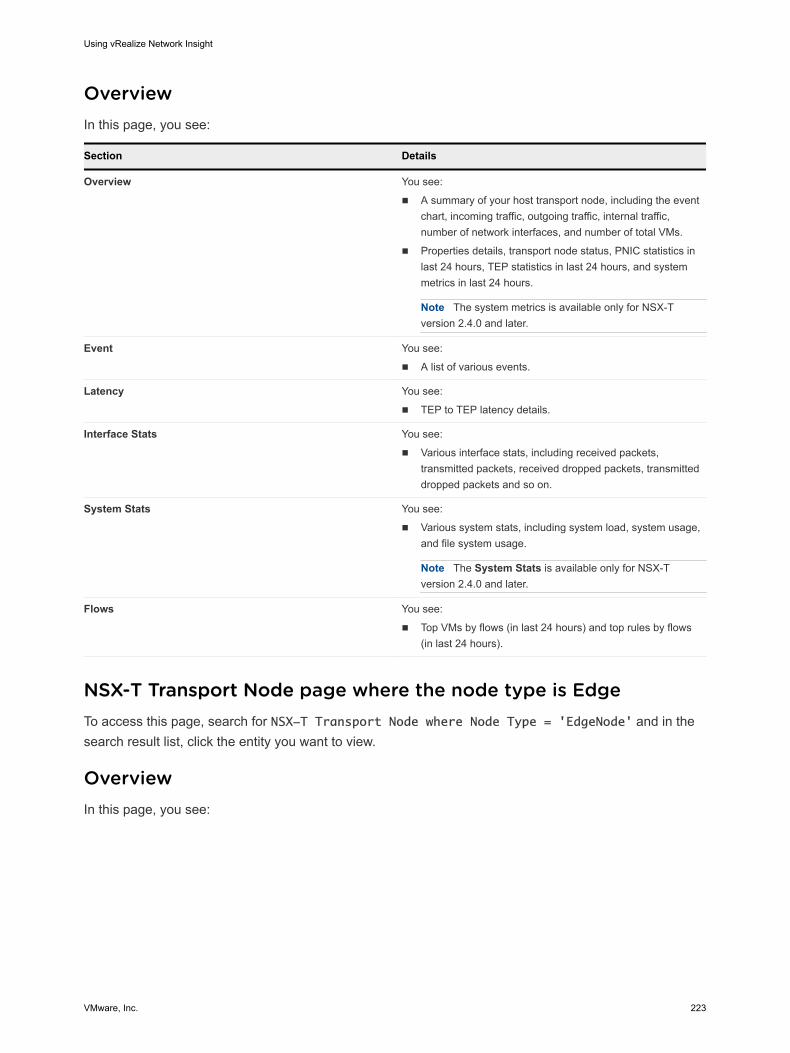
OverviewIn this page, you see:
Section Details
Overview You see:
n A summary of your host transport node, including the event chart, incoming traffic, outgoing traffic, internal traffic, number of network interfaces, and number of total VMs.
n Properties details, transport node status, PNIC statistics in last 24 hours, TEP statistics in last 24 hours, and system metrics in last 24 hours.
Note The system metrics is available only for NSX-T version 2.4.0 and later.
Event You see:
n A list of various events.
Latency You see:
n TEP to TEP latency details.
Interface Stats You see:
n Various interface stats, including received packets, transmitted packets, received dropped packets, transmitted dropped packets and so on.
System Stats You see:
n Various system stats, including system load, system usage, and file system usage.
Note The System Stats is available only for NSX-T version 2.4.0 and later.
Flows You see:
n Top VMs by flows (in last 24 hours) and top rules by flows (in last 24 hours).
NSX-T Transport Node page where the node type is EdgeTo access this page, search for NSX-T Transport Node where Node Type = 'EdgeNode' and in the search result list, click the entity you want to view.
OverviewIn this page, you see:
Using vRealize Network Insight
VMware, Inc. 223
Section Details
Overview You see:
n A summary of your Edge transport node, including the event chart, number of network interfaces, tier0 service routers, tier1 service routers, and routes.
n Properties details, transport node status, uplink statistics in last 24 hours, TEP statistics in last 24 hours, and system metrics in last 24 hours
Event You see:
n A list of various events.
NAT Stats You see:
n Various NAT stats, including NAT Rule Statistics, top NAT rules by total bytes, top NAT rules by total packets, and top NAT rules by session count.
Interface Stats You see:
n Various interface stats, including received packets, transmitted packets, received dropped packets, transmitted dropped packets and so on.
System Stats You see:
n Various system stats, including system load, system usage, and file system usage.
Viewing Virtual Server DetailsThe Virtual Server page includes the virtual server metrics, and the problem and change events.
You see,
n the list of all pool members in the virtual server and its details, along with an alert for any problem.
n the list of virtual machines
n the list of physical servers
n the list of problem events that are associated with the virtual server
n the list of metrics that are related to the virtual server, like
n connections (count, duration)
n network metrics (packets and bytes received or sent)
n CPU usage
Note For the list of supported NSX-V load balancer metrics, see Supported NSX-V Metrics.
n the top flows for the pool members used by the virtual server.
Note The flow information is not captured for NSX-V load balancer.
Using vRealize Network Insight
VMware, Inc. 224
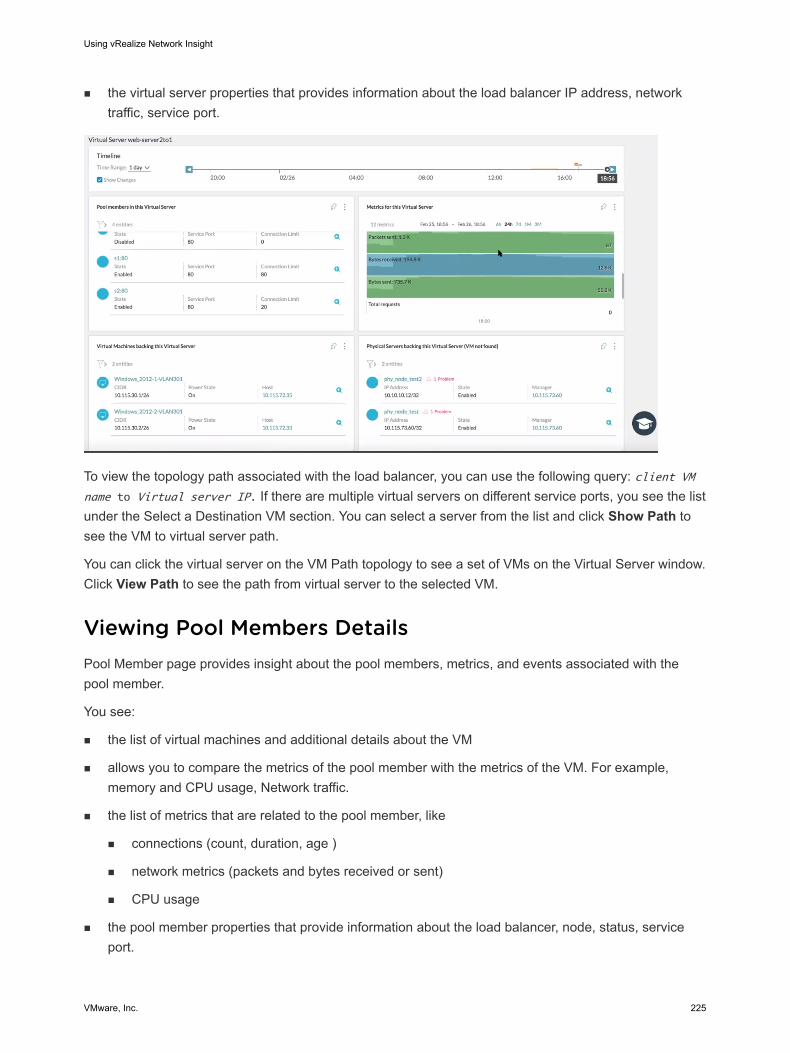
n the virtual server properties that provides information about the load balancer IP address, network traffic, service port.
To view the topology path associated with the load balancer, you can use the following query: client VM name to Virtual server IP. If there are multiple virtual servers on different service ports, you see the list under the Select a Destination VM section. You can select a server from the list and click Show Path to see the VM to virtual server path.
You can click the virtual server on the VM Path topology to see a set of VMs on the Virtual Server window. Click View Path to see the path from virtual server to the selected VM.
Viewing Pool Members DetailsPool Member page provides insight about the pool members, metrics, and events associated with the pool member.
You see:
n the list of virtual machines and additional details about the VM
n allows you to compare the metrics of the pool member with the metrics of the VM. For example, memory and CPU usage, Network traffic.
n the list of metrics that are related to the pool member, like
n connections (count, duration, age )
n network metrics (packets and bytes received or sent)
n CPU usage
n the pool member properties that provide information about the load balancer, node, status, service port.
Using vRealize Network Insight
VMware, Inc. 225
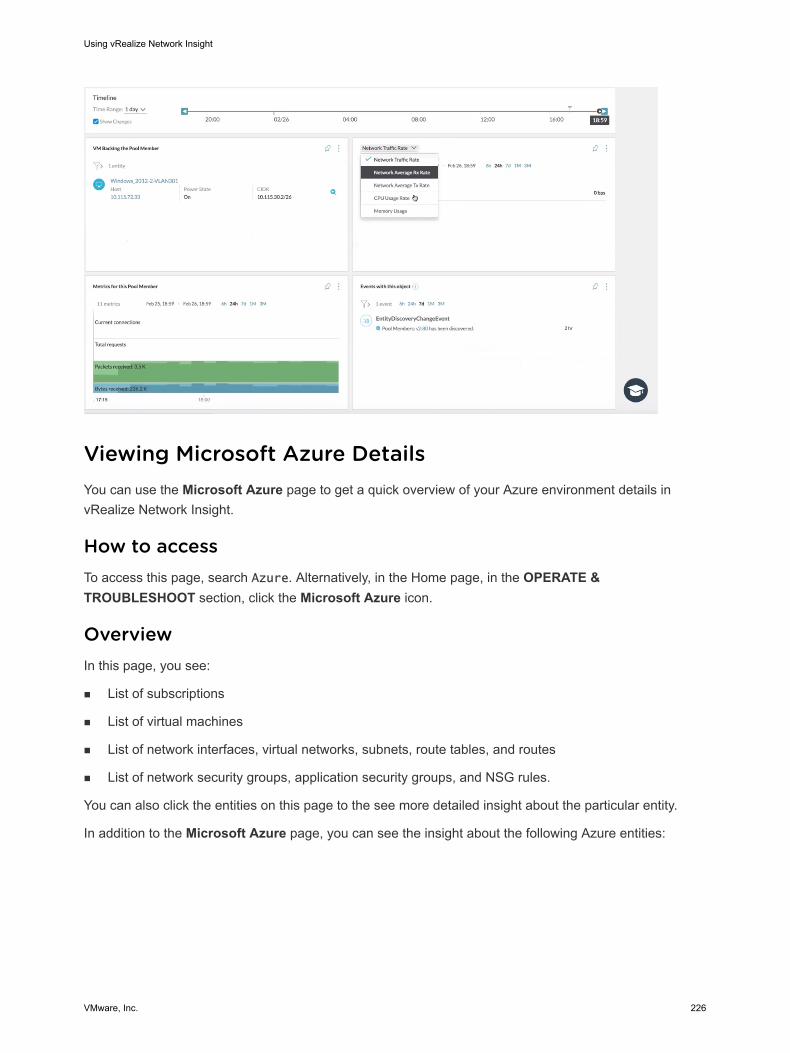
Viewing Microsoft Azure DetailsYou can use the Microsoft Azure page to get a quick overview of your Azure environment details in vRealize Network Insight.
How to accessTo access this page, search Azure. Alternatively, in the Home page, in the OPERATE & TROUBLESHOOT section, click the Microsoft Azure icon.
OverviewIn this page, you see:
n List of subscriptions
n List of virtual machines
n List of network interfaces, virtual networks, subnets, route tables, and routes
n List of network security groups, application security groups, and NSG rules.
You can also click the entities on this page to the see more detailed insight about the particular entity.
In addition to the Microsoft Azure page, you can see the insight about the following Azure entities:
Using vRealize Network Insight
VMware, Inc. 226
Table 12-3. Azure Entity details
Entity name Description
Azure Application Security Group You see:
n List of properties, events, associated VMs, and associated VMs for last 24 hours.
n List of incoming NSG rules and outgoing NSG rules.
n List of allowed flows, denied flows, flows for last 24 hours.
Azure Data Source You see:
n List of properties, events, and metrics.
Azure NSG Rules You see:
n List of properties, events, and metrics.
Azure Network Interface You see:
n List of properties, events, and metrics.
Azure Network Security Group You see:
n List of properties, events, NICs, and subnet.
n List of outbound rules and inbound rules.
n List of allowed flows, denied flows, flows for last 24 hours.
Azure Route You see:
n List of properties, events, and metrics.
Azure Route Table You see:
n List of properties, events, and metrics.
Azure Subnet You see:
n List of properties, events, VMs, NICs, and custom routes.
n List of NSG rules.
Azure Subscription You see:
n List of properties and events.
n List of virtual machines.
n List of NICs, virtual networks, and route table
n List of network security groups, application security groups, and NSG Rules.
Azure Virtual Machine You see:
n List of properties, events, NICs, associated Application Security Groups (ASGs).
n List of incoming NSG rules and outgoing NSG rules.
n List of allowed flows and denied flows.
Azure Virtual Network You see:
n List of properties, events, VMs, VMs created in last 24 hours, associated ASGs, associated ASGs for last 24 hours, subnets, and route tables.
n List of allowed flows, denied flows, and flows for last 24 hours.
Using vRealize Network Insight
VMware, Inc. 227
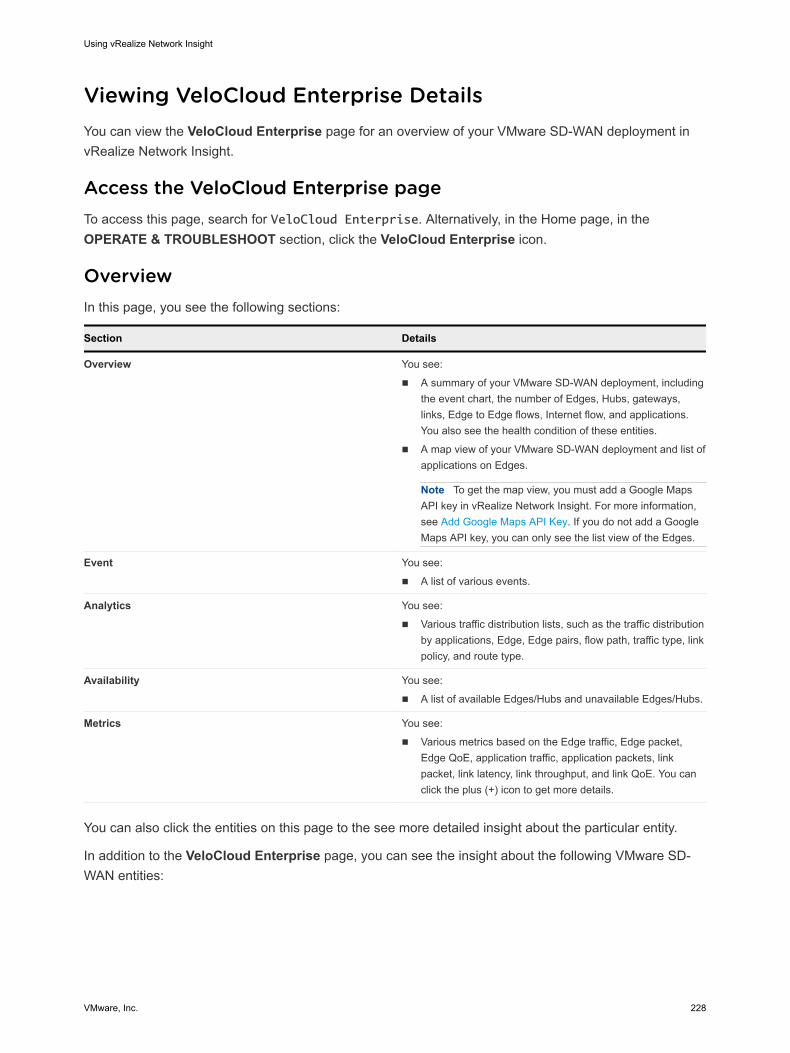
Viewing VeloCloud Enterprise DetailsYou can view the VeloCloud Enterprise page for an overview of your VMware SD-WAN deployment in vRealize Network Insight.
Access the VeloCloud Enterprise pageTo access this page, search for VeloCloud Enterprise. Alternatively, in the Home page, in the OPERATE & TROUBLESHOOT section, click the VeloCloud Enterprise icon.
OverviewIn this page, you see the following sections:
Section Details
Overview You see:
n A summary of your VMware SD-WAN deployment, including the event chart, the number of Edges, Hubs, gateways, links, Edge to Edge flows, Internet flow, and applications. You also see the health condition of these entities.
n A map view of your VMware SD-WAN deployment and list of applications on Edges.
Note To get the map view, you must add a Google Maps API key in vRealize Network Insight. For more information, see Add Google Maps API Key. If you do not add a Google Maps API key, you can only see the list view of the Edges.
Event You see:
n A list of various events.
Analytics You see:
n Various traffic distribution lists, such as the traffic distribution by applications, Edge, Edge pairs, flow path, traffic type, link policy, and route type.
Availability You see:
n A list of available Edges/Hubs and unavailable Edges/Hubs.
Metrics You see:
n Various metrics based on the Edge traffic, Edge packet, Edge QoE, application traffic, application packets, link packet, link latency, link throughput, and link QoE. You can click the plus (+) icon to get more details.
You can also click the entities on this page to the see more detailed insight about the particular entity.
In addition to the VeloCloud Enterprise page, you can see the insight about the following VMware SD-WAN entities:
Using vRealize Network Insight
VMware, Inc. 228
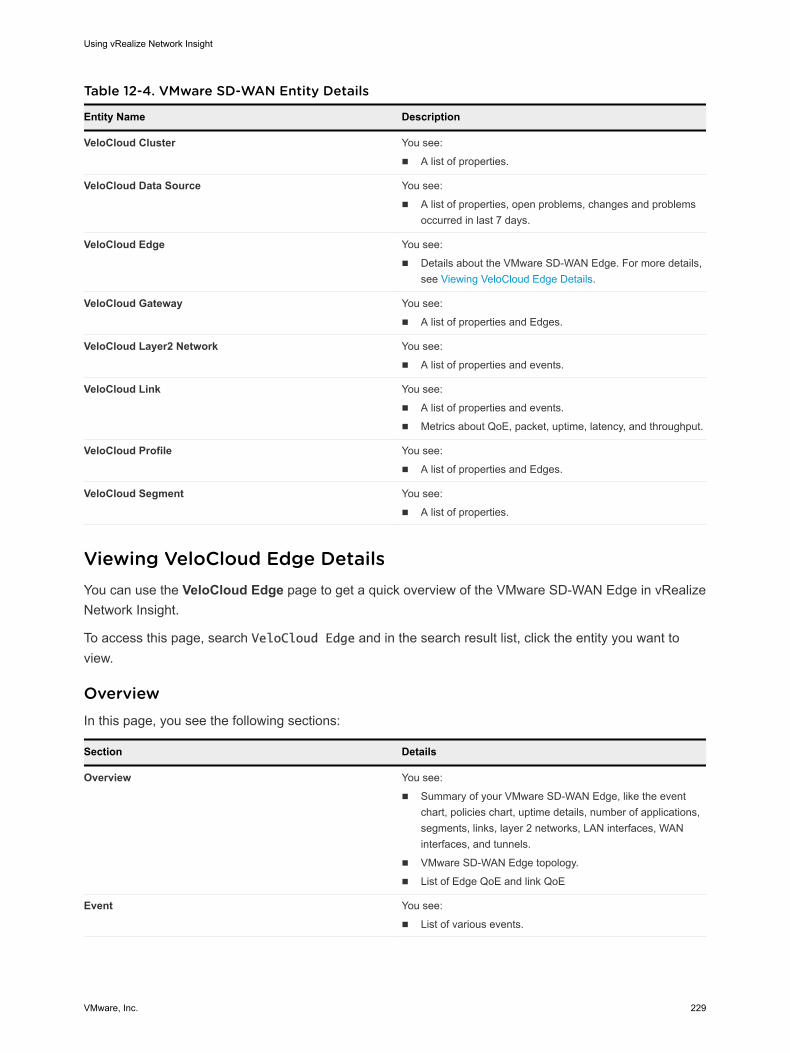
Table 12-4. VMware SD-WAN Entity Details
Entity Name Description
VeloCloud Cluster You see:
n A list of properties.
VeloCloud Data Source You see:
n A list of properties, open problems, changes and problems occurred in last 7 days.
VeloCloud Edge You see:
n Details about the VMware SD-WAN Edge. For more details, see Viewing VeloCloud Edge Details.
VeloCloud Gateway You see:
n A list of properties and Edges.
VeloCloud Layer2 Network You see:
n A list of properties and events.
VeloCloud Link You see:
n A list of properties and events.
n Metrics about QoE, packet, uptime, latency, and throughput.
VeloCloud Profile You see:
n A list of properties and Edges.
VeloCloud Segment You see:
n A list of properties.
Viewing VeloCloud Edge DetailsYou can use the VeloCloud Edge page to get a quick overview of the VMware SD-WAN Edge in vRealize Network Insight.
To access this page, search VeloCloud Edge and in the search result list, click the entity you want to view.
OverviewIn this page, you see the following sections:
Section Details
Overview You see:
n Summary of your VMware SD-WAN Edge, like the event chart, policies chart, uptime details, number of applications, segments, links, layer 2 networks, LAN interfaces, WAN interfaces, and tunnels.
n VMware SD-WAN Edge topology.
n List of Edge QoE and link QoE
Event You see:
n List of various events.
Using vRealize Network Insight
VMware, Inc. 229
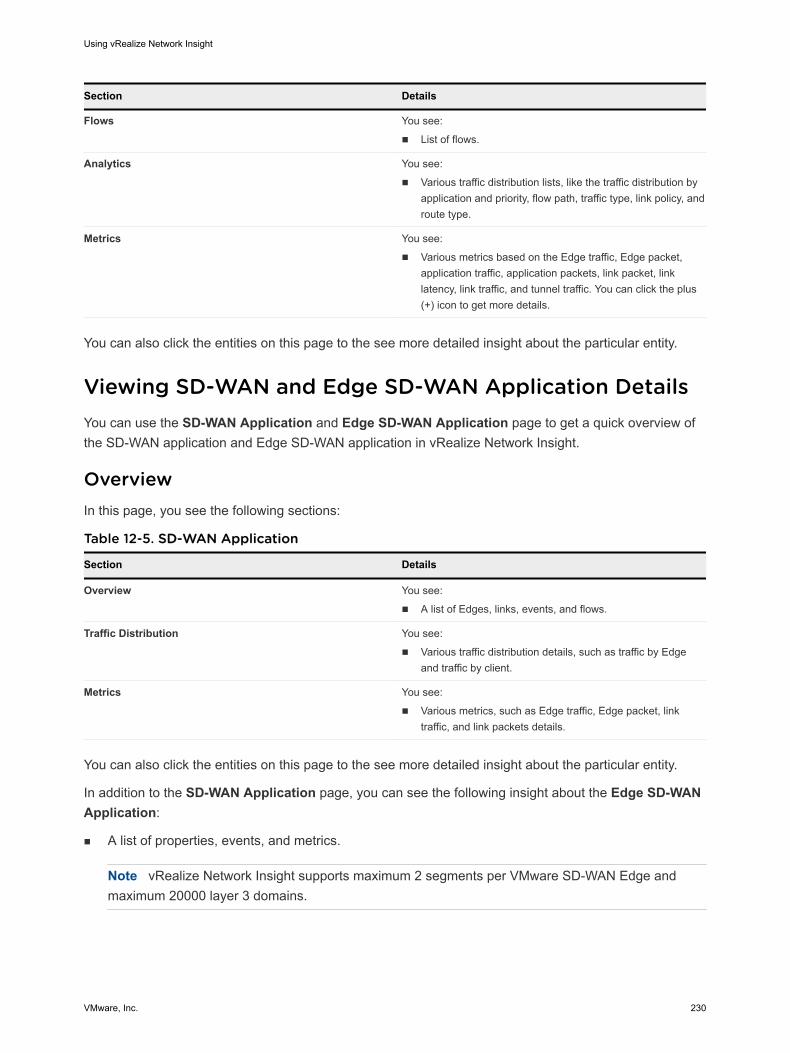
Section Details
Flows You see:
n List of flows.
Analytics You see:
n Various traffic distribution lists, like the traffic distribution by application and priority, flow path, traffic type, link policy, and route type.
Metrics You see:
n Various metrics based on the Edge traffic, Edge packet, application traffic, application packets, link packet, link latency, link traffic, and tunnel traffic. You can click the plus (+) icon to get more details.
You can also click the entities on this page to the see more detailed insight about the particular entity.
Viewing SD-WAN and Edge SD-WAN Application DetailsYou can use the SD-WAN Application and Edge SD-WAN Application page to get a quick overview of the SD-WAN application and Edge SD-WAN application in vRealize Network Insight.
OverviewIn this page, you see the following sections:
Table 12-5. SD-WAN Application
Section Details
Overview You see:
n A list of Edges, links, events, and flows.
Traffic Distribution You see:
n Various traffic distribution details, such as traffic by Edge and traffic by client.
Metrics You see:
n Various metrics, such as Edge traffic, Edge packet, link traffic, and link packets details.
You can also click the entities on this page to the see more detailed insight about the particular entity.
In addition to the SD-WAN Application page, you can see the following insight about the Edge SD-WAN Application:
n A list of properties, events, and metrics.
Note vRealize Network Insight supports maximum 2 segments per VMware SD-WAN Edge and maximum 20000 layer 3 domains.
Using vRealize Network Insight
VMware, Inc. 230
Viewing SD-WAN Assessment DetailsYou can view the SD-WAN Assessment page to get an overview of your WAN deployment details. You can also get a ROI assessment report to understand the nature of your traffic and to get a recommendation for the SD-WAN deployment. vRealize Network Insight
How to access the SD-WAN Assessment page?To access this page, in the left navigation pane, click Plan & Assess > SD-WAN Assessment.
OverviewIn this page you see, SD-WAN assessment report summary, egress and ingress traffic data, and top services for egress and ingress traffic.
You can change the scope and duration of the assessment. To change the scope and duration of the assessment, from the Scope and the Duration drop-down menu, select the scope and duration you want use and click Analyze.
You can also generate an SD-WAN assessment report. For details see, Generate Assessment Report.
Generate Assessment ReportIn vRealize Network Insight, you can generate an SD-WAN assessment report to get an estimate of the cost saving that VMware SD-WAN can provide over the traditional WAN setup. Additionally, SD-WAN assessment report also provides SD-WAN Edge recommendation for each of your site.
Procedure
1 In the SD-WAN Assessment page, click GENERATE REPORT.
You see the Additional Data dialog box.
2 In the Organization name text box, enter the organization name for which you want to generate the report.
3 In the Region specific inputs table, verify the region specific inputs and click GENERATE REPORT.
You can change the region specific inputs as per your requirement. You can click RESET to get the default values for region specific inputs.
Results
In a new tab, you can see the SD-WAN Assessment report.
Viewing VeloCloud Link Application DetailsYou can use the VeloCloud Link Application page to get an overview of your application on a link.
To access this page, search for SD-WAN Link Application and in the search result list, click the entity you want to view.
Using vRealize Network Insight
VMware, Inc. 231
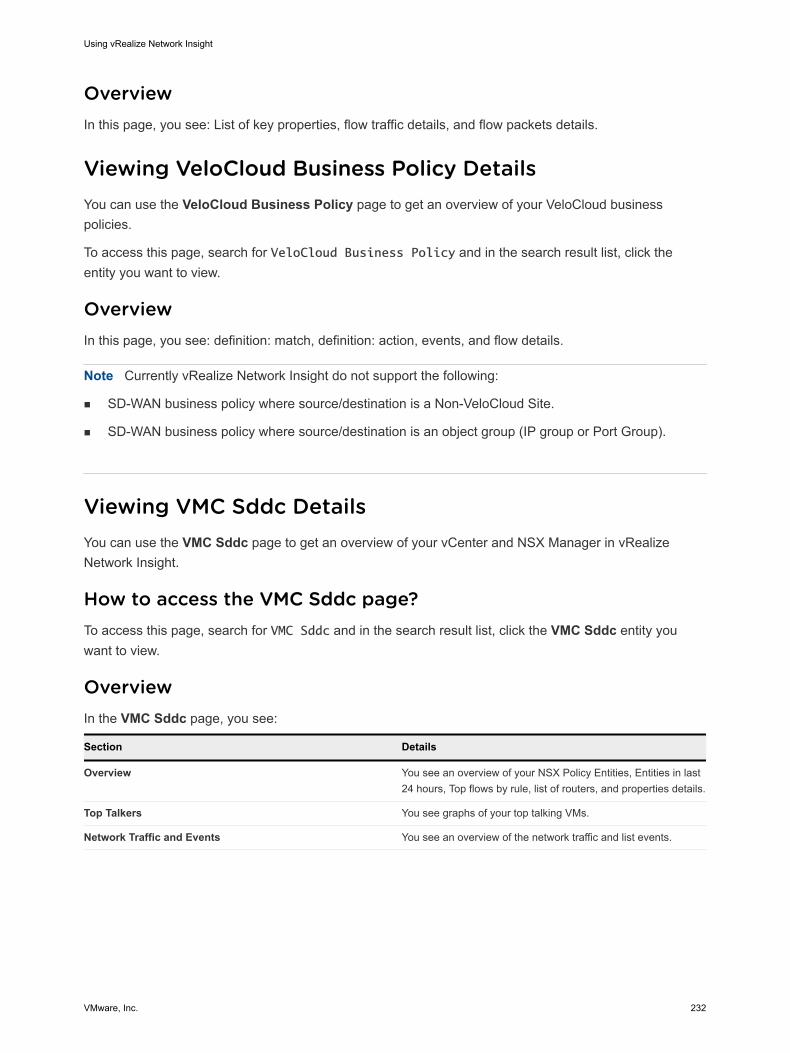
OverviewIn this page, you see: List of key properties, flow traffic details, and flow packets details.
Viewing VeloCloud Business Policy DetailsYou can use the VeloCloud Business Policy page to get an overview of your VeloCloud business policies.
To access this page, search for VeloCloud Business Policy and in the search result list, click the entity you want to view.
OverviewIn this page, you see: definition: match, definition: action, events, and flow details.
Note Currently vRealize Network Insight do not support the following:
n SD-WAN business policy where source/destination is a Non-VeloCloud Site.
n SD-WAN business policy where source/destination is an object group (IP group or Port Group).
Viewing VMC Sddc DetailsYou can use the VMC Sddc page to get an overview of your vCenter and NSX Manager in vRealize Network Insight.
How to access the VMC Sddc page?To access this page, search for VMC Sddc and in the search result list, click the VMC Sddc entity you want to view.
OverviewIn the VMC Sddc page, you see:
Section Details
Overview You see an overview of your NSX Policy Entities, Entities in last 24 hours, Top flows by rule, list of routers, and properties details.
Top Talkers You see graphs of your top talking VMs.
Network Traffic and Events You see an overview of the network traffic and list events.
Using vRealize Network Insight
VMware, Inc. 232
Viewing Arista Hardware Gateway and Arista Hardware Gateway Binding DetailsYou can view the Arista Hardware Gateway and Arista Hardware Gateway Binding page to get an overview of your Arista Hardware Gateways.
How to access the Arista Hardware Gateway page?To access the Arista Hardware Gateway page, search for Arista Hardware VTEP and in the search result list, click the entity you want to view.
To access the Arista Hardware Gateway Binding page, search for Arista Hardware Gateway Binding and in the search result list, click the entity you want to view.
OverviewIn the Arista Hardware Gateway page, you see:
n List of events
n List of key properties
n List of Arista hardware gateway bindings.
In the Arista Hardware Gateway Binding page, you see:
n List of events
n List of properties.
Viewing Flow Insight DetailsThe Flow Insight page provides an insight into data centers, devices, and flows. It is a context-based page as it performs analysis based on the entities, flows, and the time range that you select.
To access the Flow Insight page, do the following:
1 In the left navigation pane, click Analytics > Flow Insights.
2 Select the Scope and Duration.
3 Click Analyze.
Alternatively, you can search for Flows and in the search result page, click Flow Insight.
The various sections in the Flow Analytics Dashboard are:
n Top Talkers
n What's New
n Network Performance
n Outliers
Using vRealize Network Insight
VMware, Inc. 233
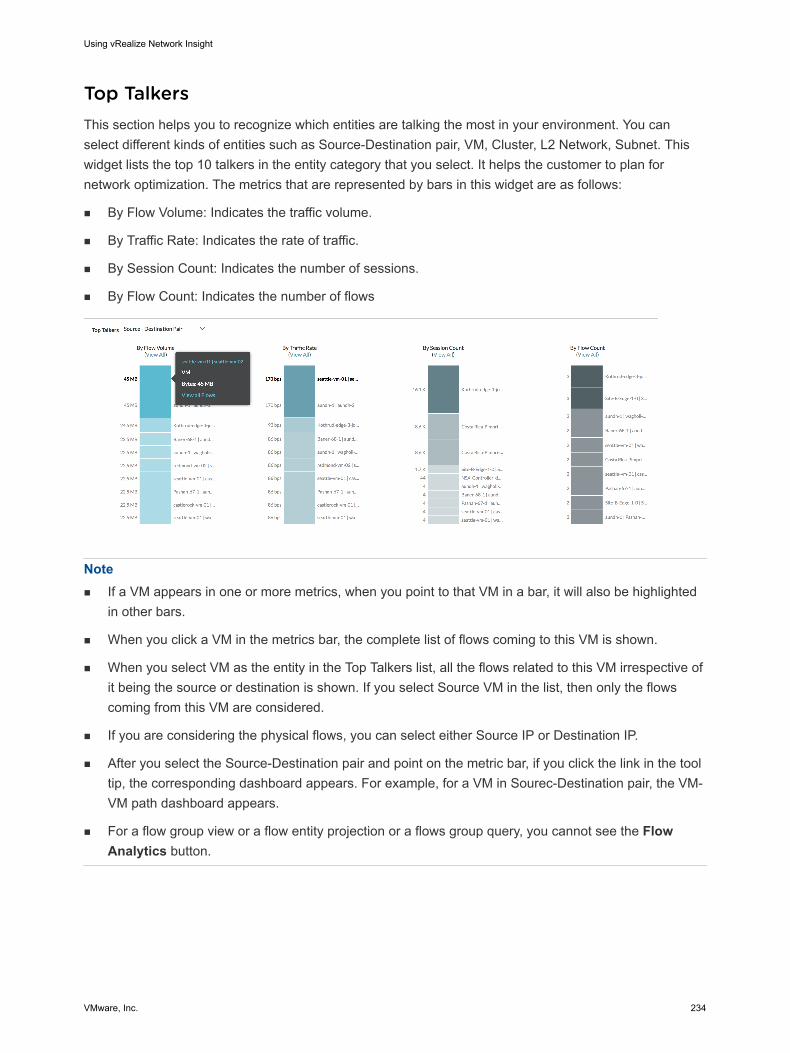
Top TalkersThis section helps you to recognize which entities are talking the most in your environment. You can select different kinds of entities such as Source-Destination pair, VM, Cluster, L2 Network, Subnet. This widget lists the top 10 talkers in the entity category that you select. It helps the customer to plan for network optimization. The metrics that are represented by bars in this widget are as follows:
n By Flow Volume: Indicates the traffic volume.
n By Traffic Rate: Indicates the rate of traffic.
n By Session Count: Indicates the number of sessions.
n By Flow Count: Indicates the number of flows
Note n If a VM appears in one or more metrics, when you point to that VM in a bar, it will also be highlighted
in other bars.
n When you click a VM in the metrics bar, the complete list of flows coming to this VM is shown.
n When you select VM as the entity in the Top Talkers list, all the flows related to this VM irrespective of it being the source or destination is shown. If you select Source VM in the list, then only the flows coming from this VM are considered.
n If you are considering the physical flows, you can select either Source IP or Destination IP.
n After you select the Source-Destination pair and point on the metric bar, if you click the link in the tool tip, the corresponding dashboard appears. For example, for a VM in Sourec-Destination pair, the VM-VM path dashboard appears.
n For a flow group view or a flow entity projection or a flows group query, you cannot see the Flow Analytics button.
Using vRealize Network Insight
VMware, Inc. 234
What's NewThis section helps you to track what services and entities are discovered in the data center in the selected time range. The widget in this section are as follows:
n New Virtual Machines Accessing Internet: Lists the new VMs that access Internet.
n New Internet Services Accessed: Lists the new Internet services discovered in the environment.
n New Internal Services Accessed: Lists the new intranet services that are discovered and accessed from the Internet endpoint.
n New Internal/E-W Services Accessed: Lists the services that are exposed and accessed by the machines within a data center
n New Services with Blocked Flows: Lists services that have blocked flows. This section is populated only for IPFIX.
n New Firewall Rule Hits: Lists the new firewall rules that are brought into effect. This section is populated only for IPFIX.
Network PerformanceIn this section, you can find and visualize the abnormal flows for the various ranges of TCP Round Trip Time (RTT) values based on the selected criteria.
Note vRealize Network Insight shows average TCP RTT metrics at 5 minutes granularity for last 24 hours only.
If the flow deviation percentage is 100 percent and absolute deviation is 20 milliseconds (ms), then vRealize Network Insight considers that flow as an abnormal flow.
In the visualization, the left side shows the different range of TCP RTT and the right sides shows the normal and abnormal deviation range. Based on the values of percentage deviation and absolute deviation, flows are connected from left (TCP RTT) to right (DEVIATION). You can analyze the following types of flows:
n Inter-Host
n Intra-Host
n Internet
n All Flows
You can also change the percent deviation and absolute deviation based on your requirement.
In the following example, there are two different ranges of TCP RTT, one is less than equal to 30 ms and the other is 30-120 ms. You can find there are total 151 flows comes under the less than equal to 30 ms TCP RTT range. Out of the 151 flows, 9 flows are shown as an abnormal flow.
Using vRealize Network Insight
VMware, Inc. 235
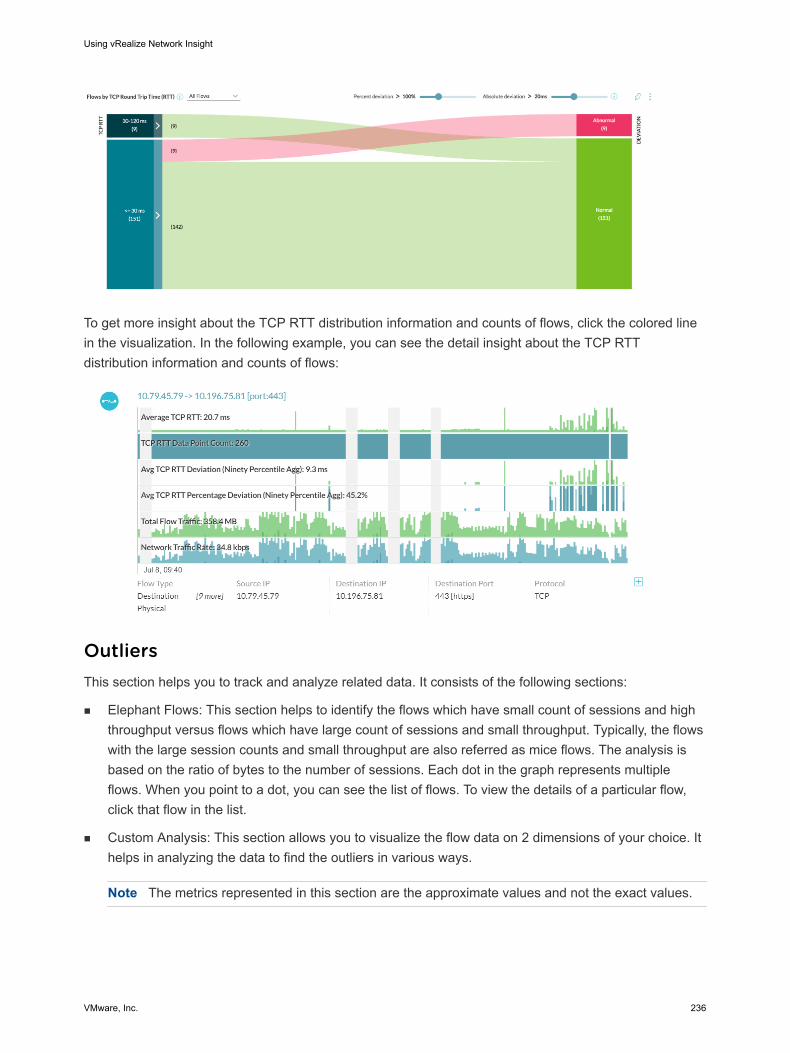
To get more insight about the TCP RTT distribution information and counts of flows, click the colored line in the visualization. In the following example, you can see the detail insight about the TCP RTT distribution information and counts of flows:
OutliersThis section helps you to track and analyze related data. It consists of the following sections:
n Elephant Flows: This section helps to identify the flows which have small count of sessions and high throughput versus flows which have large count of sessions and small throughput. Typically, the flows with the large session counts and small throughput are also referred as mice flows. The analysis is based on the ratio of bytes to the number of sessions. Each dot in the graph represents multiple flows. When you point to a dot, you can see the list of flows. To view the details of a particular flow, click that flow in the list.
n Custom Analysis: This section allows you to visualize the flow data on 2 dimensions of your choice. It helps in analyzing the data to find the outliers in various ways.
Note The metrics represented in this section are the approximate values and not the exact values.
Using vRealize Network Insight
VMware, Inc. 236
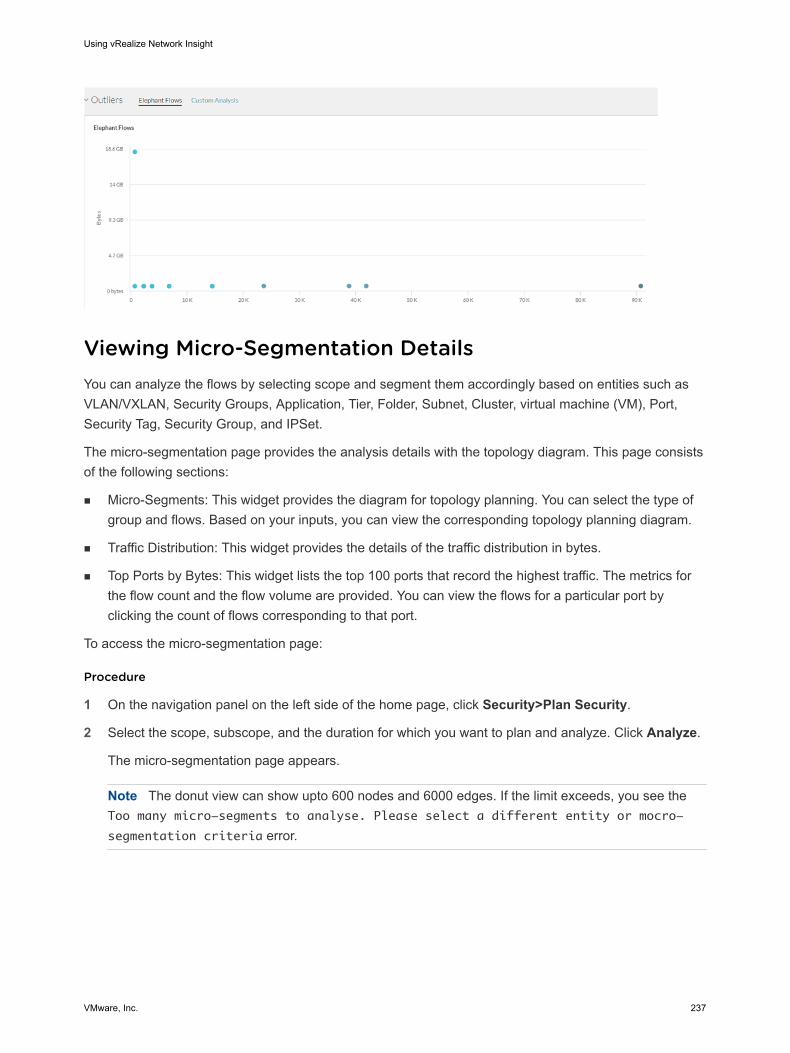
Viewing Micro-Segmentation DetailsYou can analyze the flows by selecting scope and segment them accordingly based on entities such as VLAN/VXLAN, Security Groups, Application, Tier, Folder, Subnet, Cluster, virtual machine (VM), Port, Security Tag, Security Group, and IPSet.
The micro-segmentation page provides the analysis details with the topology diagram. This page consists of the following sections:
n Micro-Segments: This widget provides the diagram for topology planning. You can select the type of group and flows. Based on your inputs, you can view the corresponding topology planning diagram.
n Traffic Distribution: This widget provides the details of the traffic distribution in bytes.
n Top Ports by Bytes: This widget lists the top 100 ports that record the highest traffic. The metrics for the flow count and the flow volume are provided. You can view the flows for a particular port by clicking the count of flows corresponding to that port.
To access the micro-segmentation page:
Procedure
1 On the navigation panel on the left side of the home page, click Security>Plan Security.
2 Select the scope, subscope, and the duration for which you want to plan and analyze. Click Analyze.
The micro-segmentation page appears.
Note The donut view can show upto 600 nodes and 6000 edges. If the limit exceeds, you see the Too many micro-segments to analyse. Please select a different entity or mocro-
segmentation criteria error.
Using vRealize Network Insight
VMware, Inc. 237
Viewing Application DetailsAn application is a collection of tiers. Each tier in an application is a collection of VMs and physical IPs based on the user-defined filter criteria. The applications allow you to create a group of tiers and visualize traffic or flows between the tiers of the same application and between applications.
You can create or add an application into vRealize Network Insight in three ways:
n Create an Application Manually
n Public API
n Application Discovery
Application page provides complete visibility of a single application in vRealize Network Insight. This enables you to troubleshoot problems and also view the analytics.
n An Overview
n the application topology
n Tier Overview
n List of VMs in the applications
n the physical IPs that the application depends or uses
n Shared services
n Applications with which this particular application is talking to
n Events related to the applications
n application VMs Manager
n What's New in last 24 hours
n Incoming and ougoing traffic count
n Dropped flows
n New and unprotected members
n External accessed services
n Internet accessed services
n Used application ports
n Traffic flows or flow analytics
n Top Talkers
n Top application flows by rule
n Micro-segmentation
n Contextual flows between entities, which provides data of different flow types like all allowed flows, and dropped flows, protected and unprotected flows by NSX DFW.
Using vRealize Network Insight
VMware, Inc. 238
n What's New in an application
n Metrics
n the VM metric information that represents network rate, CPU, memory and disk information.
n the Kubernetes metrics
Analytics - Outlier Detection
vRealize Network Insight offers outlier detection based on the metrics associated with the flows defined over the VMs and physical IP addresses. These VMs/IPs should have similar traffic patterns so that a classification of a particular VM/IP as an outlier is of value. For example, the VMs, which belong to the same tier of an application, generally perform the same function for the application, such as the VMs of an SQL database serving requests for a web application. For these kind of VMs, the number of requests received, the amount of traffic sent out, the session count, and so on go through a series of similar variations.
Through outlier detection, vRealize Network Insight enables you to detect a particular VM which might be experiencing very different traffic pattern compared to other VMs/IPs in the group. For example, if the VM is sending or receiving much higher/lower traffic compared to the rest of the group. It could be because of a wrongly configured load balancer, DDOS attack, and so on. vRealize Network Insight classifies such VMs/IPs as outliers. By looking at these outliers, the user easily knows about this unexpected behaviour and takes appropriate actions.
How to Detect the Outlier VMs
Procedure
1 On the sidebar, click Analytics. Click Outlier.
2 Click Add to add a configuration.
Using vRealize Network Insight
VMware, Inc. 239
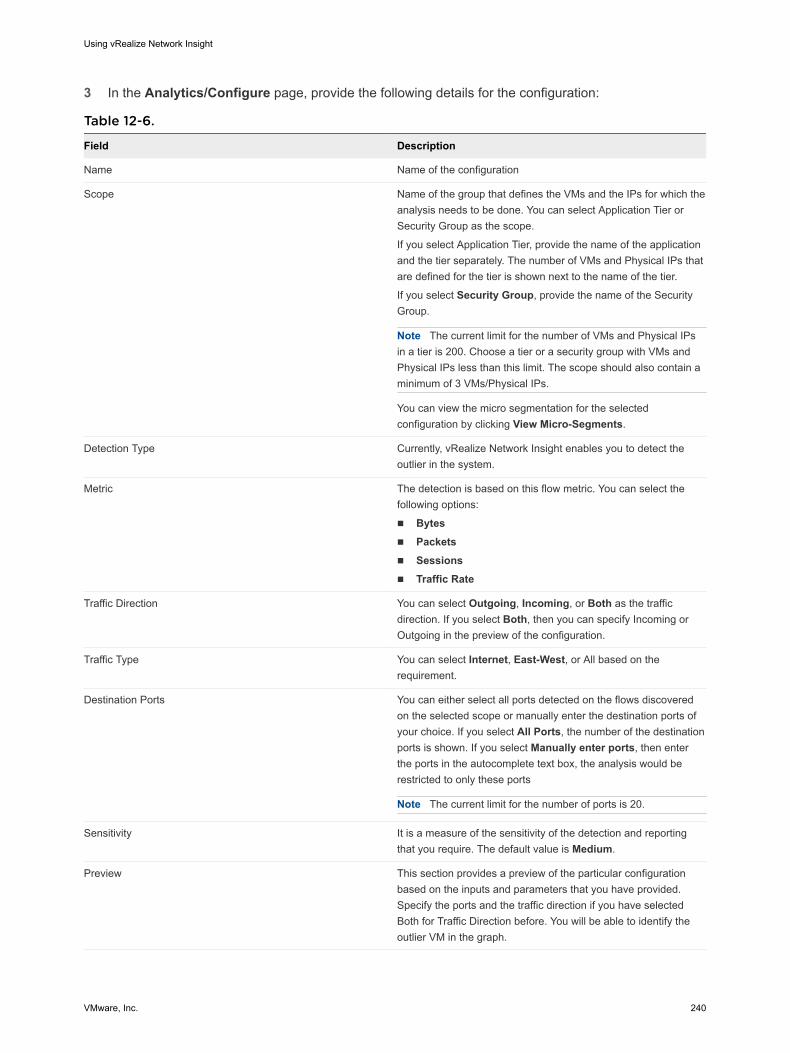
3 In the Analytics/Configure page, provide the following details for the configuration:
Table 12-6.
Field Description
Name Name of the configuration
Scope Name of the group that defines the VMs and the IPs for which the analysis needs to be done. You can select Application Tier or Security Group as the scope.
If you select Application Tier, provide the name of the application and the tier separately. The number of VMs and Physical IPs that are defined for the tier is shown next to the name of the tier.
If you select Security Group, provide the name of the Security Group.
Note The current limit for the number of VMs and Physical IPs in a tier is 200. Choose a tier or a security group with VMs and Physical IPs less than this limit. The scope should also contain a minimum of 3 VMs/Physical IPs.
You can view the micro segmentation for the selected configuration by clicking View Micro-Segments.
Detection Type Currently, vRealize Network Insight enables you to detect the outlier in the system.
Metric The detection is based on this flow metric. You can select the following options:
n Bytesn Packetsn Sessionsn Traffic Rate
Traffic Direction You can select Outgoing, Incoming, or Both as the traffic direction. If you select Both, then you can specify Incoming or Outgoing in the preview of the configuration.
Traffic Type You can select Internet, East-West, or All based on the requirement.
Destination Ports You can either select all ports detected on the flows discovered on the selected scope or manually enter the destination ports of your choice. If you select All Ports, the number of the destination ports is shown. If you select Manually enter ports, then enter the ports in the autocomplete text box, the analysis would be restricted to only these ports
Note The current limit for the number of ports is 20.
Sensitivity It is a measure of the sensitivity of the detection and reporting that you require. The default value is Medium.
Preview This section provides a preview of the particular configuration based on the inputs and parameters that you have provided. Specify the ports and the traffic direction if you have selected Both for Traffic Direction before. You will be able to identify the outlier VM in the graph.
Using vRealize Network Insight
VMware, Inc. 240
Note n The outlier is detected by evaluating the data available in last 24 hours.
n You need a continuous flow of IPFIX data to detect the outlier.
4 Click Submit to create the analytics configuration.
5 Once the application is created, it is available in the list view of the applications in the Analytics Configurations page. Click that particular application to see a dashboard associated with it.
Analytics: Static and Dynamic Thresholds
vRealize Network Insight enables you to set and configure thresholds and receive alerts based on aberrations in the behavior of the entities. You can configure two types of thresholds:
n Static Threshold: If a particular metric value goes beyond or below the configured value, then a static-threshold-based alert is generated.
n Dynamic Threshold: If the threshold is determined by the system based on the analysis of the historical data, an alert is generated in case this threshold is violated. The data is analyzed for a period of 7 days before any alert is generated. The process of creating a baseline is restricted to 21 days of the historic data and the older metric values are not considered to create a baseline for the new metric values.
The alert is generated immediately after a threshold is violated. The enterprise license users can view the number of Threshold Violations in the What's Happening section of the Home page. To view the event details, click on the Threshold Violations number. If there are no threshold configurations present in the system, then the What's Happening section shows the +Configure link. You can click the +Configure link to configure the threshold.
Configure Thresholds and AlertsYou can add a threshold configuration and gets alerts for the configured threshold.
To configure the analytics-associated thresholds and alerts:
Procedure
1 On the Home page, in the left navigation panel, click Analytics > Thresholds > Add.
Threshold - Add configuration page opens.
2 In the Name text box, enter a unique name for the configuration.
3 From the Scope drop-down menu, select a scope, and in the Select criteria text box, enter a criteria.
The Scope drop-down consists of the Virtual Machines, Flows, Application, SD-WAN Link, SD-WAN Edge, and SD-WAN Edge Application entities. The scope is based on the search query system. You can create a query from the available suggestions as per your requirements.
Using vRealize Network Insight
VMware, Inc. 241
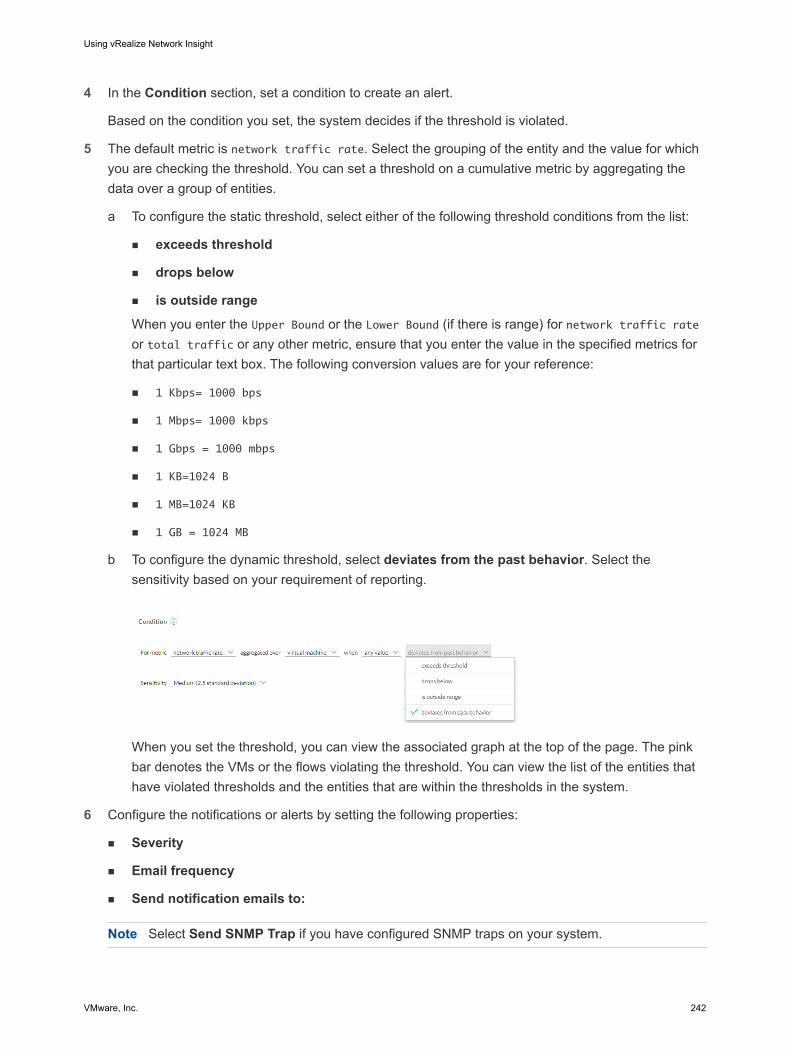
4 In the Condition section, set a condition to create an alert.
Based on the condition you set, the system decides if the threshold is violated.
5 The default metric is network traffic rate. Select the grouping of the entity and the value for which you are checking the threshold. You can set a threshold on a cumulative metric by aggregating the data over a group of entities.
a To configure the static threshold, select either of the following threshold conditions from the list:
n exceeds threshold
n drops below
n is outside range
When you enter the Upper Bound or the Lower Bound (if there is range) for network traffic rate or total traffic or any other metric, ensure that you enter the value in the specified metrics for that particular text box. The following conversion values are for your reference:
n 1 Kbps= 1000 bps
n 1 Mbps= 1000 kbps
n 1 Gbps = 1000 mbps
n 1 KB=1024 B
n 1 MB=1024 KB
n 1 GB = 1024 MB
b To configure the dynamic threshold, select deviates from the past behavior. Select the sensitivity based on your requirement of reporting.
When you set the threshold, you can view the associated graph at the top of the page. The pink bar denotes the VMs or the flows violating the threshold. You can view the list of the entities that have violated thresholds and the entities that are within the thresholds in the system.
6 Configure the notifications or alerts by setting the following properties:
n Severity
n Email frequency
n Send notification emails to:
Note Select Send SNMP Trap if you have configured SNMP traps on your system.
Using vRealize Network Insight
VMware, Inc. 242
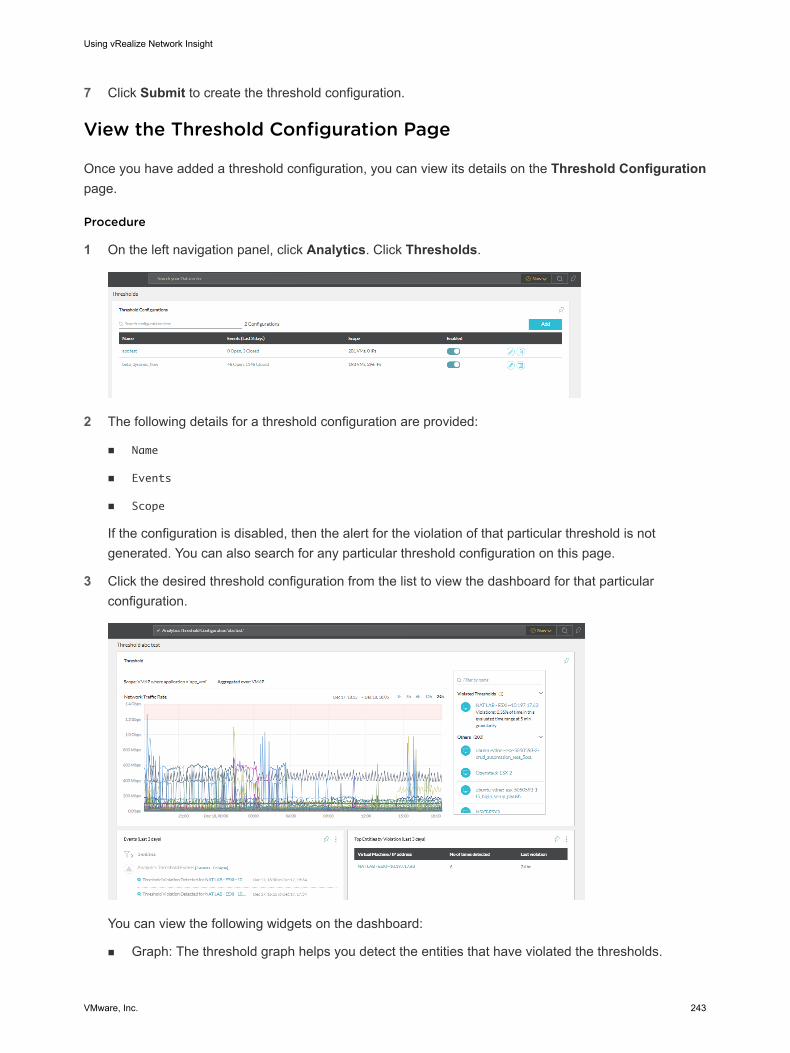
7 Click Submit to create the threshold configuration.
View the Threshold Configuration Page
Once you have added a threshold configuration, you can view its details on the Threshold Configuration page.
Procedure
1 On the left navigation panel, click Analytics. Click Thresholds.
2 The following details for a threshold configuration are provided:
n Name
n Events
n Scope
If the configuration is disabled, then the alert for the violation of that particular threshold is not generated. You can also search for any particular threshold configuration on this page.
3 Click the desired threshold configuration from the list to view the dashboard for that particular configuration.
You can view the following widgets on the dashboard:
n Graph: The threshold graph helps you detect the entities that have violated the thresholds.
Using vRealize Network Insight
VMware, Inc. 243
n Events: This widget provides the list of events that have been generated for violated thresholds for the last three days.
n Top Entities by Violation: This widget lets you know the top entities that have been the cause of aberrations for the last three days.
Using vRealize Network Insight
VMware, Inc. 244
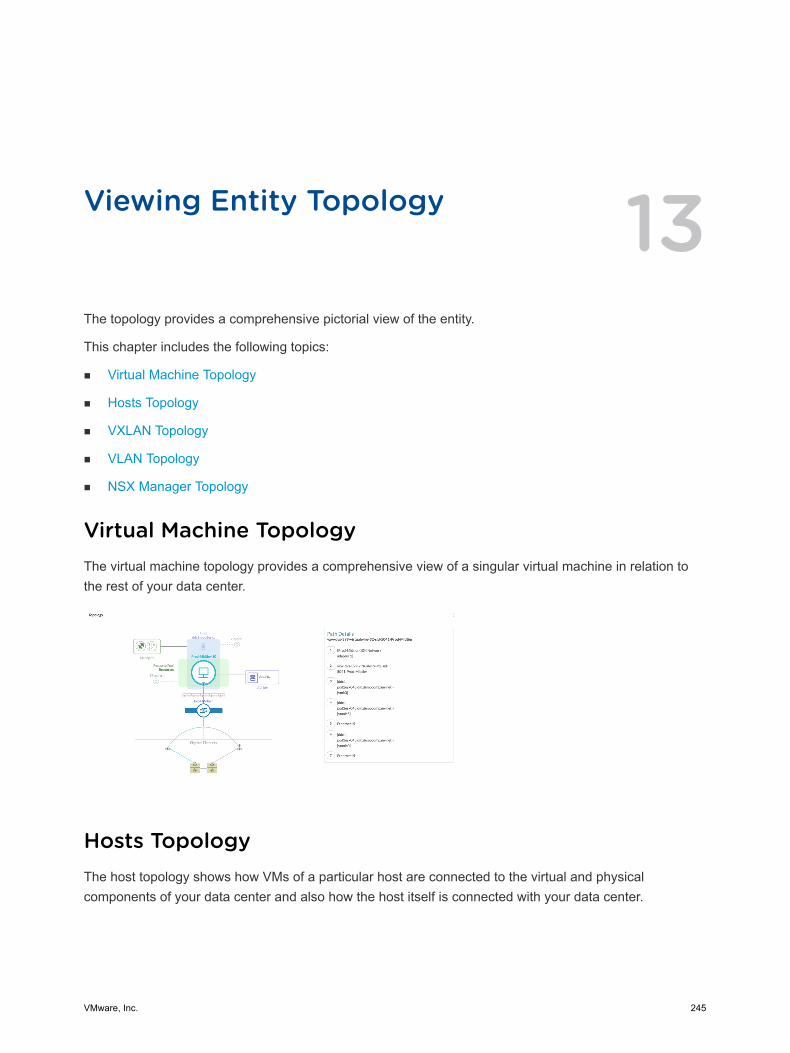
Viewing Entity Topology 13The topology provides a comprehensive pictorial view of the entity.
This chapter includes the following topics:
n Virtual Machine Topology
n Hosts Topology
n VXLAN Topology
n VLAN Topology
n NSX Manager Topology
Virtual Machine TopologyThe virtual machine topology provides a comprehensive view of a singular virtual machine in relation to the rest of your data center.
Hosts TopologyThe host topology shows how VMs of a particular host are connected to the virtual and physical components of your data center and also how the host itself is connected with your data center.
VMware, Inc. 245
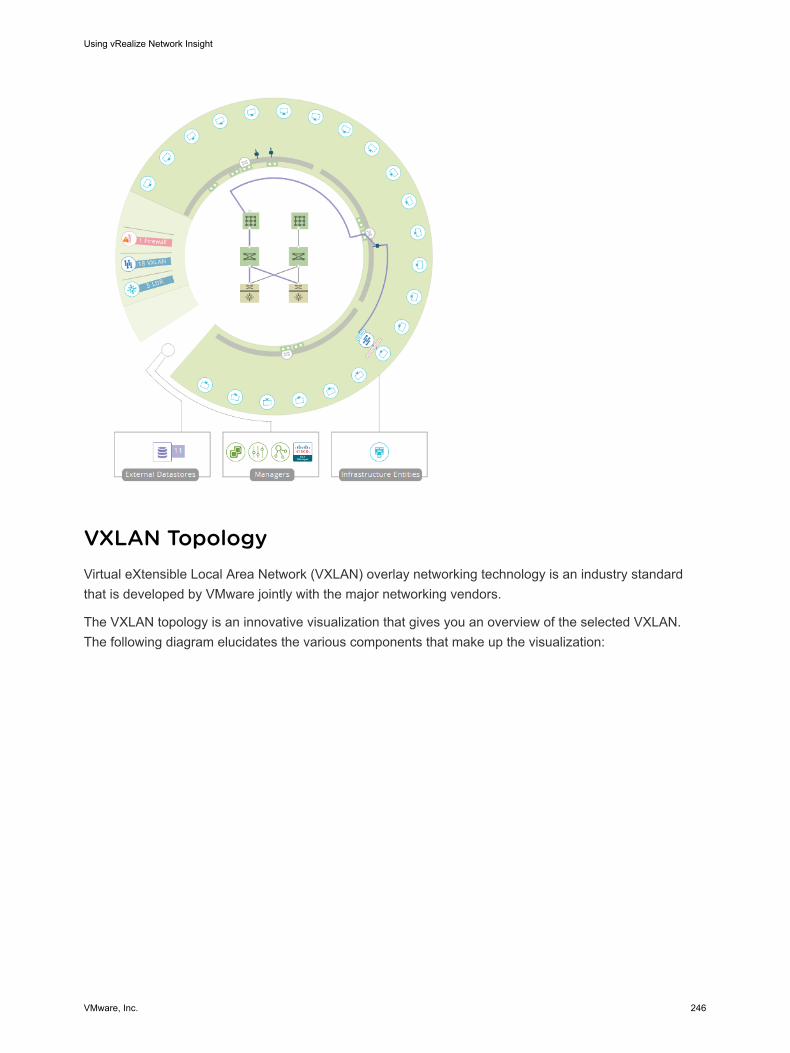
VXLAN TopologyVirtual eXtensible Local Area Network (VXLAN) overlay networking technology is an industry standard that is developed by VMware jointly with the major networking vendors.
The VXLAN topology is an innovative visualization that gives you an overview of the selected VXLAN. The following diagram elucidates the various components that make up the visualization:
Using vRealize Network Insight
VMware, Inc. 246
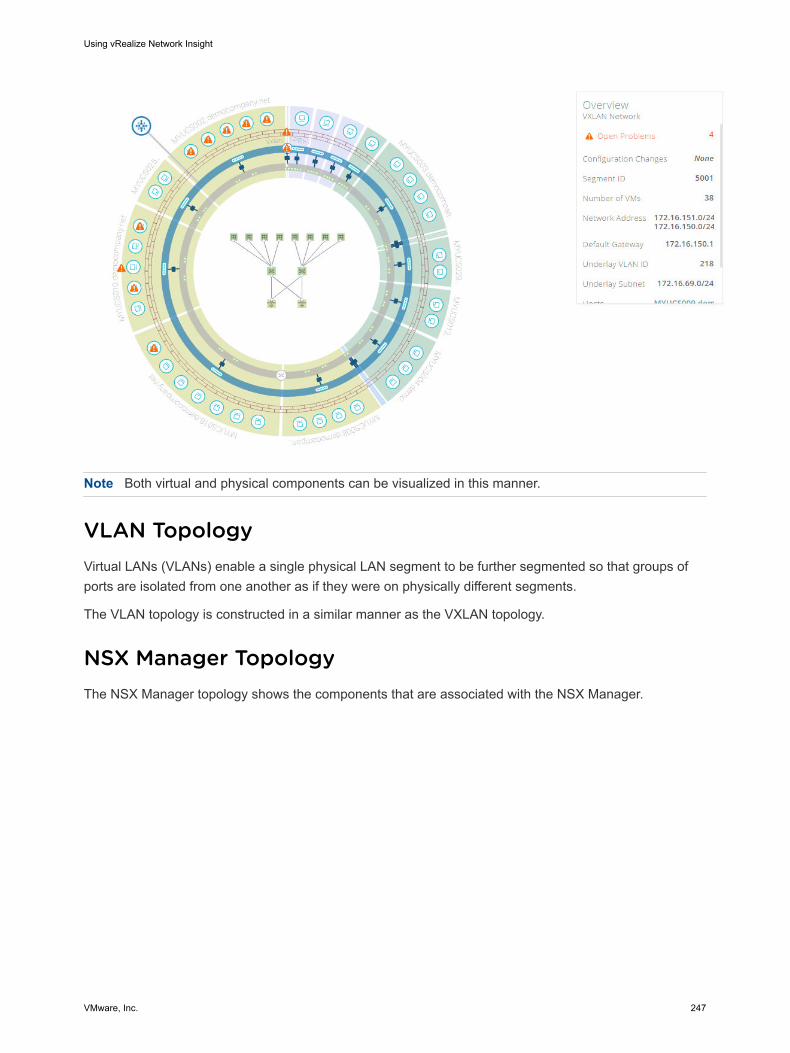
Note Both virtual and physical components can be visualized in this manner.
VLAN TopologyVirtual LANs (VLANs) enable a single physical LAN segment to be further segmented so that groups of ports are isolated from one another as if they were on physically different segments.
The VLAN topology is constructed in a similar manner as the VXLAN topology.
NSX Manager TopologyThe NSX Manager topology shows the components that are associated with the NSX Manager.
Using vRealize Network Insight
VMware, Inc. 247
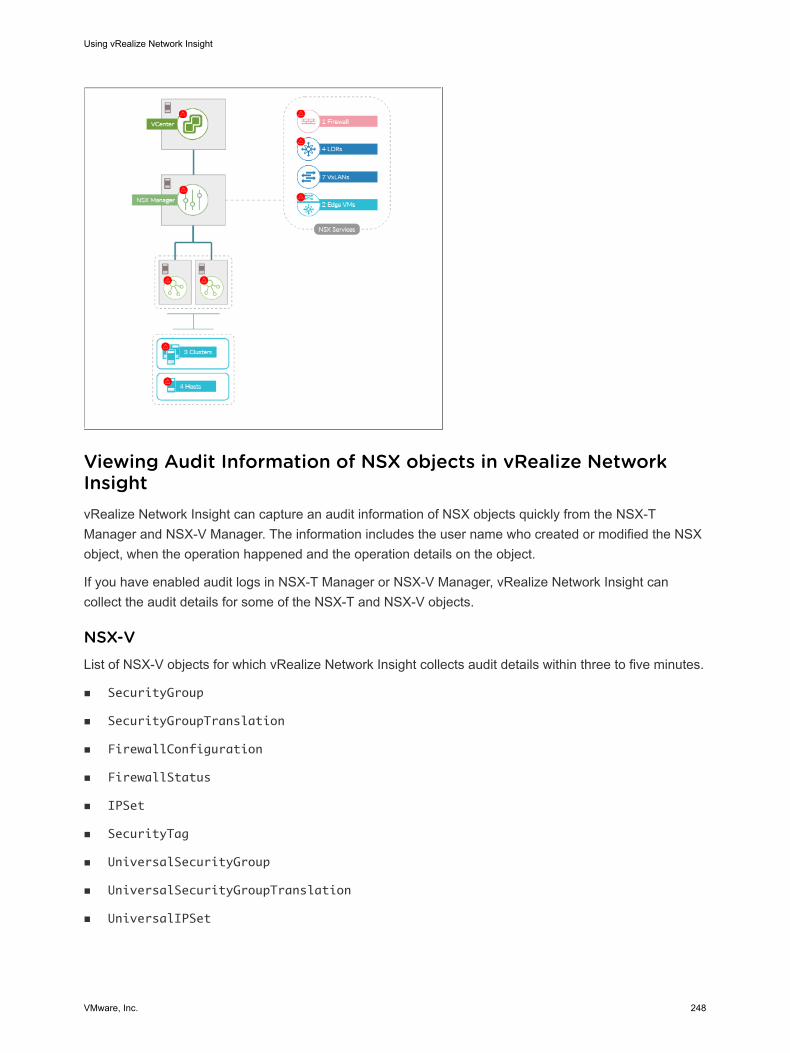
Viewing Audit Information of NSX objects in vRealize Network InsightvRealize Network Insight can capture an audit information of NSX objects quickly from the NSX-T Manager and NSX-V Manager. The information includes the user name who created or modified the NSX object, when the operation happened and the operation details on the object.
If you have enabled audit logs in NSX-T Manager or NSX-V Manager, vRealize Network Insight can collect the audit details for some of the NSX-T and NSX-V objects.
NSX-VList of NSX-V objects for which vRealize Network Insight collects audit details within three to five minutes.
n SecurityGroup
n SecurityGroupTranslation
n FirewallConfiguration
n FirewallStatus
n IPSet
n SecurityTag
n UniversalSecurityGroup
n UniversalSecurityGroupTranslation
n UniversalIPSet
Using vRealize Network Insight
VMware, Inc. 248
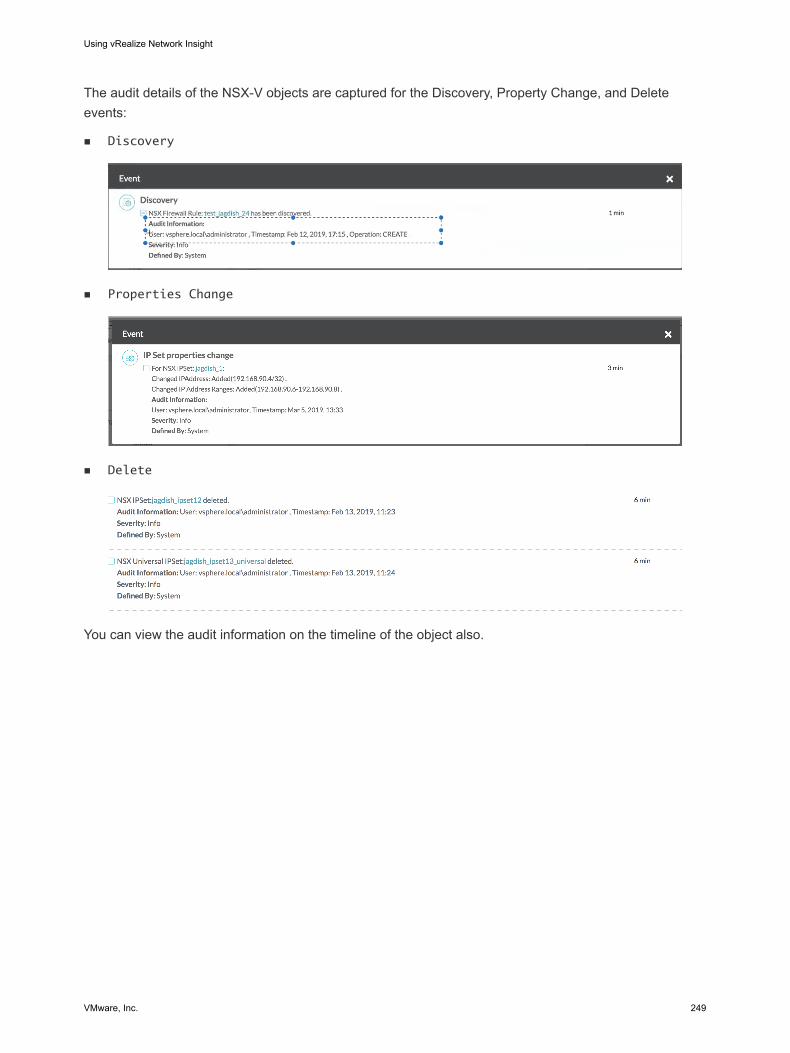
The audit details of the NSX-V objects are captured for the Discovery, Property Change, and Delete events:
n Discovery
n Properties Change
n Delete
You can view the audit information on the timeline of the object also.
Using vRealize Network Insight
VMware, Inc. 249
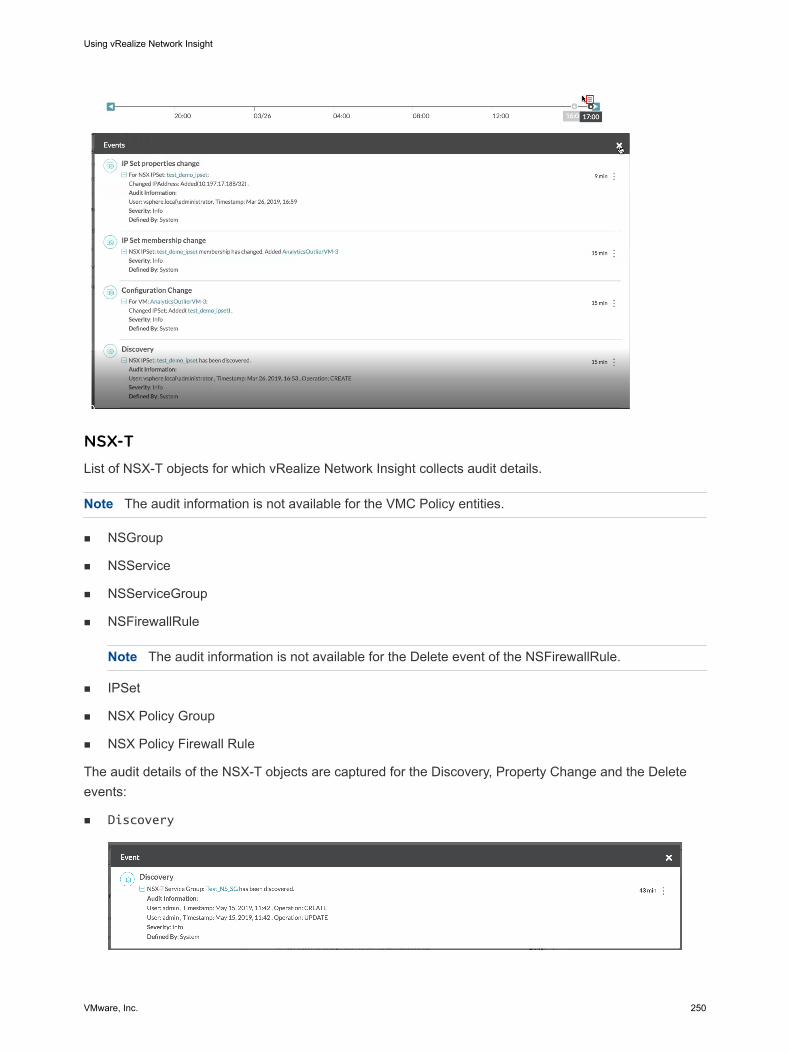
NSX-TList of NSX-T objects for which vRealize Network Insight collects audit details.
Note The audit information is not available for the VMC Policy entities.
n NSGroup
n NSService
n NSServiceGroup
n NSFirewallRule
Note The audit information is not available for the Delete event of the NSFirewallRule.
n IPSet
n NSX Policy Group
n NSX Policy Firewall Rule
The audit details of the NSX-T objects are captured for the Discovery, Property Change and the Delete events:
n Discovery
Using vRealize Network Insight
VMware, Inc. 250
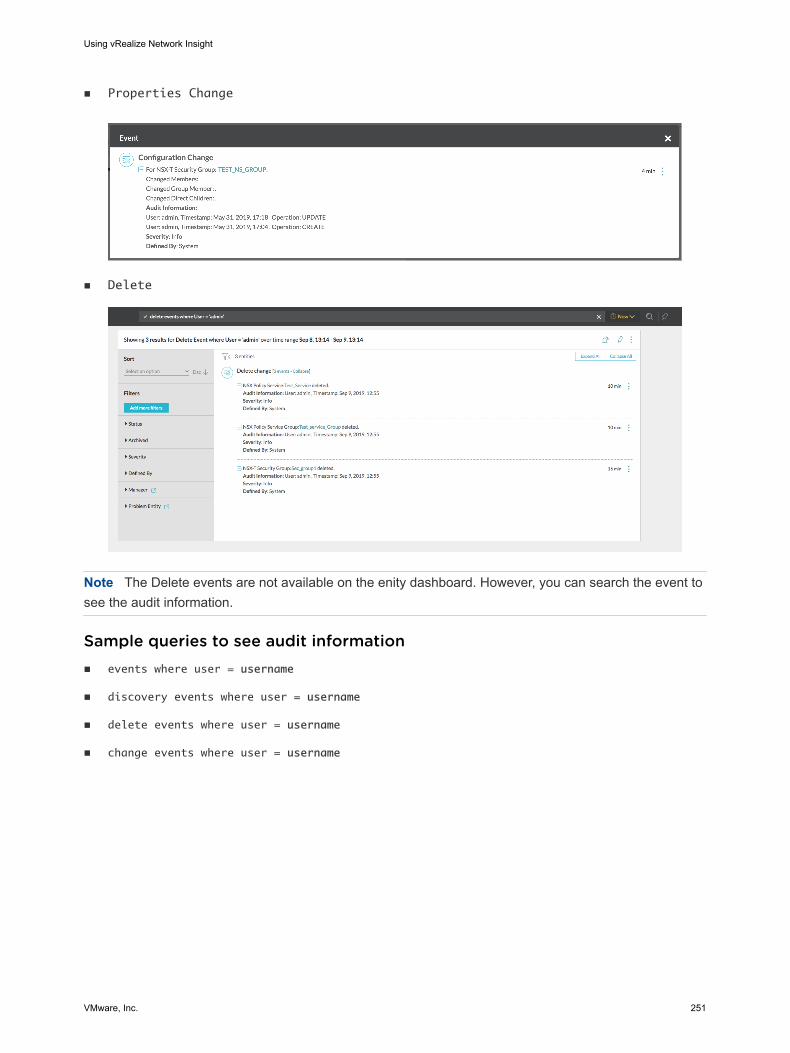
n Properties Change
n Delete
Note The Delete events are not available on the enity dashboard. However, you can search the event to see the audit information.
Sample queries to see audit informationn events where user = username
n discovery events where user = username
n delete events where user = username
n change events where user = username
Using vRealize Network Insight
VMware, Inc. 251
Working with Pins 14All parts of the application are denoted as pins; fundamental units that can be saved and grouped to club data that you think can be useful together and to share them with other members of your team. You can pin a search query and also the pins that are available for an entity.
To add a pin, click the Pin icon. All your saved pins are displayed in Pinboards section which can be invoked by clicking the Pinboard icon in the header.
This chapter includes the following topics:
n Pins
n Pinboards
PinsThe information on each entity page is segregated into pins. All the entity pages are made up of pins and each pin contains a specific bit of information related to the entity.
The pins have the following features:
n You can maximize the view of any pin using the More options ( ) button and also view more information about the pin using the Help option.
n Pins can also contain filters so that you can drill down on the data that is displayed on the pin.
n Many pins also contain the Export as CSV option so that you can export the data present in the pin in CSV format. You can select the specific properties and the number of CSV rows you want to export in the dialog that is displayed.
Note The Export to CSV feature for the flow data takes more than 30 minutes for 180,000 flows when all the fields are selected.
Types of Pins
Most of the pins that are available in the software can be categorized into the following:
VMware, Inc. 252
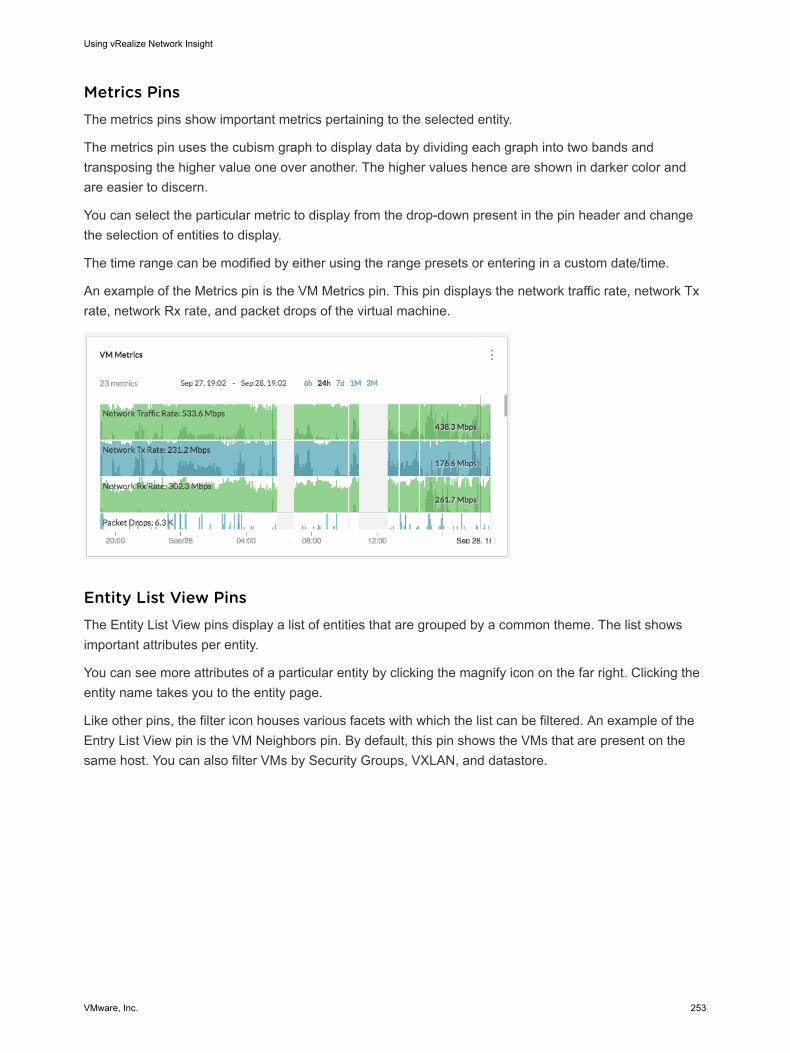
Metrics PinsThe metrics pins show important metrics pertaining to the selected entity.
The metrics pin uses the cubism graph to display data by dividing each graph into two bands and transposing the higher value one over another. The higher values hence are shown in darker color and are easier to discern.
You can select the particular metric to display from the drop-down present in the pin header and change the selection of entities to display.
The time range can be modified by either using the range presets or entering in a custom date/time.
An example of the Metrics pin is the VM Metrics pin. This pin displays the network traffic rate, network Tx rate, network Rx rate, and packet drops of the virtual machine.
Entity List View PinsThe Entity List View pins display a list of entities that are grouped by a common theme. The list shows important attributes per entity.
You can see more attributes of a particular entity by clicking the magnify icon on the far right. Clicking the entity name takes you to the entity page.
Like other pins, the filter icon houses various facets with which the list can be filtered. An example of the Entry List View pin is the VM Neighbors pin. By default, this pin shows the VMs that are present on the same host. You can also filter VMs by Security Groups, VXLAN, and datastore.
Using vRealize Network Insight
VMware, Inc. 253
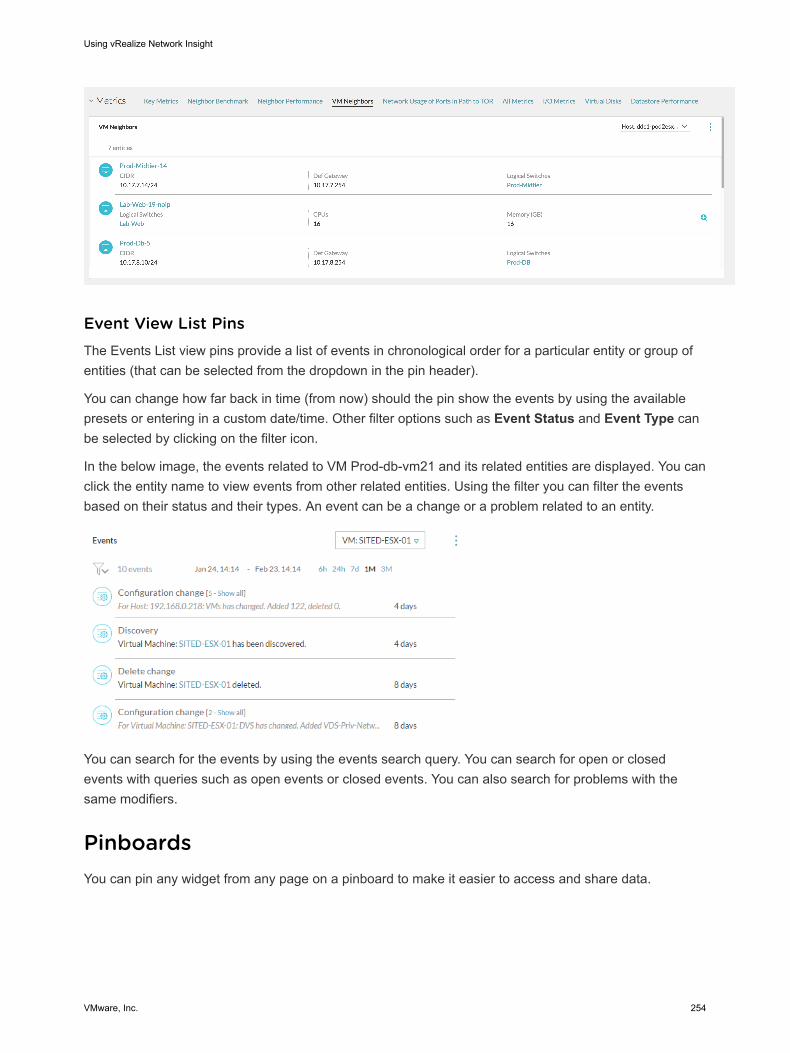
Event View List PinsThe Events List view pins provide a list of events in chronological order for a particular entity or group of entities (that can be selected from the dropdown in the pin header).
You can change how far back in time (from now) should the pin show the events by using the available presets or entering in a custom date/time. Other filter options such as Event Status and Event Type can be selected by clicking on the filter icon.
In the below image, the events related to VM Prod-db-vm21 and its related entities are displayed. You can click the entity name to view events from other related entities. Using the filter you can filter the events based on their status and their types. An event can be a change or a problem related to an entity.
You can search for the events by using the events search query. You can search for open or closed events with queries such as open events or closed events. You can also search for problems with the same modifiers.
PinboardsYou can pin any widget from any page on a pinboard to make it easier to access and share data.
Using vRealize Network Insight
VMware, Inc. 254
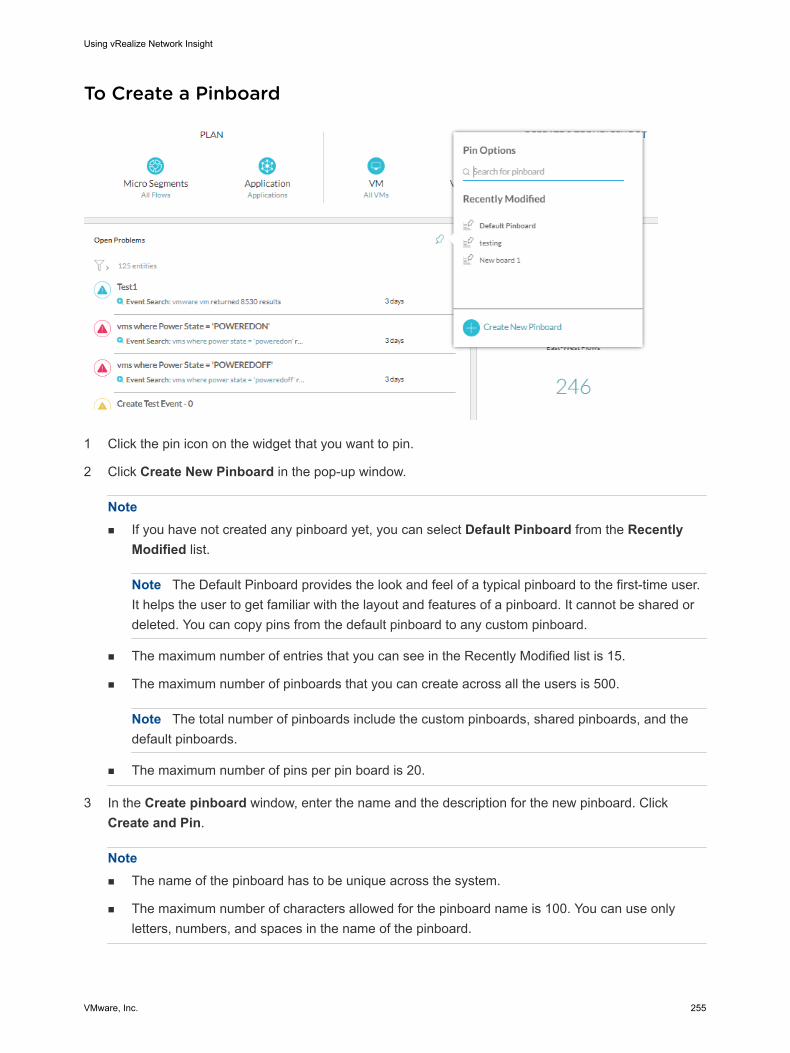
To Create a Pinboard
1 Click the pin icon on the widget that you want to pin.
2 Click Create New Pinboard in the pop-up window.
Note n If you have not created any pinboard yet, you can select Default Pinboard from the Recently
Modified list.
Note The Default Pinboard provides the look and feel of a typical pinboard to the first-time user. It helps the user to get familiar with the layout and features of a pinboard. It cannot be shared or deleted. You can copy pins from the default pinboard to any custom pinboard.
n The maximum number of entries that you can see in the Recently Modified list is 15.
n The maximum number of pinboards that you can create across all the users is 500.
Note The total number of pinboards include the custom pinboards, shared pinboards, and the default pinboards.
n The maximum number of pins per pin board is 20.
3 In the Create pinboard window, enter the name and the description for the new pinboard. Click Create and Pin.
Note n The name of the pinboard has to be unique across the system.
n The maximum number of characters allowed for the pinboard name is 100. You can use only letters, numbers, and spaces in the name of the pinboard.
Using vRealize Network Insight
VMware, Inc. 255
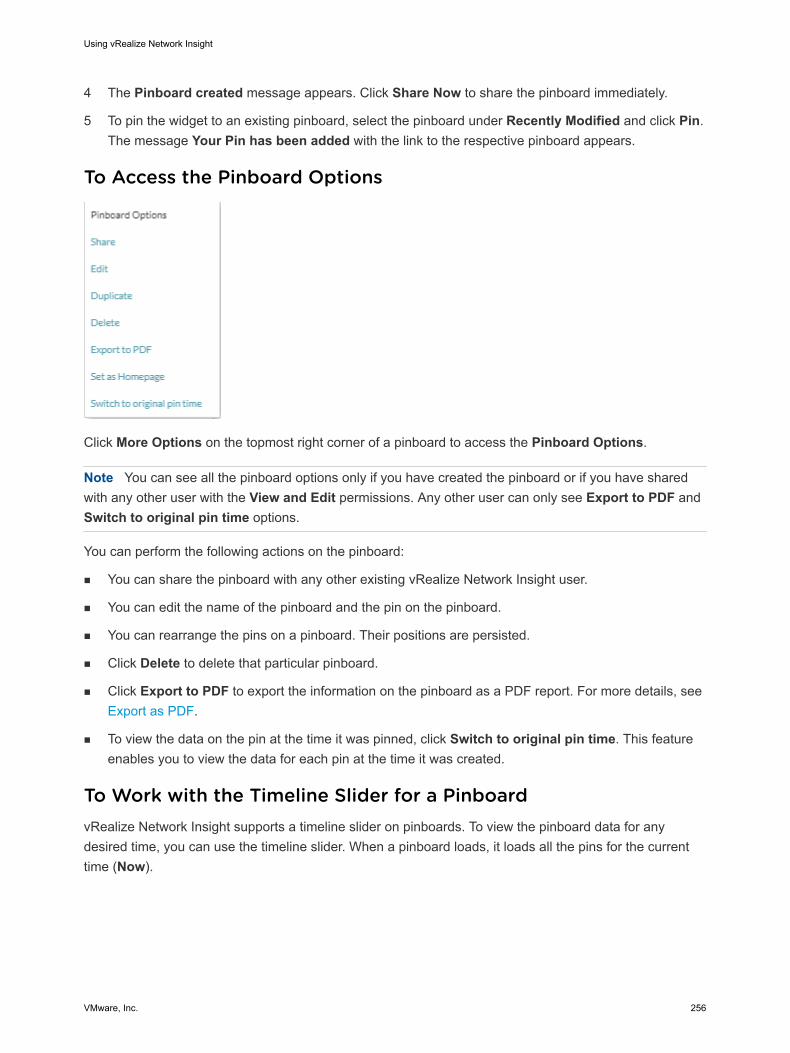
4 The Pinboard created message appears. Click Share Now to share the pinboard immediately.
5 To pin the widget to an existing pinboard, select the pinboard under Recently Modified and click Pin. The message Your Pin has been added with the link to the respective pinboard appears.
To Access the Pinboard Options
Click More Options on the topmost right corner of a pinboard to access the Pinboard Options.
Note You can see all the pinboard options only if you have created the pinboard or if you have shared with any other user with the View and Edit permissions. Any other user can only see Export to PDF and Switch to original pin time options.
You can perform the following actions on the pinboard:
n You can share the pinboard with any other existing vRealize Network Insight user.
n You can edit the name of the pinboard and the pin on the pinboard.
n You can rearrange the pins on a pinboard. Their positions are persisted.
n Click Delete to delete that particular pinboard.
n Click Export to PDF to export the information on the pinboard as a PDF report. For more details, see Export as PDF.
n To view the data on the pin at the time it was pinned, click Switch to original pin time. This feature enables you to view the data for each pin at the time it was created.
To Work with the Timeline Slider for a PinboardvRealize Network Insight supports a timeline slider on pinboards. To view the pinboard data for any desired time, you can use the timeline slider. When a pinboard loads, it loads all the pins for the current time (Now).
Using vRealize Network Insight
VMware, Inc. 256
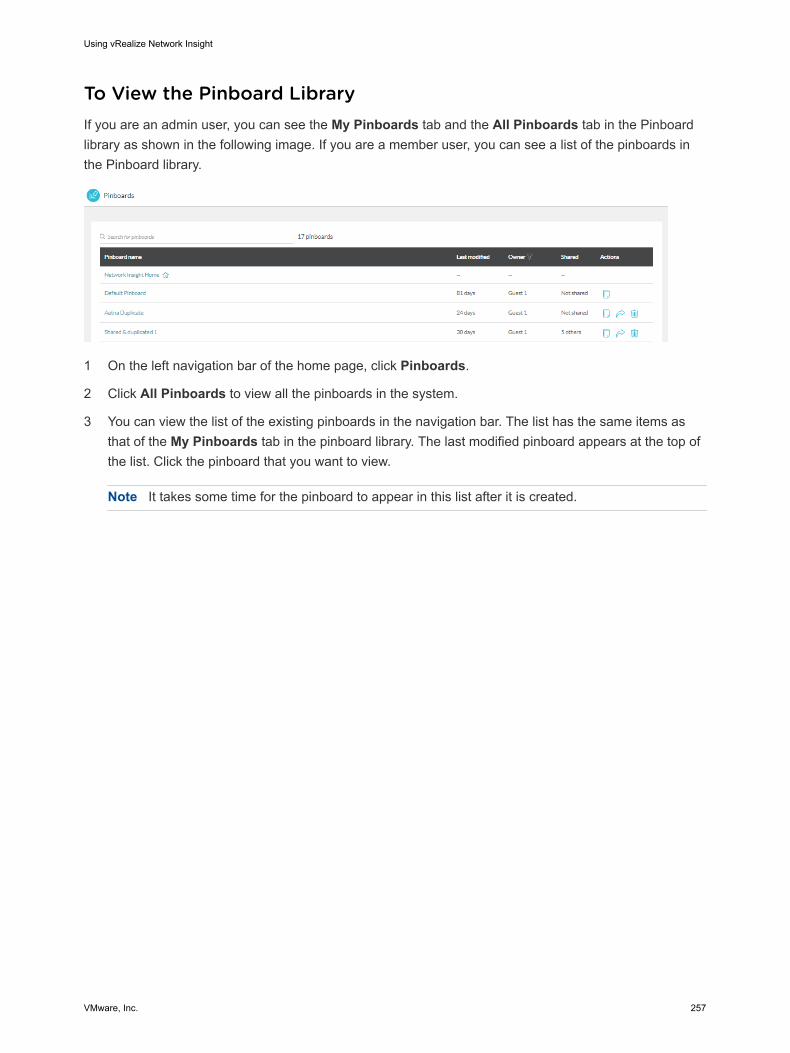
To View the Pinboard LibraryIf you are an admin user, you can see the My Pinboards tab and the All Pinboards tab in the Pinboard library as shown in the following image. If you are a member user, you can see a list of the pinboards in the Pinboard library.
1 On the left navigation bar of the home page, click Pinboards.
2 Click All Pinboards to view all the pinboards in the system.
3 You can view the list of the existing pinboards in the navigation bar. The list has the same items as that of the My Pinboards tab in the pinboard library. The last modified pinboard appears at the top of the list. Click the pinboard that you want to view.
Note It takes some time for the pinboard to appear in this list after it is created.
Using vRealize Network Insight
VMware, Inc. 257
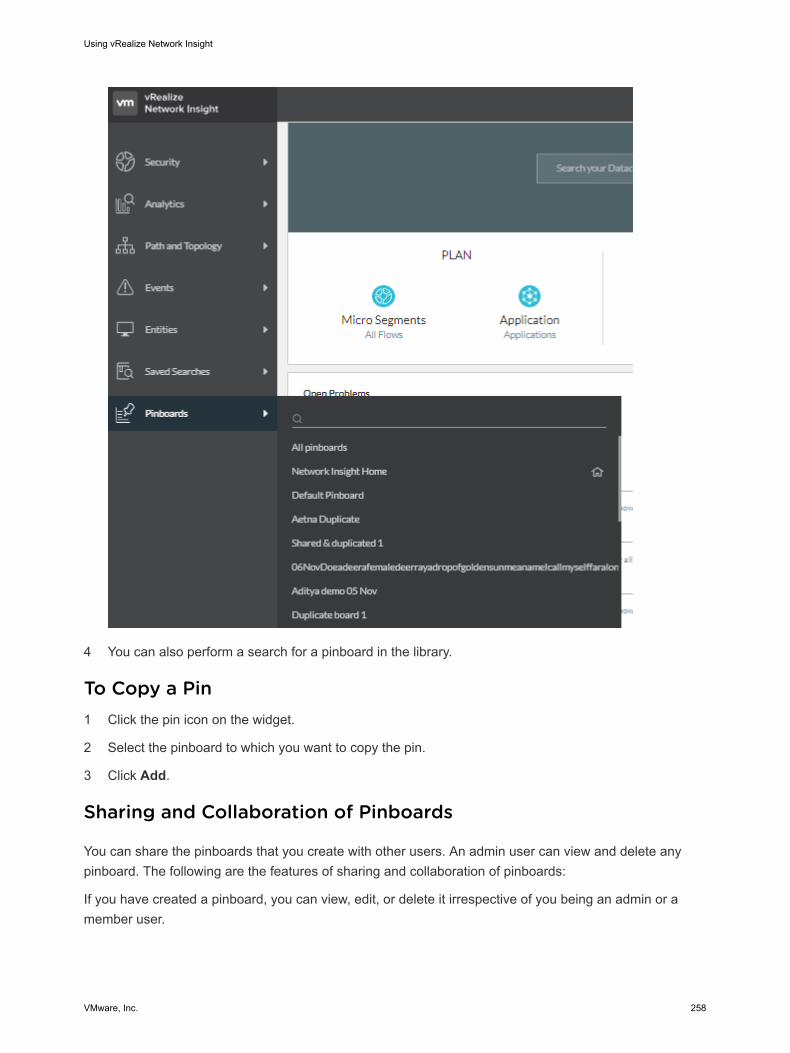
4 You can also perform a search for a pinboard in the library.
To Copy a Pin1 Click the pin icon on the widget.
2 Select the pinboard to which you want to copy the pin.
3 Click Add.
Sharing and Collaboration of Pinboards
You can share the pinboards that you create with other users. An admin user can view and delete any pinboard. The following are the features of sharing and collaboration of pinboards:
If you have created a pinboard, you can view, edit, or delete it irrespective of you being an admin or a member user.
Using vRealize Network Insight
VMware, Inc. 258
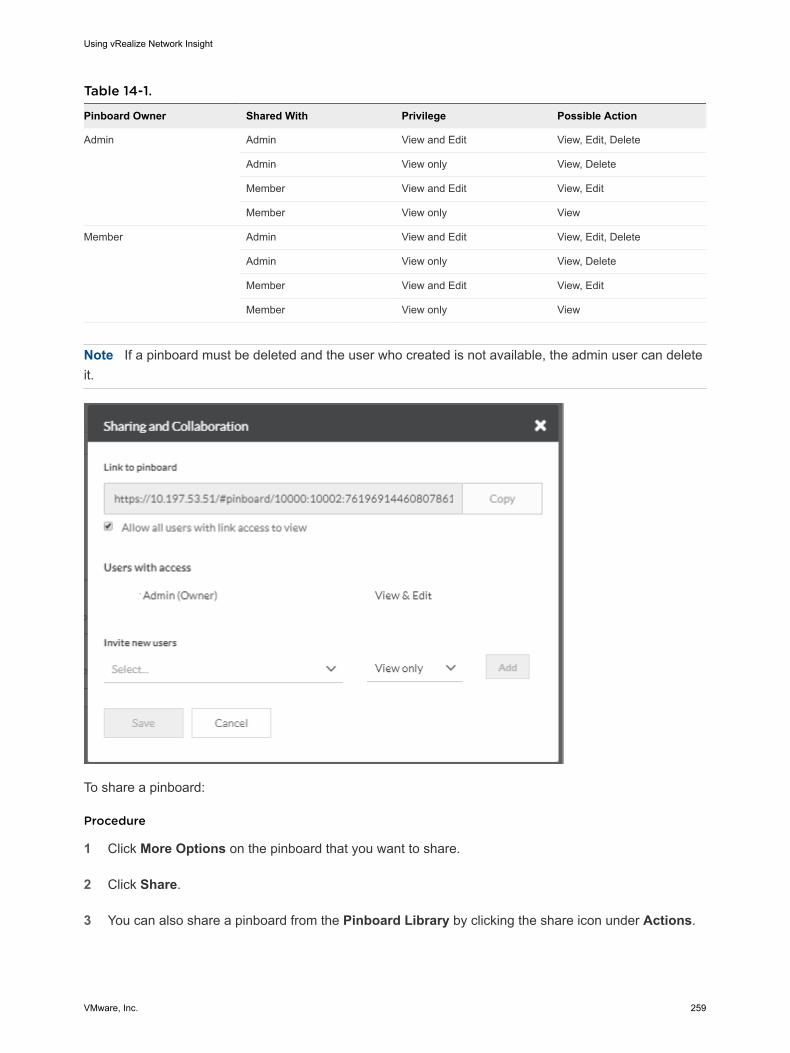
Table 14-1.
Pinboard Owner Shared With Privilege Possible Action
Admin Admin View and Edit View, Edit, Delete
Admin View only View, Delete
Member View and Edit View, Edit
Member View only View
Member Admin View and Edit View, Edit, Delete
Admin View only View, Delete
Member View and Edit View, Edit
Member View only View
Note If a pinboard must be deleted and the user who created is not available, the admin user can delete it.
To share a pinboard:
Procedure
1 Click More Options on the pinboard that you want to share.
2 Click Share.
3 You can also share a pinboard from the Pinboard Library by clicking the share icon under Actions.
Using vRealize Network Insight
VMware, Inc. 259
4 By default, the link sharing is enabled. You can share the link of a pinboard with any user who is logged in.
5 You can add the users with whom you want to share the pinboard. You can specify the privileges such as view and view and edit to a particular user.
Note The user who has only the view privilege cannot share the pinboard with any other user.
6 Click Save to save the share and collaboration changes that you have made.
7 You can view the sharing and collaboration information for any pinboard through either of the following options.
n In the Pinboard Library, you can view the sharing information in the Shared column for a particular pinboard.
n Click the pin icon on the widget. Point to any of the pinboards listed under Recently Modified to see the details regarding the owner and with whom it has been shared.
To Set A Pinboard as the Home Page
You can set a pinboard of your choice as your default home page.
Procedure
1 Navigate to the desired pinboard that you want to set as the home page.
2 Click Pinboard Options. Click Set as Home Page.
This particular pinboard is set as the home page.
Note Once you set a pinboard as the home page, the Set as Home Page option on that pinboard is disabled.
3 You can also set a particular pinboard as the default home page from the My Preferences page under Settings.
4 If you want to view the previous home page, then click Network Insight Home under Pinboards on the left navigation panel. The message Do you want to set Network Insight Home as Homepage? pops up. If you want to revert back to the default home page, click Set Homepage. Click Dismiss to close the message.
Note n If you delete a pinboard that you have set as your home page, then the default home page is
reset to Network Insight Home page. If you are the owner of the pinboard that you are deleting, a message pops up for confirmation for deletion.
n If another user has set the pinboard that you have created as the home page, when you delete it, the home page reverts back to Network Insight Home automatically for that user.
Using vRealize Network Insight
VMware, Inc. 260
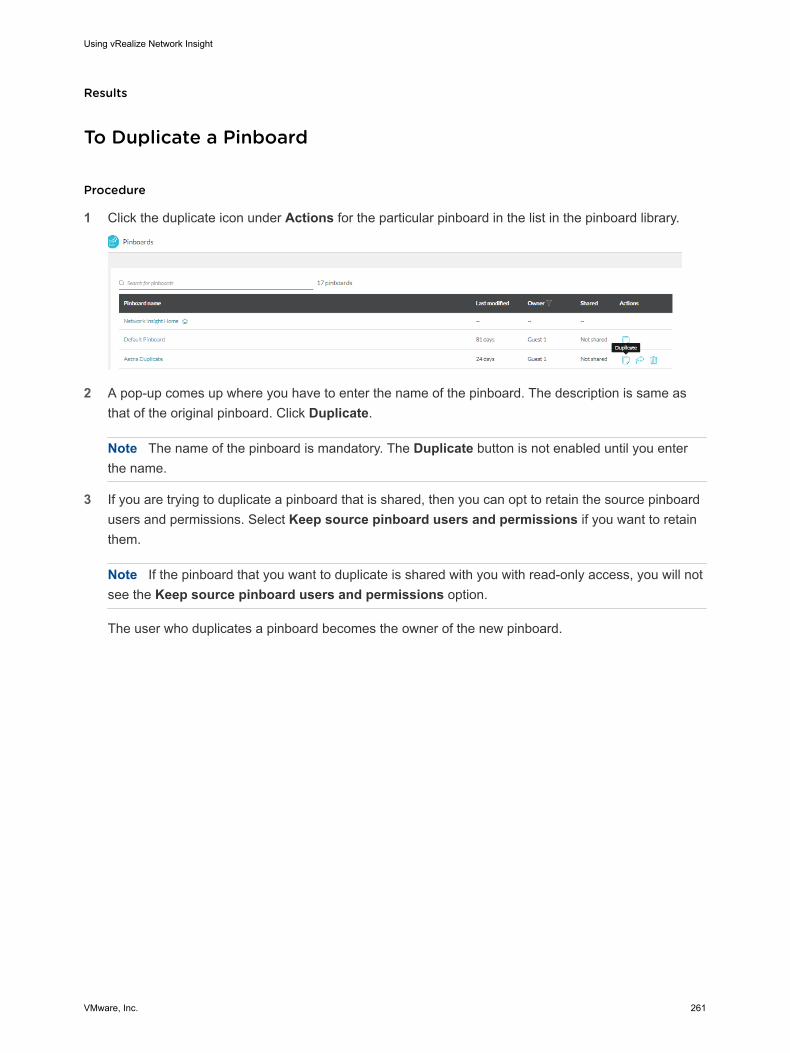
Results
To Duplicate a Pinboard
Procedure
1 Click the duplicate icon under Actions for the particular pinboard in the list in the pinboard library.
2 A pop-up comes up where you have to enter the name of the pinboard. The description is same as that of the original pinboard. Click Duplicate.
Note The name of the pinboard is mandatory. The Duplicate button is not enabled until you enter the name.
3 If you are trying to duplicate a pinboard that is shared, then you can opt to retain the source pinboard users and permissions. Select Keep source pinboard users and permissions if you want to retain them.
Note If the pinboard that you want to duplicate is shared with you with read-only access, you will not see the Keep source pinboard users and permissions option.
The user who duplicates a pinboard becomes the owner of the new pinboard.
Using vRealize Network Insight
VMware, Inc. 261
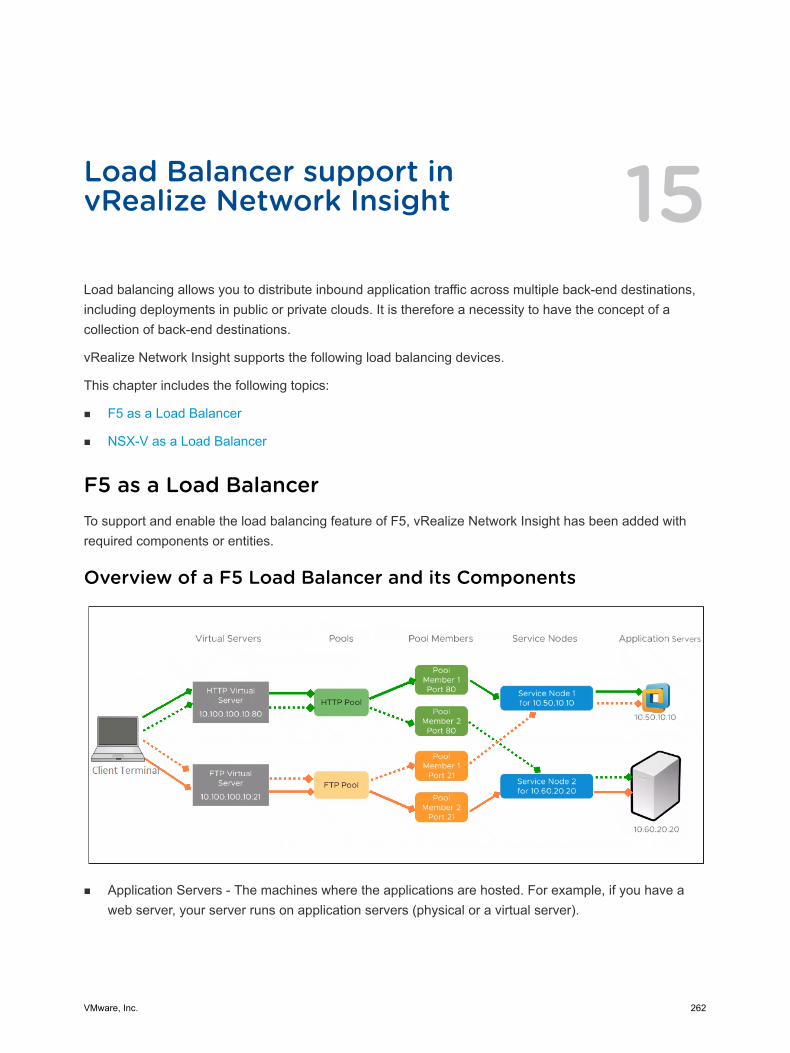
Load Balancer support in vRealize Network Insight 15Load balancing allows you to distribute inbound application traffic across multiple back-end destinations, including deployments in public or private clouds. It is therefore a necessity to have the concept of a collection of back-end destinations.
vRealize Network Insight supports the following load balancing devices.
This chapter includes the following topics:
n F5 as a Load Balancer
n NSX-V as a Load Balancer
F5 as a Load BalancerTo support and enable the load balancing feature of F5, vRealize Network Insight has been added with required components or entities.
Overview of a F5 Load Balancer and its Components
n Application Servers - The machines where the applications are hosted. For example, if you have a web server, your server runs on application servers (physical or a virtual server).
VMware, Inc. 262
n Service Nodes - F5 represents the application servers as service nodes. So, service node has the same IP address or FQDN of the application server. Each service node can have multiple applications.
n Pool Members - A logical entity. Each application in a service node is represented by a pool member, which has the same IP address or FQDN of the service node. To identify different applications, the pool members embed the port number with the IP address of the Service Nodes.
n Pools - All pool members that serve one application are grouped as a pool.
n Virtual Servers - A public facing IP address of the application. So, the clients that want to use an application connects to the virtual server IP address (For example, 10.100.100.10) and port number (80 or 21).
n Client Terminal - The connection starts from a client terminal, which is a virtual machine.
The client request connects to the virtual server, which decides the pool members based on the pool. Pool members, then, forwards the request to the application server (VM or physical server).
Note A single application server can serve multiple requests from different ports and different service nodes.
vRealize Network Insight provides additional advantages with the load balancing feature support:
n Enables to identify whether the application servers are physical servers or the virtual machines.
n Allows you to debug or troubleshoot the problems easily by providing visibility into the application server (host or VM) information such as configuration, performance, flows.
n Provides visibility into physical or virtual networking components in an application where the load is distributed.
n Raises alerts for any issue in the environment and also helps to detect the reason for the issue. For example, application is not responding because the service node VM is down.
n provides an end to end flow visibility.
Viewing Load Balancer DetailsLoad Balancer page summarizes all the information of the virtual servers and the pools that are created on the load balancer.
You see,
n list of virtual servers along with its problems on the load balancer
n list of pools on the load balancer and their associated problems
n events associated with the load balancer
n list of flows, count and its network traffic on different destination IPs.
Note The flow information is not captured for NSX-V load balancer.
Using vRealize Network Insight
VMware, Inc. 263
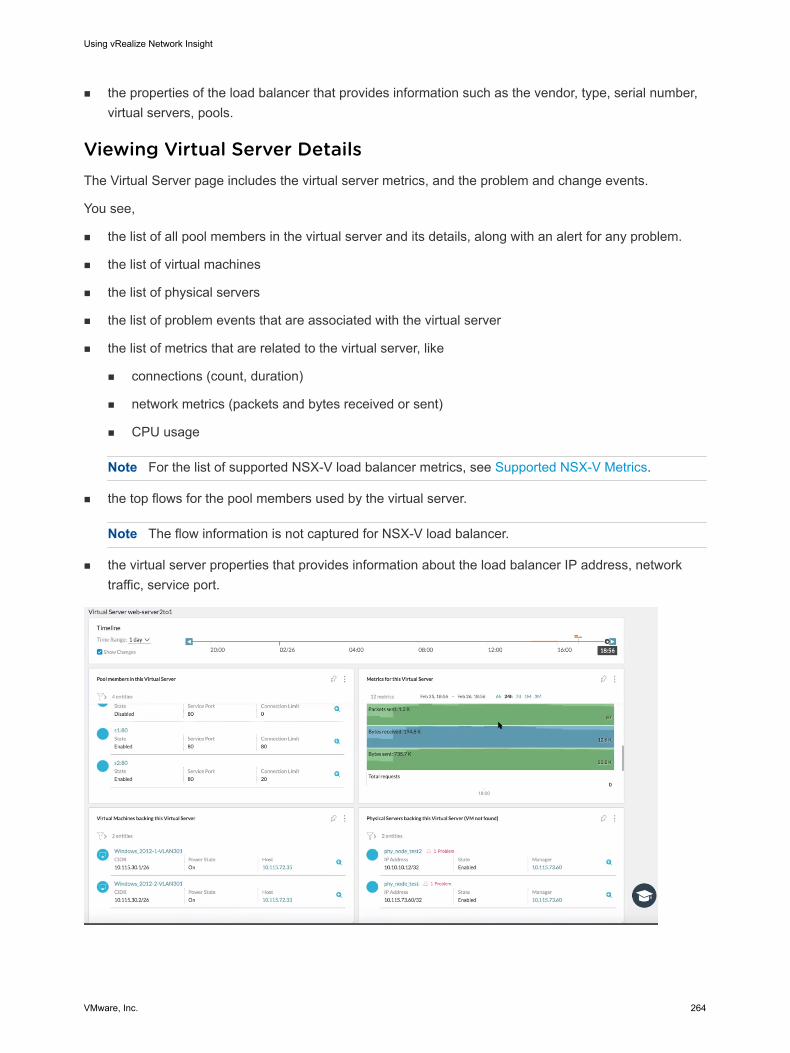
n the properties of the load balancer that provides information such as the vendor, type, serial number, virtual servers, pools.
Viewing Virtual Server DetailsThe Virtual Server page includes the virtual server metrics, and the problem and change events.
You see,
n the list of all pool members in the virtual server and its details, along with an alert for any problem.
n the list of virtual machines
n the list of physical servers
n the list of problem events that are associated with the virtual server
n the list of metrics that are related to the virtual server, like
n connections (count, duration)
n network metrics (packets and bytes received or sent)
n CPU usage
Note For the list of supported NSX-V load balancer metrics, see Supported NSX-V Metrics.
n the top flows for the pool members used by the virtual server.
Note The flow information is not captured for NSX-V load balancer.
n the virtual server properties that provides information about the load balancer IP address, network traffic, service port.
Using vRealize Network Insight
VMware, Inc. 264
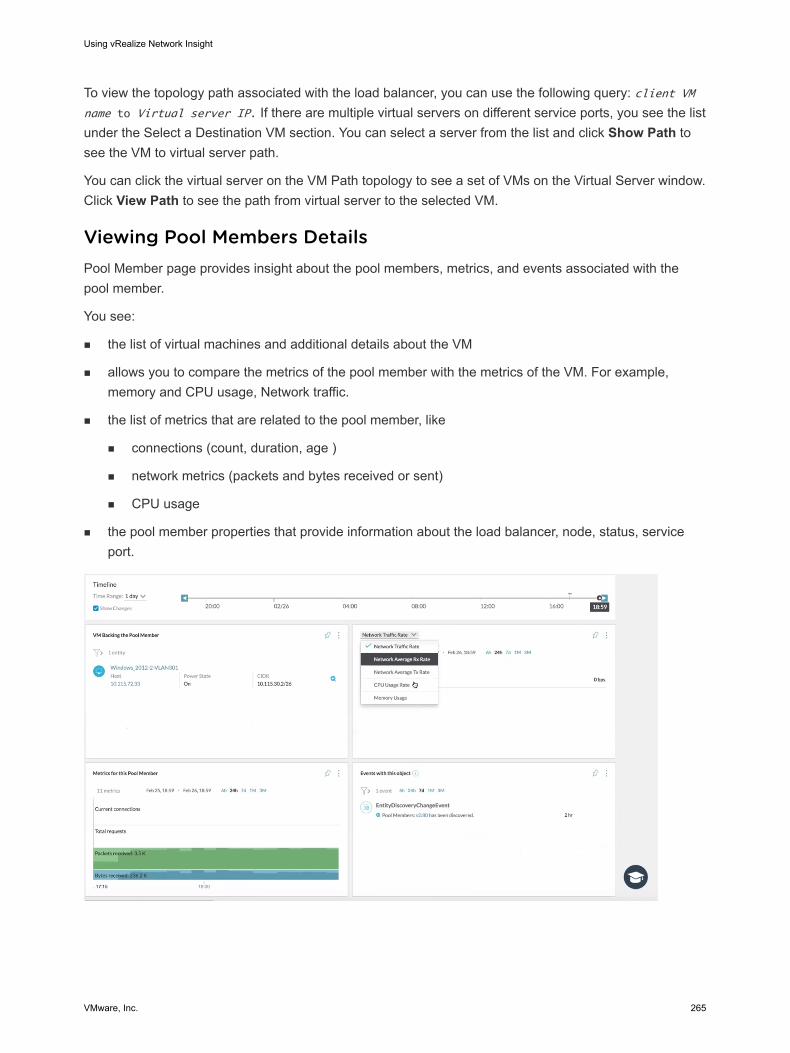
To view the topology path associated with the load balancer, you can use the following query: client VM name to Virtual server IP. If there are multiple virtual servers on different service ports, you see the list under the Select a Destination VM section. You can select a server from the list and click Show Path to see the VM to virtual server path.
You can click the virtual server on the VM Path topology to see a set of VMs on the Virtual Server window. Click View Path to see the path from virtual server to the selected VM.
Viewing Pool Members DetailsPool Member page provides insight about the pool members, metrics, and events associated with the pool member.
You see:
n the list of virtual machines and additional details about the VM
n allows you to compare the metrics of the pool member with the metrics of the VM. For example, memory and CPU usage, Network traffic.
n the list of metrics that are related to the pool member, like
n connections (count, duration, age )
n network metrics (packets and bytes received or sent)
n CPU usage
n the pool member properties that provide information about the load balancer, node, status, service port.
Using vRealize Network Insight
VMware, Inc. 265
Sample Search Queries Related to Load BalancerYou can use the following sample queries to filter or search the data related to the load balancer.
n vm where lbServiceNodes is set - Lists all the VMs that are hosting an application where load is distributed.
n vm where lbServiceNodes is set and PowerState !='POWEREDON' - Lists all the VMs that are hosting a load balanced application, but currently non-functional.
n pool member where state = 'DISABLED' - Lists all pool members that are disabled.
n Count of Pool Memebers where Service Port = '80' - Provides the count of all pool members for a particular type of service that are running on port 80.
n service node where virtual machine is not set - Lists all service nodes that are using the physical server as an application server or the vCenter Server that is hosting the VMs is not added in vRealize Network Insight
NSX-V as a Load BalancerStarting from the 4.2 release, vRealize Network Insight supports and enables the load balancing feature of NSX-V.
Here is the list of metrics currently supported:
n Virtual Server
n Total Bytes In
n Total Bytes Out
n Current Sessions
n Total Sessions
n Pool
n Total Bytes In
n Total Bytes Out
n Current Connections
n Max Connections
n Total Connections
Currently in vRealize Network Insight only the VMs are supported as pool members.
Using vRealize Network Insight
VMware, Inc. 266
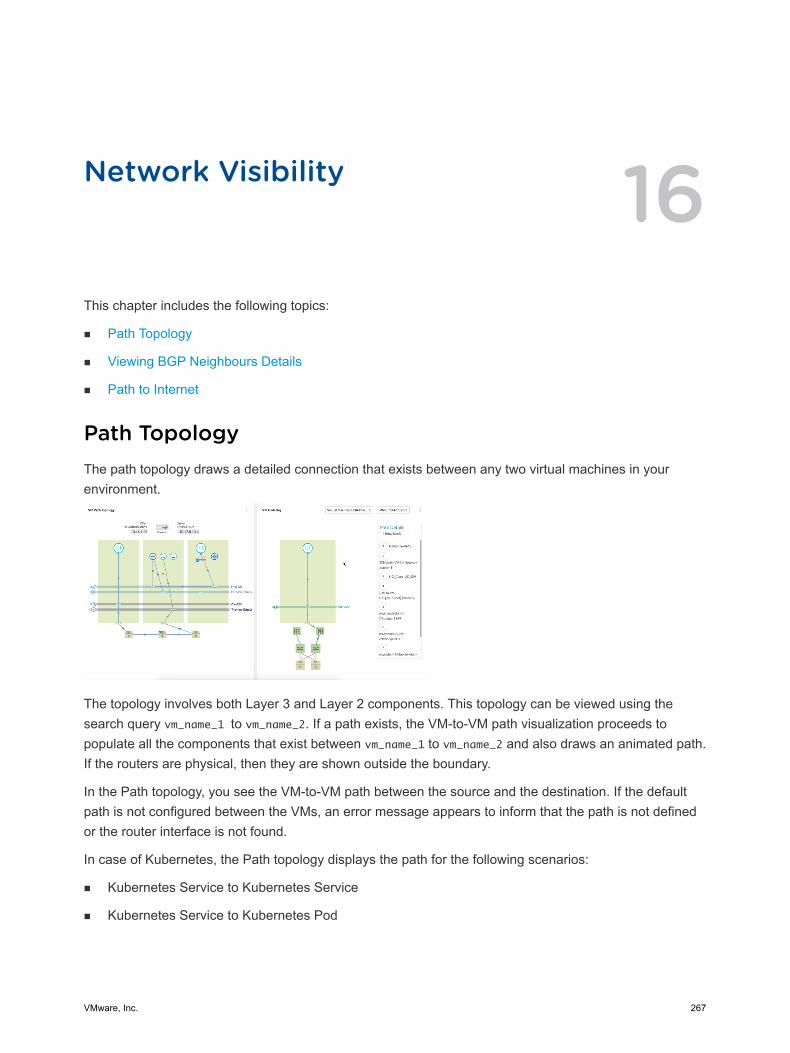
Network Visibility 16This chapter includes the following topics:
n Path Topology
n Viewing BGP Neighbours Details
n Path to Internet
Path TopologyThe path topology draws a detailed connection that exists between any two virtual machines in your environment.
The topology involves both Layer 3 and Layer 2 components. This topology can be viewed using the search query vm_name_1 to vm_name_2. If a path exists, the VM-to-VM path visualization proceeds to populate all the components that exist between vm_name_1 to vm_name_2 and also draws an animated path. If the routers are physical, then they are shown outside the boundary.
In the Path topology, you see the VM-to-VM path between the source and the destination. If the default path is not configured between the VMs, an error message appears to inform that the path is not defined or the router interface is not found.
In case of Kubernetes, the Path topology displays the path for the following scenarios:
n Kubernetes Service to Kubernetes Service
n Kubernetes Service to Kubernetes Pod
VMware, Inc. 267
n Kubernetes Pod to Kubernete Pod
Note The path involving physical devices is not supported.
The Path Via Load Balancer option lists all the load balancers that are used in between the path from the selected source and the destination VM. To see the path between the VMs via a particular load balancer, select the load balancer name from the list. If you hover the mouse on load balancer component on the path topology, you see the following details:
n Virtual Server name
n Load Balancer IP address
n Port number
n Load Balancer Algorithm
n The default gateway that was tken from the load balancer.
You can also see the routing components on the path topology.
If you hover your mouse on any of the routers, edges, or LDRs that are involved in the path, the complete routing or NAT information is shown.
The VM Underlay section that is on the right side of the VM Path topology shows the underlay information of the VMs involved and their connectivity to the top of the rack switches and the ports involved. For Kubernetes entities, VM Underlay displays the VM or the Kubernetes node information on which the Pod resides.
In the VM underlay section, the components are labeled if you select Show labels under Path Details. In this section, the drop-down list at the top shows the endpoint VMs and the active VMs at the edges. For each edge VM, the neighboring drop-down list shows the ingress and the egress interface IP addresses. Based on the selection, the underlay path for that particular interface is shown.
You can also reverse the path direction using the arrows on top of the topology map.
The topology map gives more visibility regarding the ports involved in the VM-VM path. In the Path Details section, the name of the actual port channel is shown.
Note There is no complete visibility for layer 2 on the physical front. If a packet is traversing from one switch to another, there maybe multiple switches involved. But the topology does not show the switches in the underlay network.
AWS VM-VM Path
The VM-VM path for AWS provides the path visibility between the on-premises VMs and the AWS EC2 instances.
Currently, vRealize Network Insight supports the following scenarios:
n AWS intra-VPC VM-VM path: This scenario involves the communication between the VMs of the same subnet or different subnets in a particular VPC.
Using vRealize Network Insight
VMware, Inc. 268
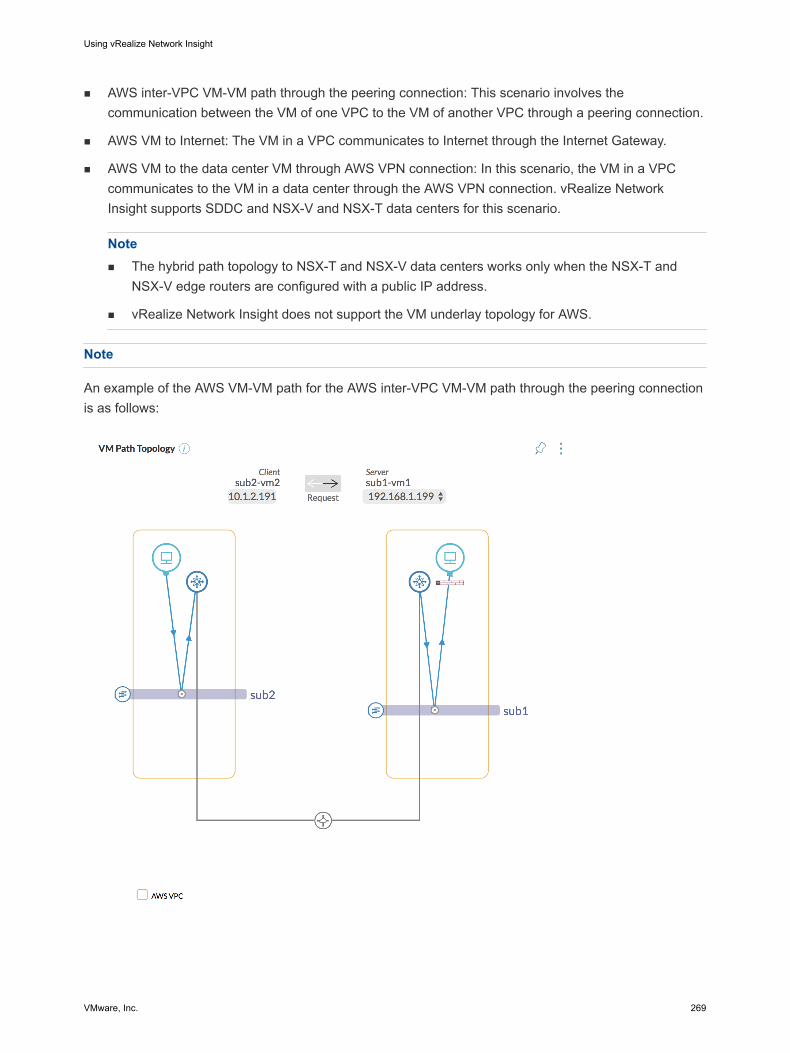
n AWS inter-VPC VM-VM path through the peering connection: This scenario involves the communication between the VM of one VPC to the VM of another VPC through a peering connection.
n AWS VM to Internet: The VM in a VPC communicates to Internet through the Internet Gateway.
n AWS VM to the data center VM through AWS VPN connection: In this scenario, the VM in a VPC communicates to the VM in a data center through the AWS VPN connection. vRealize Network Insight supports SDDC and NSX-V and NSX-T data centers for this scenario.
Note n The hybrid path topology to NSX-T and NSX-V data centers works only when the NSX-T and
NSX-V edge routers are configured with a public IP address.
n vRealize Network Insight does not support the VM underlay topology for AWS.
Note
An example of the AWS VM-VM path for the AWS inter-VPC VM-VM path through the peering connection is as follows:
Using vRealize Network Insight
VMware, Inc. 269
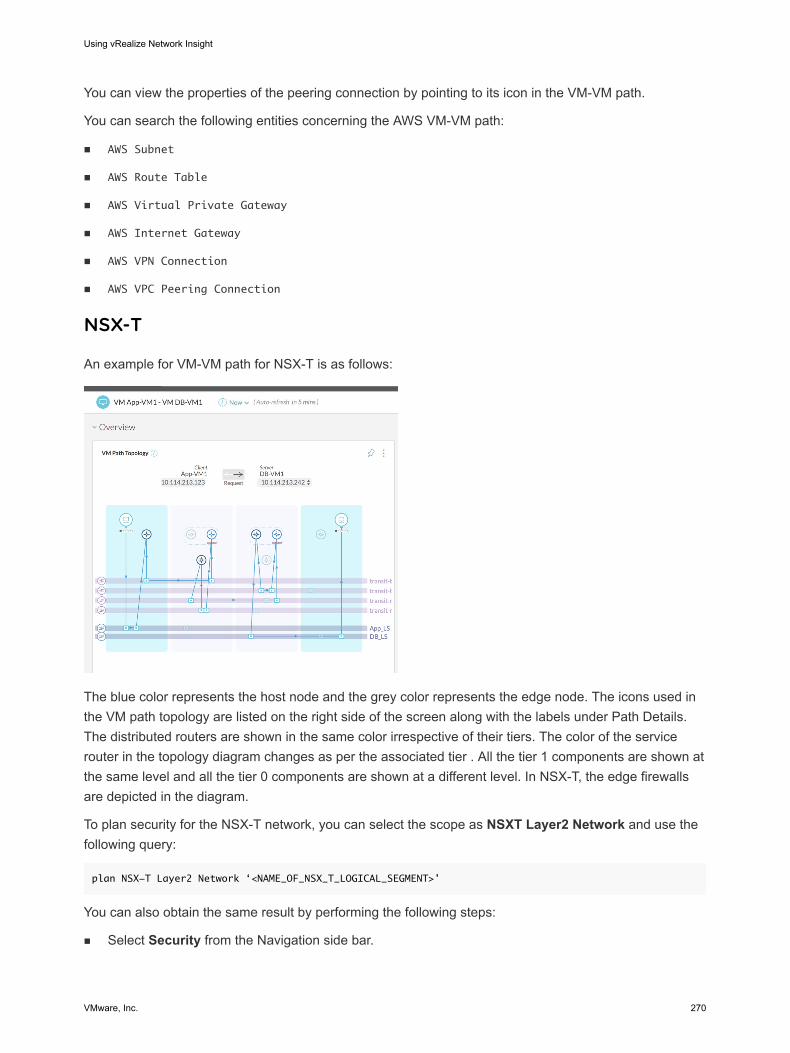
You can view the properties of the peering connection by pointing to its icon in the VM-VM path.
You can search the following entities concerning the AWS VM-VM path:
n AWS Subnet
n AWS Route Table
n AWS Virtual Private Gateway
n AWS Internet Gateway
n AWS VPN Connection
n AWS VPC Peering Connection
NSX-T
An example for VM-VM path for NSX-T is as follows:
The blue color represents the host node and the grey color represents the edge node. The icons used in the VM path topology are listed on the right side of the screen along with the labels under Path Details. The distributed routers are shown in the same color irrespective of their tiers. The color of the service router in the topology diagram changes as per the associated tier . All the tier 1 components are shown at the same level and all the tier 0 components are shown at a different level. In NSX-T, the edge firewalls are depicted in the diagram.
To plan security for the NSX-T network, you can select the scope as NSXT Layer2 Network and use the following query:
plan NSX-T Layer2 Network ‘<NAME_OF_NSX_T_LOGICAL_SEGMENT>’
You can also obtain the same result by performing the following steps:
n Select Security from the Navigation side bar.
Using vRealize Network Insight
VMware, Inc. 270
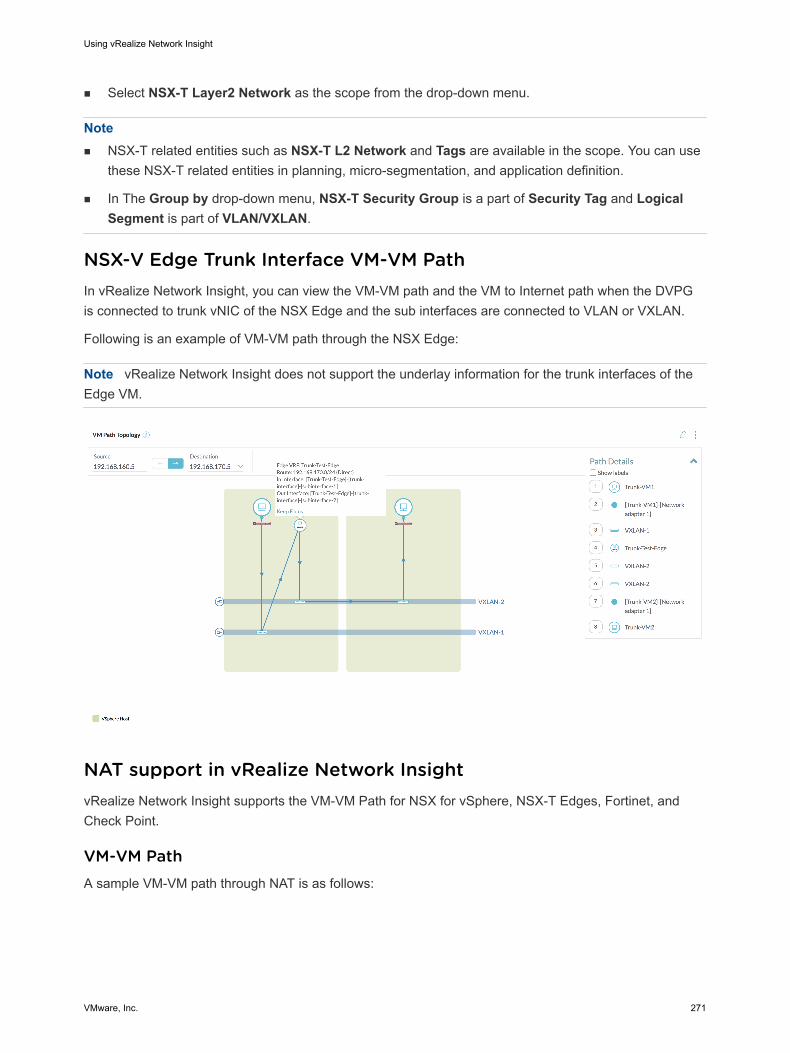
n Select NSX-T Layer2 Network as the scope from the drop-down menu.
Note n NSX-T related entities such as NSX-T L2 Network and Tags are available in the scope. You can use
these NSX-T related entities in planning, micro-segmentation, and application definition.
n In The Group by drop-down menu, NSX-T Security Group is a part of Security Tag and Logical Segment is part of VLAN/VXLAN.
NSX-V Edge Trunk Interface VM-VM PathIn vRealize Network Insight, you can view the VM-VM path and the VM to Internet path when the DVPG is connected to trunk vNIC of the NSX Edge and the sub interfaces are connected to VLAN or VXLAN.
Following is an example of VM-VM path through the NSX Edge:
Note vRealize Network Insight does not support the underlay information for the trunk interfaces of the Edge VM.
NAT support in vRealize Network InsightvRealize Network Insight supports the VM-VM Path for NSX for vSphere, NSX-T Edges, Fortinet, and Check Point.
VM-VM PathA sample VM-VM path through NAT is as follows:
Using vRealize Network Insight
VMware, Inc. 271
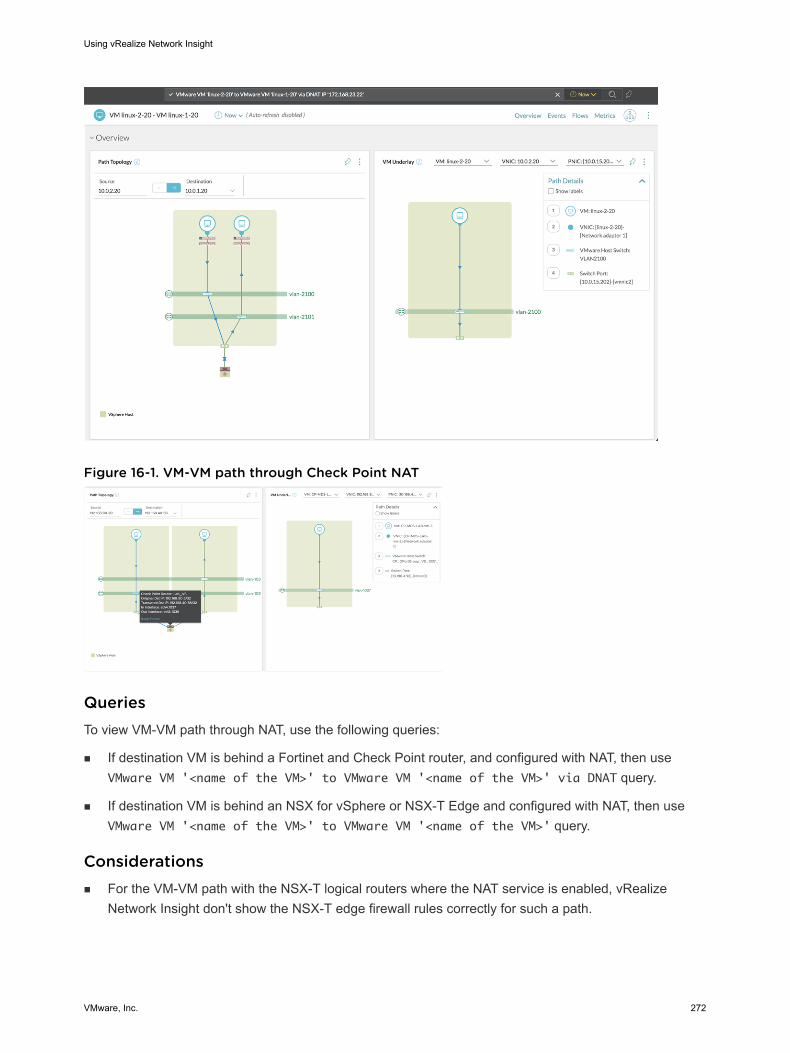
Figure 16-1. VM-VM path through Check Point NAT
QueriesTo view VM-VM path through NAT, use the following queries:
n If destination VM is behind a Fortinet and Check Point router, and configured with NAT, then use VMware VM '<name of the VM>' to VMware VM '<name of the VM>' via DNAT query.
n If destination VM is behind an NSX for vSphere or NSX-T Edge and configured with NAT, then use VMware VM '<name of the VM>' to VMware VM '<name of the VM>' query.
Considerationsn For the VM-VM path with the NSX-T logical routers where the NAT service is enabled, vRealize
Network Insight don't show the NSX-T edge firewall rules correctly for such a path.
Using vRealize Network Insight
VMware, Inc. 272
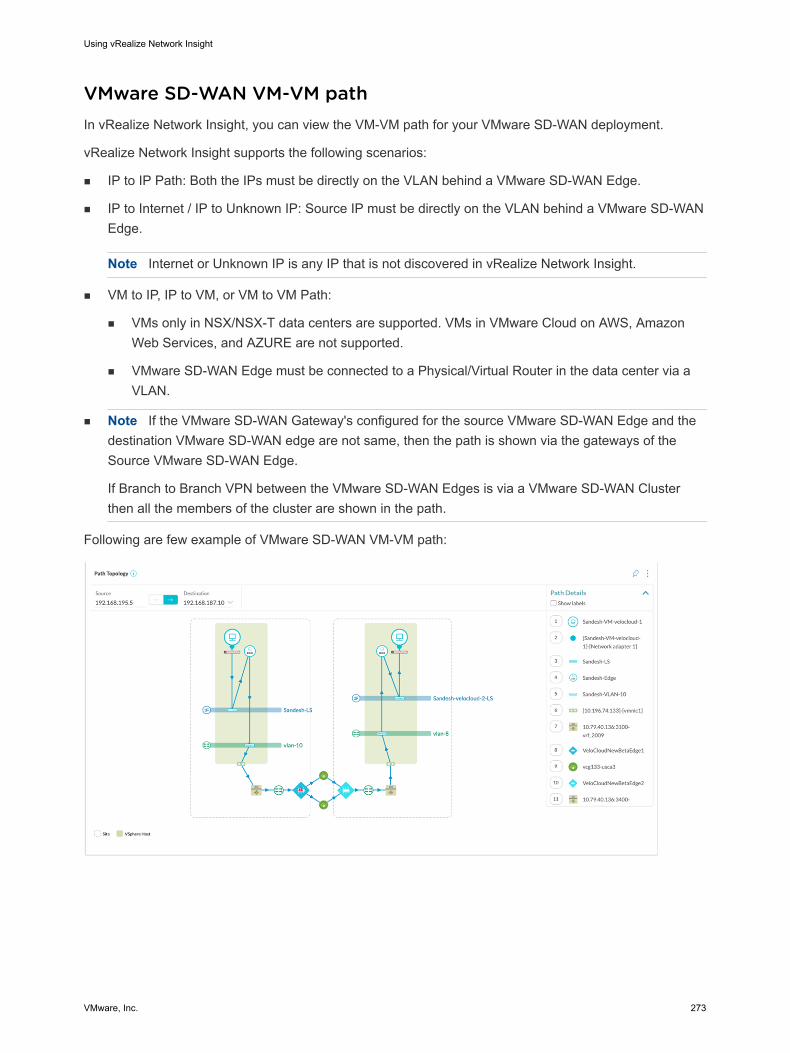
VMware SD-WAN VM-VM pathIn vRealize Network Insight, you can view the VM-VM path for your VMware SD-WAN deployment.
vRealize Network Insight supports the following scenarios:
n IP to IP Path: Both the IPs must be directly on the VLAN behind a VMware SD-WAN Edge.
n IP to Internet / IP to Unknown IP: Source IP must be directly on the VLAN behind a VMware SD-WAN Edge.
Note Internet or Unknown IP is any IP that is not discovered in vRealize Network Insight.
n VM to IP, IP to VM, or VM to VM Path:
n VMs only in NSX/NSX-T data centers are supported. VMs in VMware Cloud on AWS, Amazon Web Services, and AZURE are not supported.
n VMware SD-WAN Edge must be connected to a Physical/Virtual Router in the data center via a VLAN.
n Note If the VMware SD-WAN Gateway's configured for the source VMware SD-WAN Edge and the destination VMware SD-WAN edge are not same, then the path is shown via the gateways of the Source VMware SD-WAN Edge.
If Branch to Branch VPN between the VMware SD-WAN Edges is via a VMware SD-WAN Cluster then all the members of the cluster are shown in the path.
Following are few example of VMware SD-WAN VM-VM path:
Using vRealize Network Insight
VMware, Inc. 273
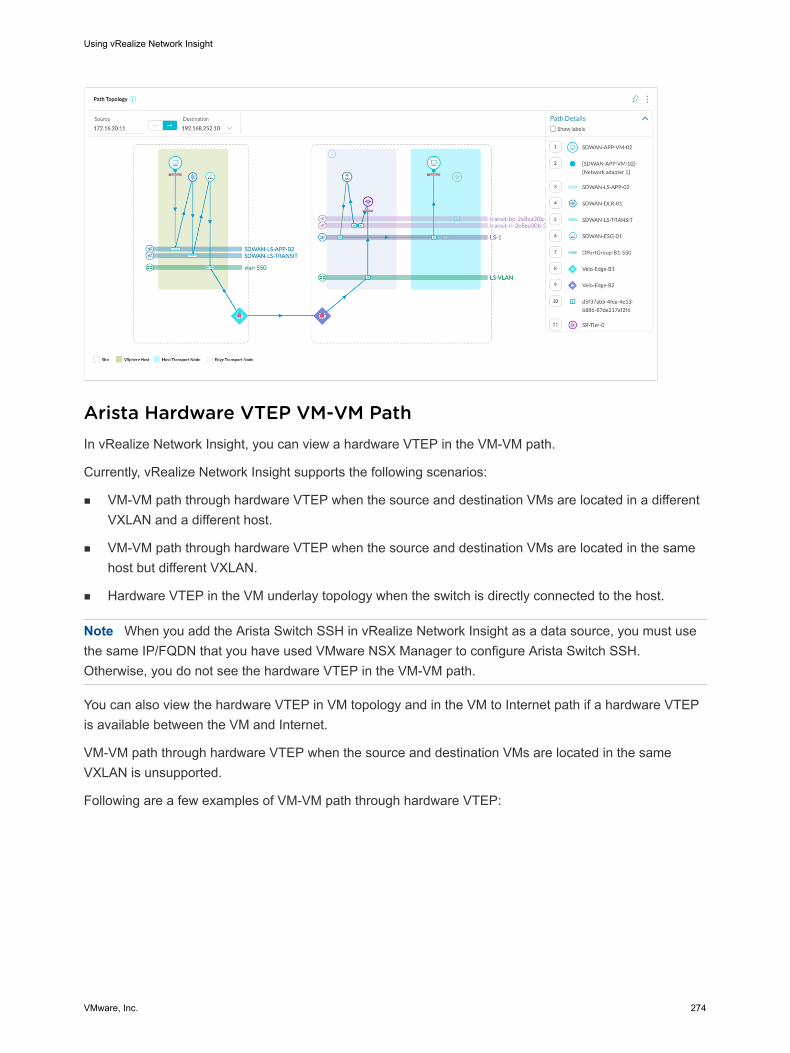
Arista Hardware VTEP VM-VM PathIn vRealize Network Insight, you can view a hardware VTEP in the VM-VM path.
Currently, vRealize Network Insight supports the following scenarios:
n VM-VM path through hardware VTEP when the source and destination VMs are located in a different VXLAN and a different host.
n VM-VM path through hardware VTEP when the source and destination VMs are located in the same host but different VXLAN.
n Hardware VTEP in the VM underlay topology when the switch is directly connected to the host.
Note When you add the Arista Switch SSH in vRealize Network Insight as a data source, you must use the same IP/FQDN that you have used VMware NSX Manager to configure Arista Switch SSH. Otherwise, you do not see the hardware VTEP in the VM-VM path.
You can also view the hardware VTEP in VM topology and in the VM to Internet path if a hardware VTEP is available between the VM and Internet.
VM-VM path through hardware VTEP when the source and destination VMs are located in the same VXLAN is unsupported.
Following are a few examples of VM-VM path through hardware VTEP:
Using vRealize Network Insight
VMware, Inc. 274
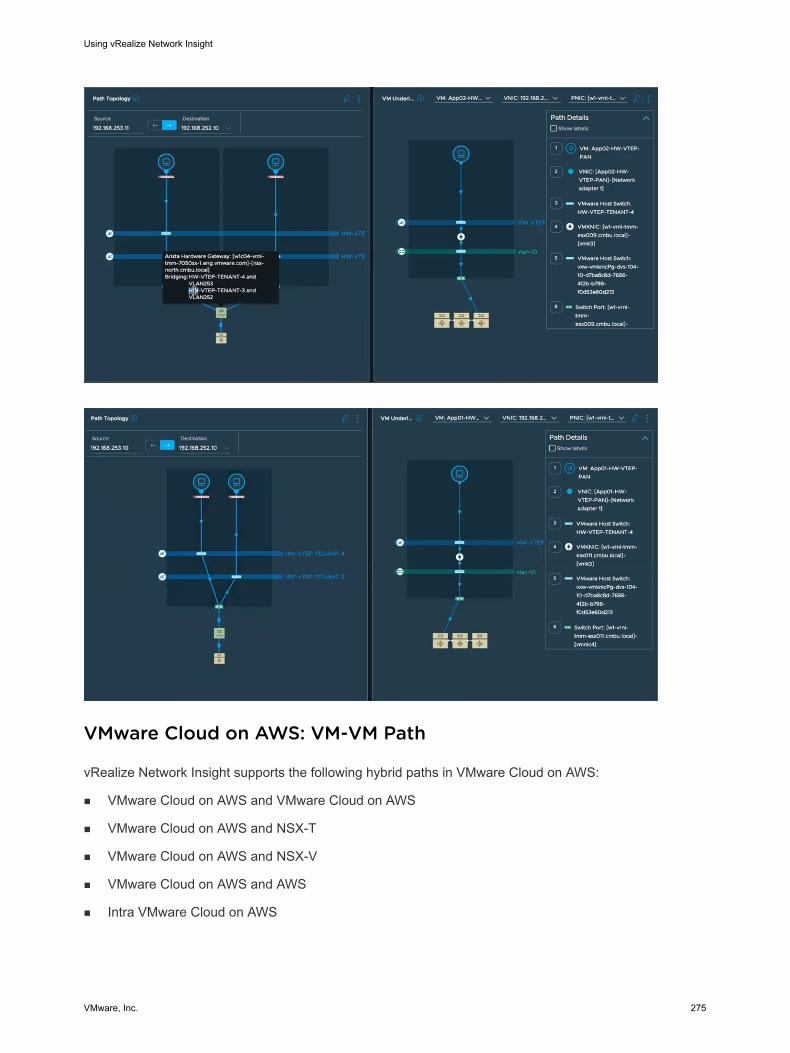
VMware Cloud on AWS: VM-VM Path
vRealize Network Insight supports the following hybrid paths in VMware Cloud on AWS:
n VMware Cloud on AWS and VMware Cloud on AWS
n VMware Cloud on AWS and NSX-T
n VMware Cloud on AWS and NSX-V
n VMware Cloud on AWS and AWS
n Intra VMware Cloud on AWS
Using vRealize Network Insight
VMware, Inc. 275
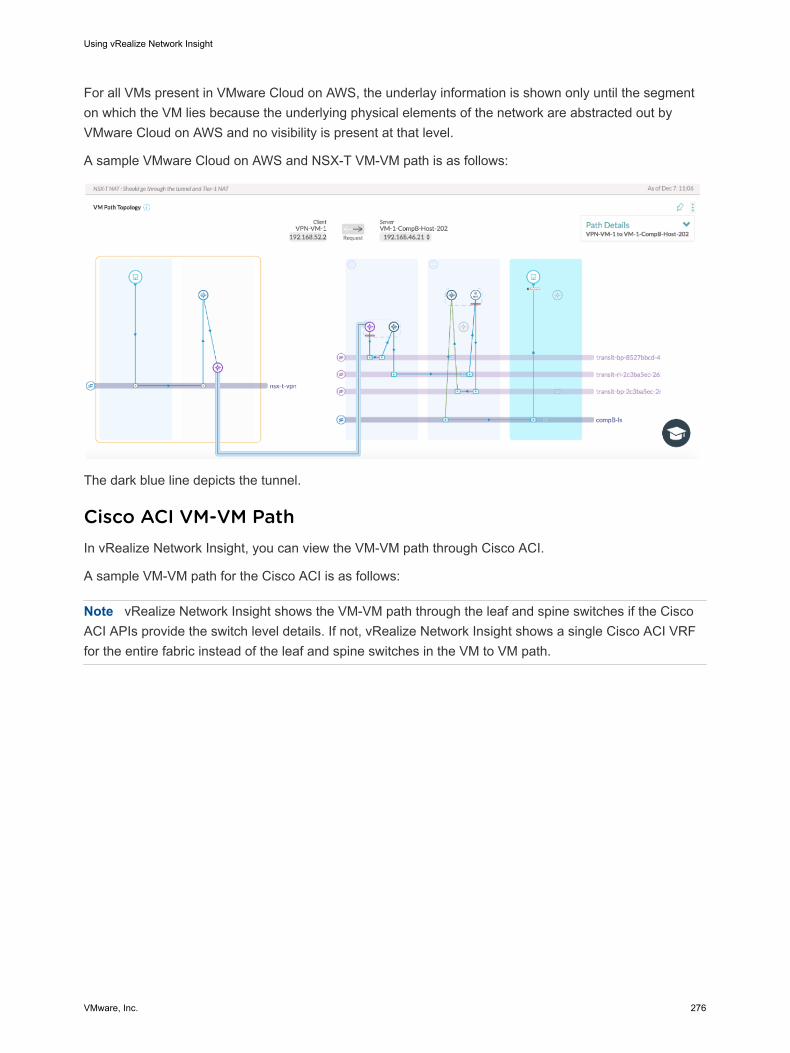
For all VMs present in VMware Cloud on AWS, the underlay information is shown only until the segment on which the VM lies because the underlying physical elements of the network are abstracted out by VMware Cloud on AWS and no visibility is present at that level.
A sample VMware Cloud on AWS and NSX-T VM-VM path is as follows:
The dark blue line depicts the tunnel.
Cisco ACI VM-VM PathIn vRealize Network Insight, you can view the VM-VM path through Cisco ACI.
A sample VM-VM path for the Cisco ACI is as follows:
Note vRealize Network Insight shows the VM-VM path through the leaf and spine switches if the Cisco ACI APIs provide the switch level details. If not, vRealize Network Insight shows a single Cisco ACI VRF for the entire fabric instead of the leaf and spine switches in the VM to VM path.
Using vRealize Network Insight
VMware, Inc. 276
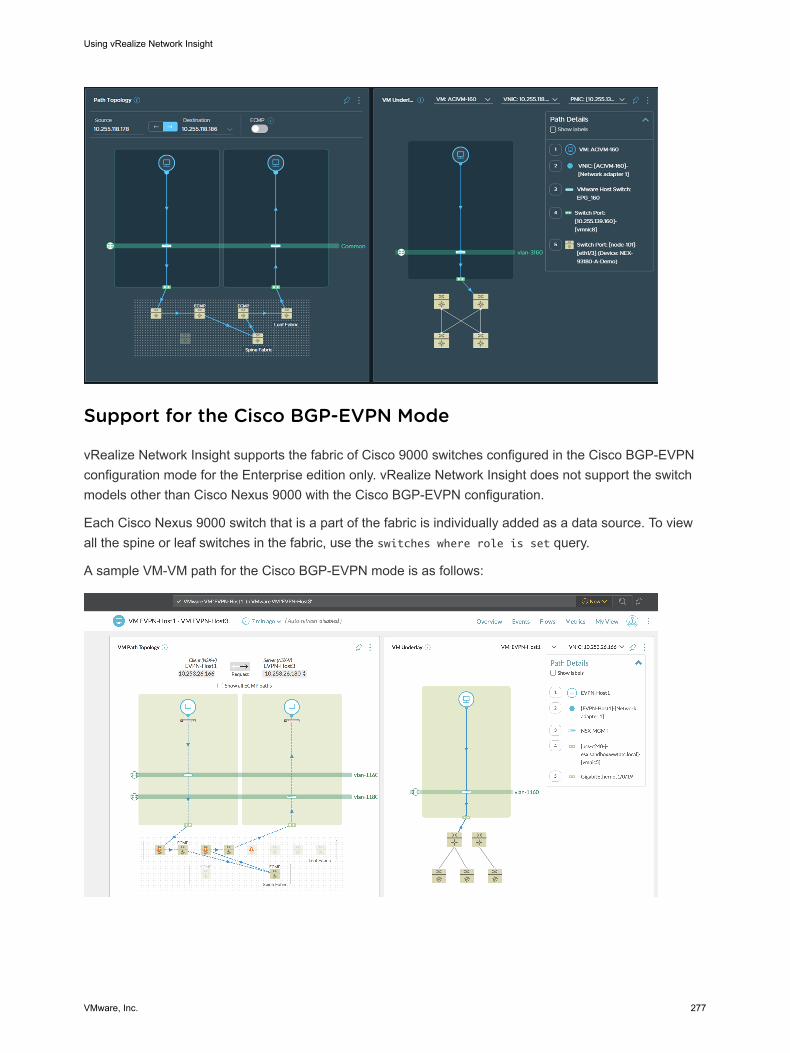
Support for the Cisco BGP-EVPN Mode
vRealize Network Insight supports the fabric of Cisco 9000 switches configured in the Cisco BGP-EVPN configuration mode for the Enterprise edition only. vRealize Network Insight does not support the switch models other than Cisco Nexus 9000 with the Cisco BGP-EVPN configuration.
Each Cisco Nexus 9000 switch that is a part of the fabric is individually added as a data source. To view all the spine or leaf switches in the fabric, use the switches where role is set query.
A sample VM-VM path for the Cisco BGP-EVPN mode is as follows:
Using vRealize Network Insight
VMware, Inc. 277
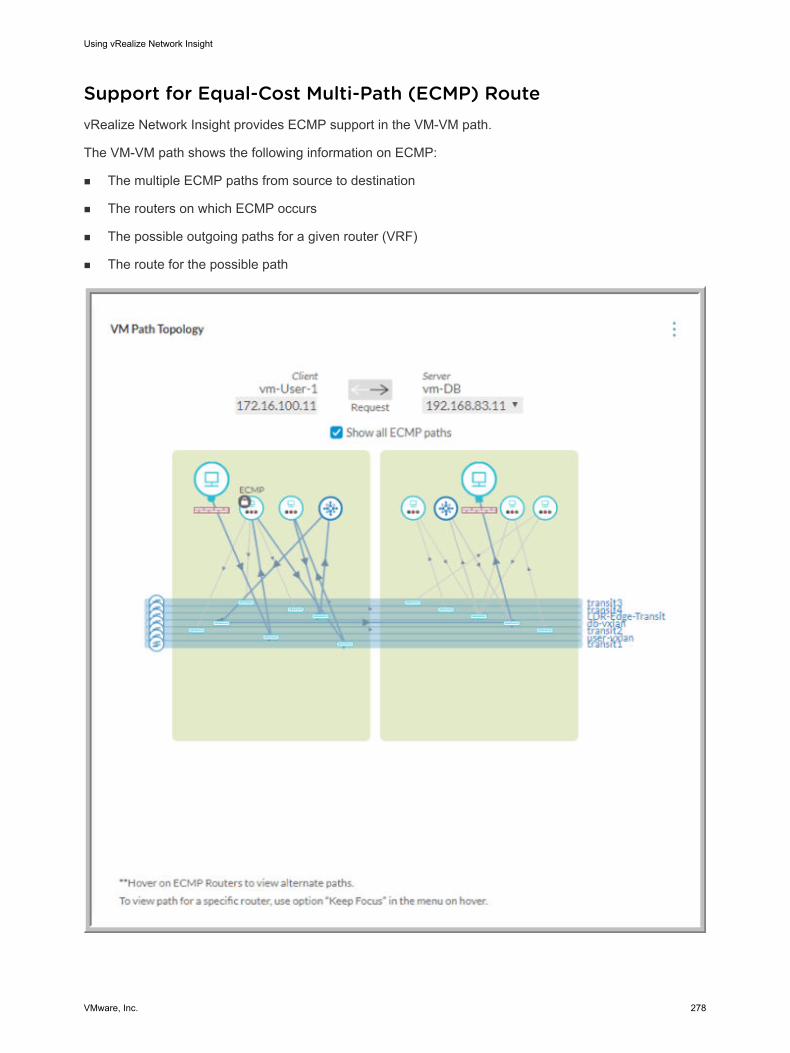
Support for Equal-Cost Multi-Path (ECMP) RoutevRealize Network Insight provides ECMP support in the VM-VM path.
The VM-VM path shows the following information on ECMP:
n The multiple ECMP paths from source to destination
n The routers on which ECMP occurs
n The possible outgoing paths for a given router (VRF)
n The route for the possible path
Using vRealize Network Insight
VMware, Inc. 278
In the preceding figure, you can see the ECMP-enabled routers. If you point over them, the additional paths are shown. Also, you can create a path by selecting and locking the routers as per your requirement. If you want to view all the ECMP paths between the two VMs, select the Show all ECMP paths option in the topology diagram.
If you want to view the path for a particular router, point on the router and click Keep Focus. The paths specific to the router is shown.
Support for the L2 Bridges
The L2 or the VLAN bridges create a single broadcast domain from multiple VLANs. In the previous releases, if the VM-VM path involved an L2 bridge between two or more VLANs, the VM-VM path did not work. From this release onwards, vRealize Network Insight supports L2 bridging. Currently, this feature is supported only for the Cisco ASA routers.
Viewing BGP Neighbours DetailsIn vRealize Network Insight you can see various information on BGP Neighbours. You can view the BGP neighbors of an NSX edge or a logical router.
Procedure
1 Enter Router where bgp= 'Disabled' in the search bar and press Enter.
2 Expand the particular router from list to see the details.
You can view the following information under BGP neighbours for NSX-V:
n IP Address
n Remote AS
n Weight
n Keep Alive Time
n Hold Down Time
n Status
You can view the following information under BGP neighbours for NSX-T:
n IP Address
n Remote AS
n Keep Alive Time
n Hold Down Time
Using vRealize Network Insight
VMware, Inc. 279
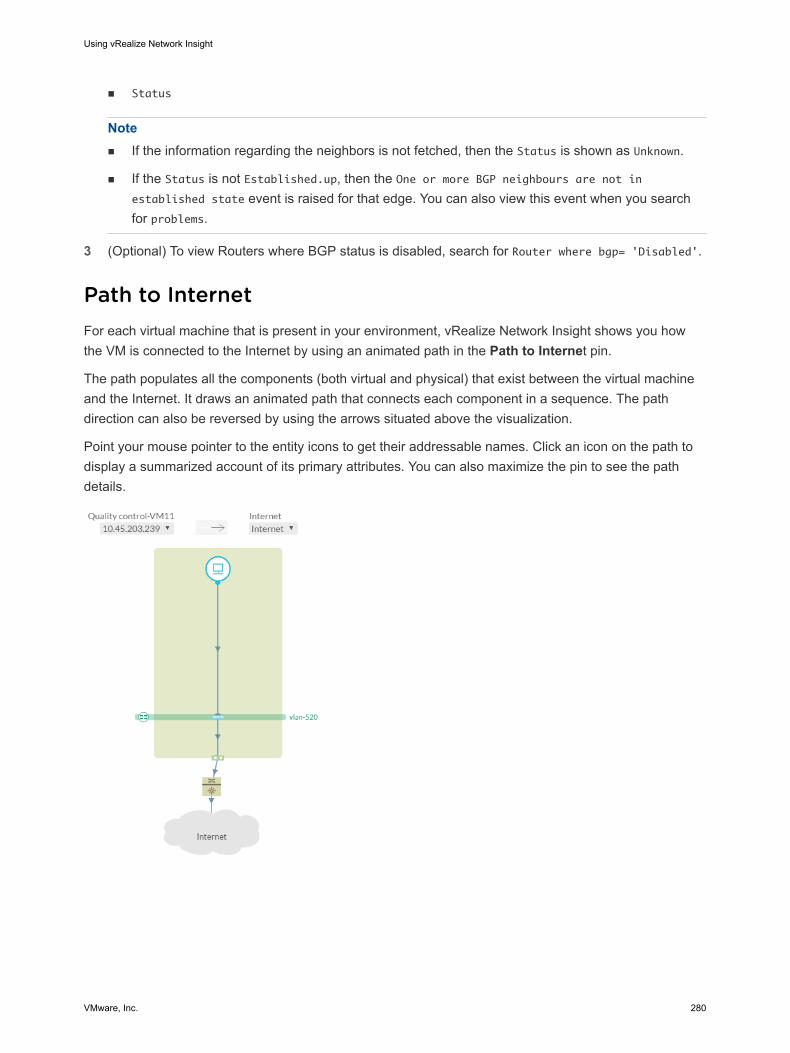
n Status
Note n If the information regarding the neighbors is not fetched, then the Status is shown as Unknown.
n If the Status is not Established.up, then the One or more BGP neighbours are not in established state event is raised for that edge. You can also view this event when you search for problems.
3 (Optional) To view Routers where BGP status is disabled, search for Router where bgp= 'Disabled'.
Path to InternetFor each virtual machine that is present in your environment, vRealize Network Insight shows you how the VM is connected to the Internet by using an animated path in the Path to Internet pin.
The path populates all the components (both virtual and physical) that exist between the virtual machine and the Internet. It draws an animated path that connects each component in a sequence. The path direction can also be reversed by using the arrows situated above the visualization.
Point your mouse pointer to the entity icons to get their addressable names. Click an icon on the path to display a summarized account of its primary attributes. You can also maximize the pin to see the path details.
Using vRealize Network Insight
VMware, Inc. 280
Security 17This chapter includes the following topics:
n Cross vCenter NSX
n Palo Alto Networks
n Cisco ASA Firewall
n Check Point Firewall
n Security Groups
n Policy-Based VPN
n NSX Distributed Firewall Inactive Rules
n Fortinet Firewall
Cross vCenter NSXIn a cross-vCenter NSX environment, you can have multiple vCenter Servers, each of which must be paired with its own NSX Manager.
One NSX Manager is assigned the role of primary NSX Manager, and the others are assigned the role of secondary NSX Manager. The primary NSX Manager is used to deploy a universal controller cluster that provides the control plane for the cross-vCenter NSX environment. The secondary NSX Managers do not have their own controller clusters. The primary NSX Manager can create universal objects, such as universal logical switches. These objects are synchronized to the secondary NSX Managers by the NSX Universal Synchronization Service. You can view these objects from the secondary NSX Managers, but you cannot edit them there. You must use the primary NSX Manager to manage universal objects. The primary NSX Manager can be used to configure any of the secondary NSX Managers in the environment.
The following Universal objects are supported:
n Universal LDR
n Universal Transport Zone
n Universal Logical Switch
n Universal Firewall Rule
VMware, Inc. 281
n Universal Security Group
n Universal IPSets
n Universal Service
n Universal Service Groups
n Universal Segment Range
Palo Alto NetworksvRealize Network Insight supports the Palo Alto Panorama firewall.
Note vRealize Network Insight does not support the Palo Alto Panorama integration with multiple NSX managers.
To add the Palo Alto Panorama in vRealize Network Insight, the Palo Alto Networks user must have admin role with XML API access. In the Paloalto networks UI, do the following steps to add an admin role for XML API.
1 Select Panorama > Admin Roles.
2 Click Add to add a new admin role.
3 The Admin Role Profile window opens.
4 Enter the name to the role and select Panorama.
5 Click the Web UI tab and disable all entries.
6 Click the XML API tab and disable all entries, except configuration and Operational Requests.
7 Click OK to close the window.
The new admin role appears in the list.
8 Click Commit.
9 Assign this role to an administrator account or create a new user and assign this role to the new user.
The Palo Alto Network features that are supported by vRealize Network Insight are as follows:
n Interrelation of Palo Alto and NSX entities: The VM membership of the address and the address group of Palo Alto Networks is computed based on the IP Address to VM mapping. This membership info can be queried as follows:
n VM where Address = <>
n Palo Alto address where vm = <>
n VM where Address Group = <>
n Palo Alto address group where vm = <>
Using vRealize Network Insight
VMware, Inc. 282
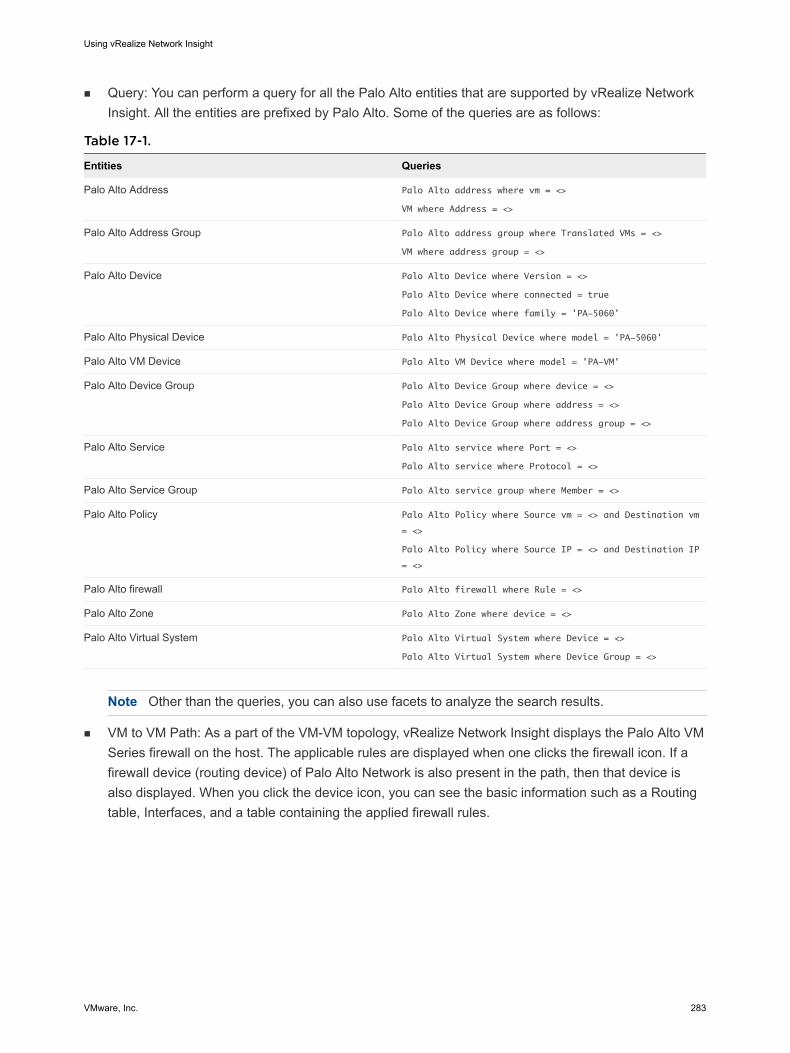
n Query: You can perform a query for all the Palo Alto entities that are supported by vRealize Network Insight. All the entities are prefixed by Palo Alto. Some of the queries are as follows:
Table 17-1.
Entities Queries
Palo Alto Address Palo Alto address where vm = <>
VM where Address = <>
Palo Alto Address Group Palo Alto address group where Translated VMs = <>
VM where address group = <>
Palo Alto Device Palo Alto Device where Version = <>
Palo Alto Device where connected = true
Palo Alto Device where family = 'PA-5060'
Palo Alto Physical Device Palo Alto Physical Device where model = 'PA-5060'
Palo Alto VM Device Palo Alto VM Device where model = 'PA-VM'
Palo Alto Device Group Palo Alto Device Group where device = <>
Palo Alto Device Group where address = <>
Palo Alto Device Group where address group = <>
Palo Alto Service Palo Alto service where Port = <>
Palo Alto service where Protocol = <>
Palo Alto Service Group Palo Alto service group where Member = <>
Palo Alto Policy Palo Alto Policy where Source vm = <> and Destination vm
= <>
Palo Alto Policy where Source IP = <> and Destination IP
= <>
Palo Alto firewall Palo Alto firewall where Rule = <>
Palo Alto Zone Palo Alto Zone where device = <>
Palo Alto Virtual System Palo Alto Virtual System where Device = <>
Palo Alto Virtual System where Device Group = <>
Note Other than the queries, you can also use facets to analyze the search results.
n VM to VM Path: As a part of the VM-VM topology, vRealize Network Insight displays the Palo Alto VM Series firewall on the host. The applicable rules are displayed when one clicks the firewall icon. If a firewall device (routing device) of Palo Alto Network is also present in the path, then that device is also displayed. When you click the device icon, you can see the basic information such as a Routing table, Interfaces, and a table containing the applied firewall rules.
Using vRealize Network Insight
VMware, Inc. 283
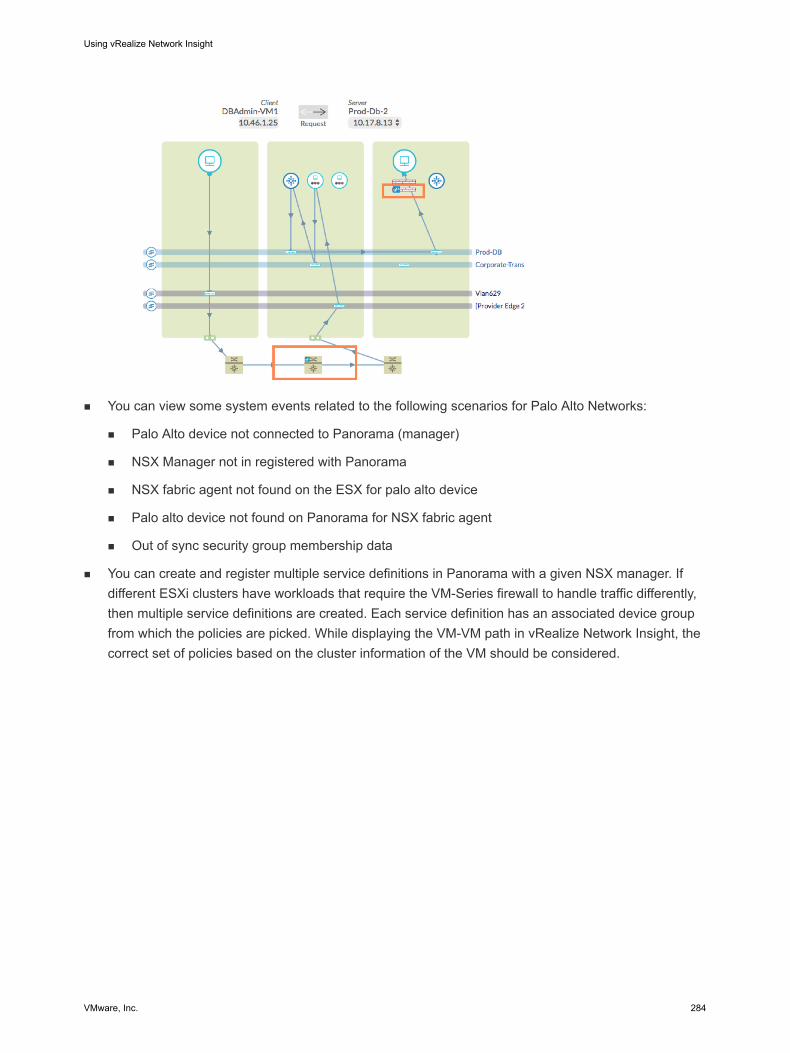
n You can view some system events related to the following scenarios for Palo Alto Networks:
n Palo Alto device not connected to Panorama (manager)
n NSX Manager not in registered with Panorama
n NSX fabric agent not found on the ESX for palo alto device
n Palo alto device not found on Panorama for NSX fabric agent
n Out of sync security group membership data
n You can create and register multiple service definitions in Panorama with a given NSX manager. If different ESXi clusters have workloads that require the VM-Series firewall to handle traffic differently, then multiple service definitions are created. Each service definition has an associated device group from which the policies are picked. While displaying the VM-VM path in vRealize Network Insight, the correct set of policies based on the cluster information of the VM should be considered.
Using vRealize Network Insight
VMware, Inc. 284
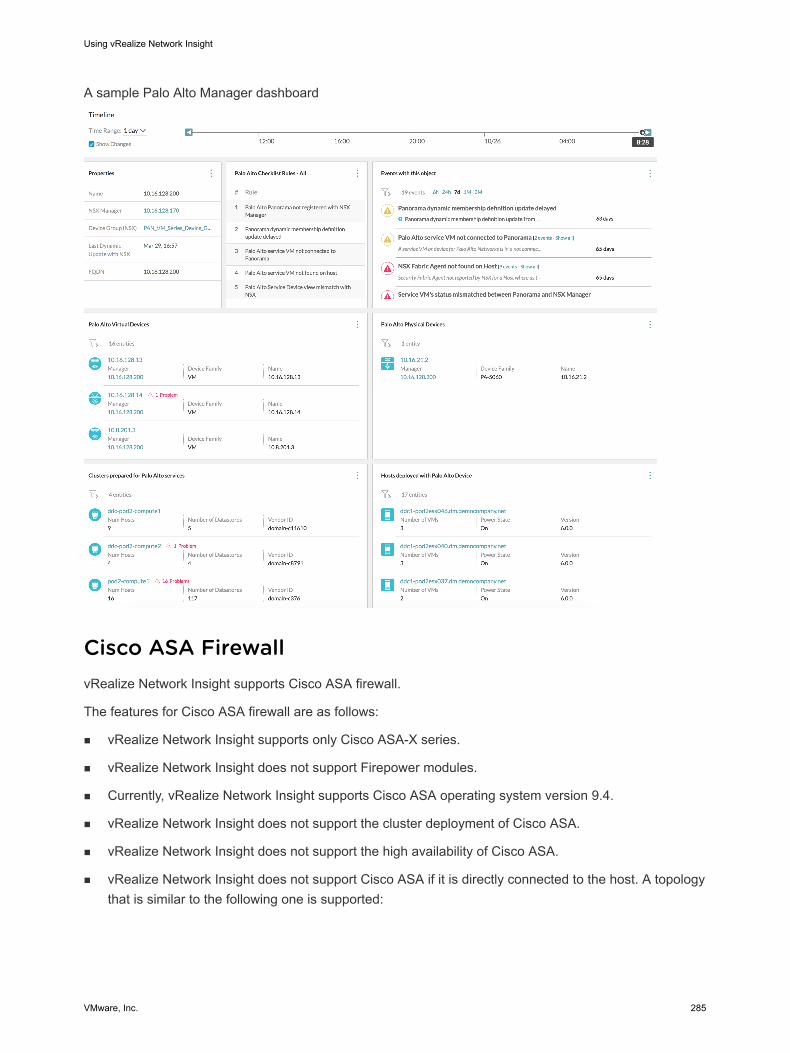
A sample Palo Alto Manager dashboard
Cisco ASA FirewallvRealize Network Insight supports Cisco ASA firewall.
The features for Cisco ASA firewall are as follows:
n vRealize Network Insight supports only Cisco ASA-X series.
n vRealize Network Insight does not support Firepower modules.
n Currently, vRealize Network Insight supports Cisco ASA operating system version 9.4.
n vRealize Network Insight does not support the cluster deployment of Cisco ASA.
n vRealize Network Insight does not support the high availability of Cisco ASA.
n vRealize Network Insight does not support Cisco ASA if it is directly connected to the host. A topology that is similar to the following one is supported:
Using vRealize Network Insight
VMware, Inc. 285
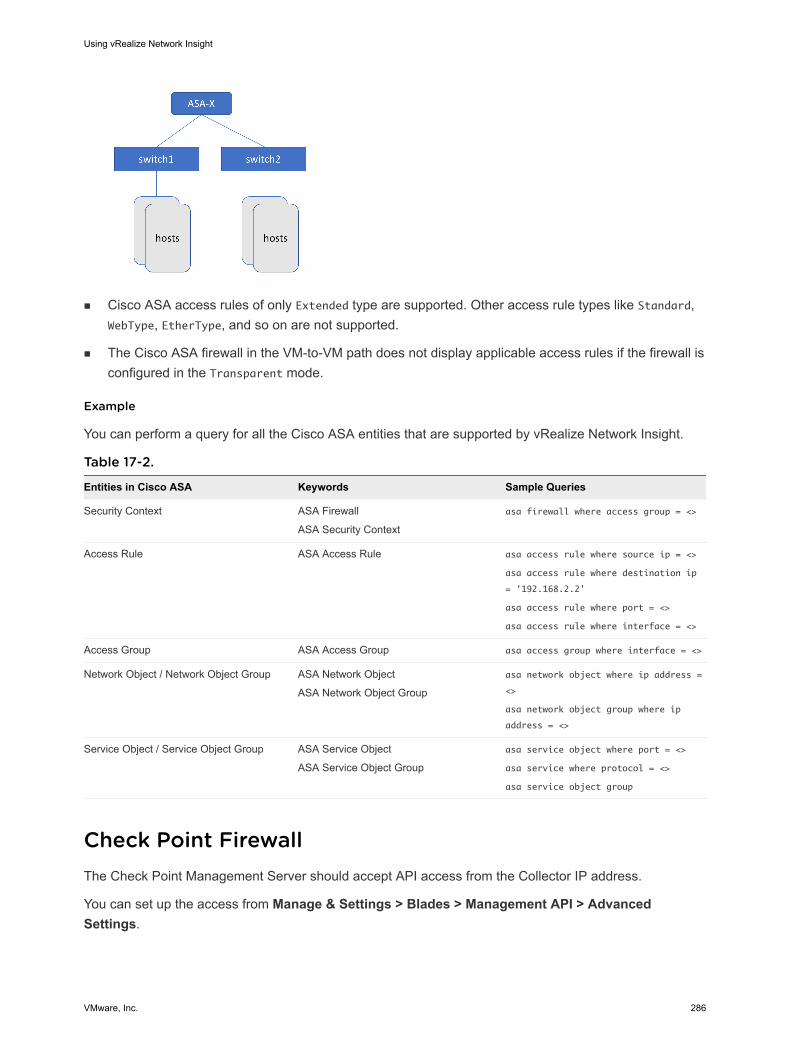
n Cisco ASA access rules of only Extended type are supported. Other access rule types like Standard, WebType, EtherType, and so on are not supported.
n The Cisco ASA firewall in the VM-to-VM path does not display applicable access rules if the firewall is configured in the Transparent mode.
Example
You can perform a query for all the Cisco ASA entities that are supported by vRealize Network Insight.
Table 17-2.
Entities in Cisco ASA Keywords Sample Queries
Security Context ASA Firewall
ASA Security Context
asa firewall where access group = <>
Access Rule ASA Access Rule asa access rule where source ip = <>
asa access rule where destination ip
= '192.168.2.2'
asa access rule where port = <>
asa access rule where interface = <>
Access Group ASA Access Group asa access group where interface = <>
Network Object / Network Object Group ASA Network Object
ASA Network Object Group
asa network object where ip address =
<>
asa network object group where ip
address = <>
Service Object / Service Object Group ASA Service Object
ASA Service Object Group
asa service object where port = <>
asa service where protocol = <>
asa service object group
Check Point FirewallThe Check Point Management Server should accept API access from the Collector IP address.
You can set up the access from Manage & Settings > Blades > Management API > Advanced Settings.
Using vRealize Network Insight
VMware, Inc. 286
If Check Point MDS is added as data-source, vRealize Network Insight fetches data from all the user-defined domains and the global domain.
vRealize Network Insight uses Check Point public Web API for fetching the data from the Check Point management server. If the VSX gateway is attached to the management server, we use SSH-based CLI commands to fetch the VSX-managed Virtual System VS routing table to support display of the VS gateway in the VM-VM path.
vRealize Network Insight requires read-only privileges for the Web-API access for fetching most of the Check Point data. There are few exceptions as follows:
n If a non-VSX physical gateway is attached to the management server, the user should have read-write access privileges for the Web API. This is required to fetch the gateway routes for using the run script Web API for the VM-VM path computation.
n If a VSX gateway is attached to the management server, the user should have the SSH access with the same password. In addition, the user should have access to the CLI command vsx_util view_vs_conf. This command is used to fetch the VSX gateway routes for the VM-VM path computation.
n For MDS server IP as data-source, the user should have the Web API access to all domains including the MDS domain and the global domain. It is required to fetch rules, policy packages and other data from all the domains.
You can perform a query for all the Check Point entities that are supported by vRealize Network Insight. All the entities are prefixed by Check Point. Some of the queries for Check Point are as follows:
Table 17-3.
Entities in Check Point Keywords Queries
IPset Check Point Address Range
Check Point Network
vm where Address Range = <>
vm where Address Range = <>
Check Point Address Range where Translated VM =
<>
Grouping Check Point Network Group Check Point Network Group where Translated VM =
<>
vm where Network Group = <>
Service/ Service Group Check Point Service
Check Point Service Group
Check point service where Port = <>
Check point service where protocol = <>
Access Layer Check Point Access Layer Check Point Policy where Access Layer = <>
Domain Check Point Domain check point domain where ip address = <>
check point policy where domain = <>
check point access layer where domain = <>
Gateways and Gateway Cluster
Check Point Gateway
Check Point Gateway Cluster
Check Point Gateway Cluster where Policy Package
= <>
Using vRealize Network Insight
VMware, Inc. 287
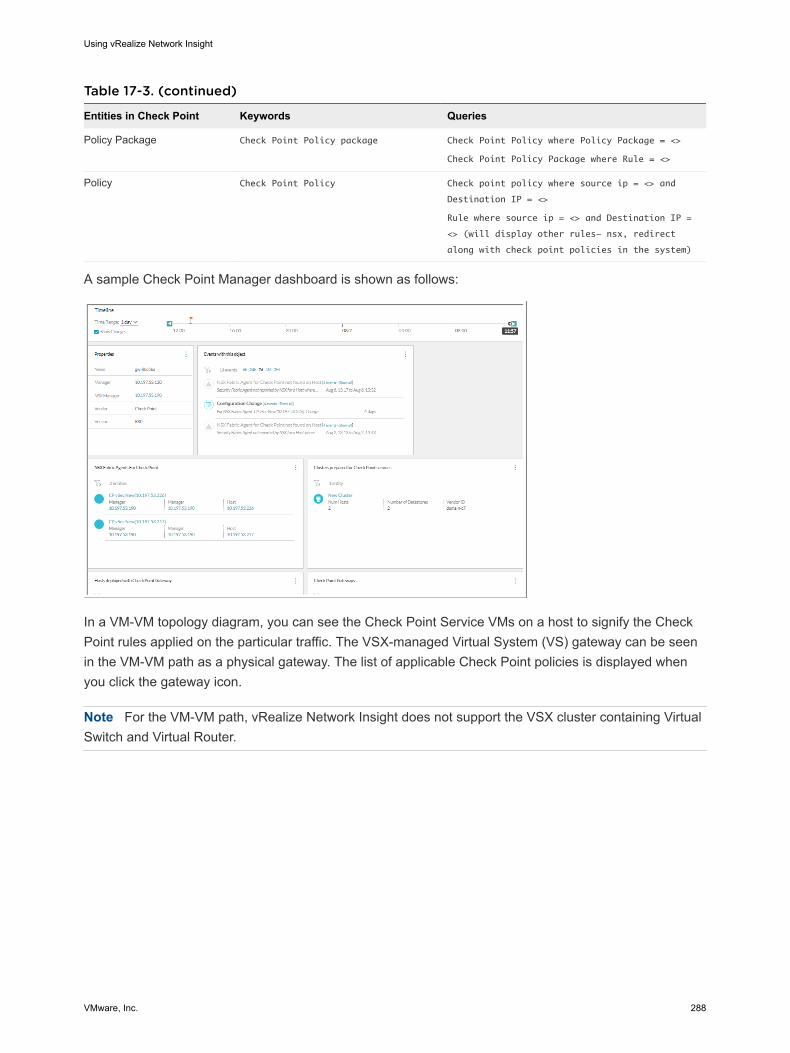
Table 17-3. (continued)
Entities in Check Point Keywords Queries
Policy Package Check Point Policy package Check Point Policy where Policy Package = <>
Check Point Policy Package where Rule = <>
Policy Check Point Policy Check point policy where source ip = <> and
Destination IP = <>
Rule where source ip = <> and Destination IP =
<> (will display other rules- nsx, redirect
along with check point policies in the system)
A sample Check Point Manager dashboard is shown as follows:
In a VM-VM topology diagram, you can see the Check Point Service VMs on a host to signify the Check Point rules applied on the particular traffic. The VSX-managed Virtual System (VS) gateway can be seen in the VM-VM path as a physical gateway. The list of applicable Check Point policies is displayed when you click the gateway icon.
Note For the VM-VM path, vRealize Network Insight does not support the VSX cluster containing Virtual Switch and Virtual Router.
Using vRealize Network Insight
VMware, Inc. 288
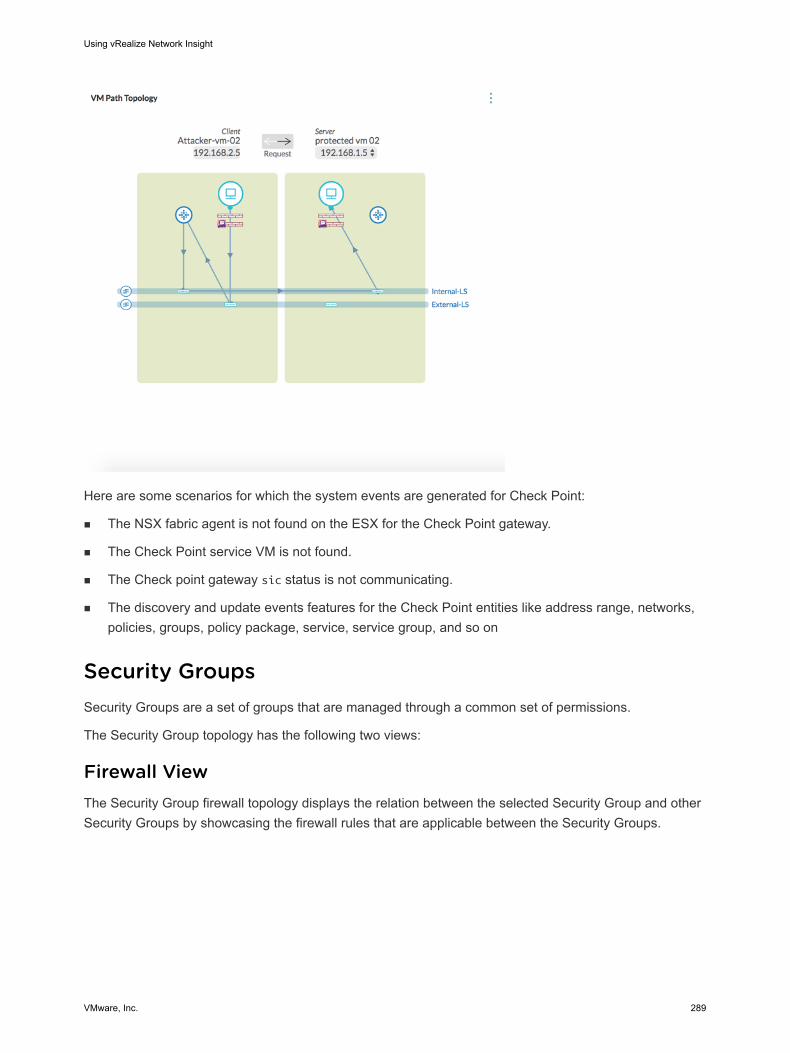
Here are some scenarios for which the system events are generated for Check Point:
n The NSX fabric agent is not found on the ESX for the Check Point gateway.
n The Check Point service VM is not found.
n The Check point gateway sic status is not communicating.
n The discovery and update events features for the Check Point entities like address range, networks, policies, groups, policy package, service, service group, and so on
Security GroupsSecurity Groups are a set of groups that are managed through a common set of permissions.
The Security Group topology has the following two views:
Firewall ViewThe Security Group firewall topology displays the relation between the selected Security Group and other Security Groups by showcasing the firewall rules that are applicable between the Security Groups.
Using vRealize Network Insight
VMware, Inc. 289
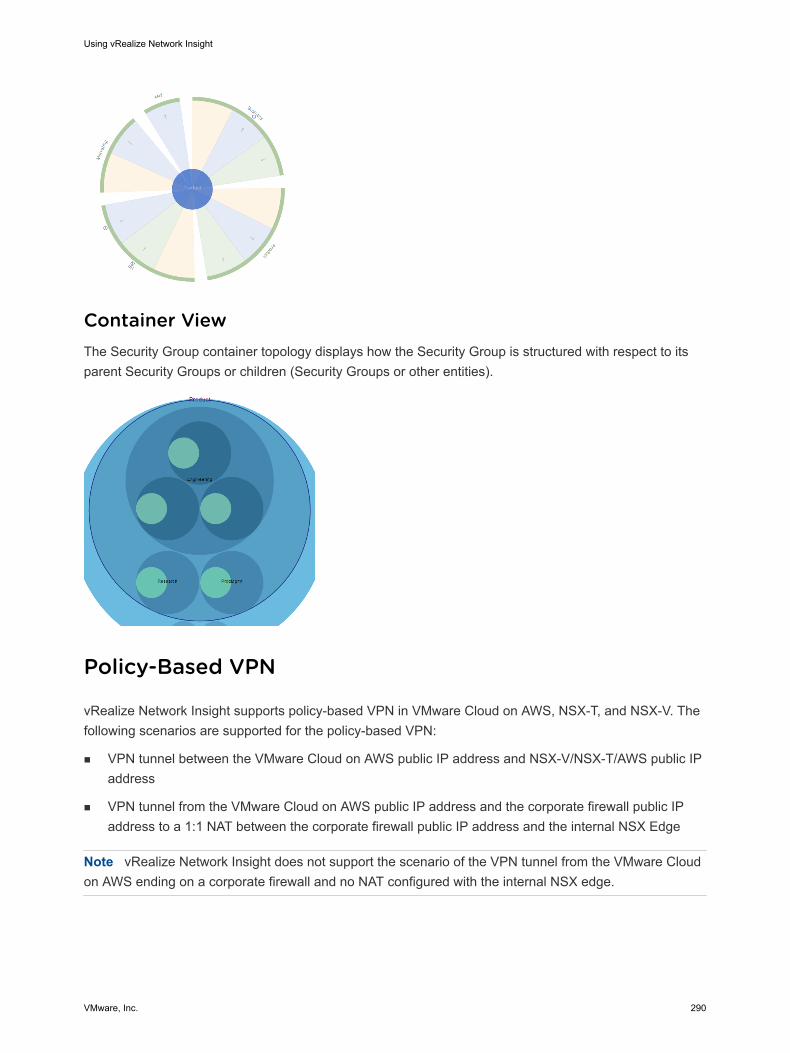
Container ViewThe Security Group container topology displays how the Security Group is structured with respect to its parent Security Groups or children (Security Groups or other entities).
Policy-Based VPN
vRealize Network Insight supports policy-based VPN in VMware Cloud on AWS, NSX-T, and NSX-V. The following scenarios are supported for the policy-based VPN:
n VPN tunnel between the VMware Cloud on AWS public IP address and NSX-V/NSX-T/AWS public IP address
n VPN tunnel from the VMware Cloud on AWS public IP address and the corporate firewall public IP address to a 1:1 NAT between the corporate firewall public IP address and the internal NSX Edge
Note vRealize Network Insight does not support the scenario of the VPN tunnel from the VMware Cloud on AWS ending on a corporate firewall and no NAT configured with the internal NSX edge.
Using vRealize Network Insight
VMware, Inc. 290
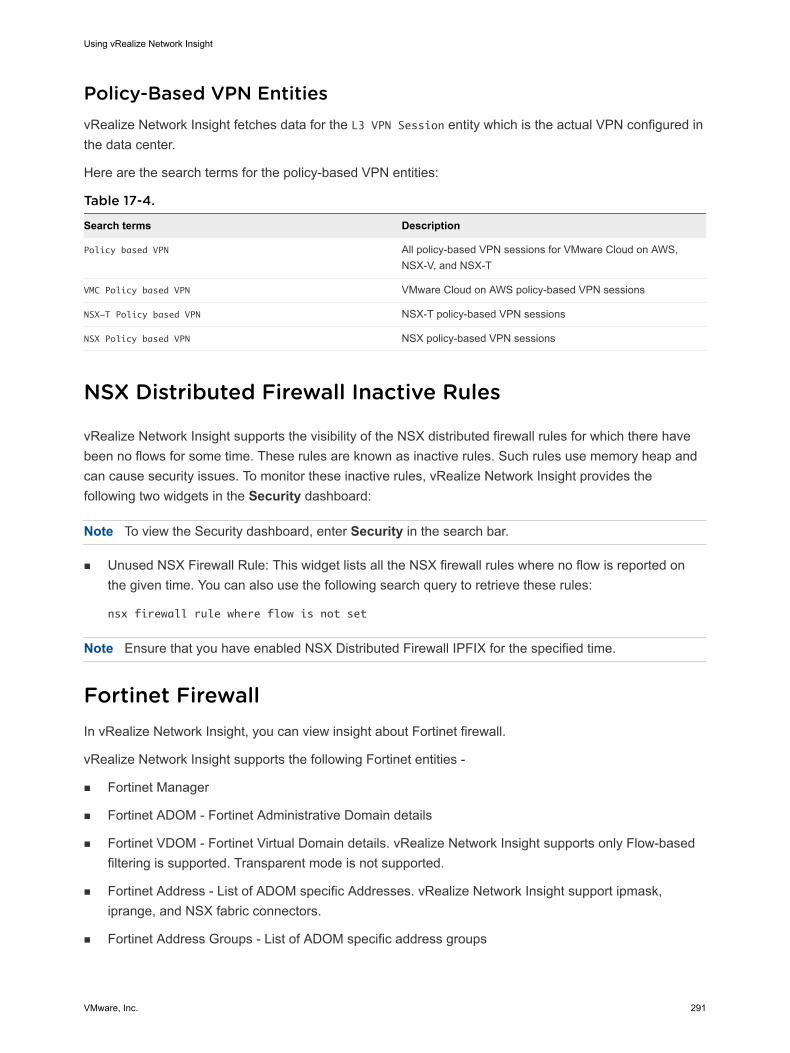
Policy-Based VPN EntitiesvRealize Network Insight fetches data for the L3 VPN Session entity which is the actual VPN configured in the data center.
Here are the search terms for the policy-based VPN entities:
Table 17-4.
Search terms Description
Policy based VPN All policy-based VPN sessions for VMware Cloud on AWS, NSX-V, and NSX-T
VMC Policy based VPN VMware Cloud on AWS policy-based VPN sessions
NSX-T Policy based VPN NSX-T policy-based VPN sessions
NSX Policy based VPN NSX policy-based VPN sessions
NSX Distributed Firewall Inactive Rules
vRealize Network Insight supports the visibility of the NSX distributed firewall rules for which there have been no flows for some time. These rules are known as inactive rules. Such rules use memory heap and can cause security issues. To monitor these inactive rules, vRealize Network Insight provides the following two widgets in the Security dashboard:
Note To view the Security dashboard, enter Security in the search bar.
n Unused NSX Firewall Rule: This widget lists all the NSX firewall rules where no flow is reported on the given time. You can also use the following search query to retrieve these rules:
nsx firewall rule where flow is not set
Note Ensure that you have enabled NSX Distributed Firewall IPFIX for the specified time.
Fortinet FirewallIn vRealize Network Insight, you can view insight about Fortinet firewall.
vRealize Network Insight supports the following Fortinet entities -
n Fortinet Manager
n Fortinet ADOM - Fortinet Administrative Domain details
n Fortinet VDOM - Fortinet Virtual Domain details. vRealize Network Insight supports only Flow-based filtering is supported. Transparent mode is not supported.
n Fortinet Address - List of ADOM specific Addresses. vRealize Network Insight support ipmask, iprange, and NSX fabric connectors.
n Fortinet Address Groups - List of ADOM specific address groups
Using vRealize Network Insight
VMware, Inc. 291
n Fortinet Dynamic Addresses - List of ADOM specific dynamic addresses (VDOM Mapped Addresses)
n Fortinet Dynamic Address Groups - List of ADOM specific dynamic address groups (VDOM Mapped Address Groups)
n Fortinet Dynamic Interfaces - List of ADOM specific dynamic interfaces.
n Fortinet Zones - List of ADOM specific zones.
n Fortinet Services - List of manual and auto generated services for each ADOM.
n Fortinet Service Groups - List of service groups for each ADOM.
n Fortinet Policy - Fortinet Policies for each ADOM. We currently support only IPv4 policies, Fortinet Global Header Policies, and Fortinet Global Footer policies.
n Fortinet Policy Packages - List of Policy packages. The policy packages name also contain the path to the policy package preceding the name of package.
n Fortinet Devices - List of Fortinet devices that are associated with the FortiManager.
n Fortinet Device Groups - List of Fortinet Device Groups specified by the user.
The followings are not supported:
n VM to VM path in NAT mode.
n VM to VM path for physical devices in transparent mode.
n Advanced (non-IP based) policy properties like User, User Group, Application, and Security Profile.
Using vRealize Network Insight
VMware, Inc. 292
Working with Micro-Segmentation 18vRealize Network Insight provides planning and recommendations for implementing the micro-segmentation security. It helps the user to manage and scale the VMware NSX deployments quickly and confidently.
This chapter includes the following topics:
n Analyzing the Application
n Application Discovery
n VMware Cloud on AWS: Planning and Micro-Segmentation
Analyzing the ApplicationThe micro-segmentation planning topology shows all the flows that are present in your environment by dividing the flows into segments.
In vRealize Network Insight, a flow is a 4-tuple. It includes:
n Source IP
n Destination IP
n Destination port
n Protocol
You can view the data in two formats: Donut View and the Grid View
Viewing Micro-Segmentation And Flow Data in Donut ViewIn the Donut view, the blue lines denote the outgoing flows, the green lines denote the incoming flows, and the yellow lines denote the flows that are bidirectional. You can click any of the segments to view its details.
VMware, Inc. 293
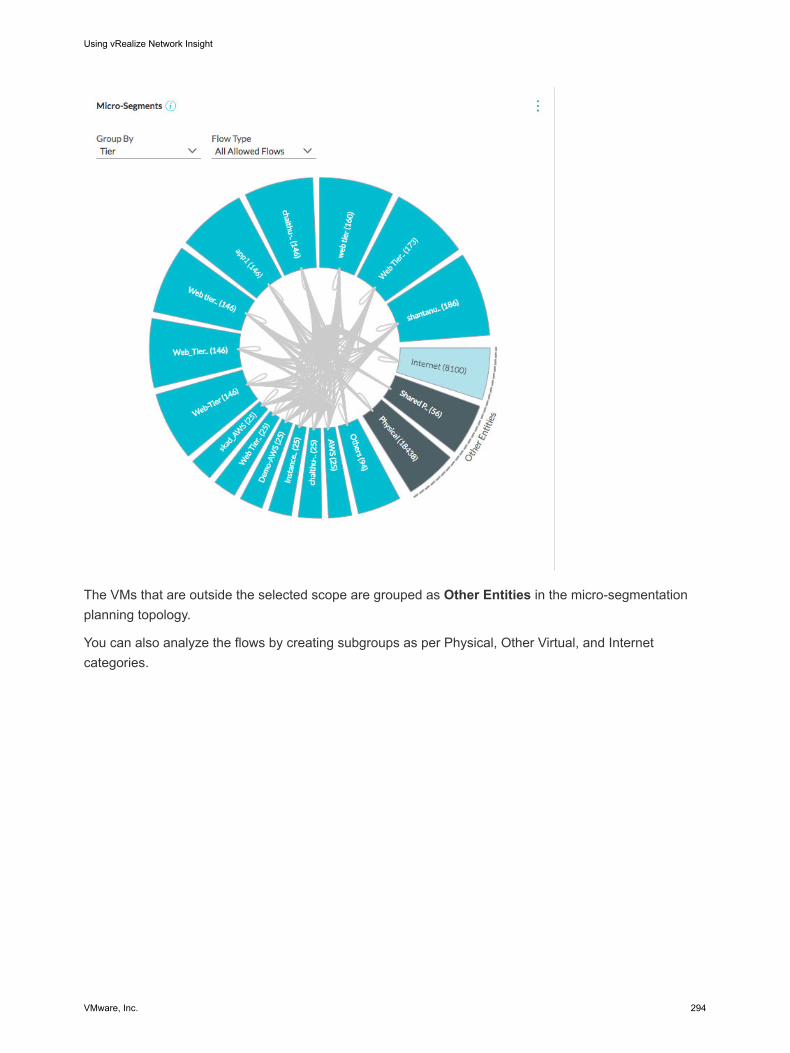
The VMs that are outside the selected scope are grouped as Other Entities in the micro-segmentation planning topology.
You can also analyze the flows by creating subgroups as per Physical, Other Virtual, and Internet categories.
Using vRealize Network Insight
VMware, Inc. 294
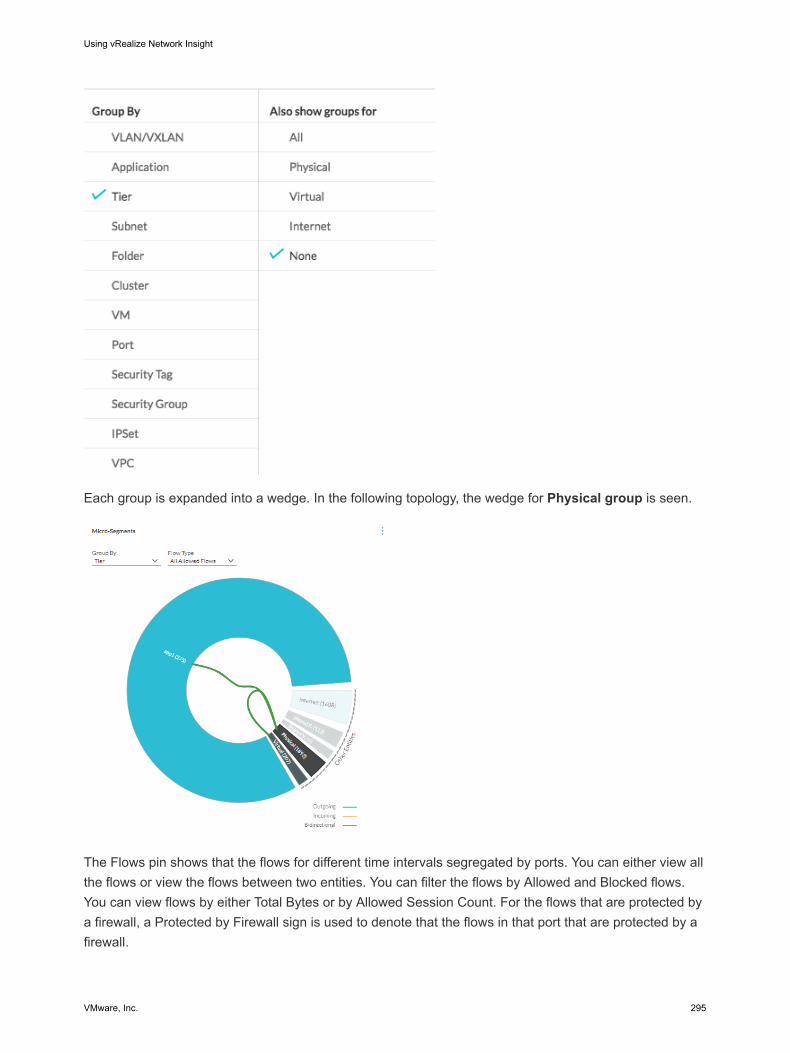
Each group is expanded into a wedge. In the following topology, the wedge for Physical group is seen.
The Flows pin shows that the flows for different time intervals segregated by ports. You can either view all the flows or view the flows between two entities. You can filter the flows by Allowed and Blocked flows. You can view flows by either Total Bytes or by Allowed Session Count. For the flows that are protected by a firewall, a Protected by Firewall sign is used to denote that the flows in that port that are protected by a firewall.
Using vRealize Network Insight
VMware, Inc. 295
The planning for a scope such as an entire data center or a cluster selects flows that have VMs or Physical Servers (identified by the Physical IPs) as the source or the destination.
A topology has two distinct zones:
n Internal: This zone includes the VMs or the IP addresses in the scope.
n External: This zone includes the VMs or the IP addresses that are out of scope but talk to the VM or IP addresses in the internal zone. The external zone consists of the following wedges:
n DC Virtual: It includes the source or the destination data center internal VMs that are talking to VMs or IP addresses in the internal zone and are not hosting any well-known shared services such as LDAP, NTP, and so on.
n Shared Virtual: It includes the destination data center internal VMs hosting well-known shared services such as LDAP, NTP, and so on to which the VMs or IP addresses in the internal zone are talking.
n DC Physical: It includes the source or the destination data center internal physical IP addresses that are talking to VMs or IP addresses in the internal zone and are not hosting any well-known shared services like LDAP, NTP, and so on.
n Shared Physical: It includes the destination data center internal Physical IP addresses hosting well-known shared services such as LDAP, NTP, and so on to which the VMs or IP addresses in the internal zone are talking.
n Internet: It includes the source or the destination data center external VMs or the physical IP addresses that are talking to the VMs or IP addresses in the internal zone.
Note n Data center Internal implies RFC 1918 designated IPs by default + any overrides defined in E-W
settings.
n Data center External implies non-RFC 1918 designated IPs by default + any overrides defined in N-S settings.
View Micro-segmentation And Flow Data in Grid ViewvRealize Network Insight enables you to see the communication between objects in a tabular or grid view.
Procedure
1 Navigate to Security > Plan Security and click the grid view icon.
2 Select a value for Group By option, for example VMs, Application, Security Groups to see the corresponding details in the tabular format.
Field Name Description
Source Object Name of the source
Destination Object Name of the destination
Using vRealize Network Insight
VMware, Inc. 296
Field Name Description
Related Flows Count of communication or flows between the source and destination
Click on the count value to see the related flow details.
Sum of Bytes Aggregated number of bytes between all the flows
Max of Traffic Rate Maximum traffic rate observed among all related flows
Count of Sessions Number of active sessions for the particular flow
Note n You can click on each column header to sort the data in ascending or descending order.
n You can hide the field from the table view, click the more icon next on the field header and deselect the field name.
3 In addition, you can perform several actions on the grid view page.
n In the filters pane on the left side of the screen, you can perform the following actions:
n Select an individual source or destination to filter the flows that are related to selected source or destination object.
n Select the firewall action to see the allowed flows or the dropped flows.
n Select the protection status to see the flow status.
n Click Add more filters to add additional filters.
n To export the tabular data in a CSV format, click the more option on top of the table, and select Export as CSV.
Create an Application ManuallyYou can manually create an application in the vRealize Network Insight user interface.
Procedure
1 On the vRealize Network Insight home page, click Security > Applications.
2 On the Applications tab, click Add Application.
3 On the Add Application page, in the Application Name text box, enter a name for the application you want to create.
4 In the Tier/Deployment section, enter a unique name.
You can create a tier/department for VMs, physical machines, or services as per your requirements.
Using vRealize Network Insight
VMware, Inc. 297
5 In the Members field,
a Select a condition from the drop-down menu to create a tier.
You can define a condition based on VM Properties, location of VMs (application, cluster, folders) and also based on the Kubernetes services (service name, cluster IP address, namespace, cluster IP, or service labels).
To search a specific Kubernetes service that has the same name or the same IP or the same tag in multiple clusters, you use custom search.
b Enter or select the value that you want to add to the tier.
For entering multiple values, use comma after individual values.
To add a service to be part of the tier, select Service Name and enter the name in the value.
Based on the defined condition, you see the associated or related VM count, or the physical IP count, or the service count.
6 To add any additional conditions, click Add another Condition.
7 (Optional) To create another tier under one application, click Add Tier/Deployment.
You can create multiple tier under one application.
The appilcation creates all the tiers and shows the count of VMs, Physical IPs and services matching all the conditions.
8 (Optional) To create a dynamic threshold configuration, select the Enable Threshold Analytics check box.
The system creates a threshold configuration in the Threshold Configurations page. vRealize Network Insight created threshold configuration name starts with Sys prefix.
Note n If you add a member in application and select the Enable Threshold Analytics check-box, it
might take around 20 minutes to reflect the member in the threshold configuration page.
n You cannot delete a system generated threshold configuration. When you delete the application or clear the Enable Threshold Analytics check-box and save the application, the system generated threshold configuration related to that application automatically gets deleted.
9 Select Analyze Flows to view the flows before you finally add the application. You can see the tiers based on VMs or physical addresses accordingly.
10 Click Save.
Note If your application does not have any VMware VM and you select Enable Threshold Analytics check box, you cannot save the application. You must add a VMware VM or clear the Enable Threshold Analytics check box to save your application.
11 (Optional) To preview the flow analysis, click Preview Flows.
Shows the Micro-Segment view for the application.
Using vRealize Network Insight
VMware, Inc. 298
What to do next
You can see the application details under Saved Application.
Creating Tiers for Physical IPs
While creating an application, you can select Custom IP Search from the drop-down list to create tiers for the physical IPs based on the enriched fields. For more information on the enriched fields, refer Enriching Flows and IP Endpoints.
The enriched DNS, Subnet, VLAN information can be used in specifying tiers as follows :
n Web
Query: IP Endpoint where Subnet Network = '172.16.101.0/24'
n App
Query: IP Endpoint where Dns Domain = app.example.com
n DB
Query: IP Endpoint where L2 Network = 'vlan-102'
n Common Services
Query: IP Endpoint where Dns Domain = svc.example.com
Application DiscoveryWhen you have several applications or when you have multiple tiers in an application, creating applications using the public APIs or the user interface becomes a long process. vRealize Network Insight auto-discovers the applications and enables you to them and their tiers automatically, which reduces a lot of manual efforts.
vRealize Network Insight can perform Application Discovery based on:
n Tags (vCenter Server or AWS tags)
n VM Names
n Add ServiceNow
Example: An Example of the Application Discovery ConstructLet's assume,
n you have added vCenter Server as a data source
n you have four VMs in your datacenter - VM1, VM2, VM3, and VM4.
n you have defined tags (key-value) that defines the application names to which each VMs belongs
n you have defined tags (key-value) that defines the tier to which each VMs belongs
For example, see the table:
Using vRealize Network Insight
VMware, Inc. 299
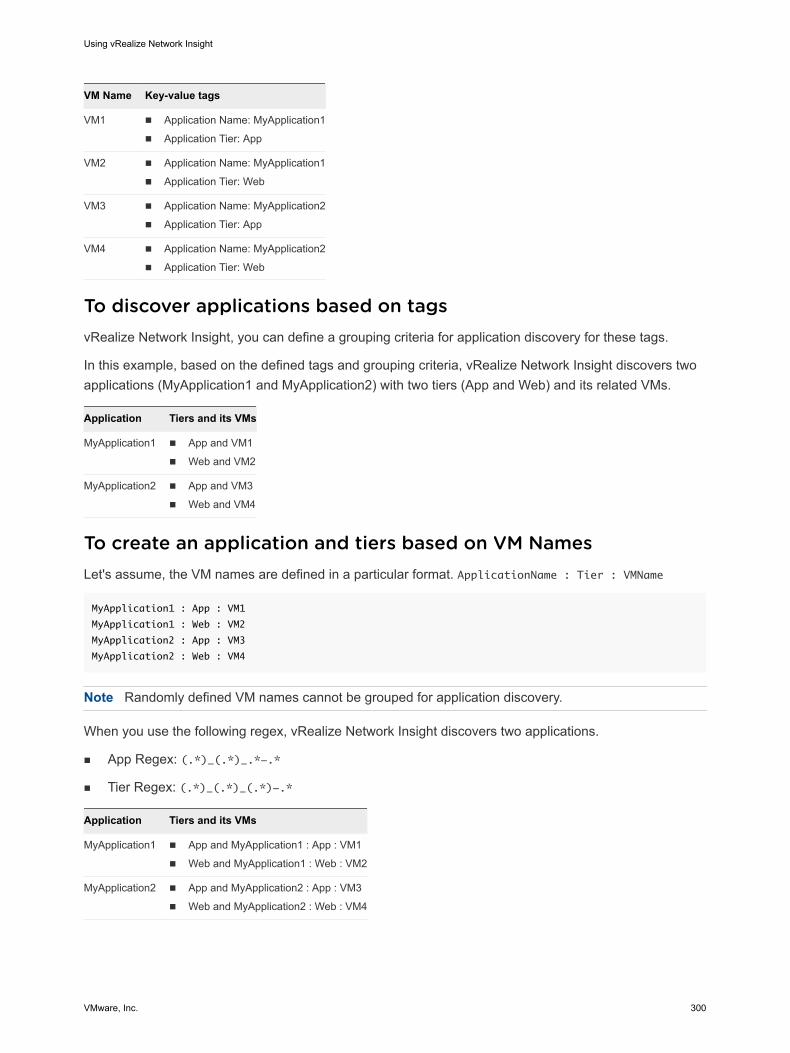
VM Name Key-value tags
VM1 n Application Name: MyApplication1
n Application Tier: App
VM2 n Application Name: MyApplication1
n Application Tier: Web
VM3 n Application Name: MyApplication2
n Application Tier: App
VM4 n Application Name: MyApplication2
n Application Tier: Web
To discover applications based on tagsvRealize Network Insight, you can define a grouping criteria for application discovery for these tags.
In this example, based on the defined tags and grouping criteria, vRealize Network Insight discovers two applications (MyApplication1 and MyApplication2) with two tiers (App and Web) and its related VMs.
Application Tiers and its VMs
MyApplication1 n App and VM1
n Web and VM2
MyApplication2 n App and VM3
n Web and VM4
To create an application and tiers based on VM NamesLet's assume, the VM names are defined in a particular format. ApplicationName : Tier : VMName
MyApplication1 : App : VM1
MyApplication1 : Web : VM2
MyApplication2 : App : VM3
MyApplication2 : Web : VM4
Note Randomly defined VM names cannot be grouped for application discovery.
When you use the following regex, vRealize Network Insight discovers two applications.
n App Regex: (.*)_(.*)_.*-.*
n Tier Regex: (.*)_(.*)_(.*)-.*
Application Tiers and its VMs
MyApplication1 n App and MyApplication1 : App : VM1
n Web and MyApplication1 : Web : VM2
MyApplication2 n App and MyApplication2 : App : VM3
n Web and MyApplication2 : Web : VM4
Using vRealize Network Insight
VMware, Inc. 300
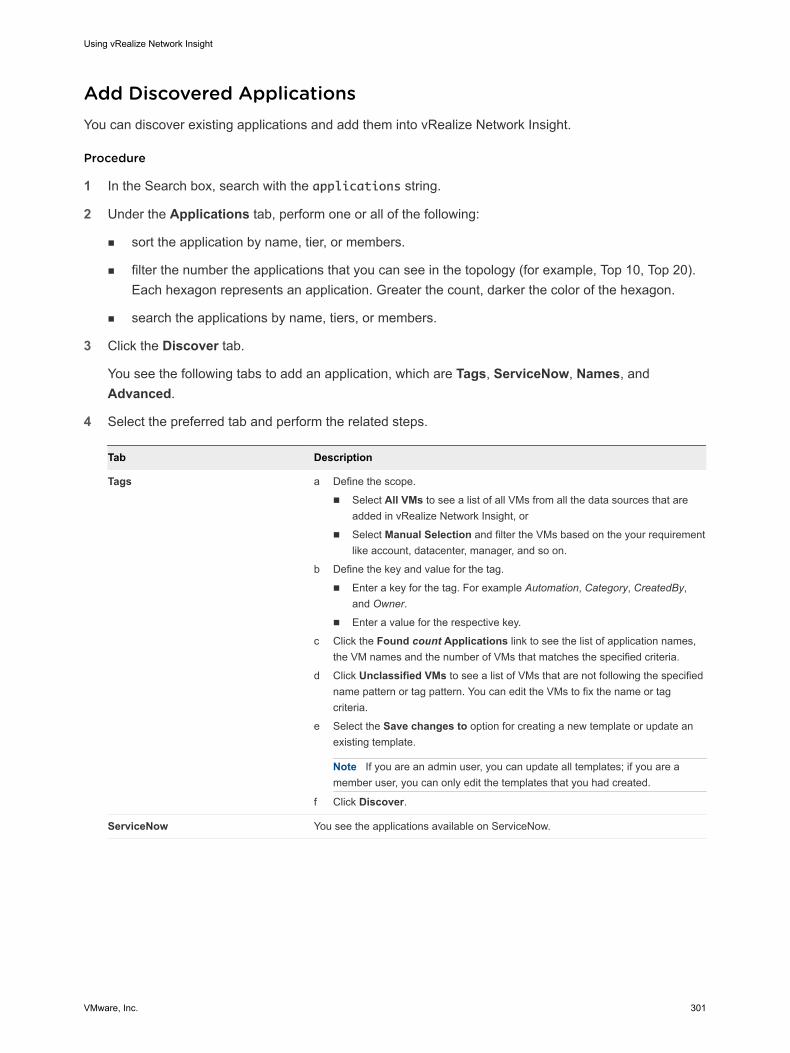
Add Discovered ApplicationsYou can discover existing applications and add them into vRealize Network Insight.
Procedure
1 In the Search box, search with the applications string.
2 Under the Applications tab, perform one or all of the following:
n sort the application by name, tier, or members.
n filter the number the applications that you can see in the topology (for example, Top 10, Top 20). Each hexagon represents an application. Greater the count, darker the color of the hexagon.
n search the applications by name, tiers, or members.
3 Click the Discover tab.
You see the following tabs to add an application, which are Tags, ServiceNow, Names, and Advanced.
4 Select the preferred tab and perform the related steps.
Tab Description
Tags a Define the scope.
n Select All VMs to see a list of all VMs from all the data sources that are added in vRealize Network Insight, or
n Select Manual Selection and filter the VMs based on the your requirement like account, datacenter, manager, and so on.
b Define the key and value for the tag.
n Enter a key for the tag. For example Automation, Category, CreatedBy, and Owner.
n Enter a value for the respective key.
c Click the Found count Applications link to see the list of application names, the VM names and the number of VMs that matches the specified criteria.
d Click Unclassified VMs to see a list of VMs that are not following the specified name pattern or tag pattern. You can edit the VMs to fix the name or tag criteria.
e Select the Save changes to option for creating a new template or update an existing template.
Note If you are an admin user, you can update all templates; if you are a member user, you can only edit the templates that you had created.
f Click Discover.
ServiceNow You see the applications available on ServiceNow.
Using vRealize Network Insight
VMware, Inc. 301
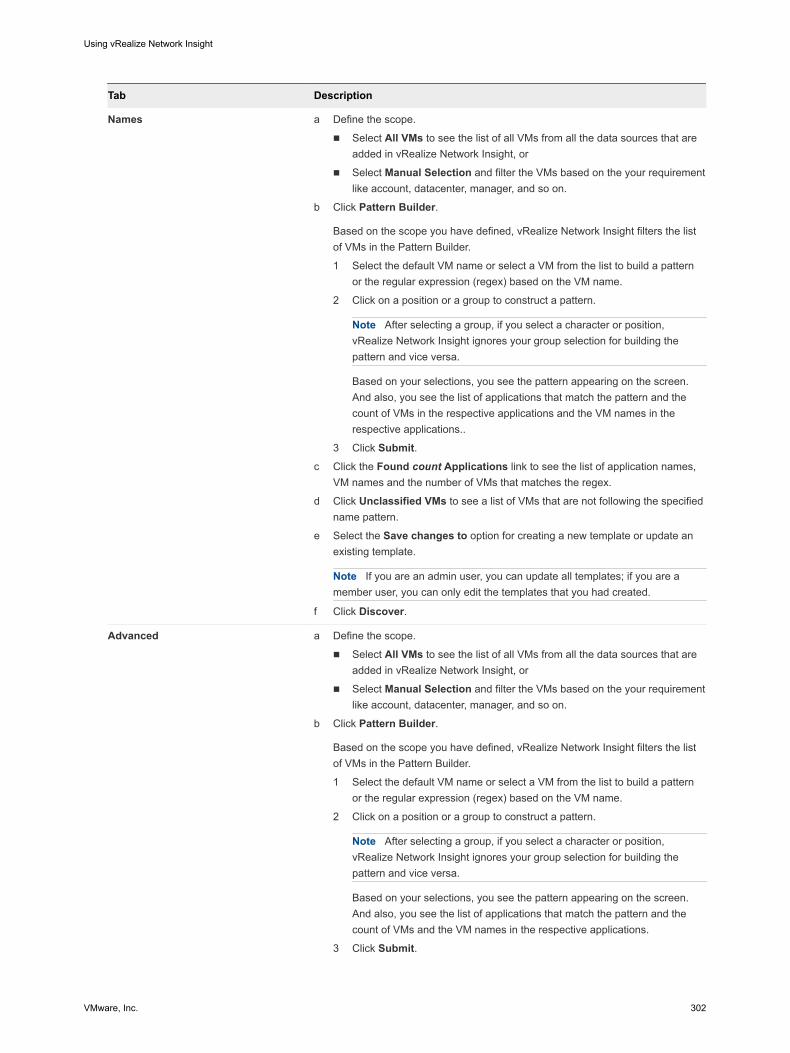
Tab Description
Names a Define the scope.
n Select All VMs to see the list of all VMs from all the data sources that are added in vRealize Network Insight, or
n Select Manual Selection and filter the VMs based on the your requirement like account, datacenter, manager, and so on.
b Click Pattern Builder.
Based on the scope you have defined, vRealize Network Insight filters the list of VMs in the Pattern Builder.
1 Select the default VM name or select a VM from the list to build a pattern or the regular expression (regex) based on the VM name.
2 Click on a position or a group to construct a pattern.
Note After selecting a group, if you select a character or position, vRealize Network Insight ignores your group selection for building the pattern and vice versa.
Based on your selections, you see the pattern appearing on the screen. And also, you see the list of applications that match the pattern and the count of VMs in the respective applications and the VM names in the respective applications..
3 Click Submit.c Click the Found count Applications link to see the list of application names,
VM names and the number of VMs that matches the regex.
d Click Unclassified VMs to see a list of VMs that are not following the specified name pattern.
e Select the Save changes to option for creating a new template or update an existing template.
Note If you are an admin user, you can update all templates; if you are a member user, you can only edit the templates that you had created.
f Click Discover.
Advanced a Define the scope.
n Select All VMs to see the list of all VMs from all the data sources that are added in vRealize Network Insight, or
n Select Manual Selection and filter the VMs based on the your requirement like account, datacenter, manager, and so on.
b Click Pattern Builder.
Based on the scope you have defined, vRealize Network Insight filters the list of VMs in the Pattern Builder.
1 Select the default VM name or select a VM from the list to build a pattern or the regular expression (regex) based on the VM name.
2 Click on a position or a group to construct a pattern.
Note After selecting a group, if you select a character or position, vRealize Network Insight ignores your group selection for building the pattern and vice versa.
Based on your selections, you see the pattern appearing on the screen. And also, you see the list of applications that match the pattern and the count of VMs and the VM names in the respective applications.
3 Click Submit.
Using vRealize Network Insight
VMware, Inc. 302
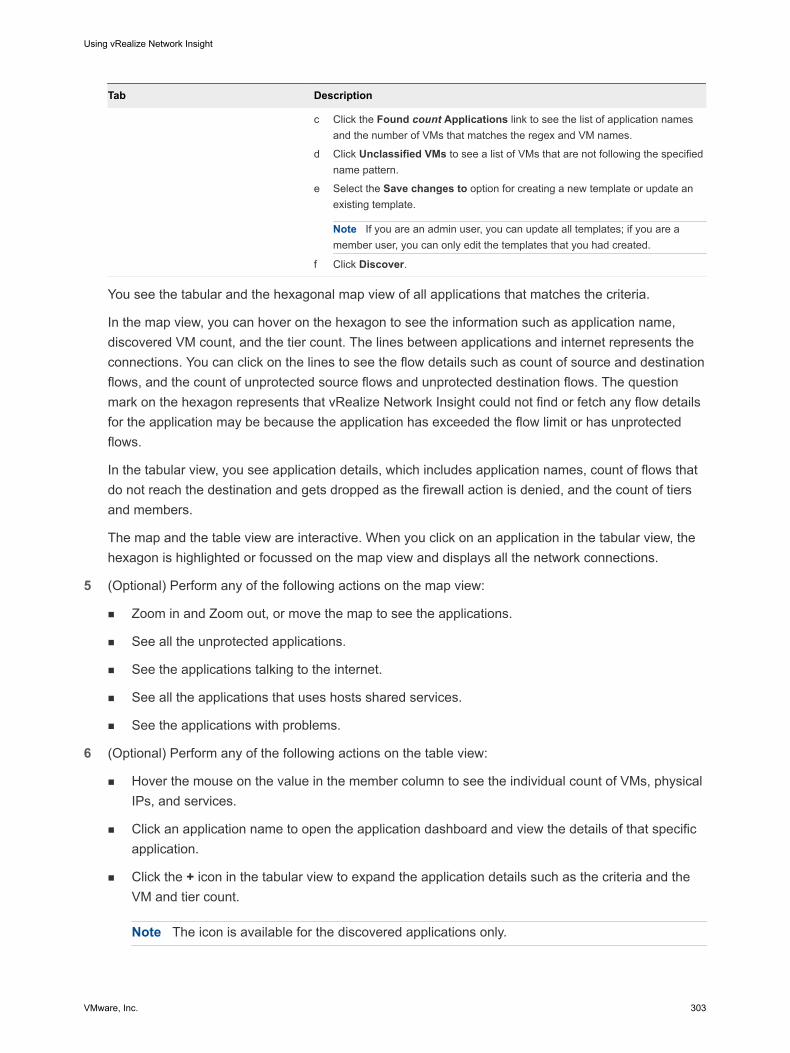
Tab Description
c Click the Found count Applications link to see the list of application names and the number of VMs that matches the regex and VM names.
d Click Unclassified VMs to see a list of VMs that are not following the specified name pattern.
e Select the Save changes to option for creating a new template or update an existing template.
Note If you are an admin user, you can update all templates; if you are a member user, you can only edit the templates that you had created.
f Click Discover. You see the tabular and the hexagonal map view of all applications that matches the criteria.
In the map view, you can hover on the hexagon to see the information such as application name, discovered VM count, and the tier count. The lines between applications and internet represents the connections. You can click on the lines to see the flow details such as count of source and destination flows, and the count of unprotected source flows and unprotected destination flows. The question mark on the hexagon represents that vRealize Network Insight could not find or fetch any flow details for the application may be because the application has exceeded the flow limit or has unprotected flows.
In the tabular view, you see application details, which includes application names, count of flows that do not reach the destination and gets dropped as the firewall action is denied, and the count of tiers and members.
The map and the table view are interactive. When you click on an application in the tabular view, the hexagon is highlighted or focussed on the map view and displays all the network connections.
5 (Optional) Perform any of the following actions on the map view:
n Zoom in and Zoom out, or move the map to see the applications.
n See all the unprotected applications.
n See the applications talking to the internet.
n See all the applications that uses hosts shared services.
n See the applications with problems.
6 (Optional) Perform any of the following actions on the table view:
n Hover the mouse on the value in the member column to see the individual count of VMs, physical IPs, and services.
n Click an application name to open the application dashboard and view the details of that specific application.
n Click the + icon in the tabular view to expand the application details such as the criteria and the VM and tier count.
Note The icon is available for the discovered applications only.
Using vRealize Network Insight
VMware, Inc. 303
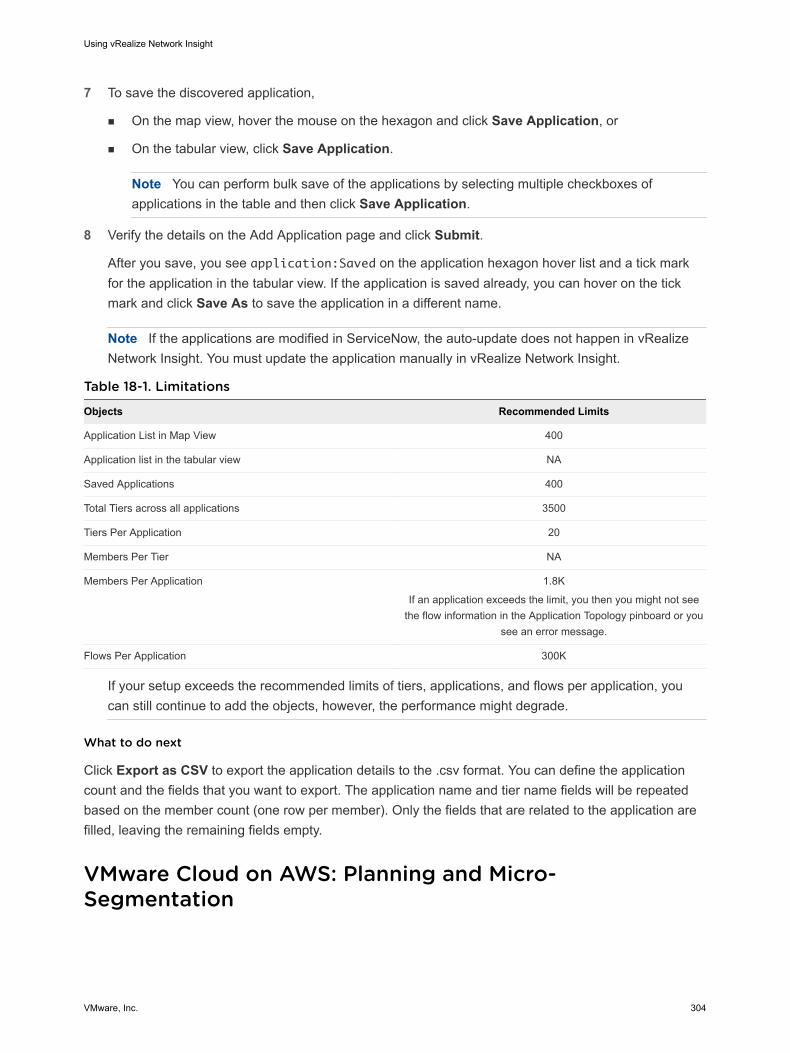
7 To save the discovered application,
n On the map view, hover the mouse on the hexagon and click Save Application, or
n On the tabular view, click Save Application.
Note You can perform bulk save of the applications by selecting multiple checkboxes of applications in the table and then click Save Application.
8 Verify the details on the Add Application page and click Submit.
After you save, you see application:Saved on the application hexagon hover list and a tick mark for the application in the tabular view. If the application is saved already, you can hover on the tick mark and click Save As to save the application in a different name.
Note If the applications are modified in ServiceNow, the auto-update does not happen in vRealize Network Insight. You must update the application manually in vRealize Network Insight.
Table 18-1. Limitations
Objects Recommended Limits
Application List in Map View 400
Application list in the tabular view NA
Saved Applications 400
Total Tiers across all applications 3500
Tiers Per Application 20
Members Per Tier NA
Members Per Application 1.8K
If an application exceeds the limit, you then you might not see the flow information in the Application Topology pinboard or you
see an error message.
Flows Per Application 300K
If your setup exceeds the recommended limits of tiers, applications, and flows per application, you can still continue to add the objects, however, the performance might degrade.
What to do next
Click Export as CSV to export the application details to the .csv format. You can define the application count and the fields that you want to export. The application name and tier name fields will be repeated based on the member count (one row per member). Only the fields that are related to the application are filled, leaving the remaining fields empty.
VMware Cloud on AWS: Planning and Micro-Segmentation
Using vRealize Network Insight
VMware, Inc. 304
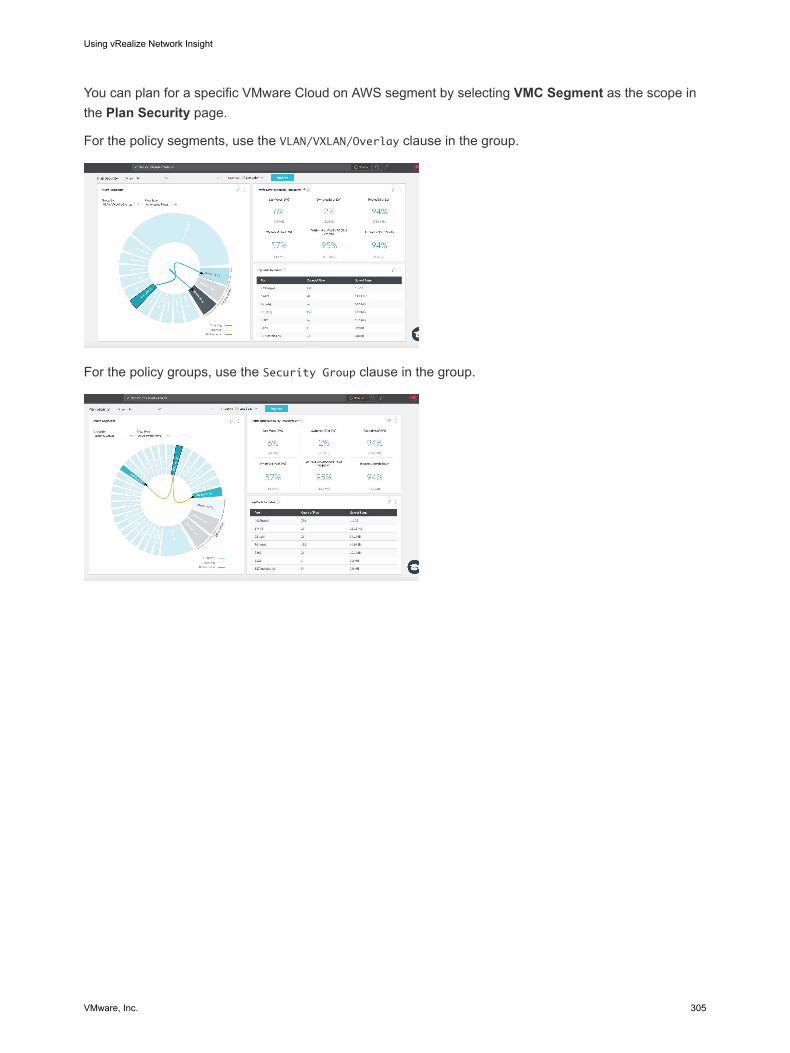
You can plan for a specific VMware Cloud on AWS segment by selecting VMC Segment as the scope in the Plan Security page.
For the policy segments, use the VLAN/VXLAN/Overlay clause in the group.
For the policy groups, use the Security Group clause in the group.
Using vRealize Network Insight
VMware, Inc. 305
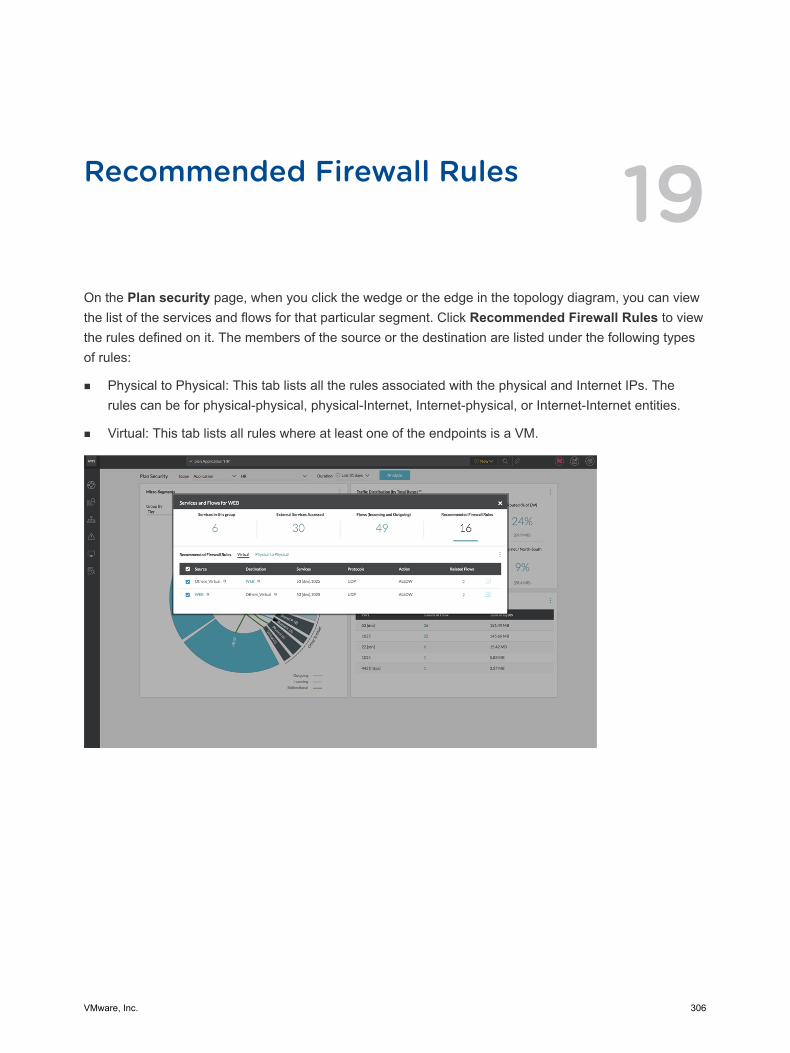
Recommended Firewall Rules 19On the Plan security page, when you click the wedge or the edge in the topology diagram, you can view the list of the services and flows for that particular segment. Click Recommended Firewall Rules to view the rules defined on it. The members of the source or the destination are listed under the following types of rules:
n Physical to Physical: This tab lists all the rules associated with the physical and Internet IPs. The rules can be for physical-physical, physical-Internet, Internet-physical, or Internet-Internet entities.
n Virtual: This tab lists all rules where at least one of the endpoints is a VM.
VMware, Inc. 306
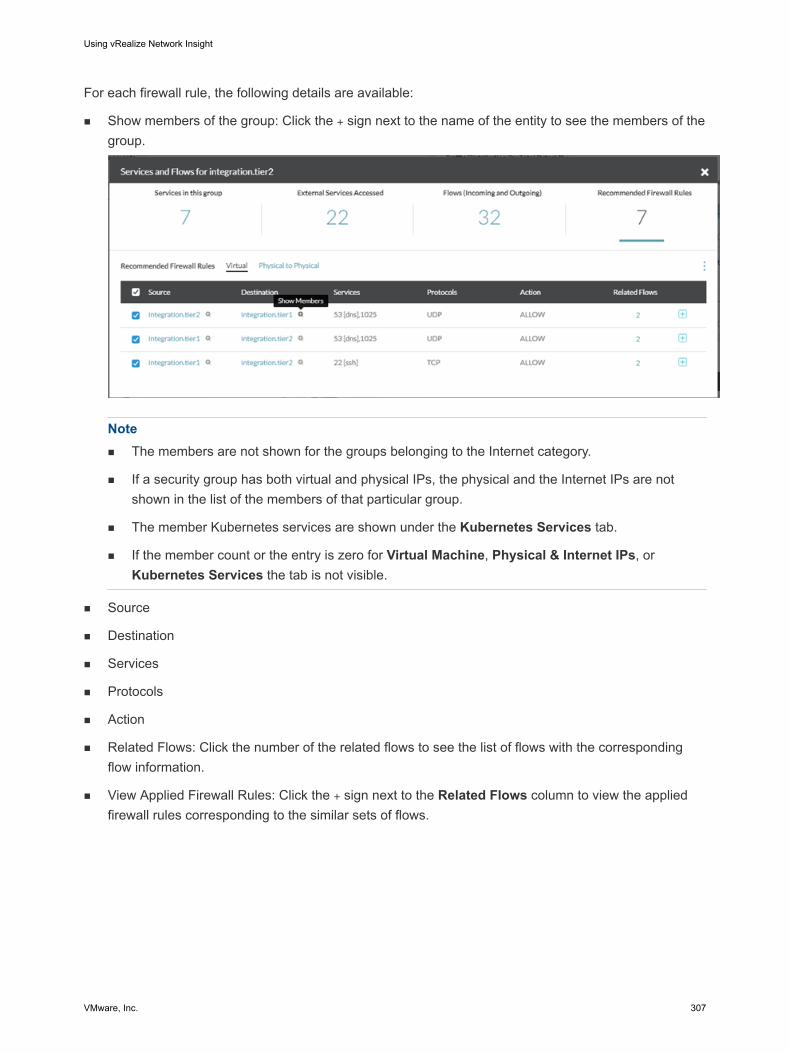
For each firewall rule, the following details are available:
n Show members of the group: Click the + sign next to the name of the entity to see the members of the group.
Note n The members are not shown for the groups belonging to the Internet category.
n If a security group has both virtual and physical IPs, the physical and the Internet IPs are not shown in the list of the members of that particular group.
n The member Kubernetes services are shown under the Kubernetes Services tab.
n If the member count or the entry is zero for Virtual Machine, Physical & Internet IPs, or Kubernetes Services the tab is not visible.
n Source
n Destination
n Services
n Protocols
n Action
n Related Flows: Click the number of the related flows to see the list of flows with the corresponding flow information.
n View Applied Firewall Rules: Click the + sign next to the Related Flows column to view the applied firewall rules corresponding to the similar sets of flows.
Using vRealize Network Insight
VMware, Inc. 307
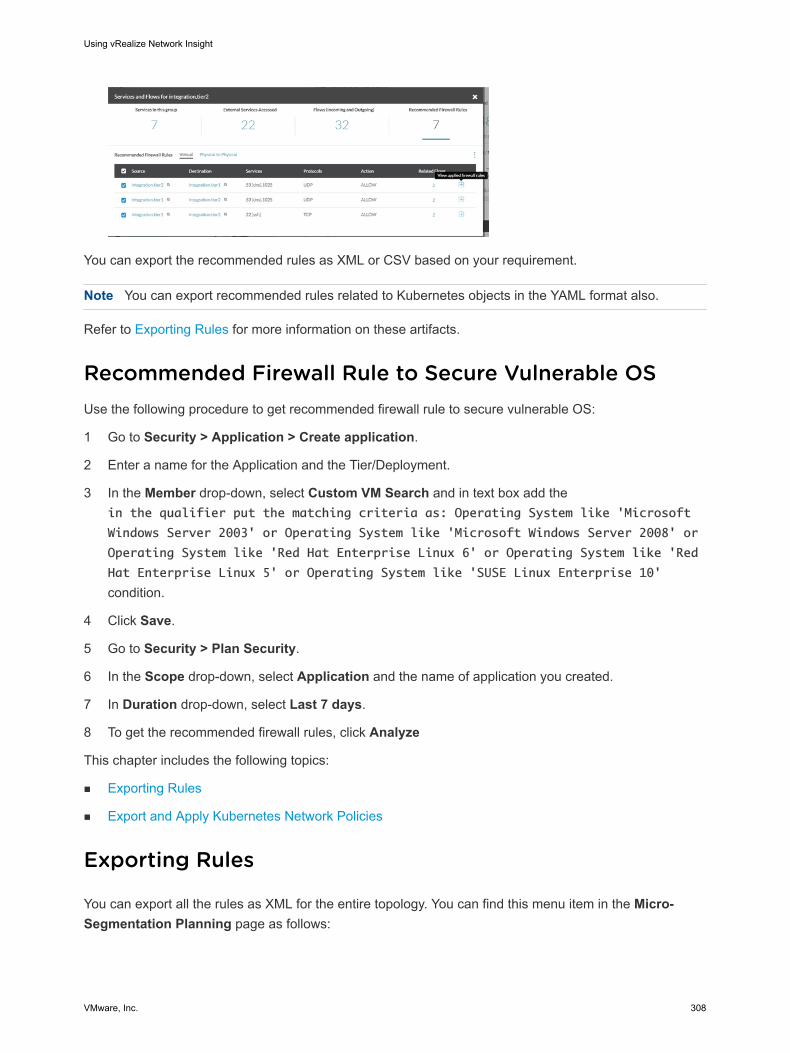
You can export the recommended rules as XML or CSV based on your requirement.
Note You can export recommended rules related to Kubernetes objects in the YAML format also.
Refer to Exporting Rules for more information on these artifacts.
Recommended Firewall Rule to Secure Vulnerable OSUse the following procedure to get recommended firewall rule to secure vulnerable OS:
1 Go to Security > Application > Create application.
2 Enter a name for the Application and the Tier/Deployment.
3 In the Member drop-down, select Custom VM Search and in text box add the in the qualifier put the matching criteria as: Operating System like 'Microsoft
Windows Server 2003' or Operating System like 'Microsoft Windows Server 2008' or
Operating System like 'Red Hat Enterprise Linux 6' or Operating System like 'Red
Hat Enterprise Linux 5' or Operating System like 'SUSE Linux Enterprise 10'
condition.
4 Click Save.
5 Go to Security > Plan Security.
6 In the Scope drop-down, select Application and the name of application you created.
7 In Duration drop-down, select Last 7 days.
8 To get the recommended firewall rules, click Analyze
This chapter includes the following topics:
n Exporting Rules
n Export and Apply Kubernetes Network Policies
Exporting Rules
You can export all the rules as XML for the entire topology. You can find this menu item in the Micro-Segmentation Planning page as follows:
Using vRealize Network Insight
VMware, Inc. 308
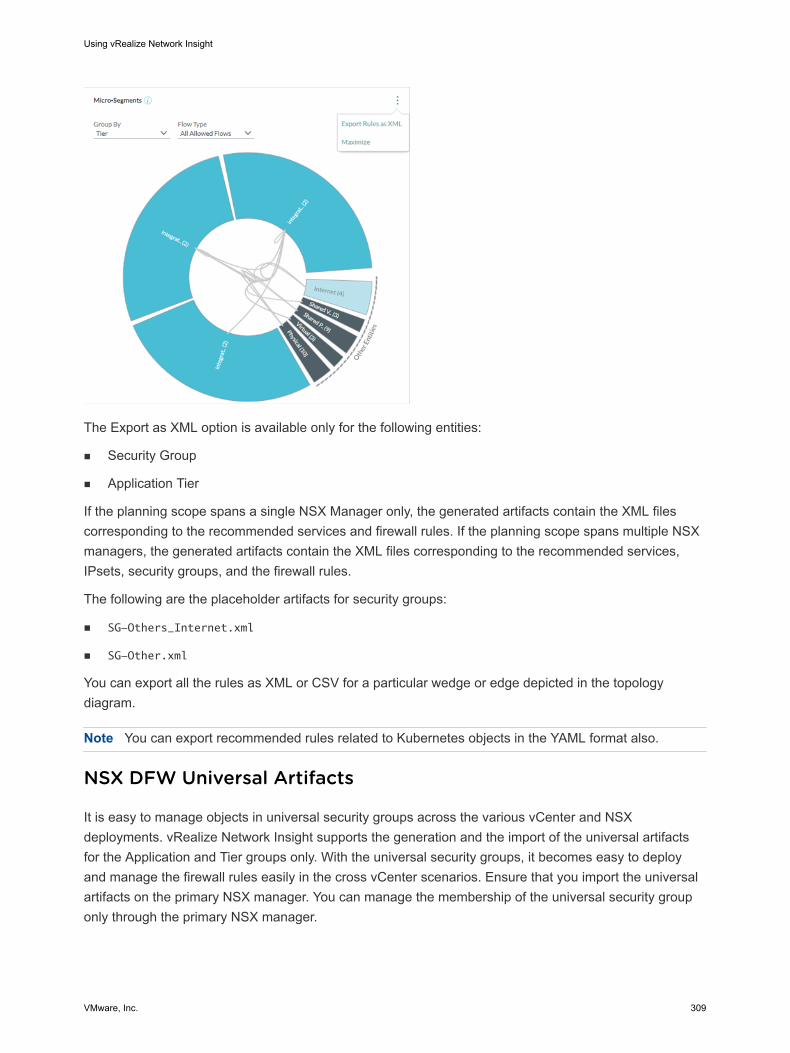
The Export as XML option is available only for the following entities:
n Security Group
n Application Tier
If the planning scope spans a single NSX Manager only, the generated artifacts contain the XML files corresponding to the recommended services and firewall rules. If the planning scope spans multiple NSX managers, the generated artifacts contain the XML files corresponding to the recommended services, IPsets, security groups, and the firewall rules.
The following are the placeholder artifacts for security groups:
n SG-Others_Internet.xml
n SG-Other.xml
You can export all the rules as XML or CSV for a particular wedge or edge depicted in the topology diagram.
Note You can export recommended rules related to Kubernetes objects in the YAML format also.
NSX DFW Universal Artifacts
It is easy to manage objects in universal security groups across the various vCenter and NSX deployments. vRealize Network Insight supports the generation and the import of the universal artifacts for the Application and Tier groups only. With the universal security groups, it becomes easy to deploy and manage the firewall rules easily in the cross vCenter scenarios. Ensure that you import the universal artifacts on the primary NSX manager. You can manage the membership of the universal security group only through the primary NSX manager.
Using vRealize Network Insight
VMware, Inc. 309
A universal security group can consist of:
n Other universal groups
n Universal IP sets
n Universal Security Tag
When you export the rules as XML, in addition to the NSX manager specific folders, a universal folder is created which consists of the NSX DFW universal artifacts. The corresponding universal security groups, universal IP sets, universal security tags, and universal DFW firewall rules are created after importing the NSX DFW universal artifacts.
Note n The universal security tag is supported in only active-standby mode.
n The universal IP set is supported in both active-active and active-standby modes.
You can create universal IP set or universal security tag based on your requirement. If you create the universal security tag, then you can map the application VM to the security tag. Else, the universal IP set is used.
You can use the following flags in the import tool:
Table 19-1.
Flag Name Description
-uni To import artifacts from the universal folder.
-utag To import the universal artifacts with the universal security tags in the membership of the universal security groups.
-log To create rules in which logging is enabled.
Note This flag is not specific to universal option.
Save the Configuration for CSV Export as Property Template
Using vRealize Network Insight
VMware, Inc. 310
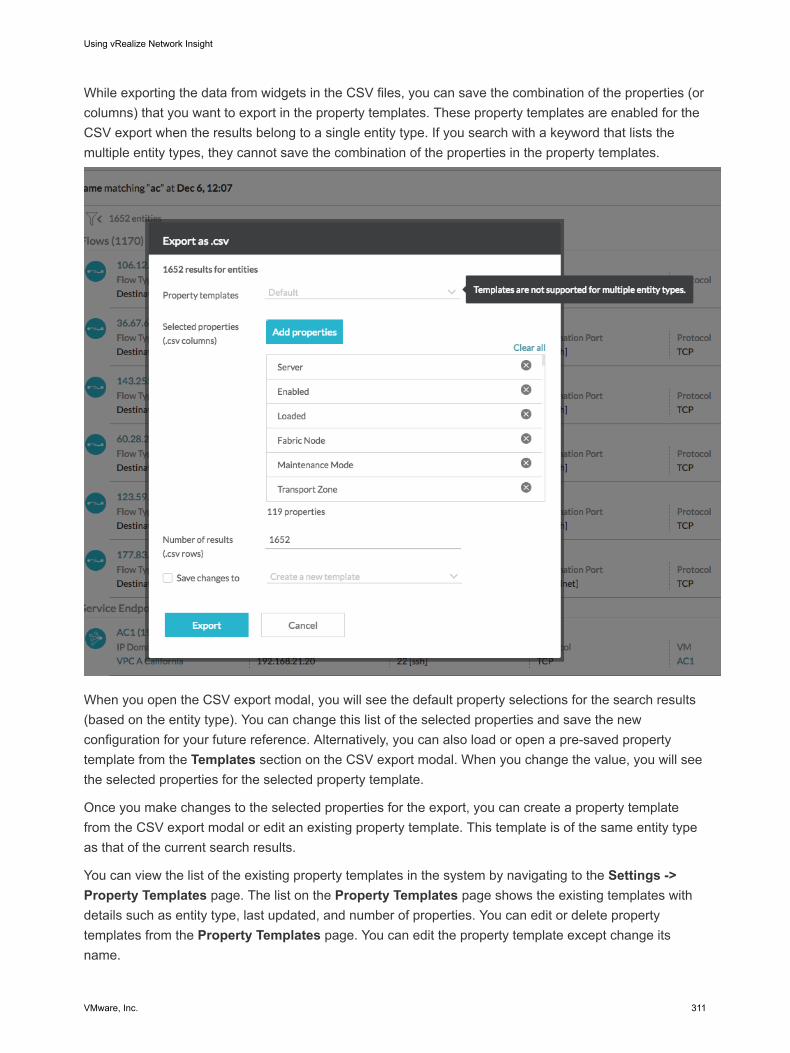
While exporting the data from widgets in the CSV files, you can save the combination of the properties (or columns) that you want to export in the property templates. These property templates are enabled for the CSV export when the results belong to a single entity type. If you search with a keyword that lists the multiple entity types, they cannot save the combination of the properties in the property templates.
When you open the CSV export modal, you will see the default property selections for the search results (based on the entity type). You can change this list of the selected properties and save the new configuration for your future reference. Alternatively, you can also load or open a pre-saved property template from the Templates section on the CSV export modal. When you change the value, you will see the selected properties for the selected property template.
Once you make changes to the selected properties for the export, you can create a property template from the CSV export modal or edit an existing property template. This template is of the same entity type as that of the current search results.
You can view the list of the existing property templates in the system by navigating to the Settings -> Property Templates page. The list on the Property Templates page shows the existing templates with details such as entity type, last updated, and number of properties. You can edit or delete property templates from the Property Templates page. You can edit the property template except change its name.
Using vRealize Network Insight
VMware, Inc. 311

Export and Apply Kubernetes Network PoliciesYou can export the recommended network policy rules related to Kubernetes objects in the YAML format. vRealize Network Insight supports exporting to YAML format for the group by Namespace and group by Service topologies only.
Prerequisites
n Add Kubernetes
n Add VMware PKS
Procedure
1 To export the recommended rules to YAML format, on the Plan Security model, select your kubernetes cluster for which you wish to plan security, and perform one of the steps.
n Expand more options in the Micro-Segments widget and select Export Rules as YAML, or
n Select a node on the Micro-Segments donut view, click on the count of Recommended Firewall Rules, expand more options and select Export Rules as YAML.
vRealize Network Insight downloads a ZIP file named with the Kubernetes Network Policies and a timestamp associated with it. When you unzip the file, you see the following five CSV files and also multiple folders depending on the number of clusters. Each folder will contain multiple YAML files for the cluster.
File Name Description
network-policy-others-ipaddress.csv Contains the IP addresses of the physical servers and virtual machine with which the services or namespaces are communicating.
recommended-namespace-labels-to-add.csv Contains the labels to be attached to the pods associated with the namespace.
Example
n Cluster - pdk8s
n Namespace - sock-shop
n Label - sock-shop-pdk8s
recommended-service-labels-to-add.csv Contains the labels to be attached to the pods associated with the service.
Example
n Cluster - pdk8s
n Namespace - sock-shop
n Service - front-end
n Label - Service:front-sock-shop-pdk8s
n Cluster - pdk8s
n Namespace - sock-shop
n Service - user
n Label - Service:user-sock-shop
Using vRealize Network Insight
VMware, Inc. 312
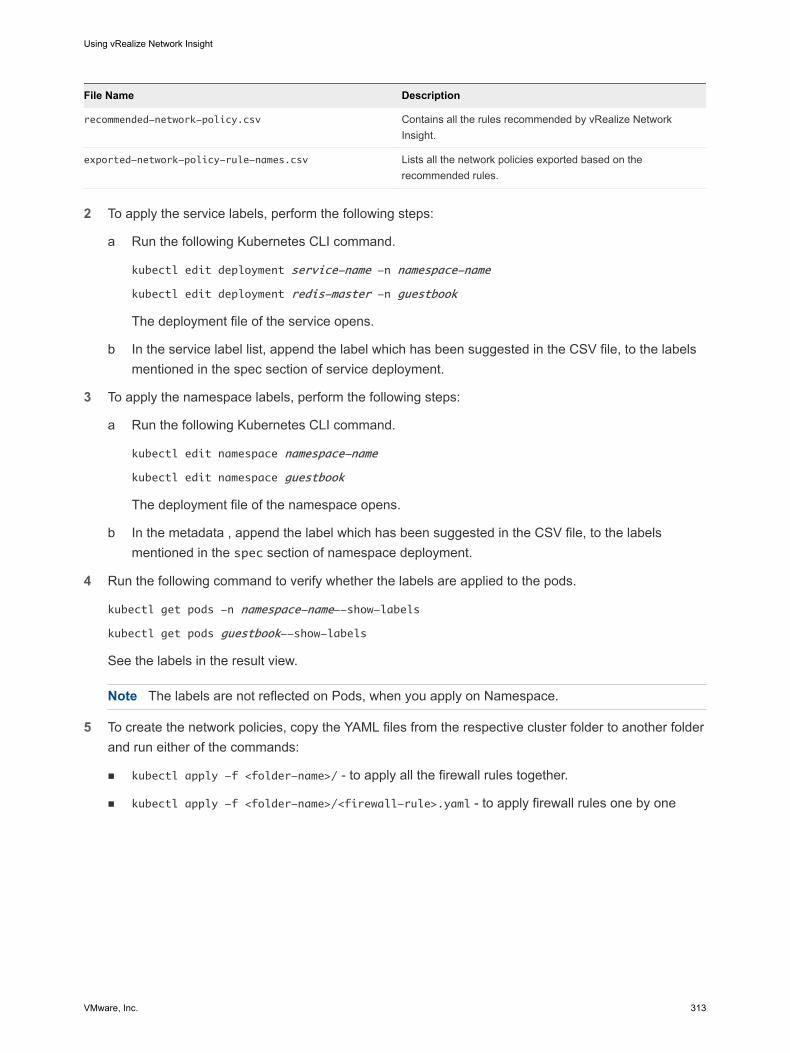
File Name Description
recommended-network-policy.csv Contains all the rules recommended by vRealize Network Insight.
exported-network-policy-rule-names.csv Lists all the network policies exported based on the recommended rules.
2 To apply the service labels, perform the following steps:
a Run the following Kubernetes CLI command.
kubectl edit deployment service-name -n namespace-name
kubectl edit deployment redis-master -n guestbook
The deployment file of the service opens.
b In the service label list, append the label which has been suggested in the CSV file, to the labels mentioned in the spec section of service deployment.
3 To apply the namespace labels, perform the following steps:
a Run the following Kubernetes CLI command.
kubectl edit namespace namespace-name
kubectl edit namespace guestbook
The deployment file of the namespace opens.
b In the metadata , append the label which has been suggested in the CSV file, to the labels mentioned in the spec section of namespace deployment.
4 Run the following command to verify whether the labels are applied to the pods.
kubectl get pods -n namespace-name--show-labels
kubectl get pods guestbook--show-labels
See the labels in the result view.
Note The labels are not reflected on Pods, when you apply on Namespace.
5 To create the network policies, copy the YAML files from the respective cluster folder to another folder and run either of the commands:
n kubectl apply -f <folder-name>/ - to apply all the firewall rules together.
n kubectl apply -f <folder-name>/<firewall-rule>.yaml - to apply firewall rules one by one
Using vRealize Network Insight
VMware, Inc. 313
Working with Search Queries 20vRealize Network Insight provides a robust search for all the entities in your environment.
Here are some of the terms that can help you with the search feature in vRealize Network Insight:
n Entities: A data center consists of physical and logical building blocks such as host, virtual machine, switch, router, NSX Manager and so on. The instances of these blocks are entities.
n Property: An entity consists of multiple properties. A property can be either a configuration property or a metric property.
a Configuration Property: An entity can be described by its configuration properties. A configuration property can be either integer or real value or a string or a boolean value.
n Name, CPU cores, and operating system for virtual machines
n Name, and number of virtual machines for hosts
b Metric Property: Any property which measures a particular characteristic of an entity is a metric property. The values of metric properties are captured at regular intervals of time. CPU usage, memory usage, and network usage for virtual machines are some examples of metric properties.
n Aggregate Functions: They can be used in the search queries to compute the total number of instances of a particular entity type or maximum property of an entity. vRealize Network Insight supports following aggregation functions.
a sum
b max
c min
d avg
When you search for entities, the software displays the entities that match your search query on the Results page.
For each search query, the search bar suggests you the next term that you can use to narrow down your search results. For example, when you enter the term vm, the search bar displays a possible list of terms that you can add to your existing term to narrow down your search results. The search bar also validates each search query. A check mark denotes a valid search query and a cross mark denotes an invalid search query. The Help page provides examples of currently supported queries.
VMware, Inc. 314
This chapter includes the following topics:
n Save and Delete Search Queries
n Search Queries
n Advanced Queries
n Time Control
n Search Results
n Filters
n vCenter Tags
Save and Delete Search QueriesvRealize Network Insight allows you to run a search query and save the query for later use. It also allows you to delete the saved searches.
Note n vRealize Network Insight provides the following default searches:
n All Flows
n Applications
n Azure
n Kubernetes Dashboard
n Top Trends
n NSX
n You cannot save or the deafult saved searches like:
n You cannot save an invalid search query.
n The saved searches are user specific and the default searches are available to all the users.
Procedure
1 To save a query, run a search and click the bookmark icon next to the search bar.
You see the bookmark icon highlighted to ensure that the the query is saved. You can find the search listed under Saved Searches in the left navigation bar. To see all the queries that are saved, click Saved Searches > Manage saved searches.
2 To delete the saved search, click on the bookmark icon again and click Delete on the confirm action dialog box.
You can also delete the saved search from the Manage saved searches window.
Using vRealize Network Insight
VMware, Inc. 315
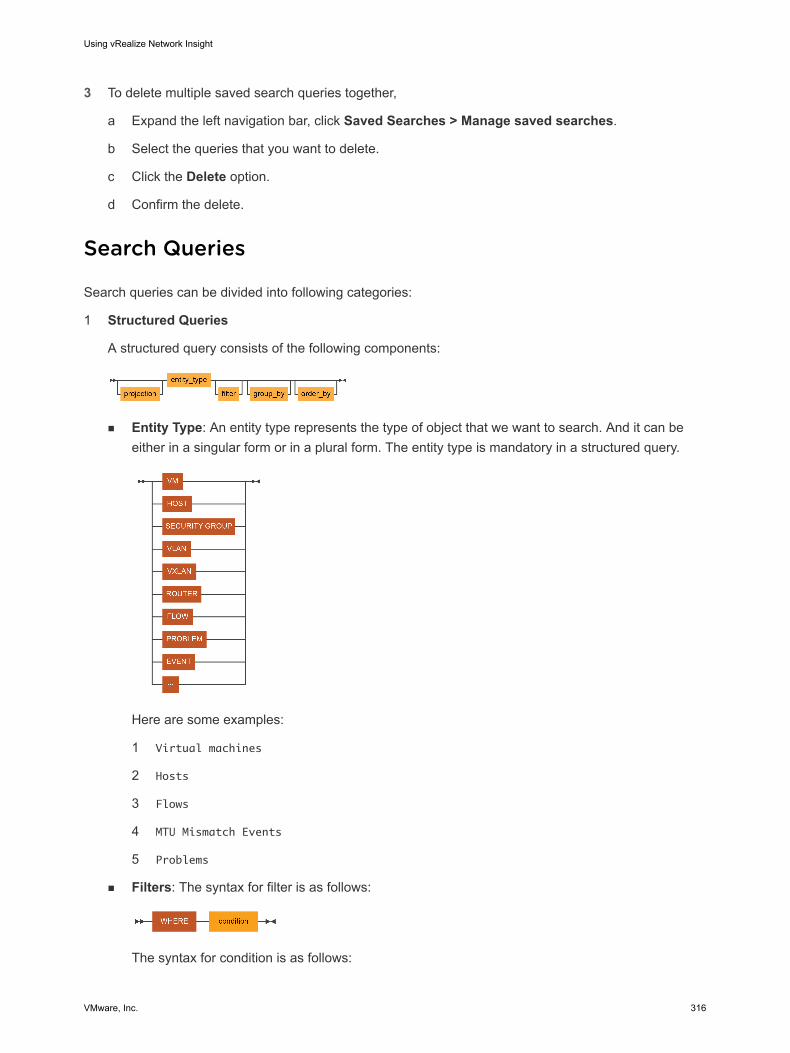
3 To delete multiple saved search queries together,
a Expand the left navigation bar, click Saved Searches > Manage saved searches.
b Select the queries that you want to delete.
c Click the Delete option.
d Confirm the delete.
Search Queries
Search queries can be divided into following categories:
1 Structured Queries
A structured query consists of the following components:
n Entity Type: An entity type represents the type of object that we want to search. And it can be either in a singular form or in a plural form. The entity type is mandatory in a structured query.
Here are some examples:
1 Virtual machines
2 Hosts
3 Flows
4 MTU Mismatch Events
5 Problems
n Filters: The syntax for filter is as follows:
The syntax for condition is as follows:
Using vRealize Network Insight
VMware, Inc. 316
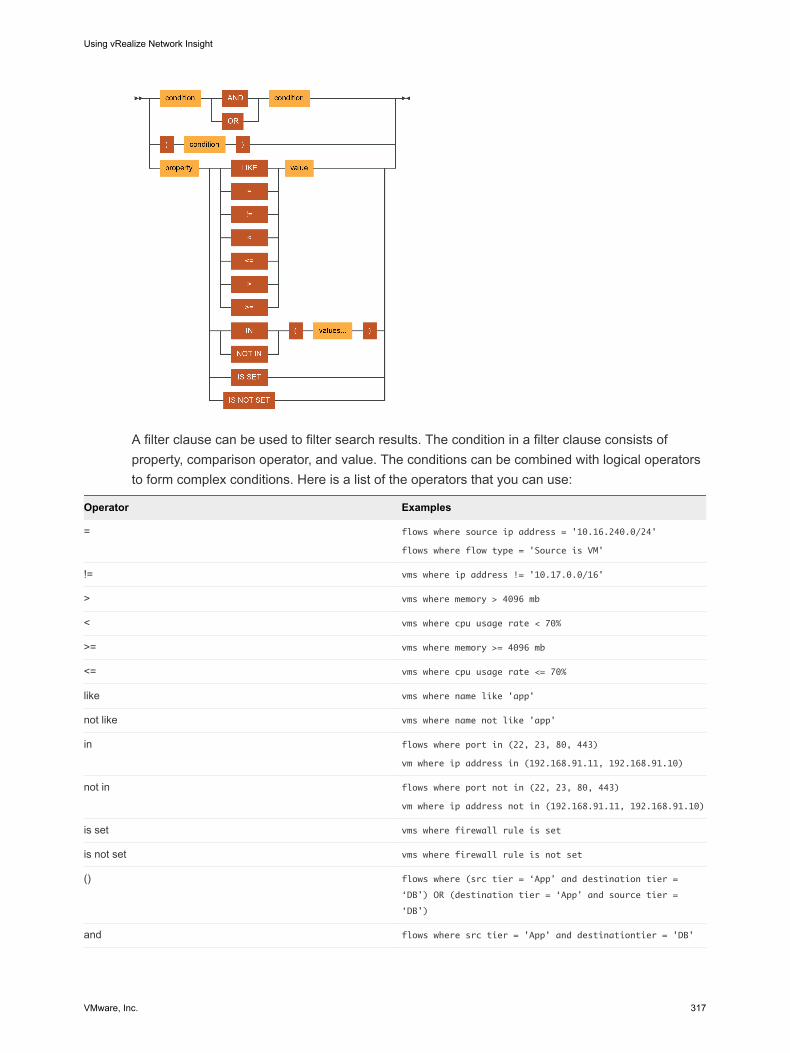
A filter clause can be used to filter search results. The condition in a filter clause consists of property, comparison operator, and value. The conditions can be combined with logical operators to form complex conditions. Here is a list of the operators that you can use:
Operator Examples
= flows where source ip address = '10.16.240.0/24'
flows where flow type = 'Source is VM'
!= vms where ip address != '10.17.0.0/16'
> vms where memory > 4096 mb
< vms where cpu usage rate < 70%
>= vms where memory >= 4096 mb
<= vms where cpu usage rate <= 70%
like vms where name like 'app'
not like vms where name not like 'app'
in flows where port in (22, 23, 80, 443)
vm where ip address in (192.168.91.11, 192.168.91.10)
not in flows where port not in (22, 23, 80, 443)
vm where ip address not in (192.168.91.11, 192.168.91.10)
is set vms where firewall rule is set
is not set vms where firewall rule is not set
() flows where (src tier = ‘App’ and destination tier =
‘DB’) OR (destination tier = ‘App’ and source tier =
‘DB’)
and flows where src tier = 'App' and destinationtier = 'DB'
Using vRealize Network Insight
VMware, Inc. 317
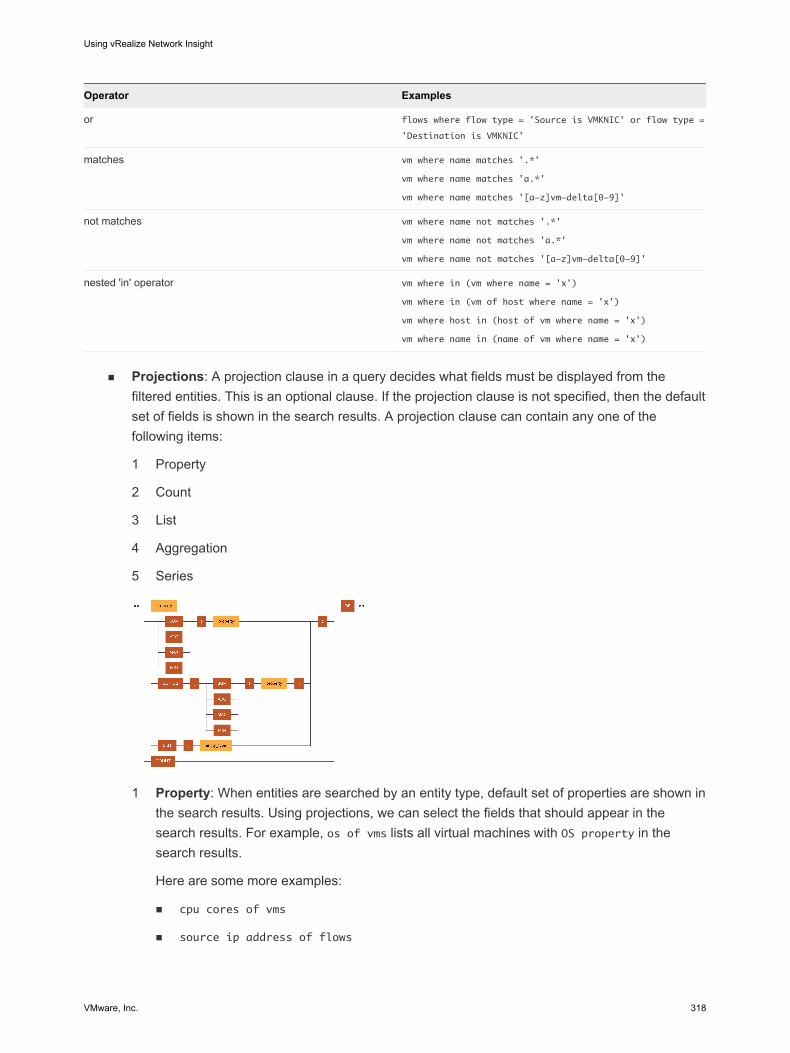
Operator Examples
or flows where flow type = 'Source is VMKNIC' or flow type =
'Destination is VMKNIC'
matches vm where name matches '.*'
vm where name matches 'a.*'
vm where name matches '[a-z]vm-delta[0-9]'
not matches vm where name not matches '.*'
vm where name not matches 'a.*'
vm where name not matches '[a-z]vm-delta[0-9]'
nested 'in' operator vm where in (vm where name = 'x')
vm where in (vm of host where name = 'x')
vm where host in (host of vm where name = 'x')
vm where name in (name of vm where name = 'x')
n Projections: A projection clause in a query decides what fields must be displayed from the filtered entities. This is an optional clause. If the projection clause is not specified, then the default set of fields is shown in the search results. A projection clause can contain any one of the following items:
1 Property
2 Count
3 List
4 Aggregation
5 Series
1 Property: When entities are searched by an entity type, default set of properties are shown in the search results. Using projections, we can select the fields that should appear in the search results. For example, os of vms lists all virtual machines with OS property in the search results.
Here are some more examples:
n cpu cores of vms
n source ip address of flows
Using vRealize Network Insight
VMware, Inc. 318
If a metric property is used, a graph is displayed for each entity with the metric property as y-axis and time as x-axis.
2 Count: The count query can be used to compute the number of objects of an entity type. Here are some examples:
n count of vms
n count of hosts
n count of flows
3 List: A list operator is helpful if the filter condition cannot be applied on the entity that you fetch.
For example:
List(host) of vms where memory <= 2gb
This query fetches list of hosts, whereas the filter condition is applied on virtual machines. Here are some more examples:
n List(ip address)of vms where cpu cores = 1
4 Aggregate functions: An aggregate function allows you to calculate a single value from a numerical config or metric property. The search query language supports the following aggregate functions:
n max
n sum
n min
n avg
Here are some examples:
n sum(memory) of hosts
n sum(memory), sum(cpu cores) of vms
n sum(bytes) of flows
5 Series: A series operator is used to perform aggregation on the metric properties. For example:
series(avg(cpu usage)) of vms where cpu cores = 4
This query displays graph containing average cpu usage of all virtual machines with 4 cpu cores. Here are some examples:
n series(sum(network usage)) of vms where name like 'app'
n series(sum(memory usage)) of vms where name like 'db'
n series(avg(cpu usage)), series(avg(memory usage)) of vms
Using vRealize Network Insight
VMware, Inc. 319
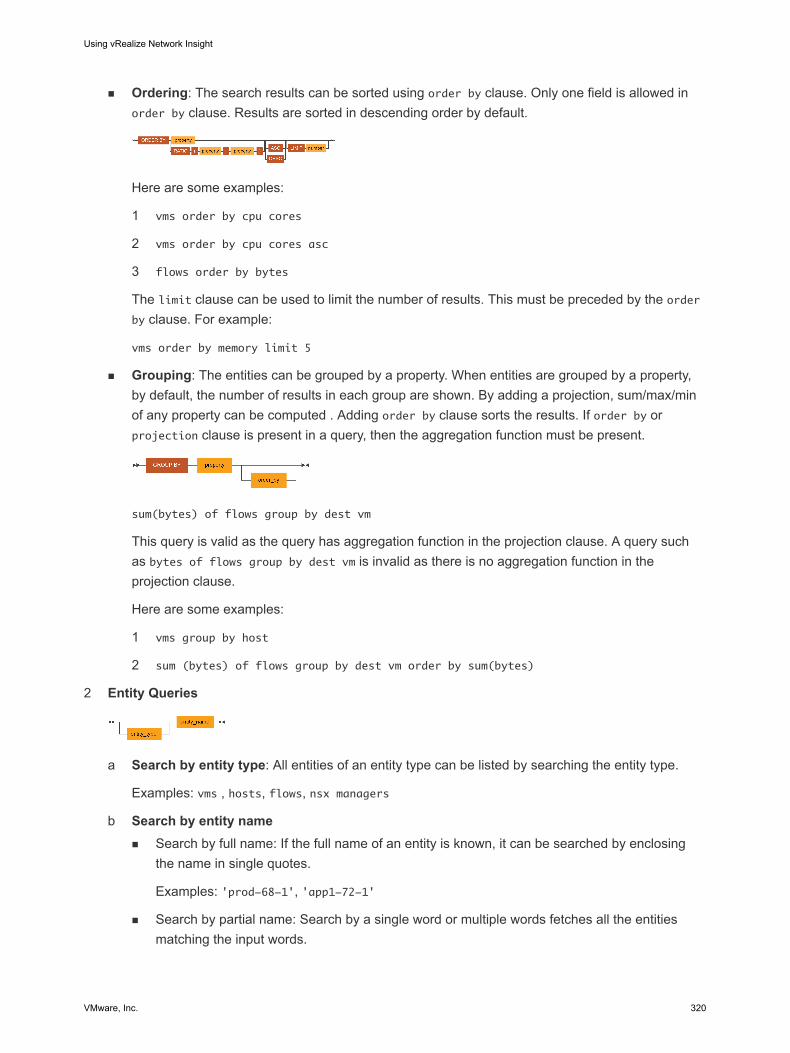
n Ordering: The search results can be sorted using order by clause. Only one field is allowed in order by clause. Results are sorted in descending order by default.
Here are some examples:
1 vms order by cpu cores
2 vms order by cpu cores asc
3 flows order by bytes
The limit clause can be used to limit the number of results. This must be preceded by the order by clause. For example:
vms order by memory limit 5
n Grouping: The entities can be grouped by a property. When entities are grouped by a property, by default, the number of results in each group are shown. By adding a projection, sum/max/min of any property can be computed . Adding order by clause sorts the results. If order by or projection clause is present in a query, then the aggregation function must be present.
sum(bytes) of flows group by dest vm
This query is valid as the query has aggregation function in the projection clause. A query such as bytes of flows group by dest vm is invalid as there is no aggregation function in the projection clause.
Here are some examples:
1 vms group by host
2 sum (bytes) of flows group by dest vm order by sum(bytes)
2 Entity Queries
a Search by entity type: All entities of an entity type can be listed by searching the entity type.
Examples: vms , hosts, flows, nsx managers
b Search by entity namen Search by full name: If the full name of an entity is known, it can be searched by enclosing
the name in single quotes.
Examples: 'prod-68-1', 'app1-72-1'
n Search by partial name: Search by a single word or multiple words fetches all the entities matching the input words.
Using vRealize Network Insight
VMware, Inc. 320
Examples: prod, app1
Note If input contains keywords or entity types, then it may be processed as a search query.
n Search by entity type and name: If both the name and the type of an entity are known, it can be searched by querying entity type and entity name together.
Example: The search query 'vm app1' returns all VMs containing app1.
3 Planning Queries
These queries can be used to plan the security of the data center by analyzing flows.
Examples:
a plan securitygroup1
b plan host1
c plan security
4 Path Queries
These queries can be used to show the path between two VMs or the path from VM to Internet.
Examples:
a Vm 'vm1' to Vm 'vm2'
b VM 'vm1' to Internet
Note n The search queries are not case-sensitive.
n The entity types or the configuration properties can have synonyms. For example, entity type 'virtual machine' has synonym 'vm'.
Azure Search QueriesYou can search Azure entity details in vRealize Network Insight.
Here are some sample search queries:
Azure Entities Sample Queries
Microsoft Azure Azure
Azure Application Security Group Azure Application Security Group where Azure Virtual
Network = 'Test-vnet2'
Azure Data Source Azure Data Source
Using vRealize Network Insight
VMware, Inc. 321
Azure Entities Sample Queries
Azure NSG Rule Azure NSG Rule where Action = 'ALLOW'
Azure Network Interface Azure Network Interface where Azure Virtual Network =
'Test-vnet2'
Azure Network Security Group Azure Network Security Group where Subscription = 'vRNI-
dev'
Azure Route Azure Route where Route Table = 'TestRouteTable'
Azure Route Table Azure Route Table where Azure Virtual Network = 'aks-
vnet-28255566'
Azure Subnet Azure Subnet where Azure Virtual Network = 'vrni-01-vnet'
Azure Subscription Azure Subscription
Azure Virtual Machine Azure Virtual Machine where Azure Application Security
Group = 'TestASG'
Azure Virtual Network Azure Virtual Network where Azure Peer Virtual Network =
'vrni-01-vnet'
Cisco ACI Entities
Here is a list of some of the Cisco ACI entities on which you can perform a search:
Note The entities are prefixed by aci.
n aci application profile
n aci bridge domain
n aci endpoint group
n aci fabric
n aci switch
n aci tenant
Here are some sample search queries:
n aci fabric 'ACI-Demo-Fabric': This query retrieves information on the tenants, switches, and controllers in the ACI fabric.
Using vRealize Network Insight
VMware, Inc. 322
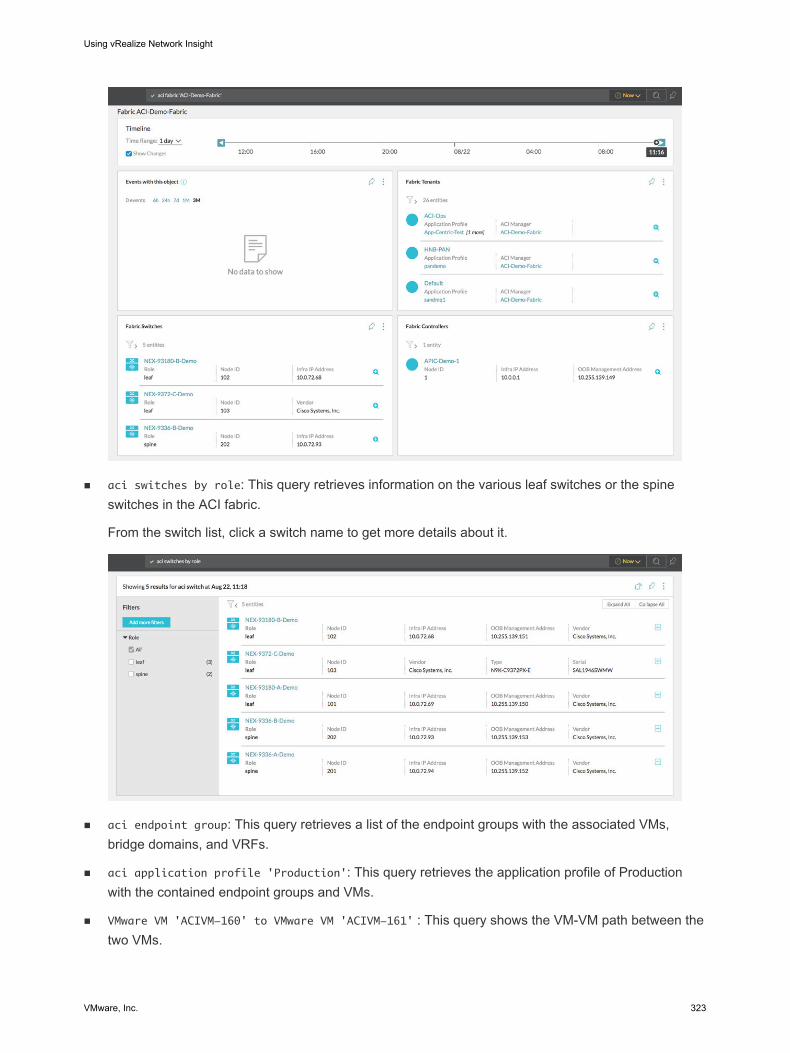
n aci switches by role: This query retrieves information on the various leaf switches or the spine switches in the ACI fabric.
From the switch list, click a switch name to get more details about it.
n aci endpoint group: This query retrieves a list of the endpoint groups with the associated VMs, bridge domains, and VRFs.
n aci application profile 'Production': This query retrieves the application profile of Production with the contained endpoint groups and VMs.
n VMware VM 'ACIVM-160' to VMware VM 'ACIVM-161' : This query shows the VM-VM path between the two VMs.
Using vRealize Network Insight
VMware, Inc. 323
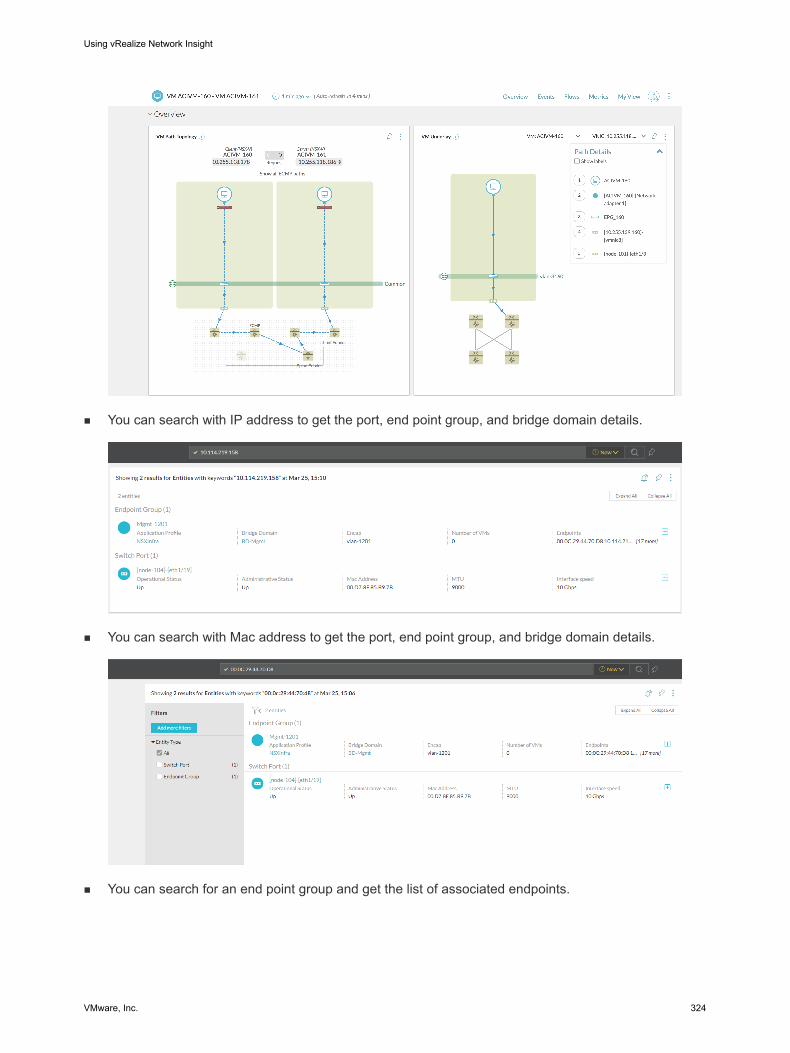
n You can search with IP address to get the port, end point group, and bridge domain details.
n You can search with Mac address to get the port, end point group, and bridge domain details.
n You can search for an end point group and get the list of associated endpoints.
Using vRealize Network Insight
VMware, Inc. 324
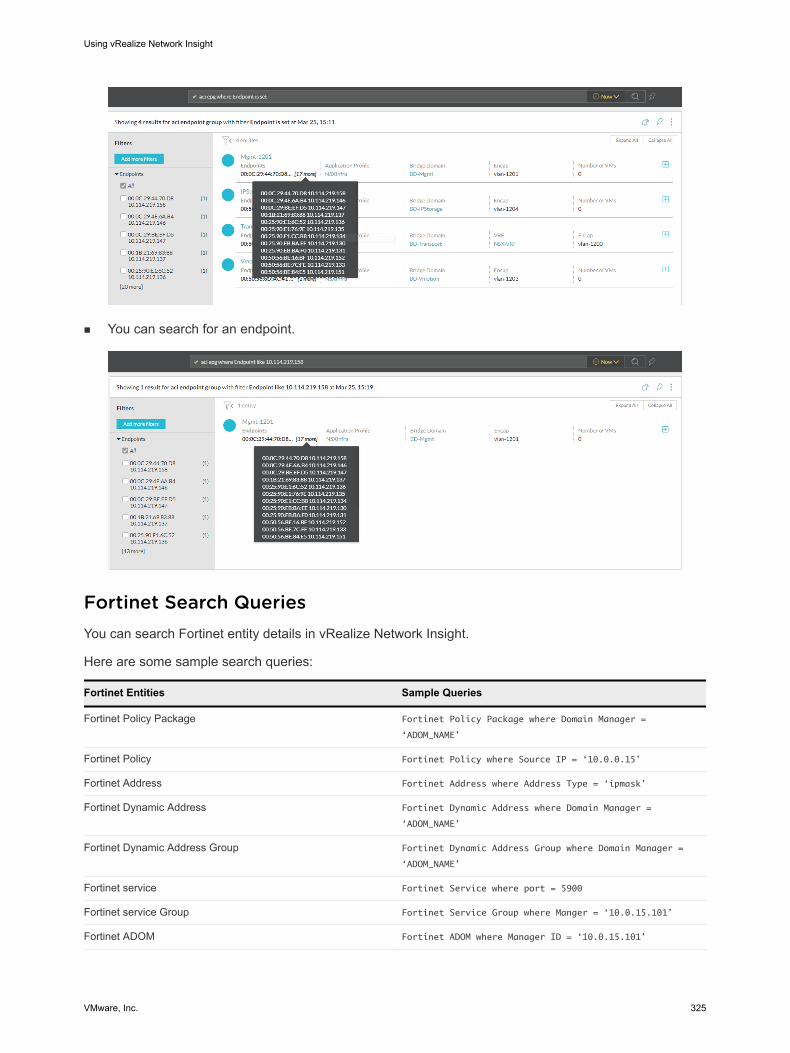
n You can search for an endpoint.
Fortinet Search QueriesYou can search Fortinet entity details in vRealize Network Insight.
Here are some sample search queries:
Fortinet Entities Sample Queries
Fortinet Policy Package Fortinet Policy Package where Domain Manager =
‘ADOM_NAME’
Fortinet Policy Fortinet Policy where Source IP = ‘10.0.0.15’
Fortinet Address Fortinet Address where Address Type = ‘ipmask’
Fortinet Dynamic Address Fortinet Dynamic Address where Domain Manager =
‘ADOM_NAME’
Fortinet Dynamic Address Group Fortinet Dynamic Address Group where Domain Manager =
‘ADOM_NAME’
Fortinet service Fortinet Service where port = 5900
Fortinet service Group Fortinet Service Group where Manger = ‘10.0.15.101’
Fortinet ADOM Fortinet ADOM where Manager ID = ‘10.0.15.101’
Using vRealize Network Insight
VMware, Inc. 325
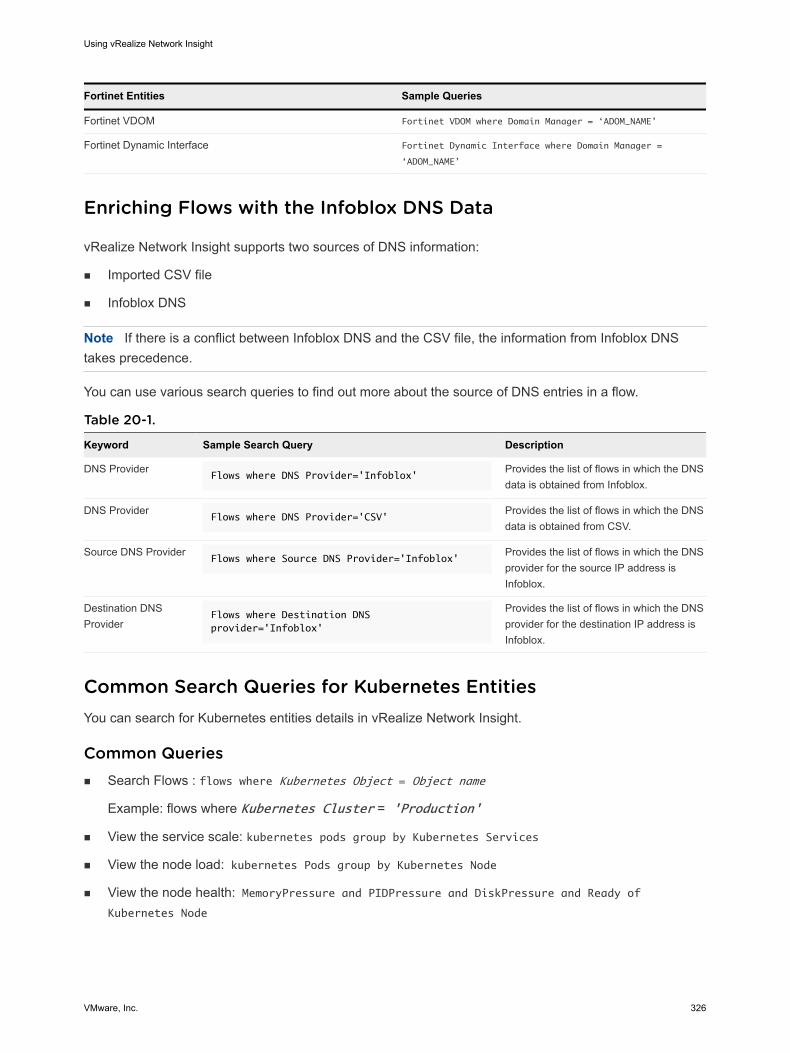
Fortinet Entities Sample Queries
Fortinet VDOM Fortinet VDOM where Domain Manager = ‘ADOM_NAME’
Fortinet Dynamic Interface Fortinet Dynamic Interface where Domain Manager =
‘ADOM_NAME’
Enriching Flows with the Infoblox DNS Data
vRealize Network Insight supports two sources of DNS information:
n Imported CSV file
n Infoblox DNS
Note If there is a conflict between Infoblox DNS and the CSV file, the information from Infoblox DNS takes precedence.
You can use various search queries to find out more about the source of DNS entries in a flow.
Table 20-1.
Keyword Sample Search Query Description
DNS ProviderFlows where DNS Provider='Infoblox'
Provides the list of flows in which the DNS data is obtained from Infoblox.
DNS ProviderFlows where DNS Provider='CSV'
Provides the list of flows in which the DNS data is obtained from CSV.
Source DNS ProviderFlows where Source DNS Provider='Infoblox'
Provides the list of flows in which the DNS provider for the source IP address is Infoblox.
Destination DNS Provider
Flows where Destination DNS provider='Infoblox'
Provides the list of flows in which the DNS provider for the destination IP address is Infoblox.
Common Search Queries for Kubernetes EntitiesYou can search for Kubernetes entities details in vRealize Network Insight.
Common Queriesn Search Flows : flows where Kubernetes Object = Object name
Example: flows where Kubernetes Cluster = 'Production'
n View the service scale: kubernetes pods group by Kubernetes Services
n View the node load: kubernetes Pods group by Kubernetes Node
n View the node health: MemoryPressure and PIDPressure and DiskPressure and Ready of Kubernetes Node
Using vRealize Network Insight
VMware, Inc. 326
n View flow compliance: flows from Kubernetes Object name of the object to Kubernetes Object name of the object
Example: flows from Kubernetes Namespace'PCI' to Kubernetes Namespace'Non-PCI'
n View the Path topology:
n Kubernetes service service name to Kubernetes service service name
n Kubernetes service service name to Kubernetes pod pod name
n Kubernetes pod pod name to Kubernetes pod pod name
Table 20-2. Queries on Kubernetes Object
Kubernetes Object Query Description
Namespace n kubernetes namespace where L2 Networks = 'a'
n list(Kubernetes Node) of Kubernetes Pod where Kubernetes Namespace = 'a'
n Return the Kubernetes namespace where it is connected to L2 Network 'a'
n Return the list of Kubernetes nodes where Kubernetes namespace is 'a'
Pod n NSX-T Logical port where connectedto.modelKey in (modelKey of kubernetes nodes) order by Tx Packets desc
n NSX-T Logical port where connectedto.modelKey in (modelKey of kubernetes pods) and Rx Packet Drops > 0
n new kubernetes pod in last 1 hour
n Return the list of logical ports which are connected to a node based on transferred packets in descending order
n Return the list of logical ports which are connected to Kubernetes pods and Rx dropped packets > 0
n New Kubernetes pods discovered in last one hour
Services n kubernetes pods where kubernetes services is not set
n kubernetes pods group by Kubernetes Services, Kubernetes Cluster
n List of Kubernetes pods that does not have a service
n Number of pods running on each service
Nodes n kubernetes nodes where Ready != 'True'
n kubernetes node where Virtual Machine = 'vm-a'
n List of unhealthy Kubernetes nodes
n Kubernetes node that is part of 'vm-a' virtual machine
Flows n flows where kubernetes service is set
n flows where source kubernetes node = 'a'
n List of flows where either a source or a destination Kubernetes service exists
n List of flows where source Kubernetes node = 'a' or destination Kubernetes node = 'a'
Table 20-3. Additional Queries
Entity/Components Query Description
Applications that have Kubernetes entities
application where virtual member = ‘service-a’ List of all applications where Kubernetes service ‘service-a’ is a member
application where virtual member = ‘service-a’ and virtual member.Kubernetes Namespace = ‘namespace-b’
List of all applications where Kubernetes service ‘service-a’ and Kubernetes namespace is ‘namespace-b’ is a member
tier where virtual member = ‘service-a’ and virtual member.Kubernetes Namespace = ‘namespace-b’
List of all tiers where Kubernetes service ‘service-a’ and Kubernetes namespace is ‘namespace-b’ is a member
Using vRealize Network Insight
VMware, Inc. 327
Table 20-3. Additional Queries (continued)
Entity/Components Query Description
count of applications where Virtual Member in (kubernetes services)
The number of applications where member is of type Kubernetes service
count of applications where virtual member in (kubernetes services where Kubernetes Namespace = ‘sock-shop’)
The number of applications where member is of type Kubernetes service which is under Kubernetes namespace ‘sock-shop’
list(virtual member) of applications where Name = ‘app-1’ and virtual member.Kubernetes Cluster is set
List of all the Kubernetes services as members for the application ‘app-1’
Metrics nsx-t logical port where (ConnectedTo in (Kubernetes Pods where kubernetes cluster is set)) and Rx Packet Drops > 0 group by ConnectedTo order by max(Rx Packet Drops)
Rx Packet drops group by Kubernetes pod
nsx-t logical port where (ConnectedTo in (Kubernetes Nodes where kubernetes cluster is set)) and Rx Packet Drops > 0 group by ConnectedTo order by max(Rx Packet Drops)
Rx Packet drops group by Kubernetes node
nsx-t logical switch where Rx Packet Drops > 0 and Tag like ‘ncp/project:’ order by Rx Packet Drops
Rx Packet drops group by Kubernetes namespace
nsx-t logical switch where Rx Packet Drops > 0 and Tag like ‘ncp/project:<namespace name>’
Packet drops by a specific namespace
nsx-t logical port where (ConnectedTo in (Kubernetes Pods where kubernetes cluster is set)) and Rx Packet Drops > 0 group by ConnectedTo.Kubernetes service order by max(Rx Packet Drops)
Packet drops group by Kubernetes services
flows where firewall action = ‘DROP’ group by Kubernetes Service
Drop flows group by Kubernetes service
flows where firewall action = ‘DROP’ group by source Kubernetes Namespace
List of all dropped flows group by Kubernetes namespace
Kubernetes events Kubernetes events where Problem Entity = ‘<pod/namespace/node Name>’
List of all Kubernetes events for the given Kubernetes entity. Kubernetes entity would be either pod or namespace or node
Kubernetes events where Event code = ‘ImagePullBackOff’ in last 24 hours
List of Kubernetes events of type ‘ImagePullBackOff’ in last 24 hours
Kubernetes events where problem entity.Kubernetes Cluster = ‘<cluster-a>’
List of all Kubernetes events for the given cluster
Sample Search Queries Related to Load BalancerYou can use the following sample queries to filter or search the data related to the load balancer.
n vm where lbServiceNodes is set - Lists all the VMs that are hosting an application where load is distributed.
Using vRealize Network Insight
VMware, Inc. 328
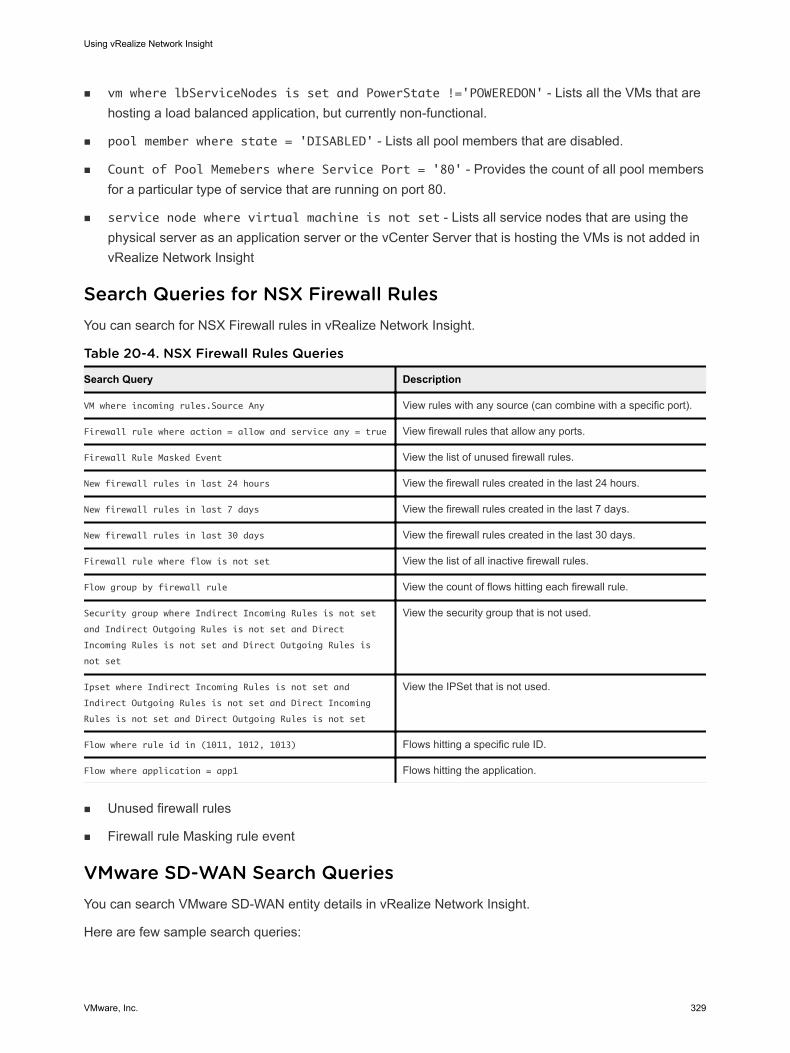
n vm where lbServiceNodes is set and PowerState !='POWEREDON' - Lists all the VMs that are hosting a load balanced application, but currently non-functional.
n pool member where state = 'DISABLED' - Lists all pool members that are disabled.
n Count of Pool Memebers where Service Port = '80' - Provides the count of all pool members for a particular type of service that are running on port 80.
n service node where virtual machine is not set - Lists all service nodes that are using the physical server as an application server or the vCenter Server that is hosting the VMs is not added in vRealize Network Insight
Search Queries for NSX Firewall RulesYou can search for NSX Firewall rules in vRealize Network Insight.
Table 20-4. NSX Firewall Rules Queries
Search Query Description
VM where incoming rules.Source Any View rules with any source (can combine with a specific port).
Firewall rule where action = allow and service any = true View firewall rules that allow any ports.
Firewall Rule Masked Event View the list of unused firewall rules.
New firewall rules in last 24 hours View the firewall rules created in the last 24 hours.
New firewall rules in last 7 days View the firewall rules created in the last 7 days.
New firewall rules in last 30 days View the firewall rules created in the last 30 days.
Firewall rule where flow is not set View the list of all inactive firewall rules.
Flow group by firewall rule View the count of flows hitting each firewall rule.
Security group where Indirect Incoming Rules is not set
and Indirect Outgoing Rules is not set and Direct
Incoming Rules is not set and Direct Outgoing Rules is
not set
View the security group that is not used.
Ipset where Indirect Incoming Rules is not set and
Indirect Outgoing Rules is not set and Direct Incoming
Rules is not set and Direct Outgoing Rules is not set
View the IPSet that is not used.
Flow where rule id in (1011, 1012, 1013) Flows hitting a specific rule ID.
Flow where application = app1 Flows hitting the application.
n Unused firewall rules
n Firewall rule Masking rule event
VMware SD-WAN Search QueriesYou can search VMware SD-WAN entity details in vRealize Network Insight.
Here are few sample search queries:
Using vRealize Network Insight
VMware, Inc. 329
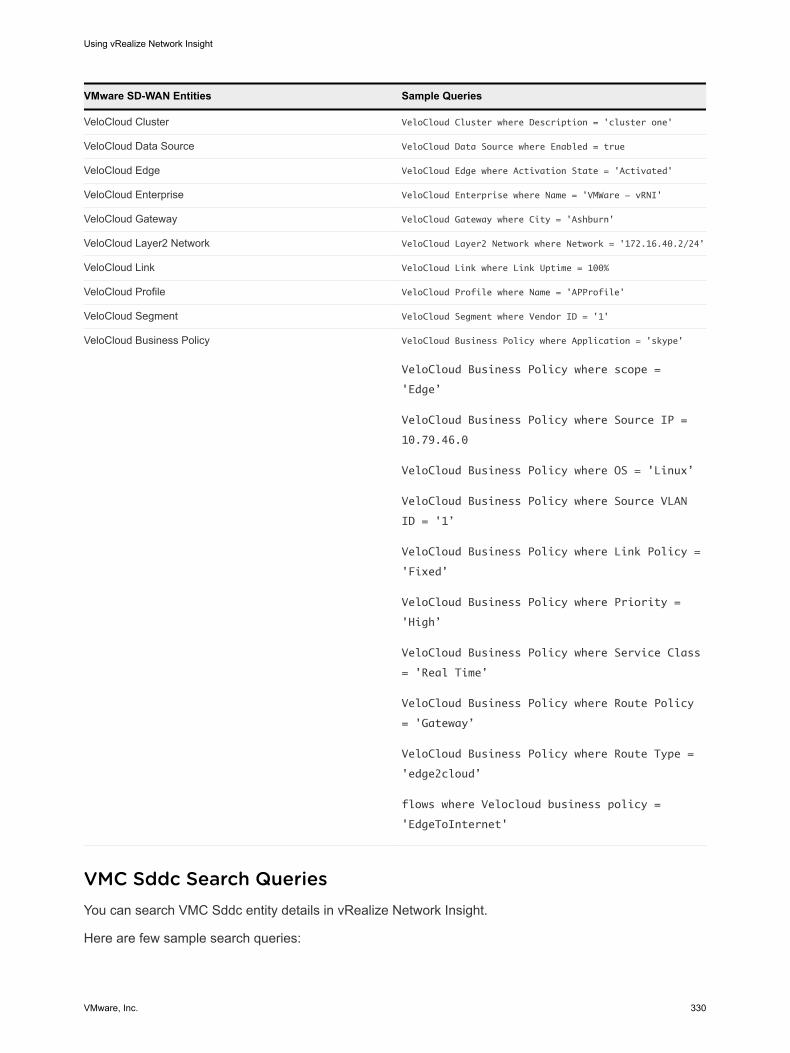
VMware SD-WAN Entities Sample Queries
VeloCloud Cluster VeloCloud Cluster where Description = 'cluster one'
VeloCloud Data Source VeloCloud Data Source where Enabled = true
VeloCloud Edge VeloCloud Edge where Activation State = 'Activated'
VeloCloud Enterprise VeloCloud Enterprise where Name = 'VMWare - vRNI'
VeloCloud Gateway VeloCloud Gateway where City = 'Ashburn'
VeloCloud Layer2 Network VeloCloud Layer2 Network where Network = '172.16.40.2/24'
VeloCloud Link VeloCloud Link where Link Uptime = 100%
VeloCloud Profile VeloCloud Profile where Name = 'APProfile'
VeloCloud Segment VeloCloud Segment where Vendor ID = '1'
VeloCloud Business Policy VeloCloud Business Policy where Application = 'skype'
VeloCloud Business Policy where scope =
'Edge’
VeloCloud Business Policy where Source IP =
10.79.46.0
VeloCloud Business Policy where OS = 'Linux’
VeloCloud Business Policy where Source VLAN
ID = '1’
VeloCloud Business Policy where Link Policy =
'Fixed’
VeloCloud Business Policy where Priority =
'High’
VeloCloud Business Policy where Service Class
= 'Real Time’
VeloCloud Business Policy where Route Policy
= 'Gateway’
VeloCloud Business Policy where Route Type =
'edge2cloud’
flows where Velocloud business policy =
'EdgeToInternet'
VMC Sddc Search QueriesYou can search VMC Sddc entity details in vRealize Network Insight.
Here are few sample search queries:
Using vRealize Network Insight
VMware, Inc. 330
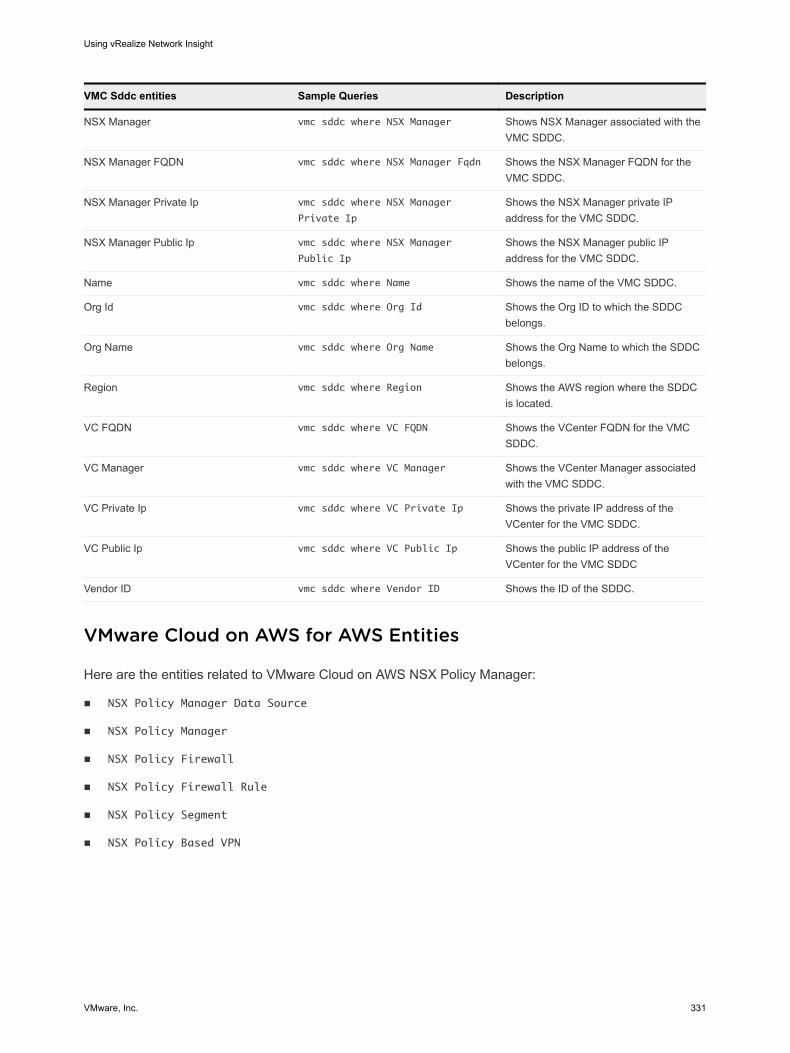
VMC Sddc entities Sample Queries Description
NSX Manager vmc sddc where NSX Manager Shows NSX Manager associated with the VMC SDDC.
NSX Manager FQDN vmc sddc where NSX Manager Fqdn Shows the NSX Manager FQDN for the VMC SDDC.
NSX Manager Private Ip vmc sddc where NSX Manager
Private Ip
Shows the NSX Manager private IP address for the VMC SDDC.
NSX Manager Public Ip vmc sddc where NSX Manager
Public Ip
Shows the NSX Manager public IP address for the VMC SDDC.
Name vmc sddc where Name Shows the name of the VMC SDDC.
Org Id vmc sddc where Org Id Shows the Org ID to which the SDDC belongs.
Org Name vmc sddc where Org Name Shows the Org Name to which the SDDC belongs.
Region vmc sddc where Region Shows the AWS region where the SDDC is located.
VC FQDN vmc sddc where VC FQDN Shows the VCenter FQDN for the VMC SDDC.
VC Manager vmc sddc where VC Manager Shows the VCenter Manager associated with the VMC SDDC.
VC Private Ip vmc sddc where VC Private Ip Shows the private IP address of the VCenter for the VMC SDDC.
VC Public Ip vmc sddc where VC Public Ip Shows the public IP address of the VCenter for the VMC SDDC
Vendor ID vmc sddc where Vendor ID Shows the ID of the SDDC.
VMware Cloud on AWS for AWS Entities
Here are the entities related to VMware Cloud on AWS NSX Policy Manager:
n NSX Policy Manager Data Source
n NSX Policy Manager
n NSX Policy Firewall
n NSX Policy Firewall Rule
n NSX Policy Segment
n NSX Policy Based VPN
Using vRealize Network Insight
VMware, Inc. 331
n NSX Policy Group
Note If NSX-T 2.4 and VMware Cloud on AWS are added as data sources in your vRealize Network Insight, then to get the VMware Cloud on AWS entities, you must add SDDC type = VMC filter in your query. For example, to list the Policy Based VPNs for VMware Cloud on AWS, enter NSX Policy Based VPN where Tier0 = ‘’ and SDDC Type = ‘VMC’.
Some sample search queries related to the VMware Cloud on AWS entities are:
n VMs where L2 Network = '' (L2 Network -> NSX Policy Segment)
n NSX Policy Based VPN where Tier0 = ''
n NSX Policy Based VPN where Local Network = '' (Local Network of Policy Based VPN Rule)
n NSX Policy Based VPN where Remote Network = '' (Remote Network of Policy Based VPN Rule)
n NSX Policy Group where Translated VM = ''
n VM where NSX Policy Group = ''
Note n NSX Policy Manager does not support child groups or IPSETS. Hence all the searches like NSX
Policy firewall rule where Indirect __________ = '' or NSX Policy group where Indirect _____= '' are disabled.
Advanced Queries
Here are some examples for advanced queries:
Flow Queries for Communication Patternsn Total Traffic across data centers or sites (DCI link use)
sum(bytes) of flows where ( Dst Manager = 'abc' AND src manager = 'cba') OR ( Dst Manager
= 'cba' AND src manager = 'abc')
n Total VTEP traffic
n sum(bytes) of flows where Flow Type = 'Src is VTEP' or flow type = 'Dst is VTEP' VTEP
traffic grouped by VMKNIC
n sum(bytes) of flows where Flow Type = 'Src is VTEP' or Flow Type = 'Dst is VTEP' group
by ip
n Other Management Traffic
flows where Flow Type = 'Source is VMKNIC' or Flow Type = 'Destination is VMKNIC'
Flow Queries for Aggregation and Groupingn Total Internet traffic by Source VM
Using vRealize Network Insight
VMware, Inc. 332
sum(bytes) of flows where Flow Type = 'Internet' group by src vm
n Top ports by total bytes
sum(bytes) of flow group by port order by sum(bytes)
n Top subnet pairs by routed traffic volume
sum(bytes) of flow where Flow Type = 'Routed' group by Source Subnet Network, destination
subnet network order by sum(bytes)
n Total VM by total pair bytes
sum(bytes) of flows group by src vm , dest vm order by sum(bytes)
n Top Server VM/Port by total bytes
sum(bytes) of flows group by dest vm , port order by sum(bytes)
Flow Queries for Capacity Estimation and Sizingn Total bytes of all vm-internet/internet-vm traffic grouped by ESX ( Palo Alto Service VM sizing)
sum(bytes) of flows where flow type = 'internet' and (flow type = ' src is vm ' OR flow
type = 'destination is vm ') group by host order by sum(bytes)
n Aggregated traffic series for matching flows ( Palo Alto Service VM sizing)
series( sum(byte rate)) of flows where host = 'ddc1-pod2esx012.dm.democompany.net' and
(Flow Type = 'Source is VM' OR flow type = 'Destination is VM')
Useful Queries for Applicationn VMs in a given application
VM where application = 'CRM'
n Routed Flows from a given application
Flows where source application = CRM and Flow Type = 'Routed'
n Flows between two tiers (one-way)
Flows where src tier = 'App' and Destination Tier = 'DB'
n Flows between two tiers (one-way)
Flows where ( src tier = 'App' and destination Tier = 'DB') OR (destination tier = 'App'
and source tier = 'DB')
Useful Queries for VM and ESXn Properties of Prod -Midtier-1 VM (MAC, IP, host, and so on)
CPU Usage Rate, Network Rate, Memory Usage Rate, mac address, ip , vxlan , host of vm
'Quality control-VM26'
n Network segments having the highest VM count
Using vRealize Network Insight
VMware, Inc. 333
vm group by l2 network
n Datastores have highest VM count
vm group by datastore
n Hosts by vSphere version
host group by version
n Hosts by vSphere Builds
host group by OS
n All VMs on all host/blade slotted in a particular UCS chassis (Nested Query)
vm where host in (host where Blade like 'sys/chassis-1')
Useful Queries: General Capacityn Number of Datacenters:
count of datacenter
n Number of clusters
count of cluster
n Number of Hosts
count of host
n Number of VMs
count of vm
n Number of Networks
count of vlan
Useful Queries: Routesn VNIs by Primary controller
vxlan group by Primary Controller
n Routes for Provider edge 3
routes where vrf = 'Provider Edge 3'
n Routes of DMZ DLR
NextHop Router of routes where VRF = 'LDR-DMZ'
n Routes having the given router as next hop
routes where NextHop Router = 'California-Edge'
Using vRealize Network Insight
VMware, Inc. 334
Useful Queries: Firewall Rulesn Firewall rules between two VMs
firewall rules from 'Prod-Midtier-1' to 'Prod-Db-1'
n Rules with have ANY source
firewall rules where Service Any = true
n VMs for a given rule
vm where Firewall Rule = 'Prod MidTier to Prod DB - DBService '
n Firewall rules where any port is allowed
firewall rule where action = allow and service any = true
n Flows hitting a particular firewall rule
flows where firewall rule = 'Admin to Prod and Lab - SSH'
n Denied flows in the system
flows where firewall action = deny
n View gateway firewall
Firewall Rule where firewall type = 'GatewayFirewall'
n View distributed firewall
Firewall Rule where firewall type = 'Distributed Firewall'
Useful Queries: General Traffic Patternsn East-West and North-South traffic count, switched traffic count, routed traffic count, and VM to VM
traffic count
plan security in last 7 days
Useful Queries: Traffic from a security lensn Top talkers VMs details
top 7 vm group by name, Vlan order by sum(Total Network Traffic) in last 7 days
n Networks that carry the most traffic
top 7 vlan group by Vlan id, vm count order by sum(Total Network Traffic) in last 7 days
n Networks where most of the communication is within the VLAN (not crossing a physical firewall or L3 boundary)
top 7 flow where Flow Type = 'Switched' group by Subnet Network order by sum(Bytes) in
last 7 days
n Networks where most of the communication is across VLAN (may be causing bottleneck problems at physical firewall)
Using vRealize Network Insight
VMware, Inc. 335
top 7 flow where Flow Type = 'Routed' group by Source Subnet Network, Destination Subnet
Network order by sum(Bytes) in last 7 days
n VMs that talks outside the country
top 7 flow where Destination Country != 'United States' group by Source VM, Destination
Country order by sum(Bytes) in last 7 days
n Data stores experiencing the most storage latencies
avg(Read Latency), avg(Write Latency) of top 7 vm group by Datastore, vlan order by
avg(Write Latency) in last 7 days
Useful Queries: Compliance/Vulnerabilitiesn Vulnerable OSs details
vm where Operating System like 'Microsoft Windows Server 2003' or Operating System like
'Microsoft Windows Server 2008' or Operating System like 'Red Hat Enterprise Linux 6' or
Operating System like 'Red Hat Enterprise Linux 5' or Operating System like 'SUSE Linux
Enterprise 10' group by vlan, Operating System
n Vulnerable OS Count
count of vm where Operating System like 'Microsoft Windows Server 2003' or Operating
System like 'Microsoft Windows Server 2008' or Operating System like 'Red Hat Enterprise
Linux 6' or Operating System like 'Red Hat Enterprise Linux 5' or Operating System like
'SUSE Linux Enterprise 10'
n Total attack surface due to Old OSs
vm where vlan in (vlan of vm where os in ('Microsoft Windows Server 2003', 'Microsoft
Windows Server 2008', 'Red Hat Enterprise Linux 6', 'Red Hat Enterprise Linux 5', 'SUSE
Linux Enterprise 10')) group by Vlan
count of vm where vlan in (vlan of vm where os in ('Microsoft Windows Server 2003',
'Microsoft Windows Server 2008', 'Red Hat Enterprise Linux 6', 'Red Hat Enterprise Linux
5', 'SUSE Linux Enterprise 10'))
Note To get recommended firewall rule for the vulnerable OS, see Recommended Firewall Rule to Secure Vulnerable OS.
Time Control
Time-control allows you to run a search query within the context of a selected time or time range. You can select from a list of presets such as last 24 hours, last 3 days, and so on. You can also specify a particular date and time using the At option or even a range using the Between option.
Using vRealize Network Insight
VMware, Inc. 336
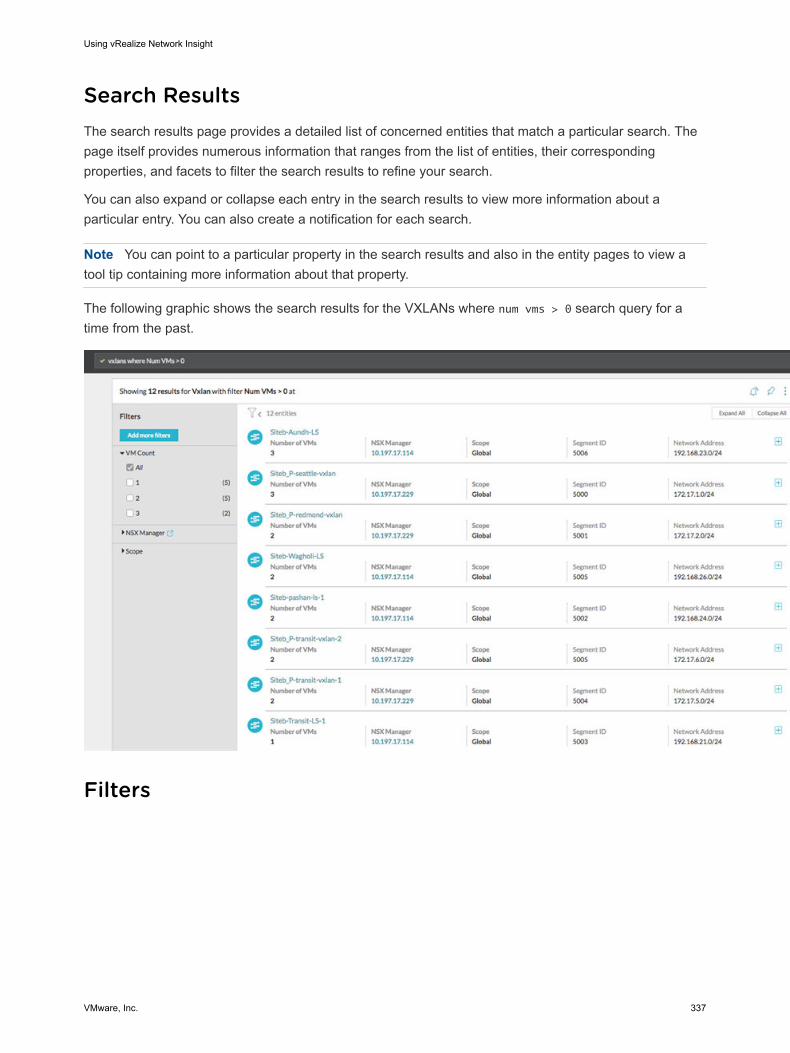
Search ResultsThe search results page provides a detailed list of concerned entities that match a particular search. The page itself provides numerous information that ranges from the list of entities, their corresponding properties, and facets to filter the search results to refine your search.
You can also expand or collapse each entry in the search results to view more information about a particular entry. You can also create a notification for each search.
Note You can point to a particular property in the search results and also in the entity pages to view a tool tip containing more information about that property.
The following graphic shows the search results for the VXLANs where num vms > 0 search query for a time from the past.
Filters
Using vRealize Network Insight
VMware, Inc. 337
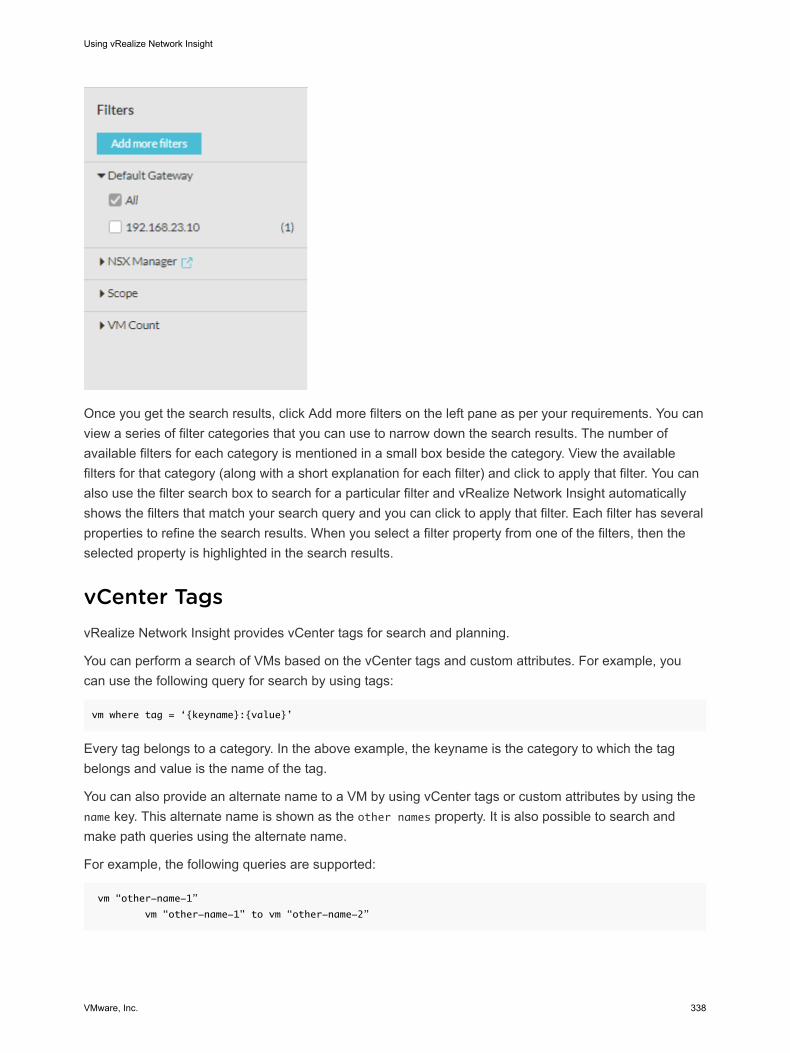
Once you get the search results, click Add more filters on the left pane as per your requirements. You can view a series of filter categories that you can use to narrow down the search results. The number of available filters for each category is mentioned in a small box beside the category. View the available filters for that category (along with a short explanation for each filter) and click to apply that filter. You can also use the filter search box to search for a particular filter and vRealize Network Insight automatically shows the filters that match your search query and you can click to apply that filter. Each filter has several properties to refine the search results. When you select a filter property from one of the filters, then the selected property is highlighted in the search results.
vCenter TagsvRealize Network Insight provides vCenter tags for search and planning.
You can perform a search of VMs based on the vCenter tags and custom attributes. For example, you can use the following query for search by using tags:
vm where tag = ‘{keyname}:{value}’
Every tag belongs to a category. In the above example, the keyname is the category to which the tag belongs and value is the name of the tag.
You can also provide an alternate name to a VM by using vCenter tags or custom attributes by using the name key. This alternate name is shown as the other names property. It is also possible to search and make path queries using the alternate name.
For example, the following queries are supported:
vm “other-name-1”
vm “other-name-1" to vm “other-name-2”
Using vRealize Network Insight
VMware, Inc. 338
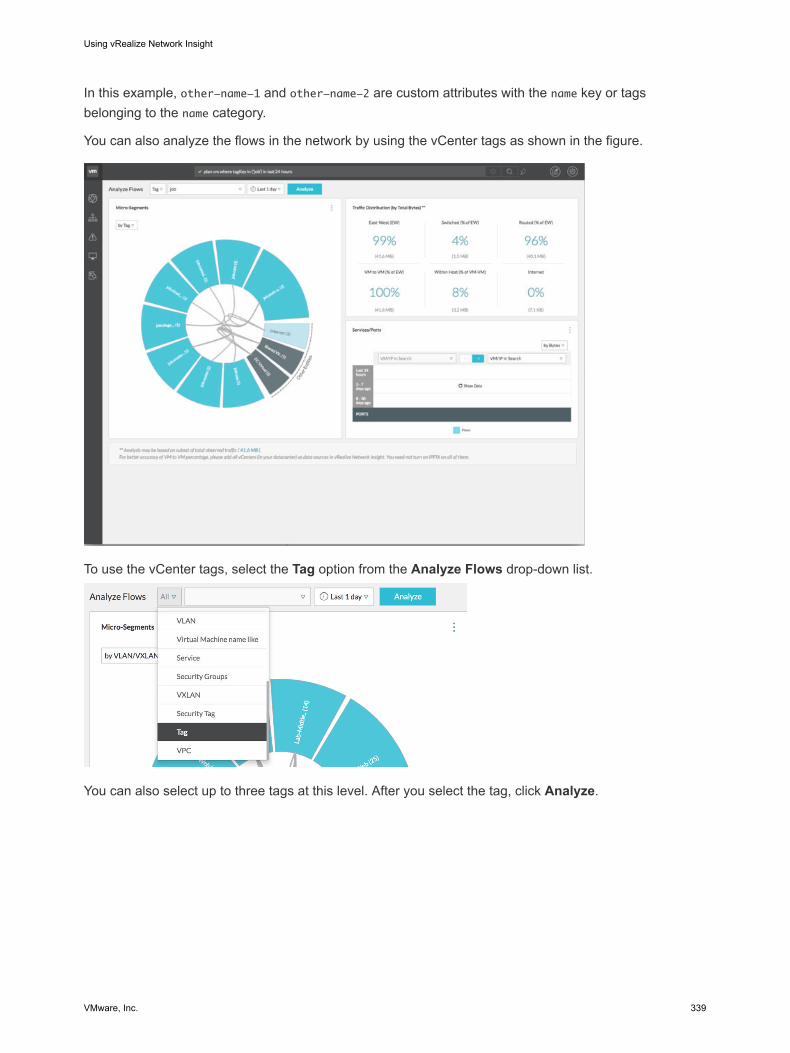
In this example, other-name-1 and other-name-2 are custom attributes with the name key or tags belonging to the name category.
You can also analyze the flows in the network by using the vCenter tags as shown in the figure.
To use the vCenter tags, select the Tag option from the Analyze Flows drop-down list.
You can also select up to three tags at this level. After you select the tag, click Analyze.
Using vRealize Network Insight
VMware, Inc. 339
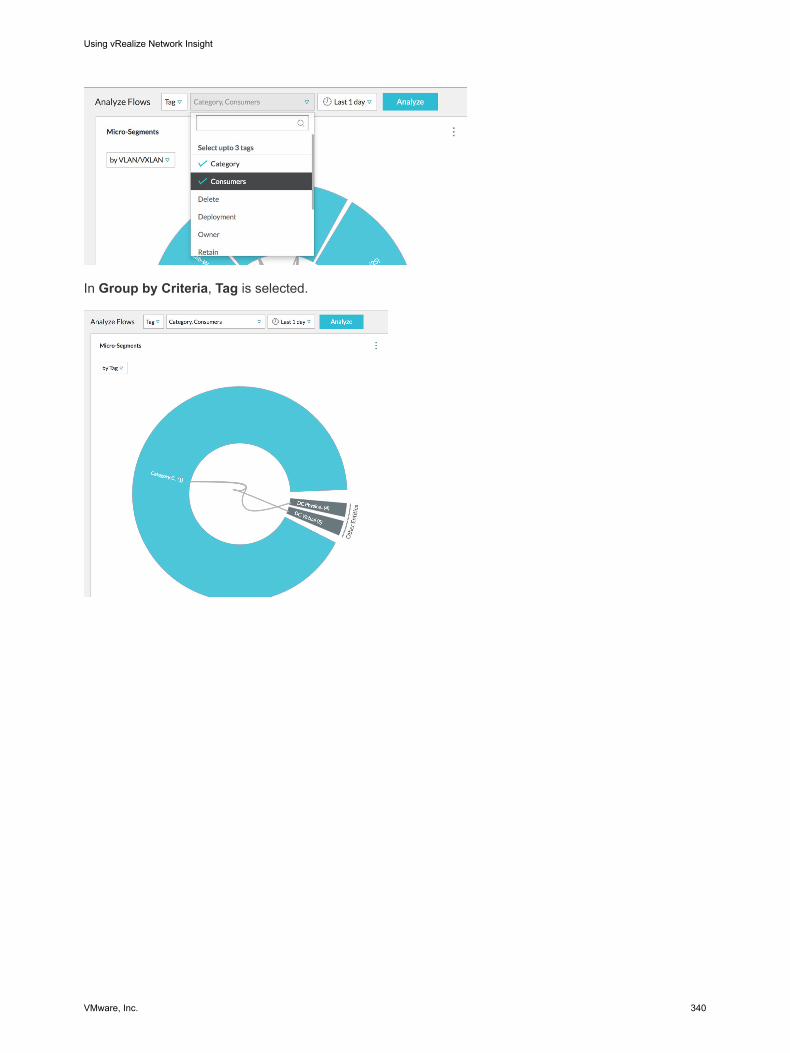
In Group by Criteria, Tag is selected.
Using vRealize Network Insight
VMware, Inc. 340
Planning Disaster Recovery for vRealize Network Insight 21VMware Site Recovery Manager (SRM) is a disaster recovery automation software that provides policy-based management, non-disruptive testing, and automated orchestration. vRealize Network Insight supports SRM 8.1 and the further versions. To protect your vRealize Network Insight, SRM automates every aspect of executing a disaster recovery plan to accelerate recovery and eliminate the risks involved when using a manual process.
For information about installing, upgrading, and configuring SRM, see VMware Site Recovery Manager Documentation.
The prerequisites for the disaster recovery operation for vRealize Network Insight are as follows:
n Ensure that you have installed and configured vSphere Replication.
n SRM should be deployed and configured on both the protected and the recovery sites.
n Ensure that the site pairing is configured properly from within the SRM UI before proceeding with the creation of the recovery plan and other components.
n VMware vSphere Replication should be enabled for each of the protected nodes of the vRNI setup in context. While enabling VMware vSphere Replication, provide sufficient RPO considering the vRealize Network Insight node size & the usage so that minimum data loss is expected to incur during a disaster. For more information on replication, see VMware vSphere Replication Documentation.
n Ensure that you create a separate protection group for vRealize Network Insight. For small and non-distributed deployments, ensure that all the VMs are in the same protection group. For distributed deployments, it is recommended that you place all the platforms in a single protection group so that it is easy to recover. You can place the collectors in different protection groups.
n Create a recovery plan and add the protection groups containing vRealize Network Insight VMs to this plan. Ensure that the protection group containing the platform nodes get the higher precedence. In the recovery plan, ensure that the primary platform node is placed in a higher priority group than the other platform nodes.
n Currently, any type of IPv4 customization with SRM is not supported
VMware, Inc. 341
It is recommended that you migrate or recover vRealize Network Insight VMs to an identical network configuration. Also as per the SRM recommendation, you can perform test run periodically to ensure the existing plan works with underlying infrastructure and the configured RPO limit.
n Migrate or recover vRealize Network Insight VMs to an identical network configuration.
If the recovery site is configured to have the same network configuration as the protected site and a mapping is created between the identical networks, configure all replicated vRealize Network Insight virtual machines to be started with the same IPs, because these VMs are the protected nodes. The recovered system will become operational after the planned migration or disaster recovery has finished successfully.
n Do not specify any IP customization for a recovery plan when the recovery site does not have the same network as that of the protected site. In this scenario, SRM is used for the recovery of the appliance VMs. For configuring network post recovery, manually assign the network settings as follows:
1 Run the change-network-settings command simultaneously on all the platform nodes.
2 Run the update-IP-change command on the nodes on Platform1, Platform2 and Platform3 consecutively.
3 Run vrni-proxy set-platform --ip-or-fqdn <with-updated-ip-of-Platform1> on the collector node.
4 Check the service status. If some of the services on the platform nodes are not running, reboot the nodes in the recommended order.
Note For more information on the commands mentioned above, see vRealize Network Insight Command Line Reference Guide.
This chapter includes the following topics:
n Sample Disaster Recovery Scenario
Sample Disaster Recovery Scenario
Here are the steps for a sample scenario for vRealize Network Insight Disaster Recovery (DR):
Procedure
1 Ensure that SRM is configured and up in both the protected and the recovery sites.
Using vRealize Network Insight
VMware, Inc. 342
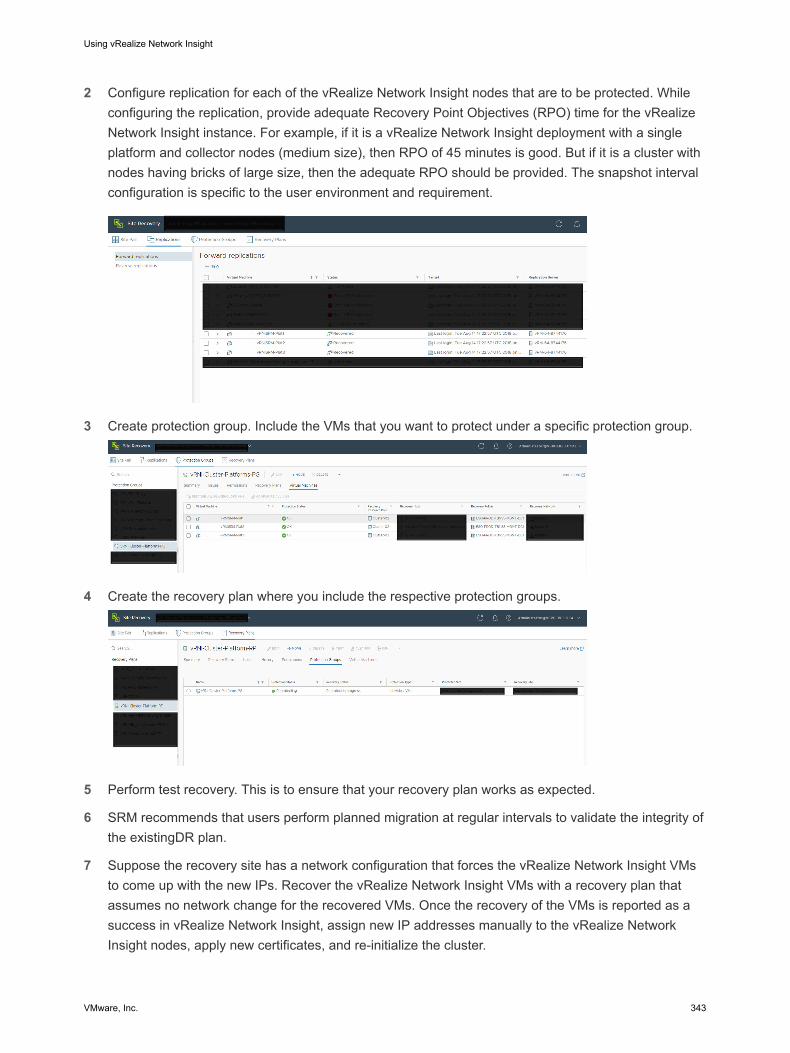
2 Configure replication for each of the vRealize Network Insight nodes that are to be protected. While configuring the replication, provide adequate Recovery Point Objectives (RPO) time for the vRealize Network Insight instance. For example, if it is a vRealize Network Insight deployment with a single platform and collector nodes (medium size), then RPO of 45 minutes is good. But if it is a cluster with nodes having bricks of large size, then the adequate RPO should be provided. The snapshot interval configuration is specific to the user environment and requirement.
3 Create protection group. Include the VMs that you want to protect under a specific protection group.
4 Create the recovery plan where you include the respective protection groups.
5 Perform test recovery. This is to ensure that your recovery plan works as expected.
6 SRM recommends that users perform planned migration at regular intervals to validate the integrity of the existingDR plan.
7 Suppose the recovery site has a network configuration that forces the vRealize Network Insight VMs to come up with the new IPs. Recover the vRealize Network Insight VMs with a recovery plan that assumes no network change for the recovered VMs. Once the recovery of the VMs is reported as a success in vRealize Network Insight, assign new IP addresses manually to the vRealize Network Insight nodes, apply new certificates, and re-initialize the cluster.
Using vRealize Network Insight
VMware, Inc. 343
8 As IPv4 customization with SRM is not supported currently, as a work around you can perform DR with vRealize Network Insight assuming as if there is no network change.
To manually assign the network settings:
a Run the change-network-settings command simultaneously on all the platform nodes.
b Run the update-IP-change command on the nodes on Platform1, Platform2 and Platform3 consecutively.
c Run vrni-proxy set-platform --ip-or-fqdn <with-updated-ip-of-Platform1> on the collector node.
d Check the service status. If some of the services on the platform nodes are not running, reboot the nodes in the recommended order.
Using vRealize Network Insight
VMware, Inc. 344
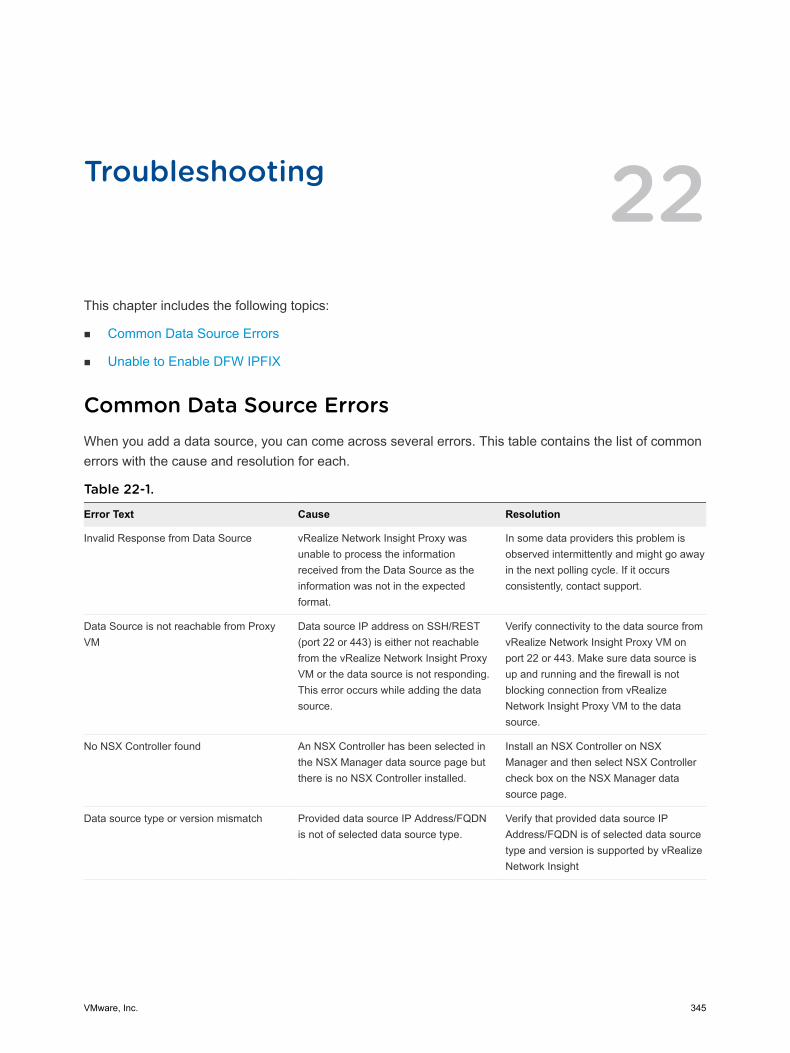
Troubleshooting 22This chapter includes the following topics:
n Common Data Source Errors
n Unable to Enable DFW IPFIX
Common Data Source ErrorsWhen you add a data source, you can come across several errors. This table contains the list of common errors with the cause and resolution for each.
Table 22-1.
Error Text Cause Resolution
Invalid Response from Data Source vRealize Network Insight Proxy was unable to process the information received from the Data Source as the information was not in the expected format.
In some data providers this problem is observed intermittently and might go away in the next polling cycle. If it occurs consistently, contact support.
Data Source is not reachable from Proxy VM
Data source IP address on SSH/REST (port 22 or 443) is either not reachable from the vRealize Network Insight Proxy VM or the data source is not responding. This error occurs while adding the data source.
Verify connectivity to the data source from vRealize Network Insight Proxy VM on port 22 or 443. Make sure data source is up and running and the firewall is not blocking connection from vRealize Network Insight Proxy VM to the data source.
No NSX Controller found An NSX Controller has been selected in the NSX Manager data source page but there is no NSX Controller installed.
Install an NSX Controller on NSX Manager and then select NSX Controller check box on the NSX Manager data source page.
Data source type or version mismatch Provided data source IP Address/FQDN is not of selected data source type.
Verify that provided data source IP Address/FQDN is of selected data source type and version is supported by vRealize Network Insight
VMware, Inc. 345
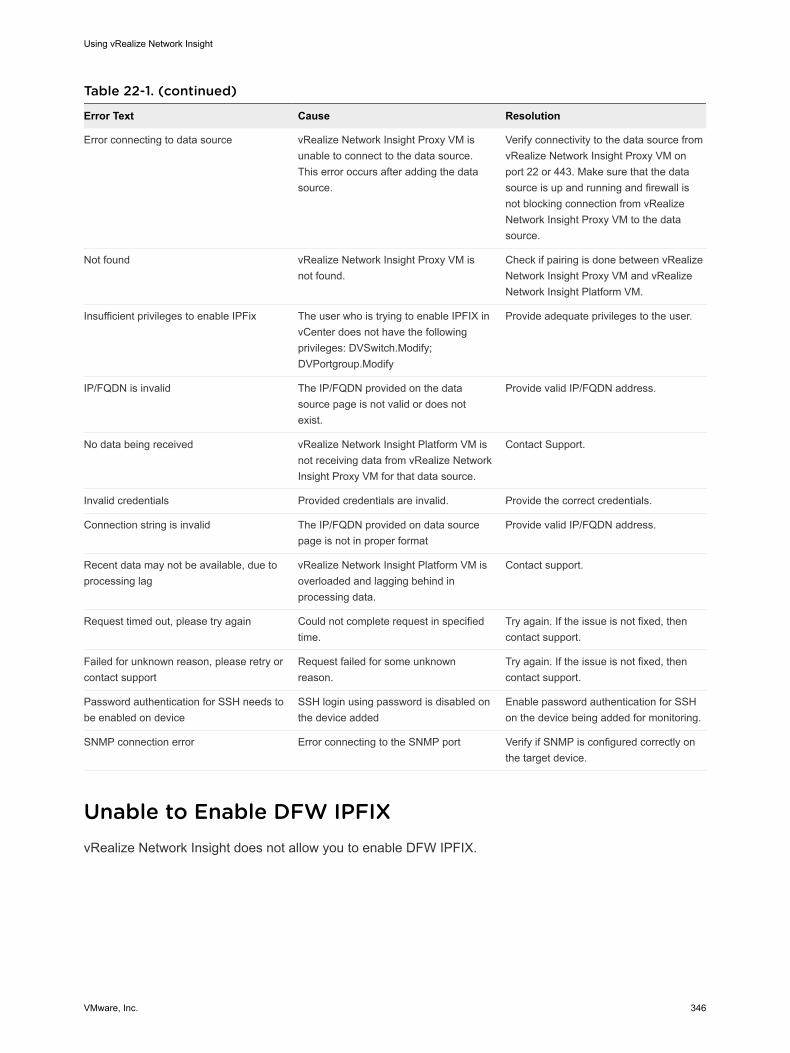
Table 22-1. (continued)
Error Text Cause Resolution
Error connecting to data source vRealize Network Insight Proxy VM is unable to connect to the data source. This error occurs after adding the data source.
Verify connectivity to the data source from vRealize Network Insight Proxy VM on port 22 or 443. Make sure that the data source is up and running and firewall is not blocking connection from vRealize Network Insight Proxy VM to the data source.
Not found vRealize Network Insight Proxy VM is not found.
Check if pairing is done between vRealize Network Insight Proxy VM and vRealize Network Insight Platform VM.
Insufficient privileges to enable IPFix The user who is trying to enable IPFIX in vCenter does not have the following privileges: DVSwitch.Modify; DVPortgroup.Modify
Provide adequate privileges to the user.
IP/FQDN is invalid The IP/FQDN provided on the data source page is not valid or does not exist.
Provide valid IP/FQDN address.
No data being received vRealize Network Insight Platform VM is not receiving data from vRealize Network Insight Proxy VM for that data source.
Contact Support.
Invalid credentials Provided credentials are invalid. Provide the correct credentials.
Connection string is invalid The IP/FQDN provided on data source page is not in proper format
Provide valid IP/FQDN address.
Recent data may not be available, due to processing lag
vRealize Network Insight Platform VM is overloaded and lagging behind in processing data.
Contact support.
Request timed out, please try again Could not complete request in specified time.
Try again. If the issue is not fixed, then contact support.
Failed for unknown reason, please retry or contact support
Request failed for some unknown reason.
Try again. If the issue is not fixed, then contact support.
Password authentication for SSH needs to be enabled on device
SSH login using password is disabled on the device added
Enable password authentication for SSH on the device being added for monitoring.
SNMP connection error Error connecting to the SNMP port Verify if SNMP is configured correctly on the target device.
Unable to Enable DFW IPFIXvRealize Network Insight does not allow you to enable DFW IPFIX.
Using vRealize Network Insight
VMware, Inc. 346
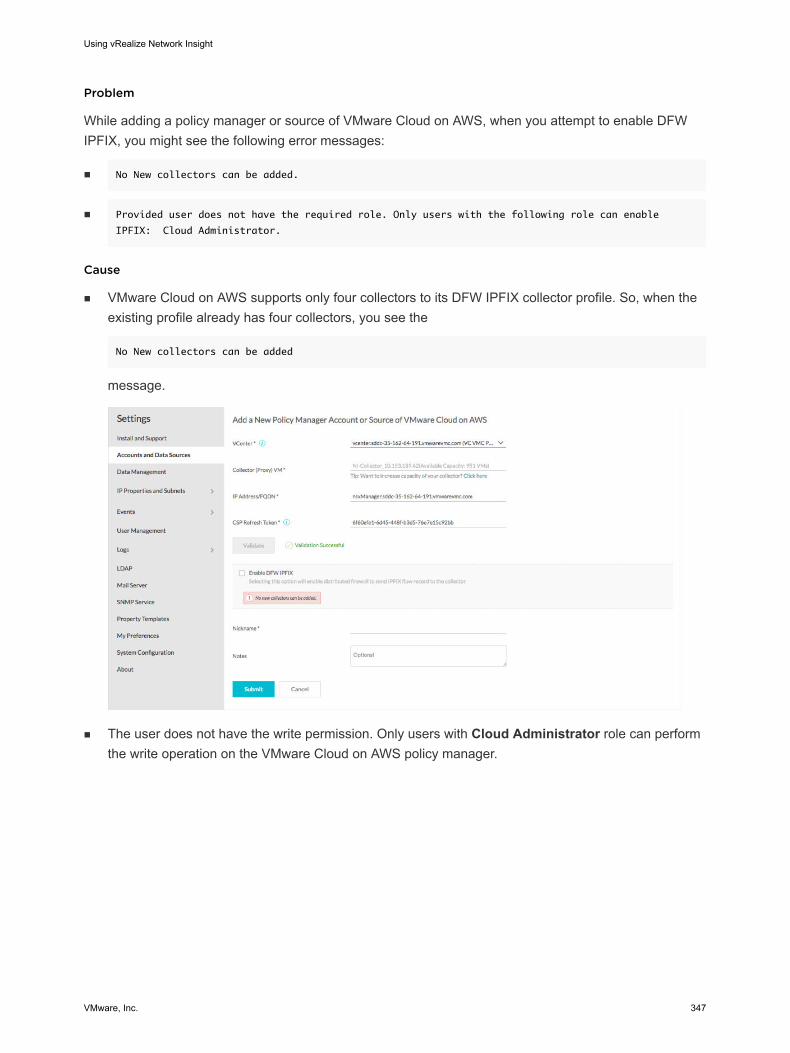
Problem
While adding a policy manager or source of VMware Cloud on AWS, when you attempt to enable DFW IPFIX, you might see the following error messages:
n No New collectors can be added.
n Provided user does not have the required role. Only users with the following role can enable
IPFIX: Cloud Administrator.
Cause
n VMware Cloud on AWS supports only four collectors to its DFW IPFIX collector profile. So, when the existing profile already has four collectors, you see the
No New collectors can be added
message.
n The user does not have the write permission. Only users with Cloud Administrator role can perform the write operation on the VMware Cloud on AWS policy manager.
Using vRealize Network Insight
VMware, Inc. 347
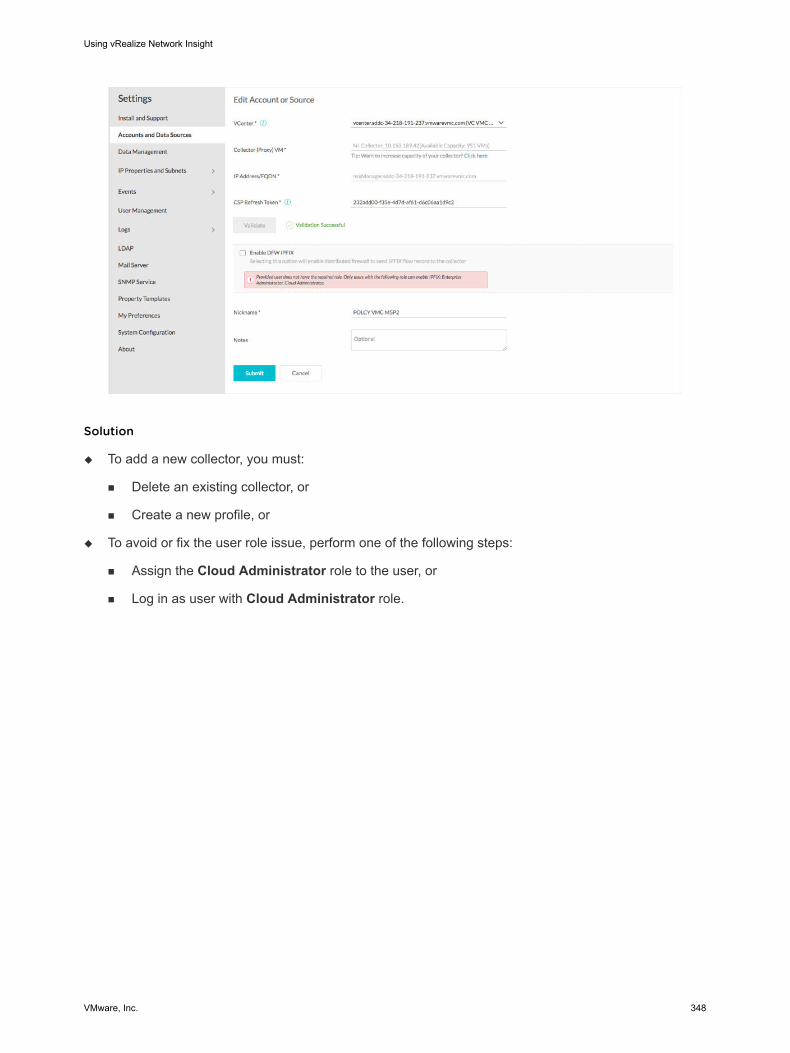
Solution
u To add a new collector, you must:
n Delete an existing collector, or
n Create a new profile, or
u To avoid or fix the user role issue, perform one of the following steps:
n Assign the Cloud Administrator role to the user, or
n Log in as user with Cloud Administrator role.
Using vRealize Network Insight
VMware, Inc. 348
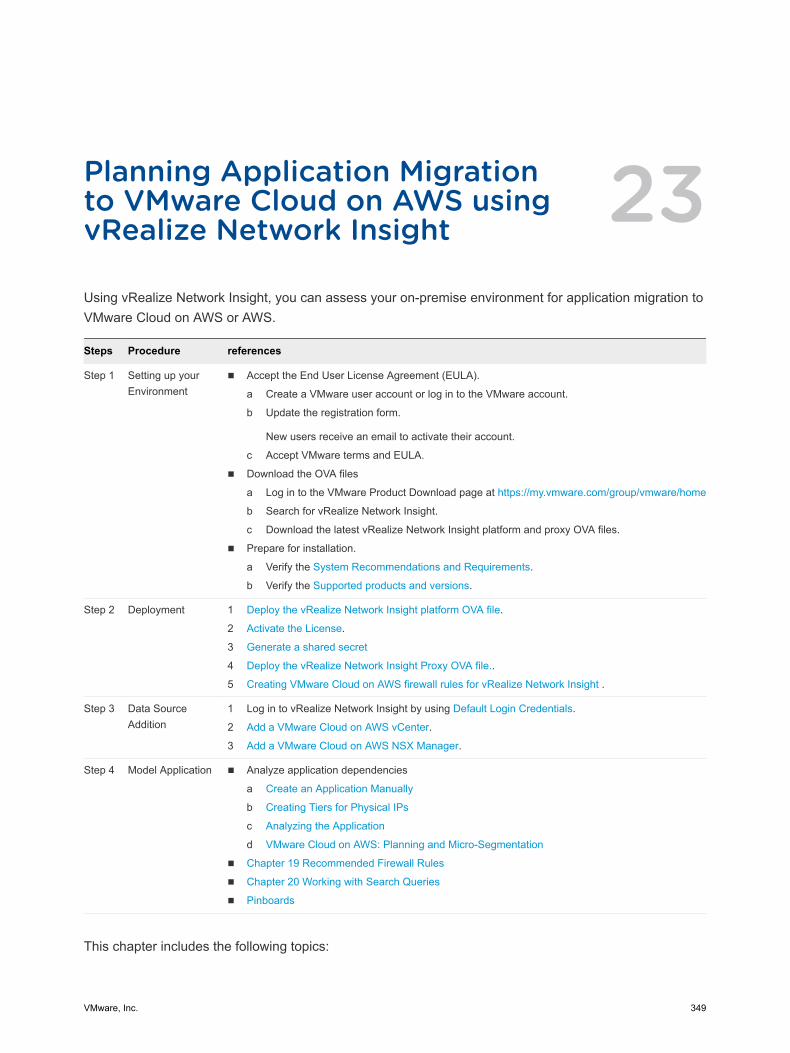
Planning Application Migration to VMware Cloud on AWS using vRealize Network Insight 23Using vRealize Network Insight, you can assess your on-premise environment for application migration to VMware Cloud on AWS or AWS.
Steps Procedure references
Step 1 Setting up your Environment
n Accept the End User License Agreement (EULA).
a Create a VMware user account or log in to the VMware account.
b Update the registration form.
New users receive an email to activate their account.
c Accept VMware terms and EULA.
n Download the OVA files
a Log in to the VMware Product Download page at https://my.vmware.com/group/vmware/home
b Search for vRealize Network Insight.
c Download the latest vRealize Network Insight platform and proxy OVA files.
n Prepare for installation.
a Verify the System Recommendations and Requirements.
b Verify the Supported products and versions.
Step 2 Deployment 1 Deploy the vRealize Network Insight platform OVA file.
2 Activate the License.
3 Generate a shared secret
4 Deploy the vRealize Network Insight Proxy OVA file..
5 Creating VMware Cloud on AWS firewall rules for vRealize Network Insight .
Step 3 Data Source Addition
1 Log in to vRealize Network Insight by using Default Login Credentials.
2 Add a VMware Cloud on AWS vCenter.
3 Add a VMware Cloud on AWS NSX Manager.
Step 4 Model Application n Analyze application dependencies
a Create an Application Manually
b Creating Tiers for Physical IPs
c Analyzing the Application
d VMware Cloud on AWS: Planning and Micro-Segmentation
n Chapter 19 Recommended Firewall Rules
n Chapter 20 Working with Search Queries
n Pinboards
This chapter includes the following topics:
VMware, Inc. 349
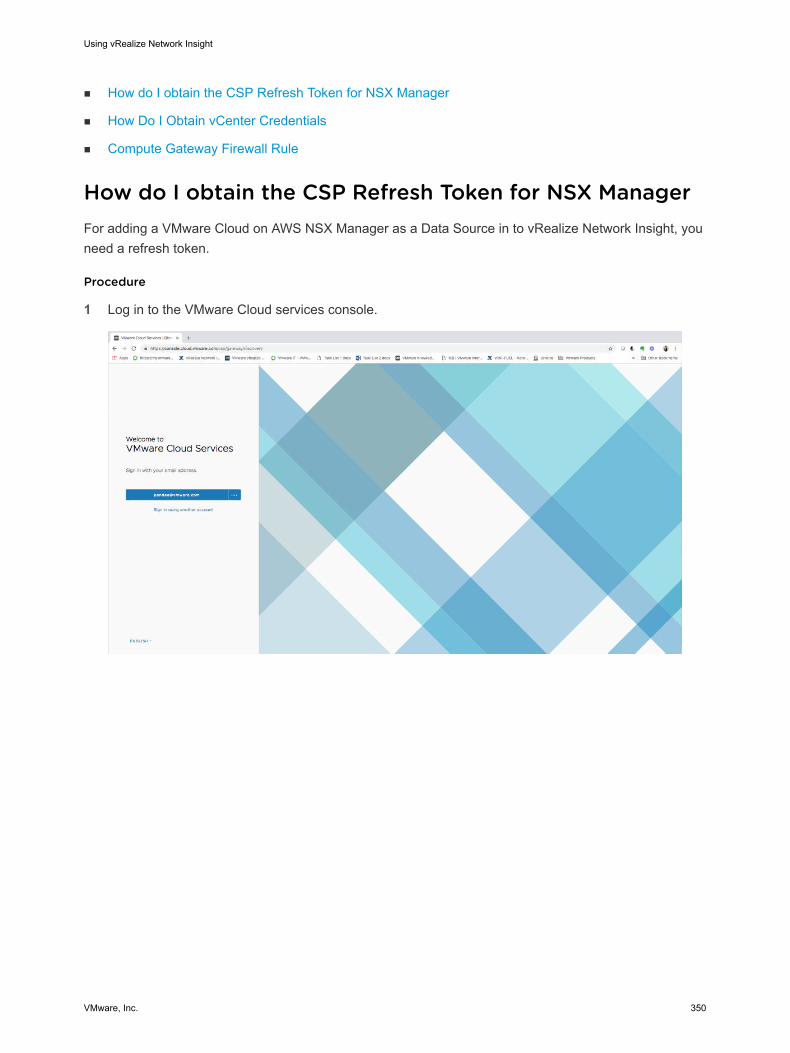
n How do I obtain the CSP Refresh Token for NSX Manager
n How Do I Obtain vCenter Credentials
n Compute Gateway Firewall Rule
How do I obtain the CSP Refresh Token for NSX ManagerFor adding a VMware Cloud on AWS NSX Manager as a Data Source in to vRealize Network Insight, you need a refresh token.
Procedure
1 Log in to the VMware Cloud services console.
Using vRealize Network Insight
VMware, Inc. 350
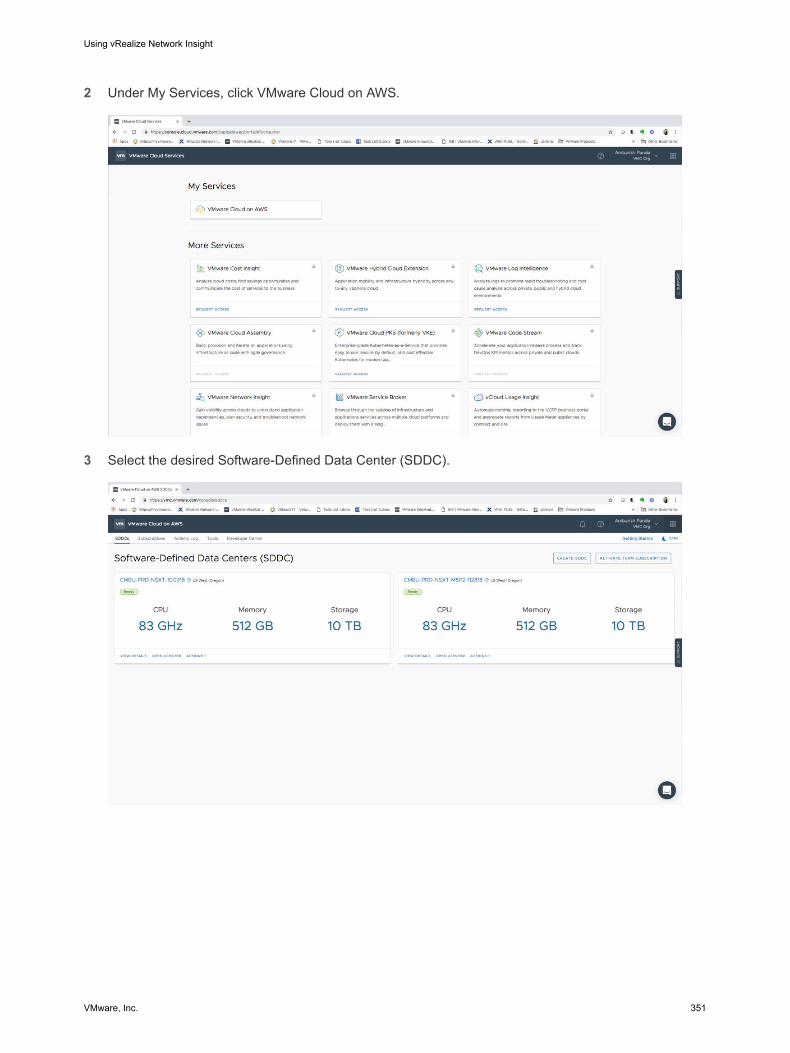
2 Under My Services, click VMware Cloud on AWS.
3 Select the desired Software-Defined Data Center (SDDC).
Using vRealize Network Insight
VMware, Inc. 351
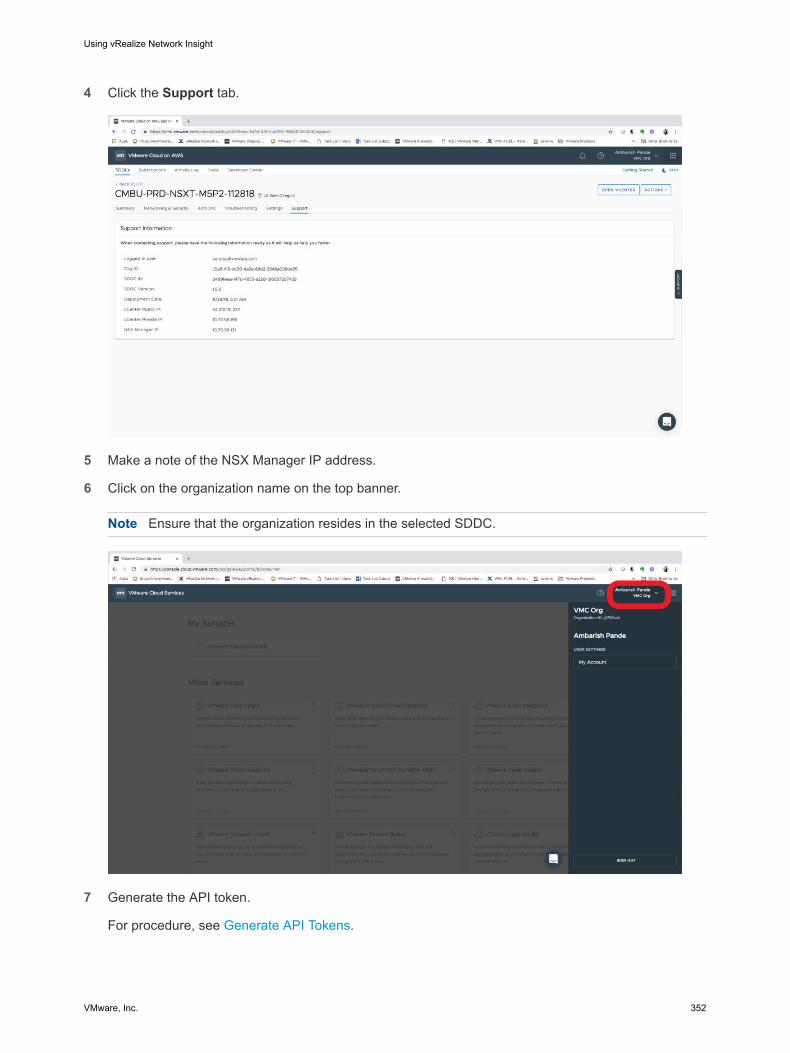
4 Click the Support tab.
5 Make a note of the NSX Manager IP address.
6 Click on the organization name on the top banner.
Note Ensure that the organization resides in the selected SDDC.
7 Generate the API token.
For procedure, see Generate API Tokens.
Using vRealize Network Insight
VMware, Inc. 352
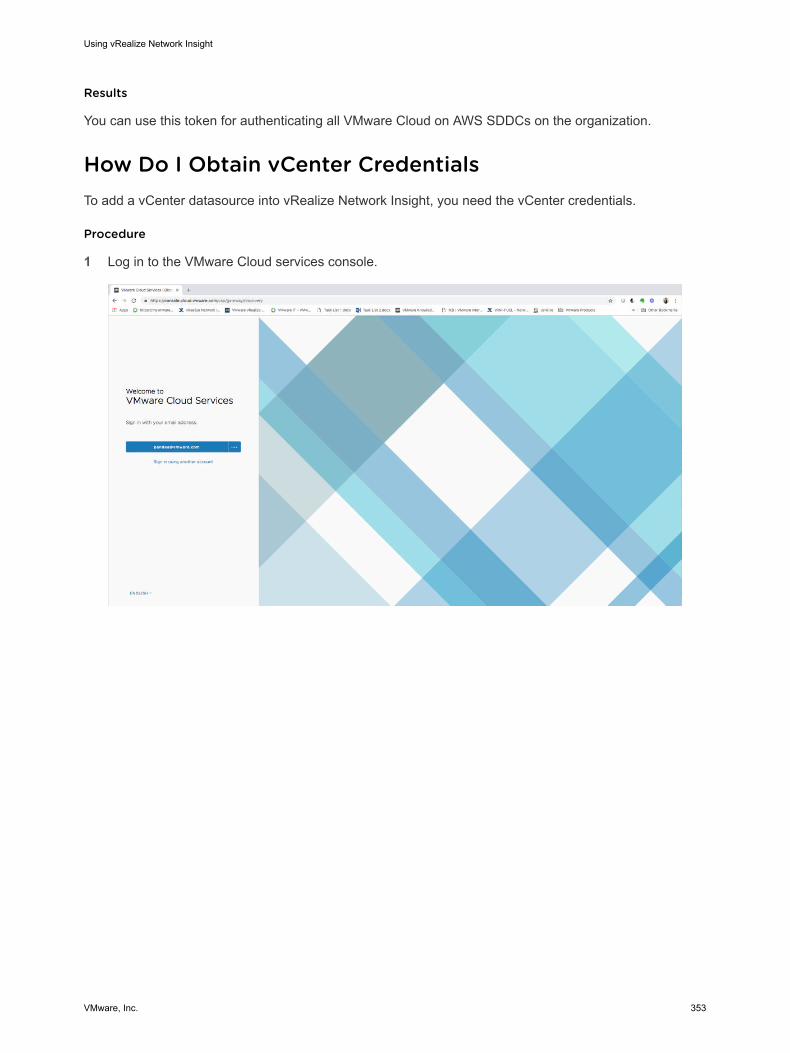
Results
You can use this token for authenticating all VMware Cloud on AWS SDDCs on the organization.
How Do I Obtain vCenter CredentialsTo add a vCenter datasource into vRealize Network Insight, you need the vCenter credentials.
Procedure
1 Log in to the VMware Cloud services console.
Using vRealize Network Insight
VMware, Inc. 353

2 Under My Services, click VMware Cloud on AWS.
3 Select the desired Software-Defined Data Center (SDDC).
Using vRealize Network Insight
VMware, Inc. 354
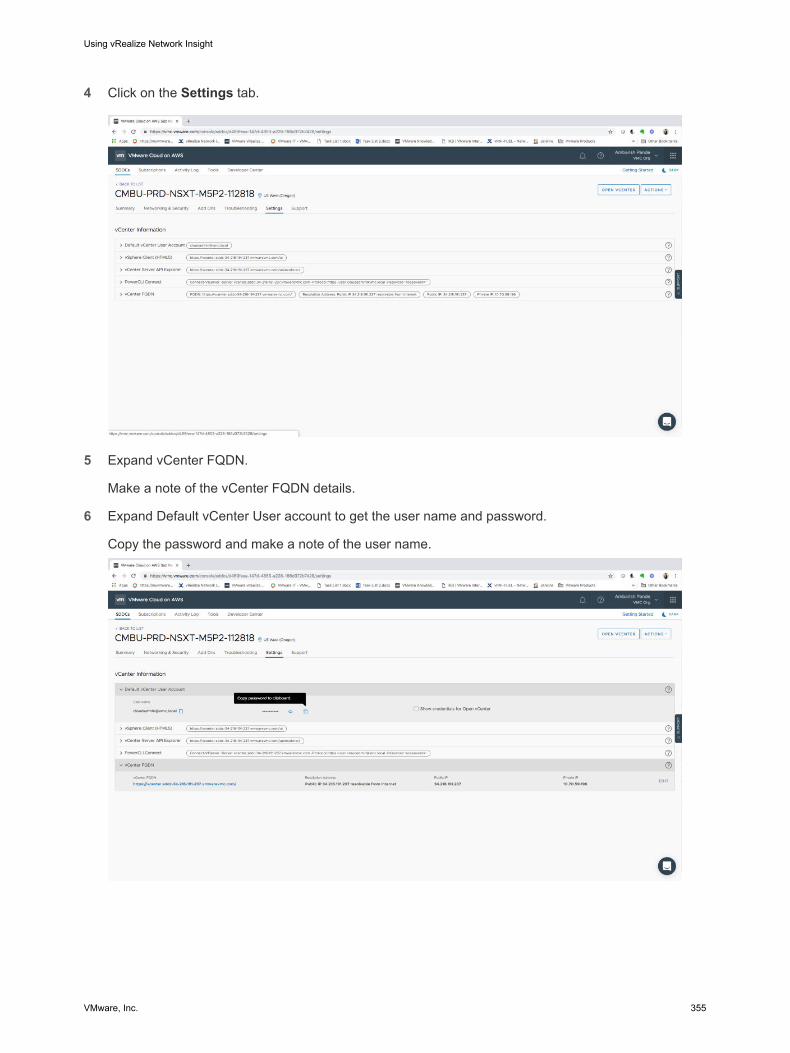
4 Click on the Settings tab.
5 Expand vCenter FQDN.
Make a note of the vCenter FQDN details.
6 Expand Default vCenter User account to get the user name and password.
Copy the password and make a note of the user name.
Using vRealize Network Insight
VMware, Inc. 355
Compute Gateway Firewall RuleWhen communicating with the vRealize Network Insight platform; the collector requires HTTPS port 443 to be open for outgoing traffic.
Following VMware hosted URLs are accessed by the collector through the firewall:
n *.vmwareidentity.com
n gaz.csp-vidm-prod.com
n *.vmware.com
n *.ni-onsaas.com
Additionally, NTP and DNS traffic should be allowed for the correct functioning of the vRealize Network Insight or vRealize Network Insight collector.
Create a firewall rule with the following details:
n Name: An appropriate descriptive name
n Source: The name of the VMware Cloud on AWS Group containing the collector IP address.
n Destination: Select ANY
n Services – Select HTTPS, DNS, DNS-UDP, NTP, ICMP
n Action – Allow
n Applied To – Internet Interface
n Logging – Enable logging, if required.
Using vRealize Network Insight
VMware, Inc. 356


![Network parameter-huawei[1]](https://img.pdfslide.net/doc/110x75/55ab17251a28abce4b8b47a3/network-parameter-huawei1.jpg)