Embed Size (px)
Citation preview
Utah Economic Development
Initiative2010-2020
Sept, 2010
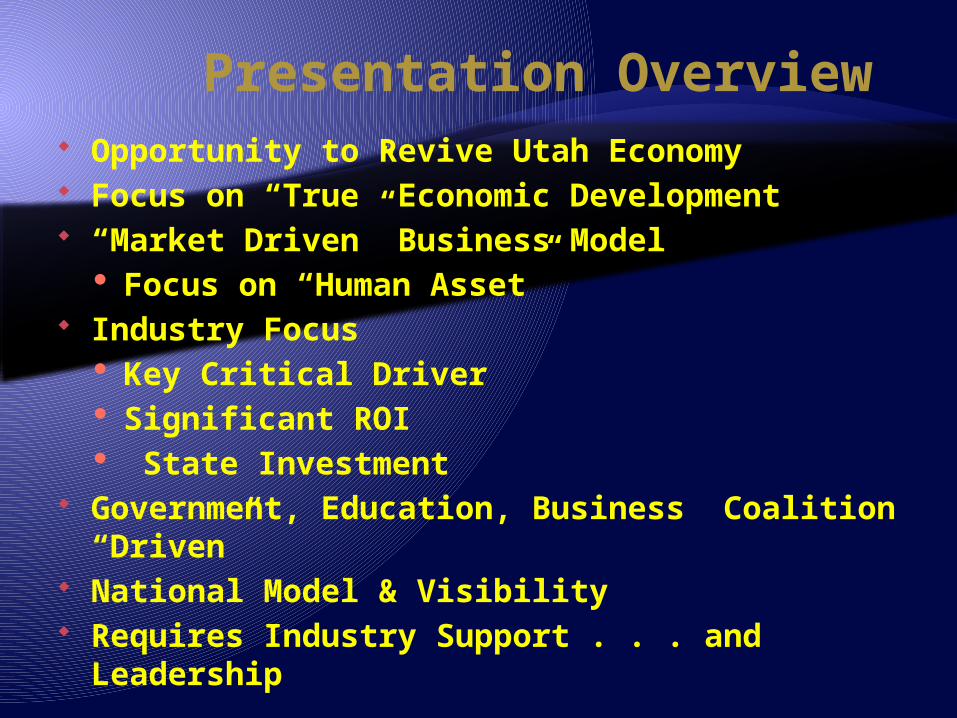
Presentation Overview Opportunity to Revive Utah Economy Focus on “True” Economic Development “Market Driven” Business Model
Focus on “Human Asset” Industry Focus
Key Critical Driver Significant ROI State Investment
Government, Education, Business Coalition “Driven”
National Model & Visibility Requires Industry Support . . . and
Leadership
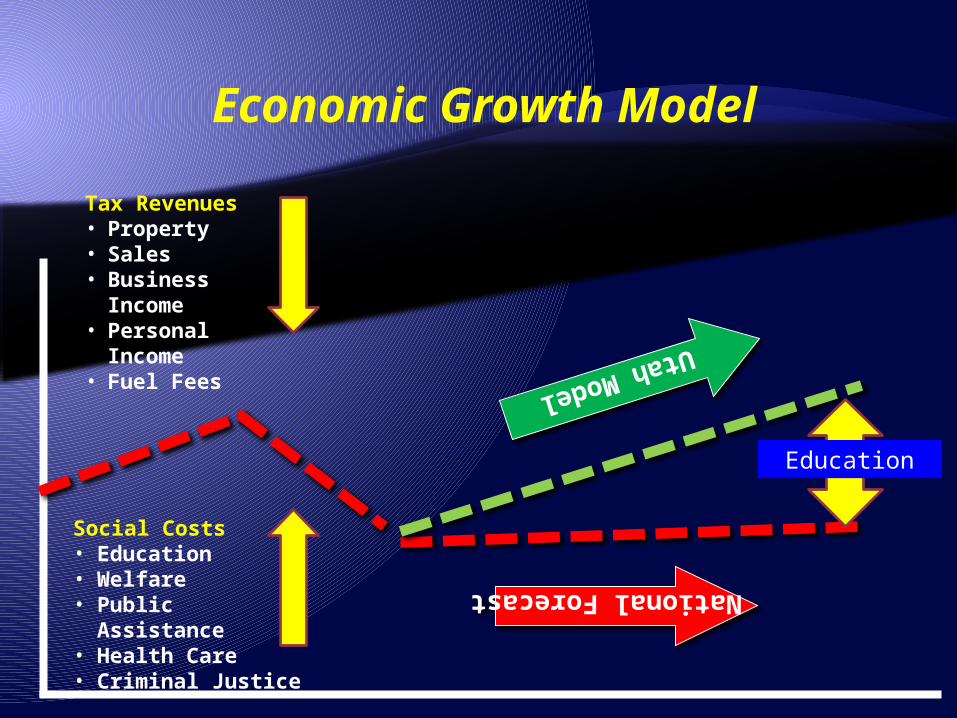
Economic Growth Model
Social Costs• Education• Welfare• Public Assistance• Health Care• Criminal Justice
National Forecast
Utah Model
Tax Revenues• Property• Sales • Business
Income• Personal
Income• Fuel Fees
Education
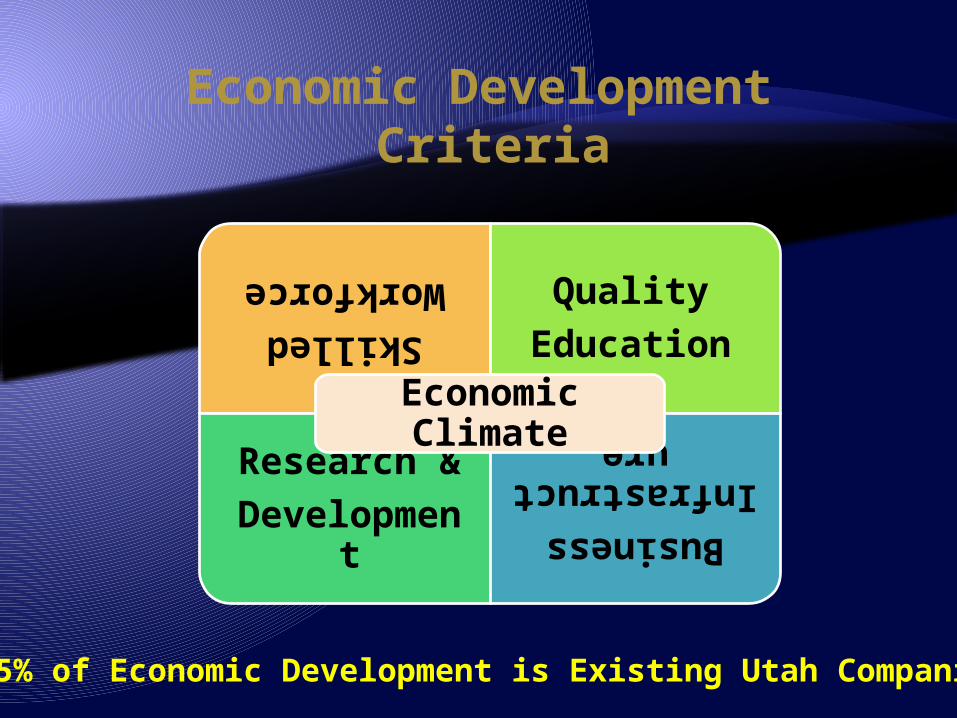
Economic Development Criteria
Skilled
Workforce
QualityEducation
Research &Developme
nt
BusinessInfrastructur
eEconomic Climate
85% of Economic Development is Existing Utah Companies
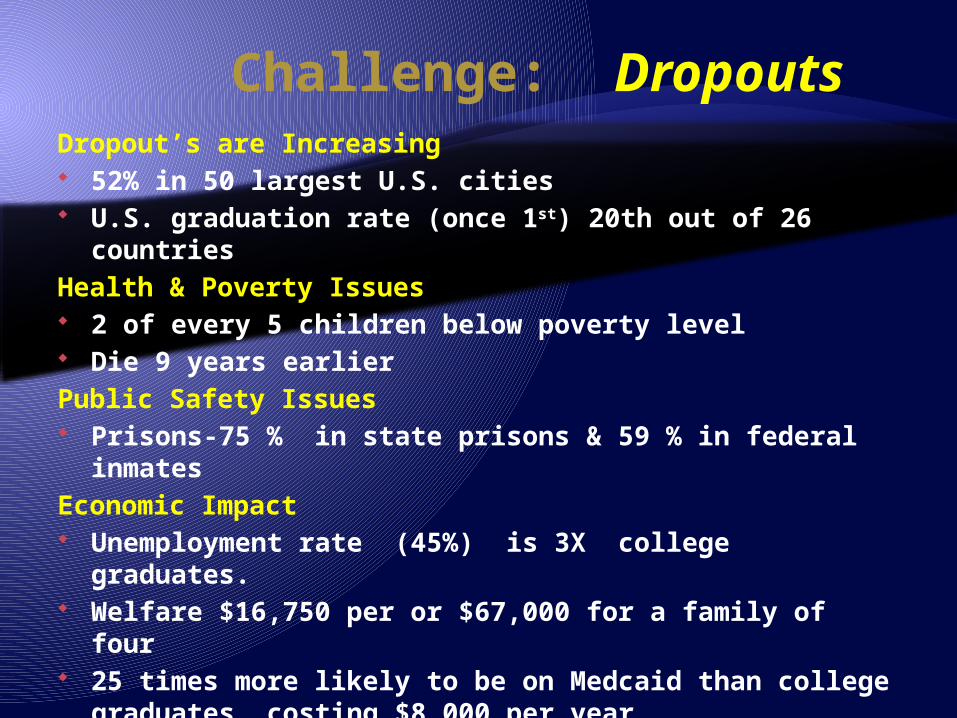
Challenge: DropoutsDropout’s are Increasing 52% in 50 largest U.S. cities U.S. graduation rate (once 1st) 20th out of 26
countriesHealth & Poverty Issues 2 of every 5 children below poverty level Die 9 years earlierPublic Safety Issues Prisons-75 % in state prisons & 59 % in federal
inmatesEconomic Impact Unemployment rate (45%) is 3X college graduates. Welfare $16,750 per or $67,000 for a family of four 25 times more likely to be on Medcaid than college
graduates, costing $8,000 per year Costs more than $800,000 over the course of his or
her lifetime
Challenge: Skilled Workforce
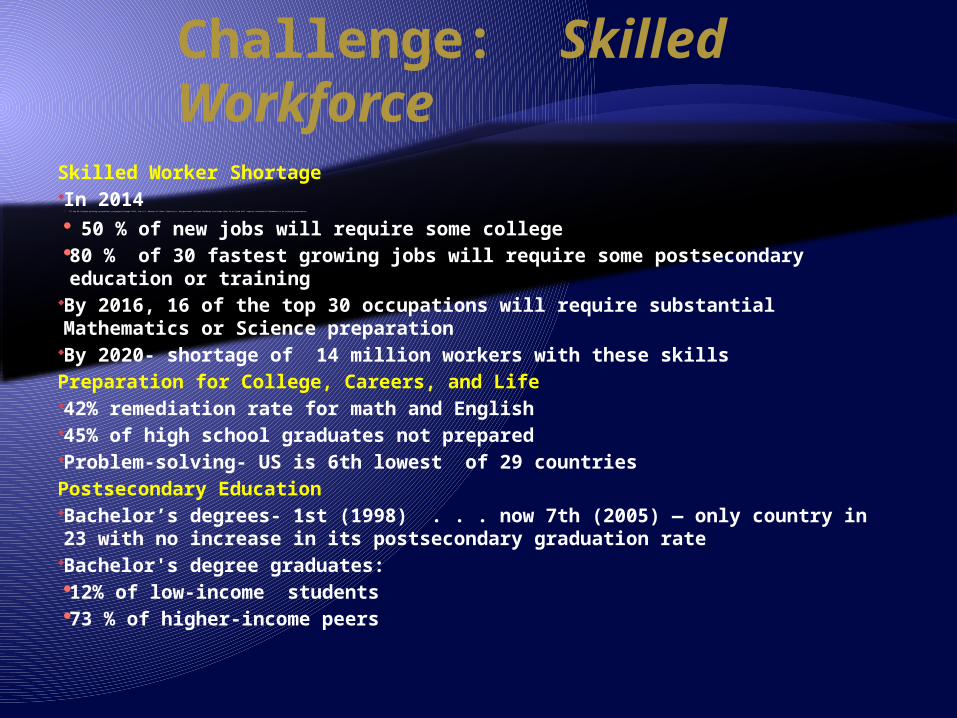
Skilled Worker Shortage In 2014
Of the 30 fastest-growing occupations projected through 2016, the U.S. Bureau of Labor Statistics’ Occupational Outlook Handbook concludes that 16 of them will require substantial Mathematics or Science preparation.
50 % of new jobs will require some college 80 % of 30 fastest growing jobs will require some postsecondary
education or training By 2016, 16 of the top 30 occupations will require substantial
Mathematics or Science preparation By 2020- shortage of 14 million workers with these skillsPreparation for College, Careers, and Life 42% remediation rate for math and English 45% of high school graduates not prepared Problem-solving- US is 6th lowest of 29 countriesPostsecondary Education Bachelor’s degrees- 1st (1998) . . . now 7th (2005) ― only country in
23 with no increase in its postsecondary graduation rate Bachelor's degree graduates:
12% of low-income students 73 % of higher-income peers
Utah’s 21st Century Workforce Initiative
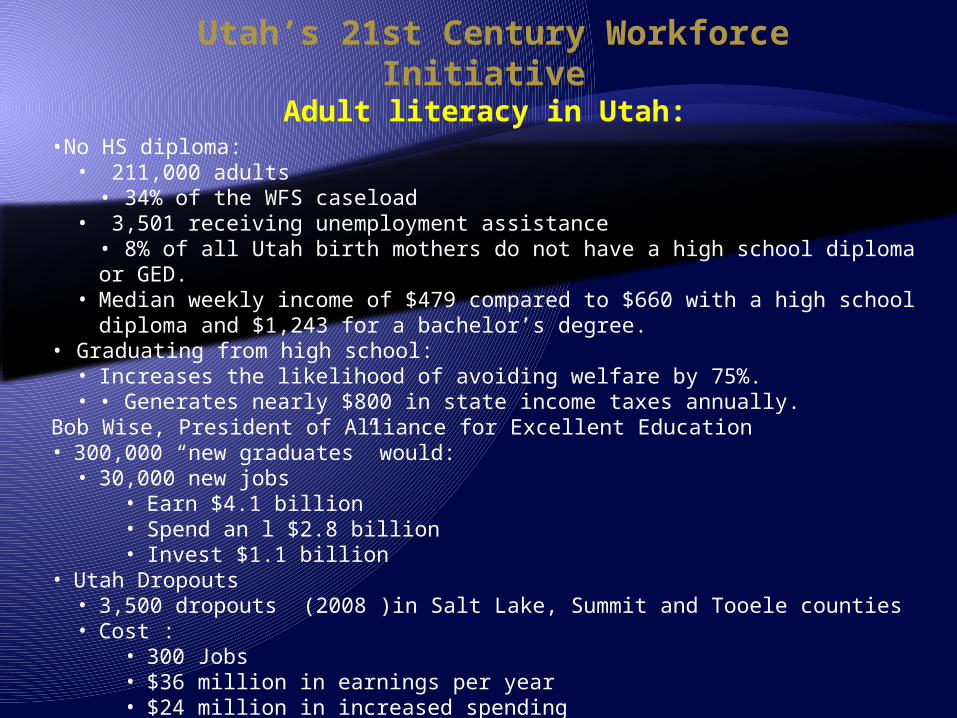
Adult literacy in Utah: •No HS diploma:
• 211,000 adults• 34% of the WFS caseload
• 3,501 receiving unemployment assistance• 8% of all Utah birth mothers do not have a high school diploma or GED.
• Median weekly income of $479 compared to $660 with a high school diploma and $1,243 for a bachelor’s degree.
• Graduating from high school:• Increases the likelihood of avoiding welfare by 75%.• • Generates nearly $800 in state income taxes annually.
Bob Wise, President of Alliance for Excellent Education• 300,000 “new graduates” would:
• 30,000 new jobs• Earn $4.1 billion• Spend an l $2.8 billion • Invest $1.1 billion
• Utah Dropouts• 3,500 dropouts (2008 )in Salt Lake, Summit and Tooele counties• Cost :
• 300 Jobs• $36 million in earnings per year• $24 million in increased spending
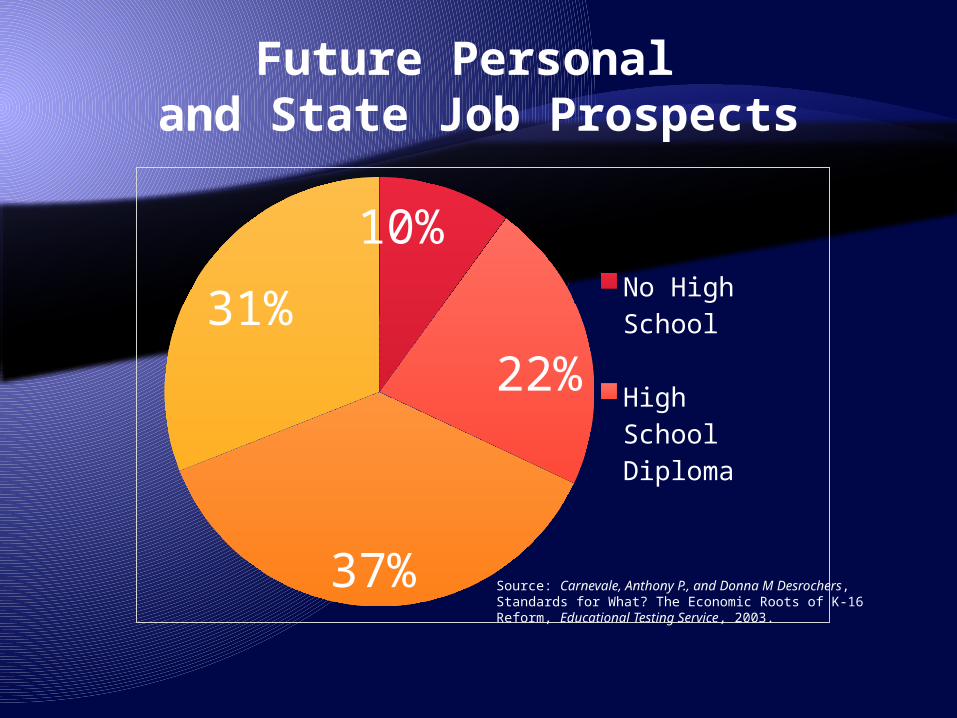
10%
22%
37%
31%No High School
High School Diploma
Some Postsec-ondaryBachelor's Degree
Source: Carnevale, Anthony P., and Donna M Desrochers, Standards for What? The Economic Roots of K-16 Reform, Educational Testing Service, 2003.
Future Personal and State Job Prospects
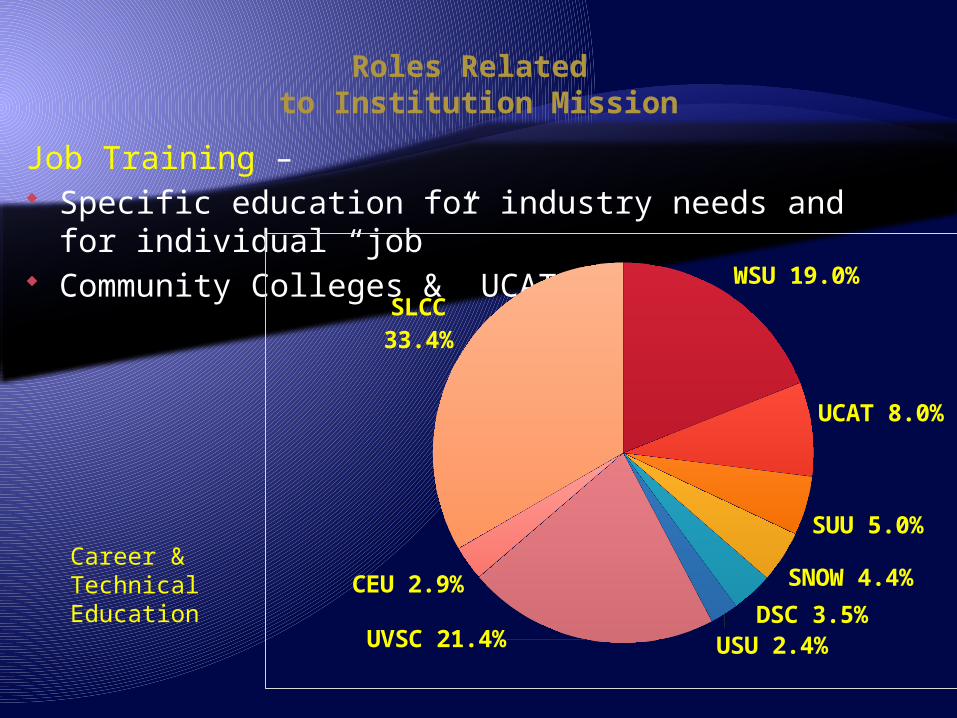
Roles Related to Institution Mission
Job Training – Specific education for industry needs and for
individual “job ” Community Colleges & UCAT
WSU 19.0%
UCAT 8.0%
SUU 5.0%
SNOW 4.4%DSC
3.5%USU 2.4%
UVSC 21.4%
CEU 2.9%
SLCC 33.4%
Career & Technical Education
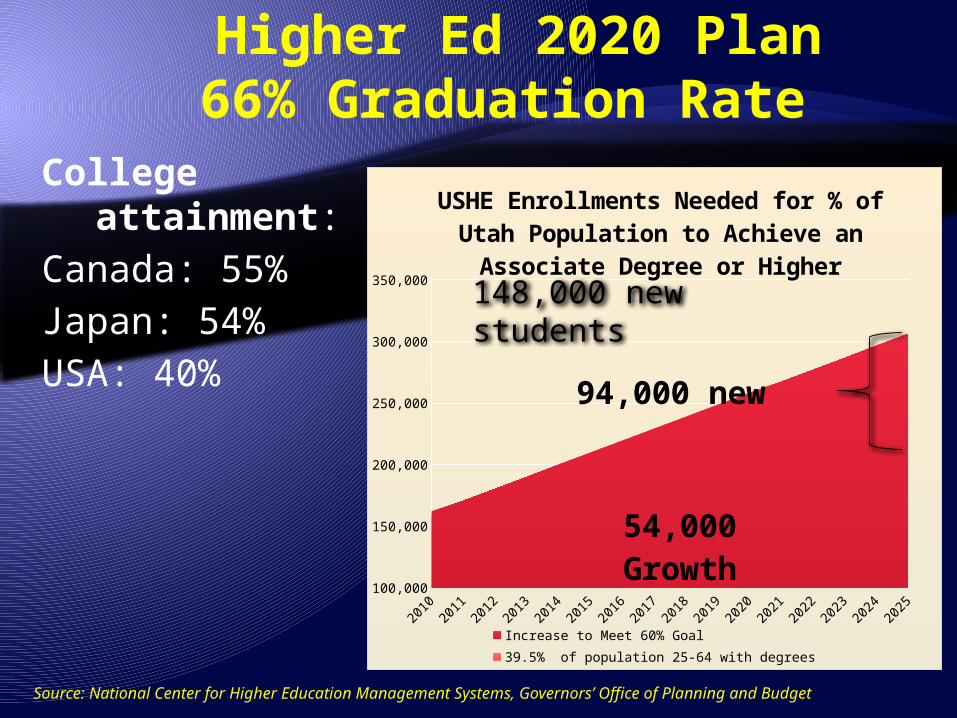
Higher Ed 2020 Plan66% Graduation Rate
2010
2011
2012
2013
2014
2015
2016
2017
2018
2019
2020
2021
2022
2023
2024
2025
100,000
150,000
200,000
250,000
300,000
350,000
USHE Enrollments Needed for % of Utah Population to Achieve an
Associate Degree or Higher
Increase to Meet 60% Goal 39.5% of population 25-64 with degrees
94,000 new
54,000 Growth
College attainment:
Canada: 55%Japan: 54%USA: 40%
148,000 new students
Source: National Center for Higher Education Management Systems, Governors’ Office of Planning and Budget
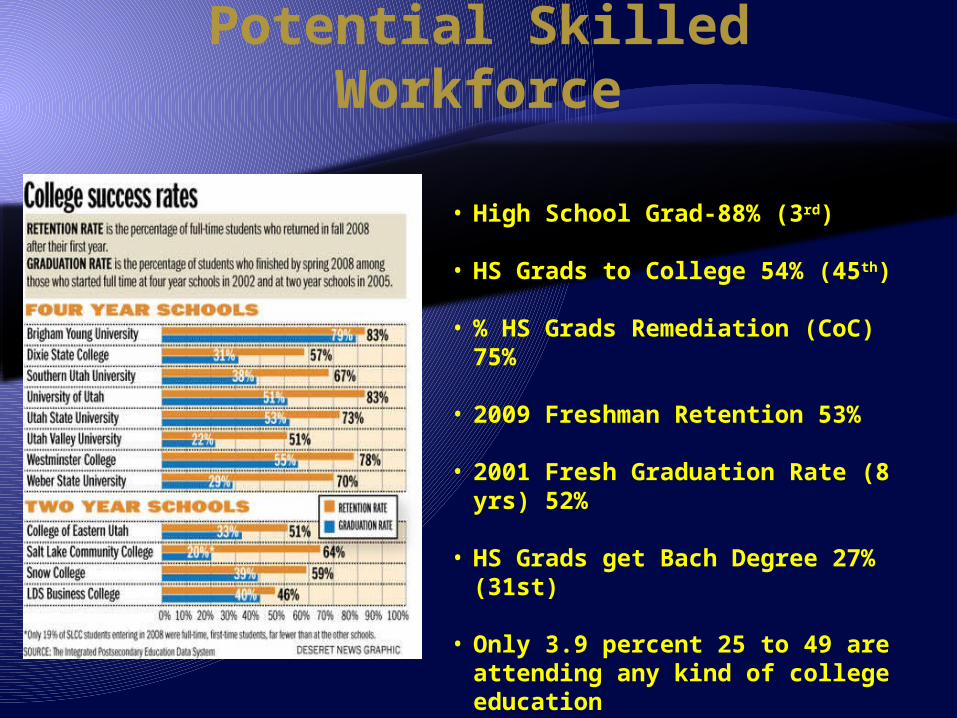
Potential Skilled Workforce
• High School Grad-88% (3rd)
• HS Grads to College 54% (45th) • % HS Grads Remediation (CoC) 75%
• 2009 Freshman Retention 53%
• 2001 Fresh Graduation Rate (8 yrs) 52%
• HS Grads get Bach Degree 27% (31st)
• Only 3.9 percent 25 to 49 are attending any kind of college education
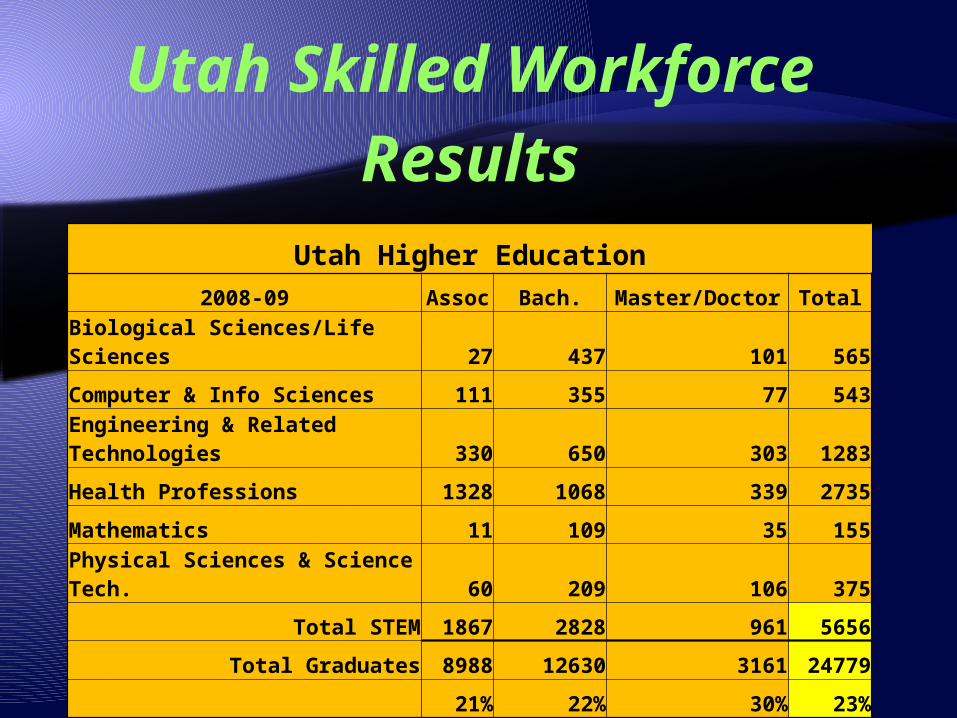
Utah Skilled WorkforceResultsUtah Higher Education
2008-09 Assoc Bach. Master/Doctor Total
Biological Sciences/Life Sciences 27 437 101 565
Computer & Info Sciences 111 355 77 543
Engineering & Related Technologies 330 650 303 1283
Health Professions 1328 1068 339 2735
Mathematics 11 109 35 155
Physical Sciences & Science Tech. 60 209 106 375
Total STEM 1867 2828 961 5656
Total Graduates 8988 12630 3161 24779
21% 22% 30% 23%
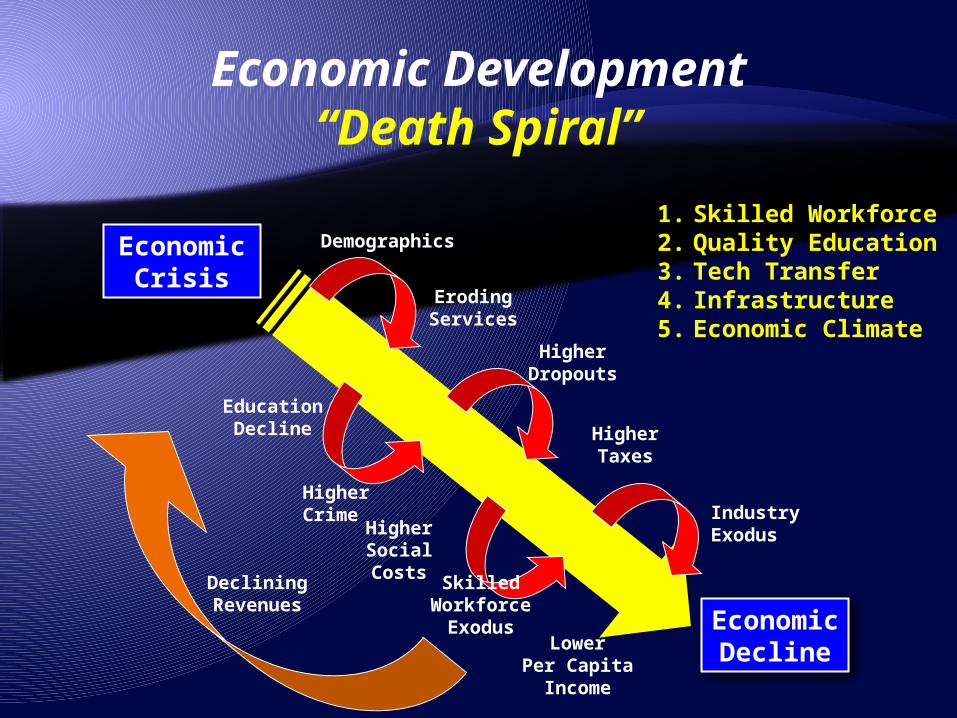
Economic
Crisis
IndustryExodus
ErodingServices
DecliningRevenues
LowerPer Capita
Income
SkilledWorkforce
Exodus
HigherDropouts
EducationDecline
HigherCrime
EconomicDecline
HigherTaxes
Economic Development“Death Spiral”
Demographics
Higher Social Costs
1. Skilled Workforce2. Quality Education3. Tech Transfer4. Infrastructure5. Economic Climate

Utah Economic Initiative
for Social and Economic Development
Solutions
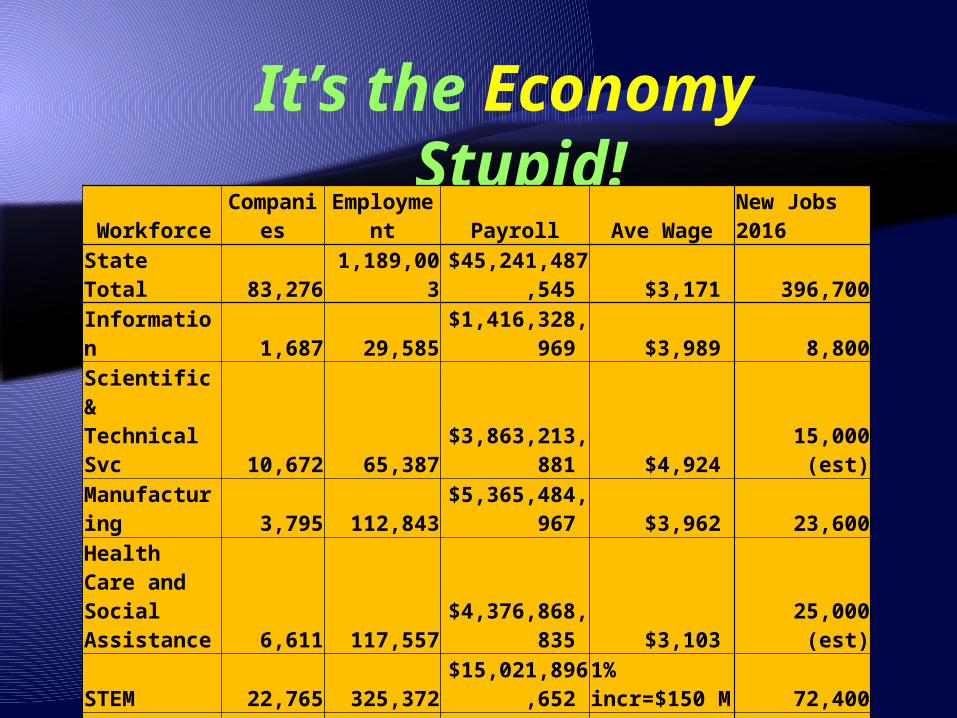
It’s the Economy Stupid!
Workforce Companies Employment Payroll Ave Wage New Jobs 2016
State Total 83,276 1,189,003 $45,241,487,545 $3,171 396,700
Information 1,687 29,585 $1,416,328,969 $3,989 8,800
Scientific & Technical Svc 10,672 65,387 $3,863,213,881 $4,924 15,000 (est)
Manufacturing 3,795 112,843 $5,365,484,967 $3,962 23,600Health Care and Social Assistance 6,611 117,557 $4,376,868,835 $3,103 25,000 (est)
STEM 22,765 325,372 $15,021,896,652 1% incr=$150 M 72,400
27% 27% 33%
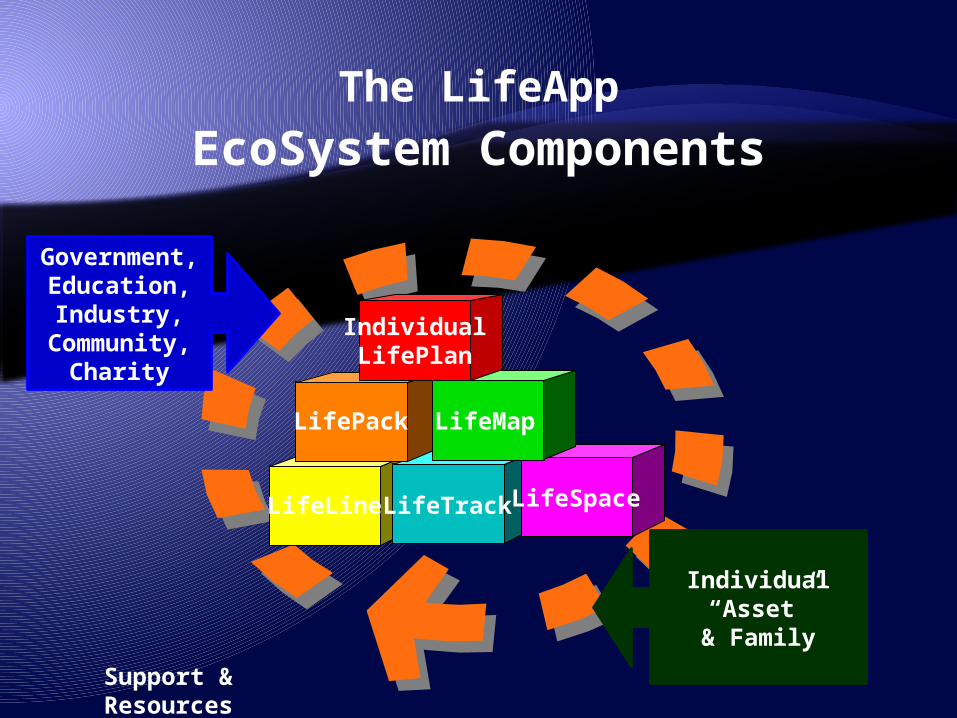
The LifeAppEcoSystem Components
IndividualLifePlan
LifeMap
LifeLine LifeTrackLifeSpace
LifePack
Support & Resources
Government,
Education,Industry,
Community,Charity
Individual “Asset”& Family
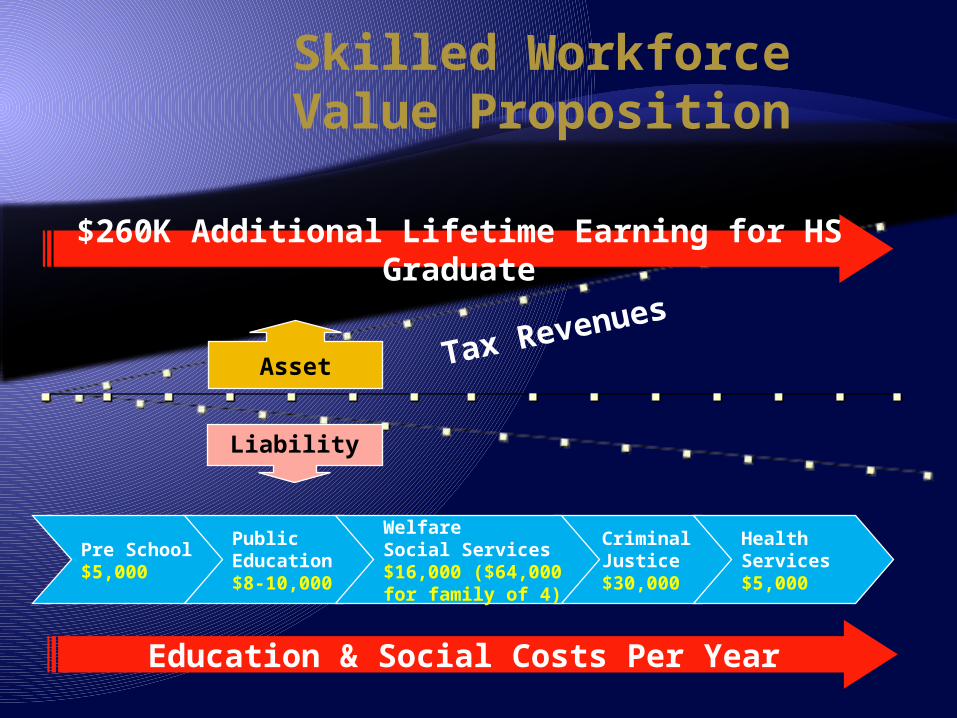
Skilled WorkforceValue Proposition
Pre School$5,000
PublicEducation$8-10,000
CriminalJustice$30,000
HealthServices$5,000
WelfareSocial Services$16,000 ($64,000for family of 4)
Liability
Asset Tax Revenues
$260K Additional Lifetime Earning for HS Graduate
Education & Social Costs Per Year
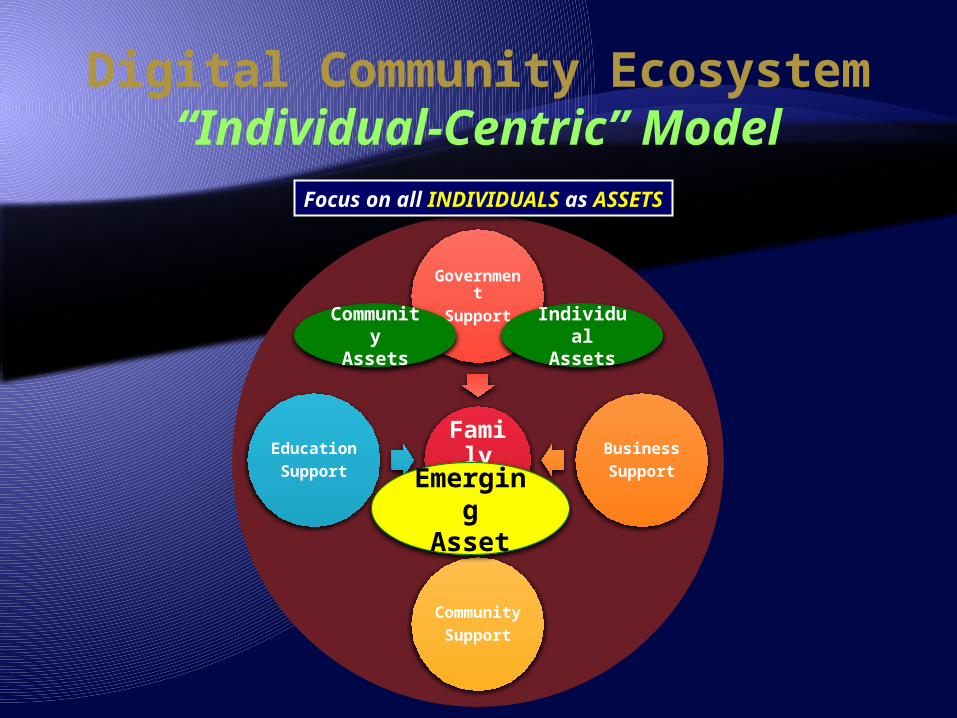
Digital Community Ecosystem“Individual-Centric” Model
Family
GovernmentSupport
BusinessSupport
CommunitySupport
EducationSupport
Focus on all INDIVIDUALS as ASSETS
Emerging
Asset
Community
Assets
Individual
Assets
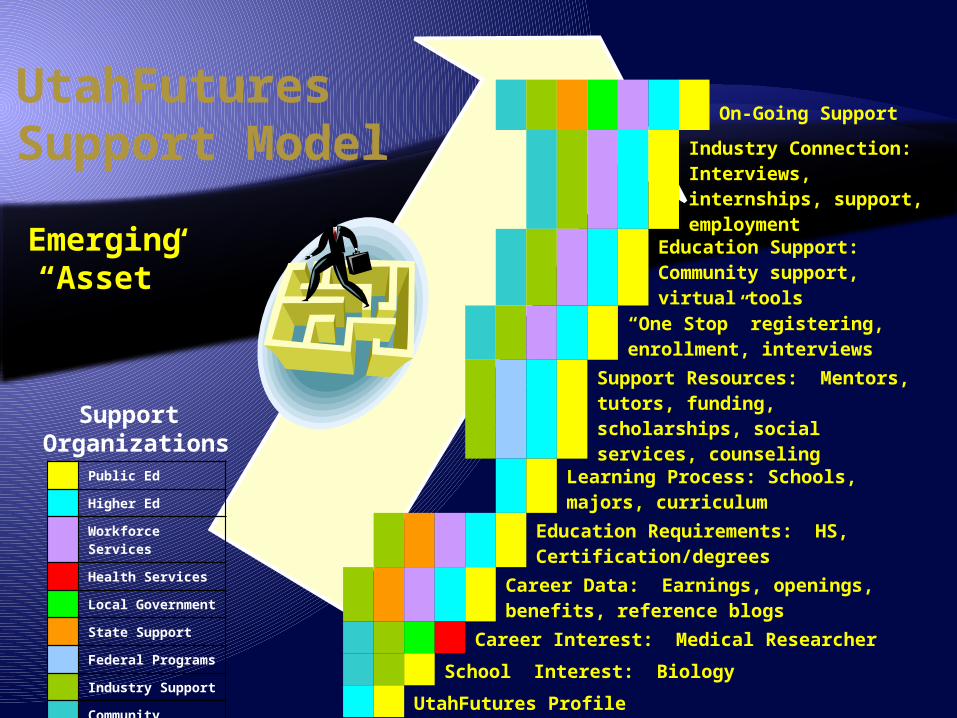
UtahFuturesSupport Model
Public Ed
Higher Ed
Workforce Services
Health Services
Local Government
State Support
Federal Programs
Industry Support
Community Support
Support Organizations
On-Going Support
Industry Connection: Interviews, internships, support, employment
Education Support: Community support, virtual tools
“One Stop” registering, enrollment, interviews
Support Resources: Mentors, tutors, funding, scholarships, social services, counseling
Learning Process: Schools, majors, curriculum
Education Requirements: HS, Certification/degrees
Career Data: Earnings, openings, benefits, reference blogs
Career Interest: Medical Researcher
School Interest: Biology
UtahFutures Profile
Emerging “Asset”
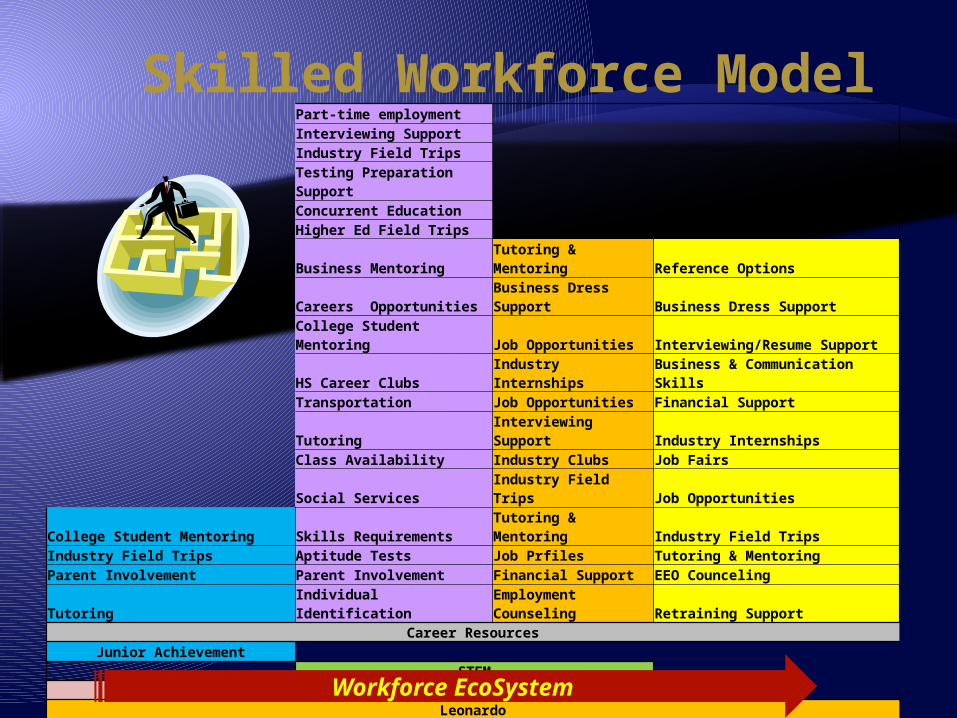
Skilled Workforce ModelPart-time employment Interviewing Support Industry Field Trips
Testing Preparation Support Concurrent Education Higher Ed Field Trips Business Mentoring Tutoring & Mentoring Reference Options
Careers OpportunitiesBusiness Dress Support Business Dress Support
College Student Mentoring Job Opportunities Interviewing/Resume Support
HS Career Clubs Industry Internships Business & Communication SkillsTransportation Job Opportunities Financial SupportTutoring Interviewing Support Industry InternshipsClass Availability Industry Clubs Job FairsSocial Services Industry Field Trips Job Opportunities
College Student Mentoring Skills Requirements Tutoring & Mentoring Industry Field TripsIndustry Field Trips Aptitude Tests Job Prfiles Tutoring & MentoringParent Involvement Parent Involvement Financial Support EEO Counceling
Tutoring Individual Identification Employment Counseling Retraining Support
Career ResourcesJunior Achievement
STEM MESA-80 Schools/3300 Students STEP
LeonardoIndustry "Virtual" Employment Resources
Career "Touch Points" Middle/Jr High High School Higher Education Life Career Support
144 Schools 187 High Schools/157K Students
Workforce EcoSystem
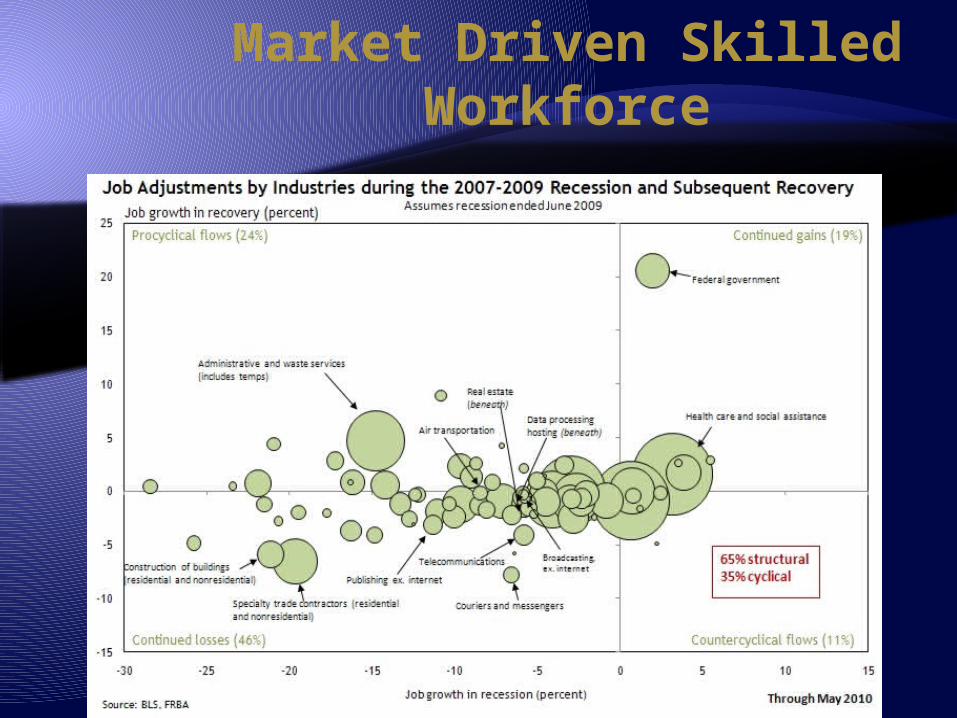
Market Driven Skilled Workforce
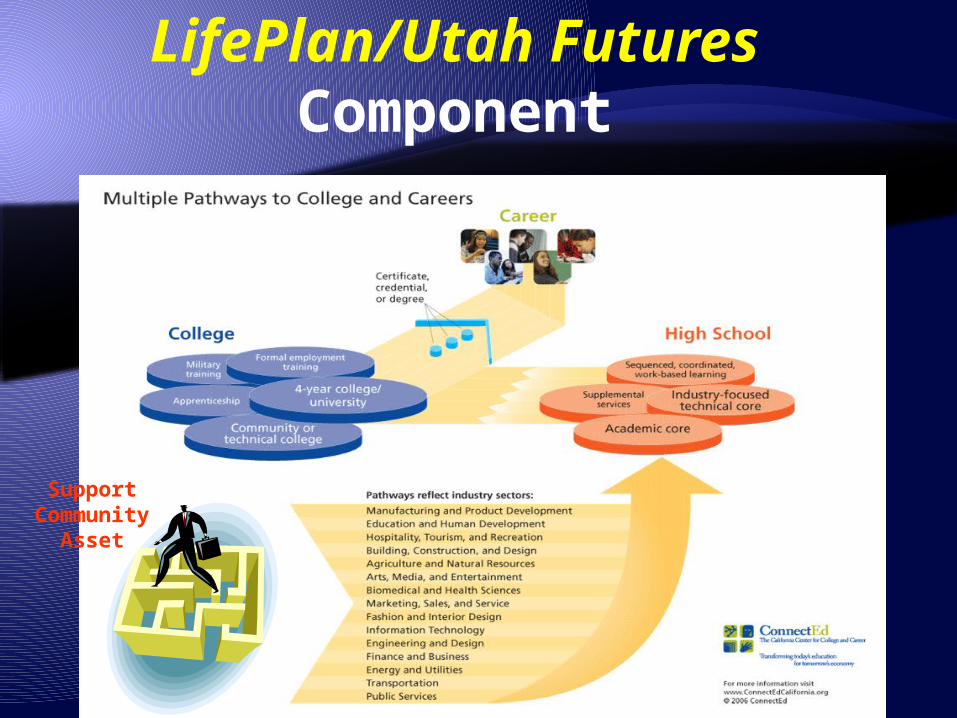
LifePlan/Utah FuturesComponent
SupportCommunity
Asset
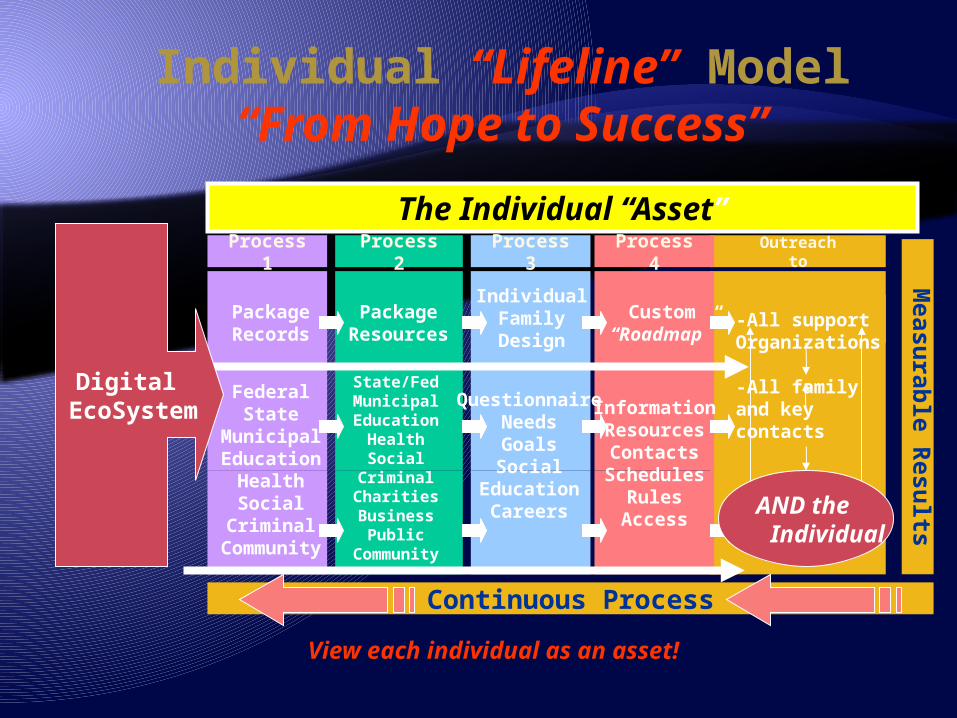
Outreach to
Process 1 Process 2 Process 3 Process 4
Continuous Process
Measu
rable R
esults
Individual “Lifeline” Model“From Hope to Success”
PackageRecords
Custom“Roadmap”
PackageResources
FederalState
MunicipalEducation
HealthSocial
CriminalCommunity
IndividualFamilyDesign
State/FedMunicipalEducation
HealthSocial
CriminalCharitiesBusiness
PublicCommunity
QuestionnaireNeedsGoalsSocial
EducationCareers
InformationResourcesContacts
SchedulesRules
Access
-All supportOrganizations
-All family and key contacts
The Individual “Asset”
AND the Individual
Digital EcoSystem
View each individual as an asset!
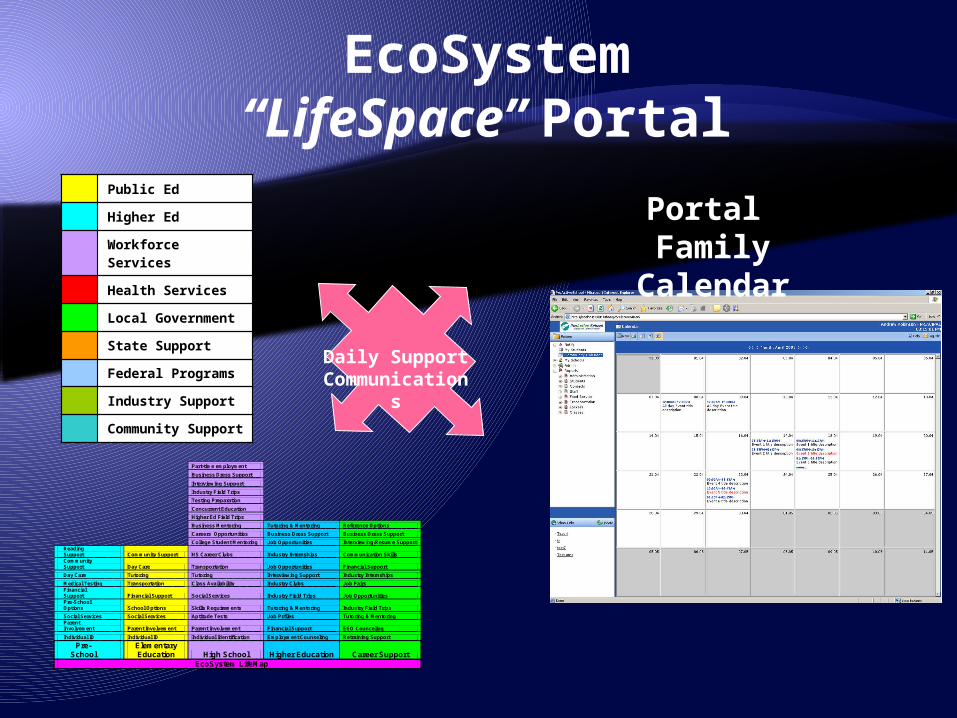
EcoSystem“LifeSpace” Portal
Part-time employment
Business Dress Support
Interviewing Support
Industry Field Trips
Testing Preparation
Concurrent Education
Higher Ed Field Trips
Business Mentoring Tutoring & Mentoring Reference Options
Careers Opportunities Business Dress Support Business Dress Support
College Student Mentoring Job Opportunities Interviewing/Resume Support Reading Support Community Support HS Career Clubs Industry Internships Communication Skills Community Support Day Care Transportation Job Opportunities Financial Support
Day Care Tutoring Tutoring Interviewing Support Industry Internships
Medical Testing Transportation Class Availability Industry Clubs Job Fairs Financial Support Financial Support Social Services Industry Field Trips Job Opportunities Pre-School Options School Options Skills Requirements Tutoring & Mentoring Industry Field Trips
Social Services Social Services Aptitude Tests Job Prfiles Tutoring & Mentoring Parent Involvement Parent Involvement Parent Involvement Financial Support EEO Counceling
Individual ID Individual ID Individual Identification Employment Counseling Retraining Support
Pre-School
Elementary Education High School Higher Education Career Support
EcoSystem LifeMap
Public Ed
Higher Ed
Workforce Services
Health Services
Local Government
State Support
Federal Programs
Industry Support
Community Support
Daily SupportCommunication
s
Portal Family Calendar
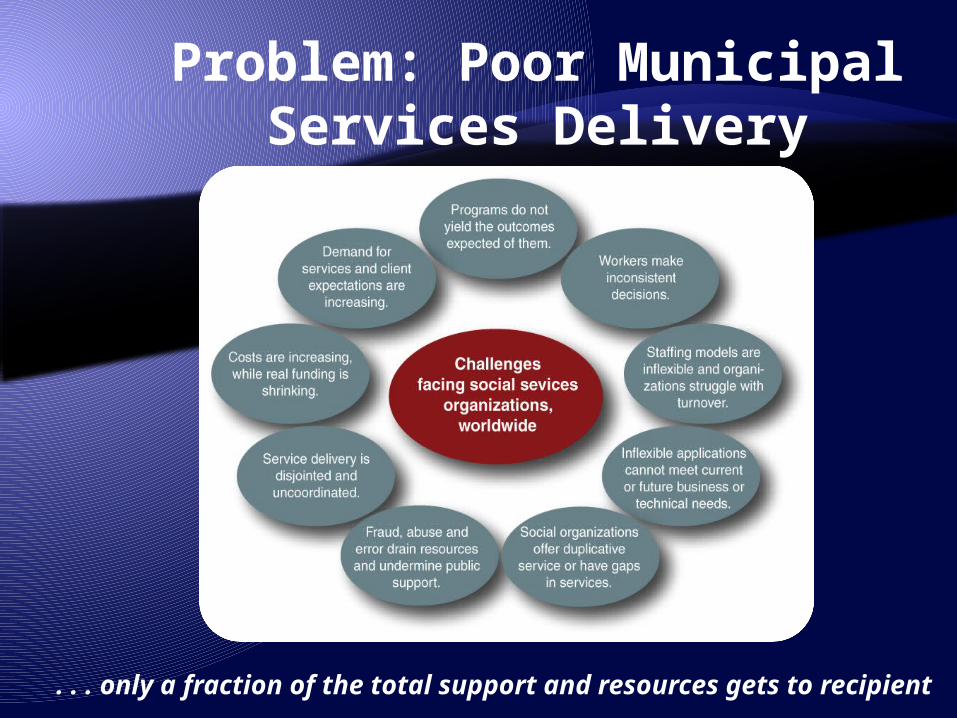
Problem: Poor Municipal Services Delivery
. . . only a fraction of the total support and resources gets to recipient
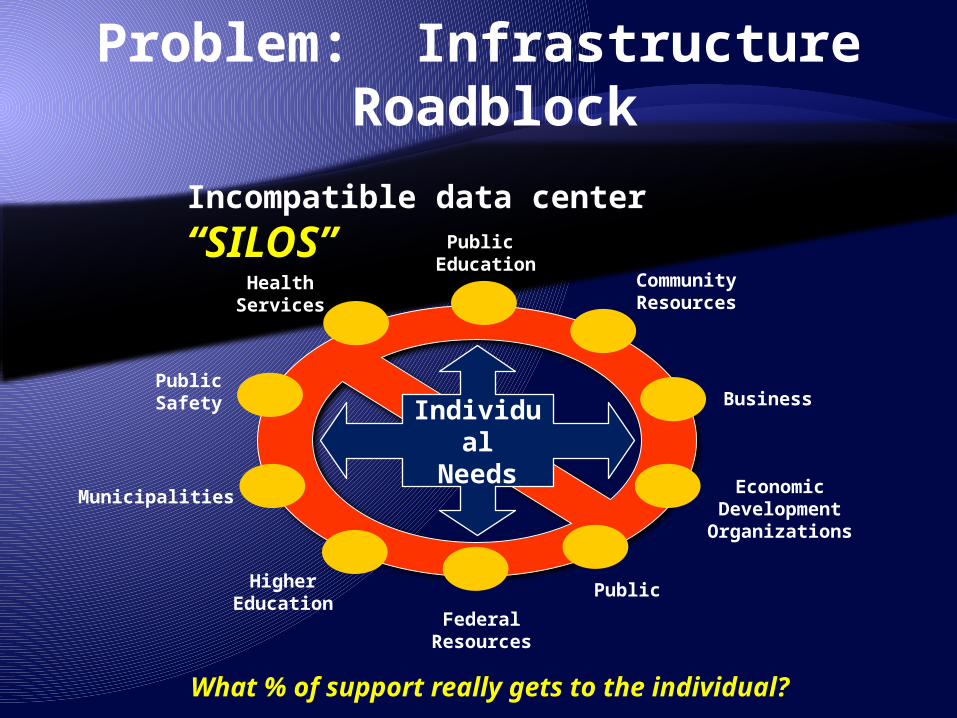
Problem: Infrastructure Roadblock
Public Education
EconomicDevelopmentOrganizations
CommunityResources
FederalResources
Business
HigherEducation
Municipalities
HealthServices
PublicSafety
Public
Incompatible data center “SILOS”
What % of support really gets to the individual?
Individual
Needs
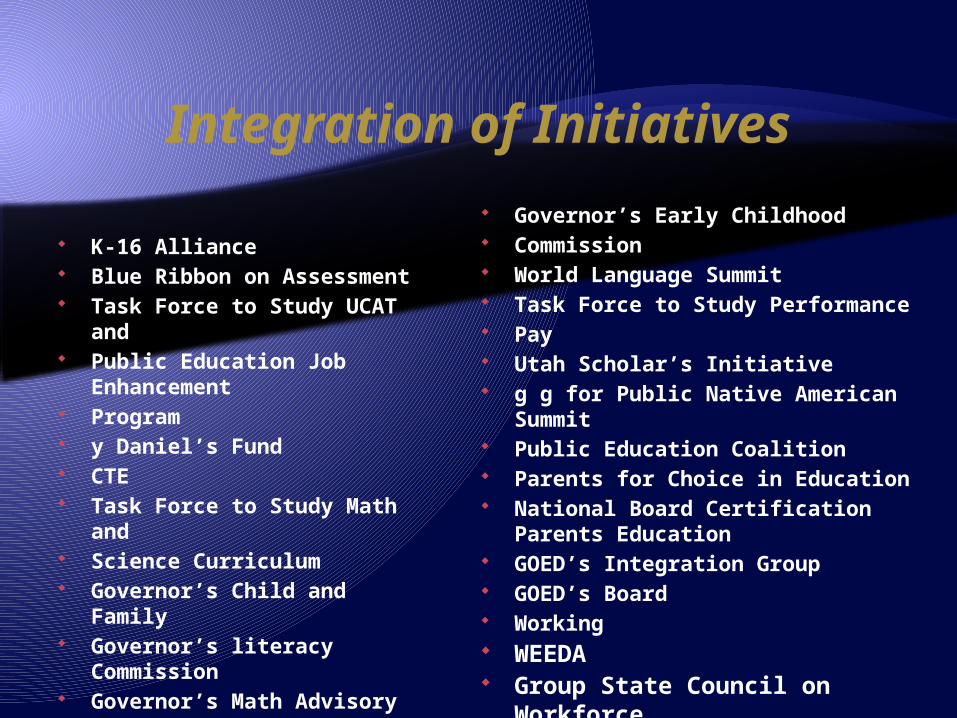
Integration of Initiatives
K-16 Alliance Blue Ribbon on
Assessment Task Force to Study UCAT
and Public Education Job
Enhancement Program y Daniel’s Fund CTE Task Force to Study Math
and Science Curriculum Governor’s Child and
Family Governor’s literacy
Commission Governor’s Math Advisory
Board y USTAR Cabinet Council
Governor’s Early Childhood Commission World Language Summit Task Force to Study Performance Pay Utah Scholar’s Initiative g g for Public Native American
Summit Public Education Coalition Parents for Choice in Education National Board Certification
Parents Education GOED’s Integration Group GOED’s Board Working WEEDA Group State Council on
Workforce
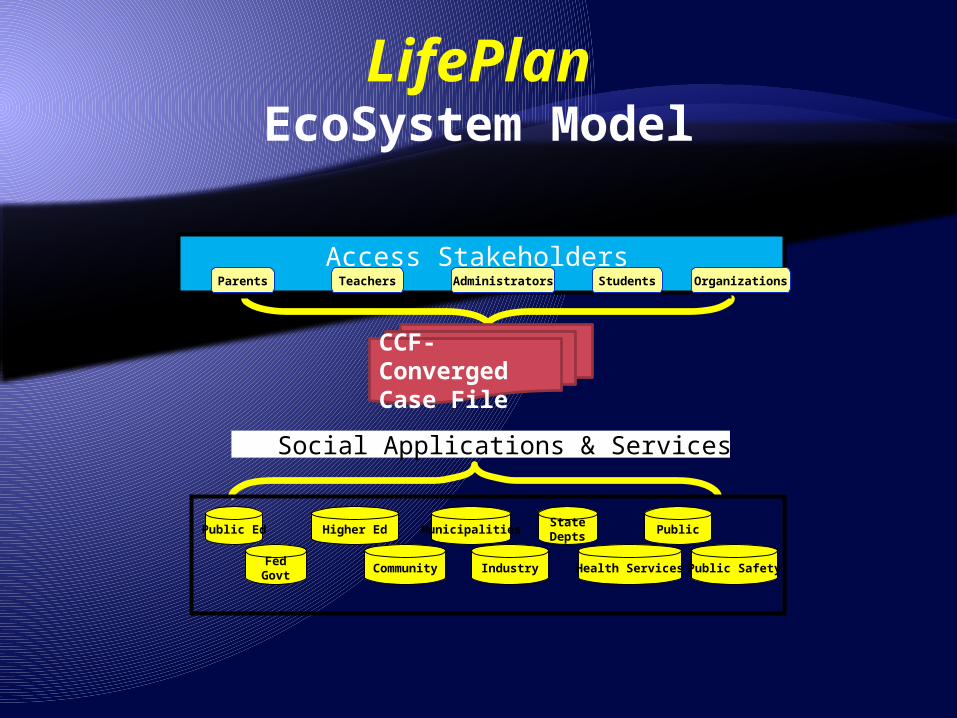
LifePlanEcoSystem Model
Social Applications & Services
Public Ed Higher Ed PublicStateDepts
Municipalities
FedGovt
Community Public SafetyHealth ServicesIndustry
Parents Teachers Administrators Students Organizations
Access Stakeholders
CCF-ConvergedCase File
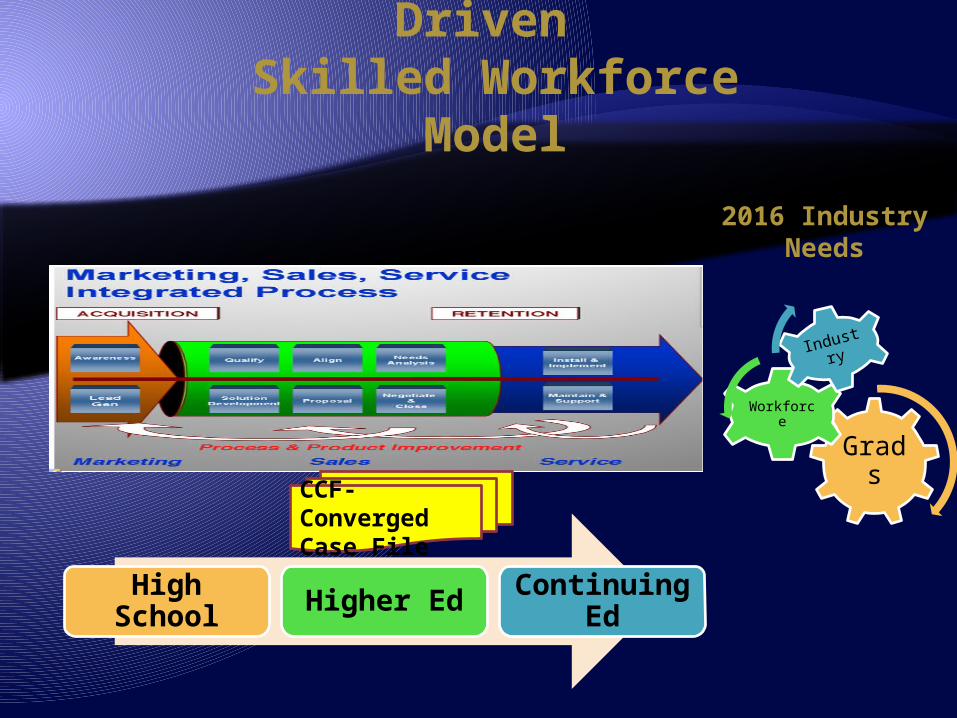
2016 IndustryNeeds
High School Higher Ed Continuing
Ed
Grads
Workforce
Industr
y
LifePlan “Needs Driven”Skilled Workforce Model
CCF-ConvergedCase File
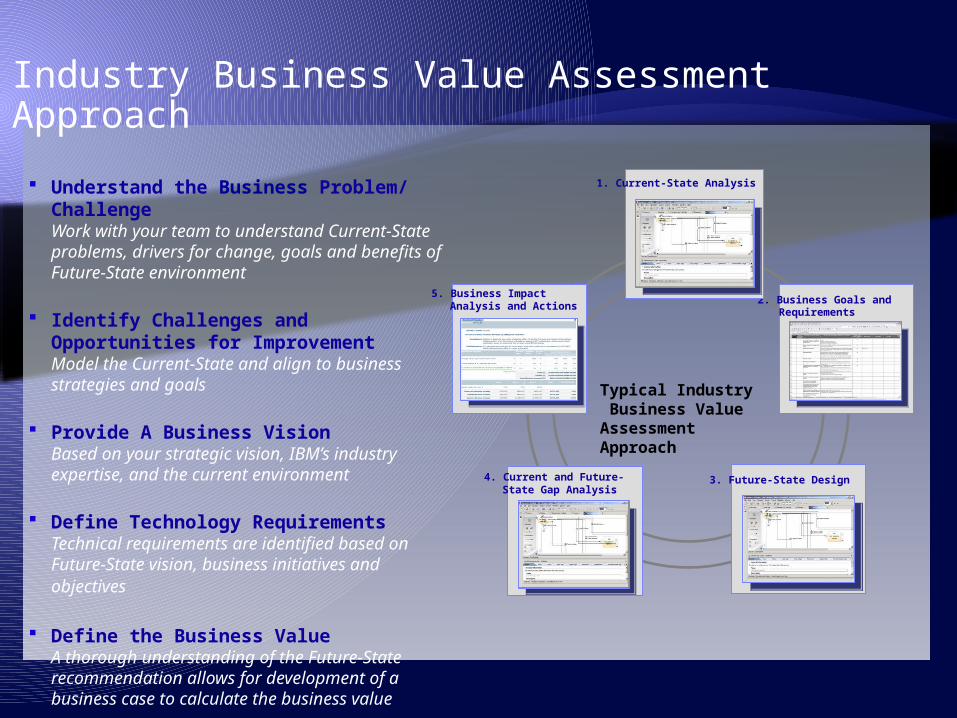
Industry Business Value Assessment Approach
Understand the Business Problem/ ChallengeWork with your team to understand Current-State problems, drivers for change, goals and benefits of Future-State environment
Identify Challenges and Opportunities for ImprovementModel the Current-State and align to business strategies and goals
Provide A Business VisionBased on your strategic vision, IBM’s industry expertise, and the current environment
Define Technology RequirementsTechnical requirements are identified based on Future-State vision, business initiatives and objectives
Define the Business ValueA thorough understanding of the Future-State recommendation allows for development of a business case to calculate the business value
--3. Future-State Design
2. Business Goals and Requirements
5. Business ImpactAnalysis and Actions
1. Current-State Analysis
4. Current and Future-State Gap Analysis
Typical Industry Business Value Assessment Approach
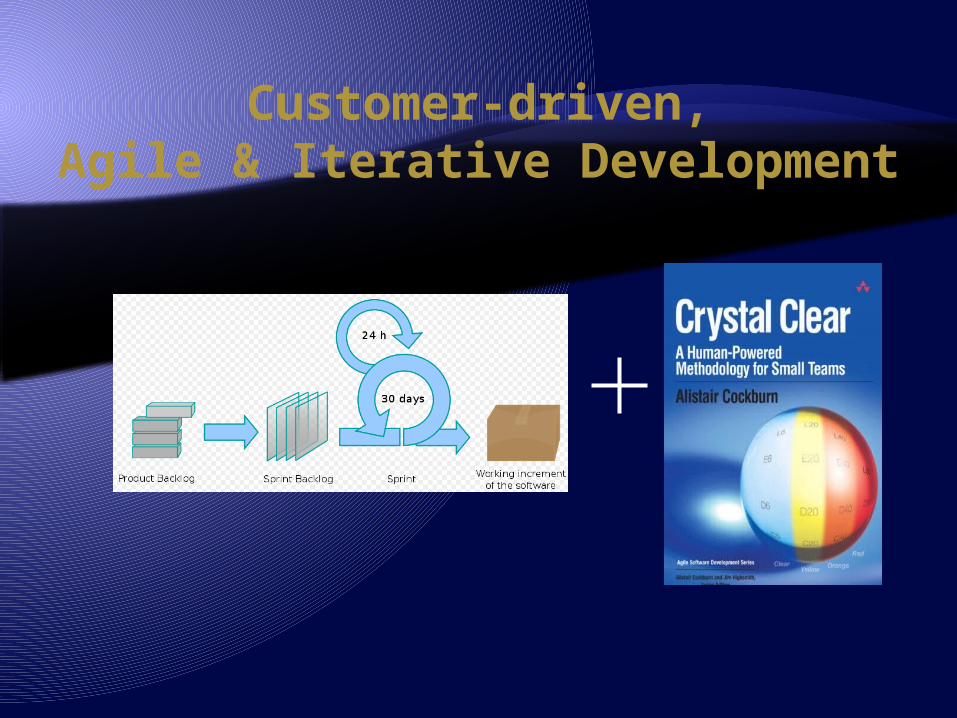
Customer-driven,Agile & Iterative Development
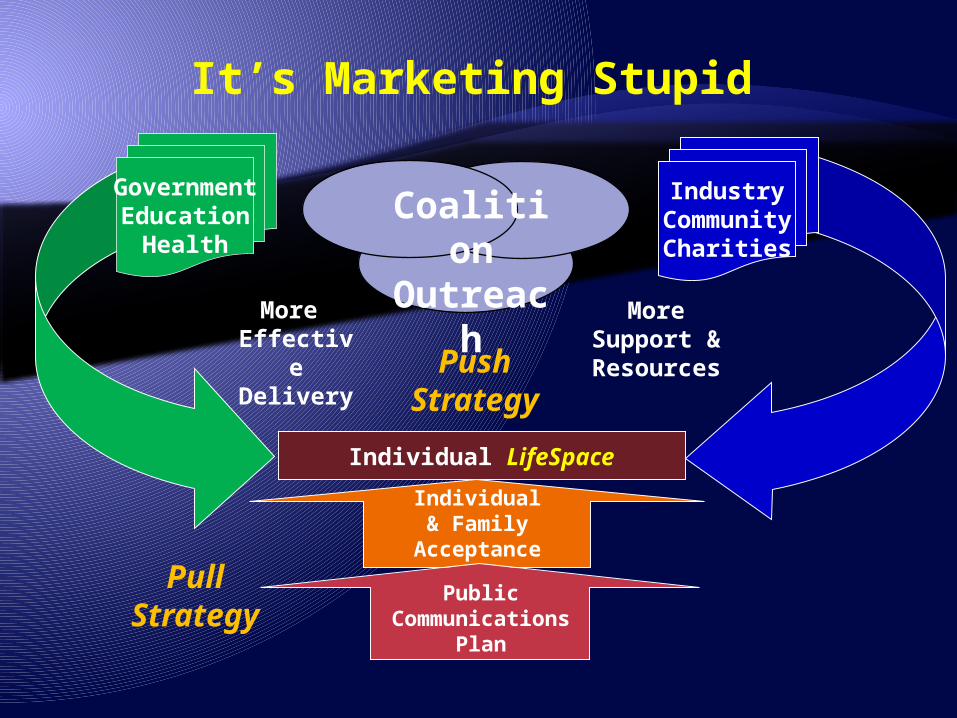
It’s Marketing Stupid
Individual LifeSpace
GovernmentEducation
Health
More EffectiveDelivery
MoreSupport
&Resource
s
PushStrategy
Individual& Family
Acceptance
PullStrategy
CoalitionOutreach
PublicCommunicatio
nsPlan
IndustryCommunityCharities
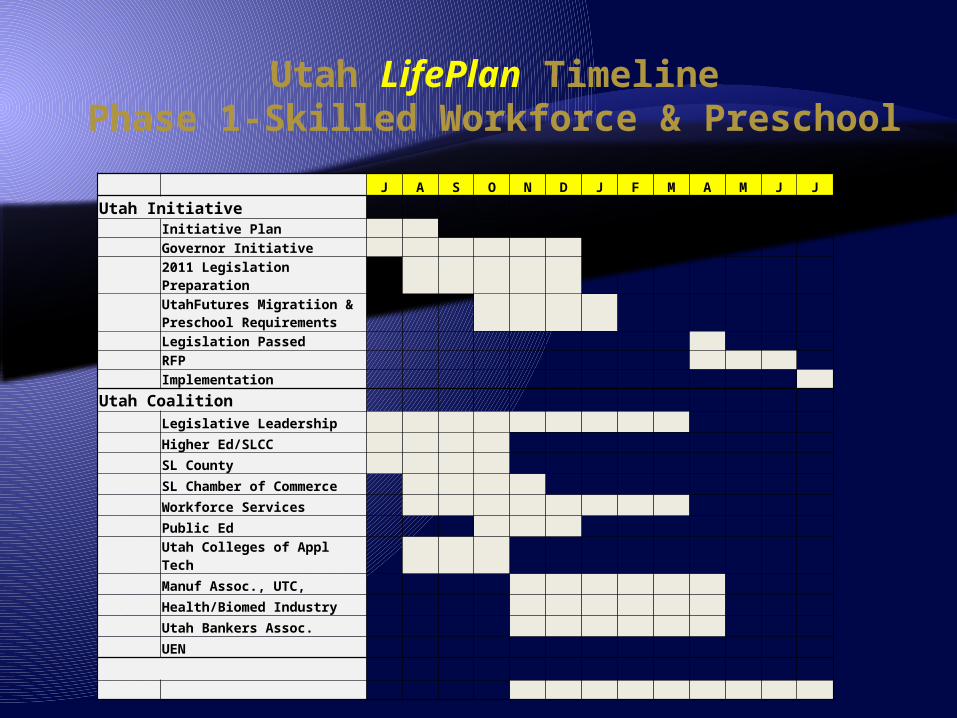
Utah LifePlan TimelinePhase 1-Skilled Workforce & Preschool
J A S O N D J F M A M J JUtah Initiative Initiative Plan Governor Initiative 2011 Legislation Preparation
UtahFutures Migratiion &
Preschool Requirements
Legislation Passed RFP Implementation
Utah Coalition
Legislative Leadership
Higher Ed/SLCC
SL County
SL Chamber of Commerce
Workforce Services
Public Ed
Utah Colleges of Appl Tech
Manuf Assoc., UTC,
Health/Biomed Industry
Utah Bankers Assoc.
UEN
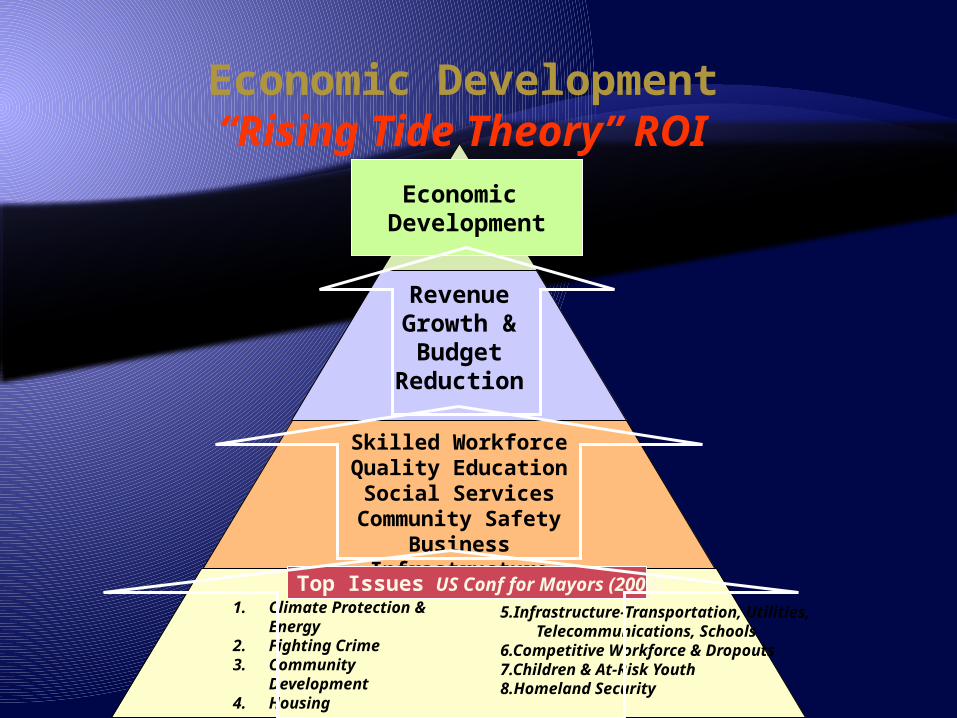
Economic Development“Rising Tide Theory” ROI
Revenue Growth & Budget
Reduction
Skilled WorkforceQuality Education
Social ServicesCommunity Safety
Business Infrastructure
Economic Development
1. Climate Protection & Energy
2. Fighting Crime3. Community
Development4. Housing
5.Infrastructure-Transportation, Utilities, Telecommunications, Schools
6.Competitive Workforce & Dropouts7.Children & At-Risk Youth8.Homeland Security
Top Issues US Conf for Mayors (2008)
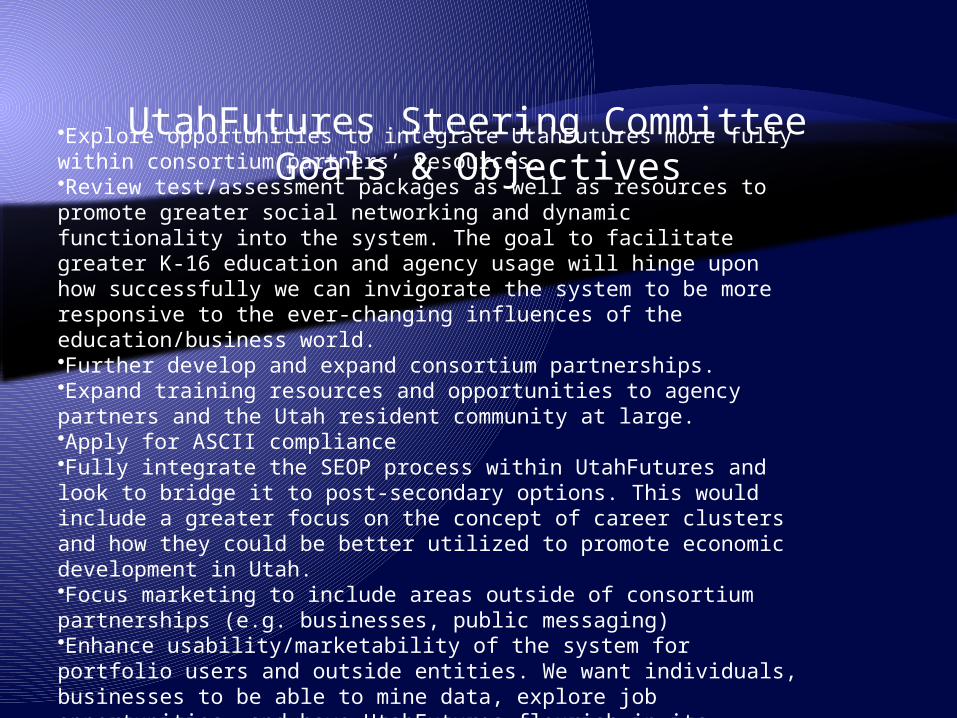
UtahFutures Steering Committee Goals & Objectives•Explore opportunities to integrate UtahFutures more fully within consortium
partners’ resources.•Review test/assessment packages as well as resources to promote greater social networking and dynamic functionality into the system. The goal to facilitate greater K-16 education and agency usage will hinge upon how successfully we can invigorate the system to be more responsive to the ever-changing influences of the education/business world.•Further develop and expand consortium partnerships.•Expand training resources and opportunities to agency partners and the Utah resident community at large.•Apply for ASCII compliance•Fully integrate the SEOP process within UtahFutures and look to bridge it to post-secondary options. This would include a greater focus on the concept of career clusters and how they could be better utilized to promote economic development in Utah.•Focus marketing to include areas outside of consortium partnerships (e.g. businesses, public messaging)•Enhance usability/marketability of the system for portfolio users and outside entities. We want individuals, businesses to be able to mine data, explore job opportunities, and have UtahFutures flourish in its capacity as a connection and recruitment tool.
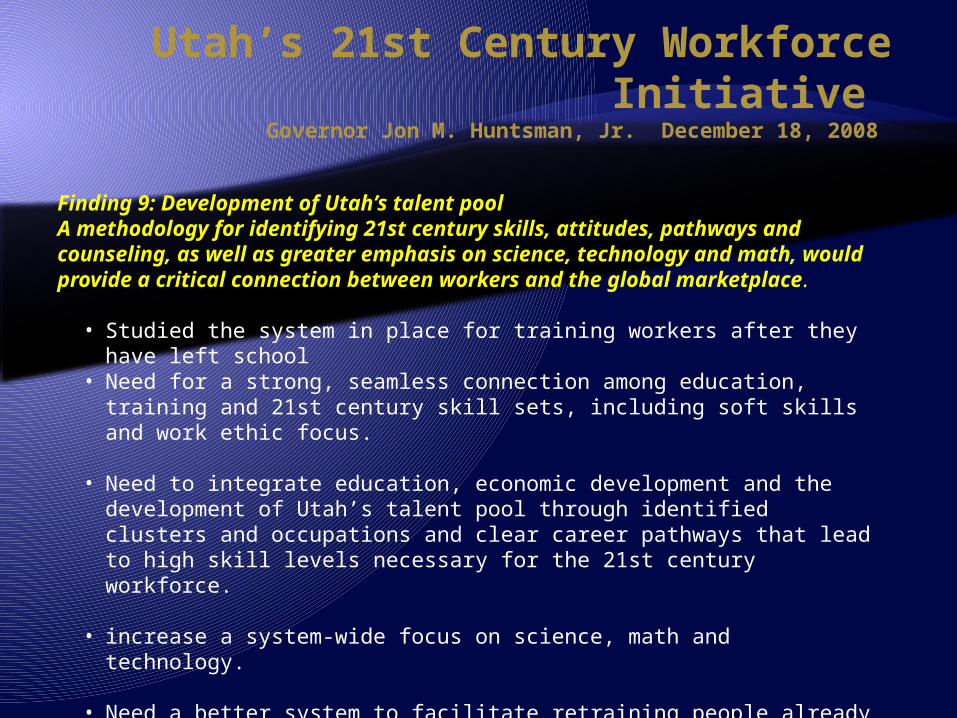
Finding 9: Development of Utah’s talent pool A methodology for identifying 21st century skills, attitudes, pathways and counseling, as well as greater emphasis on science, technology and math, would provide a critical connection between workers and the global marketplace.
• Studied the system in place for training workers after they have left school• Need for a strong, seamless connection among education, training and 21st
century skill sets, including soft skills and work ethic focus.
• Need to integrate education, economic development and the development of Utah’s talent pool through identified clusters and occupations and clear career pathways that lead to high skill levels necessary for the 21st century workforce.
• increase a system-wide focus on science, math and technology.
• Need a better system to facilitate retraining people already in the workforce with family and other responsibilities is needed.
Utah’s 21st Century Workforce Initiative
Governor Jon M. Huntsman, Jr. December 18, 2008
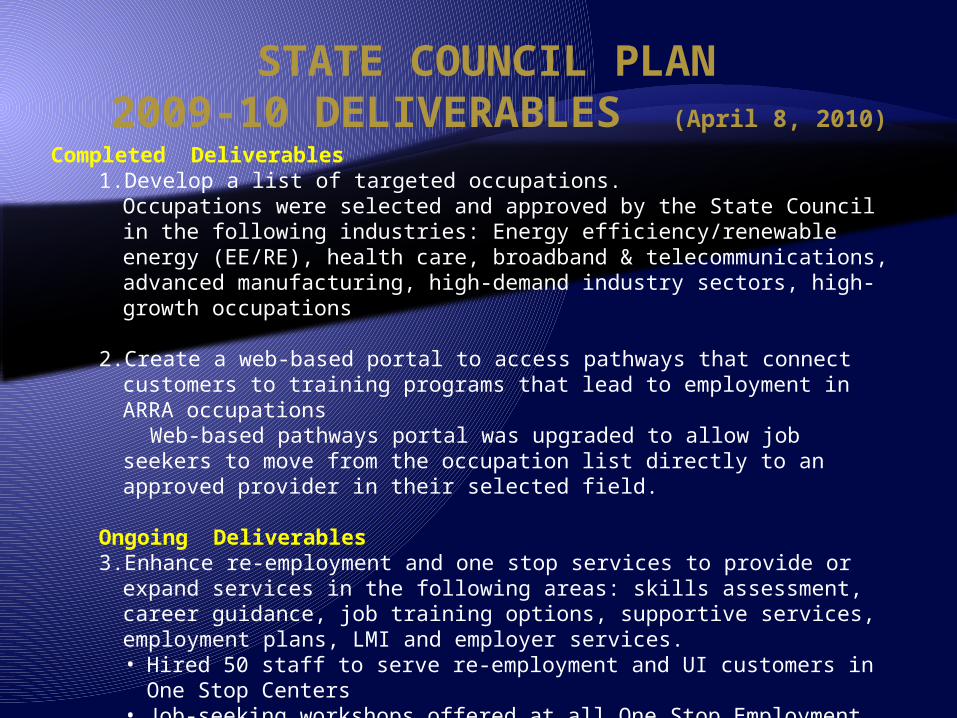
STATE COUNCIL PLAN 2009‐10 DELIVERABLES (April 8, 2010)
Completed Deliverables1. Develop a list of targeted occupations.
Occupations were selected and approved by the State Council in the following industries: Energy efficiency/renewable energy (EE/RE), health care, broadband & telecommunications, advanced manufacturing, high‐demand industry sectors, high‐growth occupations
2. Create a web‐based portal to access pathways that connect customers to training programs that lead to employment in ARRA occupations
Web‐based pathways portal was upgraded to allow job seekers to move from the occupation list directly to an approved provider in their selected field.
Ongoing Deliverables3. Enhance re‐employment and one stop services to provide or expand services in
the following areas: skills assessment, career guidance, job training options, supportive services, employment plans, LMI and employer services. • Hired 50 staff to serve re‐employment and UI customers in One Stop Centers • Job‐seeking workshops offered at all One Stop Employment Centers • ESkills presented to all Regional Councils – may be used to complete
curriculum reviews 4. Statewide use of WorkKeys for job skills assessment is being explored 5. May possibly renegotiate outcome measures due to change in economy
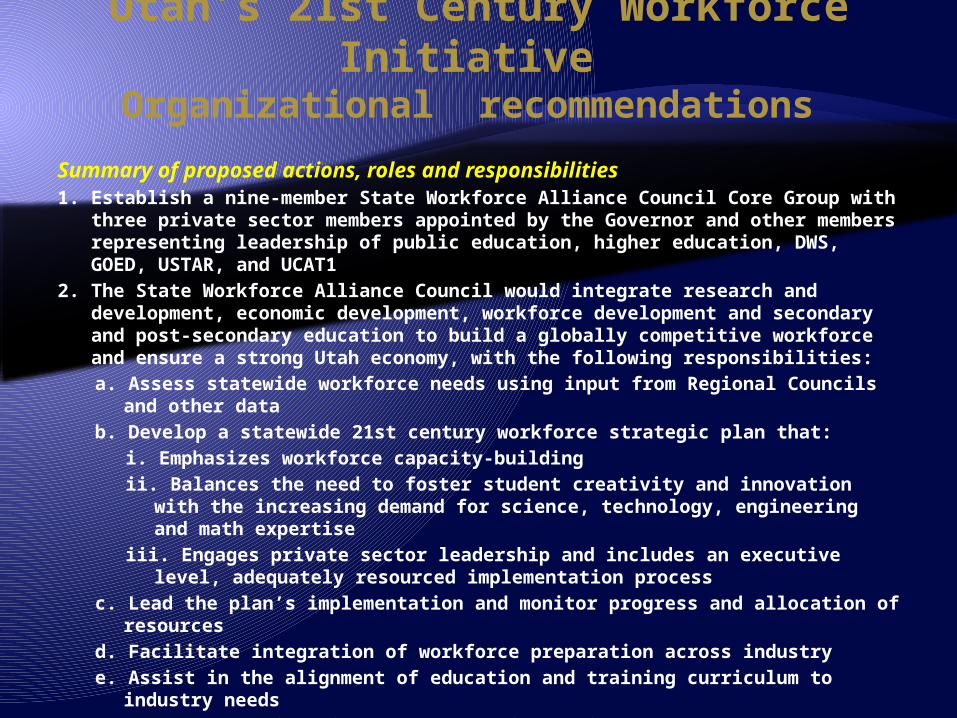
Summary of proposed actions, roles and responsibilities 1. Establish a nine-member State Workforce Alliance Council Core Group with
three private sector members appointed by the Governor and other members representing leadership of public education, higher education, DWS, GOED, USTAR, and UCAT1
2. The State Workforce Alliance Council would integrate research and development, economic development, workforce development and secondary and post-secondary education to build a globally competitive workforce and ensure a strong Utah economy, with the following responsibilities: a. Assess statewide workforce needs using input from Regional Councils
and other data b. Develop a statewide 21st century workforce strategic plan that:
i. Emphasizes workforce capacity-buildingii. Balances the need to foster student creativity and innovation with the
increasing demand for science, technology, engineering and math expertise
iii. Engages private sector leadership and includes an executive level, adequately resourced implementation process
c. Lead the plan’s implementation and monitor progress and allocation of resources
d. Facilitate integration of workforce preparation across industry e. Assist in the alignment of education and training curriculum to industry
needs f. Develop and disseminate collaborative regional competency models g. Approve regional workforce development plans and ensure statewide
coordination
Utah’s 21st Century Workforce Initiative
Organizational recommendations
Education Lower dropout rates Higher test scores Improved attendance, truancy, and suspensions Higher post high school education and graduation rates
Justice Lower crime rates Lower number of juvenile offenses and arrest
Financial Industry growth and company in-migration Job growth and lower unemployment rate Higher per capita income Higher total wages GPD accelerated growth Tax revenue growth
UtahFutures Initiative Benefits and ROI
Globally Competitive Workforce Steering Committee
Lane Beattie, president and chief executive officer of the Salt Lake Chamber
Pamela Atkinson, community advocate Scott Anderson, president and chief executive officer of Zions Bank Michael Young, president of the University of Utah Kim Campbell, president of the Utah Education Association Patti Harrington, superintendent in the Utah State Office of Education Rich Sadler, chairman of the State Board of Education Dinesh Patel, managing director of vSpring Capital Christine Kearl, education director in the Governor's Office Kristin Cox, director of the Utah Department of Workforce Services Gayle McKeachnie, rural and legislative affairs coordinator in the
Governor's Office Dave Buhler, commissioner of higher education Jim Judd, president of the AFL-CIO Sen. Lyle Hillyard, R-Logan Sen. Pat Jones, D-Holladay Rep. Phil Riesen, D-Salt Lake Rep. Greg Hughes, R-Draper
Finding 1: System governanceUtah’s workforce system needs to build the capacity of talent in our citizens. We need a workforce development governance structure to establish overall strategy and align statewide efforts toward this end.
• Multiple workforce development-related streams of effort without coordinated objectives, plans, priorities or accountabilities.
• The Department of Workforce Services, the Chambers of Commerce, local and state economic development entities, business and industry in general, Public Education, Higher Education, Career Technical Education, the Utah College of Applied Technology, community groups, professional associations and others represent various entities within these streams.
• Without a common organizing principle to achieve 21st century workforce development objectives, misalignment will continue. It became clear during the session that there are systemic challenges such as competition for funding, time and resource-consuming regulations and varying direction from disconnected governing bodies, and time and energy wasted in activities that duplicate or are inconsistent .
Utah’s 21st Century Workforce Initiative
Governor Jon M. Huntsman, Jr. December 18, 2008
Finding 2: System funding Budget and finance processes need to be changed and aligned across all workforce development activities. cross the system.
• As a result of not being aligned and without coordinated measures or processes, workforce funding can inadvertently hinder efforts it intends to finance. Many of our current funding processes for workforce development are complicated, constrained by a disconnected network of regulations, wasteful through duplication or inefficiency and make it difficult to require accountability.
• Existing funding requirements and regulations remove most local control or discretion over budget decisions and give power to those who do not have responsibilities and leaves those responsible without authority or power to accomplish expected results.
Utah’s 21st Century Workforce Initiative
Governor Jon M. Huntsman, Jr. December 18, 2008
Utah’s 21st Century Workforce Initiative
Governor Jon M. Huntsman, Jr. December 18, 2008
Finding 4: Educational leadership- There is a need for establishing a process for leadership training and continuous improvement, as well as research-based evaluation tools for monitoring leadership performance.
• Affirmed the decisive influence of principals, superintendents and other educational leaders on both teaching and student achievement.
• Utah currently has no coordinated process for training or measuring of educational leaders, and that uneven school leadership results in low teacher morale, uneven teacher performance and teacher attrition, underperforming students and poor public relations.
Utah’s 21st Century Workforce Initiative
Governor Jon M. Huntsman, Jr. December 18, 2008
Finding 7. Dropouts -The root causes of dropouts need to be identified and systematically addressed, from their inception through higher education.
• Examined data about students who start but do not finish school both in public education and post-high school state institutions. They also looked at what they came to describe as the Grand Canyon between high school and post high school enrollment.
• In that chasm we lose too many students who become underemployed, underpaid, and over-represented in the ranks of the unemployed, those on public assistance, in the judicial system, and whose children tend to perpetuate this cycle.
• With the demographic changes forecast for Utah and corresponding increases in disadvantaged students, this challenge will only intensify.
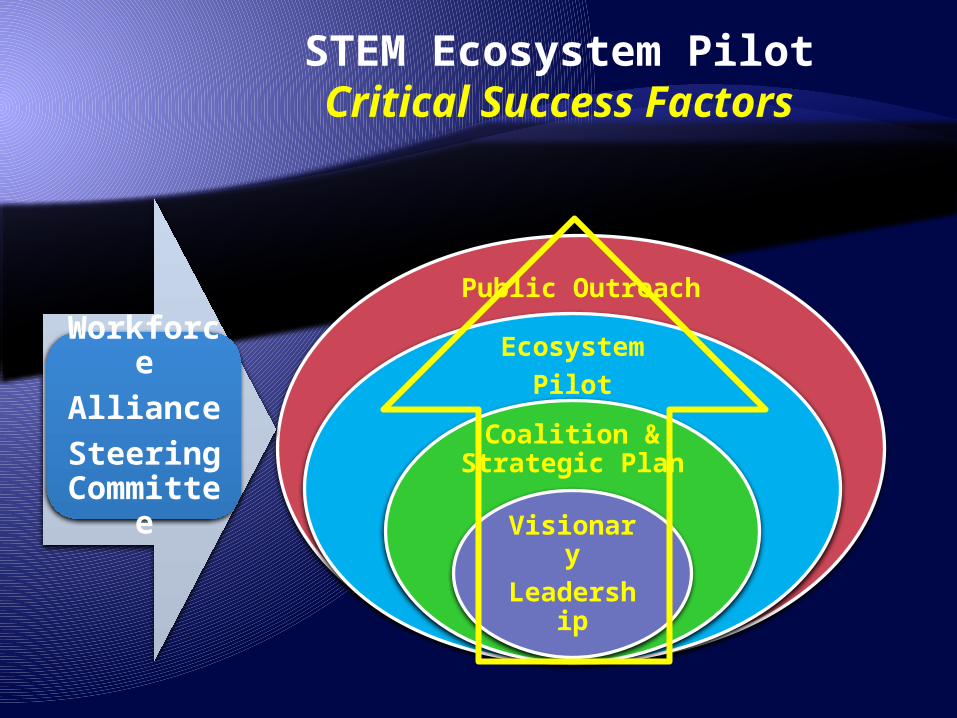
Public OutreachEcosyste
mPilotCoalition
& Strategic
PlanVisionar
yLeaders
hip
Workforce
AllianceSteering Committ
ee
STEM Ecosystem PilotCritical Success Factors
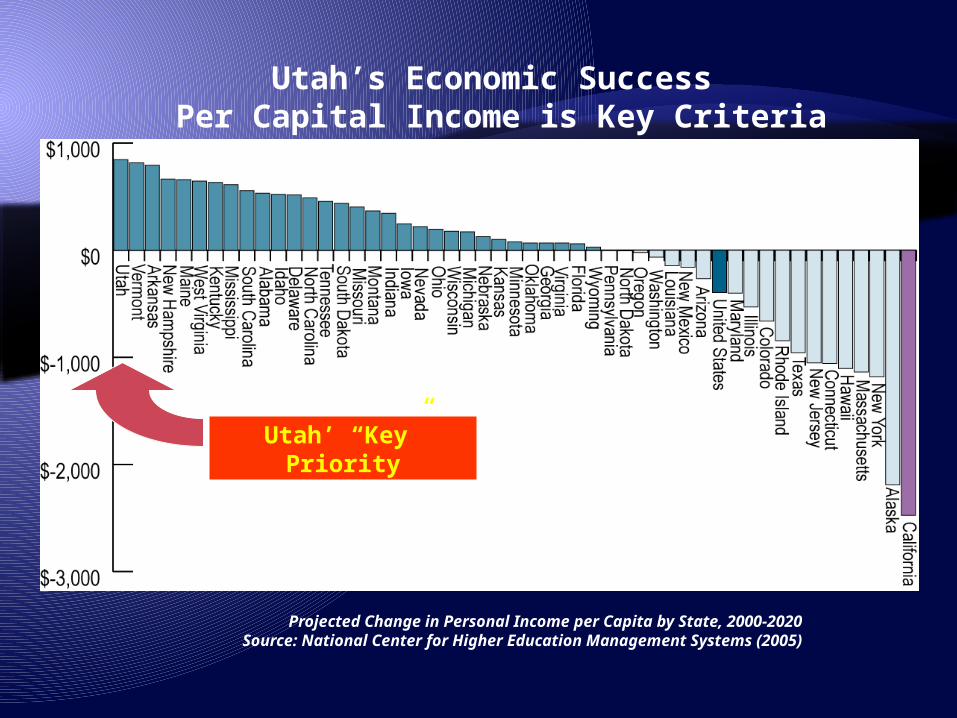
Utah’s Economic Success Per Capital Income is Key Criteria
Projected Change in Personal Income per Capita by State, 2000-2020Source: National Center for Higher Education Management Systems (2005)
Utah’ “Key” Priority