Embed Size (px)
Citation preview

by Stephanie E. Mills, Andrew Rupke, Michael D. Vanden Berg, and Taylor Boden
UTAH MINING 2018
CIRCULAR 126UTAH GEOLOGICAL SURVEY a division of UTAH DEPARTMENT OF NATURAL RESOURCES 2019
Metals, Industrial Minerals, Coal, Uranium, and Unconventional Fuels

Blank pages are intentional for printing purposes

Cover photo: Near Lakeside, Utah, view looking west along the Union Pacific railroad. Foreground: aggregate quarry in the Great Blue Limestone used by the Union Pacific railroad to maintain the Great Salt Lake railroad
causeway; in the distance, Compass Minerals potash evaporation ponds.
CIRCULAR 126UTAH GEOLOGICAL SURVEY a division of UTAH DEPARTMENT OF NATURAL RESOURCES 2019
by Stephanie E. Mills, Andrew Rupke, Michael D. Vanden Berg, and Taylor Boden
UTAH MINING 2018Metals, Industrial Minerals, Coal, Uranium, and Unconventional Fuels

STATE OF UTAHGary R. Herbert, Governor
DEPARTMENT OF NATURAL RESOURCESBrian C. Steed, Executive Director
UTAH GEOLOGICAL SURVEYR. William Keach II, Director
PUBLICATIONScontact
Natural Resources Map & Bookstore1594 W. North Temple
Salt Lake City, UT 84116telephone: 801-537-3320
toll-free: 1-888-UTAH MAPwebsite: utahmapstore.comemail: [email protected]
UTAH GEOLOGICAL SURVEYcontact
1594 W. North Temple, Suite 3110Salt Lake City, UT 84116telephone: 801-537-3300
website: https://geology.utah.gov
Although this product represents the work of professional scientists, the Utah Department of Natural Resources, Utah Geological Survey, makes no warranty, expressed or implied, regarding its suitability for a particular use. The Utah Department of Natural Resources, Utah Geological Survey, shall not be liable under any circumstances for any direct, indirect, special, incidental, or consequential damages with respect to claims by users of this product.

CONTENTS
2018 UTAH MINING INDUSTRY SUMMARY ......................................................................................................................... 1BASE AND PRECIOUS METALS .............................................................................................................................................. 4
Production and Values ........................................................................................................................................................... 4Copper .............................................................................................................................................................................. 6Gold .................................................................................................................................................................................. 9Magnesium ....................................................................................................................................................................... 9Molybdenum .................................................................................................................................................................... 9Beryllium .......................................................................................................................................................................... 9Silver .............................................................................................................................................................................. 10Vanadium ........................................................................................................................................................................ 10
Exploration and Development Activity ............................................................................................................................... 11Bingham District ............................................................................................................................................................ 11Fish Springs District ....................................................................................................................................................... 14Gold Springs District ...................................................................................................................................................... 14Goldstrike District .......................................................................................................................................................... 14Kings Canyon District .................................................................................................................................................... 15Lisbon Valley District ..................................................................................................................................................... 15San Francisco District .................................................................................................................................................... 15Star District .................................................................................................................................................................... 16Tintic Districts ................................................................................................................................................................ 16
INDUSTRIAL MINERALS ....................................................................................................................................................... 16Production and Values ......................................................................................................................................................... 16
Potash, Salt, and Magnesium Chloride ......................................................................................................................... 16Sand and Gravel, Crushed Stone, and Dimension Stone ............................................................................................... 18Portland Cement, Lime, and Limestone ......................................................................................................................... 18Phosphate ....................................................................................................................................................................... 19Gilsonite ......................................................................................................................................................................... 19Bentonite, Common Clay, and High-Alumina Clay ....................................................................................................... 19Expanded Shale .............................................................................................................................................................. 19Gypsum .......................................................................................................................................................................... 20
Exploration and Development Activity ............................................................................................................................... 20Potash ............................................................................................................................................................................. 20Lithium ........................................................................................................................................................................... 21Frac Sand ........................................................................................................................................................................ 21Phosphate ....................................................................................................................................................................... 21
URANIUM ................................................................................................................................................................................. 21COAL ......................................................................................................................................................................................... 23
Production and Demand ...................................................................................................................................................... 23Exploration and Development Activity ............................................................................................................................... 29
UtahAmerican Energy, Inc. – Murray Energy Corp. ..................................................................................................... 29Lila Canyon mines .................................................................................................................................................... 29
Canyon Fuel Company – Wolverine Fuels, LLC ........................................................................................................... 29Dugout Canyon mine ................................................................................................................................................ 29Skyline mine ............................................................................................................................................................. 30Sufco mine ................................................................................................................................................................ 30
Fossil Rock Resources – Wolverine Fuels, LLC ............................................................................................................ 30Cottonwood tract ....................................................................................................................................................... 30
Bronco Utah Operations, LLC ....................................................................................................................................... 30Emery mine. .............................................................................................................................................................. 30
Rhino Resource Partners, LP ......................................................................................................................................... 30Castle Valley mines ................................................................................................................................................... 30
Alton Coal Development ................................................................................................................................................ 30Coal Hollow mine ..................................................................................................................................................... 30
Coal Energy Group 3, LLC ............................................................................................................................................ 31Kinney #2 mine ......................................................................................................................................................... 31

UNCONVENTIONAL FUELS .................................................................................................................................................. 31Oil Shale ...................................................................................................................................................................................... 31
Exploration and Development Activities .............................................................................................................................. 31Oil Sand ...................................................................................................................................................................................... 32
Exploration and Development Activities .............................................................................................................................. 32ACKNOWLEDGMENTS .......................................................................................................................................................... 32REFERENCES ........................................................................................................................................................................... 32
TABLES
Table 1. Utah mining rankings and statistics ................................................................................................................................ 4Table 2. Select metal exploration and development projects in Utah, 2018 ............................................................................... 13Table 3. Select industrial mineral exploration and development projects in Utah, 2018 ........................................................... 20Table 4. Select uranium projects in Utah, 2018 .......................................................................................................................... 23Table 5. Coal production in Utah by coal mine, 2009–2019 ...................................................................................................... 26
FIGURES
Figure 1. Annual value of Utah energy and mineral production, 1960–2018 ............................................................................... 1Figure 2. Select base and precious metal, industrial mineral, and coal production locations in Utah. ......................................... 2Figure 3. Annual value of Utah mineral production, 2008–2018 ................................................................................................. 3Figure 4. Utah mining economic indicators .................................................................................................................................. 5Figure 5. Average annual mining employment and salaries in Utah, 2001–2018 ........................................................................ 6Figure 6. Production and value of select metals ........................................................................................................................... 7Figure 7. Select base and precious metal, industrial mineral, uranium, oil shale, and oil sand exploration and development
activity locations in Utah ............................................................................................................................................ 12Figure 8. Production and value of potash (all types) and salt ..................................................................................................... 17Figure 9. Utah aggregate production, 1950–2018 ...................................................................................................................... 18Figure 10. Uranium production and prices in Utah, 1910–2018 ................................................................................................ 22Figure 11. Utah annual coal production and value, 2000–2019 ................................................................................................. 24Figure 12. Location and status of Utah coal mines and associated facilities .............................................................................. 24Figure 13. Location of active Utah coal mines and coalfields .................................................................................................... 25Figure 14. Coal production in Utah by land ownership, 1980–2018. ......................................................................................... 27Figure 15. Distribution of Utah coal, 1970–2019 ....................................................................................................................... 28Figure 16. Distribution of Utah coal by end use, 1970–2018 ..................................................................................................... 28

1Utah Mining 2018
by Stephanie E. Mills, Andrew Rupke, Michael D. Vanden Berg, and Taylor Boden
UTAH MINING 2018Metals, Industrial Minerals, Coal, Uranium, and Unconventional Fuels
2018 UTAH MINING INDUSTRY SUMMARY
The estimated combined value of Utah’s extractive resource production in 2018 totaled $6.8 billion, including crude oil and natural gas production as well as all mining activities (figure 1). Utah’s diverse mining industry accounted for $3.7 billion (55%) of total extractive resource production, an in-crease of $464 million (14%) from 2017, but down 29% from peak values reached in 2011 ($5.3 billion). Mining activities in Utah currently produce base metals, precious metals, in-dustrial minerals, and coal (figure 2). Base metal production contributed $1.8 billion and includes copper, magnesium, be-ryllium, and molybdenum, of which copper accounts for 78% ($1.4 billion) (figure 3). Precious metals produced in Utah include gold and silver, and 2018 production was valued at $289 million (figure 3). Both base and precious metal values increased from 2017 to 2018, up 32% and 10%, respectively. Utah also produced several industrial mineral commodities including sand and gravel, crushed stone, salt, potash, cement, lime, phosphate, gilsonite, clay, gypsum, and others (figure 2). The estimated value of industrial mineral production in
2018 was $1.2 billion, a 4% increase over the revised 2017 estimate (figure 3). The most valuable industrial mineral group in 2018, estimated at $433 million, was the brine- and evaporite-derived commodities of potash, salt, and magne-sium chloride. In contrast to other minable commodities, the value of Utah coal production again decreased in 2018 to $454 million, down from $493 million in 2017 (figure 3). Historically, Utah has been a significant producer of iron, uranium, and vanadium, but production of these commodi-ties has been suspended due to low prices or exhausted re-serves. Energy Fuels Resources continues to operate its White Mesa uranium mill in San Juan County by process-ing alternative feeds of ore from uranium mining operations outside of Utah, having made the decision to conserve their own uranium resource until the market improves. Notably, Utah remains the only state to produce magnesium metal, beryllium concentrate, potassium sulfate, and gilsonite; of these mineral commodities, magnesium, beryllium, and pot-ash (includes potassium sulfate) are included on the U.S. Department of the Interior’s 2018 list of critical minerals (Fortier and others, 2018).
$0
$2000
$4000
$6000
$8000
$10,000
$12,000
1960 1965 1970 1975 1980 1985 1990 1995 2000 2005 2010 2015
Min
eral
Pro
duct
ion
Val
ue (m
illio
n 20
18$)
Metals and industrial minerals Natural gas Crude oil Coal Uranium
Source: Utah Geological Survey; U.S. Geological Survey; Utah Division of Oil, Gas and Mining; U.S. Energy Information Administration; Utah Tax Commission
Figure 1. Annual value of Utah energy and mineral production, inflation adjusted to 2018 dollars, 1960–2018.

Utah Geological Survey2
_̂
_̂
_̂
_̂
_̂
_̂
!(
!(
!(
!(
!(
")
")
")
")
")
")
")
")
")")
")
")
")")
United States Gypsum
Lila Canyon
Dugout CanyonSkyline
Redmond(salt, bentonite)
Western Clay(bentonite)
Morton(salt)
Cargill(salt)
Utelite(expanded shale)
Simplot(phosphate)
Graymont(lime)
Intrepid Moab(potassium chloride, salt)
Intrepid Wendover(potassium chloride, salt,magnesium chloride)
Holcim Devils Slide(cement)
Ash Grove Leamington(cement)
American Gilsonite
Compass Minerals(potassium sulfate, salt,
magnesium chloride)
Spor Mountain(beryllium)
Bingham(copper, gold,
molybdenum, silver)
US Magnesium
Lisbon Valley(copper)
TOOELE
SAN JUAN
MILLARD
KANE
JUAB
IRON
EMERY
UINTAH
BOX ELDER
GARFIELD
GRAND
UTAH
WAYNEBEAVER
DUCHESNE
SEVIER
SUMMIT
RICH
WASHINGTON
CARBON
SANPETE
CACHE
PIUTE
WASATCH
DAVIS
WEBER
SALT LAKE
DAGGETT
MORGAN
Moab
Provo
Vernal
St. George
Salt Lake City
Figure 2. Select base and precious metal, industrial mineral, and coal production locations in Utah.
Ü0 50 10025
Miles
0 50 100 15025Kilometers
§̈¦15
§̈¦70
§̈¦80
§̈¦80
§̈¦84
§̈¦15
#*
#*#*
#*
#*#*
#*
EmerySufco
Castle Valley #3 and #4
Coal Hollow
Rocky Range(copper)
_̂ City
Base and/or precious metal mine!(
Industrial mineral mine or facility")
#* Coal mine
§̈¦15
Delta
Figure 2. Select base and precious metal, industrial mineral, and coal production locations in Utah.

3Utah Mining 2018
For 2018 and the second consecutive year, the U.S. Geological Survey (USGS) ranked Utah as 8th nationally for production of nonfuel minerals, which includes metals and industrial minerals (table 1). The USGS estimated Utah’s nonfuel mineral produc-tion value at $2.9 billion (compared to the Utah Geological Sur-vey estimate of $3.3 billion), which accounts for 3.6% of the U.S. total; the principal commodities contributing to the overall value in Utah are portland cement, copper, magnesium metal, salt, and sand and gravel for construction (USGS, 2019a). The overall value of nonfuel production in the United States was estimated at over $80 billion, two-thirds of that value coming from indus-trial minerals and the remaining one-third coming from metals production. Utah has ranked among the top ten states for nonfuel mineral production for the past decade. In addition, Utah ranked as the 12th largest coal producer out of 23 coal-producing states and accounted for 1.8% of total U.S. coal production (U.S. En-ergy Information Association [EIA], 2019a).
In the 2018 Fraser Institute annual survey of mining compa-nies, Utah was ranked as the 7th most favorable state/nation out of 83 international jurisdictions (92nd percentile) in terms of overall investment attractiveness with regard to mining (ta-ble 1) (Stedman and Green, 2019). This ranking makes Utah the second most favorable jurisdiction in the contiguous U.S. and represents an eight spot increase over 2017. The invest-ment attractiveness index is a combination of a region’s geo-logic favorability along with favorable government policies toward exploration and development.
The minerals regulatory program within the Utah Division of Oil, Gas and Mining (DOGM) approved 1 large mine permit (crushed stone), 13 small mine permits, and 6 exploration per-mits in 2018 (table 1). The small mine permits included nine for riprap, stone, and similar materials, and one each for pre-cious metals, gemstones, salt, and humic shale. Two potash
$0
$500
$1000
$1500
$2000
$2500
$3000
Mill
ion
$
Base Metals
Mill
ion
$
$0
$200
$400
$600
$800
$1000
$1200
$1400
2008 2009 2010 2011 2012 2013 2014 2015 2016 2017 2018
Industrial Minerals
$0
$200
$400
$600
$800
2008 2009 2010 2011 2012 2013 2014 2015 2016 2017 2018
Mill
ion
$
Precious Metals
$0
$200
$400
$600
$800
2008 2009 2010 2011 2012 2013 2014 2015 2016 2017 2018
Mill
ion
$
Coal
$2900
$2142
$2710 $2703
$2177$2291 $2275
$1084$1218
$1354
$1786
$390
$635 $651
$712
$403$368
$393
$182$226
$261$289
$641
$709
$566
$678
$599 $602$638
$509 $493$454
$1053
$949
$808
$1157
$1280$1249
$1392
$1151 $1156$1201
$1302
$501
2008 2009 2010 2011 2012 2013 2014 2015 2016 2017 2018
Figure 3. Annual value of Utah mineral production, 2008–2018.

Utah Geological Survey4
exploration permits were approved, and one each for metals, pozzolan, oil shale, and humic shale (Paul Baker, DOGM, written communication, April 2019).
The Utah School and Institutional Trust Lands Administra-tion (SITLA), which manages about 4.4 million acres of state-owned lands in Utah, issued new mineral leases on 36 mineral tracts in 2018, down 37% from 2017 (table 1). These leases were issued for the following commodities: metallifer-ous minerals (11), sand and gravel (11), gemstone/fossil (4), building stone (2), coal (2), oil shale (2), volcanic materi-als (2), limestone (1), and humic shale (1) (Jerry Mansfield, SITLA, written communication, April 2019).
For the third consecutive year, over 5000 new unpatented mining claims were filed on federal lands in Utah. In 2016 and 2017 new claims were primarily focused on lithium, but in 2018 claims were more broadly targeted at base met-als, vanadium, lithium, and others. In 2018, the most active counties were Grand (lithium, vanadium), Beaver (copper/base metals), San Juan (vanadium), Kane (frac sand), Juab (base metals), and Tooele (base metals), each recording over 450 newly filed claims. At the end of 2018, the U.S. Bureau of Land Management (BLM) reported a total of 22,976 ac-tive unpatented mining claims in Utah, up 5% from 2017 (table 1) (Opie Abeyta, Utah BLM, written communication, April 2019).
Contributions by the Utah mining industry to the state tax base is significant (figure 4). The metal, industrial mineral (non-metal), sand and gravel, and coal mining industries paid over
$66 million in property taxes during 2017 (down 9% from 2016; 2018 numbers not yet available) and over $10 million in mining-related severance taxes (up 11% from 2017). All extractive industries, including oil and gas, paid nearly $78 million in federal mineral lease disbursements. Only about 0.8% of Utah’s gross domestic product came from the min-ing industry in 2017, 1.4% if oil and gas are included (2018 numbers are not yet available). Long-term mining employ-ment tends to mirror commodity price swings, but in contrast, average mining salaries have steadily increased over the same time frame (figure 5). Both employment and wages showed significant increases in 2018, at 17% and 5% respectively.
BASE AND PRECIOUS METALS
Production and Values
Utah’s base metal production value totaled $1.8 billion in 2018, 32% higher than 2017, mainly due to a significant increase in copper production by Kennecott Utah Copper Corporation (KUCC) (figure 3). The production value of pre-cious metals reached $289 million in 2018, an increase of 10% from 2017, also due to KUCC’s expanded output. Fig-ure 6 shows production and value of select metals since 2000. Globally, base and precious metals spot prices decreased over the course of 2018, as most commodities experienced a dis-tinct drop in the middle of the year. Base metal price declines ranged from 6% to 21%, gold also experiencing a negative annual price trend for the first time since 2015 (Prospectors and Developers Association of Canada, 2019).
Utah mining ranking or statistic 2013 2014 2015 2016 2017 2018USGS rank of U.S. nonfuel mineral production value 7th 5th 8th 10th 8th 8th(metals and industrial minerals)
Fraser Institute annual survey of mining companies 15th of 112 14th of 122 9th of 109 11th of 104 15th of 91 7th of 83(favorability of mining jurisdiction)
U.S. EIA rank for coal production by state 14th 13th 14th 10th 11th 12th
New DOGM approved large mine permits 4 2 2 0 0 1
New DOGM approved small mine permits 13 11 12 7 11 13
New DOGM approved exploration permits 9 14 17 11 9 6
SITLA mineral leases issued 62 56 32 53 57 36
New BLM mining claims filed 2360 3107 975 5366 5709 5361
Total BLM mining claims (end of year) 19,487 19,770 18,520 21,497 21,936 22,976
Note: USGS = U.S. Geological Survey, EIA = U.S. Energy Information Administration, DOGM = Utah Division of Oil, Gas and Mining, SITLA = Utah School and Institutional Trust Lands Administration, BLM = U.S. Bureau of Land Management
Table 1. Utah mining rankings and statistics.

5Utah Mining 2018
$0
$10
$20
$30
$40
$50
$60
$70
1990 1995 2000 2005 2010 2015
Prop
erty
Tax
es
CoalSand and gravelNon-metal minesMetal mines
$0
$5
$10
$15
$20
$25
$30
$0
$50
$100
$150
$200
1980 1985 1990 1995 2000 2005 2010 2015
Seve
ranc
e Ta
x
Min
eral
Lea
se
Mineral leaseSeverence tax (mining only)
0.0%
1.0%
2.0%
3.0%
4.0%
1997 2002 2007 2012 2017
Perc
ent o
f GSP
Total mining industry (including oil and gas)Mining industry (excluding oil and gas)
Source: Utah State Tax CommissionNote: Calendar year, presented in nominal dollars
Source: Utah State Tax CommissionNote: State fiscsal year, presented in nominal dollars
Source: U.S. Bureau of Economic Analysis
Support activities for mining industry
(mill
ion
$)
(mill
ion
$)(m
illio
n $)
Figure 4. Utah mining economic indicators. A. Property taxes charged against the mining industry, 1990–2017. B. Mineral lease revenue and severance taxes on mining industry, 1980–2018. C. Percentage of Utah's gross state product (GSP) from mining-related activities, 1997–2018.
A
C
B

Utah Geological Survey6
KUCC’s Bingham Canyon mine, located about 20 miles southwest of Salt Lake City in the Oquirrh Mountains, pro-duces all of Utah’s molybdenum and silver and nearly all its copper and gold (figure 2). The combined value of metals pro-duced by KUCC in 2018 was estimated at $1.8 billion, a 39% increase from 2017. Utah continues to be the sole U.S. pro-ducer of both magnesium metal and beryllium, both of which were identified by the USGS as critical minerals in 2018 de-spite having been produced in Utah since the late 1960s and early 1970s. Specifics of base and precious metal mining are detailed below, listed in order of greatest production value.
Copper
Utah’s 2018 copper production increased to 466 million lbs, nearly 40% higher than the 2017 production of 334 million lbs (figure 6). Coupled with a slightly stronger copper price (an average of $2.85/lb in 2017 to $3.00/lb in 2018), the value of Utah’s copper production increased more than 45%, from $951 million in 2017 to $1398 million in 2018.
The vast majority of copper production in Utah came from the KUCC Bingham Canyon open pit porphyry copper-gold-molybdenum mine, which produced 450 million lbs of cop-per in 2018 and accounted for more than 96% of Utah’s total copper production. The increase in production of more than 121 million lbs between 2017 and 2018 at Bingham is due to mining a higher grade area of the pit, improvements in fleet
productivity, increased plant throughput, and final stages of recovery from the 2013 Manefay pit-wall failure. Bingham, the most historically productive mine in the U.S. and currently in its 115th year of mining, ranked as the second highest cop-per domestic producer in 2018, behind the Morenci mine in Arizona. Rio Tinto Kennecott also takes advantage of cop-per scrap as a feed for the Magna smelter, recycling 250,000 lbs each month, the equivalent of copper wiring in 550 new homes (Rio Tinto, 2019).
Lisbon Valley Mining continued copper mining and produc-tion in 2018, producing 5.5 million lbs copper and remaining relatively stable from 2017 production with only a 2% in-crease. The Lisbon Valley mine is located 30 miles southeast of Moab in San Juan County (figure 2) and extracts sediment-hosted oxide copper ore from an open pit mine. The ore is pro-cessed through a solvent extraction-electrowinning (SX-EW) processing facility to produce copper cathode. When copper prices dropped in mid-2018, Lisbon Valley shifted from open pit mining to reprocessing of existing tailings by crushing to a more uniform particle size and installing an aeration system to reduce channelization and improve copper recovery. Lisbon Valley remains ready to resume open pit mining under favor-able copper pricing.
Copper production from Tamra Mining’s Rocky Range cop-per skarn mine in Beaver County ramped up during early 2018 (figure 2), yielding a year-end total production of nearly
4322
$45,000
$50,000
$55,000
$60,000
$65,000
$70,000
$75,000
$80,000
0
1000
2000
3000
4000
5000
6000
2001
2002
2003
2004
2005
2006
2007
2008
2009
2010
2011
2012
2013
2014
2015
2016
2017
2018
Ave
rage
Wag
e
Num
ber o
f Em
ploy
ees
Number of employees
Average wage
4062
3844
3827
4196
4611 48
09
5172
5095
4749 50
17 5133
4808
4736
4551
4099
4153
4841
Source: Utah Department of Workforce Services
Figure 5. Average annual mining employment and salaries in Utah, 2001–2018. Includes metal, industrial mineral, and coal mines and facilities; excludes oil and gas.

7Utah Mining 2018
11 million lbs, a substantial increase over the 250,000 lbs pro-duced in 2017. Tamra mines a mix of copper oxide and sulfide ore from a series of small open pit skarns, which are processed through a SX-EW and flotation circuit. Tamra was also affect-ed by the 2018 drop in copper price and by an increase in the spot price for sulfuric acid (needed for the SX-EW process).
As a result, they suspended active mining in October 2018 and transitioned to processing tailings. The mill produced copper cathode into the first quarter of 2019. Tamra is currently on care and maintenance, re-evaluating historical data to inform future exploration and to re-examine orebody characterization to ensure proper processing of the mixed oxide and sulfide ore.
$0
$500
$1000
$1500
$2000
$2500
0
50
100
150
200
250
300
350
400
Val
ue (m
illio
n $)
Thou
sand
Sho
rt To
ns
Utah Copper Production
Production
Value
$0
$100
$200
$300
$400
$500
0
4000
8000
12,000
16,000
20,000
2000
2001
2002
2003
2004
2005
2006
2007
2008
2009
2010
2011
2012
2013
2014
2015
2016
2017
2018
Val
ue (m
illio
n $)
Shor
t Ton
s
Utah Molybdenum Production
$0
$200
$400
$600
$800
0
200
400
600
800
2000
2001
2002
2003
2004
2005
2006
2007
2008
2009
2010
2011
2012
2013
2014
2015
2016
2017
2018
Val
ue (m
illio
n $)
Thou
sand
Tro
y O
unce
s
Utah Gold Production
$0
$20
$40
$60
$80
$100
$120
0
1000
2000
3000
4000
5000
6000
2000
2001
2002
2003
2004
2005
2006
2007
2008
2009
2010
2011
2012
2013
2014
2015
2016
2017
2018
Val
ue (m
illio
n $)
Thou
sand
Tro
y O
unce
s
Utah Silver Production
330 35
0
290 31
0
255
246
243 26
2
291
339
284
221
186
236
110
174
167
243
233
$1517
$1982
$1771$1655
$1378
$551
$951
$782
$1398
682 73
2
487
340
417
538
408
373
330
584
468
386
201
207
134 15
4 178 19
7
261
$575$618
$290
$342 $332
$155
$224$193
$25040
00
4500
3700
3500
3540
4150
3600
340035
80
4900
3754
2976
2127
3123
1704 19
44 2156 25
20
3175
$76
$105
$74
$66$61
$27
$37$33
$3911
,33
8929
6724
5071
17,1
96 18,5
19
16,4
24
11,6
84
7496
12,4
56 14,2
20
14,9
91
10,3
62
6350
8377
3086
5512
6393
12,6
76
$455$475
$131
$274
$309
$114 $90
$40
$157
Production
Value
2000
2001
2002
2003
2004
2005
2006
2007
2008
2009
2010
2011
2012
2013
2014
2015
2016
2017
2018
Figure 6. Production (since 2000) and value (since 2010) of select metals.

Utah Geological Survey8
Copper is an essential metal in everyday life and is one of the most widely used metals globally, as over 50% of copper sup-ply is used for infrastructure applications such as electrical wir-ing, plumbing, electronic equipment, etc. Emerging “green” technologies and renewable power generation also come with a high copper requirement. The price of copper is expected to re-main relatively stable over the next two years, based on steadily
increasing infrastructure and green technology growth coupled with an anticipated decrease in copper production through 2023, when several new large copper projects globally are expected to begin production (Lombrana and Farchy, 2019). However, as a highly traded commodity, the copper price is also sensitive to geopolitical tensions and global economic trends, which may outweigh traditional supply and demand movements.
$0
$500
$1000
$1500
$2000
$2500
0
50
100
150
200
250
300
350
400
Val
ue (m
illio
n $)
Thou
sand
Sho
rt To
ns
Utah Copper Production
Production
Value
$0
$100
$200
$300
$400
$500
0
4000
8000
12,000
16,000
20,000
2000
2001
2002
2003
2004
2005
2006
2007
2008
2009
2010
2011
2012
2013
2014
2015
2016
2017
2018
Val
ue (m
illio
n $)
Shor
t Ton
s
Utah Molybdenum Production
$0
$200
$400
$600
$800
0
200
400
600
800
2000
2001
2002
2003
2004
2005
2006
2007
2008
2009
2010
2011
2012
2013
2014
2015
2016
2017
2018
Val
ue (m
illio
n $)
Thou
sand
Tro
y O
unce
s
Utah Gold Production
$0
$20
$40
$60
$80
$100
$120
0
1000
2000
3000
4000
5000
6000
2000
2001
2002
2003
2004
2005
2006
2007
2008
2009
2010
2011
2012
2013
2014
2015
2016
2017
2018
Val
ue (m
illio
n $)
Thou
sand
Tro
y O
unce
s
Utah Silver Production
330 35
0
290 31
0
255
246
243 26
2
291
339
284
221
186
236
110
174
167
243
233
$1517
$1982
$1771$1655
$1378
$551
$951
$782
$1398
682 73
2
487
340
417
538
408
373
330
584
468
386
201
207
134 15
4 178 19
7
261
$575$618
$290
$342 $332
$155
$224$193
$250
4000
4500
3700
3500
3540
4150
3600
340035
80
4900
3754
2976
2127
3123
1704 19
44 2156 25
20
3175
$76
$105
$74
$66$61
$27
$37$33
$39
11,3
3
8929
6724
5071
17,1
96 18,5
19
16,4
24
11,6
84
7496
12,4
56 14,2
20
14,9
91
10,3
62
6350
8377
3086
5512
6393
12,6
76
$455$475
$131
$274
$309
$114 $90
$40
$157
Production
Value
2000
2001
2002
2003
2004
2005
2006
2007
2008
2009
2010
2011
2012
2013
2014
2015
2016
2017
2018
Figure 6. Continued.

9Utah Mining 2018
Gold
Utah produced 196,905 troy oz of gold in 2018, all but 205 troy oz produced by the KUCC Bingham Canyon mine (fig-ure 6). The 196,700 troy oz produced by Bingham represents a 18,800 troy oz (11%) increase from 2017. In total, Utah’s 2018 gold production was valued at $250 million, a 12% in-crease from the $224 million valuation in 2017. This increase was the result of higher production at Bingham Canyon and a slightly improved gold price of $1270/troy oz in 2018 com-pared to $1260/troy oz averaged in 2017.
The Kiewit mine in the Gold Hill district of west Tooele County, 40 miles south of Wendover, produced the remain-ing 205 troy oz of gold. Clifton Mining holds Kiewit’s land position with mining operated by Desert Hawk. Due to fi-nancial hardship for Desert Hawk, mining ceased in July 2017. However, processing of the heap leach recommenced in May 2018. Kiewit is an open pit heap leach operation and Desert Hawk is optimistic for future exploration potential in the area, citing surface sampling that has returned assay values up to 17 ppm Au.
Gold is generally known for its uses in jewelry, coinage, bul-lion, and monetary backing, but also has uses in a variety of industrial and electronic applications. However, due to its monetary implications, the price of gold is largely controlled by variations in international relations, health of major finan-cial markets, and inflation. The price of gold in 2018 experi-enced a 15% price drop mid-year with a minor rebound at the end of the year, ending the year down 1.1% (Clark, 2019). Major merger and acquisition activity between many of the world’s largest gold miners and producers such as Barrick, Randgold, Newmont, and Goldcorp will likely drive asset sales and spinoffs, as well as possible further consolidation in the gold sector, through 2019. Due to factors such as mine reserve depletion restricting supply of new gold stock, geo-political risks and start-up delays for new projects, and a lack of industry investment overall for the past several years, the price of gold is forecasted to remain stable, if not improve. Offsetting these potential bullish factors is the issue of fall-ing ore grades both in existing mines and in pipeline projects which could result in increasing production costs.
Magnesium
U.S. Magnesium is the only facility producing magnesium metal from a primary source in the United States. The facility is located on the southwestern shore of Great Salt Lake, about 60 miles west of Salt Lake City in Tooele County (figure 2). Magnesium chloride concentrate is produced from Great Salt Lake brines through evaporation and ultimately converted to magnesium metal by an electrolytic process. The annu-al magnesium production capacity at the U.S. Magnesium plant is approximately 75,000 st (specific data on production is confidential). The price for magnesium metal remained unchanged from 2017, averaging $2.15/lb in 2018 (USGS,
2019a). Magnesium was the second largest contributor to Utah’s base metal value in 2018.
Significant quantities of U.S. Magnesium’s production had been used by the adjacent Allegheny Technologies facility to produce titanium sponge. However, this plant was idled at the end of 2016 due to unfavorable market conditions. The idling of this plant significantly reduced magnesium demand in 2017 and 2018. Magnesium is also used as a constituent of aluminum-based alloys, in castings and wrought products, in the desulfurization of iron and steel, and other minor uses (USGS, 2019a). Lithium, which is also concentrated with magnesium in the U.S. Magnesium solar evaporation ponds, has been considered as a possible future byproduct of the op-eration (Tripp, 2009).
Molybdenum
Utah produced 12,786,000 lbs of molybdenum in 2018, ex-clusively from the KUCC Bingham Canyon mine (figure 6). While this represents only a 16% increase in production from 2017, the increase in molybdenum price from a 2017 aver-age of $8.16/lb to a 2018 average of $12.25/lb drove a nearly 75% increase in overall molybdenum value from $90 million to $157 million. Molybdenum ore is not fully processed at the Rio Tinto facilities in Utah after plans for a molybdenum auto-clave process (MAP) facility were shelved following the 2013 open-pit slide. As such, Rio Tinto does not directly recover byproducts of molybdenum smelting, such as rhenium, one of the recently identified critical minerals (Fortier and others, 2018). However, Rio Tinto announced a partnership with the Critical Mineral Institute in 2016 to investigate improved re-covery rates and tailings processing for critical minerals.
Molybdenum, which has the lowest coefficient of thermal ex-pansion of any engineering material, is used primarily in the production of stronger and more corrosion-resistant iron al-loys. Eighty percent of the molybdenum produced globally is used in specialty steels, cast iron, and super alloys, the remain-ing 20% used in chemical compounds, particularly industrial lubricants (International Molybdenum Association, undated). Due to the industrial applications of molybdenum, it is widely used within the petroleum industry, and the price of molybde-num is often driven by economic fluctuations in oil and gas. An increase in global stainless steel production and renewed vitality in the oil and gas sector were the driving forces behind the 50% molybdenum price increase from 2017 to 2018.
Beryllium
Beryllium production in Utah totaled 324,104 lbs in 2018, a 9% increase from the 296,495 lbs produced in 2017. Howev-er, the price of beryllium dropped more than 20% from $290/lb in 2017 to $226/lb in 2018. Despite the increase in pro-duction, the lower prices resulted in a 15% decrease, to $74 million, in the overall value of beryllium produced. Beryllium in Utah is produced by Materion Natural Resources from the

Utah Geological Survey10
Spor Mountain area in Juab County, 40 miles northwest of Delta (figure 2). This operation is the sole producer of be-ryllium in the United States, and also the largest producer of beryllium in the world, accounting for approximately 70% to 85% of the world’s annual production. This dependence on a singular site, in addition to the difficulty of replacing beryl-lium with a substitute metal, qualified beryllium as a critical mineral on the USGS 2018 list (Fortier and others, 2018).
Beryllium at Spor Mountain occurs as bertrandite (Be4Si2O7(OH)2) in epithermal carbonate-replacement depos-its hosted in Miocene-age tuff. Despite bertrandite containing 15 wt. % beryllium, the bertrandite ore contains less than 0.5 wt. % beryllium due to dilution from waste rock (Lederer and others, 2016). Spor Mountain contains proven and probable reserves of nearly 9 million st at 0.25% beryllium, which at current production rates would support over 75 years of con-tinued beryllium production (Materion, 2019).
Beryllium at Spor Mountain is mined as bertrandite and shipped to Materion’s mill, located 10 miles north of Delta in Millard County. At the mill, the mined bertrandite is pro-cessed to beryllium hydroxide, which is shipped to a refinery and finishing plant in Ohio also owned and operated by the Materion group. For the past several years, Materion has in-cluded up to 10% imported beryl ore in the mill feed; how-ever, in 2018 the mill processed only Materion’s domestic ore (Materion, 2019). As a specialty metal, over half of beryllium products are used in industrial components and in consumer and automotive electronics, with other important applica-tions in defense, telecommunications, and scientific fields. Materion has established a recycling program for both “new” scrap (produced during creation of beryllium products) and “old” scrap (postconsumer products that have reached the end of their life) with recovery rates of 40% (USGS, 2019a).
Silver
Utah’s KUCC Bingham Canyon mine was the state’s sole pro-ducer of silver in 2018. Like the other products mined at Bing-ham, silver production increased 17%, from 2,156,000 troy oz in 2017 to 2,520,000 troy oz in 2018. However, the average price of silver dropped over the same period from $17.20/troy oz in 2017 to $15.30/troy oz in 2018, resulting in only a mod-est increase in valuation of 4%, from $37 million in 2017 to $39 million in 2018 (figure 6).
Silver is used as both a precious metal, for jewelry and coin-age, and as an industrial metal. It has excellent electrical con-duction and is also antimicrobial, resulting in approximately 60% of silver being used in industrial applications (USGS, 2019a). Electronic industrial uses take advantage of silver’s ductility and high electrical conductivity, though given silver’s susceptibility to oxidation and relative scarceness, copper re-mains the dominant metal in this space. Silver’s antimicrobial properties, able to penetrate the cell walls of bacteria but leave human cells unharmed, makes it relevant for purification and
chemical applications (Silver Institute, undated). Global fore-cast for silver is expected to remain relatively stable, based on growth in the industrial sectors, particularly electrical (e.g., solar panels); however, silver’s capacity as a precious metal also makes it sensitive to fluctuations in international relations and financial markets like gold. An increase in sil-ver demand will likely be met by increasing silver recovery at existing gold, copper, or lead-zinc mines (where silver is a common byproduct, such as at Bingham Canyon), as opposed to growth and development of new primary silver projects.
Vanadium
No vanadium was mined in Utah in 2018; however, interest in the metal experienced a sharp increase and mining could recommence in 2019. The vanadium spot price reached a 10-year high in November 2018, driving much of the renewed interest, though the price fell as much as 35% in the following months (Popovic and Thomas, 2019). Despite the significant drop in price relative to the 2018 peak, the price remains el-evated relative to the average price over the past 10 years, and many investors and miners suspect vanadium’s long-term outlook will remain strong. Prospectivity for vanadium is based on the potentially increasing market for large-capacity vanadium redox batteries and on China increasing the vana-dium requirement in construction rebar. Vanadium was also identified as a critical mineral by the USGS in 2018 (Fortier and others, 2018).
The increased price and long-term outlook for vanadium has spurred strong interest in exploration and development of va-nadium projects on the Colorado Plateau (southeastern Utah), an area known for past vanadium production. Historically vanadium was produced as a byproduct of sediment-hosted uranium mining from the Salt Wash Member of the Jurassic-age Morrison Formation and to a lesser degree from the Moss Back Member of the Triassic-age Chinle Formation. The Salt Wash is generally accepted as having a higher vanadium to uranium ratio in comparison to other U-bearing units on the Colorado Plateau.
In 2018, Energy Fuels’ White Mesa Mill in Blanding, San Juan County, began adjusting their processing circuits to re-cover vanadium from existing tailings ponds, which are esti-mated to contain 4 million lbs vanadium pentoxide (V2O5). The ramp-up of vanadium production allowed the White Mesa Mill to become the only operating conventional uranium and vanadium production facility in the United States. Retrofitting and upgrading of the vanadium circuit took place through the end of 2018, with the first high-purity vanadium concentrate shipped in the first quarter of 2019. Energy Fuels anticipates producing between 200,000 and 225,000 lbs V2O5 per month from the tailings ponds.
Energy Fuels also began test mining during the last quarter of 2018 in the La Sal and Pandora mines, testing the ability to target high-grade vanadium mineralization. The 2018 test

11Utah Mining 2018
mining of 420 st yielded an average grade of 1.67% V2O5 and 0.10% U3O8 for a V:U ratio of 16:1. An expansion of the test mining program to 5200 st verified the original results, and the larger test returned an average of 1.60% V2O5 and 0.19% U3O8. The test mining required refurbishment of the underground mines, which are now capable of entering full production given favorable economics in the vanadium and/or uranium markets. Energy Fuels’ measured and indicated resource from Utah properties totals 31,673,000 lbs V2O5 (Energy Fuels Inc., 2018).
Besides Energy Fuels, several other companies have shown interest in Utah’s vanadium resources and begun staking and acquiring claims around many of Utah’s past producing vanadium mines and districts (figure 7). Global Vanadium Corp. acquired the Desert Eagle project in Garfield County east of the Henry Mountains, citing historical V2O5 values up to 28 wt. %. Global Vanadium intends to publish an up-dated NI 43-101 for the property in 2019. Maxtech Ventures, though branded as a primary manganese producer, signed a letter of intent to purchase mining claims in the Temple Mountain district, Emery County. The increase in vanadium exploration continued into early 2019, with more than five additional companies acquiring a land position in Utah’s known U-V districts across Grand, Emery, Garfield, and San Juan Counties.
Exploration and Development Activity
The information compiled in this section has been gathered from a variety of sources, including the UGS annual industry survey of mine operators, mining company websites, press releases, technical reports, personal communication with in-dustry geologists, and the DOGM website (2019).
Exploration and development activity in the metallic miner-als industry is closely tied to commodity prices. Following the global commodity super-cycle that peaked in 2011–2012, metal prices bottomed out in 2015–2016. Following modest rebounds in 2017 and the first part of 2018, prices for almost every commodity dropped sharply mid-year 2018. Given the weak prices that persisted through the end of the year, overall investment in the minerals industry in 2018 dropped 35% to a new decadal low (Prospectors and Developers Association of Canada, 2019). Funding specifically for exploration and development managed to stay above the low experienced in 2015, but still experienced a 50% drop from 2017. Distribu-tion of funding among commodities remained relatively sta-ble, battery metals maintaining the increase from 5% to 14% of total exploration funding seen from 2016 to 2017. Base metal funding increased marginally, leaving the percentage of funding for precious metals at the lowest point since 2011. Nonetheless, gold still received the overwhelming majority of funding at over 40% of financing, with copper the next most funded commodity at about 8% (Prospectors and De-velopers Association of Canada, 2019).
Mining is facing increased competition from several other emerging sectors, leading to an increase in investment by major mining companies into junior explorers (increase from $3.2 million to $12 million from 2013 to 2017). The major-ity of this funding has been for near-term projects, leaving greenfield exploration at only 26% of total funding in 2018, compared to 38% in 2008 (Prospectors and Developers As-sociation of Canada, 2019). Near-term projects are more at-tractive given the likelihood of growth and development; global copper resources, for example, grew an average of 13% over a five-year period from 2010 to 2015 (Mudd and Jow-itt, 2018). Resource growth occurs because mining can begin with a known resource, then reinvest revenue into near mine exploration which generally expands the resource. However, despite the positive growth of most resources, exploration and mining face significant challenges, particularly with respect to decreasing grade. Current copper mines average 0.53 wt. % Cu grade, whereas mines under development average 0.39 wt. % Cu. Lower grades increase operating costs, as they require movement and processing of more material. The average cost of production per short ton of ore has increased from just over $15 to $23 from 2007 to 2017 (McCrae, 2018).
Exploration in Utah has been affected by the trends discussed above, resulting in 2018 experiencing a relatively restrained exploration market. The majority of exploration projects that progressed are related to near mine exploration or renewed exploration in historical mining districts. Because the eco-nomic contributions of exploration to Utah are more difficult to assess than production, details of some of Utah’s larger ex-ploration programs are presented below in alphabetical order by mining district. A broader look at exploration in Utah in 2018 is shown in figure 7 and summarized in table 2.
Bingham District
The Bingham district is controlled mainly by the Rio Tinto Group, with mining operations managed through KUCC. KUCC has an in-mine geology and exploration team that focus-es on growth opportunities with the goal of extending the mine life of the current open pit. Additionally, Rio Tinto has a global exploration team that operates in the area in pursuit of brown-field opportunities within the immediate geologic terrane.
Within the open pit, the pushback of the south wall is the main growth opportunity currently underway. The $900 million project began in 2012 with the expectation of increasing the mine life to 2032 and is currently expected to allow access to higher and more consistent grade ore starting late 2020. The more consistent grade of the south wall pushback will offset variability in grade as mining progresses to lower levels of the pit. Currently the open pit has a total resource of 90 million st at 0.28 wt. % Cu. Other known growth opportunities, such as the North Rim Skarn underground project’s total resource of 22 million st at 3.65 wt. % Cu, remain under evaluation (Rio Tinto, 2019). Additionally, the mine exploration team contin-

Utah Geological Survey12
_̂
_̂
_̂
_̂
_̂
_̂
West Dip
Antelope Range
White Canyon
Henry Mountains
Bradshaw
Fish Springs
Main Tintic
Silver Island
Lucin
Tecoma
Circle Cliffs
Lisbon Valley
Bingham
San Rafael River
Temple Mountain
Dry ValleyUcolo
La Sal
Gateway
Red Canyon
South Henry Mountains
Cedar Mountain
Enefit American
Oil
East HenryMountains
White Mesa
Gold Hill
Kings Canyon
San FranciscoBeaver Lake
Star
Southwest Tintic
Rocky Range
Goldstrike
Gold Springs
TOOELE
SAN JUAN
MILLARD
KANE
JUAB
IRON
EMERY
UINTAH
BOX ELDER
GARFIELD
GRAND
UTAH
WAYNEBEAVER
DUCHESNE
SEVIER
SUMMIT
RICH
WASHINGTON
CARBON
SANPETE
CACHE
PIUTE
WASATCH
DAVIS
WEBER
SALT LAKE
DAGGETT
MORGAN
TRM #1
Sal Rica
Dragon Mine
Sevier Lake
TomCo Energy
USO (Utah)
Ashley Creek
Blawn Mountain
Southern Red Sands
Ramsey Hill Exploration
Red Leaf Resources
Diamond Creek Mine
Petroteq Energy
Paradox Brine (Anson) Moab
Provo
Vernal
St. George
Salt Lake City
Figure 7. Select base and precious metal, industrial mineral, uranium, oil shale, and oil sand exploration and development activity locations in Utah.
Ü
§̈¦15
§̈¦70
§̈¦80
§̈¦80
§̈¦84
§̈¦15
0 50 10025Miles
0 50 100 15025Kilometers
")
_̂ City
§̈¦15
ShootaringCanyon
Delta
$+ Oil shale site!( Oil sand site
Industrial mineral site")
Uranium ± Vanadium mill#*
Metal mining district (table 2)
Metal and Uranium-Vanadium mining district (tables 2 and 4)
Uranium-Vanadium mining district (table 4)
Figure 7. Select base and precious metal, industrial mineral, uranium, oil shale, and oil sand exploration and development activity locations in Utah.

13Utah Mining 2018
District Property Commodity County Company Progress
Antelope Range Blair Project Ag-Au Iron Bullion Canyon LLC Drill targets identified, program on hold for funding
Beaver Lake North Beaver Lake/Kingbird Cu Beaver Alderan Resources Ltd. Property staked in 2018
Beaver Lake Kingbird Claims Cu Beaver Horn Silver Mines Inc. Property staked in 2018 and leased to Alderan
Bingham Bingham Orbit Cu-Au-Mo Salt Lake Rio Tinto Exploration Drilled 9 holes totaling 17,388 ftBradshaw Donut Flat Cu Beaver Alderan Resources Ltd. Property staked in 2018
Circle Cliffs Colt Mesa Co Garfield Glacier Lake Resources Inc.
Acquired property following reduction of Grand Staircase Escalante Natl Monument, sampled, property dropped
East Henry Mtns. Desert Eagle V Garfield Global Vanadium Corp. Acquired 97 lode claims
Fish Springs Silver Dome Polymetallic Juab Allegiant Gold Ltd. Property dropped, target previously drill tested
Fish Springs West Desert (Crypto) Polymetallic Juab InZinc Mining Ltd. Drilled 5 core holes totaling 10,760 ft
Gold Hill Gold Hill Au-Ag Tooele Newmont USA Ltd. Property dropped, exploration in Great Basin suspended
Gold Springs Gold Springs Au-Ag Iron TriMetals Mining Inc. SRK structural study, mapping, sampling
Goldstrike Goldstrike Au-Ag Washington Liberty Gold Corp.Drilled 81,089 ft (200 RC holes, 15 core holes) and published Preliminary Economic Assessment (PEA)
Henry Mtns. Bromide Basin Au Garfield Prolific Mining Corp. Property acquired by Prolific Mining Corp. from Bromide Mining LLC
Kings Canyon Thompson Knoll Polymetallic Millard Inland Explorations Ltd./BCM Resources
Drilled 1 core hole, lost at 1095 ft (planned 2950 ft), intersected porphyry
La Sal La Sal Mining Complex V(-U) San Juan Energy Fuels Inc. La Sal and Pandora mines refurbished for
test mining, on standby
Lisbon Valley Lisbon Valley Copper Cu San Juan Lisbon Valley Mining
Company LLC Investigating feasibility of in situ recovery, near mine resource drilling
Lucin East Canyon Au-Ag Box Elder Tuvera Exploration Inc. Program on hold for funding
Rocky Range Milford Copper Cu Beaver Tamra Mining Company LLC
Open pit mining until Oct 2018, then processed tailings
San Francisco Frisco Summit Cu Beaver Rio Tinto Exploration Data compilation, mapping, soil sampling, and rock sampling
San Francisco Frisco Project Cu-Au, Pb-Ag Beaver Alderan Resources Ltd. Drilled 10 core holes totaling 12,700 ftSilver Island Speedway Au Tooele Torq Resources Inc. Mapping and sampling, property dropped
Star Elephant Canyon Cu Beaver Alderan Resources Ltd. Property staked in 2018, surface sampling and mapping
Star Harrington Claims Pb-Zn-Ag Beaver Horn Silver Mines, Inc. Property staked in 2018, leased to Alderan
Star Milford Base Metals Polymetallic Beaver TAO Commodities Property staked 2018, surface sampling, mapping, trenching
Tecoma TUG Au-Ag Box Elder Newmont USA Ltd. Program suspended, property available for partnership
Temple Mountain Temple Mountain V Emery Maxtech Ventures Acquired 52 lode claimsTintic (Main) Burgin and Trixie Polymetallic Juab High Power Exploration Inc. Property staked, mapping and sampling
Tintic (SW) SWT Porphyry Cu-Mo Juab Freeport-McMoRan Exploration Corp. Drilled 3 core holes totaling 13,275 ft
Tintic (SW) Dragon Mine Polymetallic Juab Continental Mineral Claims Inc.
Acquired claims under Dragon Mine halloysite clay project for metallic mineral potential
West Dip West Mercur Au Tooele Rush Valley Exploration/Torq Resources Inc.
Comprehensive soil sampling program, mapping, historical data aggregation
Table 2. Select metal exploration and development projects in Utah, 2018. Districts are shown on figure 7.

Utah Geological Survey14
ues exploring for other near-term growth projects that would be within the scope of current mining operations.
Rio Tinto’s global exploration team has been exploring within the “Bingham Orbit” (Oquirrh Mountains) for several years, focused on brownfield porphyry and skarn targets that are not necessarily accessible by current mining but could take advan-tage of much of the existing mine infrastructure (e.g., smelter). In 2018 the Bingham Orbit program continued with nine holes drilled totaling 17,388 ft. No field mapping or sampling was conducted in 2018.
Fish Springs District
InZinc’s West Desert Zn-Cu-Fe project is located in the Fish Springs district of western Juab County, about 70 miles west of Eureka. Fish Springs is a historically Ag-Pb producing district, mainly from carbonate replacement and vein style mineraliza-tion, with more recent exploration identifying additional skarn mineralization. The West Desert (Crypto) Cu-In skarn was dis-covered in the late 1950s and is the focus of InZinc’s exploration. The elevated indium in the deposit is the result of In substituting for Zn in the sphalerite crystal lattice in concentrations up to 8%. Indium was listed as a critical mineral by the USGS in 2018 due to being 100% import-reliant (Fortier and others, 2018).
The current resource estimate for the West Desert project from the 2014 Preliminary Economic Assessment (PEA) states an indicated sulfide resource of 14,354,300 st at 6.22% Zn equiva-lent (2.16 wt. % Zn, 0.23 wt. % Cu, 33 ppm In), and an indicat-ed oxide resource of 1,542,100 st at 4.76% Zn equivalent (3.44 wt. % Zn, 0.20 wt. % Cu, 8 ppm In) (Dyer and others, 2014). The 2018 exploration program at West Desert aimed to expand the known resource. The program included ground geophysics and five core holes totaling 10,760 ft. Two holes were drilled to the east of the known resource, delineating narrow high-grade mineralization starting at over 985 ft depth in intervals 5 ft and less, with Zn up to 11.6 wt. %. The remaining three holes were drilled to the west of the resource and high-grade zinc and cop-per were intersected between 500 and 1150 ft depth, with a highlight of 22 ft grading 16.5 wt. % Zn, 0.3 wt. % Cu, 60 ppm In, and 14 ppm Ag from 464 ft depth. The next phase of drilling will focus on expanding the shallow high-grade western extent of the resource, which still remains open.
Gold Springs District
TriMetals Mining’s Gold Springs project in far west Iron Coun-ty is a low-sulfidation epithermal gold deposit with gold-silver bearing quartz-adularia-calcite veining and stockwork, extend-ing 3.5 miles along trend in the Gold Springs mining district. The 2017 NI43-101 for this project gives a pit-constrained mea-sured and indicated resource on the Jumbo Trend of 375,00 troy oz Au at an average grade of 0.52 ppm plus 7,735,000 troy oz Ag at an average grade of 10.79 ppm using a 0.25 ppm Au cut-off and $1500/troy oz gold price (Lane and others, 2017).
Since 2010 TriMetals has completed 252 drill holes totaling 131,000 ft. The most recent drill campaign in 2016 consisted of 43 reverse circulation (RC) holes totaling 23,115 ft. Explo-ration in 2018 was focused on understanding the structural context of the Jumbo Trend for future exploration targeting. To this end, SRK was contracted to conduct a structural as-sessment of the project, yielding five drill targets. Conclusions from the structural assessment focused on the implications of the dominantly east-west extensional to left-lateral strike-slip stress regime that creates the north-south-trending district-bounding faults, the post-strike slip but likely syn-extension timing of mineralization, the difference between ore shoot ori-entation on district-scale north-south faults versus northwest-southeast and northeast-southwest cross-faults, and the asso-ciation of highest Au grades with multiple brecciation and/or veining events.
Goldstrike District
Liberty Gold is developing the sediment-hosted Goldstrike project located in western Washington County. Gold is found predominantly at the unconformity between Paleozoic-age basement rocks and overlying Eocene-age Claron Formation, mainly occurring in the Claron basal conglomerate but also in the Paleozoic Callville Limestone or Pakoon Dolomite. East-west strike-slip faults are the major structural control, creating dilational zones and pull-apart basins, while within individual grabens northwest and north-northeast cross-faults provide lo-cal control.
Liberty Gold began the Goldstrike project in 2014 by combin-ing a database of over 1500 drill holes and 100,000 blast holes with associated maps and sections to produce a three-dimen-sional model of the geologic mineralization, which allowed them to plan successful drill programs from 2015 to present. In 2018, Goldstrike published its initial resource estimate and PEA, delineating an indicated resource of 925,000 troy oz Au at an average grade of 0.50 ppm Au using a cutoff of 0.2 ppm Au (SRK Consulting, 2018). Additionally, Liberty Gold received an Amended Plan of Operations consolidation land position to a continuous 2150 acres.
Exploration in 2018 consisted of 81,089 ft of drilling (200 RC holes and 15 diamond core holes) in multiple extensions of the known resource. Highlights include intercepts in the Peg Leg area of 2.95 ppm Au over 60 ft and 1.17 ppm Au over 220 ft; in the Dip Slope Zone of 2.09 ppm Au over 55 ft (including 3.94 ppm Au over 25 ft); and in newly identified gold min-eralization in West Beavertail of 1.49 ppm Au over 55 ft (in-cluding 3.37 ppm Au over 20 ft). The 2019 exploration plan includes an estimated 200 RC holes for 31,500 ft to continue exploring open gold intercepts to the north, south, and west of the main resource, particularly following up on still open min-eralization in West Beavertail. An updated resource including the 2018 and available 2019 exploration results is expected in the last quarter of 2019.

15Utah Mining 2018
Kings Canyon District
The Thompson Knolls prospect in the Kings Canyon district is located in west-central Millard County, on the west slope of the Confusion Range. The Kings Canyon district is a relatively young district for Utah, as mineral occurrences were only dis-covered in the 1980s. Despite extensive exploration, including the drilling of over 200 holes by various companies, the district has not gone into production (Krahulec, 2018). Surface altera-tion in the district includes iron-stained jasperoid and decalcifi-cation, styles of alteration that are often associated with Carlin and sediment-hosted gold systems. Gold mineralization mani-fests as stratiform replacement of favorable sediment packages.
Current exploration in the Thompson Knolls prospect is oper-ated by BCM Resources in partnership with Inland Exploration and focuses on porphyry/skarn targets under post-mineral cover and sediment-hosted gold. Since BCM took over exploration in 2015, they have completed surface sampling and mapping as well as new ground magnetics and induced-polarization surveys. Two holes were initially planned for 2018, the first of which intersected quartz monzonite porphyry (QMP) at 595 ft beneath fanglomerate cover that continued throughout the hole until it was lost on a post-mineral fault at 1095 ft (planned depth 2950 ft). Alteration in the QMP included oxidation, argilliza-tion, seriticization, and pyritization. Copper oxides were inter-cepted directly below the fanglomerate cover with Cu values up to 641 ppm. Copper values within the most intense quartz-sericite-pyrite alteration averaged 223 ppm. Inclusions of gran-ite, biotite-feldspar quartz porphyry, and lamprophyre in the QMP indicate a multi-stage magmatic district. BCM interprets the sericitic alteration to represent the phyllic alteration shell on the margin of a porphyry copper system and have planned the three additional holes to target the core of the system at 1650 ft spacing. No further drilling took place in 2018.
In addition to the porphyry exploration at the north end of the Thompson Knolls project, BCM also maintains claims in the southern part of the prospect around previous drilling by Cen-turion Mines Corp. that yielded 30 ft at 8.01 ppm Au (includ-ing 10 ft at 21.06 ppm) from 250 ft depth, the best sediment-hosted Au intercept known for the district (Redfern, 2016).
Lisbon Valley District
Lisbon Valley Mining targets sediment-hosted copper oxide in the Cretaceous Dakota Sandstone. The mining operation is hosted in the northwest-trending Lisbon Valley anticline, which is an 11-mile-long upright doubly plunging fold bound-ed by normal faults. Near-mine exploration has delineated several zones of copper mineralization continuing beneath cover beyond the current economic extent of open pit mining. Lisbon Valley has been exploring the potential of in situ recov-ery (ISR), which has been successfully trialed at other copper operations, such as the Florence project in Arizona. Lisbon Valley has begun the permitting procedure and limited bench top testing to investigate the viability of this method, which is
potentially well suited to the sandstone-hosted oxide copper. ISR works by using injection, recovery, and monitoring wells to circulate a fluid solvent underground that dissolves copper from the host rock and can then be extracted for traditional processing through a SX-EW plant. The ISR method avoids the need for open pit mining and hence requires far less sur-face disruption, potentially mitigating many of the environ-mental impacts associated with traditional mining.
Eurasian Minerals―now EMX Royalty Corp.―holds the Copper Warrior project on the northwest nose of the Lisbon Valley anticline, about 8 miles northwest of the Lisbon Valley copper operation. They are targeting the same style of sed-iment-hosted readily leachable copper oxide mineralization as observed at Lisbon Valley and have mapped minor occur-rences of outcropping copper mineralization. The company is not actively exploring the district and lists the property as available for partnership.
San Francisco District
The Frisco project held by Alderan Resources is located in the historic San Francisco mining district west of Milford in Bea-ver County. The district is known primarily for historical pro-duction from the Horn Silver mine and the Cactus mine but has had several episodes of porphyry exploration over the past decades. Alderan consolidated their ground position at Frisco in 2016 and began exploration work, including compilation of historical data, mapping and sampling, aeromag survey, and a large-scale induced polarization survey.
Drilling in 2018 included 10 diamond core holes totaling 12,700 ft focused on the Accrington (Imperial) skarn target, the Perseverance (Cactus Canyon) porphyry target, the Pea-cock lead-zinc-silver target, and the Washington skarn target. The Accrington skarn is a high-temperature garnet-pyroxene and magnetite skarn with widespread mineralization at sur-face. Seven of the ten 2018 drill holes were focused on the Ac-crington skarn and delineated a continuous zone of mineral-ization across 2625 ft strike, still open to the south and south-west, with a highlight intercept of 175 ft at 1.4 wt . % Cu, 0.45 wt. % Zn, 0.19 ppm Au, 20 ppm Ag from 150 ft depth. The Perseverance porphyry target, based on a coincident charge-ability and resistivity anomaly, was tested with one hole and intercepted skarn at 0 to 218 ft and 587 to 606 ft, and other-wise intersected monzonite to the end of the hole at 3334 ft. Very fine grained chalcopyrite was present in trace amounts up to 2638 ft. The monzonite showed weak chloritic alteration and patchy pyritization, becoming stronger from 2769 ft to the end of the hole. Both the Peacock lead-zinc-silver target in the Horn Silver mine area and the Washington skarn target near the Washington mine were tested with one hole each, yielding weak mineralization.
Alderan’s 2019 exploration program is focused on two tar-gets, the newly staked White Mountain epithermal prospect 6 miles south of the San Francisco district and the Tourmaline

Utah Geological Survey16
Breccia targets within the existing Frisco claims. The White Mountain prospect has widespread surface alteration includ-ing sinter, chalcedony, and alunite, and geologic mapping and sampling are planned for the first part of 2019. The Tourma-line Breccia targets in the Frisco district are located around the Cactus Breccia (past production of 1,433,000 st at 2.1 wt. % Cu) and include at least four additional breccias identified from geophysics and geologic evidence. Like White Moun-tain, the early 2019 program at the Tourmaline Breccias will comprise mapping and sampling to refine drill targets, with a drill program expected later in the year.
Rio Tinto Exploration (RTX) staked a set of 320 unpatented claims to the east and southeast of Alderan’s Frisco project in 2017 and an additional 285 in 2018. Exploration work in 2018 included compilation of historical data, mapping, soil sampling, and rock sampling.
Star District
Although the majority of exploration activity in Beaver County has been focused on the San Francisco district, the Star district to the southeast has also had minor activity. The Star district was historically a significant Ag and Pb producer with byprod-uct Zn, Cu, Au, and W from skarn and carbonate replacement mineralization. In addition to their claims in the San Francisco district, Alderan has staked minor claims in the Star district and initiated surface sampling and mapping for skarn mineraliza-tion at their Copper King prospect. To date, surface sampling and mapping has delineated a zone of outcropping magnetite skarn over 985 ft returning a high of 8.63 wt. % Cu.
TAO Commodities conducted surface sampling, mapping, and trenching at their Milford project in the Star district targeting high-grade Zn-Pb-Cu replacement mineralization in 2018. A 2019 drill program has been permitted to include a minimum 2130 ft of drilling for four to five holes focused on the Silver Bear prospect, a known base metal vein striking at least 490 ft length and up to 6.5 ft thickness in the north of the district, with the potential to increase to 3280 ft for six to seven holes pending positive results from the initial drilling.
Tintic Districts
The Tintic districts (Main, Southwest, and East) have had increased exploration activity through 2018 and into 2019. Freeport McMoRan continued their exploration program in Southwest Tintic on land acquired from Quaterra Resources in 2015. The 2018 drilling program included three diamond core holes totaling 13,275 ft. Freeport is targeting deep porphyry potential in the district and will use the final results from the 2018 drilling to inform the next stage of exploration.
Continental Mineral Claims Inc. (CMC) entered into an ex-ploration agreement with Applied Minerals Inc., owners of the Dragon Mine halloysite clay project, in 2018. The explo-
ration agreement permits CMC to conduct metallic minerals exploration on Applied Minerals property, alongside the exist-ing halloysite clay project. Metallic mineral exploration will be focused beneath the clay resource, based on the geologic interpretation that the halloysite clay represents shallow ad-vanced argillic alteration, often associated with porphyry sys-tems. In addition to the exploration agreement with Applied Minerals, CMC also staked 369 claims in the area.
High Power Exploration Inc. (HPX) acquired claims in the Main and Southwest Tintic districts in 2018. After consolidat-ing their land position, exploration focused on review of his-torical mining and exploration data, mapping, and sampling in preparation for a targeted drilling program in 2019.
In early 2019, Tintic Consolidated Metals LLC was formed by IG Copper and private investors. This group took over the previous Chief Consolidated land position in the East Tintic district around the Trixie and Burgin mine with the intent to resume production at the Trixie mine in late 2019 or early 2020. In addition to restarting mining in known mineraliza-tion, extensive mapping and soil sampling is being conducted through 2019 to define new exploration targets in the district.
INDUSTRIAL MINERALS
Production and Values
Industrial mineral production in Utah during 2018 had an esti-mated value of $1.2 billion (figure 3), which is an increase of 4% from the revised 2017 value. The largest contributor was the brine- and evaporite-derived products that include potash, salt, and magnesium chloride. These products had a combined value of $433 million, a 6% increase from 2017, and accounted for 36% of Utah’s total industrial mineral production value in 2018. The second-largest contributor was the sand and gravel, crushed stone (including limestone and dolomite), and dimen-sion stone commodity groups. These products had a combined value of $286 million in 2018, a 5% increase from 2017, and accounted for 24% of the industrial mineral total. The third-largest contribution to the value of industrial minerals produc-tion came from the Portland cement and lime product group. These products had a combined value of $268 million in 2018, a 3% increase from 2017, and accounted for 22% of the to-tal industrial mineral value. Together, these three commodity groups contributed 82% of the total 2018 value of industrial minerals produced in Utah. The remaining value came from phosphate, gilsonite, clay, expanded shale, and gypsum.
Potash, Salt, and Magnesium Chloride
The brine- and evaporite-derived commodities produced in Utah include potash, salt (NaCl), and magnesium chloride. Potash is produced as both potassium sulfate (or SOP) and potassium chloride (muriate of potash or MOP).

17Utah Mining 2018
Potash production in Utah totaled 491,000 st in 2018 and con-tributed the most value to this commodity group (figure 8). The 2018 estimated value of produced potash is approximate-ly $241 million, an increase of 15% from 2017. The higher value is primarily due to an increase in production of potas-sium sulfate, but slight increases in price as well as a slight in-crease in production of potassium chloride, also contributed. Compass Minerals Ogden produces potassium sulfate from Great Salt Lake brine, Intrepid Potash-Wendover produces potassium chloride from shallow brines in the Great Salt Lake
Desert, and Intrepid Potash-Moab produces potassium chlo-ride from a solution mining operation targeting deep, subsur-face evaporites of the Pennsylvanian-age Paradox Formation (figure 2). Potassium sulfate has a significantly higher market value than potassium chloride. The primary use of both types of potash is fertilizer.
Utah salt production in 2018 amounted to approximately 3.1 million st and had a production value estimated at $172 mil-lion (figure 8). About 79% of the salt was produced from Great
$0
$50
$100
$150
$200
$250
$300
0
200
400
600
2000
2001
2002
2003
2004
2005
2006
2007
2008
2009
2010
2011
2012
2013
2014
2015
2016
2017
2018
Val
ue (m
illio
n $)
Thou
sand
Sho
rt To
ns
Utah Potash Production (MOP + SOP)
Prod uc tion
Va lu e
$0
$50
$100
$150
$200
$250
0
1000
2000
3000
4000
2000
2001
2002
2003
2004
2005
2006
2007
2008
2009
2010
2011
2012
2013
2014
2015
2016
2017
2018
Val
ue (m
illio
n $)
Thou
sand
Sho
rt To
ns
Utah Salt Production
3000
2800 30
00
2750 29
00
2770
2750
3100
2970
3300
2854
2870
3181 32
34
2768
2691
3264
3101
3648
230
335 35
0
394
596
577
400 43
0
495
360 37
4
433 45
4
456
351
392
444
491
469
$165
$219$233 $236
$253
$198$210
$188
$241
$144$155
$172
$162
$147
$173 $172
$209
$123
500
300
100
700
Figure 8. Production (since 2000) and value (since 2010) of potash (all types) and salt.

Utah Geological Survey18
Salt Lake brine by three operators: Compass Minerals Ogden, Cargill Salt, and Morton International, in descending produc-tion order (figure 2). The remaining 21% came from Red-mond Minerals, Intrepid Potash-Moab, and Intrepid Potash-Wendover. Redmond Minerals operates an underground mine near Redmond in Sanpete County and produces salt from the Jurassic-age Arapien Shale (figure 2). Salt produced in Utah is used for a variety of purposes including road deicing, water treatment, and agricultural and industrial applications.
In 2018, magnesium chloride production in Utah increased to 818,000 st and had an estimated production value of about $19 million. The magnesium chloride brine was produced by Intrepid Potash-Wendover and Compass Minerals Ogden; the latter also produces small amounts of magnesium chloride flake. Magnesium chloride is commonly used as a premium road deicer and as a dust suppressant for unpaved roads.
The most significant source of brine-derived products in Utah is Great Salt Lake. An estimated 3.0 million st of total solids was produced from Great Salt Lake in 2018, including salt, potash, magnesium chloride, and magnesium metal; produc-tion is essentially unchanged from 2017. This estimate does not account for all byproducts, such as chlorine gas and hy-drochloric acid, so the actual solids production is likely high-er. The estimated value of mineral and brine production from
Great Salt Lake in 2018 was $500 million, which was a de-crease of about 8% from 2017.
Sand and Gravel, Crushed Stone, and Dimension Stone
Sand and gravel, crushed stone, and dimension stone are pro-duced by many private, county, state, and federal entities. Given the numerous producers of this commodity group, it was impractical for the UGS to send annual production sur-veys to all operators. However, the UGS does compile data from selected operators to track these commodities and uses USGS data for production and value estimates. During 2018, approximately 29 million st of sand and gravel was produced in Utah, up less than 1% from revised 2017 estimates (fig-ure 9), and was worth $211 million (USGS, 2019b). About 10 million st of crushed stone, a 9% increase from revised 2017 estimates, was worth $75 million (USGS, 2019b), and sev-eral thousand tons of dimension stone was produced. Prices for crushed stone and sand and gravel increased slightly from 2017 to 2018.
Portland Cement, Lime, and Limestone
Together Ash Grove Cement and LafargeHolcim produced about 1.7 million st of Portland cement in Utah during 2018,
0
10
20
30
40
50
60
70
1950 1955 1960 1965 1970 1975 1980 1985 1990 1995 2000 2005 2010 2015
Mill
ion
Shor
t Ton
s
Sand and gravel Crushed stone
Source: U.S. Geological Survey
Pre-OlympicsConstruction
Pre-RecessionConstruction Boom
Great Salt LakeRailroad Causeway
Construction
Figure 9. Utah aggregate production, 1950–2018.

19Utah Mining 2018
having an estimated value of $197 million. Ash Grove Cement operates the Leamington quarry and plant east of Leamington in Juab County, while LafargeHolcim operates the Devils Slide quarry and plant east of Morgan in Morgan County (figure 2). Portland cement production value increased 8% in 2018 due to modest increases in production and price (USGS, 2019a). Besides mining limestone for Portland cement, Ash Grove and Holcim also produce small amounts of sandstone, clay, and shale, which are lesser feedstock for their cement plants.
During 2018, Graymont Western U.S. was the sole producer of lime in Utah. Lime production decreased about 7% in 2018. Graymont produces high-calcium quicklime and dolomitic quicklime from their quarry and plant in the Cricket Moun-tains about 35 miles southwest of Delta in Millard County (figure 2). Lime is used for flue gas desulfurization, steel pro-duction, and a variety of other construction, chemical, and in-dustrial applications.
During 2018, about 3.9 million st of limestone was produced for uses other than crushed stone. Most of that production was used to manufacture the aforementioned cement and lime, but a few smaller operations, such as Diamond Mountain Resources in Uintah County, produce limestone for flue-gas desulfurization at coal-fired power plants. Small amounts of limestone are also used as a safety product for the coal indus-try. Limestone “rock dust” is used to coat the walls of coal mines to keep coal dust from accumulating.
Phosphate
Simplot Phosphates continues to be the only active phosphate producer in Utah, mining the Meade Peak Member of the Permian Phosphoria Formation. The phosphate operation is located 12 miles north of Vernal in Uintah County (figure 2). In 2018, the mine produced nearly 4.2 million st of ore, which was 2% more than 2017 production. The ore yielded about 1.6 million st of phosphate concentrate (about 30% P2O5) after processing. The concentrate is transported in slurry through a 96-mile underground pipeline to the Simplot fertilizer plant near Rock Springs, Wyoming. More than 95% of the phos-phate rock mined in the United States is used to manufacture phosphoric acids to make ammonium phosphate fertilizers and animal feed supplements (USGS, 2019a).
Simplot is in the process of permitting a significant revision to their mine plan with DOGM. They plan to expand their existing mine to the east (east of U.S. 191) on private property owned by the mine. The expansion includes plans to continue production through the year 2076.
Gilsonite
Gilsonite is a shiny, black, solid hydrocarbon that occurs in a swarm of narrow, but laterally and vertically extensive veins in the Uinta Basin. It has been mined since the late 1880s, mostly
in Utah with some minor production in the Colorado part of the Uinta Basin. In 2018, American Gilsonite Company was the only primary producer, mining and processing gilsonite at their operation in southeastern Uintah County (figure 2). Over the past decade, gilsonite production from the Uinta Basin has ranged between 20,000 and 85,000 st per year, depending on market conditions (specific production and price data are proprietary). Production for American Gilsonite was signifi-cantly reduced in 2016 as the company underwent Chapter 11 bankruptcy reorganization. Production increased in 2017 as the company emerged from bankruptcy, and 2018 production was at similar levels to 2017. A new gilsonite mine (TRM #1), operated by Table Rock Minerals, produced a small amount of gilsonite from a SITLA lease in the Uinta Basin south of Ouray in Uintah County (figure 7). The mine began operating in 2018 and has the capacity to extract about 10,000 tons of gilsonite per year. The mine is in the Cottonwood vein.
Utah is the only place in the world that contains large deposits of gilsonite, which has been shipped worldwide for use in nu-merous and diverse products including asphalt paving mixes, coatings, inks, and paints (Boden and Tripp, 2012). More re-cently, the oil and gas industry has used gilsonite as an addi-tive in drilling fluids. Gilsonite helps control fluid loss and seepage, helps increase wellbore stability, helps prevent loss circulation, and helps stabilize shale formations.
Bentonite, Common Clay, and High-Alumina Clay
Clay production in Utah totaled at least 330,000 st in 2018. Clay is produced at various small and large mines, often on an intermittent basis. Consequently, production and value esti-mates are subject to significant change on a year-to-year basis. Bentonite was produced by Western Clay and Redmond Min-erals. Uses for bentonite include well drilling and foundry op-erations, various civil engineering applications, and as litter-box filler. Some of the largest producers of clay are Interstate Brick (common), Ash Grove Cement (high-alumina clay), and LafargeHolcim (high-alumina clay). Common clay is largely used to make bricks, whereas high-alumina clay is used to make Portland cement.
Applied Minerals Inc. continued development of their halloy-site and iron oxide operation at the Dragon mine in the Tintic Mountains. In 2018 they produced a small amount of clay and continued research and development activities. They also sold about 4.5 million tons of mixed clay and iron oxide from sur-face piles that were established by a previous operator for net proceeds of $4.3 million. The mixed material will be used as pozzolan, which is a cement alternative/replacement or con-crete enhancement.
Expanded Shale
Expanded shale in Utah is produced by Utelite at their quarry and plant near Wanship in Summit County (figure 2). In 2018,

Utah Geological Survey20
Utelite produced approximately 167,000 st of expanded shale, which is a lightweight aggregate sometimes called “bloated shale” mainly used by the construction industry. Expanded shale is produced by rapidly heating high-purity shale, derived from the Cretaceous-age Frontier Formation, to about 2000ºF causing it to expand and vitrify. The resulting aggregate is du-rable, inert, uniform in size, and lightweight, having a density about one-half that of conventional aggregates. The material is used in roof tile, concrete block, structural concrete, and horti-culture additives, as well as for highway construction and geo-technical fill. About half of Utelite’s production is used locally along the Wasatch Front and the rest is shipped out of state.
Gypsum
Four operators reported combined gypsum production in Utah of about 400,000 st in 2018, an increase from 2017 reported production. The estimated value of 2018 gypsum production is $4.8 million, 17% higher than 2017. Higher value calcined gypsum production was slightly down in 2018 from 2017, while lower value crude gypsum production was up. The four Utah gypsum producers were Progressive Contracting, Inc., United States Gypsum Co., Diamond K Gypsum, and Sunroc Corp. (in descending production order). Two gypsum wall-board plants are located near Sigurd in Sevier County, but only the United States Gypsum plant is active (figure 2). Utah
gypsum is primarily used in raw or crude form by regional cement companies as an additive to retard the setting time of cement and by the agriculture industry as a soil conditioner. Lesser amounts of the higher value calcined gypsum are used to make wallboard.
Exploration and Development Activity
Exploration and development activities involving industrial mineral commodities in Utah included potash, lithium, hy-draulic fracturing sand, and phosphate (table 3). This summa-ry generally does not include information on development of smaller aggregate or construction material operations, which are difficult to track but often make up a significant compo-nent of industrial mineral development. The information for this section is derived primarily from company websites, press releases, DOGM records, and personal communications.
Potash
For the past decade or so, interest in Utah potash has led to several potash exploration projects, but recent, relatively low potash prices have resulted in limited project advance-ment, with a few exceptions. In 2018, Crystal Peak Miner-als published a feasibility study for their Sevier Playa project (Brebner and others, 2018). They are developing a potassium
Property Commodity; Deposit Location County Company Progress
Blawn Mountain Potash and alumina; alunite alteration
Blawn Mountain; Wah Wah Mtns.
Beaver SOPerior Fertilizer Corp. (changed from Potash Ridge Corp.)
Changed name of company; completed prefeasibility study in 2017; minimal reported activity in 2018
Diamond Creek mine
Phosphate; Meade Peak Mbr. of Phosphoria Fm.
Diamond Fork Utah Falcon Isle Resources
Defined a small resource of about 74,000 tons of phosphate rock; intends to mine a few thousand tons per year as organically certified phosphate; currently working to complete a mine permit with DOGM
Dragon Mine Halloysite specialty clay and iron oxide
Tintic Mtns. Juab Applied Minerals Inc.
Continued research and development; sold 4.5 million tons of mixed clay and iron oxide material for use as pozzolan that was stockpiled by previous operator
Paradox Brine Lithium; brine Paradox Basin Grand Anson Resources Ltd Re-entered four oil and gas wells to collect brine samples: two in early 2018 and two more in early 2019; the highest reported lithium analysis was 253 ppm
Ramsey Hill project
Frac sand north of Vernal Uintah Ramsey Hill Exploration
Currently working to open frac sand mine north of Vernal; seeking a conditional use permit from Uintah County
Sal Rica Lithium; shallow brine
Pilot Valley Box Elder
Westwater Resources (formerly Uranium Resources, Inc.)
Completed some limited brine sampling in shallow auger holes during 2017; received water rights for 1500 acre-feet per year in early 2019
TRM #1 Gilsonite; vein Uinta Basin Uintah Table Rock Minerals LLC
Opened a new gilsonite mine on a SITLA lease; produced a small amount of gilsonite in 2018
Sevier Playa Potash; shallow brine Sevier Playa/Dry Lake
Millard Crystal Peak Minerals Inc.
Published feasibility study in early 2018; BLM completed draft EIS in late 2018 and a final EIS is expected in summer 2019
Table 3. Select industrial mineral exploration and development projects in Utah, 2018.

21Utah Mining 2018
sulfate or SOP project in a shallow brine deposit on the Se-vier Lake/Playa in Millard County (figure 7). The company intends to use solar ponds and a processing plant to produce about 370,000 st of SOP per year with an estimated mine life of 30 years. The BLM published a draft environmental impact statement (EIS) in late 2018 for the project and a final EIS is expected to be released during the summer of 2019. SOPerior Fertilizer Corporation (formerly Potash Ridge Corporation) has a project in the Blawn Mountain area in Beaver County (figure 7) to produce SOP from alunite, and they are consider-ing alumina as an additional resource from the project. Their alumina resource was added to a prefeasibility study in 2017 (Kerr and others, 2017). In the past decade, a few companies have completed drilling programs in the Paradox Basin, but minimal substantive activity has occurred in the last couple of years on any Paradox Basin potash project. Projects in the Paradox Basin are focused on potassium chloride, or MOP, production rather than SOP.
Lithium
Following increased demand and rising prices for battery ma-terials, Utah has become a target for lithium exploration in the past few years. During 2016 and 2017, thousands of lithium claims were staked in Utah, but only minor additional claims were staked in 2018. Projects have targeted lithium brines in a variety of locations including the northern Paradox Basin, Pilot Valley, Tule Valley, and the Black Rock Desert, but re-cent activity has focused primarily on the northern Paradox Basin. Anson Resources holds a large block of claims (their Paradox Brine project) near Moab in Grand County (figure 7) and re-entered four oil and gas wells during 2018 and early 2019 to test brine flow rates and chemistry. Analyses of brine from the tested wells have yielded lithium concentrations up to 253 ppm. At Pilot Valley in Box Elder County, Westwa-ter Resources was awarded a water right for 1500 acre-ft per year in early 2019 for their Sal Rica project, but they reported minimal other activity.
Frac Sand
As horizontal oil and gas wells reach ever greater lengths―laterals in the Uinta Basin now reach up to 11,000 ft―oil and gas companies have increased the amount of frac sand used in hydraulic fracturing stimulations, up to 22 million pounds per well. As a result, demand for frac sand has increased and specifications for frac sand have shifted or relaxed to some degree. Changing specifications have opened more opportu-nity for producing frac sand from sources in Utah. Frac sand is typically mined from unconsolidated sand deposits and friable sandstone, and ideally, the sand grains from these deposits are well rounded, strong, and appropriately sized. A few groups have investigated potential resources in southwestern Utah, western Utah, central Utah, and the Uinta Basin. One compa-ny, Ramsey Hill Exploration, is developing a frac sand mine north of Vernal to supply the Uinta Basin (figure 7). As of May 2019, they were pursuing a conditional use permit from Uin-
tah County for their mine. Another company, Southern Red Sands LLC (formerly Integrated Sands), has a large land posi-tion that includes SITLA and federal lands in Kane County, where it is hoping to develop a frac sand mine (figure 7).
Phosphate
During 2018, a relatively small phosphate company pur-sued a mining permit from DOGM. Falcon Isle Resources has plans to produce modest amounts of organically certified phosphate from their Diamond Creek phosphate mine near Diamond Fork in Utah County (figure 7). They intend to ex-tract a few thousand tons of phosphate rock per year from a roughly 7-foot-thick zone of the Meade Peak Member of the Permian-age Phosphoria Formation that grades ap-proximately 25% to 30% P2O5. The company has currently outlined a resource of about 74,000 tons in a 3.3-acre area. The area was previously mined in 1980 but has since been idle. Utah Phosphate Company (a subsidiary of Nutrien) has been evaluating an industrial-scale phosphate project at Ashley Creek in Uintah County, which is west of Simplot’s phosphate operation, but little project advancement has been made in the past few years (figure 7).
URANIUM
Utah has historically been a leader in uranium production, ranking as the third largest uranium-producing state overall. The vast amount of this uranium production has come from the sandstone-hosted uranium deposits of the Colorado Pla-teau, which covers the southeast area of the state and extends into Colorado, New Mexico, and Arizona. However, despite Utah’s historically profitable uranium production, the price of U3O8 has been in general decline since 2011 (figure 10). Despite potential stabilization of the price since the decadal low observed in late 2016, the price has remained too low for mining in Utah to resume. There has been no active mining in Utah since 2012, although operators maintain several mines in standby should prices improve, and very little exploration has taken place. Table 4 details uranium resources in Utah.
In response to persistently low uranium prices causing many U.S. producers to struggle, and to the introduction of ura-nium as a critical mineral in 2018 (Fortier and others, 2018), Energy Fuels and Ur-Energy submitted a petition to the U.S. Department of Commerce under Section 232 of the Trade Expansion Act of 1962 in July 2018. This petition requested an investigation into the effects of uranium imports on U.S. national security and proposed implementing a limit to the amount of imported uranium, reserving 25% of the U.S. market for domestic producers. Currently the U.S. imports the majority of uranium from Canada and Australia, though imports from China and Russia make up roughly one quarter of the current market. The Section 232 report was completed by the Department of Commerce and submitted to the presi-dent in April 2019.
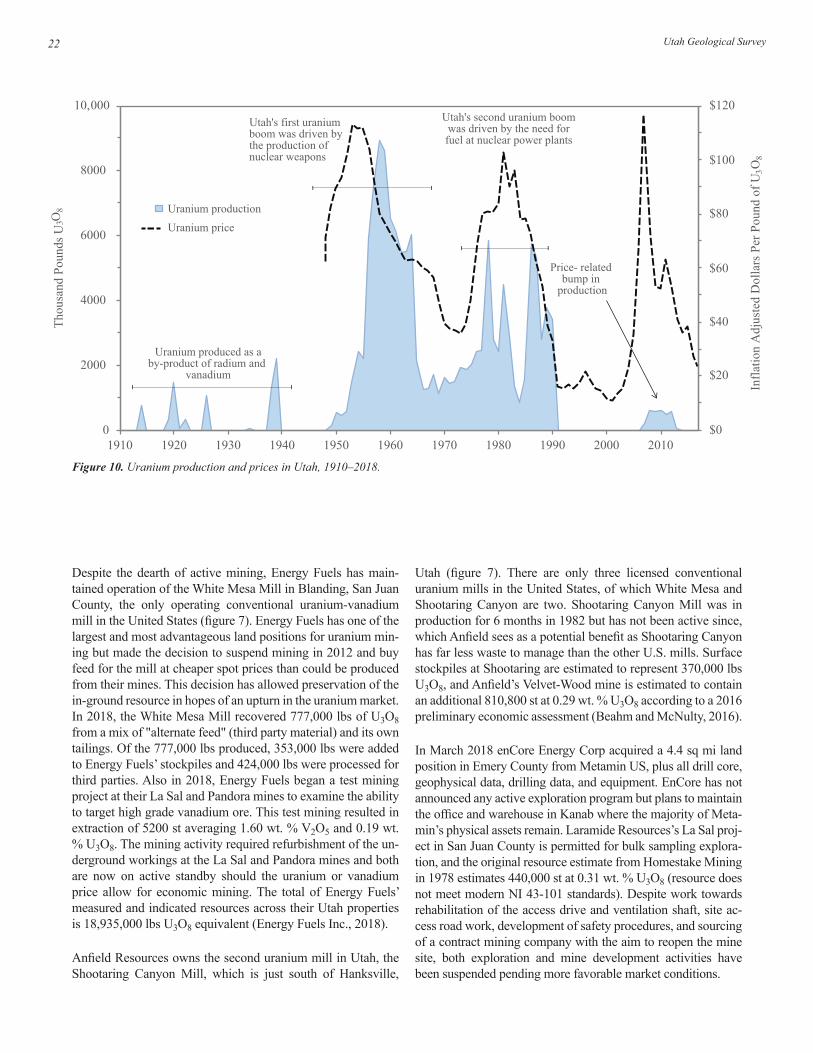
Utah Geological Survey22
Despite the dearth of active mining, Energy Fuels has main-tained operation of the White Mesa Mill in Blanding, San Juan County, the only operating conventional uranium-vanadium mill in the United States (figure 7). Energy Fuels has one of the largest and most advantageous land positions for uranium min-ing but made the decision to suspend mining in 2012 and buy feed for the mill at cheaper spot prices than could be produced from their mines. This decision has allowed preservation of the in-ground resource in hopes of an upturn in the uranium market. In 2018, the White Mesa Mill recovered 777,000 lbs of U3O8 from a mix of "alternate feed" (third party material) and its own tailings. Of the 777,000 lbs produced, 353,000 lbs were added to Energy Fuels’ stockpiles and 424,000 lbs were processed for third parties. Also in 2018, Energy Fuels began a test mining project at their La Sal and Pandora mines to examine the ability to target high grade vanadium ore. This test mining resulted in extraction of 5200 st averaging 1.60 wt. % V2O5 and 0.19 wt. % U3O8. The mining activity required refurbishment of the un-derground workings at the La Sal and Pandora mines and both are now on active standby should the uranium or vanadium price allow for economic mining. The total of Energy Fuels’ measured and indicated resources across their Utah properties is 18,935,000 lbs U3O8 equivalent (Energy Fuels Inc., 2018).
Anfield Resources owns the second uranium mill in Utah, the Shootaring Canyon Mill, which is just south of Hanksville,
Utah (figure 7). There are only three licensed conventional uranium mills in the United States, of which White Mesa and Shootaring Canyon are two. Shootaring Canyon Mill was in production for 6 months in 1982 but has not been active since, which Anfield sees as a potential benefit as Shootaring Canyon has far less waste to manage than the other U.S. mills. Surface stockpiles at Shootaring are estimated to represent 370,000 lbs U3O8, and Anfield’s Velvet-Wood mine is estimated to contain an additional 810,800 st at 0.29 wt. % U3O8 according to a 2016 preliminary economic assessment (Beahm and McNulty, 2016).
In March 2018 enCore Energy Corp acquired a 4.4 sq mi land position in Emery County from Metamin US, plus all drill core, geophysical data, drilling data, and equipment. EnCore has not announced any active exploration program but plans to maintain the office and warehouse in Kanab where the majority of Meta-min’s physical assets remain. Laramide Resources’s La Sal proj-ect in San Juan County is permitted for bulk sampling explora-tion, and the original resource estimate from Homestake Mining in 1978 estimates 440,000 st at 0.31 wt. % U3O8 (resource does not meet modern NI 43-101 standards). Despite work towards rehabilitation of the access drive and ventilation shaft, site ac-cess road work, development of safety procedures, and sourcing of a contract mining company with the aim to reopen the mine site, both exploration and mine development activities have been suspended pending more favorable market conditions.
$0
$20
$40
$60
$80
$100
$120
0
2000
4000
6000
8000
10,000
1910 1920 1930 1940 1950 1960 1970 1980 1990 2000 2010
Infla
tion
Adj
uste
d D
olla
rs P
er P
ound
of U
3O8
Thou
sand
Pou
nds U
3O8
Uranium produced as aby-product of radium and
vanadium
Utah's first uraniumboom was driven bythe production ofnuclear weapons
Utah's second uranium boomwas driven by the need forfuel at nuclear power plants
Price- related bump in
production
Uranium production
Uranium price
Figure 10. Uranium production and prices in Utah, 1910–2018.

23Utah Mining 2018
COAL
Production and Demand
Five Utah coal operators produced 13.8 million st of coal valued at $454 million (figure 11) from seven underground mines and one surface mine in 2018 (figure 12 and 13; table 5). After increasing slightly in 2017, production slipped by 4.6% in 2018, to a 33-year low, mainly due to decreased pro-duction at the Skyline and Sufco mines. In contrast, the newly
opened Emery mine increased production in 2018 and the Lila Canyon mine significantly ramped up production with the ex-pansion of an export market. After several years of decline, employment at active or recently active mines increased over 10% in 2018 to 1316 employees but is still far below the 2028 employees recorded in 2008 (figure 14). Employment is ex-pected to increase another 10% to about 1450 employees in 2019 as several mines expand their operations and increase production. In fact, operators report having significant dif-ficulty finding and retaining trained miners and engineers/
District Property County Company ResourceCedar Mountain Cedar Mountain Emery enCore Energy Corp. 2M st at 0.055% U3O8 historical resource1
Dry Valley Dunn Mine San Juan Western Uranium and Vanadium Corporation
139,357 st at 0.13% U3O8 indicated resource2
Gateway Whirlwind Grand Energy Fuels Inc. 188,000 st at 0.29 % U3O8 indicated resource3
La Sal Beaver-La Sal San Juan Energy Fuels Inc. 224,000 st at 0.19% U3O8 measured and indicated re-source3, refurbished for test mining in 2018, on standby
La Sal Energy Queen San Juan Energy Fuels Inc. 343,000 st at 0.19% U3O8 measured and indicated resource3
La Sal La Sal San Juan Laramide Resources Ltd.
440,000 st at 0.312% U3O8 historical resource4
La Sal Pandora San Juan Energy Fuels Inc. 203,000 st at 0.19% U3O8 measured and indicated re-source3, refurbished for test mining in 2018, on standby
La Sal Redd Block San Juan Energy Fuels Inc. 371,000 st at 0.18% U3O8 measured and indicated resource3
Lisbon Valley Velvet-Wood San Juan Anfield Resources Inc. 810,800 st at 0.29% U3O8 measured and indicated resource5
Red Canyon Daneros San Juan Energy Fuels Inc. 20,000 st at 0.36% U3O8 indicated resource3
San Rafael River Probe Emery enCore Energy Corp. Acquired from Metamin in 2018, 27,400 st at 0.25% U3O8 historical resource1
San Rafael River San Rafael Project Emery Western Uranium and Vanadium Corporation
758,000 st at 0.225% U3O8 indicated resource2
San Rafael River Snow Emery enCore Energy Corp. Acquired from Metamin in 2018, 34,700 st at 0.23% U3O8 historical resource1
South Henry Mountains Copper Bench Garfield Energy Fuels Inc. 500,000 st at 0.29% U3O8 indicated resource3
South Henry Mountains Frank M Garfield Anfield Resources Inc. 1.1M st at 0.101% U3O8 indicated resource6
South Henry Mountains Indian Bench Garfield Energy Fuels Inc. 220,000 st at 0.40% U3O8 indicated resource3
South Henry Mountains Southwest Garfield Energy Fuels Inc. 660,000 st at 0.25% U3O8 indicated resource3
South Henry Mountains Tony M Garfield Energy Fuels Inc. 1M st at 0.24% U3O8 indicated reousrce3
Temple Mountain Sinbad Emery enCore Energy Corp. Acquired from Metamin in 2018, up to 200,000 lbs U3O8 historical estimate1
Ucolo Sage Plain San Juan Western Uranium and Vanadium Corporation
100,000 st at 0.23% U3O8 measured and indicated resource2
White Canyon Blue Jay San Juan enCore Energy Corp. 107,600 st at 0.122% U3O8 historical resource1
White Canyon Geitus San Juan enCore Energy Corp. 136,800 st at 0.144% U3O8 historical resource1
White Canyon Marcy Look San Juan enCore Energy Corp. 38,400 st at 0.186% U3O8 historical resource1
1enCore Energy Corp., 2019; 2Western Uranium Corporation, 2017; 3Energy Fuels Inc., 2018; 4Laramide Resources Ltd., 2006; 5Beahm and McNulty, 2016; 6Beahm and Anderson, 2008
Table 4. Select uranium projects in Utah, 2018. District locations are shown on figure 7.

Utah Geological Survey24
Production Value
2000
2001
2002
2003
2004
2005
2006
2007
2008
2009
2010
2011
2012
2013
2014
2015
2016
2017
2018
Val
ue (m
illio
n $)
Mill
ion
Shor
t Ton
s
26.9
27.0
25.3
23.1 24
.6
26.1
24.3
24.3
21.8
21.9
19.4 20
.1
17.2
17.0
14.5
14.0 14
.4
13.8
17.9
0
5
15
20
25
10
30
* 2019 data are estimated
2019
*
15.7
$0
$100
$200
$400
$500
$600
$300
$700
$800
$456
$480$460
$377 $367
$459
$569
$624 $641
$566
$679$709
$599
$602$638
$501
$509 $493
$454
$534
Wasatch PlateauCoalfield
Book CliffsCoalfield
Emery Coalfield
AberdeenPinnacle
West Ridge
Willow Creek
Star Point Savage
Levan
SUFCO
Horizon
Wildcat
0 10 20 miles
Salina
Manti
Ephraim
Castle Dale
Mt. Pleasant
Nephi
Price
6
191
10
89
24
15
70
U T A HD U C H E S N E
C A R B O N
E M E R Y
S A N P E T E
S E V I E R
GR
AN
D
J U A BRive
r
N
Hunter
Deer Creek
Soldier Canyon
SunnysideCogeneration(burns waste coal)
UIN
TA
H
Gre
en
G r e e n River
Trail Mountain
Dugout Canyon
Emery
Cottonwood
Castle Valley #3 and #4
Hidden Valley
Lila Canyon
Huntington
Crandall CanyonSouth Crandall Canyon
Whisky Creek
Columbia
Skyline
K A N E
Kanab
UTAH
89
89
14
9
Inset not to scale
Coal Hollow (surface)
AltonCoalfield
KaiparowitsCoalfield
KolobCoalfield
Coal-burning power plant
Coal loadout
Active coal mine
Closed coal mine (not all shown)
191
Kinney #2
Pending mine
Coalfield
Sunnyside
Figure 12. Location and status (at time of publication) of Utah coal mines and associated facilities.
Figure 11. Utah annual coal production and value, 2000–2019.

25Utah Mining 2018
BOX ELDER
TOOELE
CACHE
RICH
WEBER
MORGAN
SUMMITSALTLAKE
UTAH
DAVIS
WASATCH
DUCHESNE
UINTAH
DAGGETT
JUAB
MILLARD
SANPETE
CARBON
EMERYGRAND
SEVIER
BEAVER
IRON
PIUTE WAYNE
GARFIELD
SAN JUAN
KANE
WASHINGTON
0 4020
miles
County boundaryInterstate highway
Kolob
Harmony
Alton
Sego
KaiparowitsPlateau
Henry Mtns.
SalinaCanyon
WasatchPlateau
BookCliffs
San Juan
La Sal
VernalTabby
Emery
Henrys Fork
Grouse Creek
Goose Creek
Wales
Coalville
#
# #
SUFCO
#Lila Canyon
#
Castle Valley#3 and #4
Emery
15
15
80
15
84
80
70
Lost Creek
Mt. Pleasant #
Active coal mine
Economic reservesProspective resourcesMarginal resources
Coal >4 ft thickand <3000 ft deep
#
Coalfields
ZionNP
Capitol R
eef NP
Bryce Canyon NP
Canyonlands N
P
Arches NP
Dinosaur NM
KaiparowitsNM
GrandStaircase
NM
EscalanteCanyons
NM
Shash JaaNM
IndianCreek
NM
Natural Bridges
NM
CedarBreaks
NM
National parkor monument
Sterling
CoalHollow
Skyline
Dugout Canyon
IPP(1800 MW)
Hunter (1577 MW)
Huntington(1037 MW)
Sunnyside* (58 MW)
Bonanza(500 MW)
#
Coal-burningpower plant(capacity)
*Sunnyside burns waste coal
Figure 13. Location of active Utah coal mines and coalfields.

Utah G
eological Survey26
Company Mine County Coalfield 2009 2010 2011 2012 2013 2014 2015 2016 2017 2018 2019*thousand short tons
Canyon Fuel Company, LLC - Wolverine Fuels, LLC1
Dugout Canyon Carbon Book Cliffs 3291 2307 2395 1588 561 676 763 650 626 557 900
Skyline #3 Carbon/Sanpete/Emery2 Wasatch Plateau 2910 3050 2950 1954 3135 4170 4409 4767 4389 3614 4200
SUFCO Sevier Wasatch Plateau 6748 6398 6498 5651 5959 6539 6095 5375 5947 4842 5300
Bronco Utah Operations, LLC3 Emery Emery Emery 1238 999 -- -- 4 -- -- -- 135 442 700
Castle Valley Mining, LLC - Rhino Resource Partners, LP4
Castle Valley #3 Emery Wasatch Plateau -- -- -- -- -- -- 218 170 205 102 600Castle Valley #4 Emery Wasatch Plateau 651 -- 592 1004 875 1,061 757 724 754 893 400
East Mountain Energy - PacifiCorp Deer Creek Emery Wasatch Plateau 3833 2954 3143 3295 2785 2083 15 -- -- -- --
Hidden Splendor Resources, Inc. - America West Resources, Inc.
Horizon Carbon Wasatch Plateau 194 270 370 210 -- -- -- -- -- -- --
West Ridge Resources, Inc. - UtahAmerican Energy, Inc. - Murray Energy Corp.
West Ridge Carbon Book Cliffs 3063 3355 3566 2579 2629 2514 1580 -- -- -- --
UtahAmerican Energy, Inc. - Murray Energy Corp. Lila Canyon Emery Book Cliffs -- 72 157 304 257 335 350 1587 1638 2816 3200
Alton Coal Development, LLC
Coal Hollow Kane Alton -- -- 403 570 747 555 316 671 724 488 400Burton #1 Kane Alton -- -- -- -- -- -- 11 34 -- -- --
Total 21,928 19,405 20,074 17,155 16,953 17,933 14,513 13,978 14,417 13,753 15,700
Source: UGS coal company questionnaires*Forecast1Bowie Resources bought Canyon Fuel from Arch Coal in summer 2013. In late 2018, Bowie changed their name to Wolverine Fuels.22018 production by county: Sanpete = 906,716 tons; Emery = 1,765,410 tons; Carbon = 941,447 tons. 2017 production by county: Sanpete = 43,949 tons; Emery = 136,203 tons; Carbon = 4,208,538 tons. 2009–2016: all production in Carbon.
3Bronco bought the Emery mine from CONSOL Energy in 2015.4Rhino bought the Castle Valley mines from C.W. Mining (Co-op) in summer 2010; mines were formerly called Bear Canyon.
Table 5. Coal production in Utah by coal mine, 2009–2019.

27Utah Mining 2018
mechanics, which makes expansion more difficult. Demand at Utah coal-fired power plants was fairly stable from 2000 to 2015 at about 15.5 million st a year but dropped to less than 12.5 million st in 2016 and has remained at this lower level through 2018. In addition, fuel switching or closure at other U.S. coal-fired power plants outside of Utah has reduced do-mestic demand for Utah coal to near historical lows. However, Utah operators have recently taken advantage of a strengthen-ing foreign export market, sending an estimated 4.6 million st of coal overseas to Asia in 2018, the highest since 1996. With the export market continuing to remain strong, Utah coal pro-duction is expected to increase to about 15.7 million st in 2019.
In 2018, the vast majority of Utah coal, 9.5 million st, was produced from the Wasatch Plateau coalfield; 3.4 million st came from mines in the Book Cliffs coalfield, 0.5 million st from the Alton coalfield, and 0.4 million st from the Emery coalfield (figure 13; table 5). The majority of Utah coal in 2018, 84% (11.6 million st), was produced from federal land, whereas only 1.3% (0.2 million st) was from state-owned land (figure 14). Federal coal production has dominated in Utah since 2011, when the Deer Creek mine’s state-owned Mill
Fork coal tract reverted back to federal ownership after a 22.3 million st coal production threshold was reached. This rever-sion dramatically increased the amount of coal produced on federal land, from 48% in 2011 to 84% in 2012. The remain-der of Utah’s 2018 coal production came from private lands (14.4%, 2.0 million st) at the Castle Valley, Emery, Coal Hol-low, and Skyline mines.
The total amount of Utah coal distributed to the U.S. mar-ket in 2018 was 10.9 million st, about 1 million st less than 2017 (figure 15). As recently as 2008, 24.9 million st of Utah coal was distributed; over 9.2 million st was exported to other states, and 15.7 million st was used in state. In 2018, only 1.9 million st of Utah coal was shipped to other states, while 9.0 million st was used locally. The vast majority of Utah coal, about 80% (8.8 million st), went to the electric utility market mainly within the state (figure 16). Utah coal deliveries to the industrial sector decreased slightly to 2.2 million st in 2018, which is significantly less than peak deliveries of 4.4 million st in 2003. Total annual domestic deliveries of Utah coal in 2019 are expected to remain in the 10 to 11 million st range, reflecting low overall domestic demand.
1980 1985 1990 1995 2000 2005 2010 2015
Thou
sand
Sho
rt To
ns
0
5000
10,000
15,000
20,000
25,000
30,000Federal State County Private Employment (active mines)
Empl
oym
ent a
t act
ive
or re
cent
ly a
ctiv
e m
ines
0
1000
1500
2500
3000
4000
5000
500
2000
3500
4500
Figure 14. Coal production in Utah by land ownership, 1980–2018.
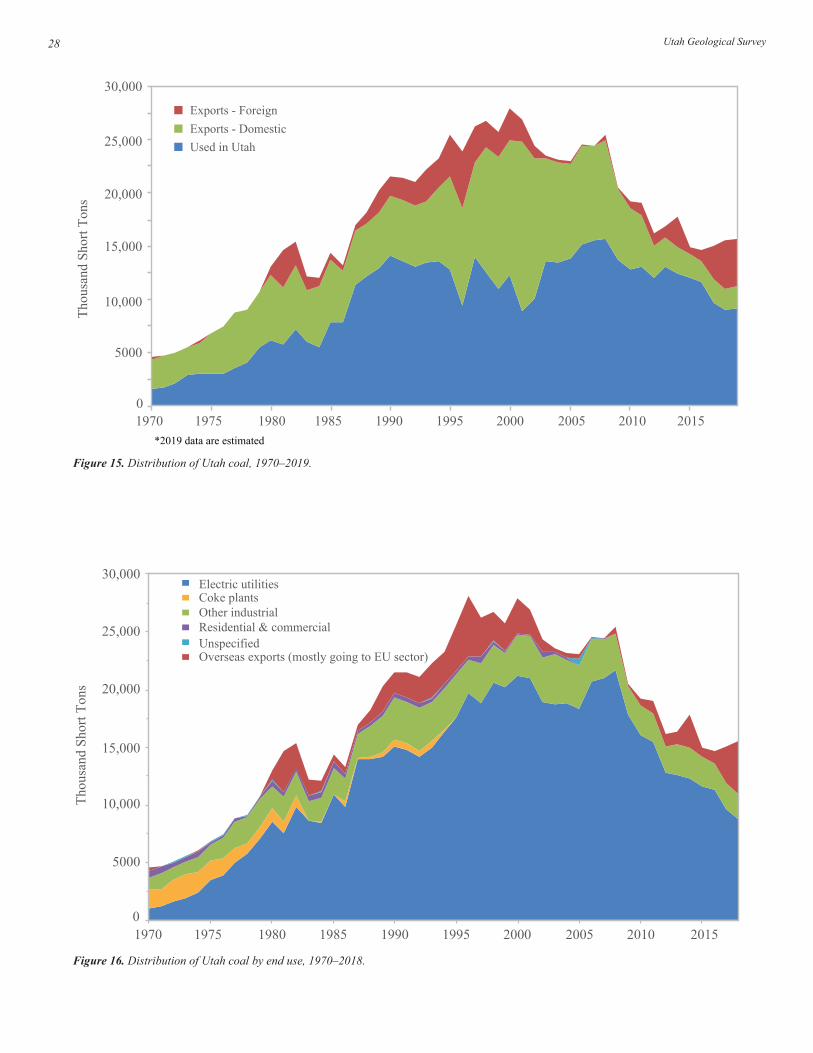
Utah Geological Survey28
Figure 15. Distribution of Utah coal, 1970–2019.
Figure 16. Distribution of Utah coal by end use, 1970–2018.
*2019 data are estimated
5000
10,000
15,000
20,000
25,000
30,000
0
Thou
sand
Sho
rt To
ns
1970 1975 1980 1985 1990 1995 2000 2005 2010 2015
Exports - ForeignExports - DomesticUsed in Utah
5000
10,000
15,000
20,000
25,000
30,000
0
Thou
sand
Sho
rt To
ns
Electric utilitiesCoke plantsOther industrialResidential & commercialUnspecifiedOverseas exports (mostly going to EU sector)
1970 1975 1980 1985 1990 1995 2000 2005 2010 2015

29Utah Mining 2018
The demand for Utah coal has sharply decreased over the past few years as coal-fired power plants have closed or switched to natural-gas-fired generation. Gas overtook coal as the leading fuel for U.S. power plants in 2016, and EIA expects coal to only provide 25% of total U.S. electric gener-ation during the summer of 2019 (U.S. EIA, 2019b). Within Utah, the Carbon coal-fired power plant outside the town of Helper closed in April 2015 because it was cost prohibitive to retrofit the old plant with new EPA-mandated emission-reducing technology. This removed about 600,000 st of coal from the Utah market. Starting in 2016, annual consump-tion of coal at Utah’s coal-fired power plants dropped 19%, a reduction of about 2.8 million st, (excluding the Bonanza plant in the Uinta Basin which is supplied with Colorado coal). Most of this reduction occurred at the Intermountain Power Plant (IPP) near the town of Delta (a reduction of about 1.2 million st) as the City of Los Angeles, the majority owner, has begun to purchase less electricity from the plant as it favors renewable sources or natural gas-fired genera-tion. In fact, Los Angeles has stated it will no longer pur-chase any coal-fired electricity from IPP after its power pur-chase agreement expires in 2025. In addition, as new solar-generated electricity (mostly from California and Nevada, but also from Utah) floods the grid during the day, Utah’s Hunter and Huntington coal-fired power plants have been forced to throttle back their operations during these peak so-lar times, thus consuming less coal (about 500,000 st less at Hunter and 400,000 st less at Huntington). In California and Nevada, both significant past markets for Utah coal, several coal-fired generation plants have closed or converted to natural gas to comply with stricter air-quality standards. In Nevada, for example, the Reid Gardner coal-fired power plant shut down units 1 through 3 in 2014 and shutdown unit 4 in 2017; Utah used to supply up to 1.5 million st of coal to Reid Gardner. In California, several co-generation plants that formerly used Utah coal have shut down or converted to natural gas in recent years. On the industrial side, Utah’s historically largest consumer of coal, Kennecott Utah Cop-per, has converted one of their coal plants to natural gas and has recently announced that it will close the last coal-fire unit in 2019; overall this has removed nearly 500,000 tons from the market.
Foreign exports of Utah coal averaged about 2.9 million st per year in the 1990s, peaking at 5.3 million st in 1996 (figure 15). Beginning in the early 2000s, foreign exports dropped dramatically, with no exports reported in 2007. Starting in 2008, Utah coal exports revived, reaching 2.9 million st in 2014, before dropping again in 2015 to only about 0.7 million st and 1.0 million st in 2016. However, a recently expanding foreign export market has provided new opportunity for Utah coal operators. With diminished port capacity on the west coast of the United States, Utah operators have successfully turned to alternate port facilities (e.g., Guaymas, Mexico) to send their coal overseas. It is estimated that Utah operators could export as much as 4.5 million st in 2019.
For detailed statistics on Utah’s coal industry (including infor-mation previously published in the annual Utah Coal Report), refer to the extensive data tables located on the UGS’s Utah Energy and Mineral Statistics website: https://geology.utah.gov/resources/energy/utah-energy-and-mineral-statistics/.
Exploration and Development Activity
UtahAmerican Energy, Inc. – Murray Energy Corp.
Lila Canyon mine: The Lila Canyon mine is located south of Horse Canyon in the Book Cliffs coalfield in Emery Coun-ty. In spring of 2010, the company finished construction on 1200-foot-long rock slopes and began development work in the Sunnyside coal bed, producing 72,000 st of coal in 2010. Mine development work continued from 2011 through 2015, and total coal production averaged about 300,000 st per year during this time. Coal production increased substantially in 2016, up to 1.6 million st, after the now-closed West Ridge mine’s refurbished longwall mining equipment was installed, and production remained at the 1.6 million st level in 2017. UtahAmerican has aggressively and successfully pursued the foreign export market and as a result has increased produc-tion to 2.8 million st in 2018, with plans to mine about 3.2 million tons in 2019. This increase was also made possible by installing a new longwall mining machine that can cut a thicker seam of coal. Coal is presently mined from federal leases where the merged upper and lower Sunnyside bed is up to 13 ft thick. Current leases at Lila Canyon will support mining for up to 10 more years, with significant reserves in adjacent unleased areas.
Canyon Fuel Company – Wolverine Fuels, LLC
In late 2018, Bowie Resources rebranded and changed their name to Wolverine Fuels, LLC, and moved their corporate headquarters to Sandy, Utah. Wolverine is majority-owned by Galena Private Equity Resources Fund, and Trafigura Trading, LLC is their exclusive marketing agent. Wolverine owns the three Canyon Fuel Company mines in Utah (Dugout, Skyline, and Sufco) and the currently idled Bowie #2 mine in Colorado.
Dugout Canyon mine: In 2012, Dugout operators complet-ed mining the longwall panels in its current mine plan and switched to running a room-and-pillar operation because of the reduction in coal demand. This switch in mining method resulted in a large reduction in coal production, from a high of 4.6 million st in 2005 to only 561,000 st in 2013. Current production is from the Rock Canyon bed and totaled 557,000 st in 2018, using two continuous miners. However, with an increase in coal demand from overseas, Dugout plans to add additional shifts and increase production to about 900,000 st in 2019. Mining will remain in the Rock Canyon until about 2020 when operations will shift back to the previously mined Gilson seam.

Utah Geological Survey30
Skyline mine: Canyon Fuel Company’s Skyline mine, lo-cated in the Wasatch Plateau coalfield, is currently transition-ing their mining operation to the recently leased Flat Canyon federal coal tract in Sanpete County, near the border with Em-ery County, picking up odd short longwall panels on the way. Continuous miners entered Flat Canyon in October 2017 and longwall production is expected to start in late summer 2019. Production in 2018 was down due to this transition, totaling only 3.6 million st from three different counties: 941,000 st in Carbon, 1.8 million in Emery, and 907,000 in Sanpete. Pro-duction is expected to rebound in 2019 to about 4.2 million st, in just Sanpete and Emery Counties. The Flat Canyon tract is estimated to contain up to 50 million st of recoverable coal re-serves in the Lower O’Connor A and B beds, as well as minor reserves in the Flat Canyon bed.
Sufco mine: Sufco is Utah’s largest coal producer and the 15th largest producing underground coal mine in the United States (2017 data). Located in the Wasatch Plateau coalfield, Sufco is also the only active mine in Sevier County. Sufco coal production, from the upper Hiawatha bed, dropped in 2018 to 4.8 million st, 19% less than in 2017, and 39% less than record high production of 7.9 million st achieved dur-ing 2006. Similar to Skyline, the lower production in 2018 is related to underground operations slowly shifting to the newly leased Greens Hollow federal tract, picking up small scattered longwall panels along the way. Full production in Greens Hollow, which contains an estimated 56 million st of recoverable coal, will commence in mid-2019, mostly in the lower Hiawatha bed, and overall production should increase to about 5.3 million st in 2019.
Fossil Rock Resources – Wolverine Fuels, LLC
Cottonwood tract: On December 31, 2007, SITLA held a sale of the Cottonwood Competitive Coal Leasing Unit. The tract was awarded to Ark Land Company, a subsidiary of Arch Coal, Inc., also the former owner of Canyon Fuel Company. Two coal leases were issued, one for 8204 acres covering lands within the 1998 land exchange Cottonwood Coal Tract and the other for 600 acres within an adjacent SITLA sec-tion. In mid-2011, the Cottonwood lease was transferred to Fossil Rock Resources, a subsidiary of PacifiCorp and Rocky Mountain Power, as part of a settlement of litigation between the two companies. The Cottonwood tract is adjacent to Paci-fiCorp’s existing, but inactive, Train Mountain federal lease. Total recoverable coal in the Hiawatha bed for the combined leases is estimated at about 49 million st. Following the an-nouncement of the closure of the Deer Creek mine in early 2015, Fossil Rock Resources and its coal reserves were sold to Bowie Resources, now called Wolverine Fuels.
Bronco Utah Operations, LLC
Emery mine: Bronco Utah Operations bought the Emery mine from CONSOL Energy in December 2015. The Emery
mine produced about 1 million st annually from the Ferron Sandstone I bed from 2005 through 2010, then CONSOL idled the mine due to low coal demand. Bronco developed new portals into the I bed in early 2017, producing 135,000 st that year and ramping up to 442,000 st in 2018. Produc-tion is expected to increase again in 2019 to about 700,000 st. The thick I seam, up to 12 ft, contains significant reserves to the south and could support mining for many years. Cur-rently coal is only produced from private land, but operators recently applied for a federal right-of-way to provide access to additional private land areas with better mining conditions.
Rhino Resource Partners, LP
Castle Valley mines: Rhino purchased the Bear Canyon mines from C.W. Mining (Co-op) in 2010 and changed the mines’ name to Castle Valley. Between 2011 and 2014, opera-tors produced a total of 3.5 million st from the Tank bed (#4 mine). Production restarted in the Bear bed (#3 mine) in 2015, and in 2018, production commenced in the Blind bed (also #3 mine). Production totaled 996,000 st in 2018: 893,000 st from the Tank (#4), 75,000 st from the Bear (#3), and 27,000 st from the Blind (#3). Reserves in the Tank will be depleted by late summer 2019 and the #4 mine will be closed. Production will continue in the #3 mine in the Bear and Blind beds. Total production for both mines and all three seams is expected to remain near the 1.0 million st level in 2019. Rhino recently acquired the now-closed Deer Creek mine’s waste pile facility near the mouth of Huntington Canyon and plans to construct an air-jig cleaning plant at the mine to reduce ash content.
Alton Coal Development
Coal Hollow mine: In 2011, Alton Coal Development began production at a new coal mine in the Alton coalfield in south-ern Utah’s Kane County. The Coal Hollow mine produces subbituminous Dakota Formation coal from the Smirl bed, which averages about 10,000 Btu/ lb, about 1% sulfur, and 8% ash. Surface-mining production at the company’s Coal Hollow mine on private property peaked in 2013 at 747,000 st before decreasing to 316,000 st in 2015 as the reserves on the southern property were depleted. In the spring of 2014, highwall mining began in the mine’s open pits in an effort to recover coal with less surface disturbance. Also, during this time, permitting was underway to begin mining the northern fee tract, which commenced production in 2016. After op-erations moved to the north, the mine produced 671,000 st in 2016, 724,000 st in 2017, and 488,000 in 2018.
Alton Coal’s application to acquire an adjacent federal coal lease, a process begun in 2004, was delayed when the BLM de-clared a federal coal leasing moratorium in January 2016. After the presidential election and a change in federal administration, the BLM lifted the coal leasing moratorium in March 2017, providing a new opportunity for Alton Coal to pursue a lease on federal coal adjacent to its private leases. This federal lease was

31Utah Mining 2018
awarded in late 2018 and mine permitting plans are currently underway. Alton Coal will exhaust the reserves on the private land in summer 2019 and will commence surface mining on the federal land shortly thereafter, assuming permits are in place and any litigation is settled. Operators plan to mine via surface methods to a specified stripping ratio and also return to high-wall mining, but this time with an auger system. Production in 2019 is expected to remain low at about 400,000 st as this transition takes place, but could ramp up to 1 million st in 2020.
After experiencing difficulty producing coal using the highwall mining machine in 2014, Alton Coal commenced underground room and pillar mining in late 2015 at the Burton #1 mine. To-tal production from the underground mine in 2015 and 2016 was only 45,000 st. Burton was idled in mid-2016 after there were problems establishing an approved roof control program. With the acquisition of the federal lease, the Burton mine will be abandoned to focus on surface mining.
Coal Energy Group 3, LLC
Kinney #2 mine: The first permit application for the proposed Kinney #2 mine was submitted in 2008 by Carbon Resources, LLC, but several deficiencies and other issues delayed progress and the application file was closed several years later. Coal Energy Group 3, LLC, a related company, re-submitted the ap-plication to DOGM in November 2018. The proposed Kinney #2 underground mine would be located on 452 acres, a com-bination of private and Carbon County land, located about a half mile north of the town of Scofield, Utah. The proposed operation would use continuous miners to produce from the Hi-awatha coal bed, which averages 8 ft thick and is under about 700 ft of cover, with plans to mine about 800,000 st a year. In March 2019, DOGM returned the application with the require-ment that the company address several deficiencies.
UNCONVENTIONAL FUELS
Oil Shale
The upper Green River Formation in the Uinta Basin of Utah contains one of the largest deposits of oil shale in the world. The oil shale deposit contains an estimated in-place resource of 1.3 trillion bbls (USGS Oil Shale Assessment Team, 2011) and a potential economic resource of 77 billion bbls (Vanden Berg, 2008). The richest Green River oil shale horizon is the Mahogany zone, where individual beds can yield up to 80 gal-lons of oil per ton of rock. The Mahogany zone is 70 to 120 ft thick and is accessible via extensive outcrops along the east-ern and southern flanks of the basin.
Exploration and Development Activities
The outcrop accessibility, low dip, and shallow cover of Utah oil shale deposits make conventional surface/under-
ground mining and surface retort the preferred technology to recover oil from the shale. Currently, at least four companies are pursuing oil shale development in Utah: Enefit American Oil, Red Leaf Resources, TomCo Energy, and Dragon Shale.
Enefit American Oil is an Estonian company that has land holdings of over 27,000 acres in the Uinta Basin (figure 7), including 18,000 acres of private land, 4000 acres of state leases, and 5000 acres of federal land. On the southern, pri-vate part of their property, Enefit seeks to develop a full-scale oil shale operation consisting of a surface and/or un-derground mine, surface retorts and circulating fluidized bed combustion units, and a shale oil upgrader. During 2017, the BLM extended Enefit’s Research Development and Dem-onstration lease on 160 acres of federal land. In September 2018, Enefit received approval from the BLM for an impor-tant right-of-way that will allow development of a utility corridor across BLM ground to their private property. Enefit had been pursuing the right-of-way since 2012.
Red Leaf Resources is a Utah company with multiple state oil shale leases in the southeastern part of the Uinta Basin (figure 7). Red Leaf has developed a retort process called EcoShale technology. The process involves surface mining oil shale, retorting it in a stationary bed capsule, and return-ing the spent shale to the mine pit for reclamation. Their process of heating the shale was tested in a pilot project at the Seep Ridge lease in 2008 and 2009. This successful test has provided the basis for subsequent testing and design im-provements. Red Leaf has received a large-mine operating permit for the Seep Ridge site and their current goal is to begin construction of a 10,000 barrel-per-day project at the Seep Ridge site by 2021 with first production in 2023.
TomCo Energy is a United Kingdom-based oil shale com-pany with 15,488 acres of SITLA leases in the Uinta Basin (figure 7). In 2017, TomCo set up TurboShale Inc., an oil shale technology company seeking to develop a relatively low-cost, radio-frequency-heating technology for oil extrac-tion. As of early 2019, TomCo is preparing for field testing of TurboShale’s technology at their Holliday Block. In March 2019, TomCo released an oil resource estimation prepared by SRK Consulting under the guidelines of the 2018 Petroleum Resources Management System for two of their leases which cover an area of 2919 acres, which includes their Holliday Block. SRK estimated a contingent resource (2C) of 131 mil-lion barrels and a prospective resource (2U) of 443 million barrels (McConachie and Kushkarina, 2019).
Another company investigating Utah’s oil shale resources is Dragon Shale. Instead of producing liquid fuels, they are fo-cusing on producing organic compounds from the shale for use in higher value markets such as personal care products, adhesives, or drilling fluids. They intend to use modular plants to process oil shale on site. Dragon Shale reportedly produced some kerogen oil from a prototype during 2018.

Utah Geological Survey32
Oil Sand
North America has the largest oil sand (also known as tar sand or bituminous sand) resources in the world, the vast ma-jority of which are in Canada. Utah oil sand deposits, though small compared to Canadian resources, contain the largest resource in the United States. The deposits hold roughly 23 to 29 billion barrels of in-place bitumen. The Uinta Basin of northeast Utah has 25 oil sand deposits containing an es-timated 9 to 11 billion bbls. Twenty-two oil sand deposits containing another roughly estimated 14 to 18 billion bbls are in the central-southeast part of the state, and six minor deposits containing negligible oil occur in other parts of the state (Ritzma, 1979). The bitumen contained in these depos-its originated in the same way as oil found in conventional oil fields but has subsequently been exposed to surface or near-surface conditions allowing release of volatiles and biodegradation. The bitumen deposits are generally devel-oped in permeable sandstones, where the oil migrated and was stratigraphically or structurally trapped. Utah’s major oil sand deposits individually have aerial extents ranging from 20 to over 250 square miles, as many as 13 pay zones, gross thickness ranging from 10 to more than 1000 ft, and overburden thickness ranging from zero to over 500 ft. Simi-lar to oil shale, conventional mining methods would likely be used to extract oil sand.
With the relatively low crude oil prices of the past few years and the relative ease of recent oil production from tight oil reservoirs, there is less incentive for advancing bitumen ex-traction and upgrading techniques to move Utah’s oil sand toward successful and sustainable development. Challenges facing oil sand extraction in Utah have included permitting and legal challenges, process efficiency, site accessibility, adequate infrastructure, water availability, environmental concerns, and the heterogeneity of reservoir deposits. How-ever, despite these challenges and competition from tradi-tional drilling, some companies continue to pursue develop-ment of Utah’s oil sand deposits.
Exploration and Development Activities
USO (Utah) LLC (formerly US Oil Sands) holds extraction rights on a large group of SITLA leases within the PR Springs oil sand deposit in the southern Uinta Basin (figure 7). In 2011 and 2012, the company drilled and defined a discovered resource of 184 million barrels, as outlined in an NI 51-101 report covering 5930 acres of their leased land. An additional 26,075 acres of leased land holds future exploration oppor-tunities. Within a portion of the PR Springs Project area, the company acquired all the necessary permits for development of a surface mine/solvent extraction project on which work commenced in the second half of 2013. In 2017, financial challenges, including a drop in crude oil prices, caused the Canadian company to go into receivership. In 2018, the com-pany was sold and took on a new name. Minimal development of the project has occurred for the last few years.
Another Utah oil sand deposit that consistently generates interest is Asphalt Ridge near Vernal, Utah. Several com-panies have tried to develop oil sand operations in the area, but only limited commercial activity has occurred. During 2017, Petroteq Energy (formerly MCW Energy Group until mid-2017) relocated and upgraded its processing plant to a mine site at the former Temple Mountain area, which is on the southeast end of Asphalt Ridge (figure 7). The plant, which employs a solvent-based extraction process, was upgraded to a capacity of 1000 barrels of oil per day. Petroteq reported that they produced limited quantities of oil in 2018 and early 2019. Chapman and others (2018) prepared an NI 51-101 compli-ant resource estimate of Petroteq’s lands indicating that their mineable contingent resources (2C) are 87.5 million stock tank barrels of oil. Vivakor, another company interested in developing oil sand at Asphalt Ridge, is similarly pursuing bitumen extraction via solvents and mobile production units. In early 2019, Vivakor leased 1440 acres of land from SITLA having oil sand resources.
ACKNOWLEDGMENTS
This report has been compiled from a wide assortment of published and unpublished sources. In addition, we particu-larly appreciate the cooperation and assistance of Alton Coal Development, BLM (Opie Abeyta), Bronco Utah Operations, DOGM (Paul Baker and April Abate), Energy Fuels Inc. (Lo-gan Shumway), Freeport-McMoran (Matt Wetzel), Geomin-einfo (David Briggs), Liberty Gold (Pete Shabestari), Lisbon Valley Mining (Lantz Indergard and Alysen Tarrant), New-mont Mining (Jeff Nicholes), Rhino Energy, Rio Tinto Explo-ration (Duane Olson and Brian Paull), SITLA (Jerry Mans-field), Tamra Mining (Tom Holcomb), UtahAmerican Energy, and Wolverine Fuels.
REFERENCES
Beahm, D.L., and Anderson, A.C., 2008, Frank M Uranium Project 43-101 mineral resource report Garfield County, Utah USA: unpublished Canadian National Instrument (NI) 43-101 technical report prepared for Uranium One Americas, 73 p.
Beahm, D.L., and McNulty, T.P., 2016, Velvet-Wood uranium project, preliminary economic assessment, National In-strument 43-101, Utah, USA: unpublished Canadian Na-tional Instrument (NI) 43-101 technical report prepared for Anfield Resources, Inc., 122 p.
Boden, T., and Tripp, B.T., 2012, Gilsonite veins of the Uinta Basin, Utah: Utah Geological Survey Special Study 141, 50 p., 1 plate, CD.
Brebner, J., Lefaivre, A., Bairos, D., Laxer, C., Henchel, L.D., Reinke, R., and Ennis, S., 2018, NI 43-101 technical report summarizing the feasibility study for the Sevier

33Utah Mining 2018
Playa potash project, Millard County, Utah: unpublished Canadian National Instrument (NI) 43-101 technical re-port prepared for Crystal Peak Minerals Inc., 338 p.
Chapman, C.W., Sakatch, R.D., and Howe, R.J., 2018, Evaluation of contingent resources, Asphalt Ridge, Utah, owned by Petroteq Energy Inc., Online: https://content.equisolve.net/_e9d0d40d6cff4664e9510fcf2c3f3c12/petroteq/db/207/2256/pdf/Report+OSB.pdf, accessed May 2019.
Clark, J., 2019, The 2018 year in gold recap, and what it might forecast for 2019: Online, https://goldsilver.com/blog/2018-gold-snapshot-and-what-it-hints-about-2019/, accessed April 2019.
Dyer, T.L, Tietz, P.G., and Austin, J.B, 2014, Technical report on the West Desert Zinc-Copper-Indium-Magnetite Proj-ect, preliminary economic assessment, Juab County, Utah: unpublished Canadian National Instrument (NI) 43-101 technical report prepared for InZinc Mining Ltd., 210 p.
enCore Energy Corp., 2019, Corporate Presentation: Online, https://www.encoreenergycorp.com/_resources/presentations/presentation.pdf, accessed June 2019.
Energy Fuels Inc., 2018, United States Securities and Ex-change Commission form 10-K: unpublished corporate report filed with the USSEC, 290 p.
Fortier, S.M., Nassar, N.T., Lederer, G.W., Brainard, J., Gam-bogi, J., and McCullough, E.A., 2018, Draft critical min-eral list—Summary of methodology and background information—U.S. Geological Survey technical input document in response to Secretarial Order No. 3359: U.S. Geological Survey Open-File Report 2018-1021, 26 p.
International Molybdenum Association, undated, Molybdenum facts and figures: Online, https://www.imoa.info/molyb-denum-media-centre/facts-and-figures.php, accessed April 2019.
Kerr, S.B., Todd, J.N., and Malhotra, D., 2017, The Blawn Mountain project updated prefeasibility report, revised, Beaver County, Utah: unpublished Canadian National In-strument (NI) 43-101 technical report prepared for Potash Ridge Corporation, variously paginated.
Krahulec, K., 2018, Utah mining districts: Utah Geological Survey Open-File Report 695, 196 p., 1 plate.
Lane, T., Katsura, K., Gunesch, K., and Mortiz, R., 2017, Amended technical report and 2017 mineral resource Gold Springs Project: unpublished Canadian National Instrument (NI) 43-101 technical report prepared for TriMetals Mining Inc., 217 p.
Laramide Resources, Ltd., 2006, Annual Report 2005: unpub-lished annual report filed with SEDAR, 44 p.
Lederer, G.W., Foley, N.K., Jaskula, B.W., and Ayuso, R.A., 2016, Beryllium—a critical mineral commodity—re-source, production, and supply chain: U.S. Geological Survey Fact Sheet 2016-3081, 4 p.
Lombrana, L.M., and Farchy, J., 2019, A million tonnes of copper is on the way—it may not be enough: Online, http://www.mining.com/web/million-tons-copper-on-the-way-may-not-be-enough/, accessed April 2019.
Materion, 2019, Materion 2018 annual report: Online, https://investor.materion.com/static-files/c3f9e9fb-24cc-4bfc-a6cc-cb3397ee71cf, accessed April 2019.
McConachie, B., and Kushkarina, A., 2019, Independent competent person’s report and resource estimation for oil shale exploration assets held by TomCo Energy plc: Online, https://tomcoenergy.com/app/uploads/2019/04/TCO001_Oil-Shale-Resource-Estimation_Rev4-1.pdf, accessed May 2019.
McCrae, M.A., 2018, Early stage copper projects have grades one-third below operating mines: Online, http://www.mining.com/copper-supply-deficit-worse-think/, accessed April 2019.
Mudd, G.M., and Jowitt, S.M., 2018, Growing global copper resources, reserves, and production—discovery is not the only control on supply: Economic Geology, v. 113, no. 6, p. 1235–1267.
Popovic, A., and Thomas, W., 2019, Vanadium prices face a turbulent 2019: Online, https://www.prnewswire.com/news-releases/cru-vanadium-prices-face-a-turbulent-2019-300826129.html, accessed April 2019.
Prospectors and Developers Association of Canada, 2019, State of mineral finance 2019: At the crossroads, unpublished technical report for PDAC Annual Convention, 40 p.
Redfern, R.R., 2016, Technical report on Thomson Knolls property, Millard County, Utah, USA: unpublished Ca-nadian National Instrument (NI) 43-101 technical report prepared for BCM Resources Corporation, 89 p.
Rio Tinto, 2019, 2018 Annual report: Online, http://www.riotinto.com/documents/RT_2018_annual_report.pdf, accessed April 2019.
Ritzma, H.R., 1979, Oil-impregnated rock deposits of Utah: Utah Geological and Mineral Survey Map 47, scale 1:750,000.
Silver Institute, undated, Silver essentials: Online, https://www.silverinstitute.org/silver-essentials/, accessed April 2019.
SRK Consulting, 2018, Preliminary economic assessment and independent technical report for the Goldstrike Project, Washington County, Utah USA: unpublished Canadian National Instrument (NI) 43-101 technical report pre-pared for Liberty Gold Corp., 246 p.
Stedman, A., and Green, K.P., 2019, Fraser Institute annual survey of mining companies, 2018: Online, https://www.fraserinstitute.org/sites/default/files/annual-survey-of-mining-companies-2018.pdf, accessed May 2019.
Tripp, T.G., 2009, Production of magnesium from Great Salt Lake, Utah USA: Natural Resources and Environmental Issues, v. 15, Article 10, p. 55–61.

Utah Geological Survey34
U.S. Energy Information Administration, 2019a, Quarterly Coal Report: Online, https://www.eia.gov/coal/distribu-tion/quarterly/, accessed June 2019.
U.S. Energy Information Administration, 2019b, EIA expects less electricity to come from coal this summer as natural gas, renewables rise: Online, https://www.eia.gov/today-inenergy/detail.php?id=39412#, accessed June 2019.
U.S. Geological Survey, 2019a, Mineral commodity sum-maries 2019: Online, https://prd-wret.s3-us-west-2.ama-zonaws.com/assets/palladium/production/atoms/files/mcs2019_all.pdf, accessed May 2019.
U.S. Geological Survey, 2019b, Crushed stone and sand and gravel in the fourth quarter 2018: Online, https://prd-wret.s3-us-west-2.amazonaws.com/assets/palladium/production/s3fs-public/atoms/files/mis-2018q4-stonc.pdf, accessed May 2019.
U.S. Geological Survey Oil Shale Assessment Team, 2011, Oil shale resources in the Eocene Green River Forma-tion, greater Green River Basin, Wyoming, Colorado, and Utah: U.S. Geological Survey Data Series 69-DD, no pagination.
Vanden Berg, M.D., 2008, Basin-wide evaluation of the up-permost Green River Formation’s oil-shale resource, Uinta Basin, Utah and Colorado: Utah Geological Survey Special Study 128, 19 p., 8 plates, CD.
Western Uranium Corporation, 2017, United States Securities and Exchange Commission Form 10: unpublished corpo-rate report filed with the USSEC, 109 p.