Embed Size (px)
Citation preview
1

2
Utah Natural Hazards Handbook
Coordinated by
Utah Division of Homeland Security
Author Agencies
Utah Geological Survey National Weather Service Salt Lake City Utah Department of Natural Resources
Utah Department of Environmental Quality Forest Service Utah Avalanche Center
Utah Division of Water Resources Utah Division of Water Rights
Utah Division of Forestry, Fire, and State Lands Utah Division of Homeland Security
This Handbook was Completed and Distributed October 2008
3
ACKNOWLEDGEMENTS
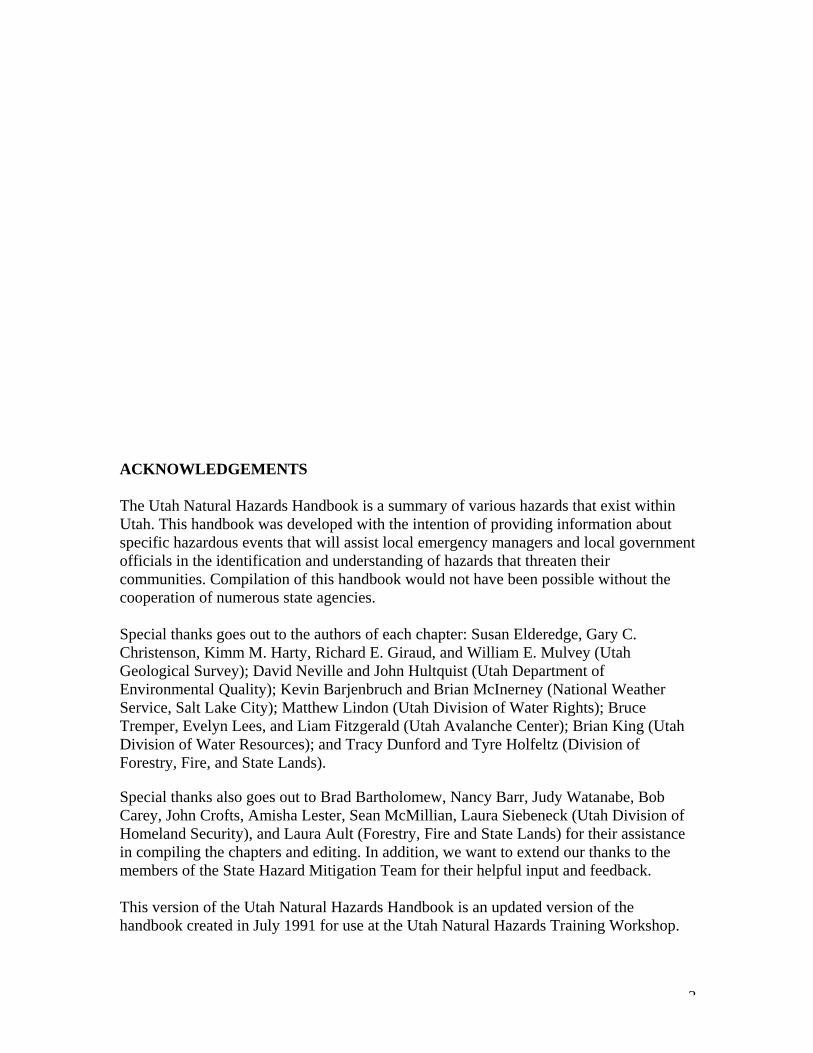
The Utah Natural Hazards Handbook is a summary of various hazards that exist within Utah. This handbook was developed with the intention of providing information about specific hazardous events that will assist local emergency managers and local government officials in the identification and understanding of hazards that threaten their communities. Compilation of this handbook would not have been possible without the cooperation of numerous state agencies. Special thanks goes out to the authors of each chapter: Susan Elderedge, Gary C. Christenson, Kimm M. Harty, Richard E. Giraud, and William E. Mulvey (Utah Geological Survey); David Neville and John Hultquist (Utah Department of Environmental Quality); Kevin Barjenbruch and Brian McInerney (National Weather Service, Salt Lake City); Matthew Lindon (Utah Division of Water Rights); Bruce Tremper, Evelyn Lees, and Liam Fitzgerald (Utah Avalanche Center); Brian King (Utah Division of Water Resources); and Tracy Dunford and Tyre Holfeltz (Division of Forestry, Fire, and State Lands).
Special thanks also goes out to Brad Bartholomew, Nancy Barr, Judy Watanabe, Bob Carey, John Crofts, Amisha Lester, Sean McMillian, Laura Siebeneck (Utah Division of Homeland Security), and Laura Ault (Forestry, Fire and State Lands) for their assistance in compiling the chapters and editing. In addition, we want to extend our thanks to the members of the State Hazard Mitigation Team for their helpful input and feedback. This version of the Utah Natural Hazards Handbook is an updated version of the handbook created in July 1991 for use at the Utah Natural Hazards Training Workshop.
4
TABLE OF CONTENTS
Introduction ……………………………………………………………...... Laura Siebeneck, Utah Division of Homeland Security
1
Earthquakes ……………...……………………………………………… Sandra N. Eldredge, Utah Geological Survey Gary C. Christenson, Utah Geological Survey
3
Landslides ………………………………………………………………… Sandra N. Eldredge, Utah Geological Survey Kimm M. Harty, Utah Geological Survey Richard E. Giraud, Utah Geological Survey
16
Problem Soils and Rock …………………………………………………... Sandra N. Eldredge, Utah Geological Survey William E. Mulvey, Utah Geological Survey Gary C. Christenson, Utah Geological Survey
26
Radon Gas …………………………………………………………………. David Neville, Utah Department of Environmental Quality John Hultquist, Utah Department of Environmental Quality
36
Weather Hazards: Lightning, Severe Thunderstorms, and Winter Storms Kevin Barjenbruch, National Weather Service Salt Lake City Brian McInerney, National Weather Service Salt Lake City
45
Floods………………………………………………………………………... Kevin Barjenbruch, National Weather Service Salt Lake City Brian McInerney, National Weather Services Salt Lake City Judy Watanabe, Utah Division of Homeland Security Laura Siebeneck, Utah Division of Homeland Security
58
Dam Safety and Risk ……………………………………………………… Matthew Lindon, Utah Division of Water Rights
68
Snow Avalanche …………………………………………………………… Bruce Tremper, Utah Avalanche Center Evelyn Lees, Utah Avalanche Center Liam Fitzgerald, Utah Avalanche Center
88
Drought …………………………………………………………………….. Brian King, Utah Division of Water Resources.
95
Wildfire ……………………………………………………………………. Tracy Dunford, Division of Forestry, Fire, and State Lands Tyre Holfeltz, Division of Forestry, Fire, and State Lands
109
Appendices Glossary ……………………………………………………………… Selected List of Agencies …………………………………………….
119 130
1
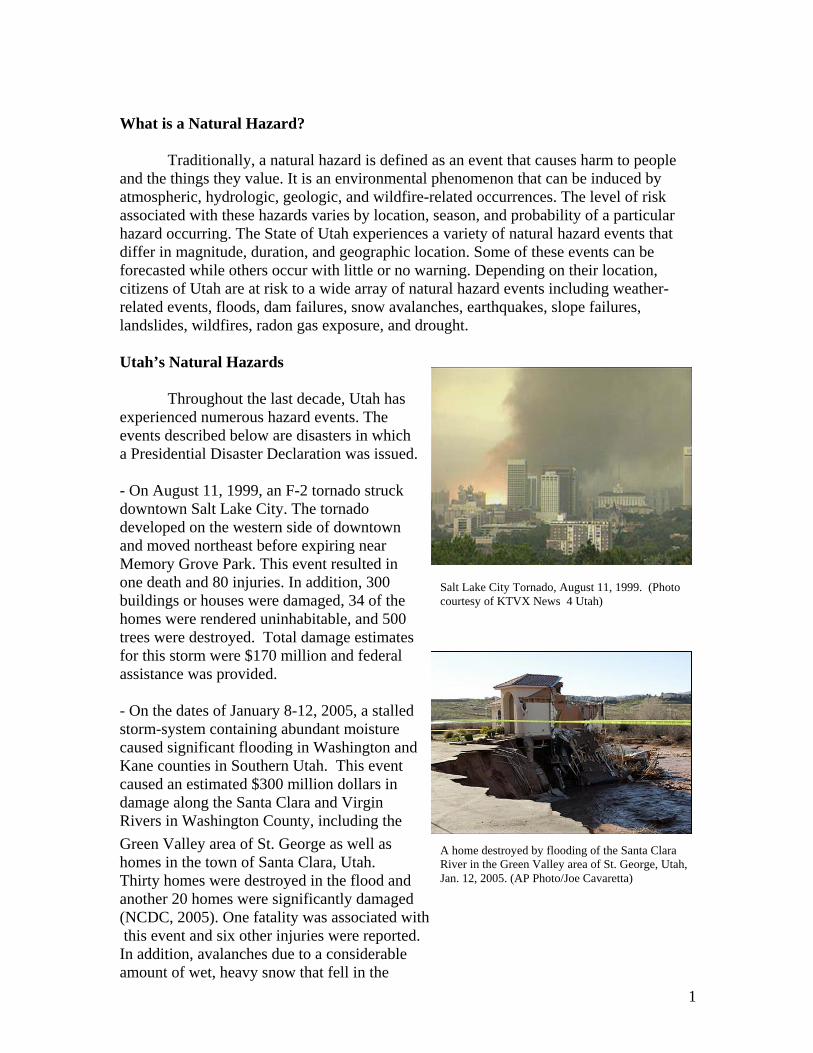
A home destroyed by flooding of the Santa Clara River in the Green Valley area of St. George, Utah, Jan. 12, 2005. (AP Photo/Joe Cavaretta)
What is a Natural Hazard?
Traditionally, a natural hazard is defined as an event that causes harm to people and the things they value. It is an environmental phenomenon that can be induced by atmospheric, hydrologic, geologic, and wildfire-related occurrences. The level of risk associated with these hazards varies by location, season, and probability of a particular hazard occurring. The State of Utah experiences a variety of natural hazard events that differ in magnitude, duration, and geographic location. Some of these events can be forecasted while others occur with little or no warning. Depending on their location, citizens of Utah are at risk to a wide array of natural hazard events including weather-related events, floods, dam failures, snow avalanches, earthquakes, slope failures, landslides, wildfires, radon gas exposure, and drought. Utah’s Natural Hazards
Throughout the last decade, Utah has experienced numerous hazard events. The events described below are disasters in which a Presidential Disaster Declaration was issued. - On August 11, 1999, an F-2 tornado struck downtown Salt Lake City. The tornado developed on the western side of downtown and moved northeast before expiring near Memory Grove Park. This event resulted in one death and 80 injuries. In addition, 300 buildings or houses were damaged, 34 of the homes were rendered uninhabitable, and 500 trees were destroyed. Total damage estimates for this storm were $170 million and federal assistance was provided. - On the dates of January 8-12, 2005, a stalled storm-system containing abundant moisture caused significant flooding in Washington and Kane counties in Southern Utah. This event caused an estimated $300 million dollars in damage along the Santa Clara and Virgin Rivers in Washington County, including the Green Valley area of St. George as well as homes in the town of Santa Clara, Utah. Thirty homes were destroyed in the flood and another 20 homes were significantly damaged (NCDC, 2005). One fatality was associated with this event and six other injuries were reported. In addition, avalanches due to a considerable amount of wet, heavy snow that fell in the
Salt Lake City Tornado, August 11, 1999. (Photo courtesy of KTVX News 4 Utah)
2
higher mountain elevations during these storms also resulted in two fatalities. A Presidential Disaster Declaration was declared February 1, 2005. - Between April 28, 2005 until June 29, 2005, frequent rainfall events, warm spring temperatures, and abundant snowpack melting at accelerated rates resulted in significant flooding and landslide events in nine Utah counties and two Indian Reservations. Peak discharge in the Little Bear River exceeded the 100-year recurrence interval. Large peak discharges in spring of 2005 in the Duchesne and Sevier River basins were the result of near record snowpacks (USGS, 2005). Total damage resulting from the flooding and landslide incidents are estimated to be over 2.9 million dollars. No deaths have been attributed to the flooding and landslide events, though there was substantial damage to public and private property, roads, and bridges. In addtion, concerns of health risks such a vector born diseases transmitted by mosquitoes arose. A Presidential Disaster Declaration was declared on August 1, 2005 and included Beaver, Box Elder, Iron, Kane, Sevier, Tooele, Uintah, and Wasatch counties and the Uintah and Ouray Indian Reservations.
How to Reduce Risks
As demonstrated above, losses associated with natural hazards can be costly. Efforts can be made to reduce the amount of losses sustained to a community prior to the onset of the disaster. While many natural hazards cannot be avoided, damage to property, infrastructure, and loss of life can be reduced through effective implementation of mitigation strategies.
The Division of Emergency Services and Homeland Security Hazard Mitigation Section is working with local communities, governments, and businesses to develop and promote hazard mitigation activities in the state. Efforts include active participation and support of the Utah Earthquake Preparedness Information Center (EPICenter) which promotes seismic safety statewide through community outreach programs, Utah Seismic Safety Commission, National Flood Insurance Program, Hazard Mitigation Grant Program and the Pre-Disaster Mitigation Program. The Homeland Security website includes information about specific hazard mitigation programs, hazards specific to Utah, mitigation publications, The State hazard mitigation Plan, and links to other hazard mitigation-related web sites. This site can be found at the following address: http://publicsafety.utah.gov/homelandsecurity/naturalhazards.html.
Purpose and Use of the Handbook
This handbook is comprised of nine chapters, each related to a specific natural hazard and one technological hazard (dam failure). The chapters were written by experts from various Utah agencies and compiled by the Utah Division of Homeland Security. The goal of this handbook is to provide a useful synthesis of natural hazards in Utah that can be used by local government officials (elected officials, public works personnel, land-use planners, etc.) as well as local emergency managers to better understand and identify what natural hazards pose greatest risk to their communities.
3
EARTHQUAKES
Sandra N. Eldredge and Gary E. Christenson Utah Geological Survey
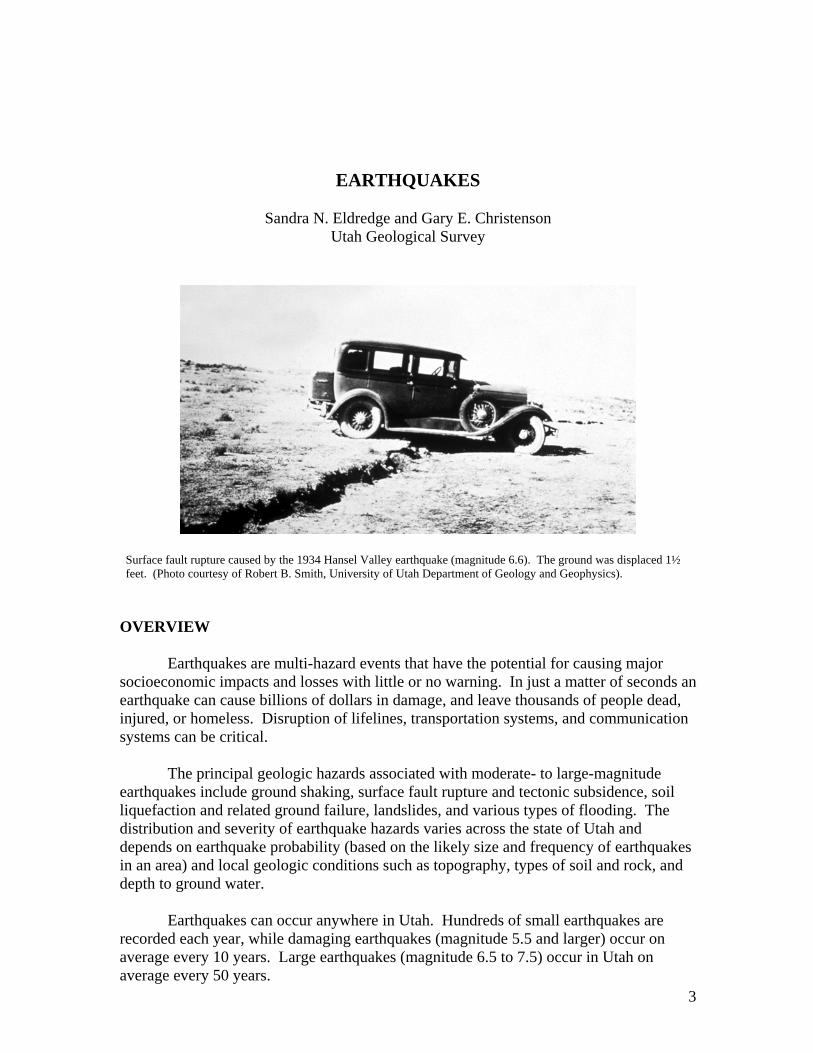
Surface fault rupture caused by the 1934 Hansel Valley earthquake (magnitude 6.6). The ground was displaced 1½ feet. (Photo courtesy of Robert B. Smith, University of Utah Department of Geology and Geophysics).
OVERVIEW
Earthquakes are multi-hazard events that have the potential for causing major socioeconomic impacts and losses with little or no warning. In just a matter of seconds an earthquake can cause billions of dollars in damage, and leave thousands of people dead, injured, or homeless. Disruption of lifelines, transportation systems, and communication systems can be critical.
The principal geologic hazards associated with moderate- to large-magnitude earthquakes include ground shaking, surface fault rupture and tectonic subsidence, soil liquefaction and related ground failure, landslides, and various types of flooding. The distribution and severity of earthquake hazards varies across the state of Utah and depends on earthquake probability (based on the likely size and frequency of earthquakes in an area) and local geologic conditions such as topography, types of soil and rock, and depth to ground water.
Earthquakes can occur anywhere in Utah. Hundreds of small earthquakes are recorded each year, while damaging earthquakes (magnitude 5.5 and larger) occur on average every 10 years. Large earthquakes (magnitude 6.5 to 7.5) occur in Utah on average every 50 years.
4
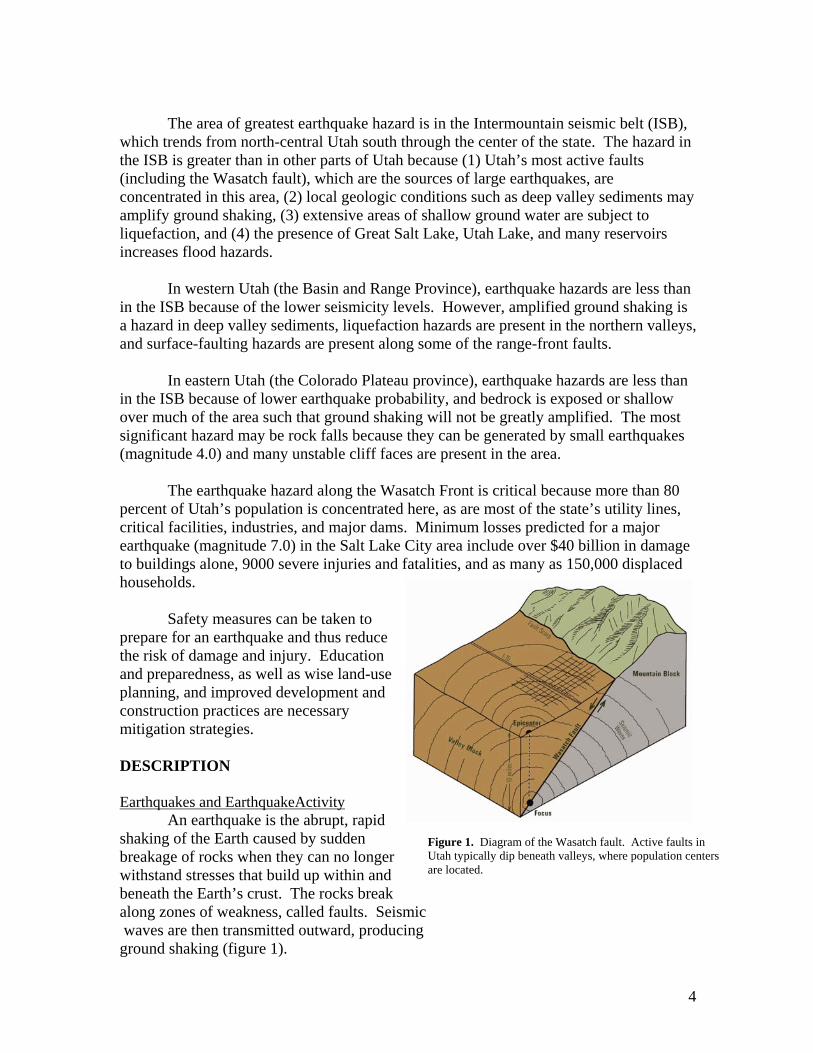
Figure 1. Diagram of the Wasatch fault. Active faults in Utah typically dip beneath valleys, where population centers are located.
The area of greatest earthquake hazard is in the Intermountain seismic belt (ISB),
which trends from north-central Utah south through the center of the state. The hazard in the ISB is greater than in other parts of Utah because (1) Utah’s most active faults (including the Wasatch fault), which are the sources of large earthquakes, are concentrated in this area, (2) local geologic conditions such as deep valley sediments may amplify ground shaking, (3) extensive areas of shallow ground water are subject to liquefaction, and (4) the presence of Great Salt Lake, Utah Lake, and many reservoirs increases flood hazards.
In western Utah (the Basin and Range Province), earthquake hazards are less than in the ISB because of the lower seismicity levels. However, amplified ground shaking is a hazard in deep valley sediments, liquefaction hazards are present in the northern valleys, and surface-faulting hazards are present along some of the range-front faults.
In eastern Utah (the Colorado Plateau province), earthquake hazards are less than in the ISB because of lower earthquake probability, and bedrock is exposed or shallow over much of the area such that ground shaking will not be greatly amplified. The most significant hazard may be rock falls because they can be generated by small earthquakes (magnitude 4.0) and many unstable cliff faces are present in the area.
The earthquake hazard along the Wasatch Front is critical because more than 80 percent of Utah’s population is concentrated here, as are most of the state’s utility lines, critical facilities, industries, and major dams. Minimum losses predicted for a major earthquake (magnitude 7.0) in the Salt Lake City area include over $40 billion in damage to buildings alone, 9000 severe injuries and fatalities, and as many as 150,000 displaced households.
Safety measures can be taken to prepare for an earthquake and thus reduce the risk of damage and injury. Education and preparedness, as well as wise land-use planning, and improved development and construction practices are necessary mitigation strategies. DESCRIPTION Earthquakes and EarthquakeActivity
An earthquake is the abrupt, rapid shaking of the Earth caused by sudden breakage of rocks when they can no longer withstand stresses that build up within and beneath the Earth’s crust. The rocks break along zones of weakness, called faults. Seismic waves are then transmitted outward, producing ground shaking (figure 1).
5
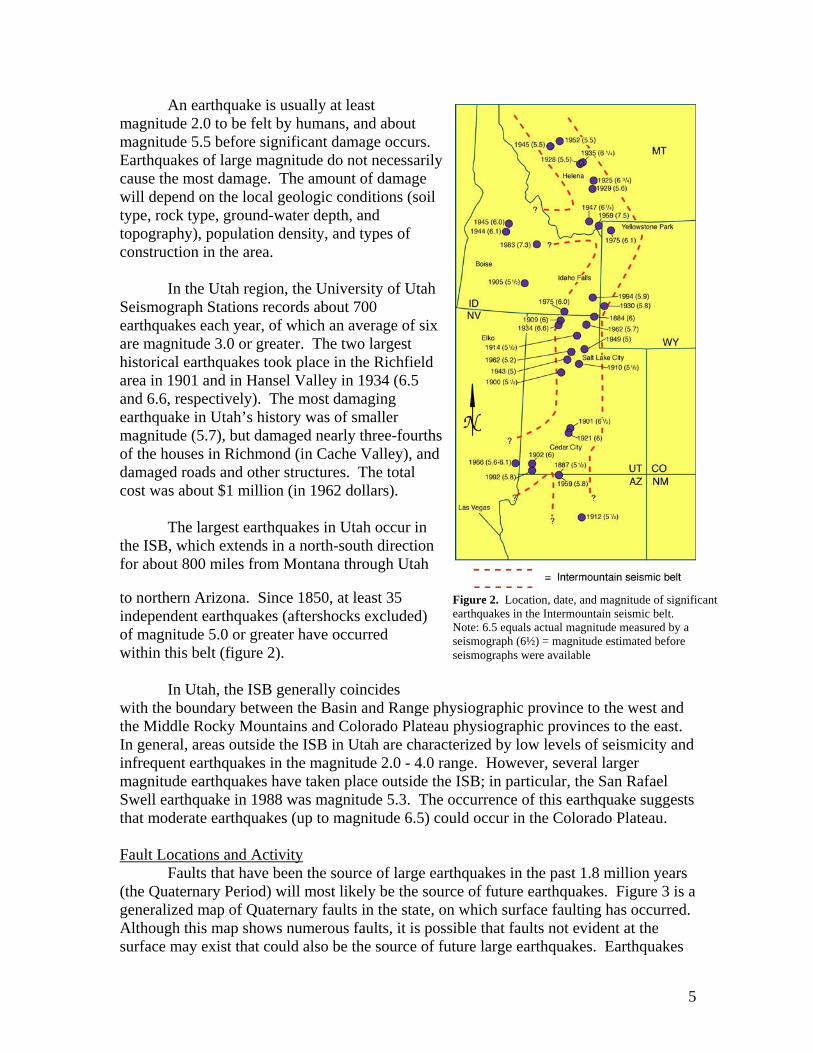
Figure 2. Location, date, and magnitude of significant earthquakes in the Intermountain seismic belt. Note: 6.5 equals actual magnitude measured by a seismograph (6½) = magnitude estimated before seismographs were available
An earthquake is usually at least magnitude 2.0 to be felt by humans, and about magnitude 5.5 before significant damage occurs. Earthquakes of large magnitude do not necessarily cause the most damage. The amount of damage will depend on the local geologic conditions (soil type, rock type, ground-water depth, and topography), population density, and types of construction in the area. In the Utah region, the University of Utah Seismograph Stations records about 700 earthquakes each year, of which an average of six are magnitude 3.0 or greater. The two largest historical earthquakes took place in the Richfield area in 1901 and in Hansel Valley in 1934 (6.5 and 6.6, respectively). The most damaging earthquake in Utah’s history was of smaller magnitude (5.7), but damaged nearly three-fourths of the houses in Richmond (in Cache Valley), and damaged roads and other structures. The total cost was about $1 million (in 1962 dollars). The largest earthquakes in Utah occur in the ISB, which extends in a north-south direction for about 800 miles from Montana through Utah
to northern Arizona. Since 1850, at least 35 independent earthquakes (aftershocks excluded) of magnitude 5.0 or greater have occurred within this belt (figure 2).
In Utah, the ISB generally coincides
with the boundary between the Basin and Range physiographic province to the west and the Middle Rocky Mountains and Colorado Plateau physiographic provinces to the east. In general, areas outside the ISB in Utah are characterized by low levels of seismicity and infrequent earthquakes in the magnitude 2.0 - 4.0 range. However, several larger magnitude earthquakes have taken place outside the ISB; in particular, the San Rafael Swell earthquake in 1988 was magnitude 5.3. The occurrence of this earthquake suggests that moderate earthquakes (up to magnitude 6.5) could occur in the Colorado Plateau. Fault Locations and Activity
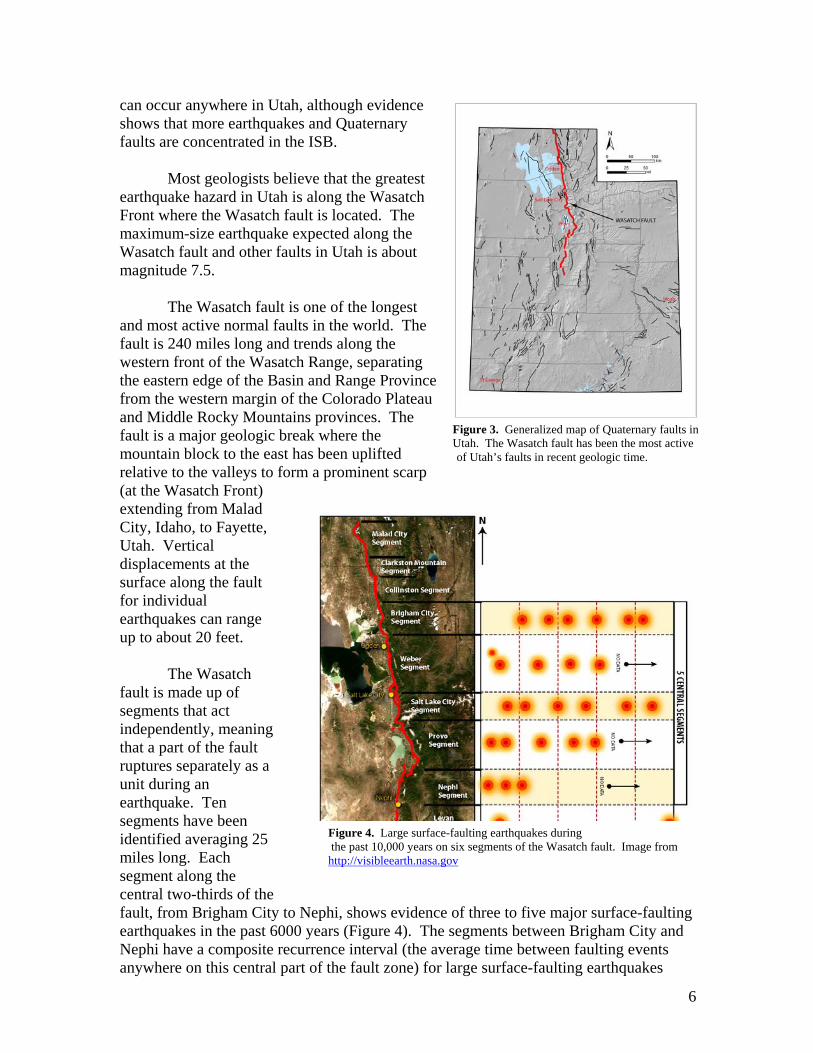
Faults that have been the source of large earthquakes in the past 1.8 million years (the Quaternary Period) will most likely be the source of future earthquakes. Figure 3 is a generalized map of Quaternary faults in the state, on which surface faulting has occurred. Although this map shows numerous faults, it is possible that faults not evident at the surface may exist that could also be the source of future large earthquakes. Earthquakes
6
Figure 3. Generalized map of Quaternary faults in Utah. The Wasatch fault has been the most active of Utah’s faults in recent geologic time.
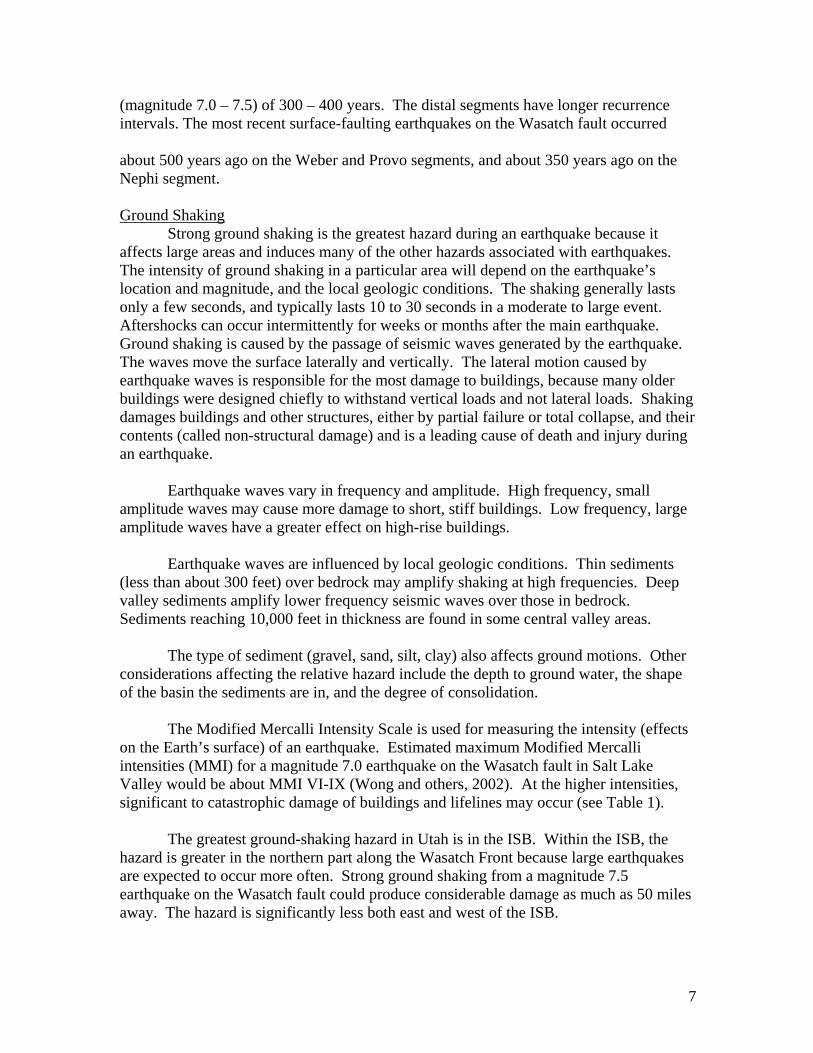
Figure 4. Large surface-faulting earthquakes during the past 10,000 years on six segments of the Wasatch fault. Image from http://visibleearth.nasa.gov
can occur anywhere in Utah, although evidence shows that more earthquakes and Quaternary faults are concentrated in the ISB. Most geologists believe that the greatest earthquake hazard in Utah is along the Wasatch Front where the Wasatch fault is located. The maximum-size earthquake expected along the Wasatch fault and other faults in Utah is about magnitude 7.5. The Wasatch fault is one of the longest and most active normal faults in the world. The fault is 240 miles long and trends along the western front of the Wasatch Range, separating the eastern edge of the Basin and Range Province from the western margin of the Colorado Plateau and Middle Rocky Mountains provinces. The fault is a major geologic break where the mountain block to the east has been uplifted relative to the valleys to form a prominent scarp (at the Wasatch Front) extending from Malad City, Idaho, to Fayette, Utah. Vertical displacements at the surface along the fault for individual earthquakes can range up to about 20 feet. The Wasatch fault is made up of segments that act independently, meaning that a part of the fault ruptures separately as a unit during an earthquake. Ten segments have been identified averaging 25 miles long. Each segment along the central two-thirds of the fault, from Brigham City to Nephi, shows evidence of three to five major surface-faulting earthquakes in the past 6000 years (Figure 4). The segments between Brigham City and Nephi have a composite recurrence interval (the average time between faulting events anywhere on this central part of the fault zone) for large surface-faulting earthquakes
7
(magnitude 7.0 – 7.5) of 300 – 400 years. The distal segments have longer recurrence intervals. The most recent surface-faulting earthquakes on the Wasatch fault occurred about 500 years ago on the Weber and Provo segments, and about 350 years ago on the Nephi segment.
Ground Shaking
Strong ground shaking is the greatest hazard during an earthquake because it affects large areas and induces many of the other hazards associated with earthquakes. The intensity of ground shaking in a particular area will depend on the earthquake’s location and magnitude, and the local geologic conditions. The shaking generally lasts only a few seconds, and typically lasts 10 to 30 seconds in a moderate to large event. Aftershocks can occur intermittently for weeks or months after the main earthquake. Ground shaking is caused by the passage of seismic waves generated by the earthquake. The waves move the surface laterally and vertically. The lateral motion caused by earthquake waves is responsible for the most damage to buildings, because many older buildings were designed chiefly to withstand vertical loads and not lateral loads. Shaking damages buildings and other structures, either by partial failure or total collapse, and their contents (called non-structural damage) and is a leading cause of death and injury during an earthquake.
Earthquake waves vary in frequency and amplitude. High frequency, small amplitude waves may cause more damage to short, stiff buildings. Low frequency, large amplitude waves have a greater effect on high-rise buildings. Earthquake waves are influenced by local geologic conditions. Thin sediments (less than about 300 feet) over bedrock may amplify shaking at high frequencies. Deep valley sediments amplify lower frequency seismic waves over those in bedrock. Sediments reaching 10,000 feet in thickness are found in some central valley areas.
The type of sediment (gravel, sand, silt, clay) also affects ground motions. Other considerations affecting the relative hazard include the depth to ground water, the shape of the basin the sediments are in, and the degree of consolidation.
The Modified Mercalli Intensity Scale is used for measuring the intensity (effects on the Earth’s surface) of an earthquake. Estimated maximum Modified Mercalli intensities (MMI) for a magnitude 7.0 earthquake on the Wasatch fault in Salt Lake Valley would be about MMI VI-IX (Wong and others, 2002). At the higher intensities, significant to catastrophic damage of buildings and lifelines may occur (see Table 1).
The greatest ground-shaking hazard in Utah is in the ISB. Within the ISB, the
hazard is greater in the northern part along the Wasatch Front because large earthquakes are expected to occur more often. Strong ground shaking from a magnitude 7.5 earthquake on the Wasatch fault could produce considerable damage as much as 50 miles away. The hazard is significantly less both east and west of the ISB.
8
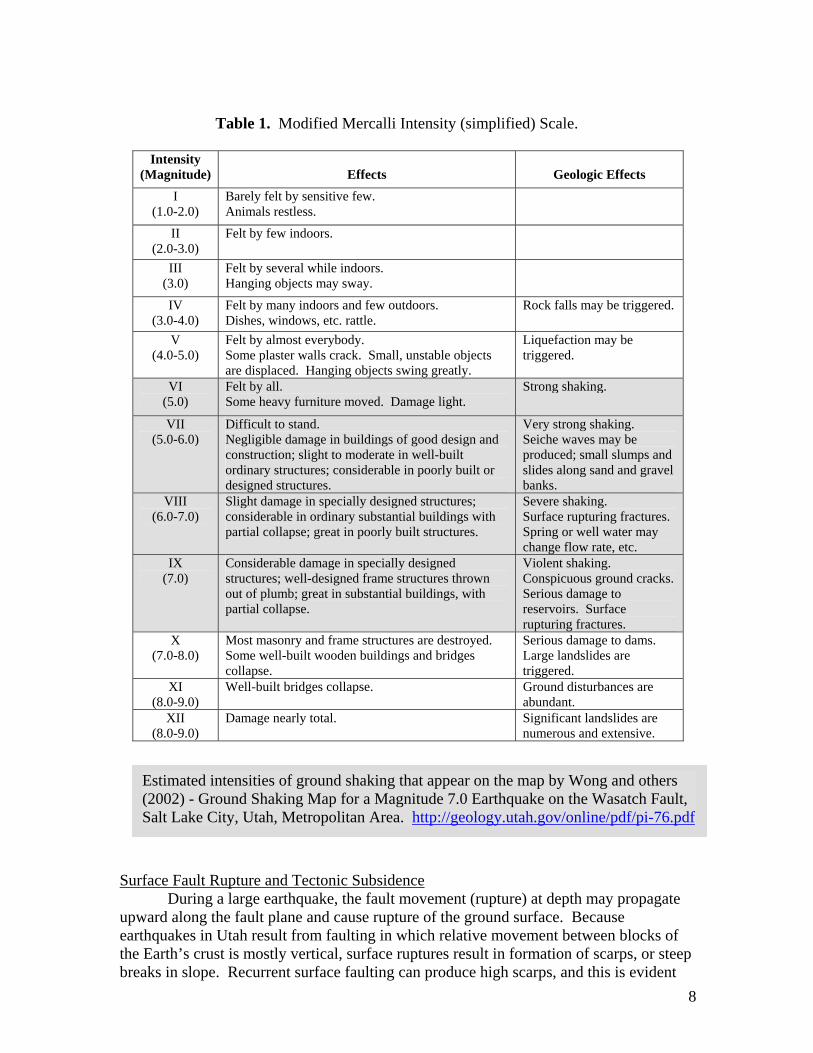
Table 1. Modified Mercalli Intensity (simplified) Scale.
Intensity (Magnitude)
Effects
Geologic Effects
I (1.0-2.0)
Barely felt by sensitive few. Animals restless.
II (2.0-3.0)
Felt by few indoors.
III (3.0)
Felt by several while indoors. Hanging objects may sway.
IV (3.0-4.0)
Felt by many indoors and few outdoors. Dishes, windows, etc. rattle.
Rock falls may be triggered.
V (4.0-5.0)
Felt by almost everybody. Some plaster walls crack. Small, unstable objects are displaced. Hanging objects swing greatly.
Liquefaction may be triggered.
VI (5.0)
Felt by all. Some heavy furniture moved. Damage light.
Strong shaking.
VII (5.0-6.0)
Difficult to stand. Negligible damage in buildings of good design and construction; slight to moderate in well-built ordinary structures; considerable in poorly built or designed structures.
Very strong shaking. Seiche waves may be produced; small slumps and slides along sand and gravel banks.
VIII (6.0-7.0)
Slight damage in specially designed structures; considerable in ordinary substantial buildings with partial collapse; great in poorly built structures.
Severe shaking. Surface rupturing fractures. Spring or well water may change flow rate, etc.
IX (7.0)
Considerable damage in specially designed structures; well-designed frame structures thrown out of plumb; great in substantial buildings, with partial collapse.
Violent shaking. Conspicuous ground cracks. Serious damage to reservoirs. Surface rupturing fractures.
X (7.0-8.0)
Most masonry and frame structures are destroyed. Some well-built wooden buildings and bridges collapse.
Serious damage to dams. Large landslides are triggered.
XI (8.0-9.0)
Well-built bridges collapse. Ground disturbances are abundant.
XII (8.0-9.0)
Damage nearly total. Significant landslides are numerous and extensive.
Surface Fault Rupture and Tectonic Subsidence During a large earthquake, the fault movement (rupture) at depth may propagate upward along the fault plane and cause rupture of the ground surface. Because earthquakes in Utah result from faulting in which relative movement between blocks of the Earth’s crust is mostly vertical, surface ruptures result in formation of scarps, or steep breaks in slope. Recurrent surface faulting can produce high scarps, and this is evident
Estimated intensities of ground shaking that appear on the map by Wong and others (2002) - Ground Shaking Map for a Magnitude 7.0 Earthquake on the Wasatch Fault, Salt Lake City, Utah, Metropolitan Area. http://geology.utah.gov/online/pdf/pi-76.pdf
9
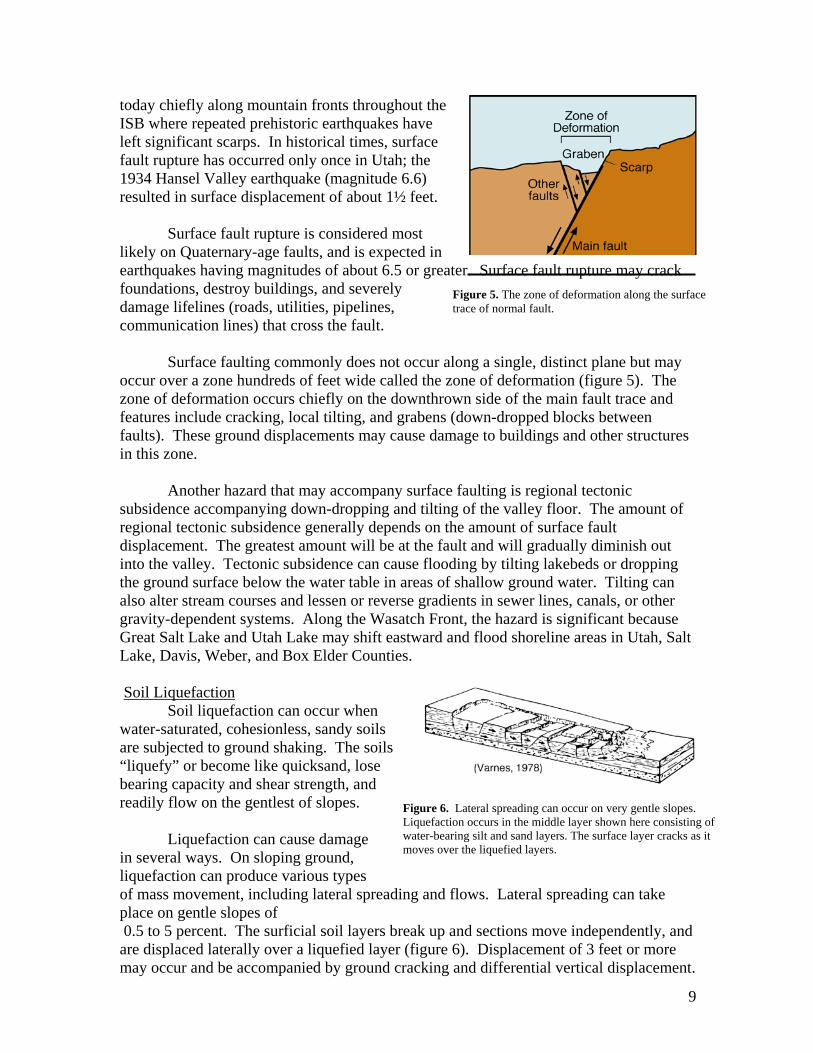
today chiefly along mountain fronts throughout the ISB where repeated prehistoric earthquakes have left significant scarps. In historical times, surface fault rupture has occurred only once in Utah; the 1934 Hansel Valley earthquake (magnitude 6.6) resulted in surface displacement of about 1½ feet. Surface fault rupture is considered most likely on Quaternary-age faults, and is expected in earthquakes having magnitudes of about 6.5 or greater. Surface fault rupture may crack foundations, destroy buildings, and severely damage lifelines (roads, utilities, pipelines, communication lines) that cross the fault. Surface faulting commonly does not occur along a single, distinct plane but may occur over a zone hundreds of feet wide called the zone of deformation (figure 5). The zone of deformation occurs chiefly on the downthrown side of the main fault trace and features include cracking, local tilting, and grabens (down-dropped blocks between faults). These ground displacements may cause damage to buildings and other structures in this zone.
Another hazard that may accompany surface faulting is regional tectonic subsidence accompanying down-dropping and tilting of the valley floor. The amount of regional tectonic subsidence generally depends on the amount of surface fault displacement. The greatest amount will be at the fault and will gradually diminish out into the valley. Tectonic subsidence can cause flooding by tilting lakebeds or dropping the ground surface below the water table in areas of shallow ground water. Tilting can also alter stream courses and lessen or reverse gradients in sewer lines, canals, or other gravity-dependent systems. Along the Wasatch Front, the hazard is significant because Great Salt Lake and Utah Lake may shift eastward and flood shoreline areas in Utah, Salt Lake, Davis, Weber, and Box Elder Counties. Soil Liquefaction
Soil liquefaction can occur when water-saturated, cohesionless, sandy soils are subjected to ground shaking. The soils “liquefy” or become like quicksand, lose bearing capacity and shear strength, and readily flow on the gentlest of slopes.
Liquefaction can cause damage in several ways. On sloping ground, liquefaction can produce various types of mass movement, including lateral spreading and flows. Lateral spreading can take place on gentle slopes of 0.5 to 5 percent. The surficial soil layers break up and sections move independently, and are displaced laterally over a liquefied layer (figure 6). Displacement of 3 feet or more may occur and be accompanied by ground cracking and differential vertical displacement.
Figure 5. The zone of deformation along the surface trace of normal fault.
Figure 6. Lateral spreading can occur on very gentle slopes. Liquefaction occurs in the middle layer shown here consisting of water-bearing silt and sand layers. The surface layer cracks as it moves over the liquefied layers.
10
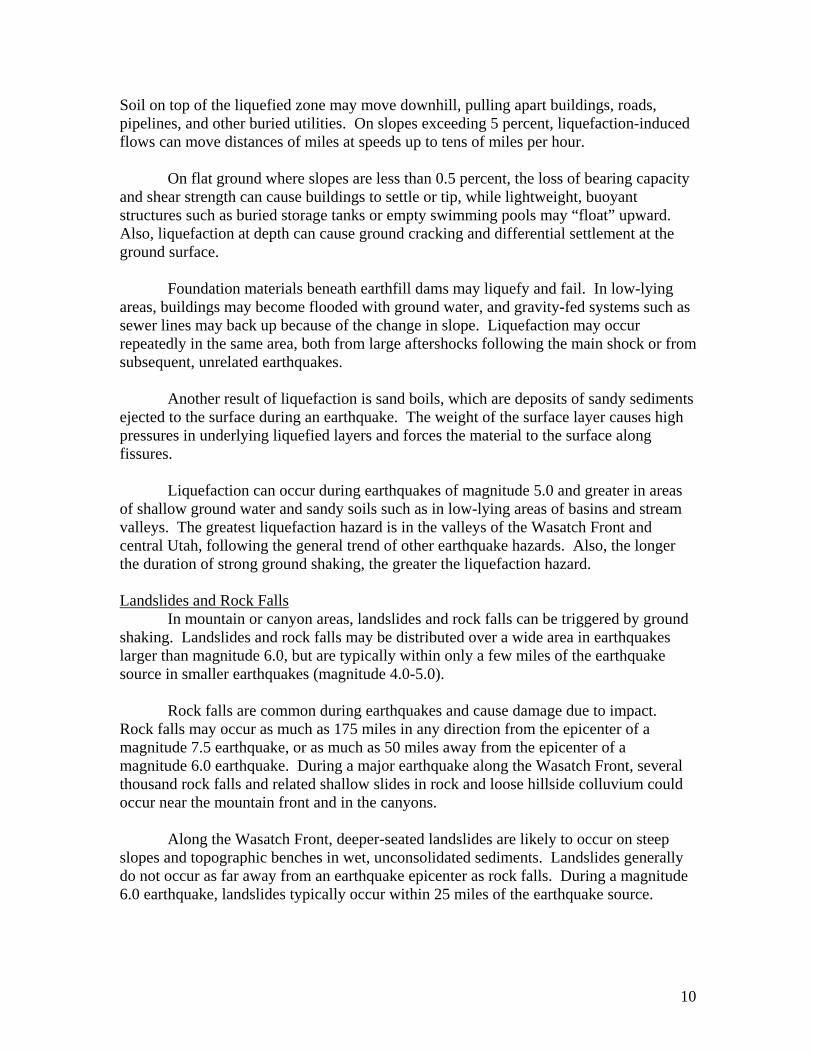
Soil on top of the liquefied zone may move downhill, pulling apart buildings, roads, pipelines, and other buried utilities. On slopes exceeding 5 percent, liquefaction-induced flows can move distances of miles at speeds up to tens of miles per hour.
On flat ground where slopes are less than 0.5 percent, the loss of bearing capacity and shear strength can cause buildings to settle or tip, while lightweight, buoyant structures such as buried storage tanks or empty swimming pools may “float” upward. Also, liquefaction at depth can cause ground cracking and differential settlement at the ground surface. Foundation materials beneath earthfill dams may liquefy and fail. In low-lying areas, buildings may become flooded with ground water, and gravity-fed systems such as sewer lines may back up because of the change in slope. Liquefaction may occur repeatedly in the same area, both from large aftershocks following the main shock or from subsequent, unrelated earthquakes. Another result of liquefaction is sand boils, which are deposits of sandy sediments ejected to the surface during an earthquake. The weight of the surface layer causes high pressures in underlying liquefied layers and forces the material to the surface along fissures. Liquefaction can occur during earthquakes of magnitude 5.0 and greater in areas of shallow ground water and sandy soils such as in low-lying areas of basins and stream valleys. The greatest liquefaction hazard is in the valleys of the Wasatch Front and central Utah, following the general trend of other earthquake hazards. Also, the longer the duration of strong ground shaking, the greater the liquefaction hazard. Landslides and Rock Falls In mountain or canyon areas, landslides and rock falls can be triggered by ground shaking. Landslides and rock falls may be distributed over a wide area in earthquakes larger than magnitude 6.0, but are typically within only a few miles of the earthquake source in smaller earthquakes (magnitude 4.0-5.0). Rock falls are common during earthquakes and cause damage due to impact. Rock falls may occur as much as 175 miles in any direction from the epicenter of a magnitude 7.5 earthquake, or as much as 50 miles away from the epicenter of a magnitude 6.0 earthquake. During a major earthquake along the Wasatch Front, several thousand rock falls and related shallow slides in rock and loose hillside colluvium could occur near the mountain front and in the canyons. Along the Wasatch Front, deeper-seated landslides are likely to occur on steep slopes and topographic benches in wet, unconsolidated sediments. Landslides generally do not occur as far away from an earthquake epicenter as rock falls. During a magnitude 6.0 earthquake, landslides typically occur within 25 miles of the earthquake source.
11
Other Hazards Earthquakes can induce other hazards including flooding, snow avalanches, ground failure due to loss of strength in sensitive clays, and subsidence caused by vibratory settlement in granular soils and fill. Flooding. Earthquakes can induce flooding due to tectonic subsidence and tilting (previously discussed), dam failure, seiches in lakes and reservoirs, surface-water diversion, and increased ground-water discharge. Flooding due to failure of a major dam would probably cause the most property damage and loss of life.
Seiches are waves generated in closed-basin bodies of water such as lakes and reservoirs when ground shaking causes sloshing of the water. Seiches can cause shoreline flooding, erosion, damage to in-lake structures (causeway embankments across Great Salt Lake, docks, solar-pond operations), and they can overtop a dam causing dam failure.
Flooding can result from disruption of surface drainage. Water tanks, pipelines,
and aqueducts may be ruptured, or canals and stream courses diverted by ground shaking, surface faulting, ground tilting, and landsliding during earthquakes. Ground-water discharge may increase, causing local surface flooding and erosion.
Snow avalanches. Snow avalanches can be triggered by ground shaking. The area of greatest concern would be in the Wasatch Range because of terrain, snowpack conditions, higher earthquake potential, population density, and heavy backcountry use.
Sensitive clays. Sensitive clays lose strength and are subject to collapse and liquefaction when shaken. The types of resulting ground failure are similar to those accompanying liquefaction. Failure may not occur except during long-duration, strong ground shaking. Sensitive clays in Utah are present in some Lake Bonneville sediments in valleys west of the Wasatch Front, and may be widely distributed along the Wasatch Front. Subsidence. Ground shaking during large earthquakes can cause vibratory settlement in loose granular materials, such as sand and gravel that do not contain clay. Valleys of western Utah are underlain by such deposits (from Lake Bonneville) where the potential for settlement may exist. Artificial fill such as railway embankments, highway foundations, bridge approaches, and dikes and levees may be susceptible if granular material is used, and even minor differential settlement can cause extensive damage. Loss Estimates Loss estimates for a magnitude 7.0 earthquake in the Salt Lake City area include over $40 billion in damage to buildings alone, not including other structures and other types of financial losses that would occur. A worst-case scenario estimates 9000 severe injuries and fatalities and as many as 150,000 displaced households. In addition, failure of a major dam could significantly increase fatalities by the thousands.
Large earthquakes in one of the other Wasatch Front major cities could also produce extensive damage. Estimated damage to buildings for a magnitude 7.0 earthquake is $16 billion in the Ogden area and $14 billion in the Provo area, and about 3000 severe injuries and fatalities could occur in either area.
12
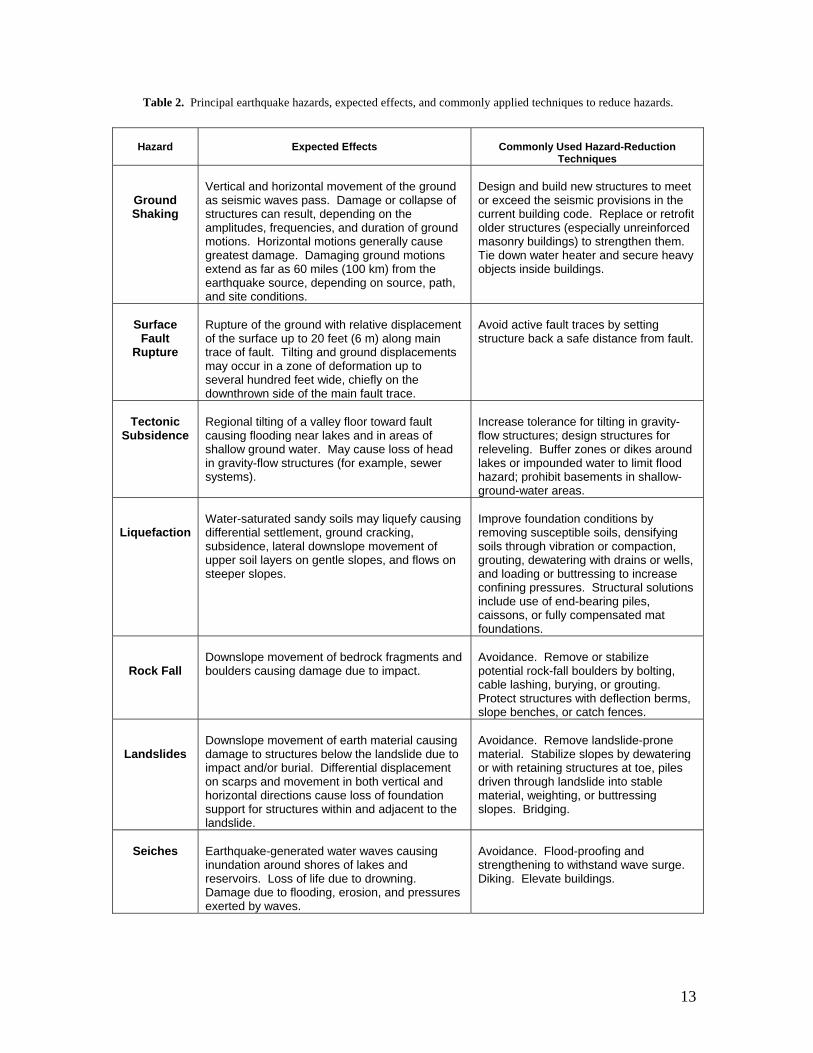
MITIGATION Areas in Utah are classic examples of seismically active regions that have only moderate historical seismicity, but high catastrophic potential from future large earthquakes. The extensive damage and loss of life experienced in areas not adequately prepared for earthquakes illustrates the critical need for mitigation measures, including risk identification and proper seismic design and construction. Education, awareness, and preparedness are all necessary for Utah’s residents. One form of mitigation is to avoid hazards. However, avoidance is often impractical, and some other mitigation strategy must be used. Mitigation can modify hazards by either reducing the likelihood or severity of the hazard (generally difficult and expensive for many earthquake hazards) or modifying what is at risk (for example, strengthening existing structures to withstand the hazard event). In some cases, one can simply understand the hazard and accept the risk. When this is done, it usually involves disclosure of the hazard to potential homeowners and occupants. Different earthquake hazards require different mitigation strategies, but community planning strategies for all hazards generally fall into two categories: (1) building codes and (2) land-use planning. Building codes apply to all construction, and these are most applicable to the ground-shaking hazard because this hazard could occur anywhere and cannot be avoided. Building codes are commonly used to ensure safe and adequate construction by all communities, and in earthquake-prone areas such as Utah, it is necessary to enforce requirements for earthquake-resistant design and construction of buildings. Many older buildings, which were built before modern building codes were adopted, pose perhaps the greatest threat to people and property today, and mitigation of ground-shaking hazards through building codes must include retrofitting these older buildings. Unreinforced masonry buildings, such as brick homes built before the mid-1970s, are examples of structures particularly vulnerable to ground shaking and may account for most of the building losses and casualties in a Wasatch Front earthquake. For hazards that are more site-specific, such as surface faulting and landsliding, land-use planning is the most effective mitigation technique. Land-use planning requires identification of hazards, evaluation of their potential effect on proposed land uses, and mitigation prior to construction. It is generally accomplished through community master plans, zoning ordinances, and geologic-hazards ordinances that define hazard areas and require developers to show that any existing hazards have been investigated and new construction will not be exposed to unnecessary risks. Table 2 is a summary of effects and common hazard-reduction techniques for each earthquake hazard.
13
Table 2. Principal earthquake hazards, expected effects, and commonly applied techniques to reduce hazards.
Hazard
Expected Effects
Commonly Used Hazard-Reduction
Techniques
Ground Shaking
Vertical and horizontal movement of the ground as seismic waves pass. Damage or collapse of structures can result, depending on the amplitudes, frequencies, and duration of ground motions. Horizontal motions generally cause greatest damage. Damaging ground motions extend as far as 60 miles (100 km) from the earthquake source, depending on source, path, and site conditions.
Design and build new structures to meet or exceed the seismic provisions in the current building code. Replace or retrofit older structures (especially unreinforced masonry buildings) to strengthen them. Tie down water heater and secure heavy objects inside buildings.
Surface
Fault Rupture
Rupture of the ground with relative displacement of the surface up to 20 feet (6 m) along main trace of fault. Tilting and ground displacements may occur in a zone of deformation up to several hundred feet wide, chiefly on the downthrown side of the main fault trace.
Avoid active fault traces by setting structure back a safe distance from fault.
Tectonic
Subsidence
Regional tilting of a valley floor toward fault causing flooding near lakes and in areas of shallow ground water. May cause loss of head in gravity-flow structures (for example, sewer systems).
Increase tolerance for tilting in gravity-flow structures; design structures for releveling. Buffer zones or dikes around lakes or impounded water to limit flood hazard; prohibit basements in shallow-ground-water areas.
Liquefaction
Water-saturated sandy soils may liquefy causing differential settlement, ground cracking, subsidence, lateral downslope movement of upper soil layers on gentle slopes, and flows on steeper slopes.
Improve foundation conditions by removing susceptible soils, densifying soils through vibration or compaction, grouting, dewatering with drains or wells, and loading or buttressing to increase confining pressures. Structural solutions include use of end-bearing piles, caissons, or fully compensated mat foundations.
Rock Fall
Downslope movement of bedrock fragments and boulders causing damage due to impact.
Avoidance. Remove or stabilize potential rock-fall boulders by bolting, cable lashing, burying, or grouting. Protect structures with deflection berms, slope benches, or catch fences.
Landslides
Downslope movement of earth material causing damage to structures below the landslide due to impact and/or burial. Differential displacement on scarps and movement in both vertical and horizontal directions cause loss of foundation support for structures within and adjacent to the landslide.
Avoidance. Remove landslide-prone material. Stabilize slopes by dewatering or with retaining structures at toe, piles driven through landslide into stable material, weighting, or buttressing slopes. Bridging.
Seiches
Earthquake-generated water waves causing inundation around shores of lakes and reservoirs. Loss of life due to drowning. Damage due to flooding, erosion, and pressures exerted by waves.
Avoidance. Flood-proofing and strengthening to withstand wave surge. Diking. Elevate buildings.
14
Where to Find Additional Information http://geology.utah.gov/ Geology, faulting, ground-shaking, and liquefaction hazard information and geologic-hazard maps are available from the Utah Geological Survey. http://www.des.utah.gov/ Earthquake preparedness information is available from the Utah Division of Homeland Security. http://www.seis.utah.edu/ Seismicity information is available from the University of Utah Seismograph Stations. http://earthquake.usgs.gov General earthquake information is available from the U.S. Geological Survey. REFERENCES Arabasz, W.J. editor, 1991, A guide to reducing losses from future earthquakes in Utah -
consensus document: Utah Geological and Mineral Survey Miscellaneous Publication 91-1, 30 p.
Arabasz, W.J., Pechmann, J.C., and Brown, E.D., 1987, Observational seismology and
the evaluation of earthquake hazards and risk in the Wasatch Front area, Utah, in Gori, P.L., and Hays, W.W., editors, Assessment of regional earthquake hazards and risk along the Wasatch Front, Utah, Volume 1: U.S. Geological Survey Professional Paper 1500, p. D1 - D36.
Arabasz, W.J., Smith R.B., and Richins, W.D., editors, 1979, Earthquake studies in
Utah, 1850 to 1978: University of Utah Seismograph Stations Special Publication, 552 p.
Black, B.D., Hecker, Suzanne, Hylland, M.D., Christenson, G.E., and McDonald, G.N.,
2003, Quaternary fault and fold database and map of Utah: Utah Geological Survey Map 193DM, scale 1:500,000.
Eldredge, S.N., 1996, Homebuyers guide to earthquake hazards in Utah: Utah Geological
Survey Public Information Series 38, 27 p. Gori, P.L., editor, 1993, Applications of research from the U.S. Geological Survey
program, Assessment of Regional Earthquake Hazards and Risk Along the Wasatch Front, Utah: U.S. Geological Survey Professional Paper 1519, 167 p.
Gori, P.L., and Hays, W.W., editors, 1992, Assessment of regional earthquake hazards
and risk along the Wasatch Front, Utah: U.S. Geological Survey Professional Paper 1500 – A-R, 2 volumes.
Harty, K.M., compiler, 1988, Flood hazard from lakes and failure of dams in Utah: Utah
Geological and Mineral Survey Map 111, scale 1:750,000.
15
Hecker, Suzanne, 1993, Quaternary tectonics of Utah with emphasis on earthquake- hazard characterization: Utah Geological Survey Bulletin 127, 157 p., 2 plates.
Hecker, Suzanne, Harty, K.M., and Christenson, G.E., 1988, Shallow ground water and
related hazards in Utah: Utah Geological and Mineral Survey Map 110, scale 1:750,000.
Keaton, J.R., 1987, Potential consequences of earthquake-induced regional tectonic
deformation along the Wasatch Front, North-central Utah, in McCalpin, James, editor, Proceedings of the 23rd Symposium on Engineering Geology and Soils: Logan, Utah State University, April 6-8, 1987, p. 19-34.
Keaton, J.R., Topham, D.E., Anderson, L.R., and Rathbun, D.J., 1987, Earthquake-
induced landslide potential in and development of a seismic slope stability map of the urban corridor of Davis and Salt Lake Counties, Utah, in McCalpin, James, editor, Proceedings of the 23rd Symposium on Engineering Geology and Soils: Logan, Utah State University, April 6-8, 1987, p. 57-82.
Lowe, Michael, Christenson, G.E., Nelson, C.V., Robison, R.M., and Tingey, James, 1991, Basic strategies for loss reduction, in Arabasz, W.J., editor, A guide to reducing losses from future earthquakes in Utah – consensus document: Utah Geological and Mineral Survey Miscellaneous Publication 91-1, p. 3-5.
Machette, M.N., Personius S.F., Nelson, A.R., Schwartz, D.P., and Lund, W.R., 1991,
The Wasatch fault zone, Utah – segmentation and history of the Holocene earthquakes: Journal of Structural Geology, v. 13, no. 2, p. 137-149.
Utah Geological Survey, 2004, Liquefaction potential maps for northern Wasatch Front,
central Utah, and for Davis, Salt Lake, and Utah Counties: Utah Geological Survey Open-File Report 433, 463 p., 81 plates.
Varnes, D.J., 1978, Slope movement types and processes, in Schuster, R.L., and Krizek,
R.J., editors, Landslides – analysis and control: National Academy of Sciences Special Report 176, p. 11-33.
Wong, Ivan, Silva, Walter, Wright, Douglas, Olig, Susan, Ashland, Francis, Gregor,
Nick, Christenson, Gary, Pechmann, James, Thomas, Patricia, Dober, Mark, and Gerth, Robyn, 2002, Ground-shaking map for a magnitude 7.0 earthquake on the Wasatch fault, Salt Lake City, Utah, metropolitan area: Utah Geological Survey Public Information Series 76, 1 plate.
16
LANDSLIDES
Sandra N. Eldredge, Kimm M. Harty, and Richard E. Giraud Utah Geological Survey
OVERVIEW
Landslides are one of the most commonly occurring natural hazards in Utah. The state has a long history of damaging landslides in both rural and urban areas. Landslides have caused loss of lives, damaged or destroyed buildings and transportation routes, and dammed rivers causing destructive flooding.
Landslides are most common in areas having moderate to steep slopes, weak slope
materials, and relatively wet climates. In these landslide-prone areas, most landslides are associated with precipitation events – either periods of sustained above-average precipitation, individual intense rainstorms, or snowmelt events. Erosion, removal of vegetation by wildfires, and earthquake ground shaking increase the likelihood of landslides. Human activities such as grading of slopes and increasing soil moisture through landscape irrigation can also trigger landslides.
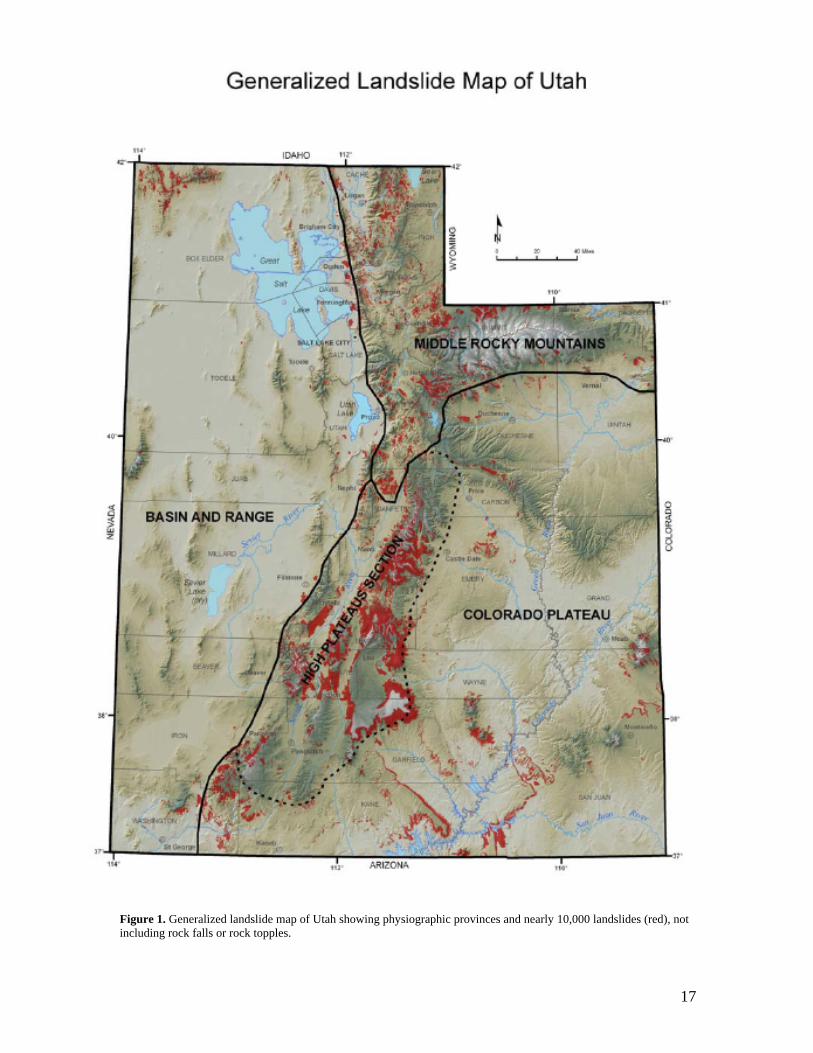
The landslide distribution in Utah is dependent on geology, topography, and climate. Landslides are most numerous in the Middle Rocky Mountains physiographic province and in the High Plateaus section of the Colorado Plateau physiographic province where weak rock types, steep slopes, and relatively abundant precipitation contribute to landsliding (figure 1). Landslides are much less common in the arid Basin and Range and Colorado Plateau provinces. Landslide risk can be reduced by avoiding and stabilizing landslides. Nearly all landslides in Utah are reactivations of pre-existing landslides, and landslides may reactivate if not stabilized. Therefore, historical landslides, prehistoric landslides, and steep slopes prone to landsliding must be thoroughly investigated before development. Avoiding landslides is not always possible, so engineering measures are often necessary to stabilize landslides and reduce landslide risk.
Landsliding causes significant economic loss in Utah. Years with above-normal
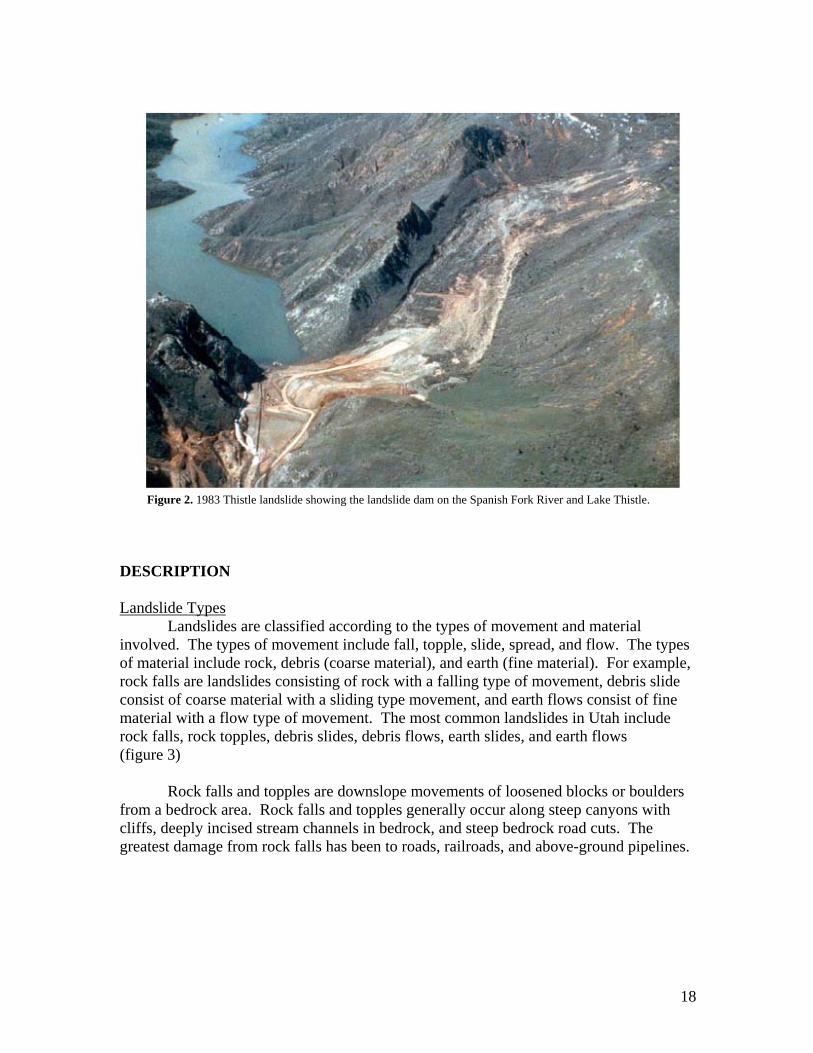
precipitation generally produce the most landslides. The landslides in the wet year of 1983 had a total estimated direct cost exceeding $250 million. The 1983 Thistle landslide (figure 2) in Utah County is recognized in terms of direct and indirect costs as the most expensive single landslide in North America. Utah contains numerous landslides and landslide-prone rock types. As Utah continues to grow and development spreads into landslide-prone areas, the potential for landslide damage to private and public property increases.
17
Figure 1. Generalized landslide map of Utah showing physiographic provinces and nearly 10,000 landslides (red), not including rock falls or rock topples.
18
Figure 2. 1983 Thistle landslide showing the landslide dam on the Spanish Fork River and Lake Thistle.
DESCRIPTION Landslide Types
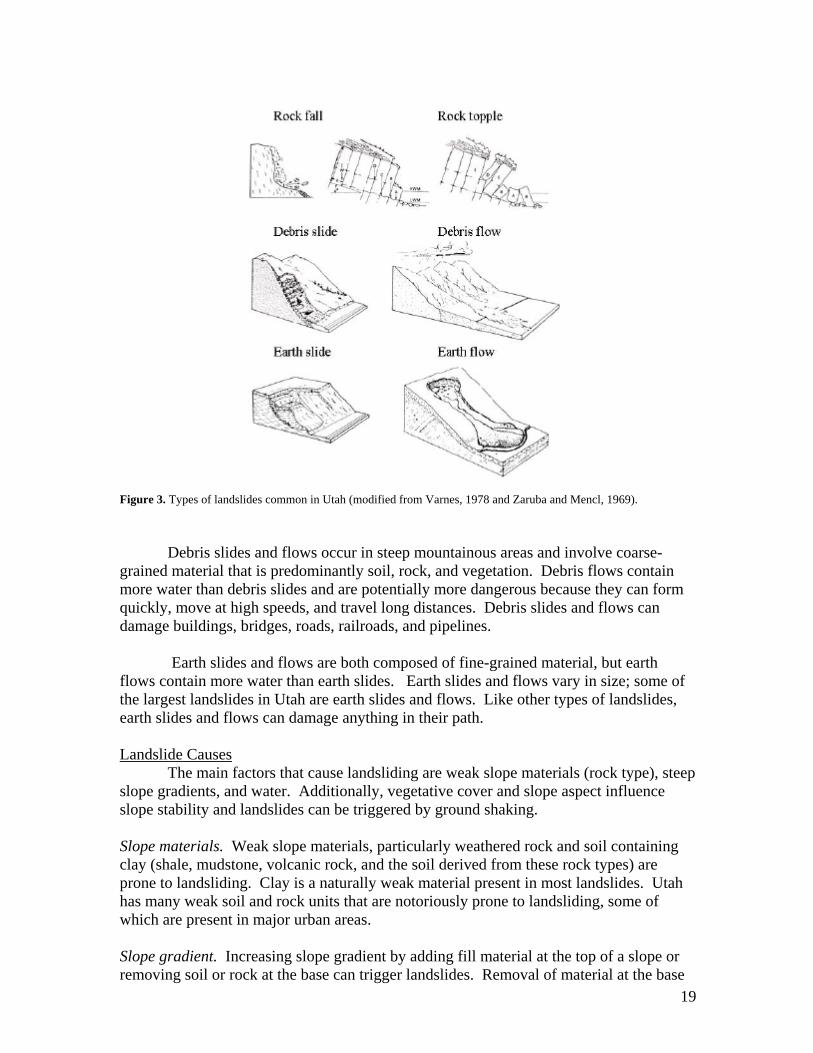
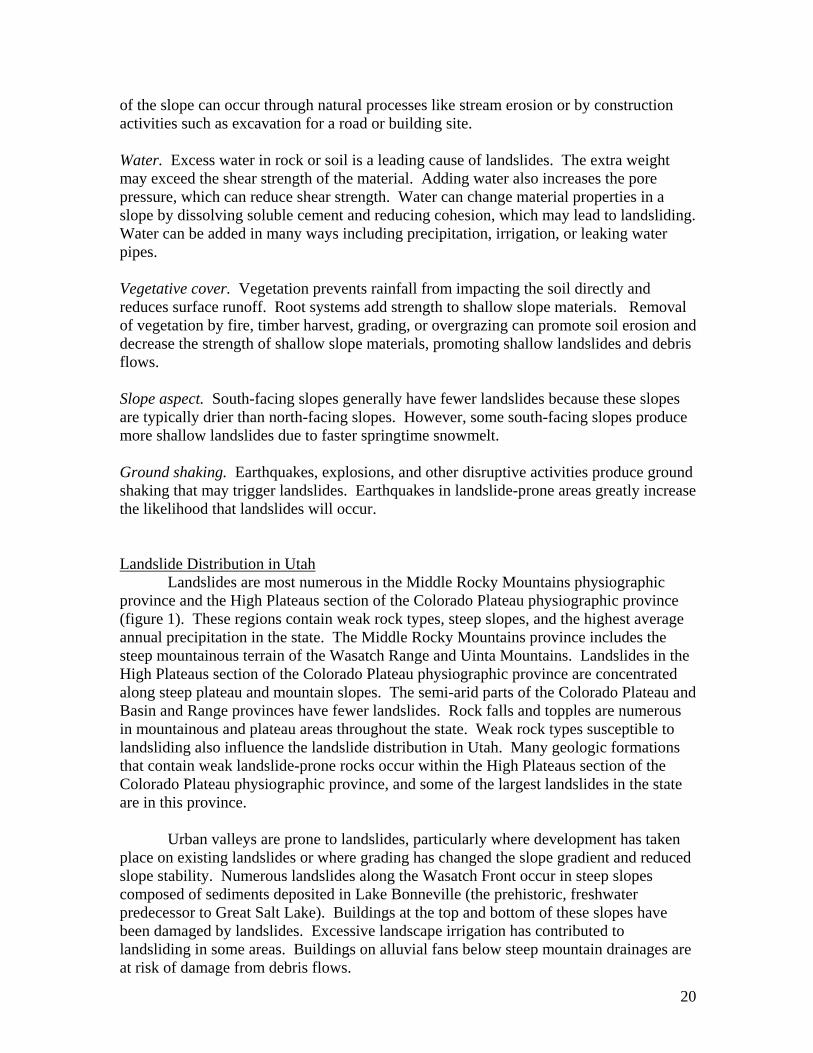
Landslides are classified according to the types of movement and material involved. The types of movement include fall, topple, slide, spread, and flow. The types of material include rock, debris (coarse material), and earth (fine material). For example, rock falls are landslides consisting of rock with a falling type of movement, debris slide consist of coarse material with a sliding type movement, and earth flows consist of fine material with a flow type of movement. The most common landslides in Utah include rock falls, rock topples, debris slides, debris flows, earth slides, and earth flows (figure 3)
Rock falls and topples are downslope movements of loosened blocks or boulders from a bedrock area. Rock falls and topples generally occur along steep canyons with cliffs, deeply incised stream channels in bedrock, and steep bedrock road cuts. The greatest damage from rock falls has been to roads, railroads, and above-ground pipelines.
19
Figure 3. Types of landslides common in Utah (modified from Varnes, 1978 and Zaruba and Mencl, 1969).
Debris slides and flows occur in steep mountainous areas and involve coarse-
grained material that is predominantly soil, rock, and vegetation. Debris flows contain more water than debris slides and are potentially more dangerous because they can form quickly, move at high speeds, and travel long distances. Debris slides and flows can damage buildings, bridges, roads, railroads, and pipelines.
Earth slides and flows are both composed of fine-grained material, but earth flows contain more water than earth slides. Earth slides and flows vary in size; some of the largest landslides in Utah are earth slides and flows. Like other types of landslides, earth slides and flows can damage anything in their path. Landslide Causes
The main factors that cause landsliding are weak slope materials (rock type), steep slope gradients, and water. Additionally, vegetative cover and slope aspect influence slope stability and landslides can be triggered by ground shaking. Slope materials. Weak slope materials, particularly weathered rock and soil containing clay (shale, mudstone, volcanic rock, and the soil derived from these rock types) are prone to landsliding. Clay is a naturally weak material present in most landslides. Utah has many weak soil and rock units that are notoriously prone to landsliding, some of which are present in major urban areas. Slope gradient. Increasing slope gradient by adding fill material at the top of a slope or removing soil or rock at the base can trigger landslides. Removal of material at the base
20
of the slope can occur through natural processes like stream erosion or by construction activities such as excavation for a road or building site. Water. Excess water in rock or soil is a leading cause of landslides. The extra weight may exceed the shear strength of the material. Adding water also increases the pore pressure, which can reduce shear strength. Water can change material properties in a slope by dissolving soluble cement and reducing cohesion, which may lead to landsliding. Water can be added in many ways including precipitation, irrigation, or leaking water pipes. Vegetative cover. Vegetation prevents rainfall from impacting the soil directly and reduces surface runoff. Root systems add strength to shallow slope materials. Removal of vegetation by fire, timber harvest, grading, or overgrazing can promote soil erosion and decrease the strength of shallow slope materials, promoting shallow landslides and debris flows. Slope aspect. South-facing slopes generally have fewer landslides because these slopes are typically drier than north-facing slopes. However, some south-facing slopes produce more shallow landslides due to faster springtime snowmelt. Ground shaking. Earthquakes, explosions, and other disruptive activities produce ground shaking that may trigger landslides. Earthquakes in landslide-prone areas greatly increase the likelihood that landslides will occur. Landslide Distribution in Utah
Landslides are most numerous in the Middle Rocky Mountains physiographic province and the High Plateaus section of the Colorado Plateau physiographic province (figure 1). These regions contain weak rock types, steep slopes, and the highest average annual precipitation in the state. The Middle Rocky Mountains province includes the steep mountainous terrain of the Wasatch Range and Uinta Mountains. Landslides in the High Plateaus section of the Colorado Plateau physiographic province are concentrated along steep plateau and mountain slopes. The semi-arid parts of the Colorado Plateau and Basin and Range provinces have fewer landslides. Rock falls and topples are numerous in mountainous and plateau areas throughout the state. Weak rock types susceptible to landsliding also influence the landslide distribution in Utah. Many geologic formations that contain weak landslide-prone rocks occur within the High Plateaus section of the Colorado Plateau physiographic province, and some of the largest landslides in the state are in this province. Urban valleys are prone to landslides, particularly where development has taken place on existing landslides or where grading has changed the slope gradient and reduced slope stability. Numerous landslides along the Wasatch Front occur in steep slopes composed of sediments deposited in Lake Bonneville (the prehistoric, freshwater predecessor to Great Salt Lake). Buildings at the top and bottom of these slopes have been damaged by landslides. Excessive landscape irrigation has contributed to landsliding in some areas. Buildings on alluvial fans below steep mountain drainages are at risk of damage from debris flows.
21
Recent Landslide History Landslides of the early 1980s. During the early 1980s, rapid snowmelt combined with above-average precipitation occurred during several consecutive years throughout much of Utah, producing numerous landslides. The wet years of 1982-86 included record-breaking precipitation across most of the state. The resulting damage from flooding and landsliding was so extensive in 1983 that 22 of Utah’s 29 counties were declared eligible for national disaster assistance. During 1983-84 the losses from landslides and floods exceeded $250 million. The landslide damage was most severe in the spring of 1983 when Utah’s landslides were among the most economically destructive landslides in North America. Thousands of landslides occurred in 1983. The most damaging and costliest landslide was the 1983 Thistle landslide (figure 2), which destroyed a highway and railway, dammed the Spanish Fork River, and flooded the town of Thistle. A large debris flow in Farmington demolished five homes and severely damaged 13 others on an alluvial fan. In Davis County, debris flows and debris floods destroyed 13 houses, severely damaged 40 houses, and caused considerable damage to 350 houses. Landslides of 1998. Numerous damaging landslides occurred in the spring of 1998 in northern Utah along the Wasatch Front. Nearly all of these were reactivations of pre-existing landslides. The 1998 landslides followed a period of four or more consecutive years of above-normal precipitation, which caused a natural rise in spring ground-water levels. The 1998 landslides caused over $1 million in damage to houses and public infrastructure (roads, water lines, sewer lines, power lines, natural gas lines, communication lines, and canals). Landslides of 2005 and 2006. Record precipitation beginning in the fall of 2004 and record snowpacks during the winter of 2004-05, particularly in southwestern Utah, resulted in numerous landslides during the spring of 2005. Above-normal precipitation again in the winter of 2005-06 resulted in numerous landslides in the spring of 2006. All types of landslides occurred in 2005 and 2006 including a rapidly moving destructive landslide in South Weber (figure 4). The majority of damage was to houses and city infrastructure. Some of the 2005 and 2006 landslides in residential subdivisions were landslides that had moved previously in 1998. The landslides of 2005 and 2006 likely caused more than $10 million in damage.
22
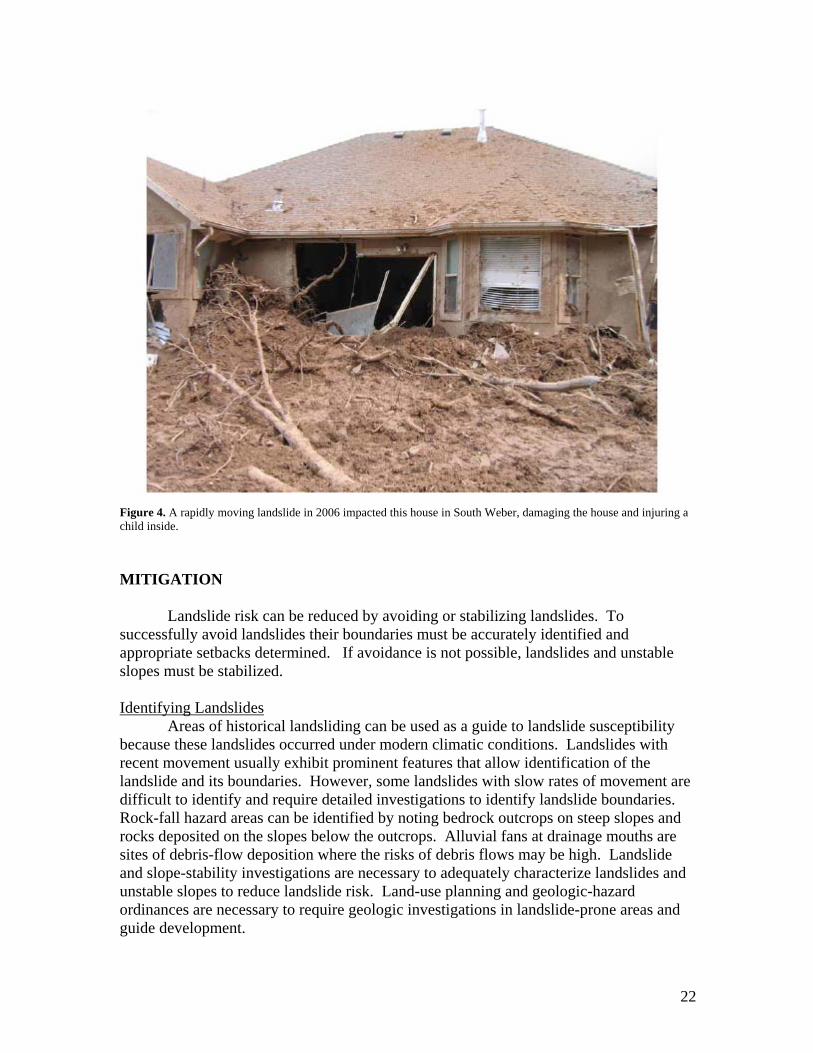
Figure 4. A rapidly moving landslide in 2006 impacted this house in South Weber, damaging the house and injuring a child inside. MITIGATION
Landslide risk can be reduced by avoiding or stabilizing landslides. To
successfully avoid landslides their boundaries must be accurately identified and appropriate setbacks determined. If avoidance is not possible, landslides and unstable slopes must be stabilized. Identifying Landslides
Areas of historical landsliding can be used as a guide to landslide susceptibility because these landslides occurred under modern climatic conditions. Landslides with recent movement usually exhibit prominent features that allow identification of the landslide and its boundaries. However, some landslides with slow rates of movement are difficult to identify and require detailed investigations to identify landslide boundaries. Rock-fall hazard areas can be identified by noting bedrock outcrops on steep slopes and rocks deposited on the slopes below the outcrops. Alluvial fans at drainage mouths are sites of debris-flow deposition where the risks of debris flows may be high. Landslide and slope-stability investigations are necessary to adequately characterize landslides and unstable slopes to reduce landslide risk. Land-use planning and geologic-hazard ordinances are necessary to require geologic investigations in landslide-prone areas and guide development.
23
Stabilizing Landslides Slope grading, water drainage, and retaining structures are effective measures for
stabilizing landslides. Slope gradients are reduced by removing material from the top and placing it at the bottom. Subsurface drainage can lower ground-water levels within a landslide and improve stability. To reduce risk from debris flows on alluvial fans, debris basins are constructed to capture flows. To reduce the risk from rock falls, catchment fences and berms are constructed or rock source areas are stabilized. Landslide stabilization requires detailed investigations by geologists and engineers. Nearly all landslide stabilization measures are expensive but are necessary to minimize the landslide risk to life and property. Where to Find Additional Information Information on landslides in Utah is available from several sources. A small-scale landslide map of Utah (1:500,000 scale – one inch equals 8 miles) by Harty (1991) shows the general distribution of landslides across the state. More detailed maps (1:100,000 scale – one inch equals 1.6 miles) by Harty (1992, 1993) show landslides based on a compilation of mapping by others. Many areas of the state have not been mapped for landslides. A statewide landslide susceptibility map (1:500,000 scale) by Giraud and Shaw (2007) shows landslides and areas of relative landslide potential. The susceptibility map identifies areas of moderate to high susceptibility where local landslide-hazard mapping is needed for land-use planning. Christenson and Shaw (in press) compiled existing county landslide-hazard maps in northern Utah into a Geographic Information System (GIS) to show areas where landslide studies are recommended. Elliott and Kirschbaum (2007) developed a preliminary landslide-history database of Utah from 1850 to 1978. This database is based primarily on newspaper accounts of landslides and can be searched for individual landslide events. All of the above sources provide generalized landslide information, but for subdivision or lot-specific information, site-specific studies are required. Several state and federal agencies have Web sites with landslide information: http://geology.utah.gov/utahgeo/hazards/landslide/index.htm The Utah Geological Survey documents landslide events and provides general information. http://landslides.usgs.gov The U. S. Geological Survey performs landslide research and maintains the National Landslide Information Center. http://www.fema.gov/hazard/landslide/index.shtm The Federal Emergency Management Agency provides information on landslides and debris flows (mudslides) including emergency response and preparedness. http://www.planning.org/landslides/docs/main.html The American Planning Association provides planning information pertaining to landslides. A Plan to Reduce Losses from Geologic Hazards in Utah – Recommendations of the Governor’s Geologic Hazards Working Group ,2006-2007. Utah Geological Survey: http://geology.utah.gov/online/c/c-104.pdf
24
REFERENCES Anderson, L.R., Keaton, J.R., Saarinen, T.F., and Wells, W.G. II, 1984, The Utah
landslides, debris flows, and floods of May and June 1983: Washington, D.C., National Academy Press, 96 p.
Ashland, F.X., 2003, Characteristics, causes, and implications of the 1998 Wasatch Front landslides: Utah Geological Survey Special Study 105, 49 p.
Christenson, G.E., and Ashland, F.X., compliers, 2007, A plan to reduce losses from
geologic hazards in Utah – recommendations of the Governor’s Geologic Hazards Working Group 2006-2007: Utah Geological Survey Circular 104, 30 p.
Christenson, G.E., and Shaw, L.M., in press, Compilation of a GIS map database showing
geologic-hazards special-study areas, Wasatch Front, Utah: Utah Geological Survey Map, scale 1:24,000.
Cruden, D.M., and Varnes, D.J., 1996, Landslide types and processes, in Turner, A.K.,
and Schuster, R.L., editors, Landslides – investigation and mitigation: Washington, D.C., National Academy Press, National Research Council, Transportation Research Board Special Report 247, p. 36-75.
Elliott, A.H., and Kirschbaum, M.J., 2007, The preliminary landslide history database of
Utah: Utah Geological Survey Open-File Report 514, CD-ROM. Giraud, R.G., and Shaw, L.M., 2007, Landslide susceptibility map of Utah: Utah
Geological Survey Map 228DM, 11 p. booklet, scale 1:500,000, DVD. Harty, K.M., 1989, Landslide mapping, hazards, and historical landslides in Utah: Utah
Geological and Mineral Survey, Survey Notes, v. 23, no. 4, p. 2-8. Harty, K.M., 1991, Landslide map of Utah: Utah Geological and Mineral Survey Map
133, 28 p. pamphlet, scale 1:500,000. Harty, K.M., 1992, Landslide maps of various 30’ x 60’ quadrangles, Utah: Utah
Geological Survey Open-File Reports 236, 237, 239, 240, 245, 247, 248, 249, 250, 252, 253, 254, 256, 257, 259, 260, 261, 263, 265, 266, scale 1:100,000.
Harty, K.M., 1993, Landslide maps of various 30’ x 60’ quadrangles, Utah: Utah
Geological Survey Open-File Reports 267, 268, 271, 272, 273, 274, 275, 276, 277, 278, 279, 280, 281, 282, 283, 289, 290, 291, 292, 293, 294, 295, scale 1:100,000.
Schuster, R.L., 1996, Socioeconomic significance of landslides, in Turner, A.K., and
Schuster, R.L., editors, Landslides – investigation and mitigation: Washington, D.C., National Academy Press, National Research Council, Transportation Research Board Special Report 247, p. 12-35.

25
Varnes, D.J., 1978, Slope movement types and processes, in Schuster, R.L., and Krizek, R.J., editors, Landslides – analysis and control: Washington, D.C., National Academy of Sciences, National Research Council, Transportation Research Board Special Report 176, p. 11-33.
Zaruba, Q., and Mencl, V., 1969, Landslides and their control: Amsterdam, Elsevier, 205
26
PROBLEM SOIL AND ROCK
Sandra N. Eldredge, William E. Mulvey, and Gary E. Christenson Utah Geological Survey
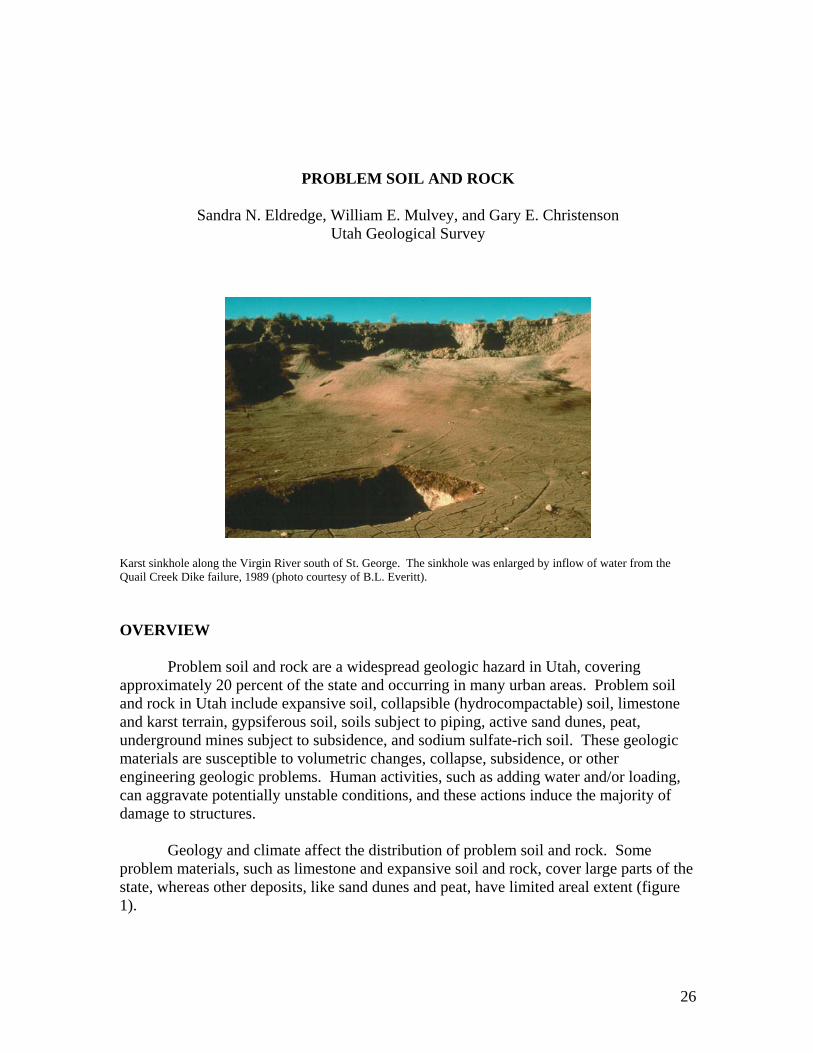
Karst sinkhole along the Virgin River south of St. George. The sinkhole was enlarged by inflow of water from the Quail Creek Dike failure, 1989 (photo courtesy of B.L. Everitt). OVERVIEW Problem soil and rock are a widespread geologic hazard in Utah, covering approximately 20 percent of the state and occurring in many urban areas. Problem soil and rock in Utah include expansive soil, collapsible (hydrocompactable) soil, limestone and karst terrain, gypsiferous soil, soils subject to piping, active sand dunes, peat, underground mines subject to subsidence, and sodium sulfate-rich soil. These geologic materials are susceptible to volumetric changes, collapse, subsidence, or other engineering geologic problems. Human activities, such as adding water and/or loading, can aggravate potentially unstable conditions, and these actions induce the majority of damage to structures.
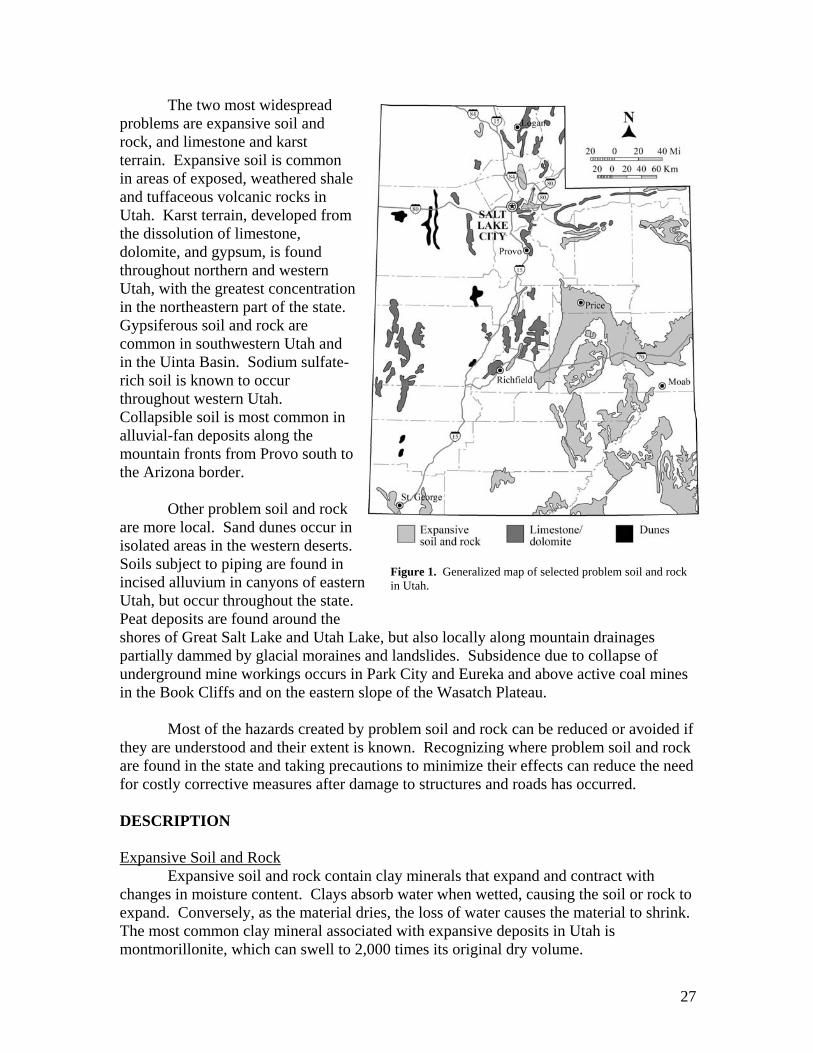
Geology and climate affect the distribution of problem soil and rock. Some problem materials, such as limestone and expansive soil and rock, cover large parts of the state, whereas other deposits, like sand dunes and peat, have limited areal extent (figure 1).
27
The two most widespread problems are expansive soil and rock, and limestone and karst terrain. Expansive soil is common in areas of exposed, weathered shale and tuffaceous volcanic rocks in Utah. Karst terrain, developed from the dissolution of limestone, dolomite, and gypsum, is found throughout northern and western Utah, with the greatest concentration in the northeastern part of the state. Gypsiferous soil and rock are common in southwestern Utah and in the Uinta Basin. Sodium sulfate-rich soil is known to occur throughout western Utah. Collapsible soil is most common in alluvial-fan deposits along the mountain fronts from Provo south to the Arizona border. Other problem soil and rock are more local. Sand dunes occur in isolated areas in the western deserts. Soils subject to piping are found in incised alluvium in canyons of eastern Utah, but occur throughout the state. Peat deposits are found around the shores of Great Salt Lake and Utah Lake, but also locally along mountain drainages partially dammed by glacial moraines and landslides. Subsidence due to collapse of underground mine workings occurs in Park City and Eureka and above active coal mines in the Book Cliffs and on the eastern slope of the Wasatch Plateau.
Most of the hazards created by problem soil and rock can be reduced or avoided if they are understood and their extent is known. Recognizing where problem soil and rock are found in the state and taking precautions to minimize their effects can reduce the need for costly corrective measures after damage to structures and roads has occurred. DESCRIPTION Expansive Soil and Rock Expansive soil and rock contain clay minerals that expand and contract with changes in moisture content. Clays absorb water when wetted, causing the soil or rock to expand. Conversely, as the material dries, the loss of water causes the material to shrink. The most common clay mineral associated with expansive deposits in Utah is montmorillonite, which can swell to 2,000 times its original dry volume.
Figure 1. Generalized map of selected problem soil and rock in Utah.
28
Problems associated with expansive materials are foundation cracking, heaving and cracking of road surfaces and other concrete slabs, and failure of wastewater disposal systems. Sidewalks and roads are particularly susceptible to damage. Wastewater disposal systems using soil absorption fields are damaged when clay-rich deposits go through the wet-dry cycle. When dry, cracks develop leaving voids that allow large volumes of water to infiltrate until the soil expands and the voids are closed. The soil then becomes impermeable and systems clog and fail, causing wastewater to discharge at the ground surface.
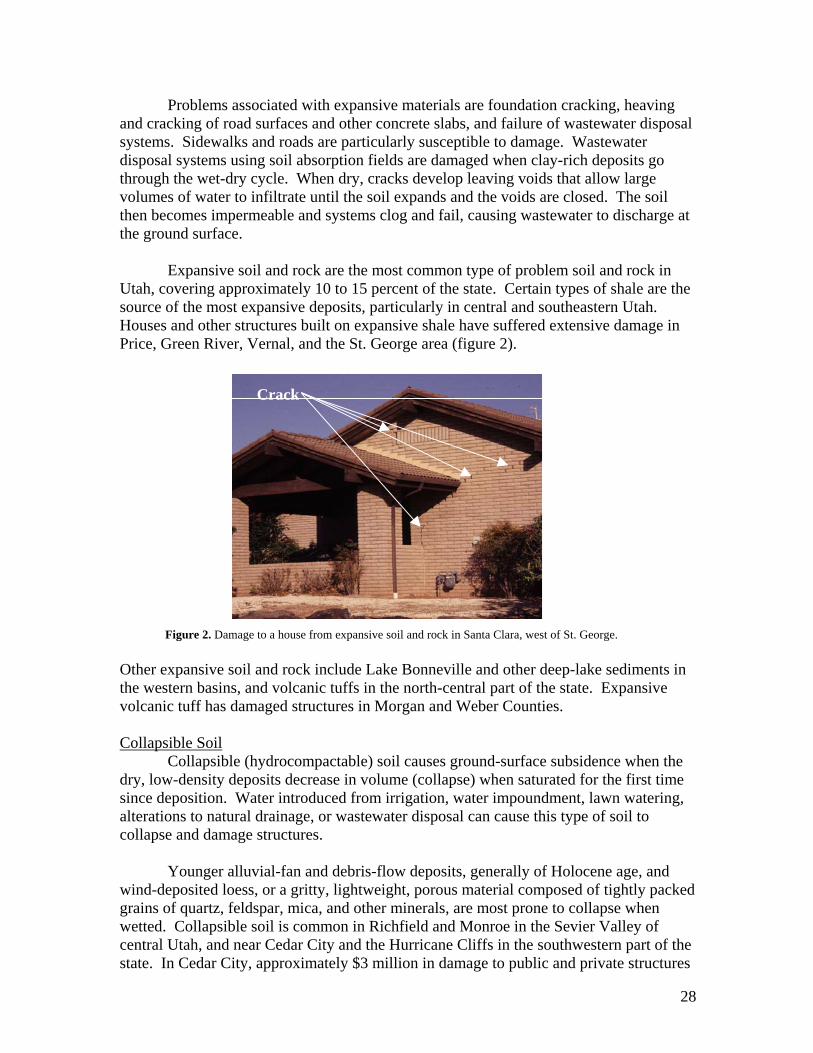
Expansive soil and rock are the most common type of problem soil and rock in Utah, covering approximately 10 to 15 percent of the state. Certain types of shale are the source of the most expansive deposits, particularly in central and southeastern Utah. Houses and other structures built on expansive shale have suffered extensive damage in Price, Green River, Vernal, and the St. George area (figure 2).
Figure 2. Damage to a house from expansive soil and rock in Santa Clara, west of St. George. Other expansive soil and rock include Lake Bonneville and other deep-lake sediments in the western basins, and volcanic tuffs in the north-central part of the state. Expansive volcanic tuff has damaged structures in Morgan and Weber Counties. Collapsible Soil Collapsible (hydrocompactable) soil causes ground-surface subsidence when the dry, low-density deposits decrease in volume (collapse) when saturated for the first time since deposition. Water introduced from irrigation, water impoundment, lawn watering, alterations to natural drainage, or wastewater disposal can cause this type of soil to collapse and damage structures. Younger alluvial-fan and debris-flow deposits, generally of Holocene age, and wind-deposited loess, or a gritty, lightweight, porous material composed of tightly packed grains of quartz, feldspar, mica, and other minerals, are most prone to collapse when wetted. Collapsible soil is common in Richfield and Monroe in the Sevier Valley of central Utah, and near Cedar City and the Hurricane Cliffs in the southwestern part of the state. In Cedar City, approximately $3 million in damage to public and private structures
Crack
29
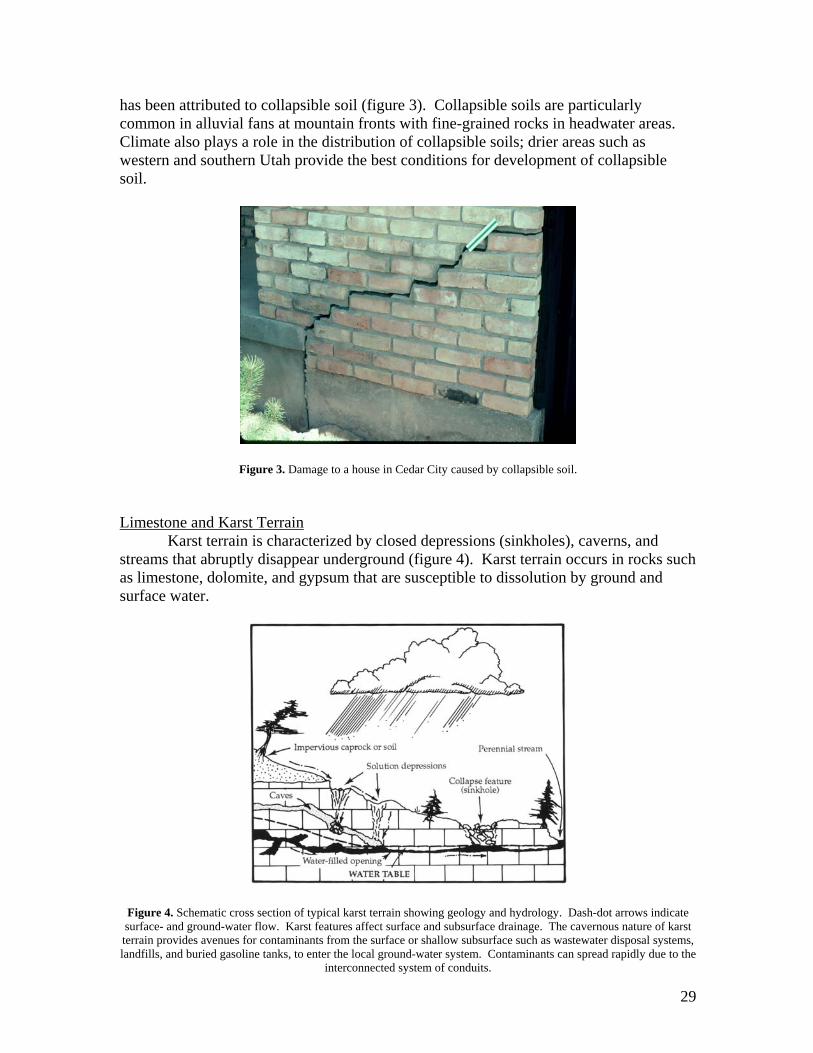
has been attributed to collapsible soil (figure 3). Collapsible soils are particularly common in alluvial fans at mountain fronts with fine-grained rocks in headwater areas. Climate also plays a role in the distribution of collapsible soils; drier areas such as western and southern Utah provide the best conditions for development of collapsible soil.
Figure 3. Damage to a house in Cedar City caused by collapsible soil.
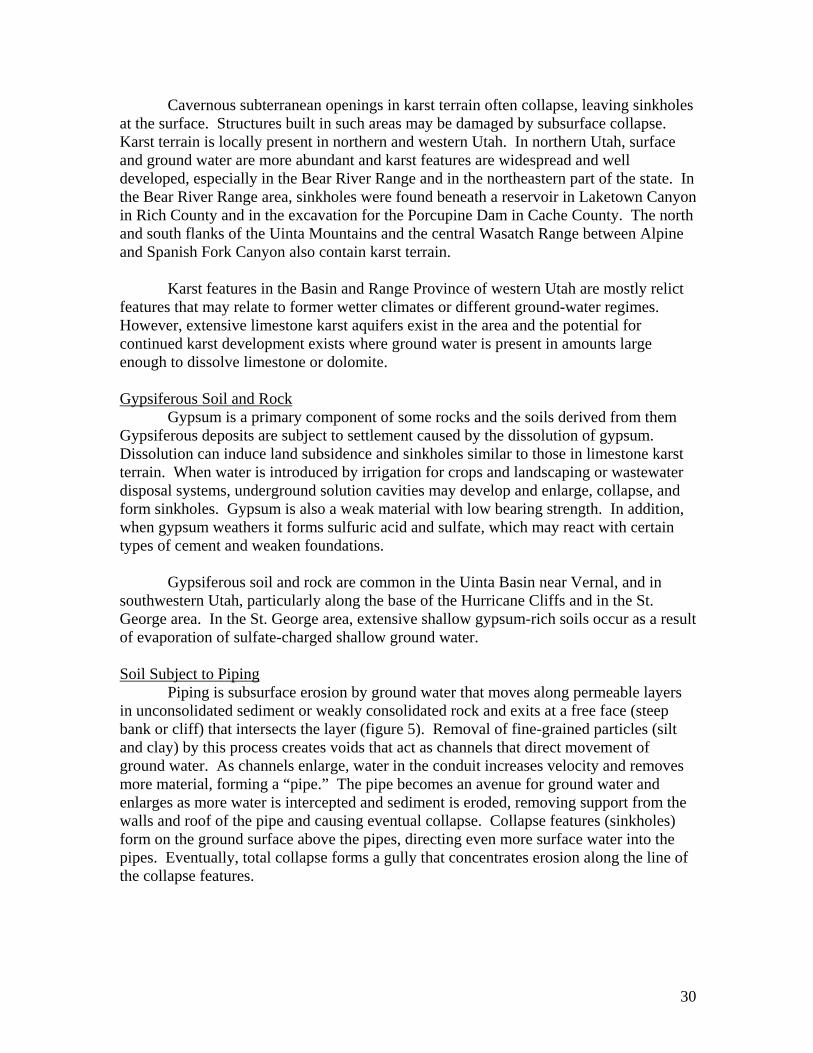
Limestone and Karst Terrain Karst terrain is characterized by closed depressions (sinkholes), caverns, and streams that abruptly disappear underground (figure 4). Karst terrain occurs in rocks such as limestone, dolomite, and gypsum that are susceptible to dissolution by ground and surface water.
Figure 4. Schematic cross section of typical karst terrain showing geology and hydrology. Dash-dot arrows indicate surface- and ground-water flow. Karst features affect surface and subsurface drainage. The cavernous nature of karst terrain provides avenues for contaminants from the surface or shallow subsurface such as wastewater disposal systems, landfills, and buried gasoline tanks, to enter the local ground-water system. Contaminants can spread rapidly due to the
interconnected system of conduits.
30
Cavernous subterranean openings in karst terrain often collapse, leaving sinkholes at the surface. Structures built in such areas may be damaged by subsurface collapse. Karst terrain is locally present in northern and western Utah. In northern Utah, surface and ground water are more abundant and karst features are widespread and well developed, especially in the Bear River Range and in the northeastern part of the state. In the Bear River Range area, sinkholes were found beneath a reservoir in Laketown Canyon in Rich County and in the excavation for the Porcupine Dam in Cache County. The north and south flanks of the Uinta Mountains and the central Wasatch Range between Alpine and Spanish Fork Canyon also contain karst terrain. Karst features in the Basin and Range Province of western Utah are mostly relict features that may relate to former wetter climates or different ground-water regimes. However, extensive limestone karst aquifers exist in the area and the potential for continued karst development exists where ground water is present in amounts large enough to dissolve limestone or dolomite. Gypsiferous Soil and Rock Gypsum is a primary component of some rocks and the soils derived from them Gypsiferous deposits are subject to settlement caused by the dissolution of gypsum. Dissolution can induce land subsidence and sinkholes similar to those in limestone karst terrain. When water is introduced by irrigation for crops and landscaping or wastewater disposal systems, underground solution cavities may develop and enlarge, collapse, and form sinkholes. Gypsum is also a weak material with low bearing strength. In addition, when gypsum weathers it forms sulfuric acid and sulfate, which may react with certain types of cement and weaken foundations. Gypsiferous soil and rock are common in the Uinta Basin near Vernal, and in southwestern Utah, particularly along the base of the Hurricane Cliffs and in the St. George area. In the St. George area, extensive shallow gypsum-rich soils occur as a result of evaporation of sulfate-charged shallow ground water. Soil Subject to Piping Piping is subsurface erosion by ground water that moves along permeable layers in unconsolidated sediment or weakly consolidated rock and exits at a free face (steep bank or cliff) that intersects the layer (figure 5). Removal of fine-grained particles (silt and clay) by this process creates voids that act as channels that direct movement of ground water. As channels enlarge, water in the conduit increases velocity and removes more material, forming a “pipe.” The pipe becomes an avenue for ground water and enlarges as more water is intercepted and sediment is eroded, removing support from the walls and roof of the pipe and causing eventual collapse. Collapse features (sinkholes) form on the ground surface above the pipes, directing even more surface water into the pipes. Eventually, total collapse forms a gully that concentrates erosion along the line of the collapse features.
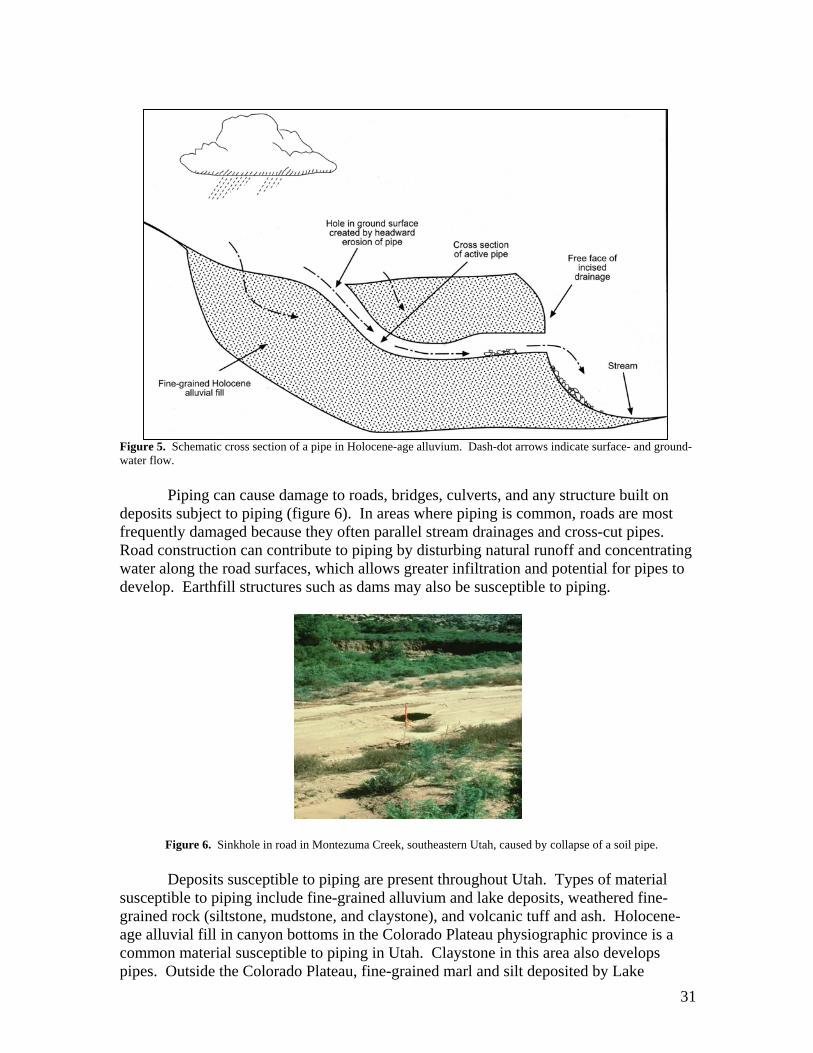
31
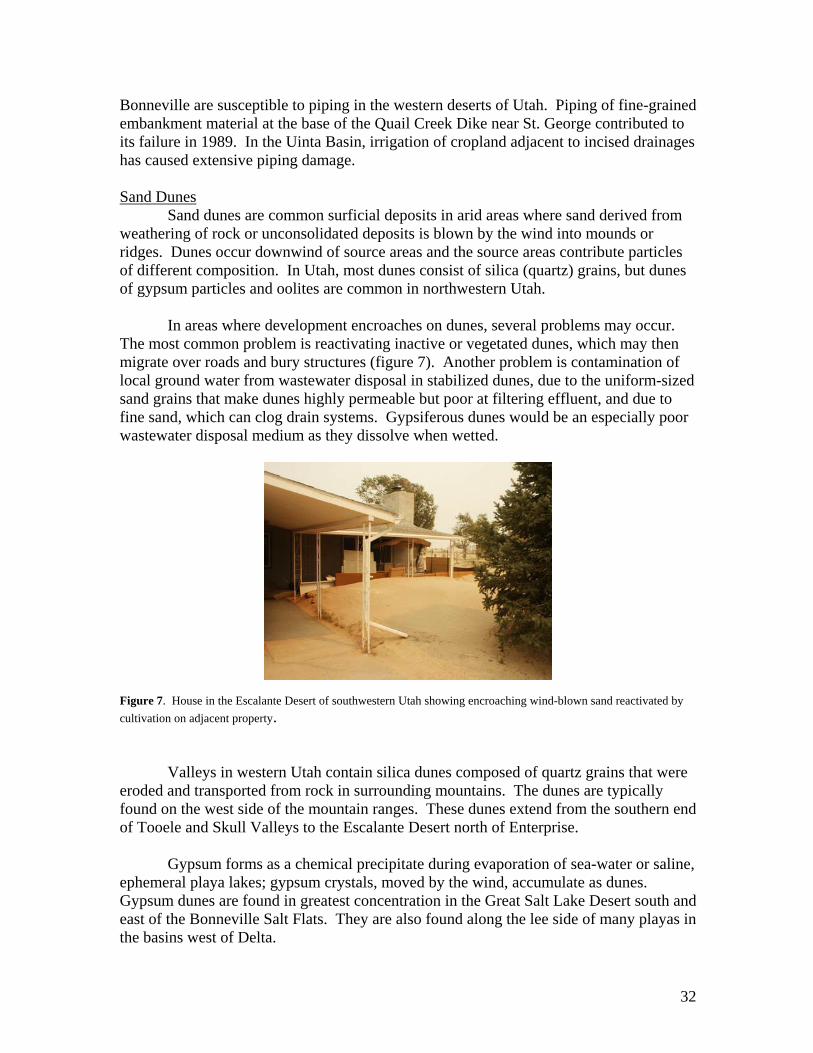
Figure 5. Schematic cross section of a pipe in Holocene-age alluvium. Dash-dot arrows indicate surface- and ground-water flow. Piping can cause damage to roads, bridges, culverts, and any structure built on deposits subject to piping (figure 6). In areas where piping is common, roads are most frequently damaged because they often parallel stream drainages and cross-cut pipes. Road construction can contribute to piping by disturbing natural runoff and concentrating water along the road surfaces, which allows greater infiltration and potential for pipes to develop. Earthfill structures such as dams may also be susceptible to piping.
Figure 6. Sinkhole in road in Montezuma Creek, southeastern Utah, caused by collapse of a soil pipe. Deposits susceptible to piping are present throughout Utah. Types of material susceptible to piping include fine-grained alluvium and lake deposits, weathered fine-grained rock (siltstone, mudstone, and claystone), and volcanic tuff and ash. Holocene-age alluvial fill in canyon bottoms in the Colorado Plateau physiographic province is a common material susceptible to piping in Utah. Claystone in this area also develops pipes. Outside the Colorado Plateau, fine-grained marl and silt deposited by Lake
32
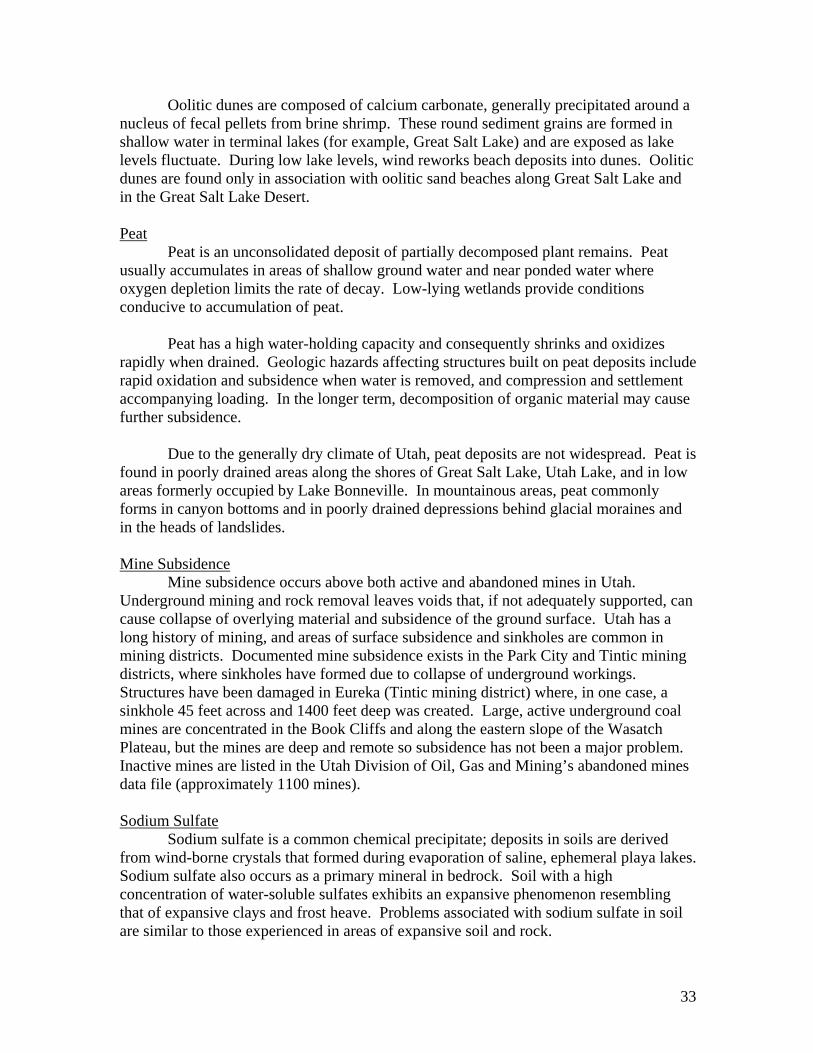
Bonneville are susceptible to piping in the western deserts of Utah. Piping of fine-grained embankment material at the base of the Quail Creek Dike near St. George contributed to its failure in 1989. In the Uinta Basin, irrigation of cropland adjacent to incised drainages has caused extensive piping damage. Sand Dunes Sand dunes are common surficial deposits in arid areas where sand derived from weathering of rock or unconsolidated deposits is blown by the wind into mounds or ridges. Dunes occur downwind of source areas and the source areas contribute particles of different composition. In Utah, most dunes consist of silica (quartz) grains, but dunes of gypsum particles and oolites are common in northwestern Utah. In areas where development encroaches on dunes, several problems may occur. The most common problem is reactivating inactive or vegetated dunes, which may then migrate over roads and bury structures (figure 7). Another problem is contamination of local ground water from wastewater disposal in stabilized dunes, due to the uniform-sized sand grains that make dunes highly permeable but poor at filtering effluent, and due to fine sand, which can clog drain systems. Gypsiferous dunes would be an especially poor wastewater disposal medium as they dissolve when wetted.
Figure 7. House in the Escalante Desert of southwestern Utah showing encroaching wind-blown sand reactivated by cultivation on adjacent property.
Valleys in western Utah contain silica dunes composed of quartz grains that were eroded and transported from rock in surrounding mountains. The dunes are typically found on the west side of the mountain ranges. These dunes extend from the southern end of Tooele and Skull Valleys to the Escalante Desert north of Enterprise. Gypsum forms as a chemical precipitate during evaporation of sea-water or saline, ephemeral playa lakes; gypsum crystals, moved by the wind, accumulate as dunes. Gypsum dunes are found in greatest concentration in the Great Salt Lake Desert south and east of the Bonneville Salt Flats. They are also found along the lee side of many playas in the basins west of Delta.
33
Oolitic dunes are composed of calcium carbonate, generally precipitated around a nucleus of fecal pellets from brine shrimp. These round sediment grains are formed in shallow water in terminal lakes (for example, Great Salt Lake) and are exposed as lake levels fluctuate. During low lake levels, wind reworks beach deposits into dunes. Oolitic dunes are found only in association with oolitic sand beaches along Great Salt Lake and in the Great Salt Lake Desert. Peat Peat is an unconsolidated deposit of partially decomposed plant remains. Peat usually accumulates in areas of shallow ground water and near ponded water where oxygen depletion limits the rate of decay. Low-lying wetlands provide conditions conducive to accumulation of peat. Peat has a high water-holding capacity and consequently shrinks and oxidizes rapidly when drained. Geologic hazards affecting structures built on peat deposits include rapid oxidation and subsidence when water is removed, and compression and settlement accompanying loading. In the longer term, decomposition of organic material may cause further subsidence. Due to the generally dry climate of Utah, peat deposits are not widespread. Peat is found in poorly drained areas along the shores of Great Salt Lake, Utah Lake, and in low areas formerly occupied by Lake Bonneville. In mountainous areas, peat commonly forms in canyon bottoms and in poorly drained depressions behind glacial moraines and in the heads of landslides. Mine Subsidence Mine subsidence occurs above both active and abandoned mines in Utah. Underground mining and rock removal leaves voids that, if not adequately supported, can cause collapse of overlying material and subsidence of the ground surface. Utah has a long history of mining, and areas of surface subsidence and sinkholes are common in mining districts. Documented mine subsidence exists in the Park City and Tintic mining districts, where sinkholes have formed due to collapse of underground workings. Structures have been damaged in Eureka (Tintic mining district) where, in one case, a sinkhole 45 feet across and 1400 feet deep was created. Large, active underground coal mines are concentrated in the Book Cliffs and along the eastern slope of the Wasatch Plateau, but the mines are deep and remote so subsidence has not been a major problem. Inactive mines are listed in the Utah Division of Oil, Gas and Mining’s abandoned mines data file (approximately 1100 mines). Sodium Sulfate Sodium sulfate is a common chemical precipitate; deposits in soils are derived from wind-borne crystals that formed during evaporation of saline, ephemeral playa lakes. Sodium sulfate also occurs as a primary mineral in bedrock. Soil with a high concentration of water-soluble sulfates exhibits an expansive phenomenon resembling that of expansive clays and frost heave. Problems associated with sodium sulfate in soil are similar to those experienced in areas of expansive soil and rock.
34
Sodium sulfate derived from playa evaporation is common in the Basin and Range Province of western Utah. Sodium sulfate derived from bedrock occurs in Duchesne County and enters into the local surface and ground water. Sodium sulfate-rich soil is present in the highlands north of St. George and in dams impounding stock ponds in the Blue Creek-Howell watershed in Box Elder County. Most sodium sulfate in northern Utah is derived from the fine-grained, deep-water sediments left by Lake Bonneville. MITIGATION Most of the hazards created by problem soil and rock can be reduced or avoided once their extent is known. Recognizing that problem soil and rock cover parts of the state and taking precautions to mitigate the potential hazards can reduce the need for costly corrective measures after damage to structures and roads has occurred. The majority of damage to structures results from human activities, usually through addition of water or by loading or excavation, which aggravate potentially unstable conditions.
Mitigation measures for expansive soil and rock include special foundation designs, gutters and downspouts that direct water away from foundation slabs, landscape vegetation that does not concentrate or draw large amounts of water from the soil near foundations or require irrigation, and insulated floors or walls near heating or cooling units to prevent evaporation that could cause local changes in soil moisture. If collapsible soils are suspected to be present, soil consolidation tests can be performed. Mitigation methods include pre-soaking and/or compacting, excavating and backfilling with suitable material, and landscaping to direct water away from a structure. Avoiding areas underlain by limestone and dolomite is the best method of preventing ground-water contamination and collapse problems in karst terrain. If this is not possible, preconstruction planning and design of wastewater disposal systems based on thorough geologic and hydrologic investigations can avoid areas of potential sinkholes and prevent ground-water pollution. Soil tests can determine the presence of gypsum. If gypsum is present, the outer walls of structures can be coated with impermeable coatings, special types of concrete can be used that resist damage from gypsum, runoff from roofs and gutters can be directed away from structures, and landscaping close to a structure can avoid plants that require regular watering. Limiting the degree to which natural drainage in soil susceptible to piping is disturbed by construction can reduce damage caused by piping. Proper drainage along roads and around structures is the most cost effective and successful mitigation procedure. Active dunes should be avoided because of their constant movement and unstable nature. Usually, dunes are a maintenance problem and do not preclude development. In general, peat deposits should be removed or avoided. Risk from mine subsidence is reduced by enforcement of laws that require mining companies to devise mining methods that reduce the potential for surface subsidence. If subsidence occurs, the mine is required to alter their mining methods to prevent further subsidence. Mine maps may be available in areas of abandoned mines to avoid areas of potential collapse. Mitigation measures for sodium sulfate-rich soils are similar to those listed for expansive soil.
35
Where to Find Additional Information
http://soils.usda.gov/ Regional and local soil surveys, with information on soil types and engineering properties, are available from the Natural Resources Conservation Service (formerly Soil Conservation Service). http://geology.utah.gov/ Engineering-geologic information and geologic-hazards maps, including problem soil and rock maps for some areas, are available from the Utah Geological Survey. http://www.ogm.utah.gov/ Listings of abandoned mines and their conditions can be obtained from the Utah Division of Oil, Gas and Mining. REFERENCES Mulvey, W.E., 1992, Soil and rock causing engineering geologic problems in Utah: Utah Geological Survey Special Study 80, 23 p., scale 1:500,000.
Nelson, J.D., and Miller, D.J., 1992, Expansive soils, problems and practice in foundation and pavement engineering: New York, John Wiley & Sons, 259 p.
Noe, D.C., Jochim, C.L., and Rogers, W.P. (second edition revised by D.C. Noe), 2007,
A guide to swelling soil for Colorado homebuyers and homeowners: Colorado Geological Survey Special Publication 43, 52 p.
Owens, R.L., and Rollins, K.M., 1990, Collapsible soil hazard map for the southern
Wasatch Front, Utah: Utah Geological and Mineral Survey Miscellaneous Publication 90-1, 38 p.
Rollins, K.M., and Rogers, G.W., 1994, Mitigation measures for small structures on collapsible alluvial soils: Journal of Geotechnical Engineering, v. 120, no. 9, p. 1533-1553.
Rollins, K.M., Rollins, R.L., Smith, T.D., and Beckwith, G.H., 1994, Identification and characterization of collapsible gravels: Journal of Geotechnical Engineering, v. 120, no. 3, p. 528-542.
Rollins, K.M., and Williams, T., 1991, Collapsible soil mapping for Cedar City, Utah, in McCalpin, J.P., editor, Engineering Geology and Geotechnical Engineering Symposium No. 27: Pocatello, Idaho State University, p. 31-1 to 31-16.
Shelton, D.C., and Prouty, D., 1979, Nature’s building codes: Colorado Geological Survey Special Publication 12, p. 37-40.
36
Radon: How to Protect Your Home and Family
David Neville, M.S., RMS and John Hultquist, B.S., RMS
Department of Environmental Quality
Division of Radiation Control Indoor Radon Program
OVERVIEW
Most people have heard about radon, usually in chemistry class when noble gases are discussed, but few know the importance it has in our daily lives. Radon is a radioactive gas released from the nuclear decay process of uranium and radium, which are trace elements in many soils. Because radon is a radioactive gas that is tasteless, invisible, and odorless, it presents unique challenges in minimizing our daily exposure to this naturally occurring radiation. This chapter will discuss the history of radon, the health effects of radon, how to test for radon, and how to mitigate a radon problem. History of Radon
The history of radon begins with a theoretical physicist name Friedrich Ernst Dorn. While studying the natural radioactive decay of radium, he detected a radioactive gas and called it radium emanation. It has been called radon since the 1920’s.
Further understanding of radon came out of Bohemia and the four corners area of the United States, where uranium mining occurred in large quantities. Because radon is a
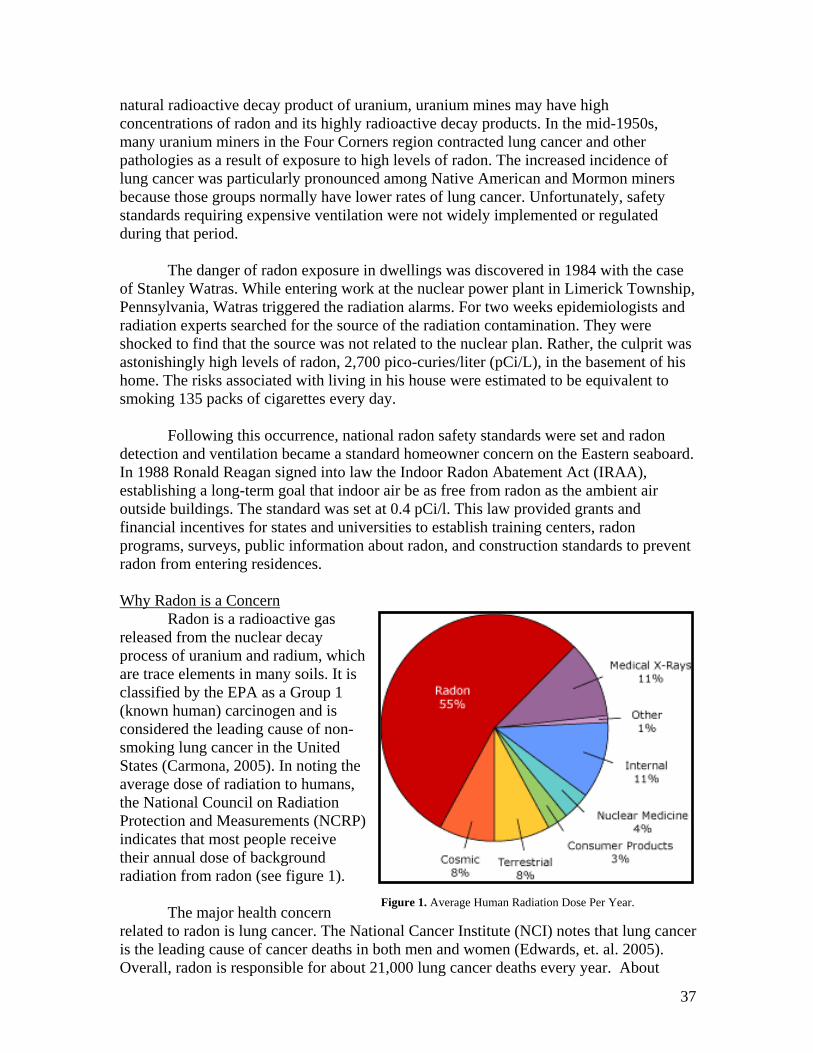
37
natural radioactive decay product of uranium, uranium mines may have high concentrations of radon and its highly radioactive decay products. In the mid-1950s, many uranium miners in the Four Corners region contracted lung cancer and other pathologies as a result of exposure to high levels of radon. The increased incidence of lung cancer was particularly pronounced among Native American and Mormon miners because those groups normally have lower rates of lung cancer. Unfortunately, safety standards requiring expensive ventilation were not widely implemented or regulated during that period.
The danger of radon exposure in dwellings was discovered in 1984 with the case of Stanley Watras. While entering work at the nuclear power plant in Limerick Township, Pennsylvania, Watras triggered the radiation alarms. For two weeks epidemiologists and radiation experts searched for the source of the radiation contamination. They were shocked to find that the source was not related to the nuclear plan. Rather, the culprit was astonishingly high levels of radon, 2,700 pico-curies/liter (pCi/L), in the basement of his home. The risks associated with living in his house were estimated to be equivalent to smoking 135 packs of cigarettes every day.
Following this occurrence, national radon safety standards were set and radon detection and ventilation became a standard homeowner concern on the Eastern seaboard. In 1988 Ronald Reagan signed into law the Indoor Radon Abatement Act (IRAA), establishing a long-term goal that indoor air be as free from radon as the ambient air outside buildings. The standard was set at 0.4 pCi/l. This law provided grants and financial incentives for states and universities to establish training centers, radon programs, surveys, public information about radon, and construction standards to prevent radon from entering residences. Why Radon is a Concern
Radon is a radioactive gas released from the nuclear decay process of uranium and radium, which are trace elements in many soils. It is classified by the EPA as a Group 1 (known human) carcinogen and is considered the leading cause of non-smoking lung cancer in the United States (Carmona, 2005). In noting the average dose of radiation to humans, the National Council on Radiation Protection and Measurements (NCRP) indicates that most people receive their annual dose of background radiation from radon (see figure 1).
The major health concern related to radon is lung cancer. The National Cancer Institute (NCI) notes that lung cancer is the leading cause of cancer deaths in both men and women (Edwards, et. al. 2005). Overall, radon is responsible for about 21,000 lung cancer deaths every year. About
Figure 1. Average Human Radiation Dose Per Year.
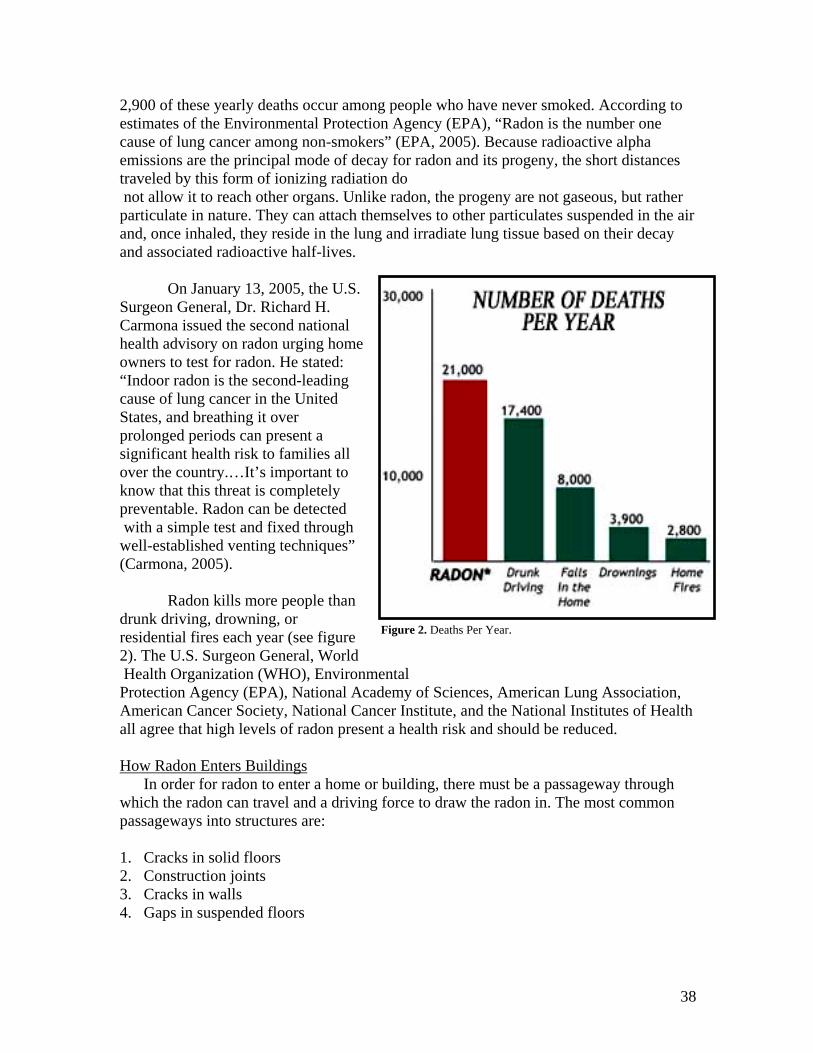
38
2,900 of these yearly deaths occur among people who have never smoked. According to estimates of the Environmental Protection Agency (EPA), “Radon is the number one cause of lung cancer among non-smokers” (EPA, 2005). Because radioactive alpha emissions are the principal mode of decay for radon and its progeny, the short distances traveled by this form of ionizing radiation do not allow it to reach other organs. Unlike radon, the progeny are not gaseous, but rather particulate in nature. They can attach themselves to other particulates suspended in the air and, once inhaled, they reside in the lung and irradiate lung tissue based on their decay and associated radioactive half-lives.
On January 13, 2005, the U.S. Surgeon General, Dr. Richard H. Carmona issued the second national health advisory on radon urging home owners to test for radon. He stated: “Indoor radon is the second-leading cause of lung cancer in the United States, and breathing it over prolonged periods can present a significant health risk to families all over the country.…It’s important to know that this threat is completely preventable. Radon can be detected with a simple test and fixed through well-established venting techniques” (Carmona, 2005).
Radon kills more people than drunk driving, drowning, or residential fires each year (see figure 2). The U.S. Surgeon General, World Health Organization (WHO), Environmental Protection Agency (EPA), National Academy of Sciences, American Lung Association, American Cancer Society, National Cancer Institute, and the National Institutes of Health all agree that high levels of radon present a health risk and should be reduced. How Radon Enters Buildings
In order for radon to enter a home or building, there must be a passageway through which the radon can travel and a driving force to draw the radon in. The most common passageways into structures are: 1. Cracks in solid floors 2. Construction joints 3. Cracks in walls 4. Gaps in suspended floors
Figure 2. Deaths Per Year.
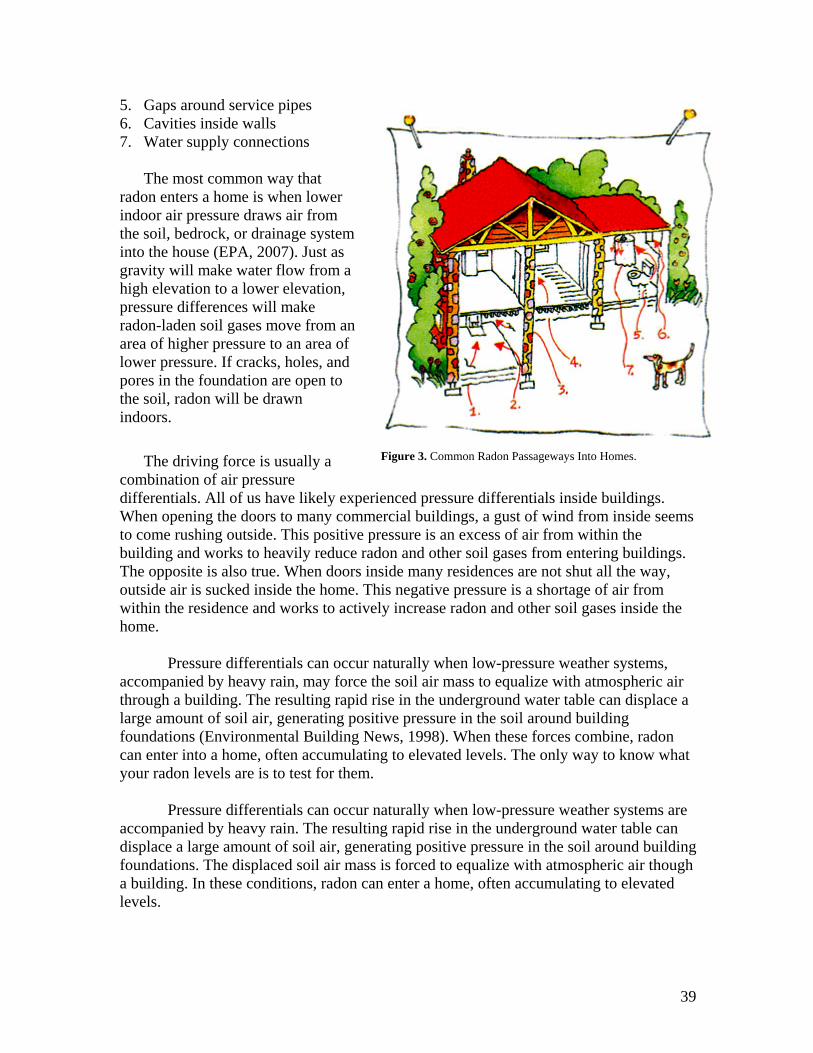
39
5. Gaps around service pipes 6. Cavities inside walls 7. Water supply connections
The most common way that
radon enters a home is when lower indoor air pressure draws air from the soil, bedrock, or drainage system into the house (EPA, 2007). Just as gravity will make water flow from a high elevation to a lower elevation, pressure differences will make radon-laden soil gases move from an area of higher pressure to an area of lower pressure. If cracks, holes, and pores in the foundation are open to the soil, radon will be drawn indoors.
The driving force is usually a combination of air pressure differentials. All of us have likely experienced pressure differentials inside buildings. When opening the doors to many commercial buildings, a gust of wind from inside seems to come rushing outside. This positive pressure is an excess of air from within the building and works to heavily reduce radon and other soil gases from entering buildings. The opposite is also true. When doors inside many residences are not shut all the way, outside air is sucked inside the home. This negative pressure is a shortage of air from within the residence and works to actively increase radon and other soil gases inside the home.
Pressure differentials can occur naturally when low-pressure weather systems, accompanied by heavy rain, may force the soil air mass to equalize with atmospheric air through a building. The resulting rapid rise in the underground water table can displace a large amount of soil air, generating positive pressure in the soil around building foundations (Environmental Building News, 1998). When these forces combine, radon can enter into a home, often accumulating to elevated levels. The only way to know what your radon levels are is to test for them.
Pressure differentials can occur naturally when low-pressure weather systems are accompanied by heavy rain. The resulting rapid rise in the underground water table can displace a large amount of soil air, generating positive pressure in the soil around building foundations. The displaced soil air mass is forced to equalize with atmospheric air though a building. In these conditions, radon can enter a home, often accumulating to elevated levels.
Figure 3. Common Radon Passageways Into Homes.
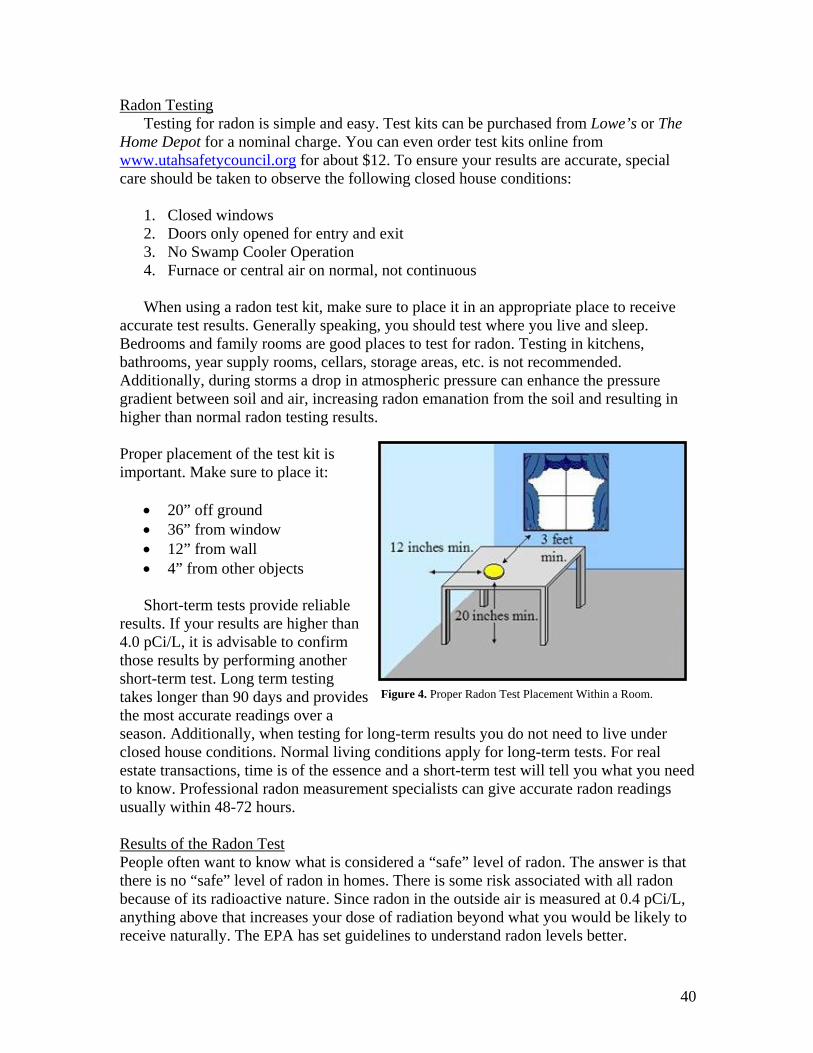
40
Radon Testing Testing for radon is simple and easy. Test kits can be purchased from Lowe’s or The
Home Depot for a nominal charge. You can even order test kits online from www.utahsafetycouncil.org for about $12. To ensure your results are accurate, special care should be taken to observe the following closed house conditions:
1. Closed windows 2. Doors only opened for entry and exit 3. No Swamp Cooler Operation 4. Furnace or central air on normal, not continuous
When using a radon test kit, make sure to place it in an appropriate place to receive
accurate test results. Generally speaking, you should test where you live and sleep. Bedrooms and family rooms are good places to test for radon. Testing in kitchens, bathrooms, year supply rooms, cellars, storage areas, etc. is not recommended. Additionally, during storms a drop in atmospheric pressure can enhance the pressure gradient between soil and air, increasing radon emanation from the soil and resulting in higher than normal radon testing results. Proper placement of the test kit is important. Make sure to place it:
• 20” off ground • 36” from window • 12” from wall • 4” from other objects
Short-term tests provide reliable
results. If your results are higher than 4.0 pCi/L, it is advisable to confirm those results by performing another short-term test. Long term testing takes longer than 90 days and provides the most accurate readings over a season. Additionally, when testing for long-term results you do not need to live under closed house conditions. Normal living conditions apply for long-term tests. For real estate transactions, time is of the essence and a short-term test will tell you what you need to know. Professional radon measurement specialists can give accurate radon readings usually within 48-72 hours. Results of the Radon Test People often want to know what is considered a “safe” level of radon. The answer is that there is no “safe” level of radon in homes. There is some risk associated with all radon because of its radioactive nature. Since radon in the outside air is measured at 0.4 pCi/L, anything above that increases your dose of radiation beyond what you would be likely to receive naturally. The EPA has set guidelines to understand radon levels better.
Figure 4. Proper Radon Test Placement Within a Room.
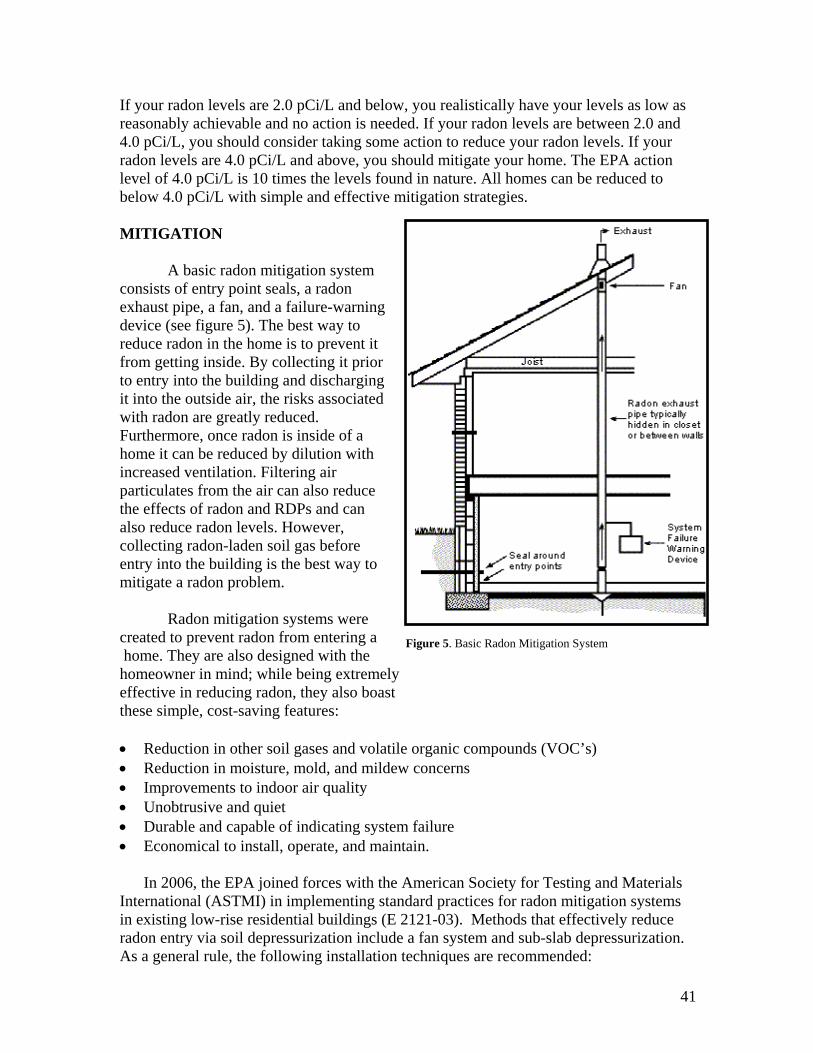
41
If your radon levels are 2.0 pCi/L and below, you realistically have your levels as low as reasonably achievable and no action is needed. If your radon levels are between 2.0 and 4.0 pCi/L, you should consider taking some action to reduce your radon levels. If your radon levels are 4.0 pCi/L and above, you should mitigate your home. The EPA action level of 4.0 pCi/L is 10 times the levels found in nature. All homes can be reduced to below 4.0 pCi/L with simple and effective mitigation strategies. MITIGATION
A basic radon mitigation system consists of entry point seals, a radon exhaust pipe, a fan, and a failure-warning device (see figure 5). The best way to reduce radon in the home is to prevent it from getting inside. By collecting it prior to entry into the building and discharging it into the outside air, the risks associated with radon are greatly reduced. Furthermore, once radon is inside of a home it can be reduced by dilution with increased ventilation. Filtering air particulates from the air can also reduce the effects of radon and RDPs and can also reduce radon levels. However, collecting radon-laden soil gas before entry into the building is the best way to mitigate a radon problem.
Radon mitigation systems were created to prevent radon from entering a home. They are also designed with the homeowner in mind; while being extremely effective in reducing radon, they also boast these simple, cost-saving features: • Reduction in other soil gases and volatile organic compounds (VOC’s) • Reduction in moisture, mold, and mildew concerns • Improvements to indoor air quality • Unobtrusive and quiet • Durable and capable of indicating system failure • Economical to install, operate, and maintain.
In 2006, the EPA joined forces with the American Society for Testing and Materials International (ASTMI) in implementing standard practices for radon mitigation systems in existing low-rise residential buildings (E 2121-03). Methods that effectively reduce radon entry via soil depressurization include a fan system and sub-slab depressurization. As a general rule, the following installation techniques are recommended:
Figure 5. Basic Radon Mitigation System
42
• When placing the piping into the concrete slab, remove 10-15 gallons of dirt, install the 4” PVC piping, and test for suction with a U-tube.
• Placement of a fan must be restricted to areas without conditioned space, e.g. not in crawl spaces, basements, garages with overhead bedrooms.
• The radon exhaust should be 10 feet above the ground with a rodent screen, away from neighboring homes, two feet above the lowest eave of the home, and away from windows. Nobody wants to have a radon system that pumps radon back into the house via a new pathway.
Cost of Radon Mitigation
The cost of a radon mitigation system is similar to the cost of installing a new furnace or replacing your washer and dryer. $1,200-$1,800 is an average cost in Utah, depending, of course, upon the type of foundation and the size of the home. Homes with crawl spaces generally cost more to mitigate, and larger homes may require multiple suction points, thus increasing the cost. Of course, the most cost efficient way to prevent radon from entering homes is by installing a passive system at the time of construction.
By building new homes with radon resistant construction techniques, homeowners can save money and reduce their radon risk at the same time. The additional cost for building a new home with radon resistant techniques is approximately $400-$600. By wiring for a fan in case it’s needed later, builders can keep the costs of turning a passive system into an active system low, too. Typical fan installation is about $300.
Ventilation methods can also assist with reducing and diluting radon. By increasing the fresh air take-up inside a building, radon and other indoor air contaminants are reduced. Increasing air take-up can also reduce the negative pressures within a building, thereby decreasing the radon entry. Caulking cracks in walls and floors can also aid in reducing radon by improving the vacuum within a home and reducing the loss of interior air. CONCLUSION
Radon is a radioactive, tasteless, odorless, invisible gas. It can be found all over the United States and the world. Though radon is found in the outside air at low levels (0.4 pCi/L), inside of homes it can accumulate to high levels, thus increasing the risk of lung cancer. In accordance with advice given by the US Surgeon General, all homes should be tested for radon. Homes with high levels of radon (above the EPA action level of 4.0 pCi/L) should be appropriately mitigated.
"Indoor radon is the second-leading cause of lung cancer in the United States and breathing it over prolonged periods can present a significant health risk to families all over the county. , , ,It's important to know that this threat is completely preventable. Radon can be detected with a simple test and fixed through well-established venting techniques." Richard Carmona, 2005 U.S. Surgeon General
43
Additional information can be found at: The Utah Department of Environmental Quality: http://www.radon.utah.gov The Environmental Protection Agency: http://www.epa.gov/radon The American Lung Association http://www.lungusa.org The American Cancer Society http://www.cancer.org
REFERENCES Carmona, R. H. (2005). Surgeon General Releases National Health Advisory On Radon. Retrieved on January 10, 2008 from http://www.surgeongeneral.gov/pressreleases/ sg01132005.html. Edwards, B.K., Brown, M., Wingo, P.A., Howe, H.L., Ward, E., Ries, L.A.G., Schrag, D., Friedman, C., Harlan, L., Warren, J., Anderson, R.N., and Pickle, L. (2005). Journal of the National Cancer Institute, Vol. 97, No. 19, October 5, 2005. 1407- 1427. Environmental Protection Agency. (2007). A citizen’s guide to radon: The guide to protecting yourself and your family from radon. Retrieved on January 10, 2008 from www.epa.gov/radon/pubs/citguide.html. Wilson, Alex (Editor). 2001. Greening Federal Facilities: An energy, environmental, and economic resource guide for federal facility managers and designers. Second edition. 178-179. Radon and other soil gases: Dealing with the hazards from below. Environmental Building News, Vol. 7, No. 7, July/August 1998, Building Green, Inc., Brattleboro, VT. Retrieved on January 10, 2008 from www.buildinggreen.com. U.S. Environmental Protection Agency, 1993. Radon Prevention in the Design and Construction of Schools and Other Large Buildings (EPA/625/R-92/016), www.epa.gov/iaq. Integrated Environmental Management, Inc. 2008. Radon. Retrieved on January 21, 2008 from http://www.iem-inc.com/prrn.html.
44
Radon: How to Protect Your Home and Family © 2008, Department of Environmental Quality, Radiation Control Division, Indoor Radon Program. All parts of this document may be reproduced for educational and professional purposes, as long as proper credit and notation is granted to the State of Utah’s Department of Environmental Quality. About the Authors: David Neville is the current program coordinator for Utah’s indoor radon program. He holds certifications from the American Association of Radon Scientists and Technologists (AARST), the National Environmental Health Association (NEHA), the National Radon Proficiency Program (NRPP), and is a certified Radon Mitigation Specialist (RMS). He holds a Master’s degree from Utah State University and Bachelor’s degree from the University of Utah. John Hultquist is the current section manager for the Division of Radiation Control’s low level radioactive waste & uranium mills and has worked for the State of Utah’s DEQ for over 22 years. He holds multiple certifications from the Environmental Protection Agency (EPA), the Occupational Safety and Health Administration (OSHA), the Nuclear Regulatory Commission (NRC), and the Department of Energy (DOE). He holds a Bachelor’s degree from the University of Tennessee at Chattanooga. For more information, please contact: Department of Environmental Quality Division of Radiation Control 168 North 1950 West Salt Lake City, UT 84114-4850 www.radon.utah.gov 1 (801) 536-4250 1 (800) 458-0145
45
WEATHER HAZARDS
Kevin Barjenbruch and Brian McInerney National Weather Service Salt Lake City
OVERVIEW
Hazards induced by weather events, such as floods, tornadoes, deadly lightning, winter storms, and extreme hot or cold, claim the lives of more than 500 Americans annually, and injure another 5,000. Average yearly damage from tornadoes, hurricanes, and floods amounts to $11.4 billion dollars, and other events, such as winter weather, severe storms, and drought significantly add to that number. In addition to impacting life and property, industries can also be negatively impacted by weather. Because approximately one-third of the Nation’s Gross Domestic Product industries are at risk to hazardous weather events, revenue losses to industries such as finance, insurance, real estate, retail, wholesale trade, manufacturing, and agriculture, can negatively impact the economic well being of these industries. The National Weather Service (NWS) Mission statement that follows, communicates the essence of the NWS, its reason for being:
" The National Weather Service (NWS) provides weather, hydrologic, and climate forecasts and warnings for the United States, its territories, adjacent waters and ocean areas, for the protection of life and property and the enhancement of the national economy. NWS data and products form a national information database and infrastructure which can be used by other governmental agencies, the private sector, the public, and the global community.”
A general description of how NWS products and services are created and delivered follows below. The remainder of the Weather Hazards section will be divided into four segments: Floods/Flash Floods; Lightning; Severe Thunderstorms; and Winter Storms. Each of these segments includes a description and mitigation section.
The most precise and accurate forecasters and warnings are of little use, however, if these messages are not received and understood. Furthermore, if word of a threat to bodily safety or property is not received, an appropriate response will not occur. Products and services for the State of Utah, ranging from short fused convective warnings, to non-convective warnings to aviation, fire weather, and hydrology are provided by the NWS Salt Lake City and Grand Junction Weather Forecast Offices (WFOs). WFO Grand
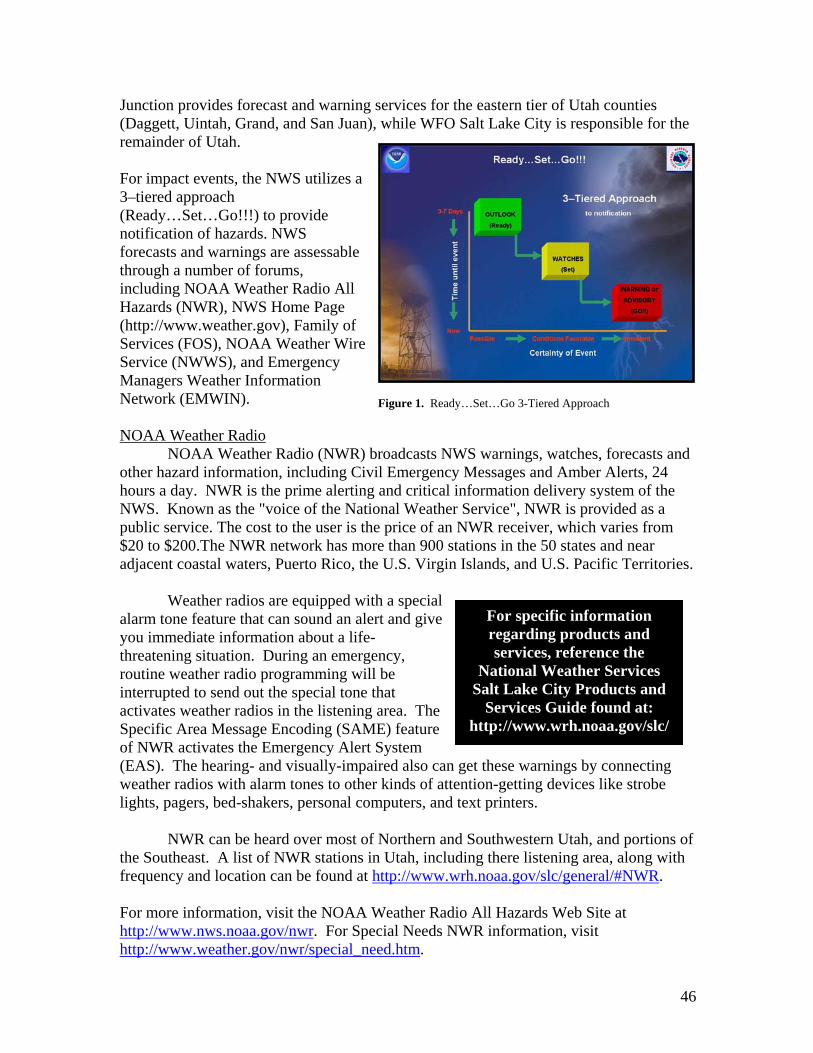
46
For specific information regarding products and services, reference the
National Weather Services Salt Lake City Products and
Services Guide found at: http://www.wrh.noaa.gov/slc/
Junction provides forecast and warning services for the eastern tier of Utah counties (Daggett, Uintah, Grand, and San Juan), while WFO Salt Lake City is responsible for the remainder of Utah. For impact events, the NWS utilizes a 3–tiered approach (Ready…Set…Go!!!) to provide notification of hazards. NWS forecasts and warnings are assessable through a number of forums, including NOAA Weather Radio All Hazards (NWR), NWS Home Page (http://www.weather.gov), Family of Services (FOS), NOAA Weather Wire Service (NWWS), and Emergency Managers Weather Information Network (EMWIN). NOAA Weather Radio
NOAA Weather Radio (NWR) broadcasts NWS warnings, watches, forecasts and other hazard information, including Civil Emergency Messages and Amber Alerts, 24 hours a day. NWR is the prime alerting and critical information delivery system of the NWS. Known as the "voice of the National Weather Service", NWR is provided as a public service. The cost to the user is the price of an NWR receiver, which varies from $20 to $200.The NWR network has more than 900 stations in the 50 states and near adjacent coastal waters, Puerto Rico, the U.S. Virgin Islands, and U.S. Pacific Territories.
Weather radios are equipped with a special
alarm tone feature that can sound an alert and give you immediate information about a life-threatening situation. During an emergency, routine weather radio programming will be interrupted to send out the special tone that activates weather radios in the listening area. The Specific Area Message Encoding (SAME) feature of NWR activates the Emergency Alert System (EAS). The hearing- and visually-impaired also can get these warnings by connecting weather radios with alarm tones to other kinds of attention-getting devices like strobe lights, pagers, bed-shakers, personal computers, and text printers.
NWR can be heard over most of Northern and Southwestern Utah, and portions of
the Southeast. A list of NWR stations in Utah, including there listening area, along with frequency and location can be found at http://www.wrh.noaa.gov/slc/general/#NWR. For more information, visit the NOAA Weather Radio All Hazards Web Site at http://www.nws.noaa.gov/nwr. For Special Needs NWR information, visit http://www.weather.gov/nwr/special_need.htm.
Figure 1. Ready…Set…Go 3-Tiered Approach
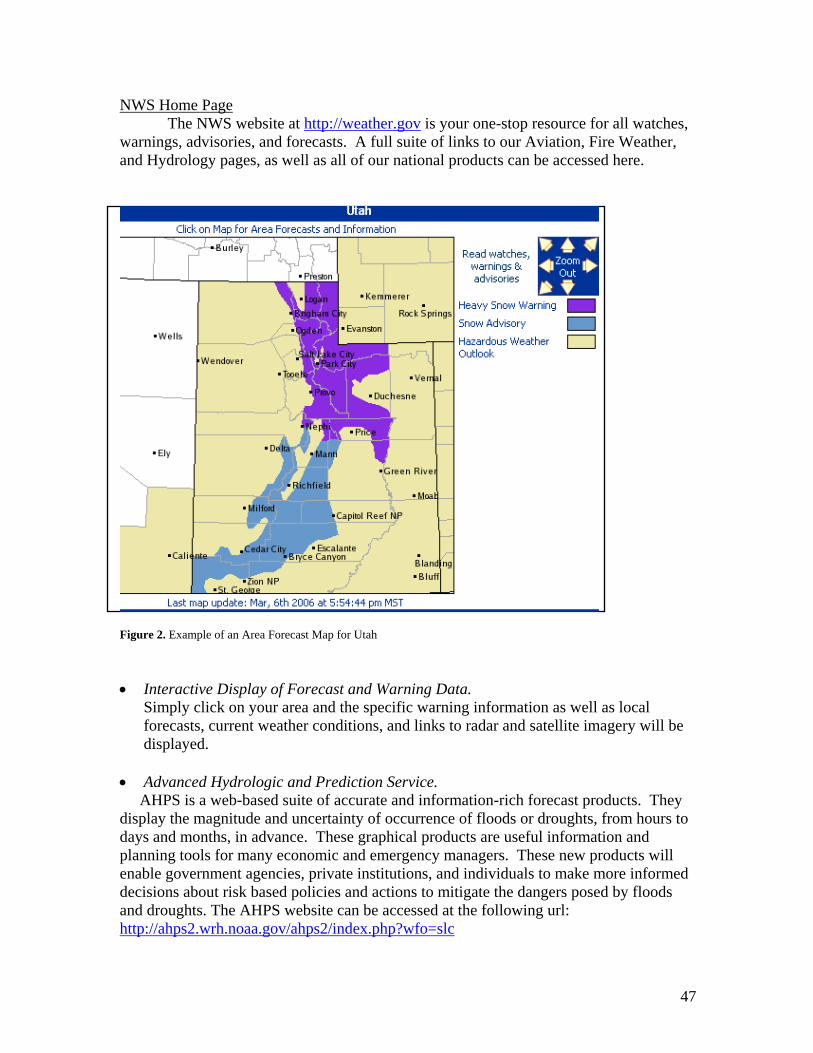
47
NWS Home Page The NWS website at http://weather.gov is your one-stop resource for all watches,
warnings, advisories, and forecasts. A full suite of links to our Aviation, Fire Weather, and Hydrology pages, as well as all of our national products can be accessed here.
Figure 2. Example of an Area Forecast Map for Utah • Interactive Display of Forecast and Warning Data.
Simply click on your area and the specific warning information as well as local forecasts, current weather conditions, and links to radar and satellite imagery will be displayed.
• Advanced Hydrologic and Prediction Service. AHPS is a web-based suite of accurate and information-rich forecast products. They display the magnitude and uncertainty of occurrence of floods or droughts, from hours to days and months, in advance. These graphical products are useful information and planning tools for many economic and emergency managers. These new products will enable government agencies, private institutions, and individuals to make more informed decisions about risk based policies and actions to mitigate the dangers posed by floods and droughts. The AHPS website can be accessed at the following url: http://ahps2.wrh.noaa.gov/ahps2/index.php?wfo=slc
48
• NWS National Digital Forecast Database (NDFD) As the foundation of the NWS Digital Services Program, the National Digital Forecast Database (NDFD) consists of gridded forecasts of sensible weather elements (e.g., cloud cover, maximum temperature). NDFD contains a seamless mosaic of digital forecasts from NWS field offices working in collaboration with the National Centers for Environmental Prediction (NCEP). The database is available for members of the public to use in creating text, graphic, gridded, and image products of their own. Access to the data and a description of NDFD elements can be found at http://www.nws.noaa.gov/ndfd/technical.htm. To view graphical forecasts, visit http://weather.gov/forecasts/graphical.
• Common Alertings Protocal (CAP)/Really Simple Syndication (RSS) Feeds
Access to NWS watches, warnings, advisories, and other similar products are available in CAP and RSS feeds. More information is available at http://www.weather.gov/alerts.
Family of Services (FOS)
FOS is a collection of data communication services, listed below. Each service offers a unique subset of NWS products and data. The FOS provides access to all NWS data and information at minimal cost recovery to private sector organizations who then repackage and tailor it for specific clients. The services are accessible via dedicated telecommunications lines from the Washington D.C. area. Users may obtain any of the individual services from the NWS for a one-time connection charge and an annual user fee to recover FOS costs to the Government for operating this system. For more information, visit the FOS web page at http://www.nws.noaa.gov/datamgmt/fos/fospage.html. NOAA Weather Wire Service (NWWS)
NWWS is a satellite data collection and dissemination system operated by the NWS. Its purpose is to provide state and federal government, commercial users, media, and private citizens with timely delivery of meteorological, hydrological, climatological, and geophysical information. The vast majority of NWWS products are weather and hydrologic forecasts and warnings issued around the clock from 141 NWS offices nationwide (see Product Collection and Dissemination). An important element of the NWWS mission is providing rapid delivery of critical NWS issued severe weather warnings and watches. All products in the NWWS data stream are prioritized, with weather and hydrologic warnings receiving the highest priority (watches are next in priority). This allows special handling and delivery of warning products ahead of other less critical weather forecast products. NWWS delivers severe weather and storm warnings to users in 10 seconds or less from the time they are issued, making it the fastest delivery system available for these very time sensitive products. Additional information on the NWWS can be found at http://www.nws.noaa.gov/nwws/index.html. Emergency Managers Weather Information Network (EMWIN)
EMWIN offers an economical way to receive all products available on the NWWS, plus graphical forecasts and select satellite data. EMWIN systems are available from many private industry suppliers. For more information, visit http://www.nws.noaa.gov/om/disemsys.shtml#EMWIN.
49
Storm Ready…Putting It All Together Some 90% of all presidentially declared disasters are weather related. While
Forecasts and warnings from NOAA’s NWS are critical to saving lives and livelihoods, even the most precise and timely information is of little use if not received, understood, and an appropriate response taken. Thus is the need for the StormReady program. StormReady encourages communities to take a proactive approach to improving local hazardous weather operations and public awareness. StormReady arms communities with improved communication and safety skills needed to save lives and property – before and during the event.” To be recognized as StormReady, a community must: • Establish a 24-hour warning point and emergency operations center; • Have more than one way to receive severe weather forecasts and warnings and to alert
the public; • Create a system that monitors local weather conditions; • Promote the importance of public readiness through community seminars; • Develop a formal hazardous weather plan, which includes training severe weather
spotters and holding emergency exercises. More information on the StormReady program can be found at http://www.stormready.noaa.gov/.
Contact Information and Web Resources
National Weather Service Salt Lake City, UT http://www.wrh.noaa.gov/slc
National Weather Service Grand Junction, CO
http://www.crh.noaa.gov/gjt
Climate Prediction Center http://www.cpc.noaa.gov
Storm Prediction Center http://www.spc.noaa.gov
Kevin Barjenbruch Warning Coordination Meteorologist National Weather Service Salt Lake City 2242 West North Temple Salt Lake City, UT 84116 [email protected]
Brian McInerney Senior Hydrologist National Weather Service Salt Lake City2242 West North Temple Salt Lake City, UT 84116 [email protected]
50
LIGHTNING DESCRIPTION
Lightning is a random, chaotic, and dangerous fact of nature. At any given moment, there are 1,800 thunderstorms in progress somewhere on the earth. This amounts to 16 million storms each year. Lightning detection systems in the United States monitor an average of 25 million strokes of cloud to ground lightning every year.
Each year, about 400 children and adults in the U.S. are struck by lightning while working outside, attending sporting events, relaxing on the beach, mountain climbing, mowing the lawn, or during other outdoor activities. In addition to the average of 67 lives lost per year, several hundred more are left to cope with permanent disabilities. Many of these tragedies can be avoided. Finishing the game, getting a tan, or completing a work shift is not worth death or a debilitating injury.
Lightning is consistently one of the top three causes of weather-related deaths in the country, claiming more lives on average than tornadoes. In Utah, lightning has claimed more lives since 1950 than any other thunderstorm-related hazard. Because lightning usually claims only one or two victims at a time, lightning generally receives much less attention than the more destructive weather-related events. In addition to the risks posed to human life, llightning also causes $4 to 5 billion in losses each year in the civilian sector due to structural and wildland fire ignitions. Each year, lightning costs about $2 billion annually in airline operating costs and passenger delays. MITIGATION
As a general principle, lightning can strike as far as 10 miles away from any rainfall. You are also in danger from lightning if you can hear thunder.
Lightning Safety…Outdoors
• Be the lowest point. Lightning usually strikes the tallest object. In the mountains if you are above the timberline, you ARE the highest object around. Quickly get below the timberline and get into a grove of small trees. Crouch down if you are in an exposed area.
• Keep an eye on the sky. Look for darkening skies, flashes of lightning, or increasing wind, which may be signs of an approaching thunderstorm.
• Listen for the sound of thunder. If you can hear thunder, go to a safe shelter immediately.
• If you see lightning, hear a thunderstorm coming, or your hair stands on end, immediately suspend your game or practice and instruct everyone to go inside a sturdy building or car. If no sturdy building is nearby, a hard-top vehicle with windows closed will offer some protection. The steel frame of the vehicle provides some protection if you are not touching metal.
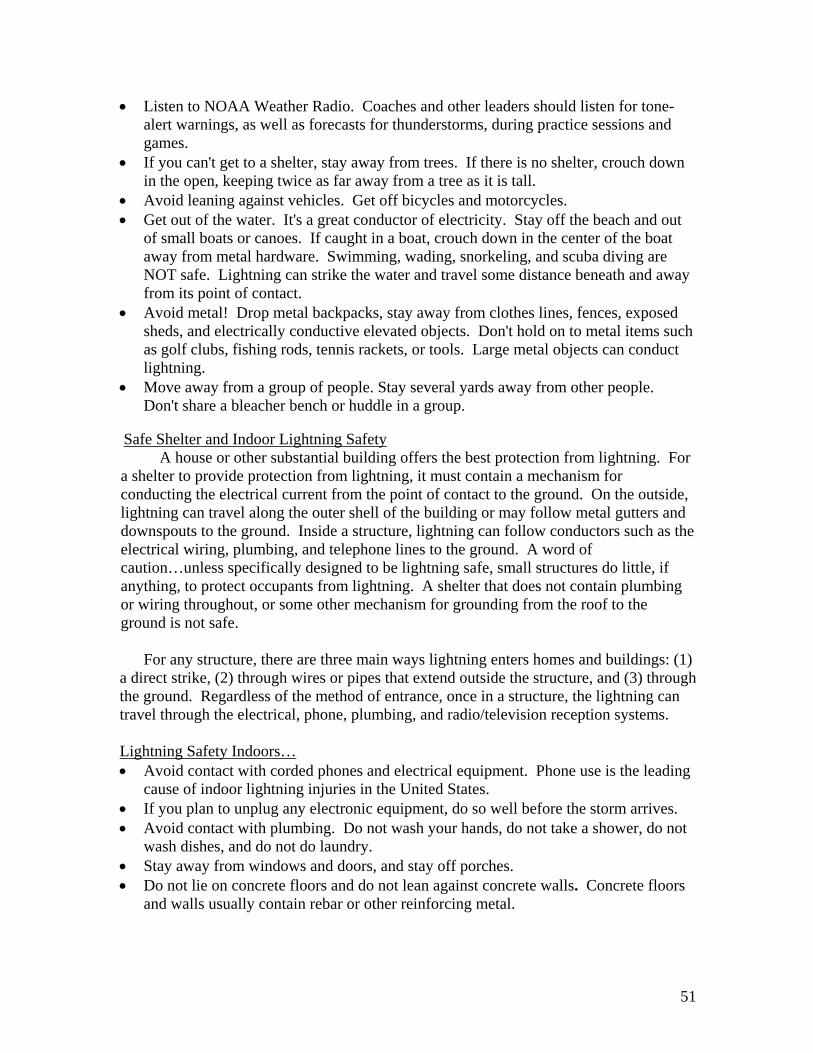
51
• Listen to NOAA Weather Radio. Coaches and other leaders should listen for tone-alert warnings, as well as forecasts for thunderstorms, during practice sessions and games.
• If you can't get to a shelter, stay away from trees. If there is no shelter, crouch down in the open, keeping twice as far away from a tree as it is tall.
• Avoid leaning against vehicles. Get off bicycles and motorcycles. • Get out of the water. It's a great conductor of electricity. Stay off the beach and out
of small boats or canoes. If caught in a boat, crouch down in the center of the boat away from metal hardware. Swimming, wading, snorkeling, and scuba diving are NOT safe. Lightning can strike the water and travel some distance beneath and away from its point of contact.
• Avoid metal! Drop metal backpacks, stay away from clothes lines, fences, exposed sheds, and electrically conductive elevated objects. Don't hold on to metal items such as golf clubs, fishing rods, tennis rackets, or tools. Large metal objects can conduct lightning.
• Move away from a group of people. Stay several yards away from other people. Don't share a bleacher bench or huddle in a group.
Safe Shelter and Indoor Lightning Safety
A house or other substantial building offers the best protection from lightning. For a shelter to provide protection from lightning, it must contain a mechanism for conducting the electrical current from the point of contact to the ground. On the outside, lightning can travel along the outer shell of the building or may follow metal gutters and downspouts to the ground. Inside a structure, lightning can follow conductors such as the electrical wiring, plumbing, and telephone lines to the ground. A word of caution…unless specifically designed to be lightning safe, small structures do little, if anything, to protect occupants from lightning. A shelter that does not contain plumbing or wiring throughout, or some other mechanism for grounding from the roof to the ground is not safe.
For any structure, there are three main ways lightning enters homes and buildings: (1) a direct strike, (2) through wires or pipes that extend outside the structure, and (3) through the ground. Regardless of the method of entrance, once in a structure, the lightning can travel through the electrical, phone, plumbing, and radio/television reception systems. Lightning Safety Indoors… • Avoid contact with corded phones and electrical equipment. Phone use is the leading
cause of indoor lightning injuries in the United States. • If you plan to unplug any electronic equipment, do so well before the storm arrives. • Avoid contact with plumbing. Do not wash your hands, do not take a shower, do not
wash dishes, and do not do laundry. • Stay away from windows and doors, and stay off porches. • Do not lie on concrete floors and do not lean against concrete walls. Concrete floors
and walls usually contain rebar or other reinforcing metal.
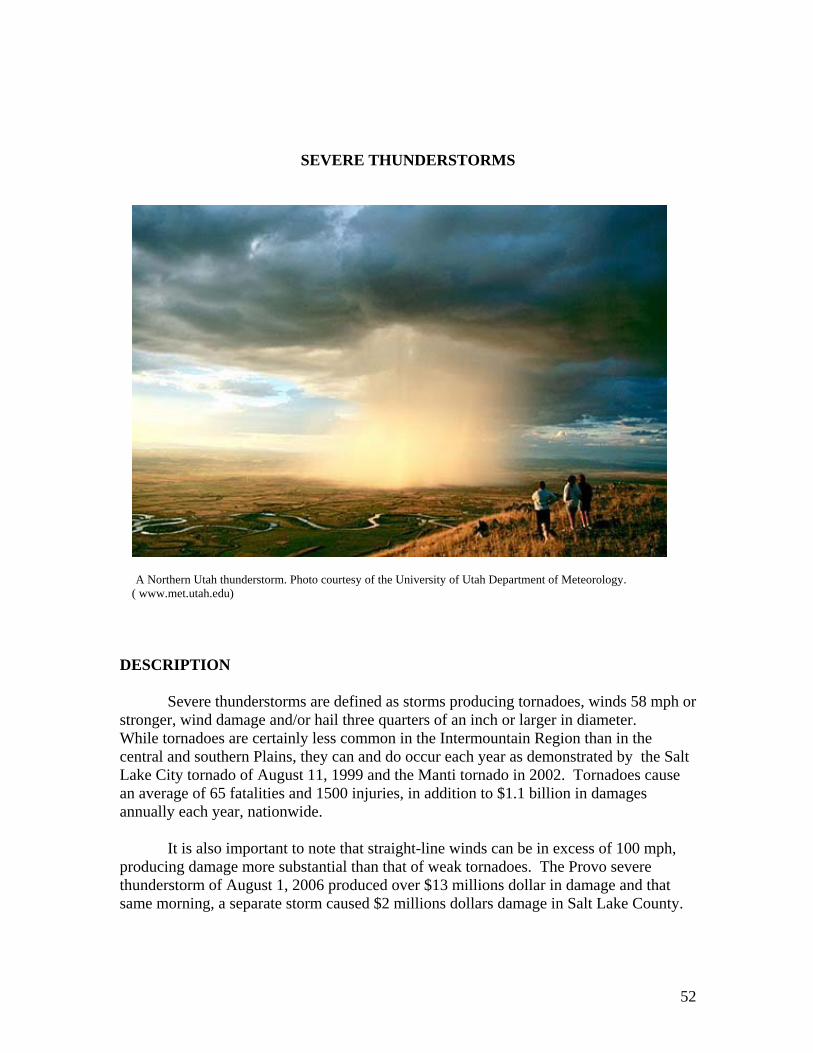
52
SEVERE THUNDERSTORMS A Northern Utah thunderstorm. Photo courtesy of the University of Utah Department of Meteorology. ( www.met.utah.edu) DESCRIPTION
Severe thunderstorms are defined as storms producing tornadoes, winds 58 mph or stronger, wind damage and/or hail three quarters of an inch or larger in diameter. While tornadoes are certainly less common in the Intermountain Region than in the central and southern Plains, they can and do occur each year as demonstrated by the Salt Lake City tornado of August 11, 1999 and the Manti tornado in 2002. Tornadoes cause an average of 65 fatalities and 1500 injuries, in addition to $1.1 billion in damages annually each year, nationwide.
It is also important to note that straight-line winds can be in excess of 100 mph, producing damage more substantial than that of weak tornadoes. The Provo severe thunderstorm of August 1, 2006 produced over $13 millions dollar in damage and that same morning, a separate storm caused $2 millions dollars damage in Salt Lake County.
53
MITIGATION Know and practice the following safety measures to remain safe during tornado events.
At Home… • Move to the interior of the lowest floor possible. • Stay away from windows. • Interior bathrooms offer excellent shelter. • Leave mobile homes immediately and proceed to the nearest designated shelter.
In a Vehicle… • Never try to outrun a tornado. • Leave the vehicle and find nearby safe shelter. • If no shelter is available, crouch in a ditch or ravine, covering your head, but be wary
of flash flooding.
At School… • Move students quickly into interior hallways on the lowest floor. • Stay out of rooms with large free-span ceilings such as gymnasiums and cafeterias. • Keep children at school beyond regular hours if severe weather is expected.
At Work… • Create and practice a severe weather preparedness plan. • Move employees quickly into interior hallways on the lowest floor. • Stay out of rooms with large free-span ceilings such as gymnasiums and cafeterias.
For Severe Thunderstorms with Damaging Wind and/or Large Hail… • Stay away from windows and go to lowest floor. • If driving, keep a firm grip on your vehicle’s steering wheel as wind speed and
direction can change rapidly. • Be prepared for sudden changes in visibility as heavy rain or blowing dust may
accompany downbursts. • Remain in your vehicle whenever possible, it will provide some protection from hail
smaller than golf ball size. • Get under a substantial structure if caught outside.
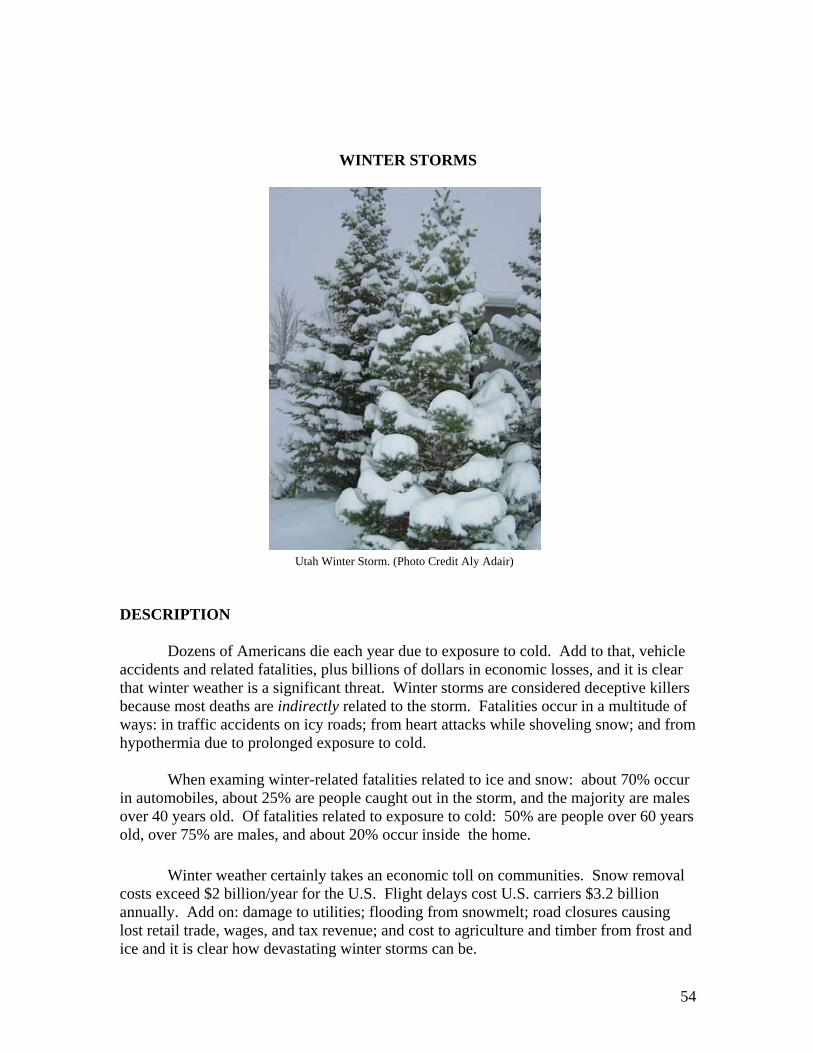
54
WINTER STORMS Utah Winter Storm. (Photo Credit Aly Adair) DESCRIPTION
Dozens of Americans die each year due to exposure to cold. Add to that, vehicle accidents and related fatalities, plus billions of dollars in economic losses, and it is clear that winter weather is a significant threat. Winter storms are considered deceptive killers because most deaths are indirectly related to the storm. Fatalities occur in a multitude of ways: in traffic accidents on icy roads; from heart attacks while shoveling snow; and from hypothermia due to prolonged exposure to cold. When examing winter-related fatalities related to ice and snow: about 70% occur in automobiles, about 25% are people caught out in the storm, and the majority are males over 40 years old. Of fatalities related to exposure to cold: 50% are people over 60 years old, over 75% are males, and about 20% occur inside the home.
Winter weather certainly takes an economic toll on communities. Snow removal costs exceed $2 billion/year for the U.S. Flight delays cost U.S. carriers $3.2 billion annually. Add on: damage to utilities; flooding from snowmelt; road closures causing lost retail trade, wages, and tax revenue; and cost to agriculture and timber from frost and ice and it is clear how devastating winter storms can be.
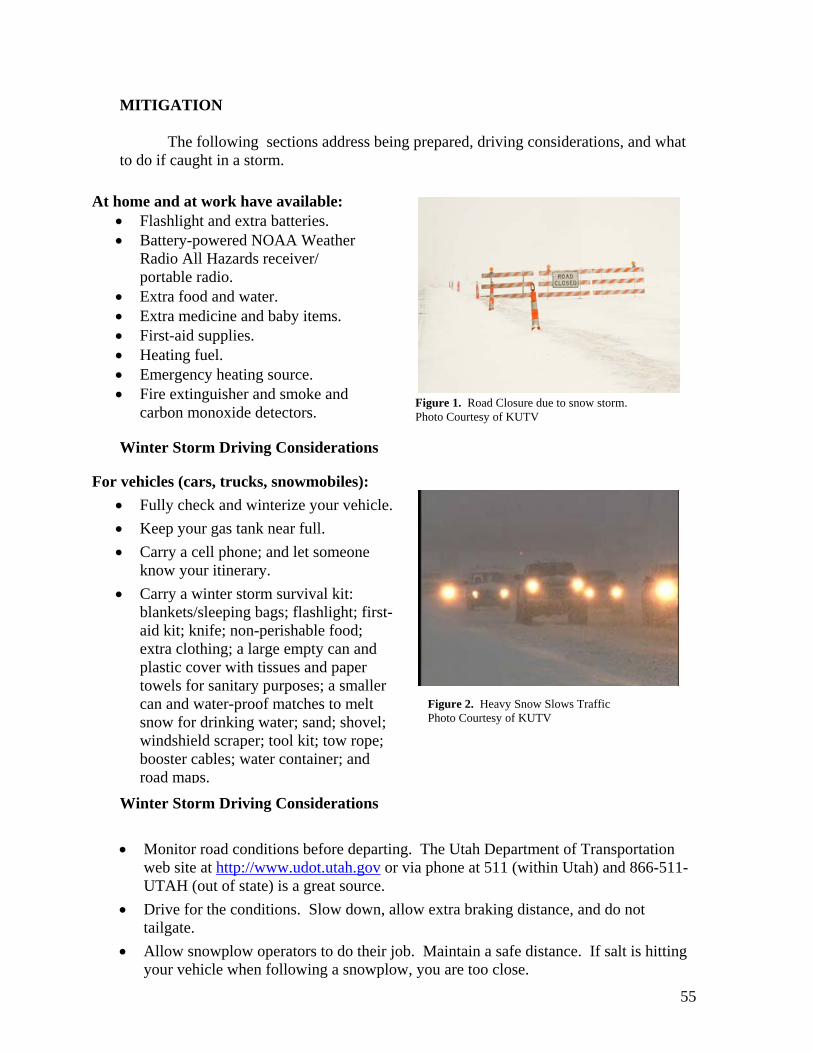
55
For vehicles (cars, trucks, snowmobiles): • Fully check and winterize your vehicle.• Keep your gas tank near full. • Carry a cell phone; and let someone
know your itinerary. • Carry a winter storm survival kit:
blankets/sleeping bags; flashlight; first-aid kit; knife; non-perishable food; extra clothing; a large empty can and plastic cover with tissues and paper towels for sanitary purposes; a smaller can and water-proof matches to melt snow for drinking water; sand; shovel; windshield scraper; tool kit; tow rope; booster cables; water container; and road maps.
MITIGATION
The following sections address being prepared, driving considerations, and what to do if caught in a storm.
Winter Storm Driving Considerations
Winter Storm Driving Considerations • Monitor road conditions before departing. The Utah Department of Transportation
web site at http://www.udot.utah.gov or via phone at 511 (within Utah) and 866-511-UTAH (out of state) is a great source.
• Drive for the conditions. Slow down, allow extra braking distance, and do not tailgate.
• Allow snowplow operators to do their job. Maintain a safe distance. If salt is hitting your vehicle when following a snowplow, you are too close.
At home and at work have available: • Flashlight and extra batteries. • Battery-powered NOAA Weather
Radio All Hazards receiver/ portable radio.
• Extra food and water. • Extra medicine and baby items. • First-aid supplies. • Heating fuel. • Emergency heating source. • Fire extinguisher and smoke and
carbon monoxide detectors. Figure 1. Road Closure due to snow storm. Photo Courtesy of KUTV
Figure 2. Heavy Snow Slows Traffic Photo Courtesy of KUTV
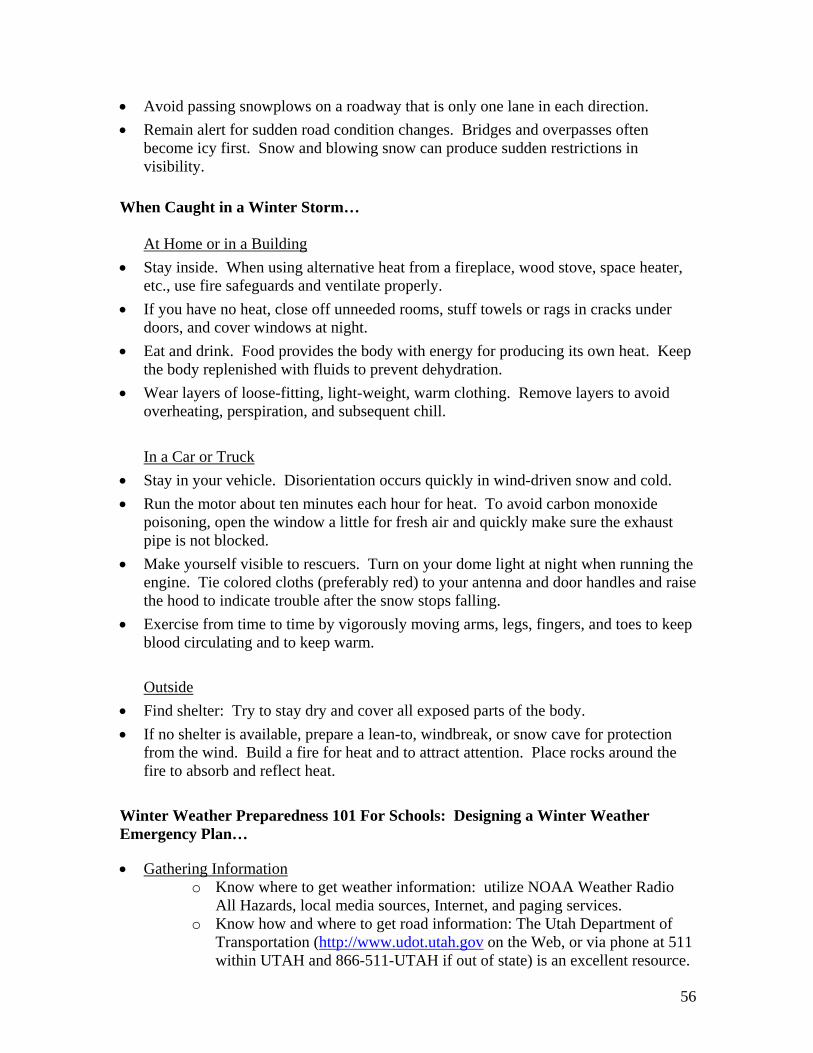
56
• Avoid passing snowplows on a roadway that is only one lane in each direction. • Remain alert for sudden road condition changes. Bridges and overpasses often
become icy first. Snow and blowing snow can produce sudden restrictions in visibility.
When Caught in a Winter Storm…
At Home or in a Building • Stay inside. When using alternative heat from a fireplace, wood stove, space heater,
etc., use fire safeguards and ventilate properly. • If you have no heat, close off unneeded rooms, stuff towels or rags in cracks under
doors, and cover windows at night. • Eat and drink. Food provides the body with energy for producing its own heat. Keep
the body replenished with fluids to prevent dehydration. • Wear layers of loose-fitting, light-weight, warm clothing. Remove layers to avoid
overheating, perspiration, and subsequent chill.
In a Car or Truck • Stay in your vehicle. Disorientation occurs quickly in wind-driven snow and cold. • Run the motor about ten minutes each hour for heat. To avoid carbon monoxide
poisoning, open the window a little for fresh air and quickly make sure the exhaust pipe is not blocked.
• Make yourself visible to rescuers. Turn on your dome light at night when running the engine. Tie colored cloths (preferably red) to your antenna and door handles and raise the hood to indicate trouble after the snow stops falling.
• Exercise from time to time by vigorously moving arms, legs, fingers, and toes to keep blood circulating and to keep warm.
Outside
• Find shelter: Try to stay dry and cover all exposed parts of the body. • If no shelter is available, prepare a lean-to, windbreak, or snow cave for protection
from the wind. Build a fire for heat and to attract attention. Place rocks around the fire to absorb and reflect heat.
Winter Weather Preparedness 101 For Schools: Designing a Winter Weather Emergency Plan… • Gathering Information
o Know where to get weather information: utilize NOAA Weather Radio All Hazards, local media sources, Internet, and paging services.
o Know how and where to get road information: The Utah Department of Transportation (http://www.udot.utah.gov on the Web, or via phone at 511 within UTAH and 866-511-UTAH if out of state) is an excellent resource.
57
City and county transportation officials, drivers, and security teams are also excellent sources.
• Alerting Students and Staff
o Alert students and staff to take action: Use mobile communications for bus drivers, and a PA system for school staff and students.
• Activating Plan o Determine when to activate plan: Gather information about the type of
winter storm, expected impact, and time of impact on the school district. The primary decision will be whether to cancel, delay, or hold classes as usual. In watch situations, immediate action will usually not be required. When a warning or advisory is issued, assess the weather situation by monitoring NWS forecasts, current weather conditions, and road conditions.
• Canceling or Delaying Classes o Determine when to cancel or delay classes: How much time do you have
before the storm impacts the area? Not only must students be transported to school safely, but also back home via bus, car, or on foot. What kind of an impact will the storm make? Will roads be impassable, or will road conditions just have a minimal effect on transportation of students, causing only small delays.
• School Bus Driver Actions o For heavy snow or blowing and drifting snow: Be familiar with alternate
routes, stay up to date on the latest forecast, and maintain communication with school officials.
o For ice storms: Remain alert for downed trees and utility lines, and other road hazards. Be familiar with alternate routes. Stay up to date on the forecast and maintain communication with school officials.
o Extreme cold: Learn to recognize and treat symptoms of hypothermia and frostbite.
• Safety Instruction o Educate school staff and students: Conduct drills and hold safety
programs annually. o Participate in Winter Weather Preparedness Week campaigns. o Contact your local Emergency Manager or National Weather Service
Office for a speaker to discuss winter weather safety.
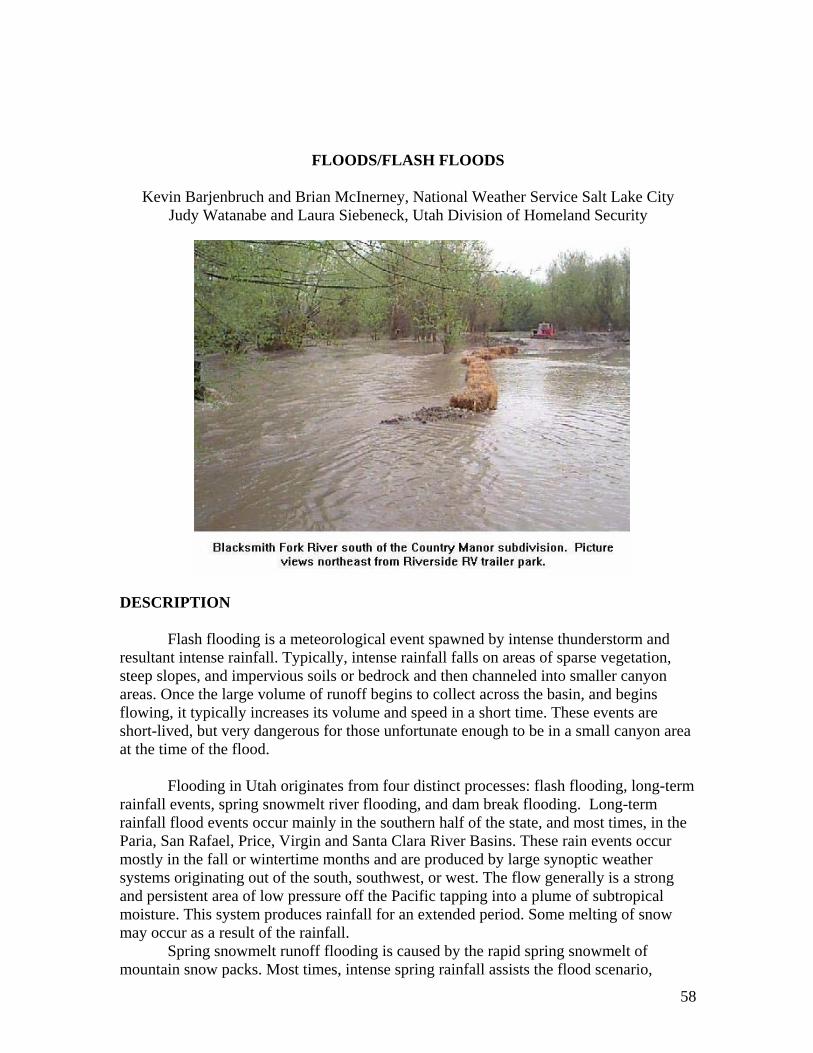
58
FLOODS/FLASH FLOODS
Kevin Barjenbruch and Brian McInerney, National Weather Service Salt Lake City Judy Watanabe and Laura Siebeneck, Utah Division of Homeland Security
DESCRIPTION Flash flooding is a meteorological event spawned by intense thunderstorm and resultant intense rainfall. Typically, intense rainfall falls on areas of sparse vegetation, steep slopes, and impervious soils or bedrock and then channeled into smaller canyon areas. Once the large volume of runoff begins to collect across the basin, and begins flowing, it typically increases its volume and speed in a short time. These events are short-lived, but very dangerous for those unfortunate enough to be in a small canyon area at the time of the flood. Flooding in Utah originates from four distinct processes: flash flooding, long-term rainfall events, spring snowmelt river flooding, and dam break flooding. Long-term rainfall flood events occur mainly in the southern half of the state, and most times, in the Paria, San Rafael, Price, Virgin and Santa Clara River Basins. These rain events occur mostly in the fall or wintertime months and are produced by large synoptic weather systems originating out of the south, southwest, or west. The flow generally is a strong and persistent area of low pressure off the Pacific tapping into a plume of subtropical moisture. This system produces rainfall for an extended period. Some melting of snow may occur as a result of the rainfall. Spring snowmelt runoff flooding is caused by the rapid spring snowmelt of mountain snow packs. Most times, intense spring rainfall assists the flood scenario,
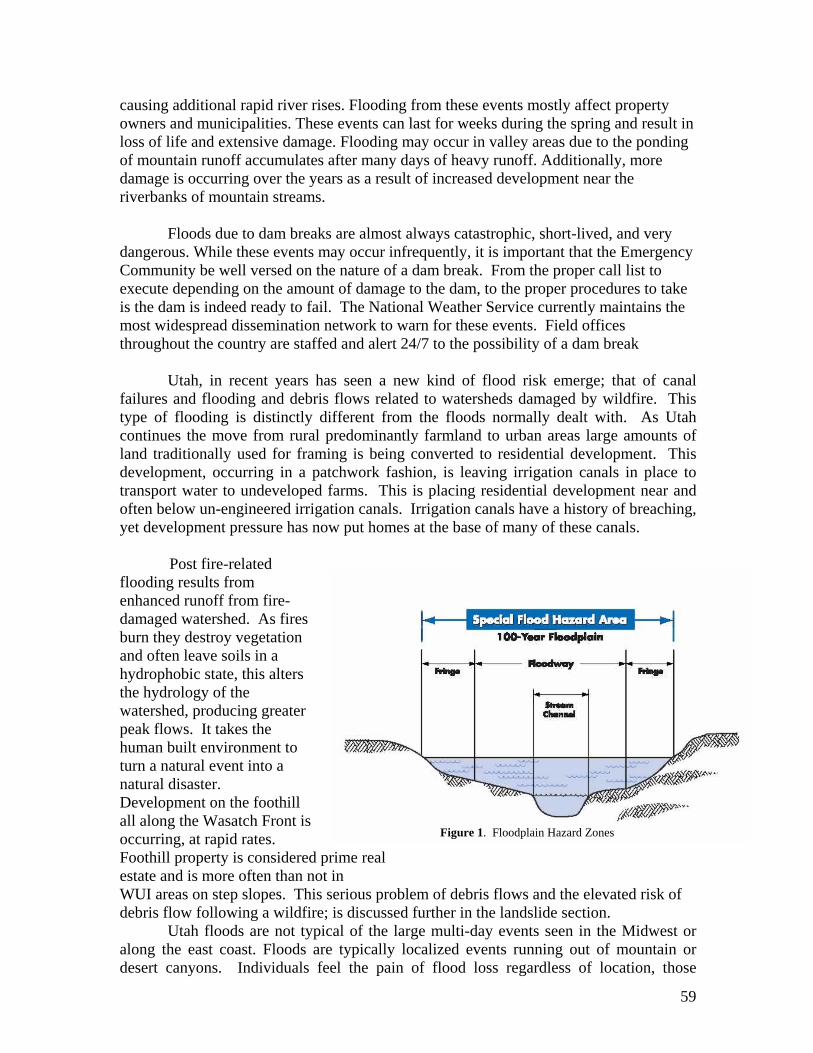
59
causing additional rapid river rises. Flooding from these events mostly affect property owners and municipalities. These events can last for weeks during the spring and result in loss of life and extensive damage. Flooding may occur in valley areas due to the ponding of mountain runoff accumulates after many days of heavy runoff. Additionally, more damage is occurring over the years as a result of increased development near the riverbanks of mountain streams. Floods due to dam breaks are almost always catastrophic, short-lived, and very dangerous. While these events may occur infrequently, it is important that the Emergency Community be well versed on the nature of a dam break. From the proper call list to execute depending on the amount of damage to the dam, to the proper procedures to take is the dam is indeed ready to fail. The National Weather Service currently maintains the most widespread dissemination network to warn for these events. Field offices throughout the country are staffed and alert 24/7 to the possibility of a dam break
Utah, in recent years has seen a new kind of flood risk emerge; that of canal failures and flooding and debris flows related to watersheds damaged by wildfire. This type of flooding is distinctly different from the floods normally dealt with. As Utah continues the move from rural predominantly farmland to urban areas large amounts of land traditionally used for framing is being converted to residential development. This development, occurring in a patchwork fashion, is leaving irrigation canals in place to transport water to undeveloped farms. This is placing residential development near and often below un-engineered irrigation canals. Irrigation canals have a history of breaching, yet development pressure has now put homes at the base of many of these canals. Post fire-related flooding results from enhanced runoff from fire-damaged watershed. As fires burn they destroy vegetation and often leave soils in a hydrophobic state, this alters the hydrology of the watershed, producing greater peak flows. It takes the human built environment to turn a natural event into a natural disaster. Development on the foothill all along the Wasatch Front is occurring, at rapid rates. Foothill property is considered prime real estate and is more often than not in WUI areas on step slopes. This serious problem of debris flows and the elevated risk of debris flow following a wildfire; is discussed further in the landslide section.
Utah floods are not typical of the large multi-day events seen in the Midwest or along the east coast. Floods are typically localized events running out of mountain or desert canyons. Individuals feel the pain of flood loss regardless of location, those
Figure 1. Floodplain Hazard Zones
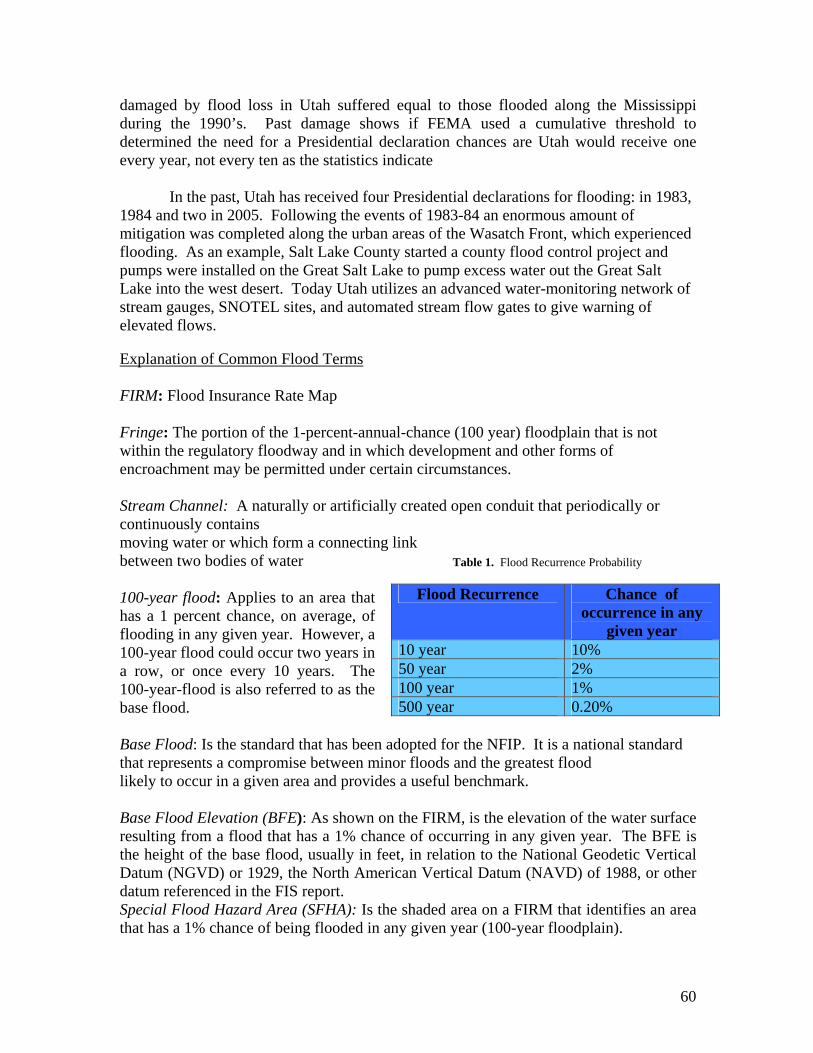
60
damaged by flood loss in Utah suffered equal to those flooded along the Mississippi during the 1990’s. Past damage shows if FEMA used a cumulative threshold to determined the need for a Presidential declaration chances are Utah would receive one every year, not every ten as the statistics indicate In the past, Utah has received four Presidential declarations for flooding: in 1983, 1984 and two in 2005. Following the events of 1983-84 an enormous amount of mitigation was completed along the urban areas of the Wasatch Front, which experienced flooding. As an example, Salt Lake County started a county flood control project and pumps were installed on the Great Salt Lake to pump excess water out the Great Salt Lake into the west desert. Today Utah utilizes an advanced water-monitoring network of stream gauges, SNOTEL sites, and automated stream flow gates to give warning of elevated flows. Explanation of Common Flood Terms FIRM: Flood Insurance Rate Map Fringe: The portion of the 1-percent-annual-chance (100 year) floodplain that is not within the regulatory floodway and in which development and other forms of encroachment may be permitted under certain circumstances. Stream Channel: A naturally or artificially created open conduit that periodically or continuously contains moving water or which form a connecting link between two bodies of water 100-year flood: Applies to an area that has a 1 percent chance, on average, of flooding in any given year. However, a 100-year flood could occur two years in a row, or once every 10 years. The 100-year-flood is also referred to as the base flood. Base Flood: Is the standard that has been adopted for the NFIP. It is a national standard that represents a compromise between minor floods and the greatest flood likely to occur in a given area and provides a useful benchmark. Base Flood Elevation (BFE): As shown on the FIRM, is the elevation of the water surface resulting from a flood that has a 1% chance of occurring in any given year. The BFE is the height of the base flood, usually in feet, in relation to the National Geodetic Vertical Datum (NGVD) or 1929, the North American Vertical Datum (NAVD) of 1988, or other datum referenced in the FIS report. Special Flood Hazard Area (SFHA): Is the shaded area on a FIRM that identifies an area that has a 1% chance of being flooded in any given year (100-year floodplain).
Flood Recurrence Chance of occurrence in any
given year 10 year 10% 50 year 2% 100 year 1% 500 year 0.20%
Table 1. Flood Recurrence Probability
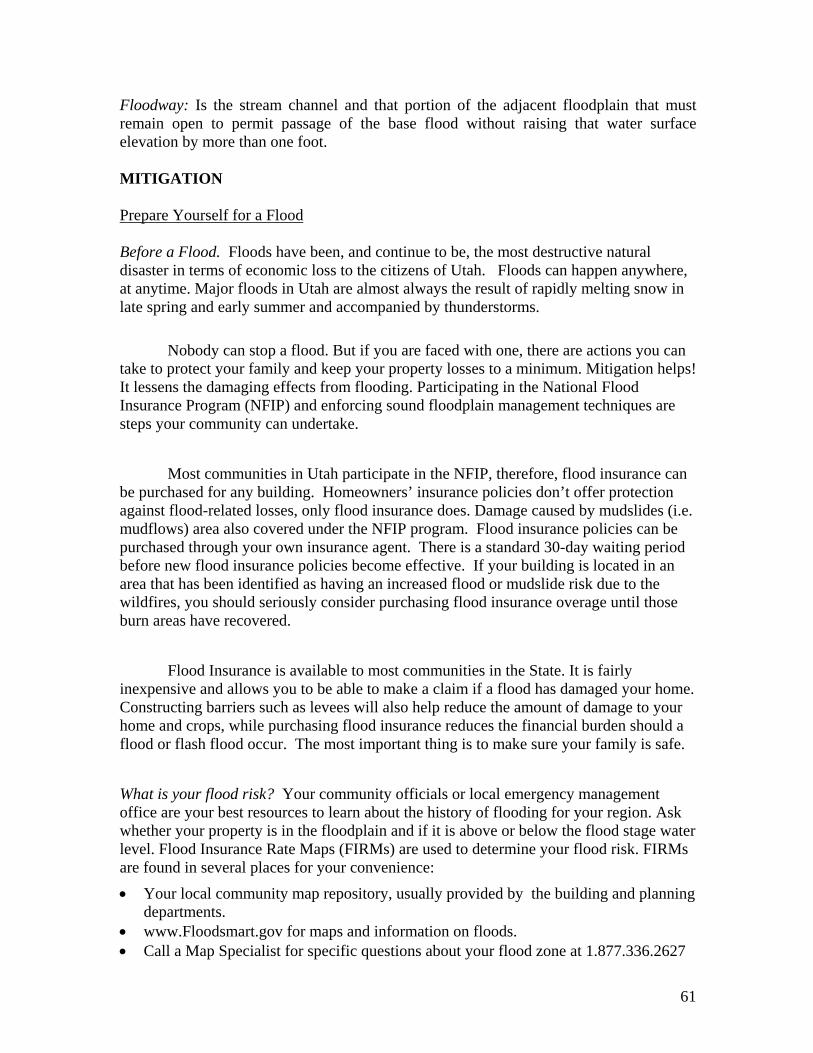
61
Floodway: Is the stream channel and that portion of the adjacent floodplain that must remain open to permit passage of the base flood without raising that water surface elevation by more than one foot. MITIGATION Prepare Yourself for a Flood
Before a Flood. Floods have been, and continue to be, the most destructive natural disaster in terms of economic loss to the citizens of Utah. Floods can happen anywhere, at anytime. Major floods in Utah are almost always the result of rapidly melting snow in late spring and early summer and accompanied by thunderstorms.
Nobody can stop a flood. But if you are faced with one, there are actions you can take to protect your family and keep your property losses to a minimum. Mitigation helps! It lessens the damaging effects from flooding. Participating in the National Flood Insurance Program (NFIP) and enforcing sound floodplain management techniques are steps your community can undertake.
Most communities in Utah participate in the NFIP, therefore, flood insurance can be purchased for any building. Homeowners’ insurance policies don’t offer protection against flood-related losses, only flood insurance does. Damage caused by mudslides (i.e. mudflows) area also covered under the NFIP program. Flood insurance policies can be purchased through your own insurance agent. There is a standard 30-day waiting period before new flood insurance policies become effective. If your building is located in an area that has been identified as having an increased flood or mudslide risk due to the wildfires, you should seriously consider purchasing flood insurance overage until those burn areas have recovered.
Flood Insurance is available to most communities in the State. It is fairly inexpensive and allows you to be able to make a claim if a flood has damaged your home. Constructing barriers such as levees will also help reduce the amount of damage to your home and crops, while purchasing flood insurance reduces the financial burden should a flood or flash flood occur. The most important thing is to make sure your family is safe. What is your flood risk? Your community officials or local emergency management office are your best resources to learn about the history of flooding for your region. Ask whether your property is in the floodplain and if it is above or below the flood stage water level. Flood Insurance Rate Maps (FIRMs) are used to determine your flood risk. FIRMs are found in several places for your convenience: • Your local community map repository, usually provided by the building and planning
departments. • www.Floodsmart.gov for maps and information on floods. • Call a Map Specialist for specific questions about your flood zone at 1.877.336.2627
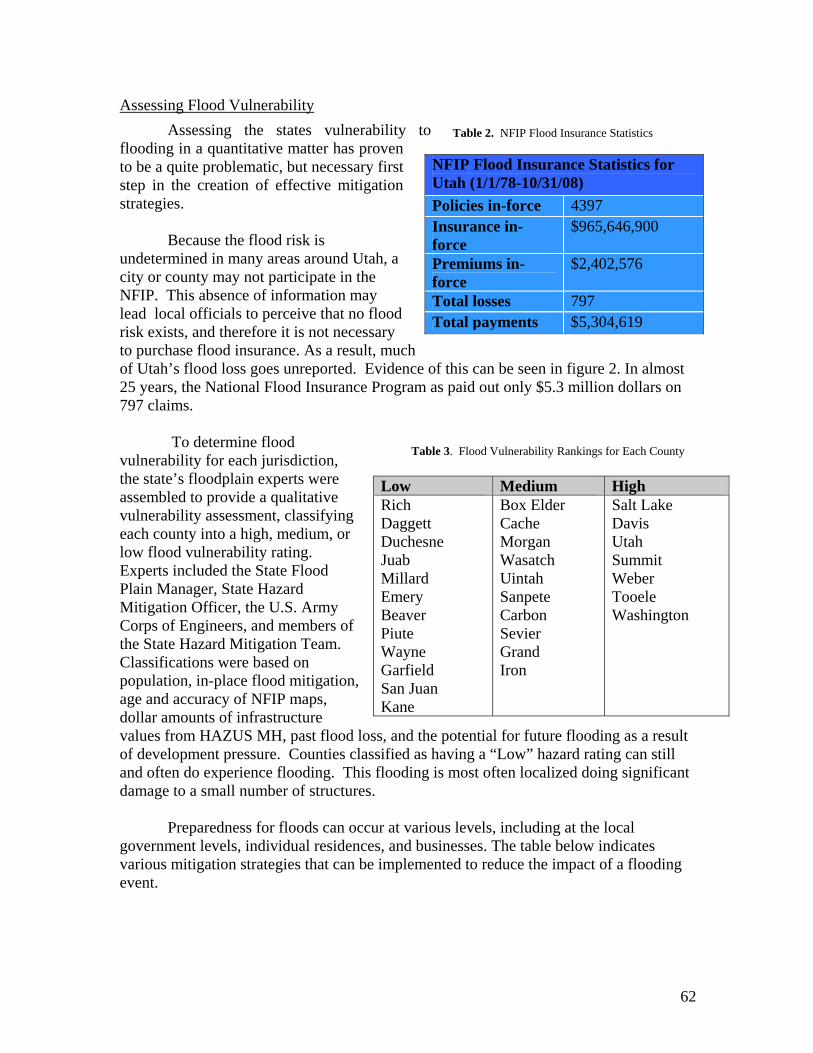
62
Assessing Flood Vulnerability Assessing the states vulnerability to
flooding in a quantitative matter has proven to be a quite problematic, but necessary first step in the creation of effective mitigation strategies.
Because the flood risk is undetermined in many areas around Utah, a city or county may not participate in the NFIP. This absence of information may lead local officials to perceive that no flood risk exists, and therefore it is not necessary to purchase flood insurance. As a result, much of Utah’s flood loss goes unreported. Evidence of this can be seen in figure 2. In almost 25 years, the National Flood Insurance Program as paid out only $5.3 million dollars on 797 claims.
To determine flood
vulnerability for each jurisdiction, the state’s floodplain experts were assembled to provide a qualitative vulnerability assessment, classifying each county into a high, medium, or low flood vulnerability rating. Experts included the State Flood Plain Manager, State Hazard Mitigation Officer, the U.S. Army Corps of Engineers, and members of the State Hazard Mitigation Team. Classifications were based on population, in-place flood mitigation, age and accuracy of NFIP maps, dollar amounts of infrastructure values from HAZUS MH, past flood loss, and the potential for future flooding as a result of development pressure. Counties classified as having a “Low” hazard rating can still and often do experience flooding. This flooding is most often localized doing significant damage to a small number of structures.
Preparedness for floods can occur at various levels, including at the local
government levels, individual residences, and businesses. The table below indicates various mitigation strategies that can be implemented to reduce the impact of a flooding event.
NFIP Flood Insurance Statistics for Utah (1/1/78-10/31/08) Policies in-force 4397 Insurance in-force
$965,646,900
Premiums in-force
$2,402,576
Total losses 797 Total payments $5,304,619
Low Medium High Rich Daggett Duchesne Juab Millard Emery Beaver Piute Wayne Garfield San Juan Kane
Box Elder Cache Morgan Wasatch Uintah Sanpete Carbon Sevier Grand Iron
Salt Lake Davis Utah Summit Weber Tooele Washington
Table 2. NFIP Flood Insurance Statistics
Table 3. Flood Vulnerability Rankings for Each County
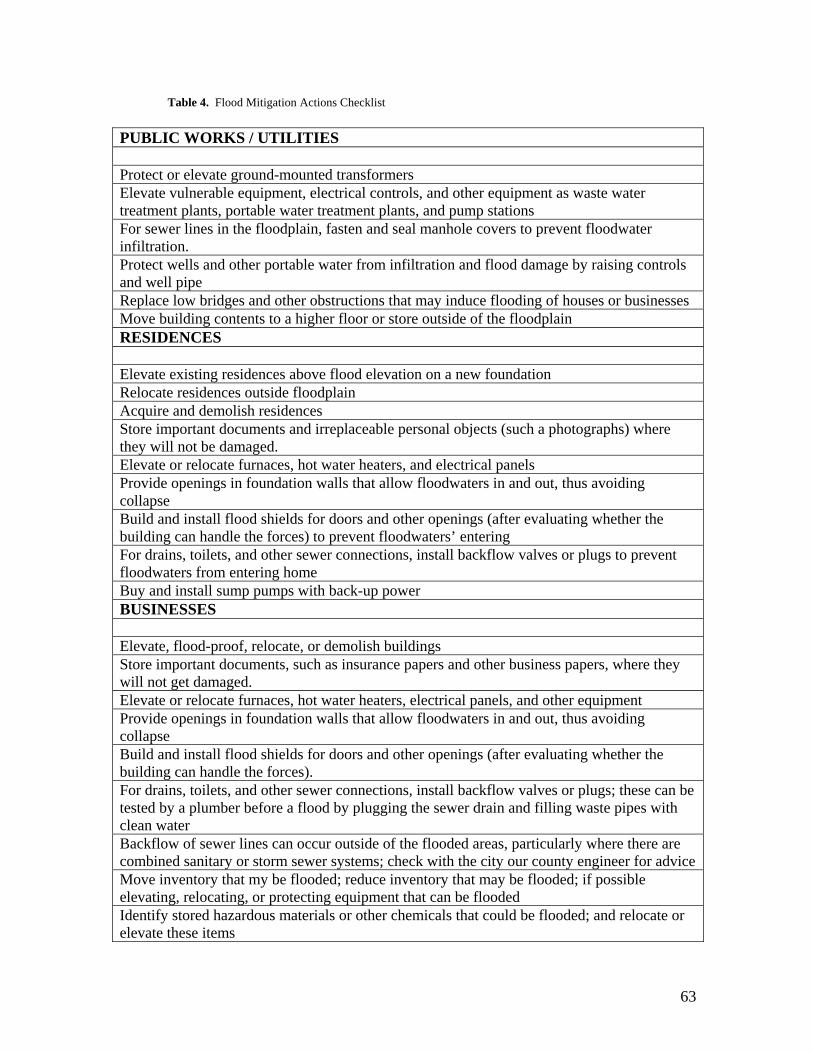
63
Table 4. Flood Mitigation Actions Checklist
PUBLIC WORKS / UTILITIES Protect or elevate ground-mounted transformers Elevate vulnerable equipment, electrical controls, and other equipment as waste water treatment plants, portable water treatment plants, and pump stations For sewer lines in the floodplain, fasten and seal manhole covers to prevent floodwater infiltration. Protect wells and other portable water from infiltration and flood damage by raising controls and well pipe Replace low bridges and other obstructions that may induce flooding of houses or businesses Move building contents to a higher floor or store outside of the floodplain RESIDENCES Elevate existing residences above flood elevation on a new foundation Relocate residences outside floodplain Acquire and demolish residences Store important documents and irreplaceable personal objects (such a photographs) where they will not be damaged. Elevate or relocate furnaces, hot water heaters, and electrical panels Provide openings in foundation walls that allow floodwaters in and out, thus avoiding collapse Build and install flood shields for doors and other openings (after evaluating whether the building can handle the forces) to prevent floodwaters’ entering For drains, toilets, and other sewer connections, install backflow valves or plugs to prevent floodwaters from entering home Buy and install sump pumps with back-up power BUSINESSES Elevate, flood-proof, relocate, or demolish buildings Store important documents, such as insurance papers and other business papers, where they will not get damaged. Elevate or relocate furnaces, hot water heaters, electrical panels, and other equipment Provide openings in foundation walls that allow floodwaters in and out, thus avoiding collapse Build and install flood shields for doors and other openings (after evaluating whether the building can handle the forces). For drains, toilets, and other sewer connections, install backflow valves or plugs; these can be tested by a plumber before a flood by plugging the sewer drain and filling waste pipes with clean water Backflow of sewer lines can occur outside of the flooded areas, particularly where there are combined sanitary or storm sewer systems; check with the city our county engineer for advice Move inventory that my be flooded; reduce inventory that may be flooded; if possible elevating, relocating, or protecting equipment that can be flooded Identify stored hazardous materials or other chemicals that could be flooded; and relocate or elevate these items
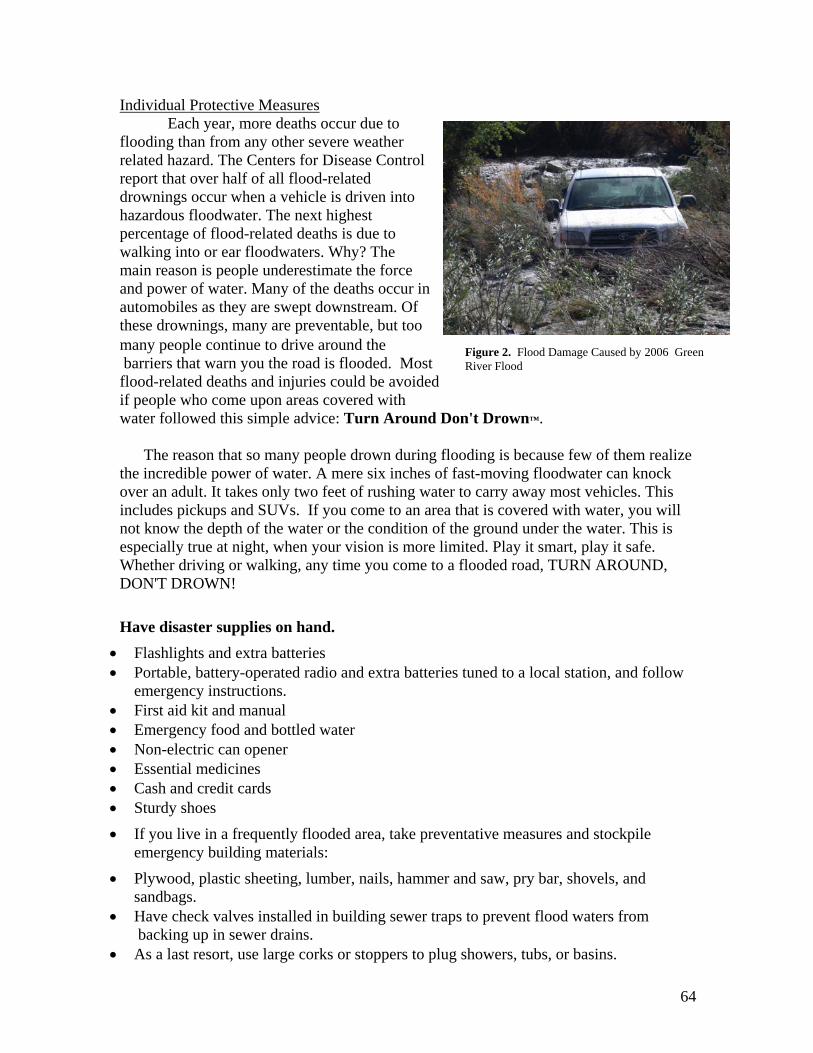
64
Individual Protective Measures Each year, more deaths occur due to
flooding than from any other severe weather related hazard. The Centers for Disease Control report that over half of all flood-related drownings occur when a vehicle is driven into hazardous floodwater. The next highest percentage of flood-related deaths is due to walking into or ear floodwaters. Why? The main reason is people underestimate the force and power of water. Many of the deaths occur in automobiles as they are swept downstream. Of these drownings, many are preventable, but too many people continue to drive around the barriers that warn you the road is flooded. Most flood-related deaths and injuries could be avoided if people who come upon areas covered with water followed this simple advice: Turn Around Don't Drown™. The reason that so many people drown during flooding is because few of them realize the incredible power of water. A mere six inches of fast-moving floodwater can knock over an adult. It takes only two feet of rushing water to carry away most vehicles. This includes pickups and SUVs. If you come to an area that is covered with water, you will not know the depth of the water or the condition of the ground under the water. This is especially true at night, when your vision is more limited. Play it smart, play it safe. Whether driving or walking, any time you come to a flooded road, TURN AROUND, DON'T DROWN! Have disaster supplies on hand.
• Flashlights and extra batteries • Portable, battery-operated radio and extra batteries tuned to a local station, and follow emergency instructions. • First aid kit and manual • Emergency food and bottled water • Non-electric can opener • Essential medicines • Cash and credit cards • Sturdy shoes • If you live in a frequently flooded area, take preventative measures and stockpile emergency building materials: • Plywood, plastic sheeting, lumber, nails, hammer and saw, pry bar, shovels, and sandbags. • Have check valves installed in building sewer traps to prevent flood waters from backing up in sewer drains. • As a last resort, use large corks or stoppers to plug showers, tubs, or basins.
Figure 2. Flood Damage Caused by 2006 Green River Flood
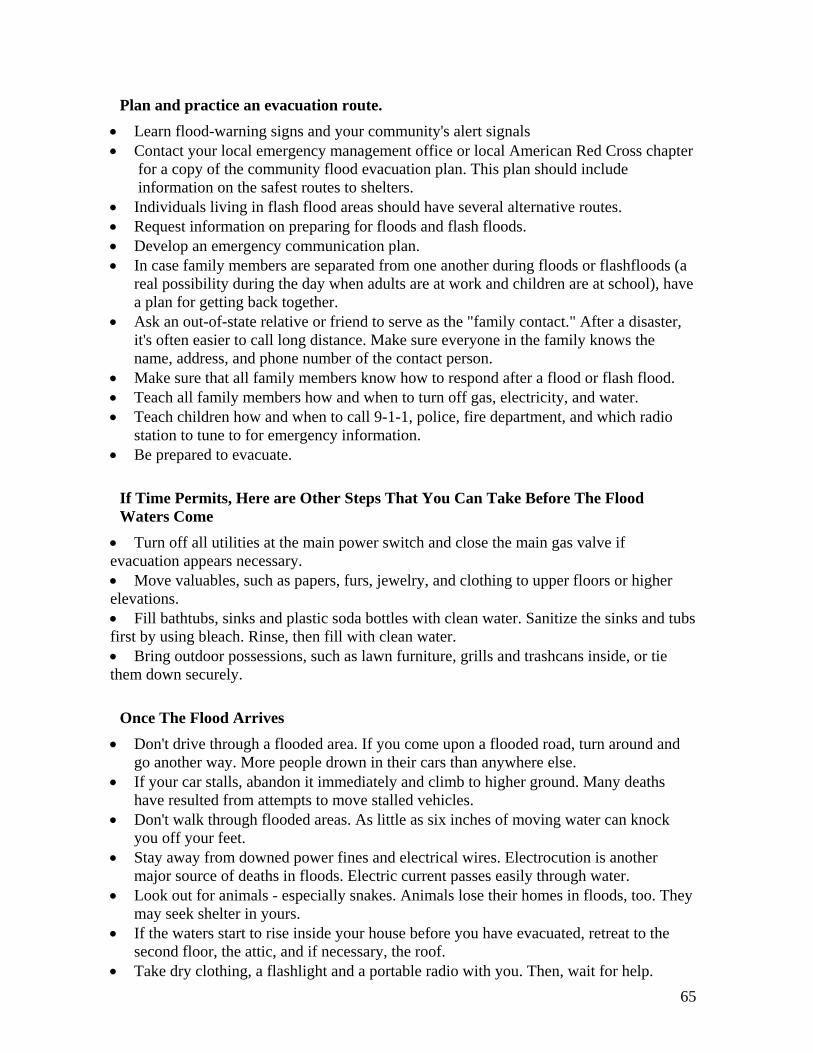
65
Plan and practice an evacuation route. • Learn flood-warning signs and your community's alert signals • Contact your local emergency management office or local American Red Cross chapter for a copy of the community flood evacuation plan. This plan should include information on the safest routes to shelters. • Individuals living in flash flood areas should have several alternative routes. • Request information on preparing for floods and flash floods. • Develop an emergency communication plan. • In case family members are separated from one another during floods or flashfloods (a real possibility during the day when adults are at work and children are at school), have a plan for getting back together. • Ask an out-of-state relative or friend to serve as the "family contact." After a disaster, it's often easier to call long distance. Make sure everyone in the family knows the name, address, and phone number of the contact person. • Make sure that all family members know how to respond after a flood or flash flood. • Teach all family members how and when to turn off gas, electricity, and water. • Teach children how and when to call 9-1-1, police, fire department, and which radio station to tune to for emergency information. • Be prepared to evacuate.
If Time Permits, Here are Other Steps That You Can Take Before The Flood Waters Come
• Turn off all utilities at the main power switch and close the main gas valve if evacuation appears necessary. • Move valuables, such as papers, furs, jewelry, and clothing to upper floors or higher elevations. • Fill bathtubs, sinks and plastic soda bottles with clean water. Sanitize the sinks and tubs first by using bleach. Rinse, then fill with clean water. • Bring outdoor possessions, such as lawn furniture, grills and trashcans inside, or tie them down securely.
Once The Flood Arrives
• Don't drive through a flooded area. If you come upon a flooded road, turn around and go another way. More people drown in their cars than anywhere else. • If your car stalls, abandon it immediately and climb to higher ground. Many deaths have resulted from attempts to move stalled vehicles. • Don't walk through flooded areas. As little as six inches of moving water can knock you off your feet. • Stay away from downed power fines and electrical wires. Electrocution is another major source of deaths in floods. Electric current passes easily through water. • Look out for animals - especially snakes. Animals lose their homes in floods, too. They may seek shelter in yours. • If the waters start to rise inside your house before you have evacuated, retreat to the second floor, the attic, and if necessary, the roof. • Take dry clothing, a flashlight and a portable radio with you. Then, wait for help.
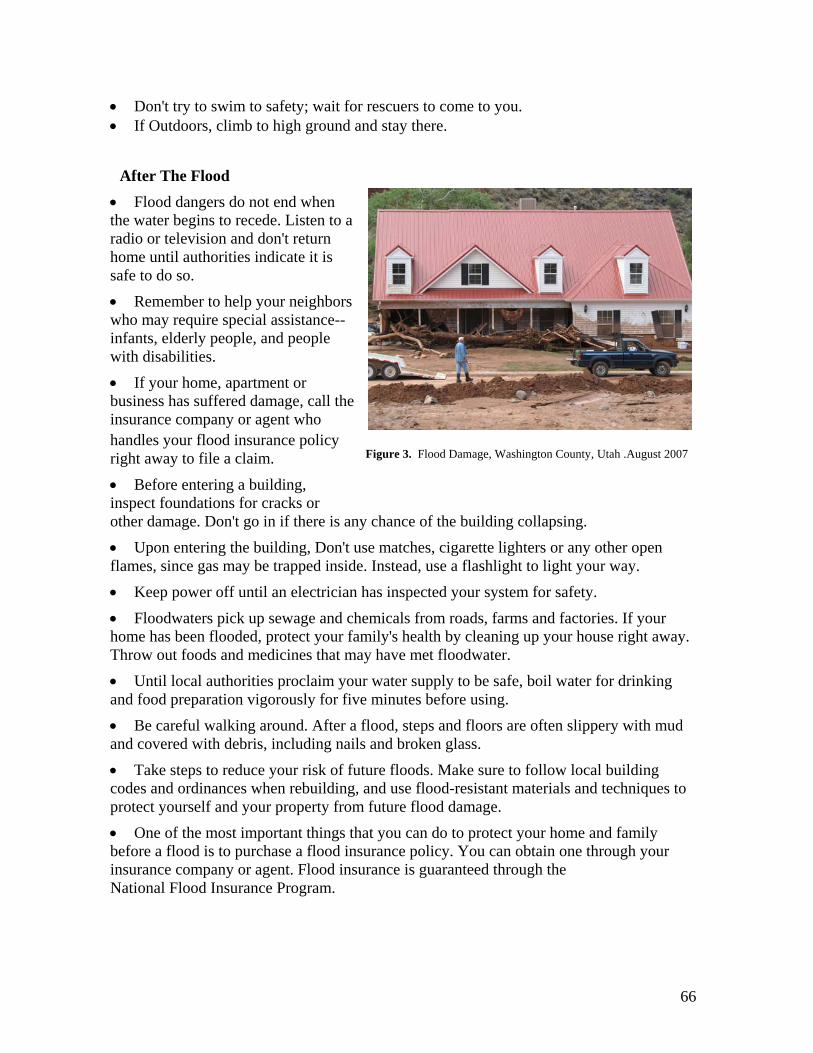
66
• Don't try to swim to safety; wait for rescuers to come to you. • If Outdoors, climb to high ground and stay there.
After The Flood
• Flood dangers do not end when the water begins to recede. Listen to a radio or television and don't return home until authorities indicate it is safe to do so. • Remember to help your neighbors who may require special assistance--infants, elderly people, and people with disabilities. • If your home, apartment or business has suffered damage, call the insurance company or agent who handles your flood insurance policy right away to file a claim. • Before entering a building, inspect foundations for cracks or other damage. Don't go in if there is any chance of the building collapsing. • Upon entering the building, Don't use matches, cigarette lighters or any other open flames, since gas may be trapped inside. Instead, use a flashlight to light your way. • Keep power off until an electrician has inspected your system for safety. • Floodwaters pick up sewage and chemicals from roads, farms and factories. If your home has been flooded, protect your family's health by cleaning up your house right away. Throw out foods and medicines that may have met floodwater. • Until local authorities proclaim your water supply to be safe, boil water for drinking and food preparation vigorously for five minutes before using. • Be careful walking around. After a flood, steps and floors are often slippery with mud and covered with debris, including nails and broken glass. • Take steps to reduce your risk of future floods. Make sure to follow local building codes and ordinances when rebuilding, and use flood-resistant materials and techniques to protect yourself and your property from future flood damage. • One of the most important things that you can do to protect your home and family before a flood is to purchase a flood insurance policy. You can obtain one through your insurance company or agent. Flood insurance is guaranteed through the National Flood Insurance Program.
Figure 3. Flood Damage, Washington County, Utah .August 2007
67
Inspecting Utilities In A Damaged Home • Check for gas leaks--If you smell gas or hear blowing or hissing noise, open a window and quickly leave the building. Turn off the gas at the outside main valve if you can and call the gas company from a neighbor's home. If you turn off the gas for any reason, it must be turned back on by a professional. • Look for electrical system damage--If you see sparks or broken or frayed wires, or if you smell hot insulation, turn off the electricity at the main fuse box or circuit breaker. If you have to step in water to get to the fuse box or circuit breaker, call an electrician for advice.
Check for sewage and water line damage--If you suspect sewage lines are damaged avoid using the toilets and call a plumber. If water pipes are damaged, contact the water company and avoid the water from the tap.
For further information Additional resources and information can be found at Salt Lake City National Weather Service website at http://www.wrh.noaa.gov/slc , the Utah Division of Homeland Security Division of Emergency Services website at http://publicsafety.utah.gov/homelandsecurity/ and the Federal Emergency Management Agency website at www.fema.gov .
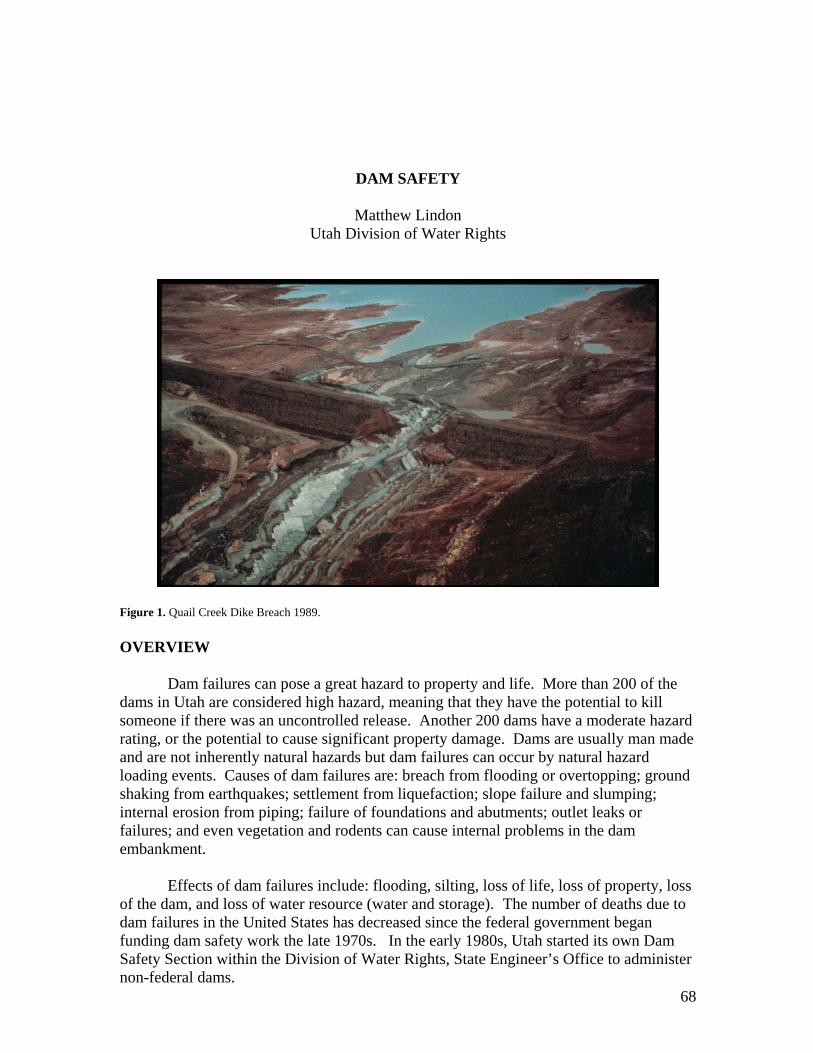
68
DAM SAFETY
Matthew Lindon Utah Division of Water Rights
Figure 1. Quail Creek Dike Breach 1989. OVERVIEW Dam failures can pose a great hazard to property and life. More than 200 of the dams in Utah are considered high hazard, meaning that they have the potential to kill someone if there was an uncontrolled release. Another 200 dams have a moderate hazard rating, or the potential to cause significant property damage. Dams are usually man made and are not inherently natural hazards but dam failures can occur by natural hazard loading events. Causes of dam failures are: breach from flooding or overtopping; ground shaking from earthquakes; settlement from liquefaction; slope failure and slumping; internal erosion from piping; failure of foundations and abutments; outlet leaks or failures; and even vegetation and rodents can cause internal problems in the dam embankment. Effects of dam failures include: flooding, silting, loss of life, loss of property, loss of the dam, and loss of water resource (water and storage). The number of deaths due to dam failures in the United States has decreased since the federal government began funding dam safety work the late 1970s. In the early 1980s, Utah started its own Dam Safety Section within the Division of Water Rights, State Engineer’s Office to administer non-federal dams.
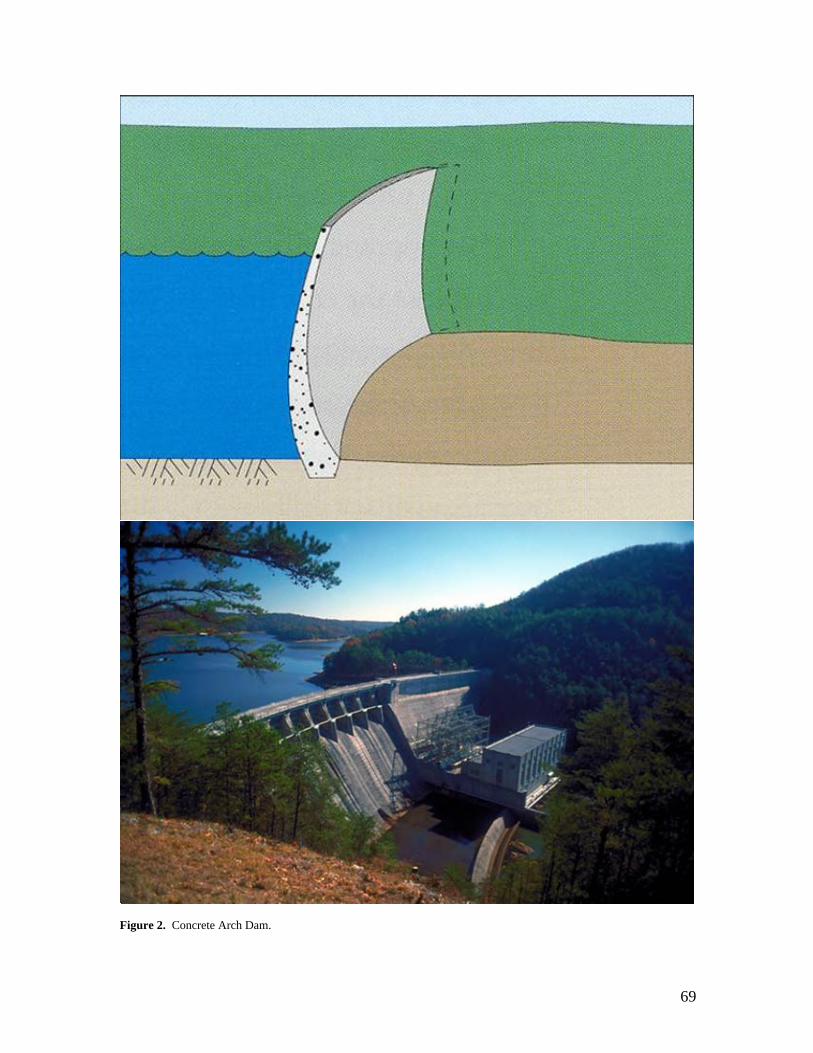
69
Figure 2. Concrete Arch Dam.
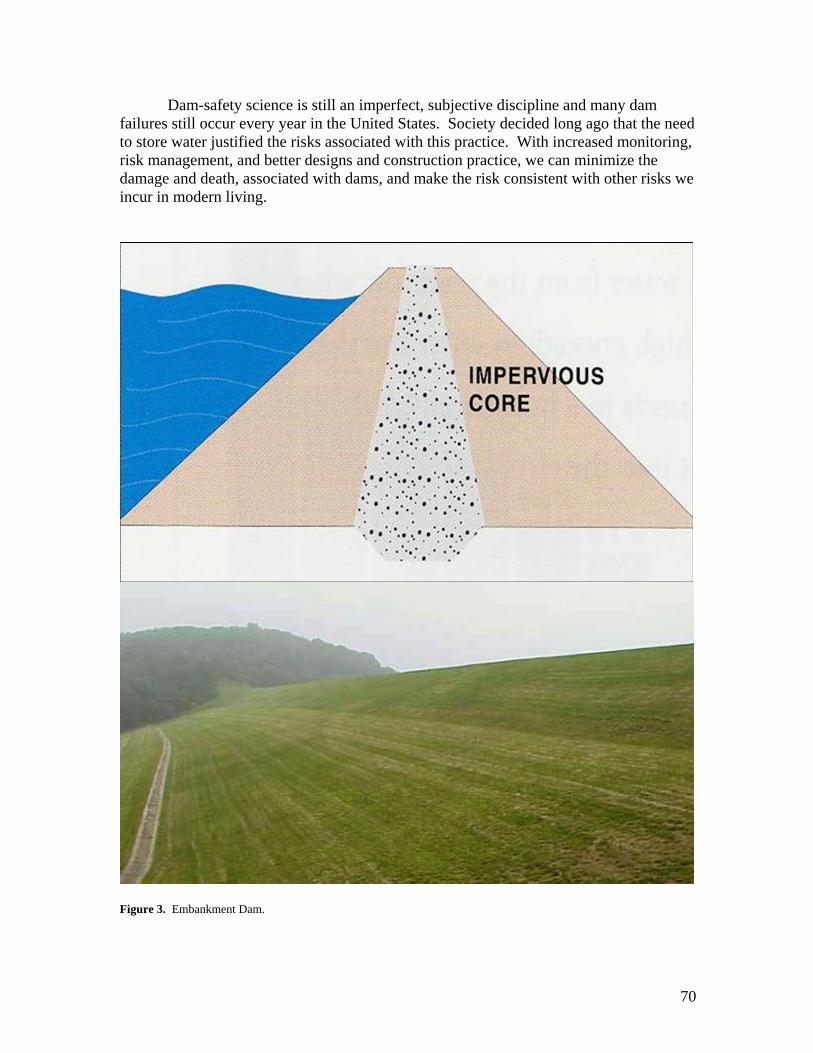
70
Dam-safety science is still an imperfect, subjective discipline and many dam failures still occur every year in the United States. Society decided long ago that the need to store water justified the risks associated with this practice. With increased monitoring, risk management, and better designs and construction practice, we can minimize the damage and death, associated with dams, and make the risk consistent with other risks we incur in modern living.
Figure 3. Embankment Dam.
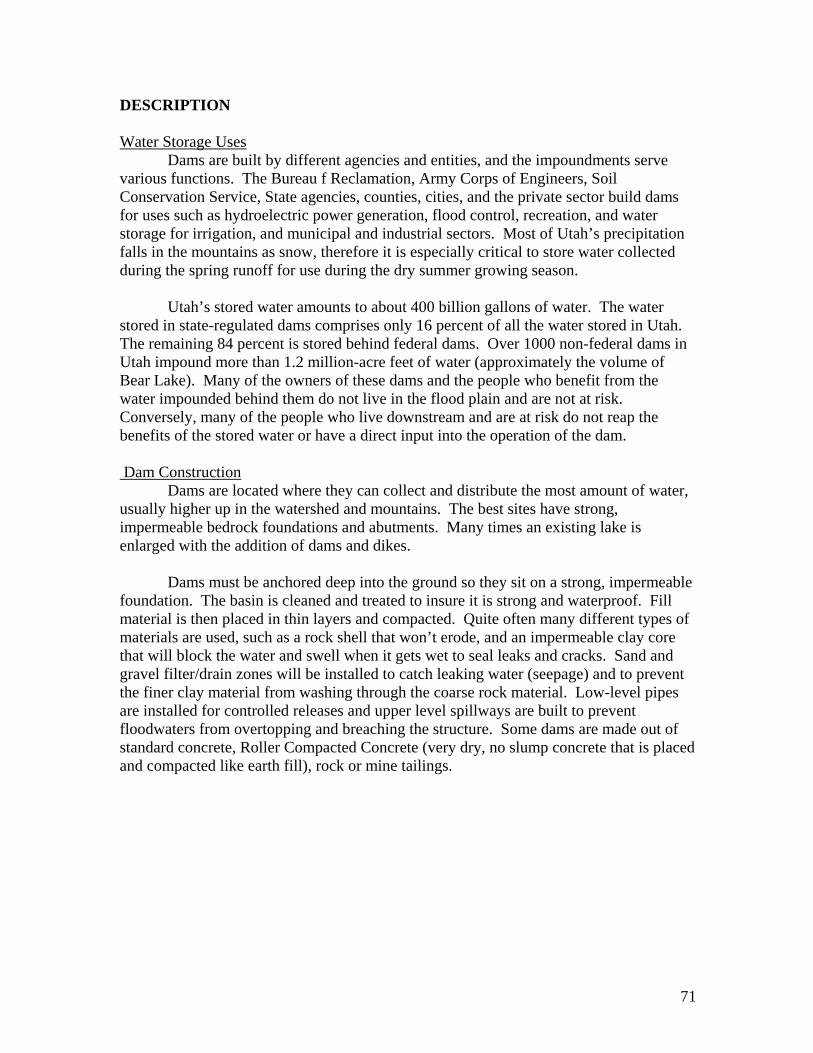
71
DESCRIPTION Water Storage Uses
Dams are built by different agencies and entities, and the impoundments serve various functions. The Bureau f Reclamation, Army Corps of Engineers, Soil Conservation Service, State agencies, counties, cities, and the private sector build dams for uses such as hydroelectric power generation, flood control, recreation, and water storage for irrigation, and municipal and industrial sectors. Most of Utah’s precipitation falls in the mountains as snow, therefore it is especially critical to store water collected during the spring runoff for use during the dry summer growing season.
Utah’s stored water amounts to about 400 billion gallons of water. The water stored in state-regulated dams comprises only 16 percent of all the water stored in Utah. The remaining 84 percent is stored behind federal dams. Over 1000 non-federal dams in Utah impound more than 1.2 million-acre feet of water (approximately the volume of Bear Lake). Many of the owners of these dams and the people who benefit from the water impounded behind them do not live in the flood plain and are not at risk. Conversely, many of the people who live downstream and are at risk do not reap the benefits of the stored water or have a direct input into the operation of the dam. Dam Construction
Dams are located where they can collect and distribute the most amount of water, usually higher up in the watershed and mountains. The best sites have strong, impermeable bedrock foundations and abutments. Many times an existing lake is enlarged with the addition of dams and dikes.
Dams must be anchored deep into the ground so they sit on a strong, impermeable foundation. The basin is cleaned and treated to insure it is strong and waterproof. Fill material is then placed in thin layers and compacted. Quite often many different types of materials are used, such as a rock shell that won’t erode, and an impermeable clay core that will block the water and swell when it gets wet to seal leaks and cracks. Sand and gravel filter/drain zones will be installed to catch leaking water (seepage) and to prevent the finer clay material from washing through the coarse rock material. Low-level pipes are installed for controlled releases and upper level spillways are built to prevent floodwaters from overtopping and breaching the structure. Some dams are made out of standard concrete, Roller Compacted Concrete (very dry, no slump concrete that is placed and compacted like earth fill), rock or mine tailings.
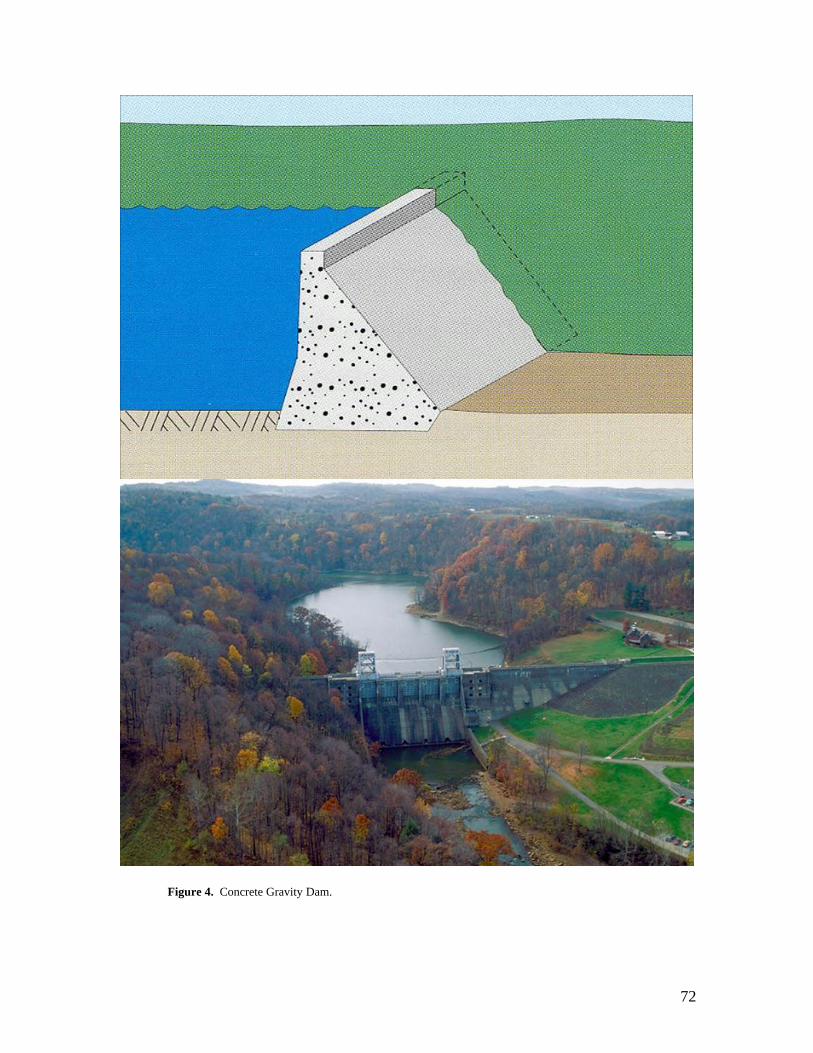
72
Figure 4. Concrete Gravity Dam.
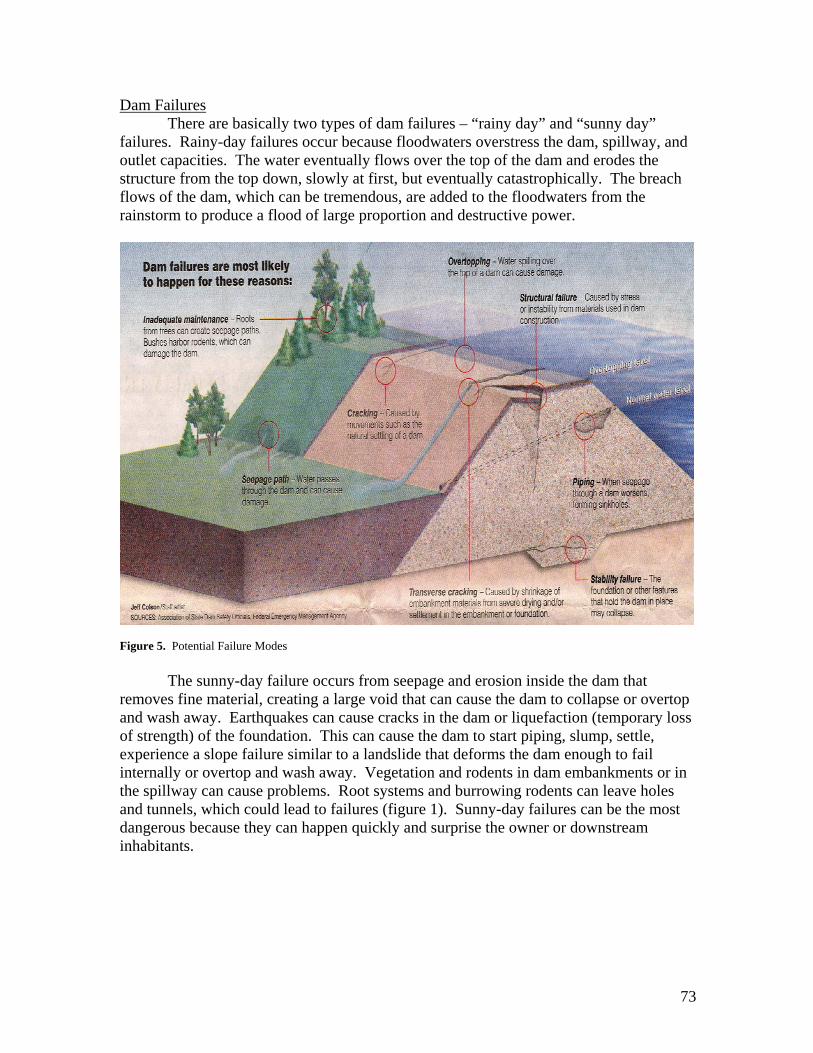
73
Dam Failures There are basically two types of dam failures – “rainy day” and “sunny day”
failures. Rainy-day failures occur because floodwaters overstress the dam, spillway, and outlet capacities. The water eventually flows over the top of the dam and erodes the structure from the top down, slowly at first, but eventually catastrophically. The breach flows of the dam, which can be tremendous, are added to the floodwaters from the rainstorm to produce a flood of large proportion and destructive power.
Figure 5. Potential Failure Modes The sunny-day failure occurs from seepage and erosion inside the dam that removes fine material, creating a large void that can cause the dam to collapse or overtop and wash away. Earthquakes can cause cracks in the dam or liquefaction (temporary loss of strength) of the foundation. This can cause the dam to start piping, slump, settle, experience a slope failure similar to a landslide that deforms the dam enough to fail internally or overtop and wash away. Vegetation and rodents in dam embankments or in the spillway can cause problems. Root systems and burrowing rodents can leave holes and tunnels, which could lead to failures (figure 1). Sunny-day failures can be the most dangerous because they can happen quickly and surprise the owner or downstream inhabitants.
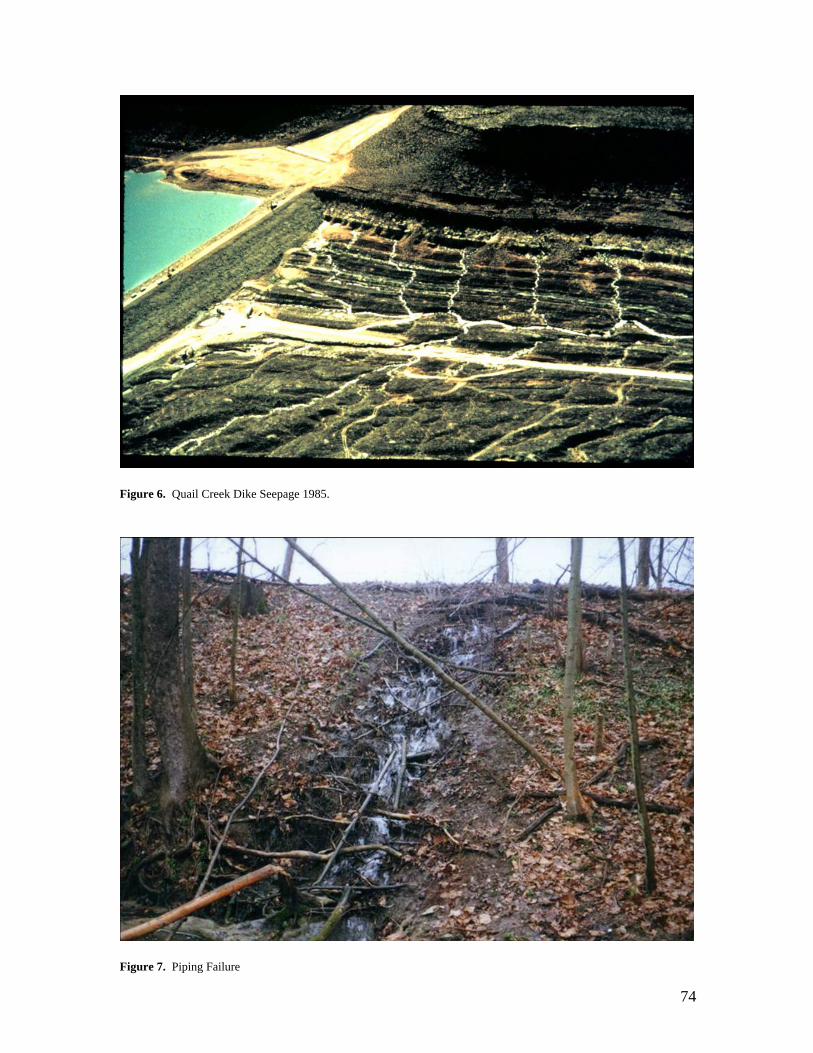
74
Figure 6. Quail Creek Dike Seepage 1985.
Figure 7. Piping Failure
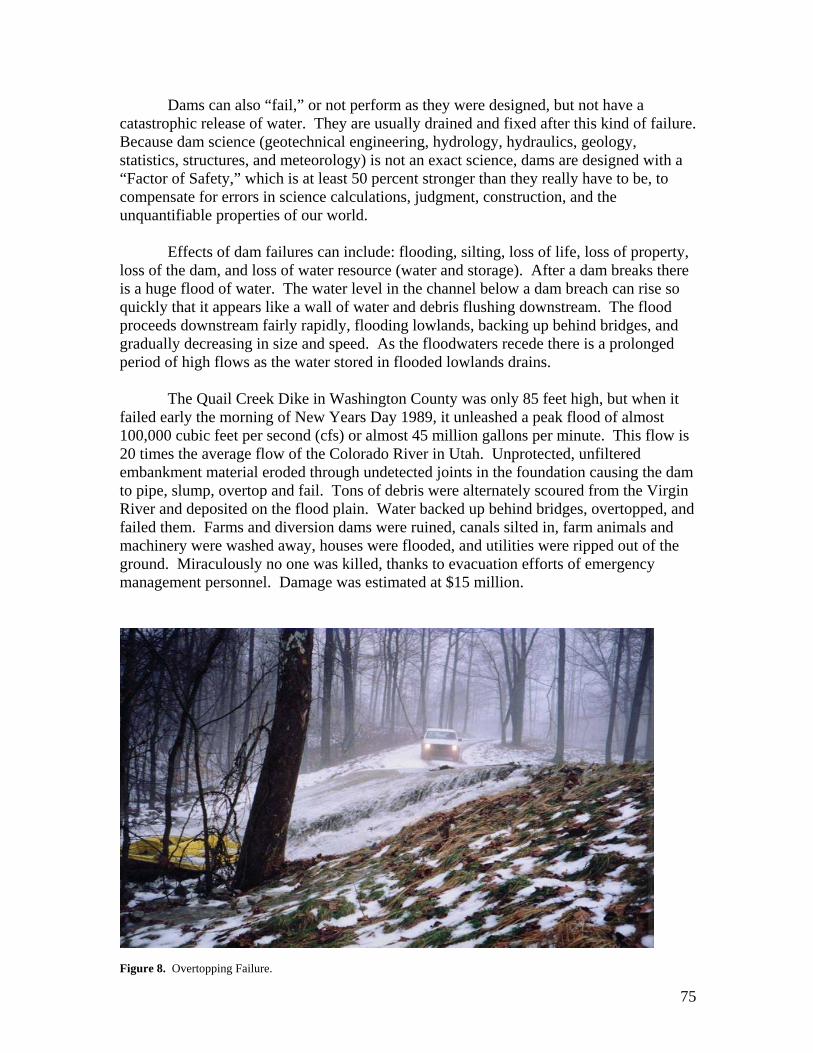
75
Dams can also “fail,” or not perform as they were designed, but not have a catastrophic release of water. They are usually drained and fixed after this kind of failure. Because dam science (geotechnical engineering, hydrology, hydraulics, geology, statistics, structures, and meteorology) is not an exact science, dams are designed with a “Factor of Safety,” which is at least 50 percent stronger than they really have to be, to compensate for errors in science calculations, judgment, construction, and the unquantifiable properties of our world. Effects of dam failures can include: flooding, silting, loss of life, loss of property, loss of the dam, and loss of water resource (water and storage). After a dam breaks there is a huge flood of water. The water level in the channel below a dam breach can rise so quickly that it appears like a wall of water and debris flushing downstream. The flood proceeds downstream fairly rapidly, flooding lowlands, backing up behind bridges, and gradually decreasing in size and speed. As the floodwaters recede there is a prolonged period of high flows as the water stored in flooded lowlands drains. The Quail Creek Dike in Washington County was only 85 feet high, but when it failed early the morning of New Years Day 1989, it unleashed a peak flood of almost 100,000 cubic feet per second (cfs) or almost 45 million gallons per minute. This flow is 20 times the average flow of the Colorado River in Utah. Unprotected, unfiltered embankment material eroded through undetected joints in the foundation causing the dam to pipe, slump, overtop and fail. Tons of debris were alternately scoured from the Virgin River and deposited on the flood plain. Water backed up behind bridges, overtopped, and failed them. Farms and diversion dams were ruined, canals silted in, farm animals and machinery were washed away, houses were flooded, and utilities were ripped out of the ground. Miraculously no one was killed, thanks to evacuation efforts of emergency management personnel. Damage was estimated at $15 million.
Figure 8. Overtopping Failure.
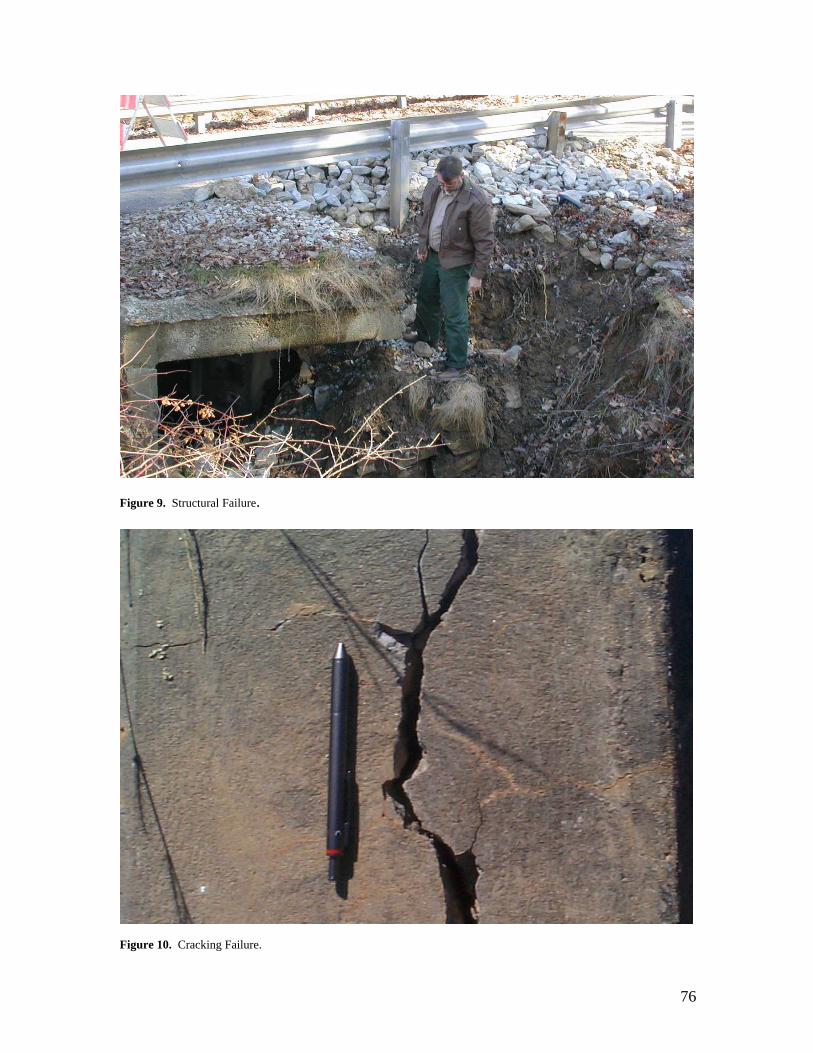
76
Figure 9. Structural Failure.
Figure 10. Cracking Failure.
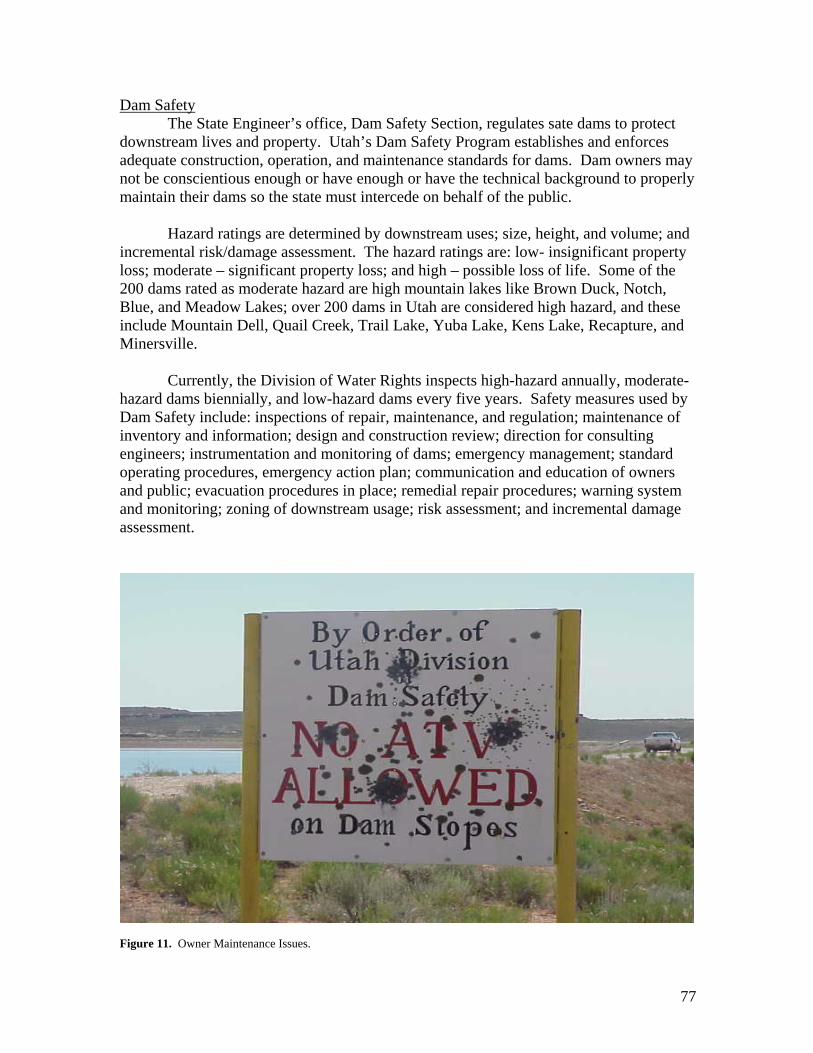
77
Dam Safety The State Engineer’s office, Dam Safety Section, regulates sate dams to protect
downstream lives and property. Utah’s Dam Safety Program establishes and enforces adequate construction, operation, and maintenance standards for dams. Dam owners may not be conscientious enough or have enough or have the technical background to properly maintain their dams so the state must intercede on behalf of the public. Hazard ratings are determined by downstream uses; size, height, and volume; and incremental risk/damage assessment. The hazard ratings are: low- insignificant property loss; moderate – significant property loss; and high – possible loss of life. Some of the 200 dams rated as moderate hazard are high mountain lakes like Brown Duck, Notch, Blue, and Meadow Lakes; over 200 dams in Utah are considered high hazard, and these include Mountain Dell, Quail Creek, Trail Lake, Yuba Lake, Kens Lake, Recapture, and Minersville. Currently, the Division of Water Rights inspects high-hazard annually, moderate-hazard dams biennially, and low-hazard dams every five years. Safety measures used by Dam Safety include: inspections of repair, maintenance, and regulation; maintenance of inventory and information; design and construction review; direction for consulting engineers; instrumentation and monitoring of dams; emergency management; standard operating procedures, emergency action plan; communication and education of owners and public; evacuation procedures in place; remedial repair procedures; warning system and monitoring; zoning of downstream usage; risk assessment; and incremental damage assessment.
Figure 11. Owner Maintenance Issues.
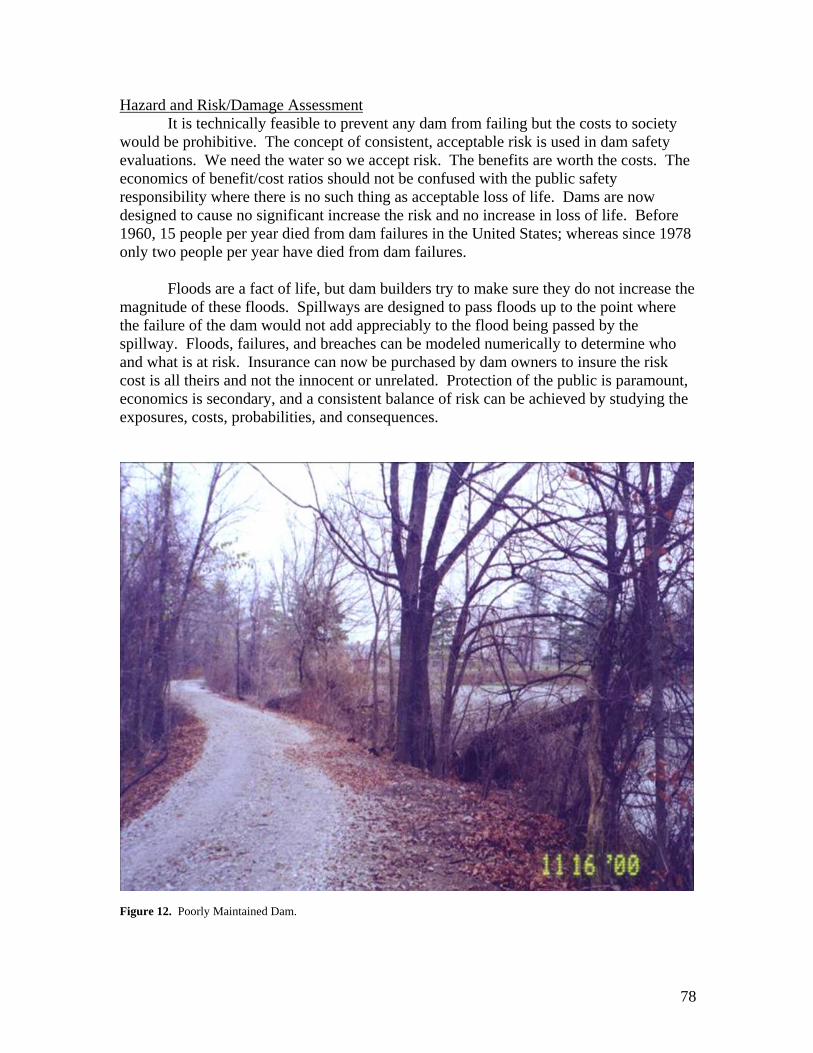
78
Hazard and Risk/Damage Assessment It is technically feasible to prevent any dam from failing but the costs to society
would be prohibitive. The concept of consistent, acceptable risk is used in dam safety evaluations. We need the water so we accept risk. The benefits are worth the costs. The economics of benefit/cost ratios should not be confused with the public safety responsibility where there is no such thing as acceptable loss of life. Dams are now designed to cause no significant increase the risk and no increase in loss of life. Before 1960, 15 people per year died from dam failures in the United States; whereas since 1978 only two people per year have died from dam failures. Floods are a fact of life, but dam builders try to make sure they do not increase the magnitude of these floods. Spillways are designed to pass floods up to the point where the failure of the dam would not add appreciably to the flood being passed by the spillway. Floods, failures, and breaches can be modeled numerically to determine who and what is at risk. Insurance can now be purchased by dam owners to insure the risk cost is all theirs and not the innocent or unrelated. Protection of the public is paramount, economics is secondary, and a consistent balance of risk can be achieved by studying the exposures, costs, probabilities, and consequences.
Figure 12. Poorly Maintained Dam.
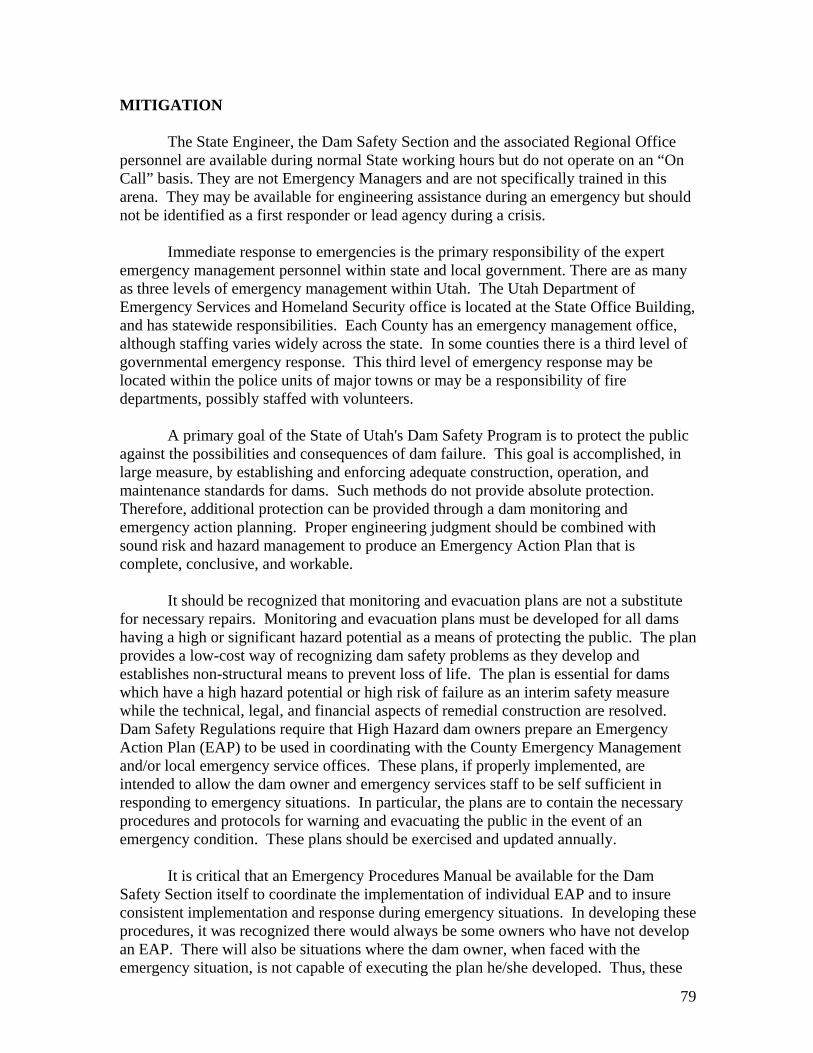
79
MITIGATION
The State Engineer, the Dam Safety Section and the associated Regional Office personnel are available during normal State working hours but do not operate on an “On Call” basis. They are not Emergency Managers and are not specifically trained in this arena. They may be available for engineering assistance during an emergency but should not be identified as a first responder or lead agency during a crisis.
Immediate response to emergencies is the primary responsibility of the expert emergency management personnel within state and local government. There are as many as three levels of emergency management within Utah. The Utah Department of Emergency Services and Homeland Security office is located at the State Office Building, and has statewide responsibilities. Each County has an emergency management office, although staffing varies widely across the state. In some counties there is a third level of governmental emergency response. This third level of emergency response may be located within the police units of major towns or may be a responsibility of fire departments, possibly staffed with volunteers.
A primary goal of the State of Utah's Dam Safety Program is to protect the public against the possibilities and consequences of dam failure. This goal is accomplished, in large measure, by establishing and enforcing adequate construction, operation, and maintenance standards for dams. Such methods do not provide absolute protection. Therefore, additional protection can be provided through a dam monitoring and emergency action planning. Proper engineering judgment should be combined with sound risk and hazard management to produce an Emergency Action Plan that is complete, conclusive, and workable.
It should be recognized that monitoring and evacuation plans are not a substitute for necessary repairs. Monitoring and evacuation plans must be developed for all dams having a high or significant hazard potential as a means of protecting the public. The plan provides a low-cost way of recognizing dam safety problems as they develop and establishes non-structural means to prevent loss of life. The plan is essential for dams which have a high hazard potential or high risk of failure as an interim safety measure while the technical, legal, and financial aspects of remedial construction are resolved. Dam Safety Regulations require that High Hazard dam owners prepare an Emergency Action Plan (EAP) to be used in coordinating with the County Emergency Management and/or local emergency service offices. These plans, if properly implemented, are intended to allow the dam owner and emergency services staff to be self sufficient in responding to emergency situations. In particular, the plans are to contain the necessary procedures and protocols for warning and evacuating the public in the event of an emergency condition. These plans should be exercised and updated annually.
It is critical that an Emergency Procedures Manual be available for the Dam Safety Section itself to coordinate the implementation of individual EAP and to insure consistent implementation and response during emergency situations. In developing these procedures, it was recognized there would always be some owners who have not develop an EAP. There will also be situations where the dam owner, when faced with the emergency situation, is not capable of executing the plan he/she developed. Thus, these
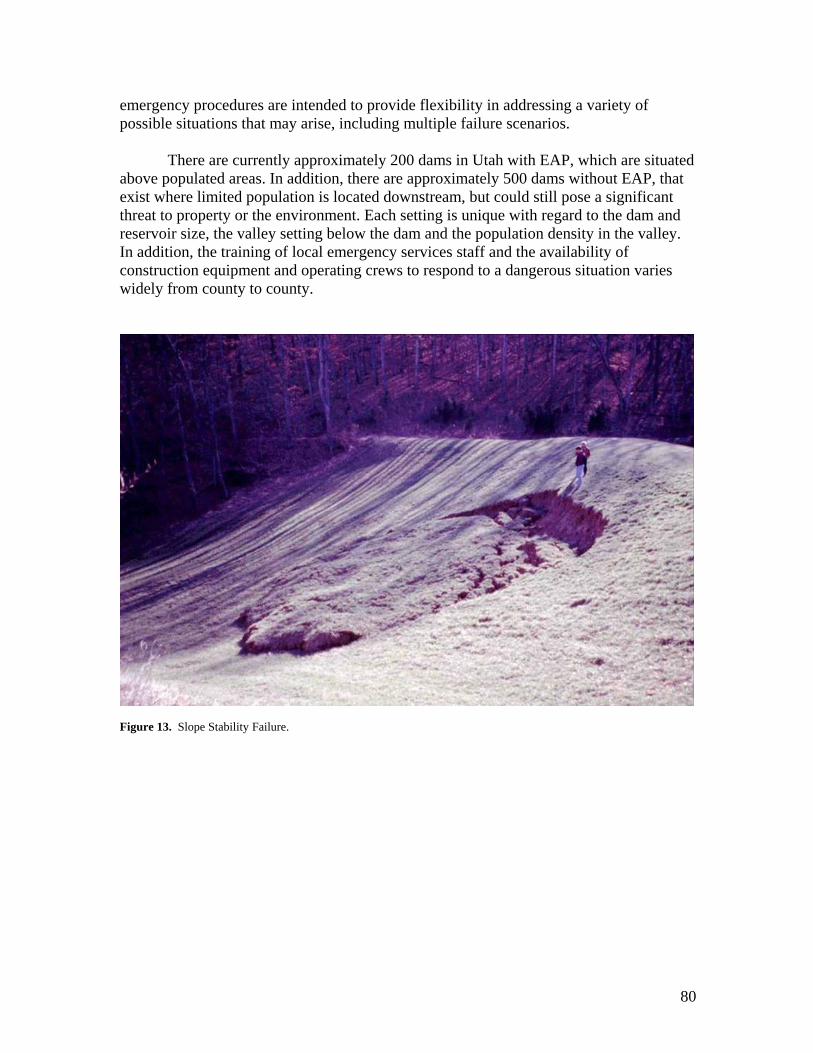
80
emergency procedures are intended to provide flexibility in addressing a variety of possible situations that may arise, including multiple failure scenarios.
There are currently approximately 200 dams in Utah with EAP, which are situated above populated areas. In addition, there are approximately 500 dams without EAP, that exist where limited population is located downstream, but could still pose a significant threat to property or the environment. Each setting is unique with regard to the dam and reservoir size, the valley setting below the dam and the population density in the valley. In addition, the training of local emergency services staff and the availability of construction equipment and operating crews to respond to a dangerous situation varies widely from county to county.
Figure 13. Slope Stability Failure.
81
HAZARDOUS SITUATION - FAILURE POSSIBLE OR IMMINENT
STATE REGULATED DAM EMERGENCY ACTION PLAN BEING IMPLEMENTED
OVERVIEW: • The Emergency Action Plan (EAP) contains the basic procedures for response. The
dam owner and county emergency management should have copies of the EAP and be familiar with its operation from annual updates and exercises. Copies of the EAP and dam breach inundation maps are also available in the Dam Safety Office at the DNR, as well as on Dam Safety’s web site under each dams inventory page, ( www.waterrights.utah.gov ).
• Dam owners and on-site personnel have primary responsibility for initiating notification and in coordinating with the local and/or County emergency services office
DAM SAFETY SECTION ROLE:
• Dam Safety’s role will be to take the lead where possible and provide technical assistance to local emergency services, County emergency management and the dam owner. This may be done by telephone or more likely by dispatching Dam Safety Staff or other technical people to the site.
ACTION LIST: 1.) Obtain as much information about the condition of the dam and the ongoing situation
as possible from the dam owner, County emergency management or local officials.
2.) To the best of Dam Safety’s ability, make an assessment of the seriousness of the
situation, considering: • Nature of the incident and the possibility of a rapid failure mode • Likely magnitude of dam breach flood and the consequences to lives, property and
the environment • Availability of local resources (people and equipment) to respond • Likely time available before the situation could turn critical (i.e. weather, runoff,
freeboard) • Travel time to the site
3.) To the best of Dam Safety’s ability, confirm through the local emergency services
office that: • EAP is being implemented • Appropriate actions are taking place • Notification is being given to downstream inhabitants
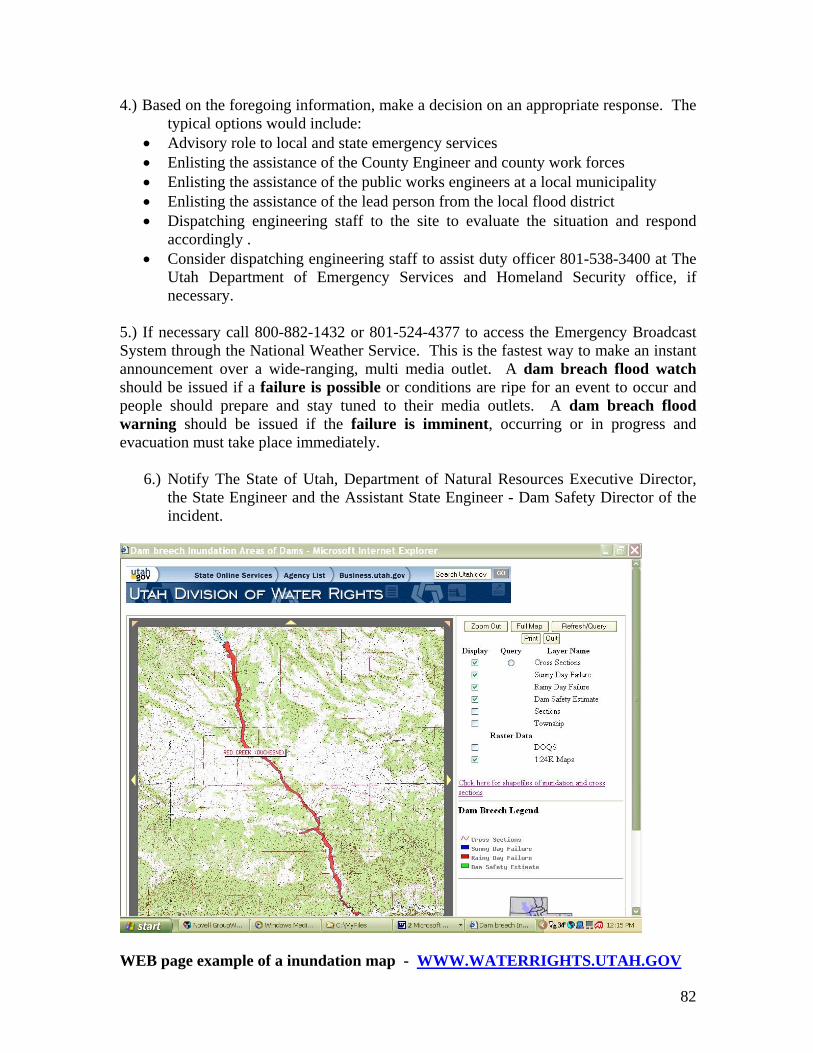
82
4.) Based on the foregoing information, make a decision on an appropriate response. The typical options would include:
• Advisory role to local and state emergency services • Enlisting the assistance of the County Engineer and county work forces • Enlisting the assistance of the public works engineers at a local municipality • Enlisting the assistance of the lead person from the local flood district • Dispatching engineering staff to the site to evaluate the situation and respond
accordingly . • Consider dispatching engineering staff to assist duty officer 801-538-3400 at The
Utah Department of Emergency Services and Homeland Security office, if necessary.
5.) If necessary call 800-882-1432 or 801-524-4377 to access the Emergency Broadcast System through the National Weather Service. This is the fastest way to make an instant announcement over a wide-ranging, multi media outlet. A dam breach flood watch should be issued if a failure is possible or conditions are ripe for an event to occur and people should prepare and stay tuned to their media outlets. A dam breach flood warning should be issued if the failure is imminent, occurring or in progress and evacuation must take place immediately.
6.) Notify The State of Utah, Department of Natural Resources Executive Director, the State Engineer and the Assistant State Engineer - Dam Safety Director of the incident.
WEB page example of a inundation map - WWW.WATERRIGHTS.UTAH.GOV
83
HAZARDOUS SITUATION - FAILURE POSSIBLE OR IMMINENT
STATE REGULATED DAM
EAP NOT BEING IMPLEMENTED OR
NO EMERGENCY ACTION PLAN EXISTS OVERVIEW:
• There is no coordinated notification or warning of downstream residences taking place
• To the extent practicable, all decisions will have to be made in coordination with the dam owner, County and State of Utah Division of Homeland Security and Emergency Management, and local officials
DAM SAFETY SECTION ROLE:
• The Dam Safety Section has the lead regulatory role if regulatory actions are needed. However, the nature of Dam Safety’s response will be dictated by the manner in which the local emergency services office responds to the situation. We could act as technical advisors to the local emergency services and County emergency management offices or could be asked to take the lead in decision making and coordinating the response.
ACTION LIST: 1.) Obtain as much information about the condition of the dam and the ongoing situation
as possible from the dam owner, County emergency management and local officials.
2.) To the best of Dam Safety’s ability, make an assessment of the seriousness of the
situation, considering: • nature of the incident and the possibility of a rapid failure mode • likely magnitude of a dam breach flood and the consequences to lives, property
and the environment • availability of local Resources, Dam Safety (people and equipment) to respond • likely time available before the situation could turn critical • travel time to the site
3.) Make a decision on an appropriate response. The typical options would include:
• Advisory role to local and state emergency services • Enlisting the assistance of the County Engineer and county work forces • Enlisting the assistance of the Lead Engineer from the local flood-fighting district
of the COE
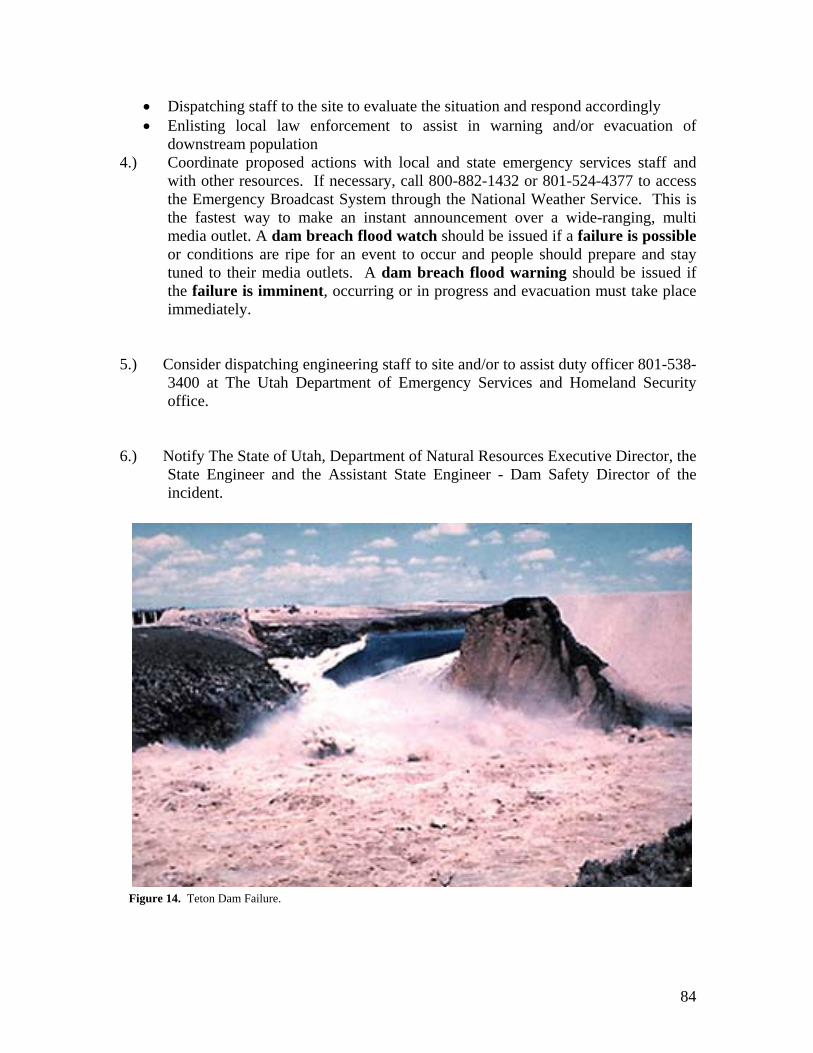
84
• Dispatching staff to the site to evaluate the situation and respond accordingly • Enlisting local law enforcement to assist in warning and/or evacuation of
downstream population 4.) Coordinate proposed actions with local and state emergency services staff and
with other resources. If necessary, call 800-882-1432 or 801-524-4377 to access the Emergency Broadcast System through the National Weather Service. This is the fastest way to make an instant announcement over a wide-ranging, multi media outlet. A dam breach flood watch should be issued if a failure is possible or conditions are ripe for an event to occur and people should prepare and stay tuned to their media outlets. A dam breach flood warning should be issued if the failure is imminent, occurring or in progress and evacuation must take place immediately.
5.) Consider dispatching engineering staff to site and/or to assist duty officer 801-538-
3400 at The Utah Department of Emergency Services and Homeland Security office.
6.) Notify The State of Utah, Department of Natural Resources Executive Director, the
State Engineer and the Assistant State Engineer - Dam Safety Director of the incident.
Figure 14. Teton Dam Failure.
85
STANDARD OPERATING PROCEDURES
The Dam Safety Act, passed by the legislature in 1990, affords several provisions to improve the regulatory ability of the State Engineer (Dam Safety Section) and directs him to establish minimum standards for existing dams. In addition, these laws require that existing dam owners (and new dam builders) formalize their Standard Operating Plans (SOP) and Emergency Action Plans (EAP) in separate standardized documents.
The SOP is intended as a private document to be shared by the dam owner/operator and the Dam Safety Section. The EAP is a public document that should be distributed to Public Safety officials, the local Sheriff, downstream inhabitants and all other entities impacted by the risk of the dam. The EAP should be included as part of the SOP for operating procedures during emergency situations.
The State Engineer's office has been inspecting dams on a rigid schedule for over two decades. The majority of problems encountered are directly related to poor maintenance or improper operation of mechanical features such as outlet controls. That is why the Dam Safety Act requires owners of dams to prepare Standard Operating Plans. The statute states this plan must be approved and in place by May 1, 1994. The objective in formulating an operating procedure or plan is to provide the greatest possible assurance of the safety of the dam and continuous operation of the reservoir. An effective plan provides all the information and instruction needed to allow an inexperienced person to perform all actions required to operate the dam safely. Among the items addressed are the operation of valves and head-gates, periodic inspection of the dam, monitoring the dam's performance, recording and interpreting the results of the inspection and monitoring, and performance of all required maintenance. By drawing up and using an operating procedure, the dam owner and/or shareholders can expect these benefits:
- Assuring the safety of the dam and continuous operation of the reservoir
- Avoiding the waste of stored water by having it under control at all times
- Minimizing the need for costly repairs
- Extending the useful life of the structure.
By requiring minimum standards for existing dams and adopting Standard Operating Procedures, most of the problems representing a threat will be eliminated. However, the possibility of a dam failure cannot be totally ruled out. To this end, the new Dam Safety Act requires all owners of High Hazard Dams to have an Emergency Action Plan in place. The plan identifies types of emergencies and responses, a notification list of persons involved, and depicts the potential inundation area to facilitate evacuation of the downstream channel. Inundation maps must be prepared to show the potential inundation areas. The maps may serve a secondary purpose by making owners and local officials cognizant of the threat dams represent which could lead to more responsible zoning. Too often development occurs downstream of a dam which is not appropriate and exposes the owner of the dam to unnecessary liability.
86
DAM SAFETY - REGULATORY AUTHORITY: Actions may be taken by Dam Safety Section professional engineers as deemed necessary to respond to emergency or exigency conditions to protect life and property. The State Engineer, the Dam Safety Section and the Regional Offices are available during normal State working hours but do not operate on an “On Call” basis. They are not Emergency Managers and are not specifically trained in this arena. They may be available for engineering assistance during an emergency but should not be identified as a first responder or lead agency during a crisis. It is the policy of the Dam Safety Section to work with and advise the dam owner of recommended actions and allow the owner to direct construction and repair crews.
Where an owner is unresponsive or directing actions that are unsafe, and there is an imminent threat to life, Department of Natural Resources, Dam Safety has the authority, in accordance with Section 73-5a-603 and 73-2-22 of the Utah Code, and protection by the Government Immunity Act, to take control of the project and professional staff may take actions as necessary to protect the public. Where necessary, enforcement of directives may require the assistance of the local sheriff.
73-5a-603. Emergency power of state engineer. (1) The state engineer may intervene during dam emergencies if the owner of the dam cannot be found or is unwilling to take appropriate action. Intervention may occur only when, in the judgment of the state engineer, the condition of any dam is so dangerous to the safety of life or property as to not permit time for issuance and enforcement of any order. (2) Emergency actions may include: (a) alerting appropriate public safety entities of the problem; (b) draining the reservoir; (c) hiring personnel or leasing equipment to undertake emergency operations; or (d) taking other steps considered necessary to safeguard life and property. (3) Any expenses incurred in undertaking emergency operations shall be reimbursed by the owner of the dam. Enacted by Chapter 319, 1990 General Session 73-2-22. Emergency flood powers -- Action to enforce orders -- Access rights to private and public property -- Injunctive relief against state engineer's decisions -- Judicial review provisions not applicable. Whenever the state engineer, with approval of the chairman of the Disaster Emergency Advisory Council, makes a written finding that any reservoir or stream has reached or will reach during the current water year a level far enough above average and in excess of capacity that public safety is or is likely to be endangered or that substantial property damage is occurring or is likely to occur, he shall have emergency powers until the danger to the public and property is abated. Emergency powers shall consist of the authority to control stream flow and reservoir storage or release. The state engineer must

87
protect existing water rights to the maximum extent possible when exercising emergency powers. Any action taken by the state engineer under this section shall be by written order. If any person refuses or neglects to comply with any order of the state engineer issued pursuant to his emergency powers, the state engineer may bring action in the name of the state in the district court to enforce them. In carrying out his emergency powers, the state engineer shall have rights of access to private and public property. Any person affected by a decision of the state engineer made under his emergency powers shall have the right to seek injunctive relief, including temporary restraining orders and temporary injunctions in any district court of the county where that person resides. No order of the state engineer shall be enjoined or set aside unless shown by clear and convincing evidence that an emergency does not in fact exist or that the order of the state engineer is arbitrary or capricious. The provisions of Sections 73-3-14 and 73-3-15 shall not be applicable to any order of the state engineer issued pursuant to this section. Enacted by Chapter 33, 1984 General Session Prepared by Matthew Lindon, PE, 2006 Department of Natural Resources, Division of Water Rights - State Engineer’s Office Dam, Safety Section.. Thanks to the Association of State Dam Safety Officials for some drawings and photos
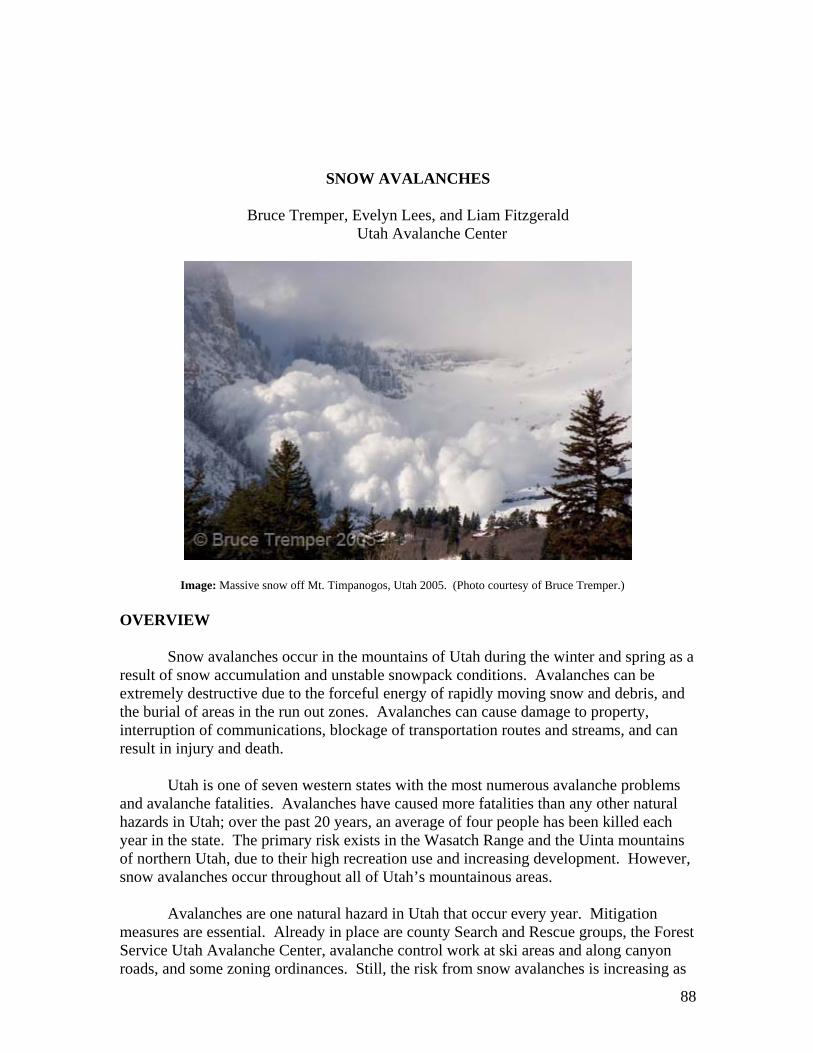
88
SNOW AVALANCHES
Bruce Tremper, Evelyn Lees, and Liam Fitzgerald Utah Avalanche Center
Image: Massive snow off Mt. Timpanogos, Utah 2005. (Photo courtesy of Bruce Tremper.) OVERVIEW Snow avalanches occur in the mountains of Utah during the winter and spring as a result of snow accumulation and unstable snowpack conditions. Avalanches can be extremely destructive due to the forceful energy of rapidly moving snow and debris, and the burial of areas in the run out zones. Avalanches can cause damage to property, interruption of communications, blockage of transportation routes and streams, and can result in injury and death. Utah is one of seven western states with the most numerous avalanche problems and avalanche fatalities. Avalanches have caused more fatalities than any other natural hazards in Utah; over the past 20 years, an average of four people has been killed each year in the state. The primary risk exists in the Wasatch Range and the Uinta mountains of northern Utah, due to their high recreation use and increasing development. However, snow avalanches occur throughout all of Utah’s mountainous areas. Avalanches are one natural hazard in Utah that occur every year. Mitigation measures are essential. Already in place are county Search and Rescue groups, the Forest Service Utah Avalanche Center, avalanche control work at ski areas and along canyon roads, and some zoning ordinances. Still, the risk from snow avalanches is increasing as
89
recreational use and development in mountainous areas expand and traffic increases on avalanche prone highways. Appropriate land-use management, effective building codes, control work, avalanche forecasting, public education, and rescue plans are all essential. DESCRIPTION A snow avalanche is a rapid down slope movement of a mass of snow, ice and debris. An avalanche can cover a wide area or be concentrated in an avalanche track. Avalanche paths consist of a starting zone, a track, and a run-out zone. Avalanche paths may not have a serious avalanche for years or even decades, but the potential is there – especially during above averaged snowfall years. Part(s) of an avalanche-starting zone may run, or all of an avalanche-starting zone may release at once. The starting zone can be several miles wide. Avalanches occur naturally, or they can be triggered artificially by explosives or people such as backcountry winter recreationist. Overall, weather, terrain and snow pack combine in a complex relationship affecting avalanche conditions. Potential avalanche activity is related to the probability of large storms as well as already established avalanche path. Weather and Snowpack. Weather is the architect of the snow pack. Weather events create a layered snow pack, and when strong layers, or slabs, form on weak layers, the snow pack can become unstable. The amount of snow, rate of accumulation, wind speed and direction, moisture content, and snow crystal types all contribute to snow pack stability conditions. The weather contributes to the timing and duration of avalanches, particularly natural or spontaneous, avalanches. Most natural avalanches occur during or within 24 hours after a storm. However, if there are persistent weak layers buried in the snow pack, human triggered avalanches can be occur for days after a storm. In Utah, the avalanche potential is greatest from December through April, although there have been large avalanches as early as mid-November and as late as early-June. Terrain. Terrain factors affecting avalanches include slope angle, elevation, aspect, shape, and roughness. Elevation and aspect dictate the depth, temperature, and moisture characteristics of the snow pack. Slope shape and roughness contribute to stability; for example, bowl-shaped slopes are more prone to avalanching than ridges, and boulders, shrubs, and trees contribute to the slope’s roughness and provide some stability. However, it is important to note that under extreme conditions, avalanches can occur in heavily timbered areas. Slope angle is the primary factor of avalanche probability. Avalanches can occur on slopes greater than 20 degrees, and the optimum angles are between 30 and 45 degrees. On slope angles greater than 45 degrees, snow generally does not accumulate. Impacts Both economic losses and loss of life can result from avalanches. At risk are some communities, individual structures, vehicles, roads, ski areas and people, particularly backcountry winter recreationists including backcountry skiers, snowmobilers, snowshoers, snowboarders, and climbers.
90
An avalanche can have enough energy, commonly reaching speeds of 80 miles per hour, to destroy everything in its path. An air blast may precede an avalanche, which can also cause damage. Another consequence of avalanches is burial of structures, roads, cars, and people in the runout zone and the interruption of transportation corridors. Tens of feet of snow and debris can be deposited over large areas. Flooding may result if a stream is dammed. Most avalanche accidents occur in backcountry, where avalanche control work is not done. In 93 percent of avalanche fatalities, the victim, or someone in the victim’s group triggered the avalanche. Case Histories Numerous destructive avalanches have occurred in Utah. Historically, the greatest death toll from Utah avalanches was suffered by the early miners, with an estimate of over 200 lives lost. When people moved to the mining communities in the mountains during the mining era in the late 1800s and early 1900s, the interaction of avalanches and people was inevitable. Several documented events include the following. In January 1881, March 1884, and February 1885, avalanches nearly destroyed the town of Alta, and a total 42 people were killed. In the Bingham Canyon mining community, 25 homes were destroyed and 40 people were killed in one avalanche (February, 1926). The community was rebuilt in the same place, and in 1939, four more people were killed, and four injured by another avalanche. After the mining era, the sport of skiing became popular, and in the late 1930s, ski area development in the Wasatch Range renewed concerns about avalanche hazards. To some degree, avalanche hazards were taken into account during construction. Control work, such as artificially pre-releasing avalanches, was and still is practiced. However, there is always an inherent risk from avalanches in the mountains. Some avalanche paths endanger many of Snowbird’s and Alta’s ski-area parking lots and structures. Once, all three floors of the Alta Lodge were filled with snow from an avalanche, which also deposited a car on top of the roof. In January 1974, three lodges were damaged, two people injured, and 35 cars damaged or destroyed. In May 1983, an avalanche destroyed the chapel. At Sundance ski area, an expensive home was built in an avalanche path near the ski area, and the house was completely destroyed by an avalanche in 1986. Due to rigorous avalanche control work, Utah ski areas have an excellent safety record. However, there is always the chance of unplanned avalanche occurrences, and ski area terrain cannot always be guaranteed safe from avalanches. In the past 25 years, two skiers and one avalanche worker have been killed in Utah ski resorts.
Canyon roads, and therefore people traveling these roads, are at risk. Numerous incidents of cars and even UTA busses knocked off roads by avalanches have been reported. Although control work is practiced along roads in the Big Cottonwood, Little Cottonwood, Provo and American Fork Canyons, there is always a chance of unplanned avalanche occurrences. For example, avalanches issuing out of the Tanner’s avalanche path in Little Cottonwood Canyon crossed the highway 11 times in 14 years, of which only one was released from control work. During a large snowstorm in 1991, several
91
came down and crossed the road in Big Cottonwood Canyon. The largest one came out near Storm Mountain, which buried the road with over 20 feet of snow and debris; luckily now cars were there at the time. It took 10 hours to clean the debris and open the road. Other, smaller avalanches further up canyon did push several cars off the road. Provo Canyon has been the site of three confirmed deaths due to avalanches in 1897 and 1924. In February 1986, a large avalanche from Bridal Veil Falls crossed the road and blocked the Provo River, which then caused the river to erode parts of the road.
Several other canyon roads throughout the state are at times threatened by avalanches, but at the present time, do not have active avalanche forecasting or control programs under the direction of UDOT. These would include, Ogden Canyon, North Ogden Pass, Powder Mountain access road, Brian Head access road, Daniels Canyon, Spanish Fork Canyon, and Price Canyon. Residences in some of these areas are also susceptible to avalanches. Most avalanche fatalities occur in the backcountry, and there has been an average of four avalanche deaths per year in Utah in the last 20 years. MITIGATION Hazard mitigation measures include appropriate land-use management and effective building codes in avalanche-prone areas, control measures including defense structures and artificial pre-release of avalanches, avalanche danger forecasting, public avalanche education, and rescue plans. Mitigation becomes more critical as the recreation use and development in mountainous areas increases. Land-use and building codes. The most cost-effective and safe measures to prevent property damage is to avoid use of lands and building in avalanche paths and runout zones. Avalanche-prone areas can be delineated in many cases, because avalanches tend to run down the same paths year after year. Avalanche paths can often be identified by lack of vegetation or a predominance of quick-growing aspen and low shrubs. However, under extreme conditions, avalanches can overrun historical path boundaries or create new paths. In these conditions, avalanches can occur in heavily timbered areas. Currently, only several locales have zoning ordinances. The town of Alta, which is threatened by avalanches from all sides, has an avalanche zoning plan that is administered by the Salt Lake County Planning Department. The zoning plan controls development in avalanche zones through building permits. Avalanche experts should always be consulted. Salt Lake County also includes avalanches in its Natural Hazards Ordinance, which requires hazard studies by an avalanche expert prior to construction in avalanche hazard areas. Control measures. Structural controls, such as erecting snow fences to keep snow away from starting zones; building snow sheds over particularly dangerous sections of roads; building diversion structures, like wedges, to divide avalanches and minimize their impact; and constructing concrete buildings to withstand avalanche forces, can all be considered in developing areas.

92
Planned explosive releases of snow accumulations are the most commonly used control techniques in the Wasatch Range. This method pre-releases avalanche when no one is in the runout zone, and reduces the unplanned avalanches in ski areas and along roads. Explosive charges can be delivered by hand, artillery or mechanical conveyance. The Utah Department of Transportation (UDOT) took responsibility for the forecasting and control avalanches along Big and Little Cottonwood Canyon highways in the 1980’s and in Provo and American Fork Canyons in the 1990’s. UDOT closes the roads while performing explosive and clean-up work; the procedure can often be accomplished in 6-12 hours. UDOT uses a combination of military artillery, Avalauncher (a compressed gas powered projectile launcher), hand delivered charges, GAZ-EX (a fixed device located in avalanche starting zones that uses a mixture of propane and oxygen to produce an above-snow detonation), and helicopter control in their avalanche hazard reduction efforts. Helicopter control work, while quite effective, can only be implemented during reasonably good weather conditions. Avalanche forecasting. Each ski area and the Utah Department of Transportation have their own avalanche forecasting programs for their areas or highways. The Forest Service Utah Avalanche Center (FSUAC) provides avalanche advisories for backcountry recreationalists to help people avoid or minimize exposure to avalanches. The UAFC provides weather, snow, stability, and avalanche danger ratings within a given area, with specific information regarding the range of elevation, slope angle and aspect. Forecasts are available for the Logan, Ogden, Salt Lake, Park City and Provo area mountains, and the Western Uinta, Manti Skyline/Wasatch Plateau and the La Sal Mountains. There are many mountainous regions in Utah with no backcountry avalanche forecasts due to financial constraints. Forecasts are generally available form early November through mid April. Public education. Avalanche education for winter outdoor recreationists is important and in Utah a joint effort of many organizations, including the ski areas, Forest Service Utah Avalanche Center, Wasatch Backcountry Rescue, private guide services and avalanche schools and UDOT. Avalanche warning signs are posted at ski areas, along highways and at many popular trailheads. Five avalanche beacon training parks are set up each winter in Utah. The Forest Service Utah Avalanche Center provides education through their daily avalanche advisory, as well as numerous avalanche awareness talks throughout the state. Most of the multi day avalanche classes are taught by the private sector.
Rescue plans. Rescue is a last resort, and can be a sad experience because more than 50 percent of the buried victims die within 30 minutes or less. All ski areas have rescue personnel and equipment to implement rescue operations. Avalanche rescue efforts in the backcountry are under the jurisdiction of the local County Sheriffs Office. In addition, Utah is very lucky to have the volunteer organization of Wasatch Backcountry Rescue. Wasatch Backcountry Rescue is a non-profit, backcountry rescue organization, working under the direction of the Salt Lake County Sheriffs Office, Search and Rescue. Their primary purpose is quick response for avalanche rescue and winter related incidents using trained search and rescue dogs and personnel familiar with the local mountain terrain. Their secondary purpose is to educate the local backcountry skiers in safe techniques for winter travel in the mountains plus the equipment and methods used
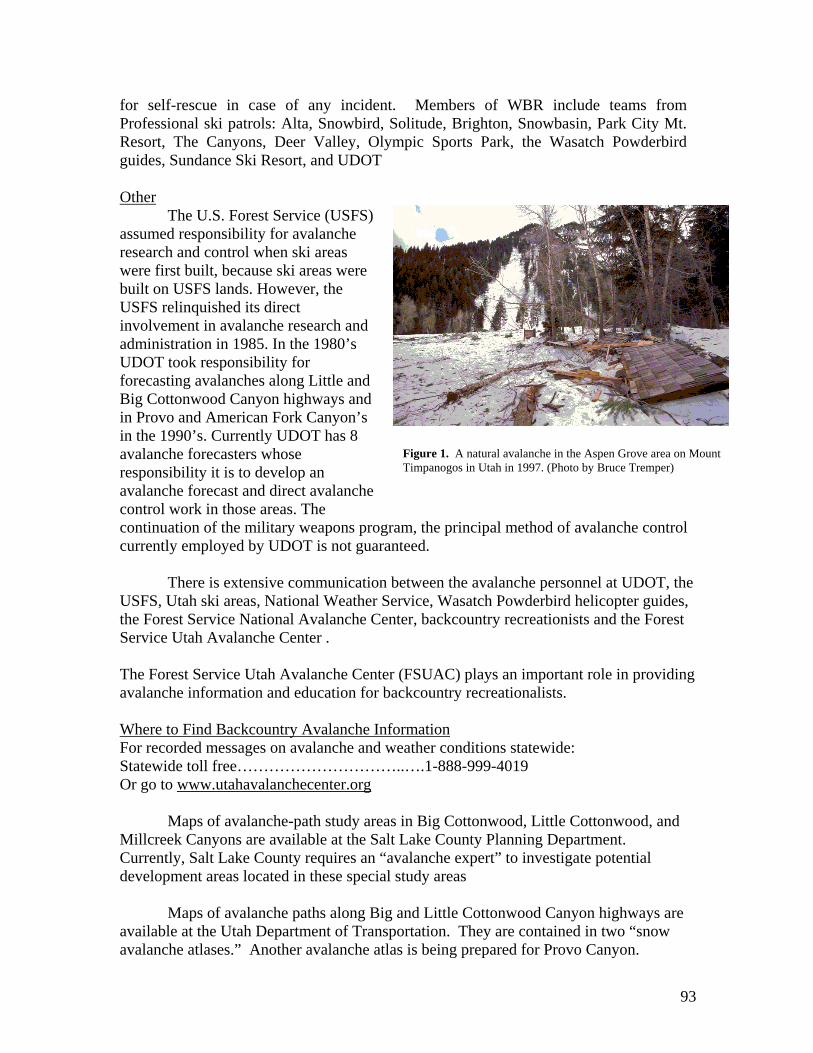
93
for self-rescue in case of any incident. Members of WBR include teams from Professional ski patrols: Alta, Snowbird, Solitude, Brighton, Snowbasin, Park City Mt. Resort, The Canyons, Deer Valley, Olympic Sports Park, the Wasatch Powderbird guides, Sundance Ski Resort, and UDOT
Other The U.S. Forest Service (USFS)
assumed responsibility for avalanche research and control when ski areas were first built, because ski areas were built on USFS lands. However, the USFS relinquished its direct involvement in avalanche research and administration in 1985. In the 1980’s UDOT took responsibility for forecasting avalanches along Little and Big Cottonwood Canyon highways and in Provo and American Fork Canyon’s in the 1990’s. Currently UDOT has 8 avalanche forecasters whose responsibility it is to develop an avalanche forecast and direct avalanche control work in those areas. The continuation of the military weapons program, the principal method of avalanche control currently employed by UDOT is not guaranteed. There is extensive communication between the avalanche personnel at UDOT, the USFS, Utah ski areas, National Weather Service, Wasatch Powderbird helicopter guides, the Forest Service National Avalanche Center, backcountry recreationists and the Forest Service Utah Avalanche Center . The Forest Service Utah Avalanche Center (FSUAC) plays an important role in providing avalanche information and education for backcountry recreationalists. Where to Find Backcountry Avalanche Information For recorded messages on avalanche and weather conditions statewide: Statewide toll free…………………………..….1-888-999-4019 Or go to www.utahavalanchecenter.org Maps of avalanche-path study areas in Big Cottonwood, Little Cottonwood, and Millcreek Canyons are available at the Salt Lake County Planning Department. Currently, Salt Lake County requires an “avalanche expert” to investigate potential development areas located in these special study areas Maps of avalanche paths along Big and Little Cottonwood Canyon highways are available at the Utah Department of Transportation. They are contained in two “snow avalanche atlases.” Another avalanche atlas is being prepared for Provo Canyon.
Figure 1. A natural avalanche in the Aspen Grove area on Mount Timpanogos in Utah in 1997. (Photo by Bruce Tremper)
94
REFERENCES Decker, Rand, no date, Avalanche defense using hazard forecasting and explosive control: Department of Civil Engineering, University of Utah, 9 p. Kalatowski, Marc, 1988, The avalanche history of Alta (including “the Binx Sandahl Years” by Doug Abromeit): The Avalanche Review v. 7 no. 3. p. 1-11. Perla, R.I., and Martineli, M., Jr., 1978, Avalanche handbook: U.S. Department of Agriculture, Forest Service, 254 p. Salt Lake County Public Works, Planning Division, 1990, Natural hazards ordinance, chapter 19.75 of the zoning ordinance, Salt Lake City, Utah: Salt Lake County Public Works, Planning Division, Salt Lake City, Utah 11p. Voight, Barry, ed., 1990, Snow avalanche hazards and mitigation in the United States: National Academy Press, Washington, D.C., 84 p.
95
DROUGHT
Brian King Utah Division of Water Resources
OVERVIEW
Drought is unique among natural hazards. Unlike a flood, earthquake or wildland fire, drought is not an easily recognized event. While most natural hazards are sudden and result in immediate impacts, droughts “sneak up on us quietly disguised as lovely sunny weather” (McKee, Doesken, and Kleist 2005) and can last a long time resulting in significant socioeconomic impacts. Thus, it is difficult to identify when a drought has begun and when it has ended. However, there are several drought indices that are used to monitor drought conditions and provide useful information from which management decisions can be based.
Drought is a natural occurrence that is manifested everywhere to some degree and is
common in the arid West. Utah is a dry landscape; it is the second driest state, receiving on average approximately 13 inches of precipitation per year. Utah’s water supply is heavily dependent upon winter snow pack accumulation and capturing the snowmelt in reservoirs. When these factors deviate from historic norms for a prolonged time, impacts in both the social and economic sectors may result.
Because of surface reservoir storage, there may be a lag time between when a drought
begins and when its impacts are realized. Generally, if the reservoirs are full before drought conditions are realized, the water supply is sufficient for a season with limited or no water use restrictions. However, as drought conditions persist, the impacts associated with it become much more apparent.
During the past 100-plus years, Utah has experienced six multi-year droughts,
intermingled with several single dry years. Looking beyond the past 100-years, the average drought has been more severe, more frequent and of longer duration Each drought varied spatially as well as by impacts. (Utah Division of Water Resources, 2007). The severity of the impacts in many cases depended not only upon the climatic conditions but a community’s “state of readiness” or the water supply’s diversity and ability to endure the drought.
Several factors influence the severity of drought and its impacts, such as winter
precipitation, soil moisture and temperature. Less obvious, but just as significant, is vulnerability. How vulnerable is a water supply to drought? There are three main components of vulnerability that go “hand-in-hand” with one another; water storage, water demand and population growth. As the population grows, so does the overall demand for water; and so too must the developed water supply grow or be used in a
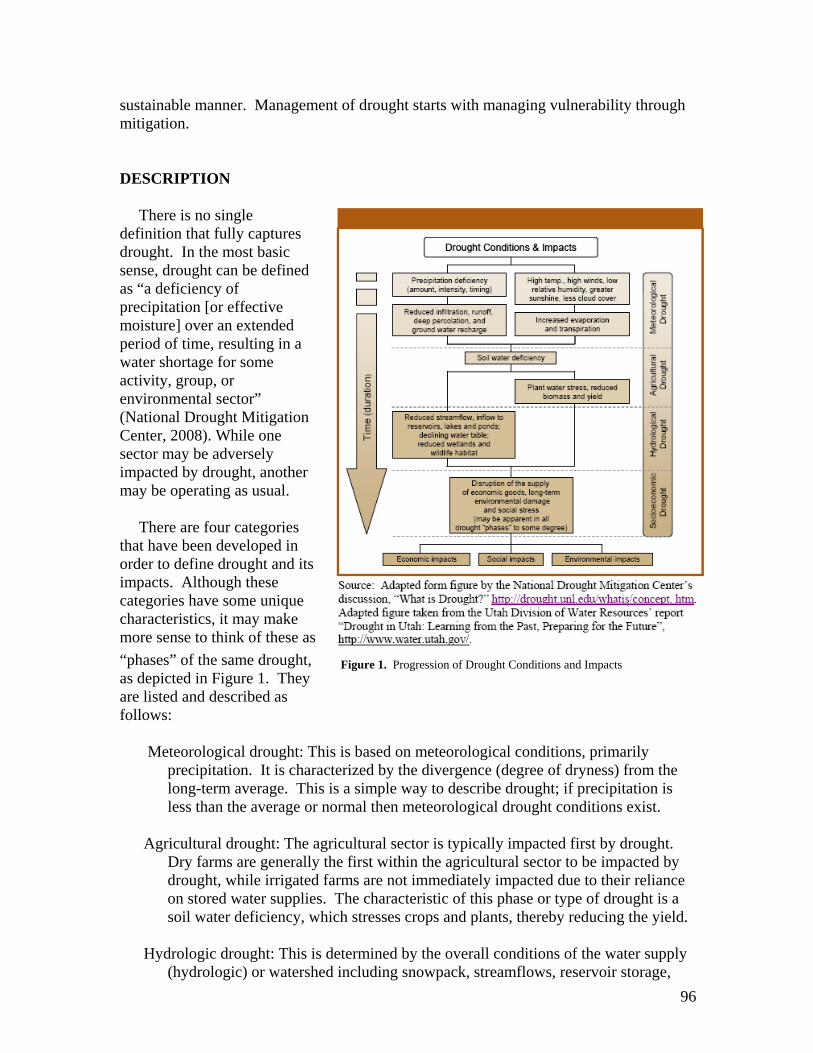
96
sustainable manner. Management of drought starts with managing vulnerability through mitigation.
DESCRIPTION
There is no single definition that fully captures drought. In the most basic sense, drought can be defined as “a deficiency of precipitation [or effective moisture] over an extended period of time, resulting in a water shortage for some activity, group, or environmental sector” (National Drought Mitigation Center, 2008). While one sector may be adversely impacted by drought, another may be operating as usual.
There are four categories
that have been developed in order to define drought and its impacts. Although these categories have some unique characteristics, it may make more sense to think of these as “phases” of the same drought, as depicted in Figure 1. They are listed and described as follows:
Meteorological drought: This is based on meteorological conditions, primarily precipitation. It is characterized by the divergence (degree of dryness) from the long-term average. This is a simple way to describe drought; if precipitation is less than the average or normal then meteorological drought conditions exist.
Agricultural drought: The agricultural sector is typically impacted first by drought.
Dry farms are generally the first within the agricultural sector to be impacted by drought, while irrigated farms are not immediately impacted due to their reliance on stored water supplies. The characteristic of this phase or type of drought is a soil water deficiency, which stresses crops and plants, thereby reducing the yield.
Hydrologic drought: This is determined by the overall conditions of the water supply
(hydrologic) or watershed including snowpack, streamflows, reservoir storage,
Figure 1. Progression of Drought Conditions and Impacts
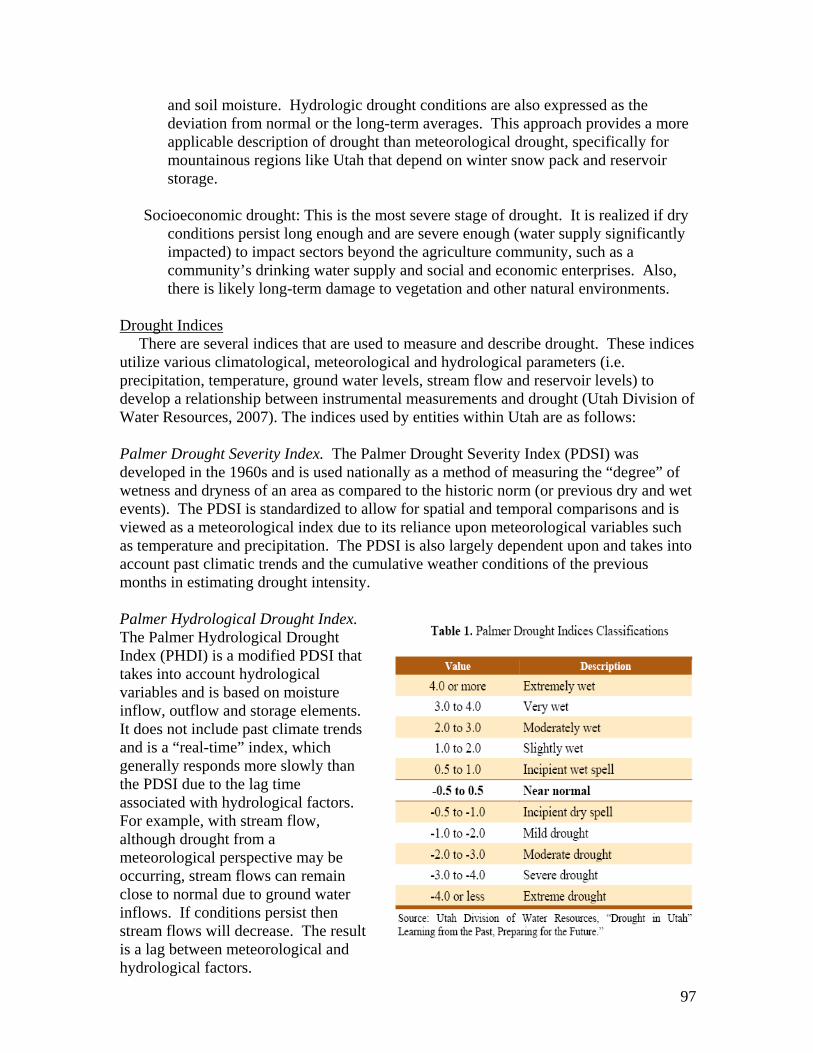
97
and soil moisture. Hydrologic drought conditions are also expressed as the deviation from normal or the long-term averages. This approach provides a more applicable description of drought than meteorological drought, specifically for mountainous regions like Utah that depend on winter snow pack and reservoir storage.
Socioeconomic drought: This is the most severe stage of drought. It is realized if dry
conditions persist long enough and are severe enough (water supply significantly impacted) to impact sectors beyond the agriculture community, such as a community’s drinking water supply and social and economic enterprises. Also, there is likely long-term damage to vegetation and other natural environments.
Drought Indices
There are several indices that are used to measure and describe drought. These indices utilize various climatological, meteorological and hydrological parameters (i.e. precipitation, temperature, ground water levels, stream flow and reservoir levels) to develop a relationship between instrumental measurements and drought (Utah Division of Water Resources, 2007). The indices used by entities within Utah are as follows: Palmer Drought Severity Index. The Palmer Drought Severity Index (PDSI) was developed in the 1960s and is used nationally as a method of measuring the “degree” of wetness and dryness of an area as compared to the historic norm (or previous dry and wet events). The PDSI is standardized to allow for spatial and temporal comparisons and is viewed as a meteorological index due to its reliance upon meteorological variables such as temperature and precipitation. The PDSI is also largely dependent upon and takes into account past climatic trends and the cumulative weather conditions of the previous months in estimating drought intensity. Palmer Hydrological Drought Index. The Palmer Hydrological Drought Index (PHDI) is a modified PDSI that takes into account hydrological variables and is based on moisture inflow, outflow and storage elements. It does not include past climate trends and is a “real-time” index, which generally responds more slowly than the PDSI due to the lag time associated with hydrological factors. For example, with stream flow, although drought from a meteorological perspective may be occurring, stream flows can remain close to normal due to ground water inflows. If conditions persist then stream flows will decrease. The result is a lag between meteorological and hydrological factors.
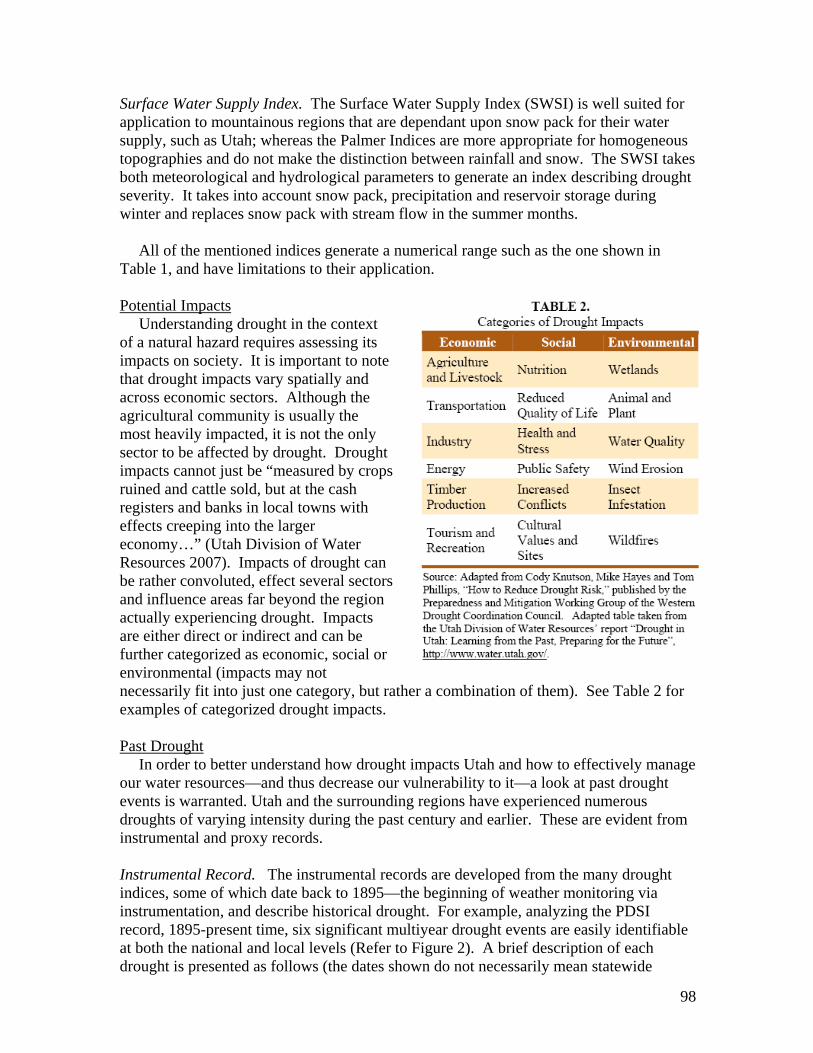
98
Surface Water Supply Index. The Surface Water Supply Index (SWSI) is well suited for application to mountainous regions that are dependant upon snow pack for their water supply, such as Utah; whereas the Palmer Indices are more appropriate for homogeneous topographies and do not make the distinction between rainfall and snow. The SWSI takes both meteorological and hydrological parameters to generate an index describing drought severity. It takes into account snow pack, precipitation and reservoir storage during winter and replaces snow pack with stream flow in the summer months.
All of the mentioned indices generate a numerical range such as the one shown in
Table 1, and have limitations to their application.
Potential Impacts Understanding drought in the context
of a natural hazard requires assessing its impacts on society. It is important to note that drought impacts vary spatially and across economic sectors. Although the agricultural community is usually the most heavily impacted, it is not the only sector to be affected by drought. Drought impacts cannot just be “measured by crops ruined and cattle sold, but at the cash registers and banks in local towns with effects creeping into the larger economy…” (Utah Division of Water Resources 2007). Impacts of drought can be rather convoluted, effect several sectors and influence areas far beyond the region actually experiencing drought. Impacts are either direct or indirect and can be further categorized as economic, social or environmental (impacts may not necessarily fit into just one category, but rather a combination of them). See Table 2 for examples of categorized drought impacts. Past Drought
In order to better understand how drought impacts Utah and how to effectively manage our water resources—and thus decrease our vulnerability to it—a look at past drought events is warranted. Utah and the surrounding regions have experienced numerous droughts of varying intensity during the past century and earlier. These are evident from instrumental and proxy records. Instrumental Record. The instrumental records are developed from the many drought indices, some of which date back to 1895—the beginning of weather monitoring via instrumentation, and describe historical drought. For example, analyzing the PDSI record, 1895-present time, six significant multiyear drought events are easily identifiable at both the national and local levels (Refer to Figure 2). A brief description of each drought is presented as follows (the dates shown do not necessarily mean statewide
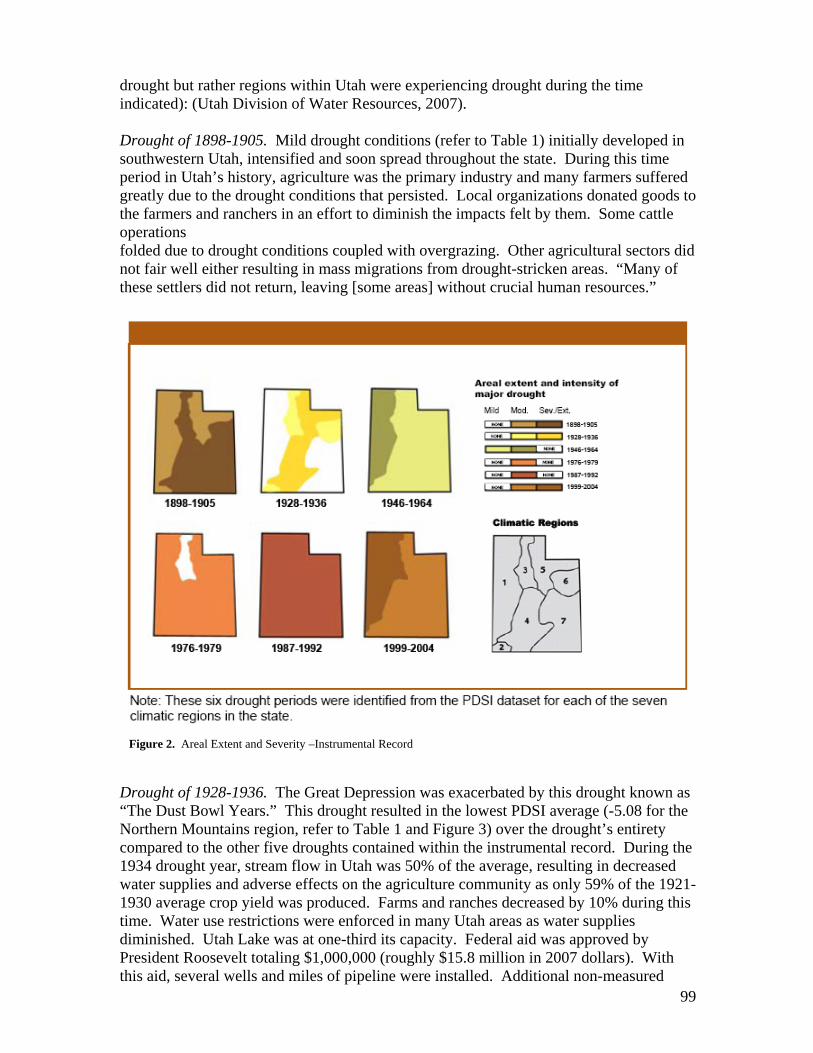
99
Figure 2. Areal Extent and Severity –Instrumental Record Six Drought Periods
drought but rather regions within Utah were experiencing drought during the time indicated): (Utah Division of Water Resources, 2007). Drought of 1898-1905. Mild drought conditions (refer to Table 1) initially developed in southwestern Utah, intensified and soon spread throughout the state. During this time period in Utah’s history, agriculture was the primary industry and many farmers suffered greatly due to the drought conditions that persisted. Local organizations donated goods to the farmers and ranchers in an effort to diminish the impacts felt by them. Some cattle operations folded due to drought conditions coupled with overgrazing. Other agricultural sectors did not fair well either resulting in mass migrations from drought-stricken areas. “Many of these settlers did not return, leaving [some areas] without crucial human resources.”
Drought of 1928-1936. The Great Depression was exacerbated by this drought known as “The Dust Bowl Years.” This drought resulted in the lowest PDSI average (-5.08 for the Northern Mountains region, refer to Table 1 and Figure 3) over the drought’s entirety compared to the other five droughts contained within the instrumental record. During the 1934 drought year, stream flow in Utah was 50% of the average, resulting in decreased water supplies and adverse effects on the agriculture community as only 59% of the 1921-1930 average crop yield was produced. Farms and ranches decreased by 10% during this time. Water use restrictions were enforced in many Utah areas as water supplies diminished. Utah Lake was at one-third its capacity. Federal aid was approved by President Roosevelt totaling $1,000,000 (roughly $15.8 million in 2007 dollars). With this aid, several wells and miles of pipeline were installed. Additional non-measured
100
quantitative and qualitative individual impacts (economic loss and social stress) were certainly present during the Dust Bowl Years. Drought 1946-1964. This drought rivals the Dust Bowl Years and certainly surpasses it in length. Significant portions of the state were declared disaster areas with severe impacts. However, the state as a whole faired better than during previous droughts due to lessons learned and mitigation measures taken. Nevertheless, even with the construction of reservoirs and improvements in agricultural practices, there was a considerable reduction in crop yield statewide. The impacts would have been far more severe without the mitigatory steps taken to develop and diversify the water supply previous to the onset of this drought. Drought of 1976-1979. This was one of the driest periods on record for the state. Moderate drought conditions were statewide and water use rate increases were enacted by over a third of the municipal water suppliers surveyed. Several of Utah’s counties had 40-100% of crop loss and Federal Disaster Declarations for these counties soon followed. Millions of dollars were lost due to crop losses and decreased tourism. Roughly $46.9 million (in 2007 dollars) of potential revenue was lost due to crop failures alone. Poor snow pack and low reservoir levels decreased tourism and by the end of the drought it was estimated that the state and its citizens lost approximately $147.8 million (in 2007 dollars) due to drought-related impacts. Drought of 1987-1992. During the late 1980s and early 1990s drought conditions persisted and moderate to severe conditions were manifested statewide. Statewide stream flows were below average and reservoir levels slowly declined. Springs and wells in northern Utah stopped producing, negatively impacting the agricultural community as well as wildlife. In some areas of the state, up to 80% of the deer population was lost due to the lack of suitable forage. Water use restrictions and ordinances were enacted, causing social stresses, and in order to alleviate impacts to the agriculture community, temporary water sales/transfer were made from Soldier Creek to the Central Utah Project to supplement the irrigation supply. Drought of 1999-2004. This drought is comparable to other past droughts, such as the 1890s and 1980s droughts, with 2002 being one of the driest years on record. However, due to the population increase and subsequent rise in demand for water, the impacts were more severe in some areas than previous droughts but the state as a whole was able to endure the drought due to the several water development projects that were in operation; impacts could have been much worse. Flows in some waterways were at historic lows. The Colorado River incurred a deficit equal to two years of average stream flow. With above average temperature and below average precipitation, stream flows continually decreased and many of the states reservoirs did not fill each year. The storage within Utah’s critical reservoirs dropped below 50%. A statewide agricultural disaster was declared as well as disaster declarations in response to insect infestations. State officials estimated that in 2002 alone, the drought resulted in a $235 million (2007 dollars) loss of revenue for Utah agriculture and tourism. The drought also led to the loss of 6,100 jobs and $141 million (2007 dollars) in lost income. Proxy Record. The previously described droughts are relatively well documented; however there are significant information gaps with regard to their socioeconomic
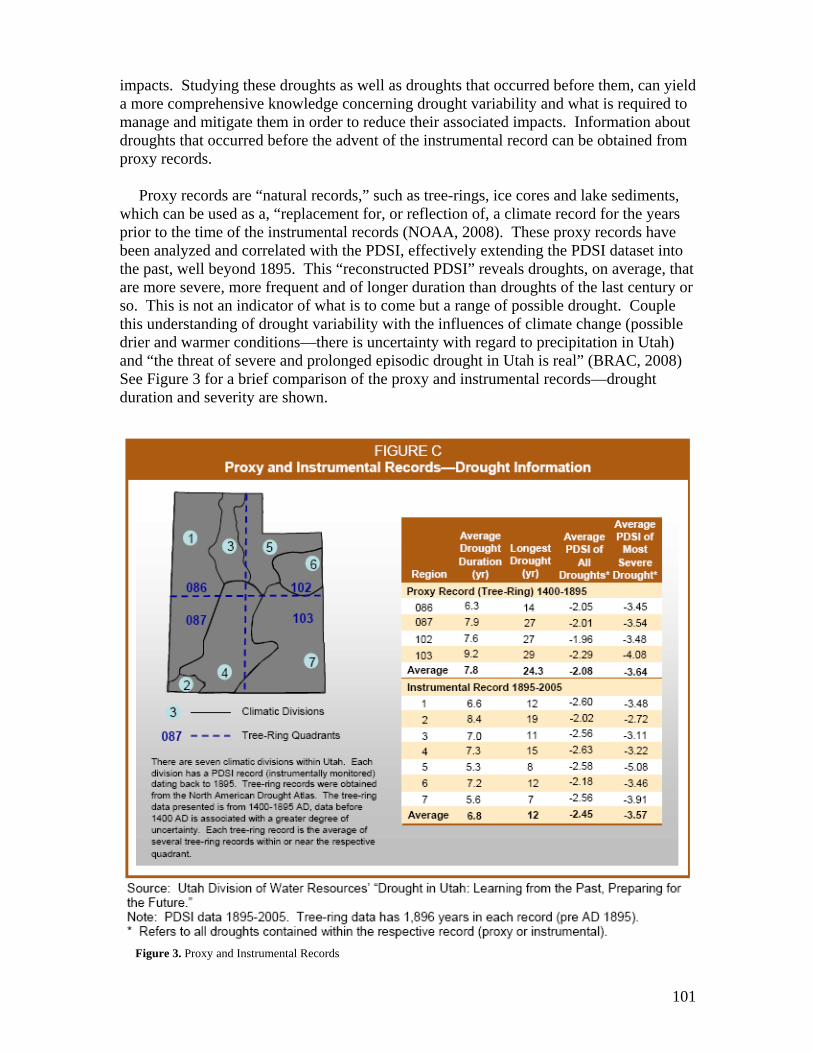
101
impacts. Studying these droughts as well as droughts that occurred before them, can yield a more comprehensive knowledge concerning drought variability and what is required to manage and mitigate them in order to reduce their associated impacts. Information about droughts that occurred before the advent of the instrumental record can be obtained from proxy records.
Proxy records are “natural records,” such as tree-rings, ice cores and lake sediments,
which can be used as a, “replacement for, or reflection of, a climate record for the years prior to the time of the instrumental records (NOAA, 2008). These proxy records have been analyzed and correlated with the PDSI, effectively extending the PDSI dataset into the past, well beyond 1895. This “reconstructed PDSI” reveals droughts, on average, that are more severe, more frequent and of longer duration than droughts of the last century or so. This is not an indicator of what is to come but a range of possible drought. Couple this understanding of drought variability with the influences of climate change (possible drier and warmer conditions—there is uncertainty with regard to precipitation in Utah) and “the threat of severe and prolonged episodic drought in Utah is real” (BRAC, 2008) See Figure 3 for a brief comparison of the proxy and instrumental records—drought duration and severity are shown.
Figure 3. Proxy and Instrumental Records
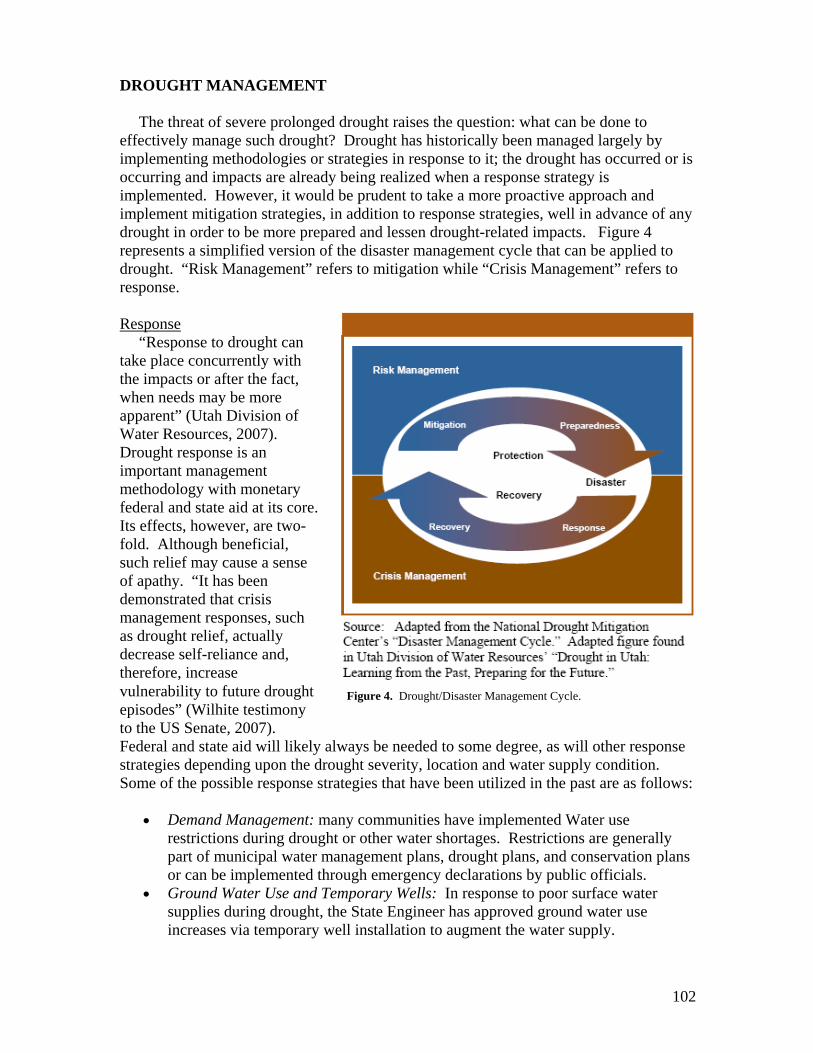
102
DROUGHT MANAGEMENT
The threat of severe prolonged drought raises the question: what can be done to effectively manage such drought? Drought has historically been managed largely by implementing methodologies or strategies in response to it; the drought has occurred or is occurring and impacts are already being realized when a response strategy is implemented. However, it would be prudent to take a more proactive approach and implement mitigation strategies, in addition to response strategies, well in advance of any drought in order to be more prepared and lessen drought-related impacts. Figure 4 represents a simplified version of the disaster management cycle that can be applied to drought. “Risk Management” refers to mitigation while “Crisis Management” refers to response.
Response
“Response to drought can take place concurrently with the impacts or after the fact, when needs may be more apparent” (Utah Division of Water Resources, 2007). Drought response is an important management methodology with monetary federal and state aid at its core. Its effects, however, are two-fold. Although beneficial, such relief may cause a sense of apathy. “It has been demonstrated that crisis management responses, such as drought relief, actually decrease self-reliance and, therefore, increase vulnerability to future drought episodes” (Wilhite testimony to the US Senate, 2007). Federal and state aid will likely always be needed to some degree, as will other response strategies depending upon the drought severity, location and water supply condition. Some of the possible response strategies that have been utilized in the past are as follows:
• Demand Management: many communities have implemented Water use
restrictions during drought or other water shortages. Restrictions are generally part of municipal water management plans, drought plans, and conservation plans or can be implemented through emergency declarations by public officials.
• Ground Water Use and Temporary Wells: In response to poor surface water supplies during drought, the State Engineer has approved ground water use increases via temporary well installation to augment the water supply.
Figure 4. Drought/Disaster Management Cycle.
103
• Agricultural Management: There are several land, crop and water management methods that have been used by the agricultural community. Some examples are: conservation tillage, planting crops with lower water requirements, and using water efficient irrigation systems.
• Water Hauling: On occasion when circumstances have warranted it, the state and
counties have hauled water to supplement the supply for domestic use. Hauling water for agricultural purposes (for cattle) is more common.
• Legislation: The impacts of drought have prompted responses from the state
legislature in the form of laws, acts and other actions. The effect drought has on the water supply has also caused the legislature to study and revisit water management methods, such as water reuse.
MITIGATION
As indicated by the proxy data, it is possible for Utah’s future to include more severe drought and/or droughts of longer duration than those of the past century. The potential socioeconomic impacts of such droughts are staggering. Management of prolonged drought, and drought of any length, through mitigation, starts well before the drought ever materializes. In the context of drought management, mitigation is “effort, planning and work done in advance of a…drought to lessen, or in some instances eliminate potential impacts” (Utah Division of Water Resources, 2007). Mitigation often takes place concurrently with response efforts; however, the difference is that response addresses the impacts of the recent drought while mitigation is directed towards potential impacts of future drought.
There are several drought mitigation strategies that can be implemented. In order for
these strategies to result in long-term benefits, there needs to be a drought component embedded within them. For example, during times of surface water surplus, if conjunctive management is utilized, surface water can be stored in aquifers to be used during future drought. The key is that a portion of the stored water should be reserved or allocated to be used during drought to supplement the surface water supply. Otherwise the surplus water stored will likely be used as the population and demand continues to grow. Setting aside water to be used specifically during drought may not be economically feasible in some cases; however mitigation strategies will still provide relatively long-term benefits and lessen the impacts of future drought. Using multiple mitigation strategies will increase diversity of the water supply and decrease a water system or community’s vulnerability to drought. Assessing a water systems vulnerability to drought is an important step before implementing any drought mitigation strategy. Such an assessment includes identifying weaknesses or vulnerabilities of a water system or community to a severe drought and then addressing them through mitigation planning and strategy implementation. Some of the many mitigation strategies available are presented as follows: Public Education and Outreach. The implementation and success of any mitigation strategy is a function of public education and willingness. If there is public buy-in, with regard to a mitigation strategy, there is a greater probability for success in implementing
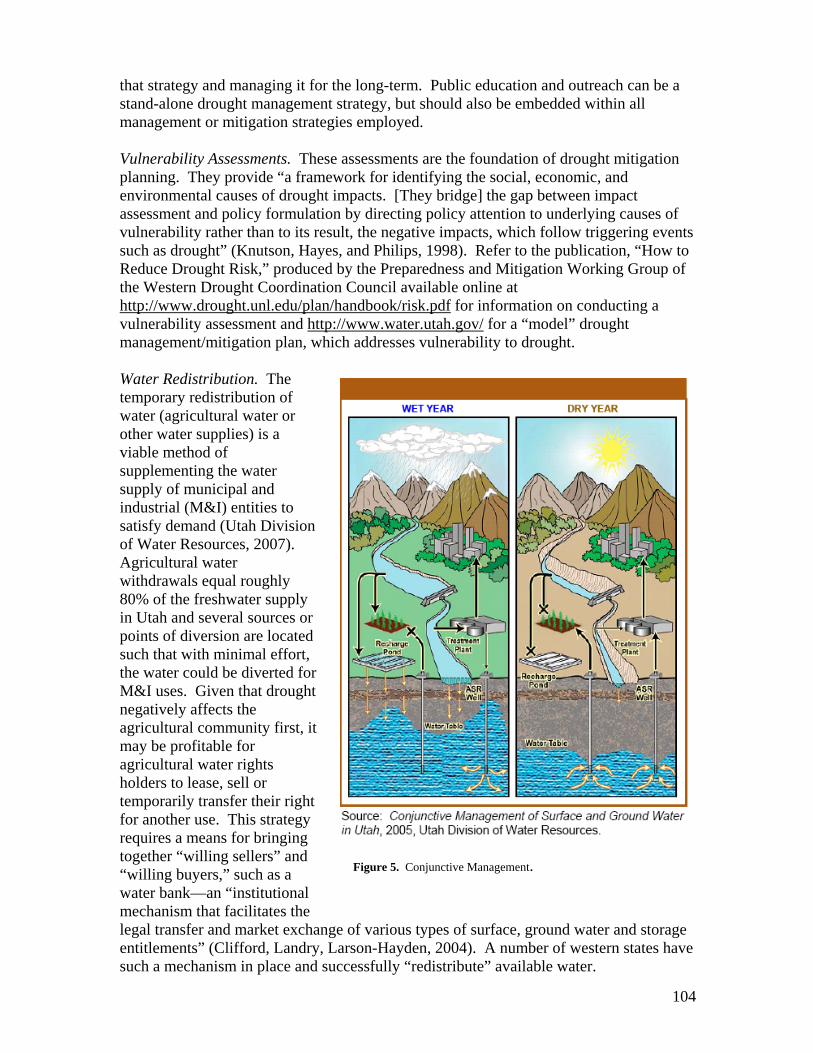
104
Figure 5. Conjunctive Management. Management
that strategy and managing it for the long-term. Public education and outreach can be a stand-alone drought management strategy, but should also be embedded within all management or mitigation strategies employed. Vulnerability Assessments. These assessments are the foundation of drought mitigation planning. They provide “a framework for identifying the social, economic, and environmental causes of drought impacts. [They bridge] the gap between impact assessment and policy formulation by directing policy attention to underlying causes of vulnerability rather than to its result, the negative impacts, which follow triggering events such as drought” (Knutson, Hayes, and Philips, 1998). Refer to the publication, “How to Reduce Drought Risk,” produced by the Preparedness and Mitigation Working Group of the Western Drought Coordination Council available online at http://www.drought.unl.edu/plan/handbook/risk.pdf for information on conducting a vulnerability assessment and http://www.water.utah.gov/ for a “model” drought management/mitigation plan, which addresses vulnerability to drought.
Water Redistribution. The temporary redistribution of water (agricultural water or other water supplies) is a viable method of supplementing the water supply of municipal and industrial (M&I) entities to satisfy demand (Utah Division of Water Resources, 2007). Agricultural water withdrawals equal roughly 80% of the freshwater supply in Utah and several sources or points of diversion are located such that with minimal effort, the water could be diverted for M&I uses. Given that drought negatively affects the agricultural community first, it may be profitable for agricultural water rights holders to lease, sell or temporarily transfer their right for another use. This strategy requires a means for bringing together “willing sellers” and “willing buyers,” such as a water bank—an “institutional mechanism that facilitates the legal transfer and market exchange of various types of surface, ground water and storage entitlements” (Clifford, Landry, Larson-Hayden, 2004). A number of western states have such a mechanism in place and successfully “redistribute” available water.
105
Conjunctive Management. This strategy is basically the storing of surplus surface water in aquifers, supplementing the ground water supply, in order to have it available when needed and using the surface and subsurface water supplies as one system or supply; see Figure 5. This is also known as aquifer storage and recovery (ASR). Such a strategy can be applied to varying time-scales and scopes, such as annually (drawing upon stored ground water during the high demand summer months) or during long-term drought (Utah Division of Water Resources, 2007). In order for this to be a long-term drought mitigation strategy, more water should annually be put into the aquifer than what is taken out, thereby building up storage. There are some water suppliers within the state employing this strategy with beneficial results. Favorable geologic conditions are needed for this strategy to be worthwhile.
Water System Interconnections. Integration of existing water systems (treatment and conveyance) can increase the ability of communities to manage drought and meet regional water demands. If there is water available in a neighboring community that is not being fully utilized during drought, with interconnections or integration, that water can be distributed to the deficient areas. This has and is happening at various levels and could be explored even more in conjunction with other mitigation strategies. For example, within the Salt Lake Valley, Jordan Valley Water Conservancy District and Salt Lake City have implemented cooperative management adjustments, effectively transferring and distributing water to Salt Lake City through mechanisms already in place. This resulted in no shortages within the city during the most recent drought (Hooton, 2006).
Water Development and Inter-Basin Transfers. Augmenting the water supply through water development is ongoing in the state with large and small-scale projects. Many projects have come about due to vulnerabilities identified in the water supply during drought. Continued and sustainable water development will effectively supplement the water supply and help mitigate drought. When economically feasible, it would be prudent to design the storage project with additional storage capacity that can be drawn upon during drought. Similar to water system interconnections, when storage projects are developed through cooperative efforts, the feasibility of incorporating inter-basin conveyance from one watershed to another should be assessed and considered as a way to lessen water deficiencies. Water Reuse. Treated wastewater is a large and continual source of water that traditionally has been discharged in to a receiving body of water and in many cases, incorporated back into the water supply. Water reuse, is the direct or indirect use of treated effluent for a beneficial use (Utah Division of Water Resources, 2005). A community can implement this management strategy and tap into an additional water source to be applied toward non-potable uses. Water reuse regulations currently exist in Utah that specifies water quality standards and the suitable uses. Storage facilities are likely required if such water is to be used for irrigation purposes since this is a fairly constant source and irrigation demand fluctuates. Industrial use may be more feasible in some cases due to the reduced need for storage. In Utah, examples of water reuse projects can be seen by visiting golf courses located near wastewater treatment facilities.
106
Demand Management. Management of water demand not only can be implemented in response to drought but in advance of it, as a mitigation strategy. Demand management, more aggressive water use practices or restrictions, can result in negative effects on the water supply if not implemented correctly. However, if properly employed, it can result in a decrease in water use and a “surplus” that can potentially be drawn upon during drought or other water shortages. Withdrawing less water also has environmental benefits by leaving more water in streams and reservoirs. Some demand management practices are as follows:
Alternative Landscaping: Outdoor water use in Utah is about 60% of the per capita use. The potential to lessen this demand is immense. Through developing or updating and implementing landscape ordinances that are suited for the arid climate of Utah, outdoor water use could be decreased and result in less strain on the water system during drought. Such ordinances could promote the use of water efficient methodologies, vegetation and a reduction in irrigable turf acreage based on lot size (Utah Division of Water Resources, 2001). Incentive Pricing: Through effective pricing structures and year-round strategies, water use rates can be influenced and lowered (Utah Division of Water Resources, 2003). There are several pricing structures, such as increasing block rates, seasonal block rates and target block rates. A pricing strategy should be designed to promote wise efficient water use while providing sufficient revenue to finance system operations. Water Metering and Leak Detection Programs. The American Water Works Association reports that “40 billion gallons of water are processed by U.S. water utilities each day, 6 billion gallons [15%] are lost due to problems such as main leaks, tank overflows, pipe bursts, improperly open drains, system blow-off, inaccurate or no metering or unauthorized use” (Stanford, 2002). Minimizing such water loss within Utah’s water systems would be beneficial. Through effective metering and maintenance water can be used more efficiently. Weather Modification—Cloud Seeding. Utah along with neighboring states, conduct weather modification or cloud seeding in order to enhance existing water supplies. Cloud seeding is effective on a regional scale and when conducted in consecutive years. It is a cost-effective strategy, estimated to cost $1.69 per acre-foot water it produces (Merrill, Adams, and Cole, 2005).
Watershed Management. Watershed management is finding a balance between human requirements and activities and ecological integrity. More specifically, it is “the process of evaluating, planning, managing, restoring, and organizing land and other resource use within an area of land that has a single drainage point” (California Department of Water Resources, 2005). Not only does watershed management potentially yield environmental benefits, form a water resources point of view, it can improve capture and storage of runoff, water quality and decrease flooding.
There are several mitigation strategies that can be applied to drought and water management; only a select few have been presented and discussed within this plan. The strategies can stand-alone or be combined with other strategies to create a diversified

107
plan. These strategies should be evaluated and modified to better suit the situation and entity employing them. Where to Find Additional Information
For more information on drought, Utah’s drought history and the discussed drought mitigation strategies, refer to the Utah Division of Water Resources’ report entitled “Drought in Utah: Learning from the Past, Preparing for the Future” available online at http://www.water.utah.gov/. Reports on conjunctive management and water reuse can also be found on the referenced web page.
REFERENCES Blue Ribbon Advisory Council on Climate Change, "Blue Ribbon Advisory Council on Climate Change Report to Governor Jon M. Huntsman, Jr." Retrieved from the Utah Department of Environmental Quality's Internet web page: http://www.deq.utah.gov/BRAC_Climate/final_report.htm, February 2008. Citation is from the Executive Summary. California Department of Water Resources, California Water Plan Update 2005 A Framework for Action, Volume 2, (Sacramento: 2005), 25-1. Clifford, Peggy and Clay Landry and Andrea Larsen-Hayden, Analysis of Water Banks in the Western States, Publication No. 04-11-011 (Washington Department of Ecology, July 2004), ii. Hooton, Leroy, "Conjunctive Water Management." Retrieved from the Salt Lake City's Internet web page: http://www.ci.slc.ut.us/Utilities/NewsEvents/news080100.htm, November 2006. Investing in the Future, (Salt Lake City: Utah Department of Natural Resources, Division of Water Resources, 2003), 15. Knutson, Cody, Mike Hayes and Tom Philips, "How to Reduce Drought Risk," (Preparedness and Mitigation Working Group of the Western Drought Coordination Council, 1998). Merrill, Ann, Todd Adams and Dave Cole, Utah Cloud Seeding Program Increased Runoff/Cost Analyses, (Salt Lake City: Utah Department of Natural Resources, Division of Water Resources, 2005). National Drought Mitigation Center, "What is Drought?." Retrieved from the National Drought Mitigation Center's Internet web page: http;//drought.unl.edu/whatis/what.htm, February 2008. Nebraska's Senator Nelson, "The Drought, A Nebraskan's View." Retrieved from the United States Senate's Internet web page: http://www.senate.gov/~bennelson/news/details.cfm?id=239387&&, February 2008.
108
NOAA Paleoclimatology Staff, "North American Drought: A Paleo Perspective." Retrieved from the NOAA's Internet web page: http://www.ncdc.noaa.gov/paleo/drought/drght_story.html, February 2008. Senate Subcommittee on Disaster Prevention and Prediction Drought Hearing (April 27, 2006). Retrieved from the United States Senate's Internet web page: http://commerce.senate.gov/pdf/wilhite-042706.pdf, February 2008. This document is Dr. Donald A. Wilhite's testimony, of the Nation Drought Mitigation Center, to the subcommittee. Quote is found on page 2. Stanford, Melissa J. Water Supply Assurance and Drought Mitigation: Options for State Regulatory Commissions and Key Stakeholders, (Columbus: National Regulatory Research Institute at The Ohio State University; NRRI 02-13, 2002), 41. Thomas B. McKee, Nolan J. Doesken and John Kleist, "A History of Drought in Colorado: Lessons Learned and What Lies Ahead," (Fort Collins: Colorado Climate Center, 2000), 5. Utah Division of Water Resources, Drought in Utah: Learning from the Past, Preparing for the Future, (Salt Lake City: Utah Department of Natural Resources, Division of Water Resources, 2007), 14. This report is also available online at: http://www.water.utah.gov. Utah Division of Water Resources, Conjunctive Management of Surface and Ground Water in Utah, (Salt Lake City: Utah Department of Natural Resources, Division of Water Resources, 2005), 9. Utah Division of Water Resources, Water Reuse in Utah, (Salt Lake City: Utah Department of Natural Resources, Division of Water Resources, 2005), xv, 2-3. Utah Division of Water Resources, Utah State Water Plan: Utah's Water Resources, Planning for the Future, (Salt Lake City: Utah Department of Natural Resources, Division of Water Resources, 2001), 31.
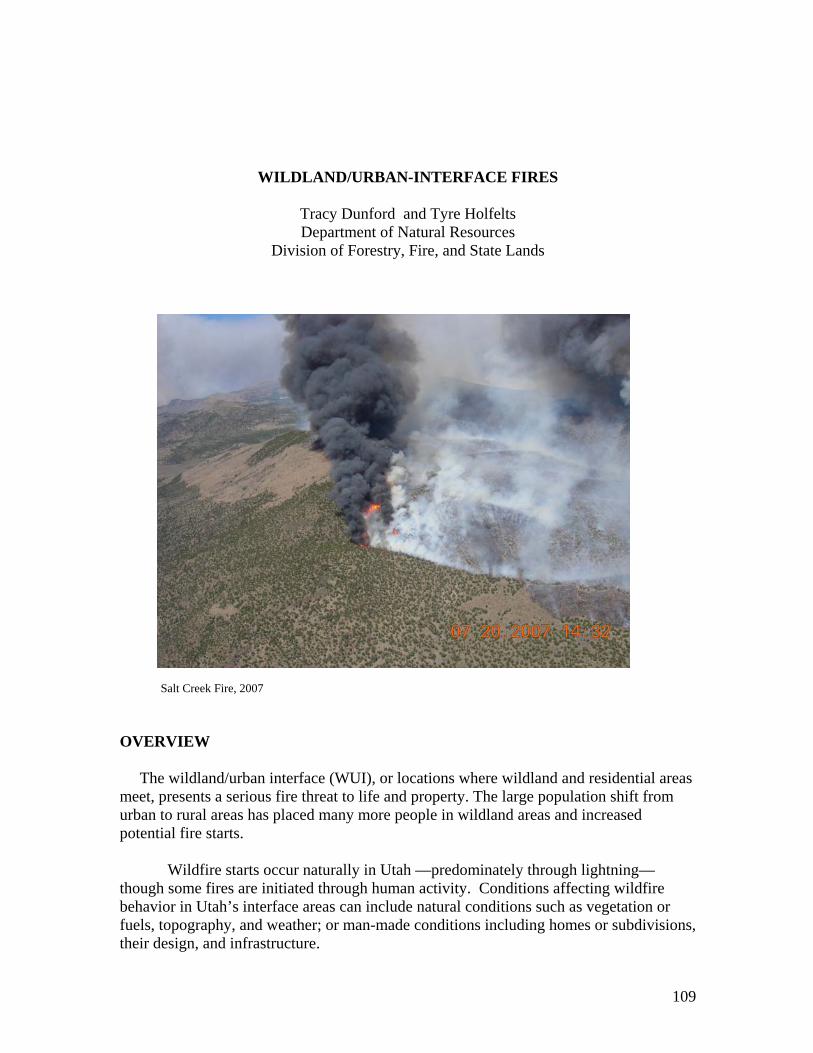
109
WILDLAND/URBAN-INTERFACE FIRES
Tracy Dunford and Tyre Holfelts Department of Natural Resources
Division of Forestry, Fire, and State Lands
Salt Creek Fire, 2007 OVERVIEW The wildland/urban interface (WUI), or locations where wildland and residential areas meet, presents a serious fire threat to life and property. The large population shift from urban to rural areas has placed many more people in wildland areas and increased potential fire starts.
Wildfire starts occur naturally in Utah —predominately through lightning— though some fires are initiated through human activity. Conditions affecting wildfire behavior in Utah’s interface areas can include natural conditions such as vegetation or fuels, topography, and weather; or man-made conditions including homes or subdivisions, their design, and infrastructure.
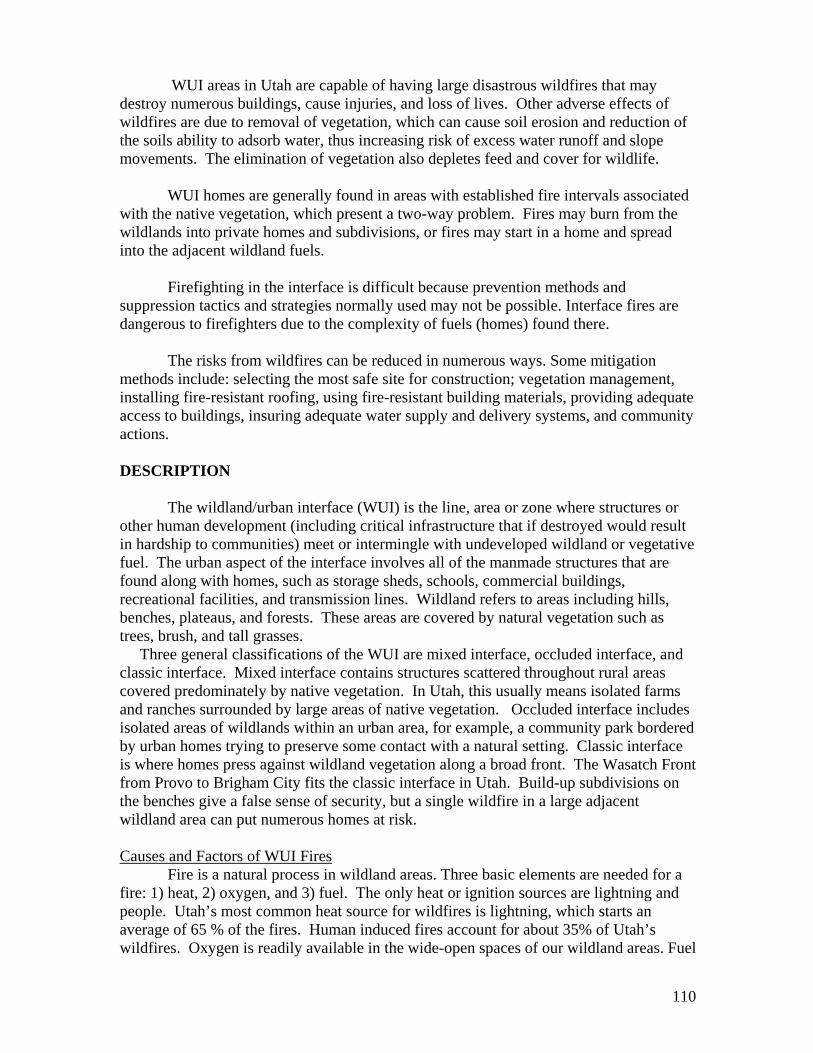
110
WUI areas in Utah are capable of having large disastrous wildfires that may destroy numerous buildings, cause injuries, and loss of lives. Other adverse effects of wildfires are due to removal of vegetation, which can cause soil erosion and reduction of the soils ability to adsorb water, thus increasing risk of excess water runoff and slope movements. The elimination of vegetation also depletes feed and cover for wildlife.
WUI homes are generally found in areas with established fire intervals associated with the native vegetation, which present a two-way problem. Fires may burn from the wildlands into private homes and subdivisions, or fires may start in a home and spread into the adjacent wildland fuels.
Firefighting in the interface is difficult because prevention methods and suppression tactics and strategies normally used may not be possible. Interface fires are dangerous to firefighters due to the complexity of fuels (homes) found there.
The risks from wildfires can be reduced in numerous ways. Some mitigation methods include: selecting the most safe site for construction; vegetation management, installing fire-resistant roofing, using fire-resistant building materials, providing adequate access to buildings, insuring adequate water supply and delivery systems, and community actions. DESCRIPTION
The wildland/urban interface (WUI) is the line, area or zone where structures or other human development (including critical infrastructure that if destroyed would result in hardship to communities) meet or intermingle with undeveloped wildland or vegetative fuel. The urban aspect of the interface involves all of the manmade structures that are found along with homes, such as storage sheds, schools, commercial buildings, recreational facilities, and transmission lines. Wildland refers to areas including hills, benches, plateaus, and forests. These areas are covered by natural vegetation such as trees, brush, and tall grasses. Three general classifications of the WUI are mixed interface, occluded interface, and classic interface. Mixed interface contains structures scattered throughout rural areas covered predominately by native vegetation. In Utah, this usually means isolated farms and ranches surrounded by large areas of native vegetation. Occluded interface includes isolated areas of wildlands within an urban area, for example, a community park bordered by urban homes trying to preserve some contact with a natural setting. Classic interface is where homes press against wildland vegetation along a broad front. The Wasatch Front from Provo to Brigham City fits the classic interface in Utah. Build-up subdivisions on the benches give a false sense of security, but a single wildfire in a large adjacent wildland area can put numerous homes at risk. Causes and Factors of WUI Fires
Fire is a natural process in wildland areas. Three basic elements are needed for a fire: 1) heat, 2) oxygen, and 3) fuel. The only heat or ignition sources are lightning and people. Utah’s most common heat source for wildfires is lightning, which starts an average of 65 % of the fires. Human induced fires account for about 35% of Utah’s wildfires. Oxygen is readily available in the wide-open spaces of our wildland areas. Fuel
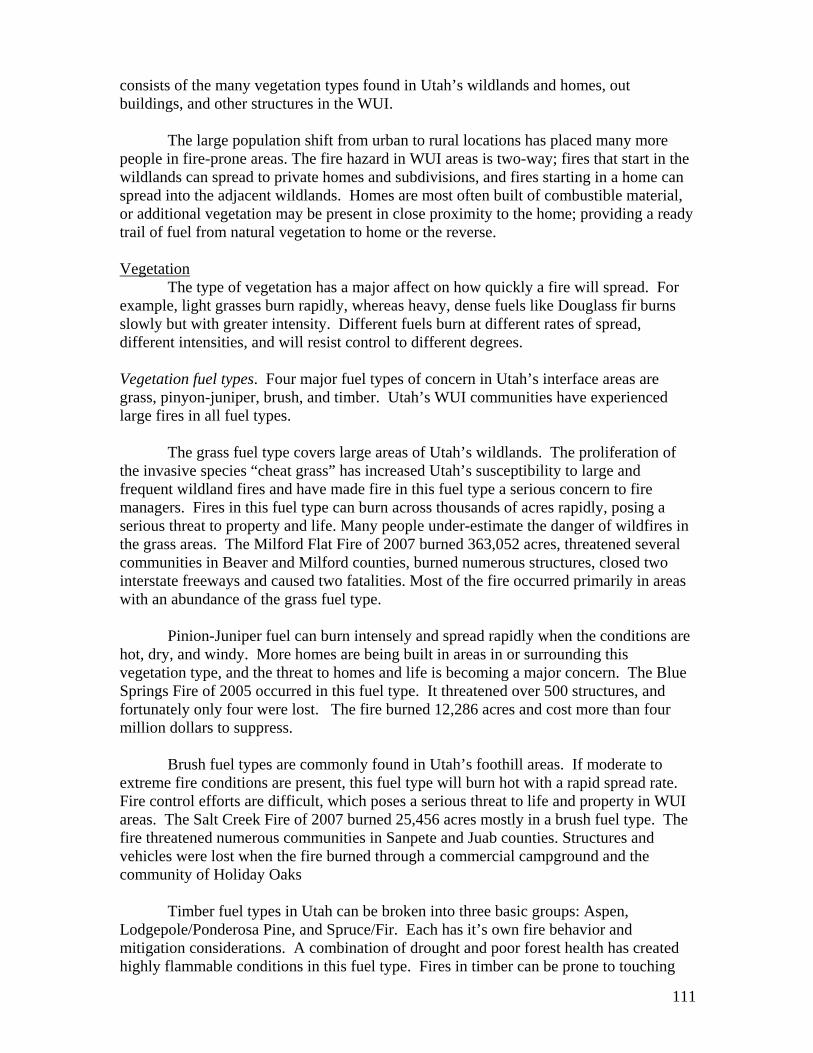
111
consists of the many vegetation types found in Utah’s wildlands and homes, out buildings, and other structures in the WUI.
The large population shift from urban to rural locations has placed many more people in fire-prone areas. The fire hazard in WUI areas is two-way; fires that start in the wildlands can spread to private homes and subdivisions, and fires starting in a home can spread into the adjacent wildlands. Homes are most often built of combustible material, or additional vegetation may be present in close proximity to the home; providing a ready trail of fuel from natural vegetation to home or the reverse. Vegetation
The type of vegetation has a major affect on how quickly a fire will spread. For example, light grasses burn rapidly, whereas heavy, dense fuels like Douglass fir burns slowly but with greater intensity. Different fuels burn at different rates of spread, different intensities, and will resist control to different degrees. Vegetation fuel types. Four major fuel types of concern in Utah’s interface areas are grass, pinyon-juniper, brush, and timber. Utah’s WUI communities have experienced large fires in all fuel types.
The grass fuel type covers large areas of Utah’s wildlands. The proliferation of the invasive species “cheat grass” has increased Utah’s susceptibility to large and frequent wildland fires and have made fire in this fuel type a serious concern to fire managers. Fires in this fuel type can burn across thousands of acres rapidly, posing a serious threat to property and life. Many people under-estimate the danger of wildfires in the grass areas. The Milford Flat Fire of 2007 burned 363,052 acres, threatened several communities in Beaver and Milford counties, burned numerous structures, closed two interstate freeways and caused two fatalities. Most of the fire occurred primarily in areas with an abundance of the grass fuel type.
Pinion-Juniper fuel can burn intensely and spread rapidly when the conditions are
hot, dry, and windy. More homes are being built in areas in or surrounding this vegetation type, and the threat to homes and life is becoming a major concern. The Blue Springs Fire of 2005 occurred in this fuel type. It threatened over 500 structures, and fortunately only four were lost. The fire burned 12,286 acres and cost more than four million dollars to suppress.
Brush fuel types are commonly found in Utah’s foothill areas. If moderate to extreme fire conditions are present, this fuel type will burn hot with a rapid spread rate. Fire control efforts are difficult, which poses a serious threat to life and property in WUI areas. The Salt Creek Fire of 2007 burned 25,456 acres mostly in a brush fuel type. The fire threatened numerous communities in Sanpete and Juab counties. Structures and vehicles were lost when the fire burned through a commercial campground and the community of Holiday Oaks
Timber fuel types in Utah can be broken into three basic groups: Aspen, Lodgepole/Ponderosa Pine, and Spruce/Fir. Each has it’s own fire behavior and mitigation considerations. A combination of drought and poor forest health has created highly flammable conditions in this fuel type. Fires in timber can be prone to touching
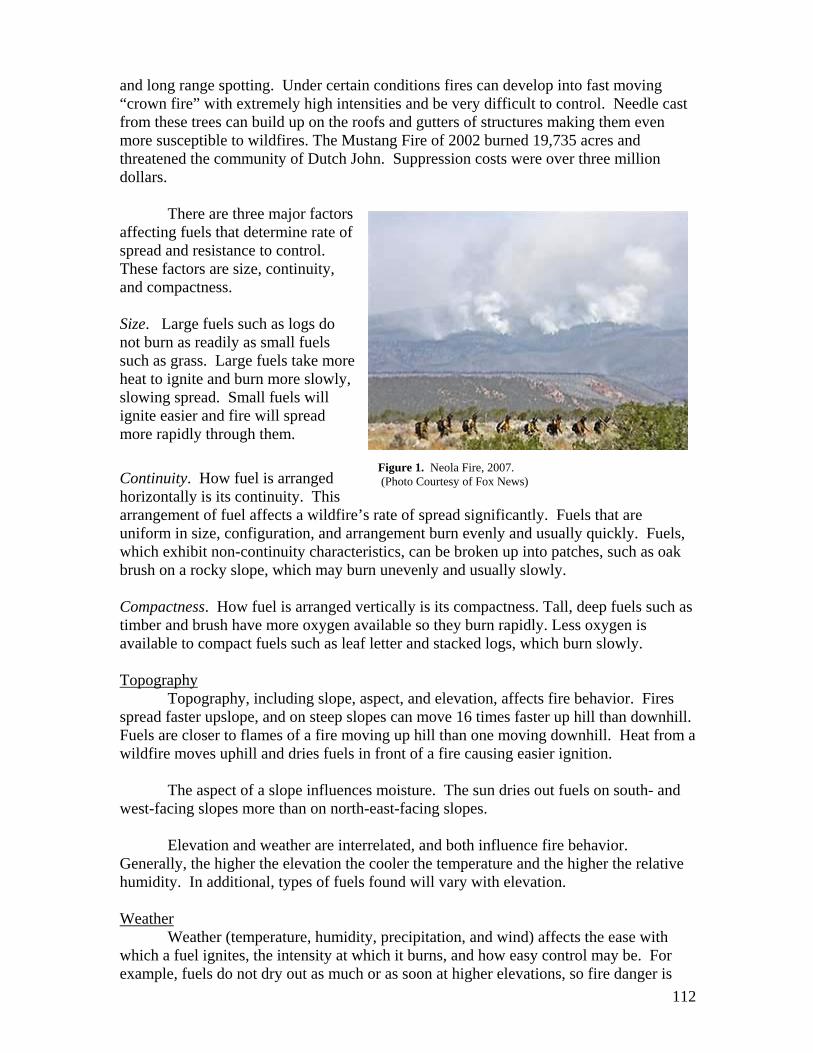
112
and long range spotting. Under certain conditions fires can develop into fast moving “crown fire” with extremely high intensities and be very difficult to control. Needle cast from these trees can build up on the roofs and gutters of structures making them even more susceptible to wildfires. The Mustang Fire of 2002 burned 19,735 acres and threatened the community of Dutch John. Suppression costs were over three million dollars.
There are three major factors affecting fuels that determine rate of spread and resistance to control. These factors are size, continuity, and compactness. Size. Large fuels such as logs do not burn as readily as small fuels such as grass. Large fuels take more heat to ignite and burn more slowly, slowing spread. Small fuels will ignite easier and fire will spread more rapidly through them. Continuity. How fuel is arranged horizontally is its continuity. This arrangement of fuel affects a wildfire’s rate of spread significantly. Fuels that are uniform in size, configuration, and arrangement burn evenly and usually quickly. Fuels, which exhibit non-continuity characteristics, can be broken up into patches, such as oak brush on a rocky slope, which may burn unevenly and usually slowly. Compactness. How fuel is arranged vertically is its compactness. Tall, deep fuels such as timber and brush have more oxygen available so they burn rapidly. Less oxygen is available to compact fuels such as leaf letter and stacked logs, which burn slowly. Topography
Topography, including slope, aspect, and elevation, affects fire behavior. Fires spread faster upslope, and on steep slopes can move 16 times faster up hill than downhill. Fuels are closer to flames of a fire moving up hill than one moving downhill. Heat from a wildfire moves uphill and dries fuels in front of a fire causing easier ignition.
The aspect of a slope influences moisture. The sun dries out fuels on south- and west-facing slopes more than on north-east-facing slopes.
Elevation and weather are interrelated, and both influence fire behavior. Generally, the higher the elevation the cooler the temperature and the higher the relative humidity. In additional, types of fuels found will vary with elevation. Weather
Weather (temperature, humidity, precipitation, and wind) affects the ease with which a fuel ignites, the intensity at which it burns, and how easy control may be. For example, fuels do not dry out as much or as soon at higher elevations, so fire danger is
Figure 1. Neola Fire, 2007. (Photo Courtesy of Fox News)
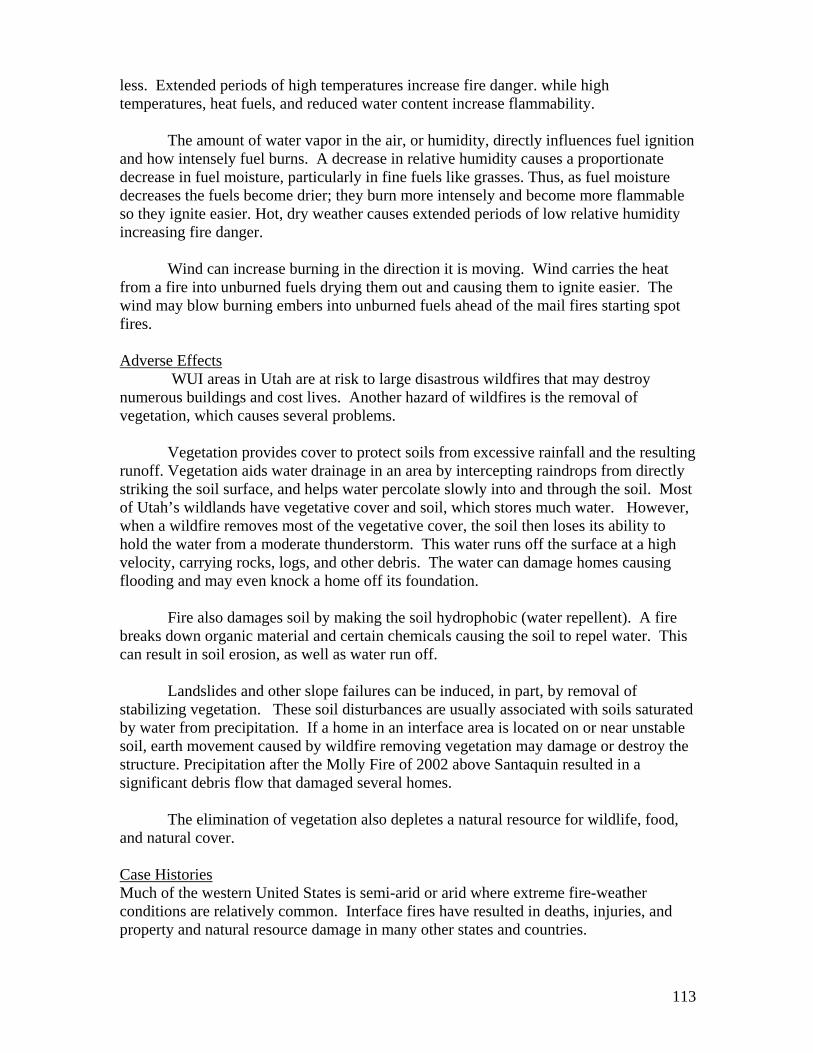
113
less. Extended periods of high temperatures increase fire danger. while high temperatures, heat fuels, and reduced water content increase flammability.
The amount of water vapor in the air, or humidity, directly influences fuel ignition and how intensely fuel burns. A decrease in relative humidity causes a proportionate decrease in fuel moisture, particularly in fine fuels like grasses. Thus, as fuel moisture decreases the fuels become drier; they burn more intensely and become more flammable so they ignite easier. Hot, dry weather causes extended periods of low relative humidity increasing fire danger.
Wind can increase burning in the direction it is moving. Wind carries the heat from a fire into unburned fuels drying them out and causing them to ignite easier. The wind may blow burning embers into unburned fuels ahead of the mail fires starting spot fires. Adverse Effects
WUI areas in Utah are at risk to large disastrous wildfires that may destroy numerous buildings and cost lives. Another hazard of wildfires is the removal of vegetation, which causes several problems.
Vegetation provides cover to protect soils from excessive rainfall and the resulting runoff. Vegetation aids water drainage in an area by intercepting raindrops from directly striking the soil surface, and helps water percolate slowly into and through the soil. Most of Utah’s wildlands have vegetative cover and soil, which stores much water. However, when a wildfire removes most of the vegetative cover, the soil then loses its ability to hold the water from a moderate thunderstorm. This water runs off the surface at a high velocity, carrying rocks, logs, and other debris. The water can damage homes causing flooding and may even knock a home off its foundation.
Fire also damages soil by making the soil hydrophobic (water repellent). A fire breaks down organic material and certain chemicals causing the soil to repel water. This can result in soil erosion, as well as water run off.
Landslides and other slope failures can be induced, in part, by removal of
stabilizing vegetation. These soil disturbances are usually associated with soils saturated by water from precipitation. If a home in an interface area is located on or near unstable soil, earth movement caused by wildfire removing vegetation may damage or destroy the structure. Precipitation after the Molly Fire of 2002 above Santaquin resulted in a significant debris flow that damaged several homes.
The elimination of vegetation also depletes a natural resource for wildlife, food, and natural cover. Case Histories Much of the western United States is semi-arid or arid where extreme fire-weather conditions are relatively common. Interface fires have resulted in deaths, injuries, and property and natural resource damage in many other states and countries.
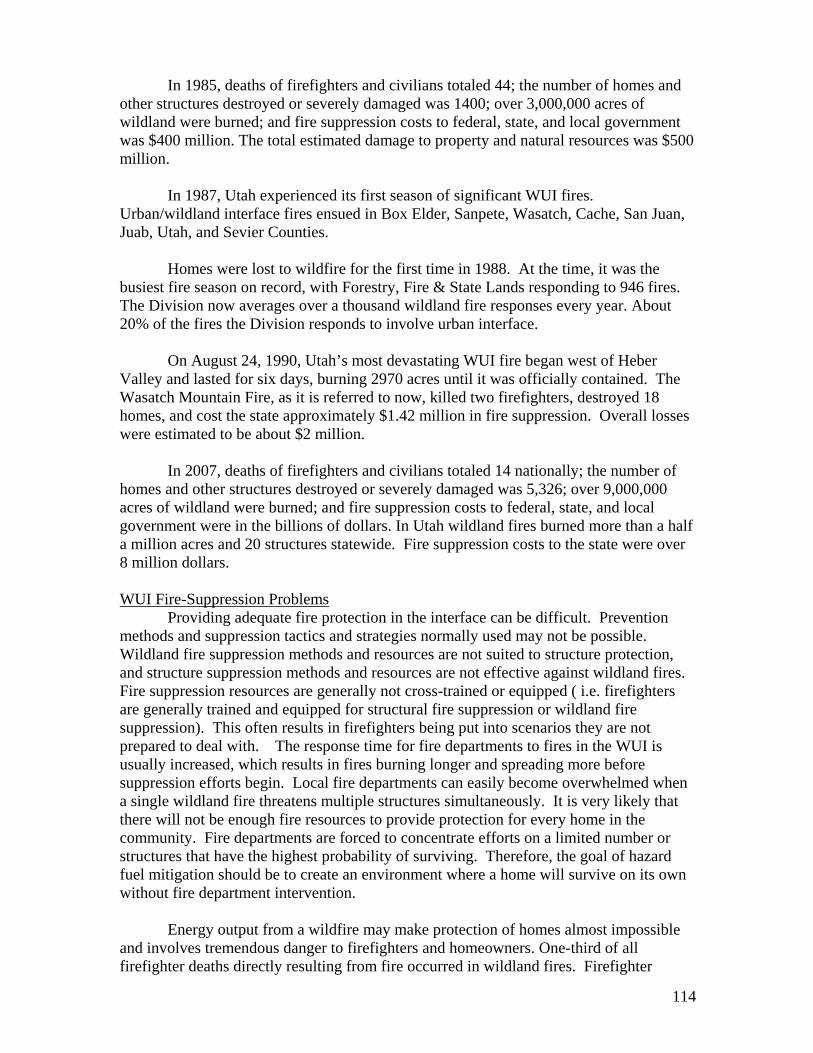
114
In 1985, deaths of firefighters and civilians totaled 44; the number of homes and other structures destroyed or severely damaged was 1400; over 3,000,000 acres of wildland were burned; and fire suppression costs to federal, state, and local government was $400 million. The total estimated damage to property and natural resources was $500 million. In 1987, Utah experienced its first season of significant WUI fires. Urban/wildland interface fires ensued in Box Elder, Sanpete, Wasatch, Cache, San Juan, Juab, Utah, and Sevier Counties. Homes were lost to wildfire for the first time in 1988. At the time, it was the busiest fire season on record, with Forestry, Fire & State Lands responding to 946 fires. The Division now averages over a thousand wildland fire responses every year. About 20% of the fires the Division responds to involve urban interface. On August 24, 1990, Utah’s most devastating WUI fire began west of Heber Valley and lasted for six days, burning 2970 acres until it was officially contained. The Wasatch Mountain Fire, as it is referred to now, killed two firefighters, destroyed 18 homes, and cost the state approximately $1.42 million in fire suppression. Overall losses were estimated to be about $2 million.
In 2007, deaths of firefighters and civilians totaled 14 nationally; the number of homes and other structures destroyed or severely damaged was 5,326; over 9,000,000 acres of wildland were burned; and fire suppression costs to federal, state, and local government were in the billions of dollars. In Utah wildland fires burned more than a half a million acres and 20 structures statewide. Fire suppression costs to the state were over 8 million dollars. WUI Fire-Suppression Problems Providing adequate fire protection in the interface can be difficult. Prevention methods and suppression tactics and strategies normally used may not be possible. Wildland fire suppression methods and resources are not suited to structure protection, and structure suppression methods and resources are not effective against wildland fires. Fire suppression resources are generally not cross-trained or equipped ( i.e. firefighters are generally trained and equipped for structural fire suppression or wildland fire suppression). This often results in firefighters being put into scenarios they are not prepared to deal with. The response time for fire departments to fires in the WUI is usually increased, which results in fires burning longer and spreading more before suppression efforts begin. Local fire departments can easily become overwhelmed when a single wildland fire threatens multiple structures simultaneously. It is very likely that there will not be enough fire resources to provide protection for every home in the community. Fire departments are forced to concentrate efforts on a limited number or structures that have the highest probability of surviving. Therefore, the goal of hazard fuel mitigation should be to create an environment where a home will survive on its own without fire department intervention. Energy output from a wildfire may make protection of homes almost impossible and involves tremendous danger to firefighters and homeowners. One-third of all firefighter deaths directly resulting from fire occurred in wildland fires. Firefighter
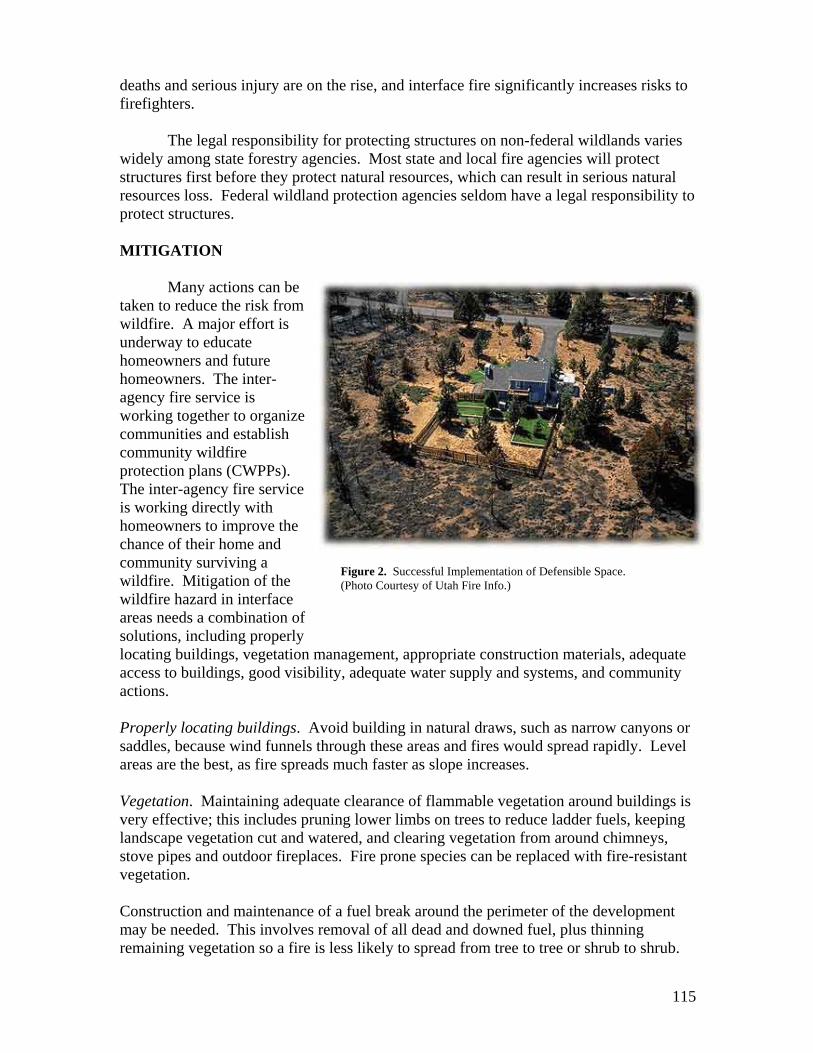
115
deaths and serious injury are on the rise, and interface fire significantly increases risks to firefighters. The legal responsibility for protecting structures on non-federal wildlands varies widely among state forestry agencies. Most state and local fire agencies will protect structures first before they protect natural resources, which can result in serious natural resources loss. Federal wildland protection agencies seldom have a legal responsibility to protect structures. MITIGATION Many actions can be taken to reduce the risk from wildfire. A major effort is underway to educate homeowners and future homeowners. The inter-agency fire service is working together to organize communities and establish community wildfire protection plans (CWPPs). The inter-agency fire service is working directly with homeowners to improve the chance of their home and community surviving a wildfire. Mitigation of the wildfire hazard in interface areas needs a combination of solutions, including properly locating buildings, vegetation management, appropriate construction materials, adequate access to buildings, good visibility, adequate water supply and systems, and community actions. Properly locating buildings. Avoid building in natural draws, such as narrow canyons or saddles, because wind funnels through these areas and fires would spread rapidly. Level areas are the best, as fire spreads much faster as slope increases. Vegetation. Maintaining adequate clearance of flammable vegetation around buildings is very effective; this includes pruning lower limbs on trees to reduce ladder fuels, keeping landscape vegetation cut and watered, and clearing vegetation from around chimneys, stove pipes and outdoor fireplaces. Fire prone species can be replaced with fire-resistant vegetation. Construction and maintenance of a fuel break around the perimeter of the development may be needed. This involves removal of all dead and downed fuel, plus thinning remaining vegetation so a fire is less likely to spread from tree to tree or shrub to shrub.
Figure 2. Successful Implementation of Defensible Space. (Photo Courtesy of Utah Fire Info.)
116
Prescribed fire is an effective way to manage hazardous fuels but can be very difficult to implement in WUI area. Construction materials. Class A fire-resistant roofing is another important mitigation measure. Also, the exterior of a building can be constructed with fire-resistant materials. Fire-resistant buildings materials usually last longer, require less maintenance, and are more cost effective (for example, brick, stucco, concrete block, or rock). Large windows or sliding glass doors can be broken from a wildfire’s heat and allow heated air and embers to enter and ignite the interior of a building. Install thick, tempered safety glass in these areas of large expanses of glass. Protective shutters and fire-resistant drapes can also be installed. Access to buildings. Adequate access to buildings is critical. If road access is steep and narrow, fire-fighting equipment may not be able to reach a building or may be significantly delayed. Avoid areas where the road slope exceeds 12 percent for even a short distance. The side-slope should not exceed 5 percent and if the road is used year round (winter use) side-slope should not exceed 2 percent. Roads with a minimum width of 20 feet and clearance of 13 and one half feet that allow for two-way traffic and pull-off areas are the best. A loop driveway provides additional access for firefighting equipment, and provides an alternate escape route. A cul-de-sac should allow room to turn fire trucks around (the minimum radius needed for fire equipment is 45 feet). Visibility. Provide a clearly visible number for the building; make sure road name signs are installed and maintained. Water supply and systems. Water supply and delivery systems are critical. The water storage or supply source should be able to provide the necessary fire flow as well as minimum daily use requirements for normal resident needs. Access by firefighting equipment should be available to any storage facilities. Ideal developments contains an adequate fire hydrant system; this entails a minimum size main line of six inches in diameter, spacing of 660 feet with two or less dwellings per acre, a 250 gallons per minute fire flow for two hours, with a minimum pressure of 20 pounds per square inch.
If it is not possible to have a hydrant system, develop metal or concrete water cisterns at strategic locations so fire engines can draft from them. These cisterns should hold a minimum of 500 gallons per home.
Water supply to a home should be by at least a one-inch line. The system should be capable of providing at least 15 gallons per minute at 50 pounds per square inch. At least one exterior, freeze-proof tap should be located about 50 feet from the home to permit hose protection for all sides of the home and the roof.
Other sources of water for fire protection can include a stream, pond, lake, or swimming pool. Make known to local firefighters the location of any of these water supplies, and assure fire apparatus has access to the water.
Utah law now requires counties to adopt a wildland urban interface ordinance in order to enter into a cooperative agreement with the state. The ordinance requires new

117
buildings and communities in the WUI to adhere to the following: 1) Provide adequate access for fire apparatus, 2) Provide adequate water supply for fire suppression, 3) Use building materials that are less flammable, and 4) Manage vegetation. Community actions. Purchase of a home in a WUI area may require pursuing and supporting community action to make a development fire safe. One of the best actions an urban interface community can take is the creation and implementation of a Community Wildfire Protection Plan (CWPP). Through this process the community comes together with the help of wildland fire managers to identify and prioritize the hazards in their community. Then they work together to develop mitigation measures to address them. A CWPP is also a mechanism to pursue funding sources for mitigation projects.
The design of public-use areas such as parks, picnic areas, and recreation sites may create green zones, which act as firebreaks, or safety zones.
WUI community covenants codes and restrictions need to address the use of fire for cooking and disposal of debris. Restrictions should include the use of fire pits, fireplace screens, removal of dead vegetation, and properly clearing vegetation. Flammable debris from construction and site improvement needs to be disposed of before final approval of a site or the development.
Consider the fire protection available and if some other arrangement is needed to provide adequate protection. If a development is located more than five miles from the nearest fire department, consider making land available for a fire department or substation. If adjacent to an existing rural fire district, require annexation as a condition for development approval. In a low population development pursue setting up a volunteer fire service.
When an effort is planned to mitigate the wildfire hazard in interface areas, consideration needs to be given to other associated hazards. Steps may need to be taken to deal with potential flooding or slope failures. Where to Find Additional Information
For information on the potential fire hazard of a WUI area, contact the local fire department or the Division of Forestry, Fire & State Lands. Other contacts are the local Forest Service Office, local Bureau of Land Management office, county planning commission, building inspectors, or county extension agent.
For recommended fire-resistant plants, contact the local wildfire protection agency.
A Community Wildfire Protection Plan (CWPP) can be obtained at your local FFSL office or via their web site. This plan can be used in conjunction with other emergency management plans or it can be used as a stand-alone plan for fire planning in a community.
The Division of Forestry, Fire & and State Lands (FFSL), in cooperation with the Utah State Fire Marshals Office, the US Forest Service and Bureau of Land Management,

118
have published a guide specifically for home owners in the WUI. Utah Firewise Living is a comprehensive guide to hazard mitigation in the WUI. A copy can be obtained from any FFSL office. REFERENCES Davis, J.B., 1990, The wildland-urban interface: paradise or battleground?: Journal of Forestry, January 1990, p. 26-31. Fire Research Institute, International directory of wildland fire and international bibliography of wildland fire. Irwin, R.L., 1987, Local planning considerations for the wildland – structural intermix in the year 2000: General Tech. Report PSW-101 Berkley, CA., Pacific Southwest Forest and Range Experiment Station, Forest Service. May, Fred, coordinator, and the State Hazard Mitigation Team, 1990, Wasatch Mountain fire hazard mitigation plan interim report: Utah Division of Comprehensive Emergency Management, 18 p. Sierra Front Wildfire Cooperators, 1987, Wildfire protection, a guide for homeowners and developers: Toiyabe National Forest, 1200 Franklin Way, Sparks, NV. State of Utah, Division of State Lands and Forestry, 1986, Wildfire hazards and residential development: Utah State Lands and Forestry. Tokle, G.O. and Marker, John, Wildfire strikes home! The report of the national wildland/urban fire protection conference: National Fire Protection Association, NFPA No. SPP-86, Quincy, MA. Wilson, Andrew and Ferguson, I.S., 1986, Predicting the probability of house survival during bushfires: Journal of Environmental Management, p. 259-269
119
GLOSSARY
Abutment (dam) – the part of a valley side against which a dam is constructed. Acre-foot of water – approximately 326,000 gallons of water, or a football field covered by one foot of water. Action level (radon) – the level of indoor radon above which action should be taken by occupants of homes to reduce radon concentrations. The action level is defined a 4 pCi/L by the U.S. Environmental Protection Agency. Aftershocks – earthquakes during the seconds, hours, days to months following some larger earthquake (main shock) in the same general region. Air cleaning – a method to remove radon decay products, which are solid particles, from indoor air. The air is continuously circulated through a device which removes the particles. Alluvial fan – a cone-shaped deposit of stream sediments, generally issuing from mountains where a stream would encounter flatter terrain. Alluvium – a general term for clay, sand, gravel, or similar unconsolidated sedimentary material deposited by a stream. Ambient level (radon) – the level of radon, or any other component, in outdoor air. Amplitude (seismic waves) – the maximum height of a wave crest or depth of a trough. Amount the ground moves as a seismic wave passes, as measured from a seismogram. Aspect (slope) – the direction of the land surface displayed as level or facing one of the cardinal directions on a compass. Avalanche path – the area in which a snow avalanche runs; generally divided into starting zones, track, and runout zone. Basin and Range physiographic province – consists of north-south-trending mountain ranges separated by valleys (includes western Utah). Bearing capacity – the load per unit area which the ground can safely support without excessive yield. Bedrock – the solid rock, sometimes exposed and sometimes beneath the soil. Collapsible soil (hydrocompaction) – loose, dry, low-density soil that decreases in volume or collapses when saturated for the first time since deposition. Colorado Plateau physiographic province – consists of generally flat-lying sedimentary rocks, making up plateaus, mesas, and deep canyons (includes south-eastern Utah).
120
Conduit – a closed channel to convey the discharge through or under a dam. Core (dam) – a zone of material of low permeability, usually clayey soils, in an embankment dam. Also called impervious core or zone. Cubic feet per second (CFS) – flow of water equal to one cubic foot of water flowing by a reference point every second; or 448 gallons of water per minute. Debris flow – involves the relatively rapid, viscous flow of surficial material that is predominantly coarse-grained. Debris slide – involves material that is predominantly coarse-grained and the form of movement is mainly along a planar surface. Delta – a deposit of sediment formed at the mouth of a river where it enters an ocean or lake. Drains (dam) – permeable vertical or horizontal sections in the dam that collect water to prevent saturation of the downstream portion of the embankment. This water is frequently piped from the drainage layer to outside the embankment. Dune – a mound or ridge of wind-blown sand derived form weather of rock or unconsolidated deposits, usually in arid areas. Earth flow – involves fine-grained material that slumps away form the top or upper part of a slope, leaving a scarp, and flows down to form a bulging toe. Earthquake – a sudden motion or trembling in the earth as stored elastic energy is released by fracture and movement of rocks along a fault. Emanating power (radon) – the fraction of radon atoms that escape from the solid where they were formed. In rock and soil, emanating power depends upon grain size, porosity, and the nature of material (gaseous or liquid) that fills the pore space. Erosion – the removal of earth or rock material by many types of processes, for example, water, wind, or ice. Expansive soil and rock – soil and rock, which contain clay minerals that expand and contract with changes in moisture content. Epicenter – the point on the Earth’s surface directly above the focus of an earthquake. Fault – a break in the earth along which movement occurs. Fault segment – section of a fault that behaves independently from adjacent sections. Fault zone – an area containing numerous faults. Fill – material used to raise the surface of the land generally in a low area.
121
Filter (dam) – a band or zone of granular material that is incorporated into a dam and is graded so as to allow seepage to flow into the filter without allowing the migration of soils from zones adjacent to the filter. Fire-resistant vegetation – plants that do not readily ignite and burn when subjected to fire because of inherent physiological characteristics of the species such as moisture content, fuel loading, and fuel arrangement. Flood plain – an areas adjoining a body of water or natural stream that has been or may be covered by flood water. Foundation of dam – the natural material on which a dam structure is place. Fuel (fire) – vegetation, building material, debris, and other substances that will support combustion. Fuel break – a change in fuel continuity, type of fuel, or degree of flammability of fuel in a strategically located strip of land to reduce or hinder the rate of fire spread. Fuel type – a category of vegetation used to indicate the predominate cover of an area. Fluvial – concerning or pertaining to rivers or streams. Focus – the point of origin of an earthquake within the earth, and the origin of the earthquake’s seismic waves. Formation (geologic) – a rock unit consisting of distinctive features/rock types separate from units above and below. Frequency (seismic waves) – the number of complete cycles of a seismic wave passing a point during one second. Glacial moraine – debris (sand to boulders) transported and deposited by glacial ice along a glacier’s sides or terminus. Graben – a block of earth downdropped between two faults. Gradient (slope) – a measure of slope of land surface. Ground failure – a general term referring to any type of ground cracking or subsidence, including landslides, liquefaction-induced cracks, and fault ruptures. Ground shaking – the shaking or vibration of the ground during an earthquake. Ground water – the part of the subsurface water which is in the zone of saturation. Gypsiferous deposits – soil or rock containing gypsum, which can be subject to dissolution.
122
Gypsum – a mineral composted of hydrated calcium sulfate. A common mineral of evaporites. Head (landslide) – the upper parts of the slide material along the contact between the disturbed material and the main scarp. Height of dam – hydraulic height refers to the height that water can raise to behind a dam. It is the difference between the elevations of the lowest point in the original streambed at the downstream toe of the dam and the maximum controllable water surface. Holocene – geologic period covering the last 10,000 years (after the last Ice Age). House pressure adjustment (radon) – a method to reduce the driving force for movement of radon in soil gas into a house. Pressures a the lowest levels inside a house are commonly lower land pressures in the surrounding soil, drawing soil gas into the house by mass transport. If the degree of house depressurization is reduced, the rate of soil gas influx might be reduced. Igneous rocks – rocks formed by cooling and hardening of hot liquid material (magma), including rocks cooled with the earth (for example, granite) and those poured out onto the surface as lavas (such as basalt). Impermeable – materials having a texture that does not permit water to move through. Instrumentation (dam) – permanent devices installed in/near a dam to allow monitoring of the dam and impoundment. Intermountain seismic belt – zone of pronounced seismicity, up to 120 miles wide and 800 miles long, extending from Arizona through central Utah to northwest Montana. Lacustrine – concerning or pertaining to lakes. Lake Bonneville – a large, ancient lake that existed 30,000 to 10,000 years ago and covered nearly 20,000 square miles in Utah, Idaho, and Nevada. The lake covered many of Utah’s valleys, and was almost 1000 feet deep in the area of the present Great Salt Lake. Lake Bonneville sediments – sediments deposited by Lake Bonneville, found in the valleys, that range from gravels and sands to clays. Landslide – a mass of earth or rock which moves downslope by flowing, spreading, sliding, toppling, or falling (see slope failure). Lateral spread- lateral downslope displacement of soil layers, generally several feet or more, above a liquefied layer. Levee (flood) – a berm or dike used to contain or direct water, usually without an outlet or spillway.
123
Liquefaction – sudden large decrease in shear strength of a cohesionless soil (generally sand, silt) caused by collapse of soil structure and temporary increase in pore-water pressure during earthquake ground shaking. Loess – a gritty, lightweight, porous material composed of tightly packed grains of quartz, feldspar, mica, and other minerals Magnitude (earthquake) – a quantity characteristic of the amplitude of the ground motion of an earthquake. The most commonly used measurement is the Richter magnitude scale; a logarithmic scale based on the motion that would be measured by a standard type of seismograph 60 miles form the earthquake’s epicenter. Metamorphic rocks – rocks formed by high temperatures and pressures encountered when existing rock is reburied within the earth (for example, quartzite formed from sandstone). Middle Rocky Mountains physiographic province – consists of mountainous terrain, including the Wasatch Range and Uinta Mountains (includes central and north-eastern Utah). Mine subsidence – occurs when mining and rock removal underground leaves voids that collapse of overlying material and subsidence of the ground surface. Modified Mercalli intensity (MMI) – the most commonly used intensity scale in the U.S.; it is a measure of the severity of earthquake shaking at a particular site as determined from its effect on the earth’s surface, man, and man’s structures. Montmorillonite – a clay type characterized by expansion upon wetting and shrinking upon drying. Natural vegetation – native plant life existing on a piece of land before any form of development. Normal fault – fault caused by crustal extension in which relative movement on opposite sides is primarily vertical; for example, the Wasatch fault. Oolite – spherical grains of carbonate sand with a quartz sand grain nucleus. Outlet (dam) – a conduit through which controlled releases can be made from the reservoir. Peat – unconsolidated surficial deposit of particularly decomposed plant remains. Period (geologic) – a standard (world-wide) geologic time unit. Permeability – the capacity of a porous rock or soil for transmitting a fluid. Physiographic province – a region whose pattern of relief features or landforms differs significantly from that of adjacent regions.
124
Picocurie – a unit of measurement of radioactivity. Picocuries per liter (Pci/L) is a common unit of measurement of the concentration of radon in air. Piping (problem soil and rock) – a weak incoherent layer in unconsolidated deposits that acts as channels directing the movement of water. As the layer becomes saturated it conducts water to a free face (cliff or stream bank for example) that intersects the layer, and material exits out a “pipe” formed in the free face. Piping can occur in a dam as the result of progressive development of internal erosion by seepage. Playa – the shallow central basin of a desert plain, in which water gathers after a rain and then evaporates. Pore space – the open spaces in a rock or soil, in between solid grains. The spaces may be filled with gas (usually air) or liquid (usually water). Porosity – the ratio of the volume of pore space in rock or soil to the volume of its mass, expressed as percentage. Probable Maximum Flood (PMF) – a flood that would result from the most severe combination of critical meteorological and hydrologic conditions possible in a region. Probable Maximum Precipitation (PMP) – the maximum amount and duration of precipitation that can be expected to occur on a drainage basin. Problem soil and rock – geologic materials that are susceptible to volumetric changes, collapse, subsidence, or other engineering geologic problems. Quaternary – a geologic time period covering the last 1.6 million years. Radon – the only radioactive element which is a gas. Radon refers to any of a number of radioactive isotopes having atomic number 86. Radon-222 is the most abundant of the radioactive radon isotopes, has the longest half-life (3.825 days), and is considered the most significant contributor to the indoor radon hazard. Recurrence interval – the length of time between occurrences of a particular event (an earthquake, for example). Rock fall – abrupt free fall or downslope movement, such as rolling or sliding, of loosened blocks or boulders from an area of bedrock. The rock-fall runout zone is the area below a rock-fall source which is at risk from falling rocks. Rock topple – forward rotation movement of a rock unit(s) about some pivot point. Runout zone (avalanche) – where a snow avalanche slows down and comes to rest (deposition zone). For large avalanches, the runout zone can include a powder- or wind-blast zone that extends far beyond the area of snow deposition. Sand boil (earthquake) – deposit of sandy sediment ejected as water and sand to the surface, formed when ground shaking has caused liquefaction at depth.
125
Scarp – a relatively steeper slope separating two more gentle slopes. Scarps can form as result of earthquake faulting. Sealing (radon) – a method to prevent the movement of radon from soil into a house. Soil gas entry routes (such as foundation cracks, porous building material, and opening for plumbing) are treated to provide a physical barrier between the soil and the house interior. Sediment – material, in small particles, that is in suspension, is being transported, or has been moved from its site of origin by water, ice, or wind, and has come to rest on the earth’s surface either above or below the sea level. Sedimentary rocks – rocks formed from loose sediment such as sand, mud, or gravel deposited by water, ice, or wind, and then hardened into rock (for example, sandstone); or formed by dissolved minerals dropping out of solution to form rock (for example, tufa). Seiche – a standing wave generated in a closed body of water such as a lake or reservoir. Ground shaking, tectonic tilting, subaqueous fault rupture, or landsliding into water can all generate a seiche. Seismicity – seismic or earthquake activity. Seismic waves – vibrations in the earth produced during earthquakes. Sensitive clay – clay soil which experiences a particularly large loss of strength when disturbed and is subject to failure during earthquake ground shaking. Shear strength – the internal resistance that tends to prevent adjacent parts of a solid from “shearing” or sliding past on another parallel to the plane of contact. It is measured by the maximum shear stress that can be sustained without failure. Sheer stress – a stress causing adjacent parts of a solid to slide past one another parallel to the plane of contact. Slope failure – a general term referring to any type of ground disturbance on a surface with any slope, not flat ground (see landslide). Slump – a slope failure that slides along a surface of rupture that is curved concavely upward. Generally slumps do not move very far from the source area. Slum area (dam) – a portion of earth embankment which moves downslope, sometimes suddenly, often with cracks developing. Snow avalanche – a rapid downslope movement of mass of snow, ice, and debris. Sodium sulfate – an evaporate that is commonly deposited upon evaporation of surface waters in playas.
126
Soil ventilation (radon) – a method to prevent the movement of radon from soil into a house. Soil gas is drawn or blown away from the house before it can enter. Solution – the conversion of rock from solid to liquid state by its combination with a liquid, usually water. Spillway system – a structure over or through which excess reservoir water is discharged. If the flow is controlled by gates, it is considered a controlled spillway; if the elevation of the spillway crest cannot be adjusted and is the only control, it is considered an uncontrolled spillway. Emergency spillway is the main spillway for normal operations and small flood flows. Starting zone (avalanche) – where the unstable snow or ice breaks loose and starts to slide. Subsidence – a settling or sinking of parts of the earth’s crust. Surface fault rupture (surface faulting) – propagation of an earthquake-generated fault rupture to the ground surface, displacing the surface and forming a scarp. Tectonic subsidence – subsidence (downdropping) and tilting of a basin on the downdropped side of a fault during an earthquake. Toe (landslide) – the margin of disturbed material most distant from the main scarp. Track (avalanche) – the slope or channel down which a snow avalanche moves at a fairly uniform speed. Unconsolidated basin fill – uncemented and nonindurated sediment, chiefly clay, slit, sand, and gravel, deposited in basins. Urban area – a geographical area, usually of incorporated land, covered predominantly by engineered structures including homes, schools, commercial buildings, service facilities, and recreational facilities. Urban/Wildland Interface (Urwin) – a geographical area where two different environments, wildland and urban residential, meet and affect each other. Velocity (ground motion) – the rate of displacement of an earth particle caused by passage of a seismic wave. Ventilation – a method to reduce indoor radon levels by displacing house air with outdoor air. This may be achieved without attempting to recover heat lost from inside the house (by opening doors, windows, or vents, or by using a fan), or by recovering the heat (with heat recovery ventilators or air-to-air heat exchangers). Wasatch fault – a normal fault that extends over 200 miles in length from Malad City, Idaho to Fayette, Utah, and trends along the western front of the Wasatch Range. Wasatch fault zone – the area along the Wasatch fault containing numerous faults.
127
Watershed – the area of land above a reference point on a stream or river, which contributes runoff to that stream. Weathering – a group of processes, such as the chemical action of air, rain water, plants, and bacteria and the mechanical action of temperature changes, whereby rocks on exposure to the weather change in character, decay, and finally crumble into soil. Wildfire – uncontrolled fire burning in vegetation. Wildland area – a geographical area of unincorporated land covered predominately by natural vegetation. Zone of deformation (earthquake) – the width of the area of surface faulting over which earth materials have been disturbed by fault rupture, tilting, or subsidence.
128