Embed Size (px)
Citation preview

JKAU: Earth Sci., Vol. 20 No. 1, pp: 35-49 (2009 A.D./ 1430 A.H.)
35
Utilization of Landsat ETM+ Data for Mapping Gossans
and Iron Rich Zones Exposed at Bahrah Area, Western
Arabian Shield, Saudi Arabia
Ahmed A. Madani
Department of Mineral Resources and Rocks, Faculty of Earth Sciences,
King Abdulaziz University P.O. Box 80206, Jeddah, 21589,
Saudi Arabia
Received: 25/11/2007 Accepted:27/5/2008
Abstract. Utilization of remote sensing techniques for mapping
gossans and iron rich zones exposed at Bahrah area, Western Arabian
Shield, Saudi Arabia is the main task of this article. Spatial
dimensions of these gossans are favorable to detect by Landsat ETM+
imagery. Gossans at the study area occur within the highly foliated,
metavolcanic sequence composed mainly of basalts, basaltic
andesites, dacites, rhyolites and their tuffs. Band ratios and density
slicing are the main remote sensing techniques used throughout this
study to discriminate and map the gossans and iron-rich zones
exposed along the NNE-SSW left lateral strike slip faults. 4/5 band
ratio image was found to be the most favorable ratio that discriminates
the gossans and iron-rich zones. The gossans have a black image
signature on this ratio and this signature is attributed to the absorption
feature near band-4 exhibited by pyrite, hematite, goethite and
magnetite, the main mineral constituents of gossans. On 4/5 band ratio
image the DN values of gossans were determined (range between 0
and 14) and used by the density slicing technique to slice the gossans
and iron rich zones from other rock units exposed at the study area.
Panchromatic Landsat band-8 was prepared for the automatic
lineaments extraction using PCI package under the user defined
parameters. The results of lineaments analysis revealed that, the main

Ahmed A. Madani 36
lineament trends affecting the metavolcanic sequence and the gossans
are NE-SW, N-S (NNE-SSW) and NW-SE. These trends were
verified in the field and found to coincide largely with the results of
the geophysical studies done by many authors on the study area. The
information extracted from the lineaments analysis, density slicing
technique and the field verification were integrated to produce an
image map of scale 1:100 000 shows the distribution of gossans and
iron rich zones exposed at the study area.
Keywords: Landsat ETM+, Gossan, Band Ratio, Density Slicing,
Bahrah area, Saudi Arabia.
Introduction
In the western Saudi Arabia, the Neoproterozoic Arabian Shield is
composed of at least five geologically distinct terranes separated by four
ophiolite-bearing suture zones. Three ensimatic island arc terranes in the
western part of the shield (Asir, Hijaz and Midyan) and Afif and Ar Rayn
terranes of continental affinity further to the east (Al Shanti and Mitchell,
1976; Bakor et al., 1976; Greenwood et al., 1976; Frisch and Al Shanti,
1977; Gass, 1977 & 1981; Schmidt et al., 1979; Camp, 1984). The
Neoproterozoic Arabian Shield host auriferous massive sulphide ore
bodies (Al-Shanti and Roobol, 1979). These massive sulphide deposits
are Kuroko-type and formed by submarine hydrothermal activity
associated with felsic vulcancity. Primary mineralization which occurs as
stock-work or stratabound deposits, were faulted, folded, metamorphosed
and intruded. Recent interaction with air and surface water oxidized the
sulphides, yielding Fe-rich crusts termed gossans (Sate, 1974).
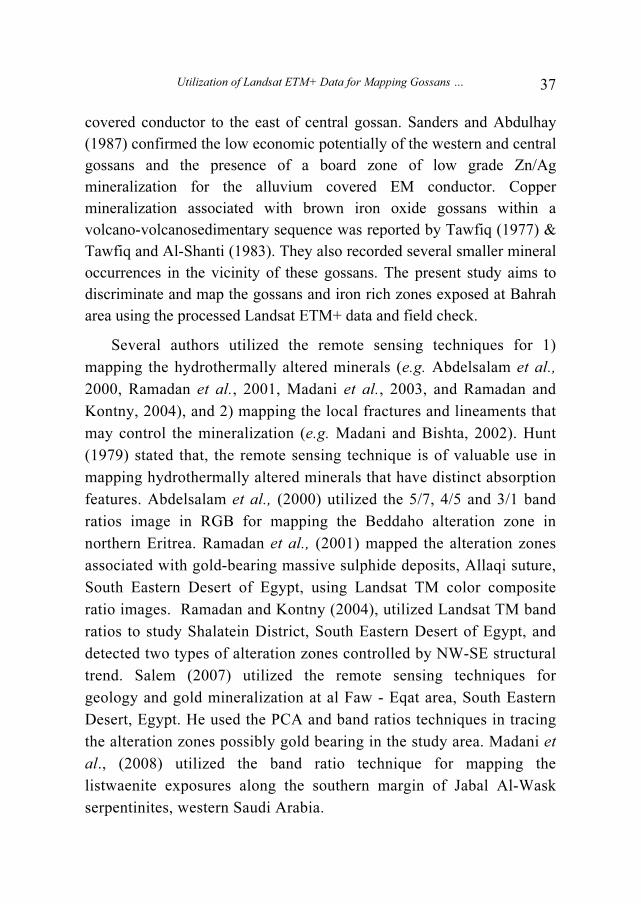
The area of study lies between Lat. 21º 22' to 21 º 26' and Long. 39º
30' to 39 º 37', approximately 40 km east of Jeddah City along the Red
Sea coast (Fig. 1). The area is covered by three main rock units namely:
schists, metavolcanics and plutonic rocks (Al Shanti, 1967). The
metavolcanic sequence is dominated by basalts, andesites, dacites,
rhyolites and their tuffs. Two gossan zones namely central and western
gossans were discovered by Al-Shanti (1967) within the metavolcanic
sequence exposed at the study area. Ground geophysical survey done by
ARGAS (1983) and Last et al., (1985) discovered a third alluvium-
Utilization of Landsat ETM+ Data for Mapping Gossans … 37
covered conductor to the east of central gossan. Sanders and Abdulhay
(1987) confirmed the low economic potentially of the western and central
gossans and the presence of a board zone of low grade Zn/Ag
mineralization for the alluvium covered EM conductor. Copper
mineralization associated with brown iron oxide gossans within a
volcano-volcanosedimentary sequence was reported by Tawfiq (1977) &
Tawfiq and Al-Shanti (1983). They also recorded several smaller mineral
occurrences in the vicinity of these gossans. The present study aims to
discriminate and map the gossans and iron rich zones exposed at Bahrah
area using the processed Landsat ETM+ data and field check.
Several authors utilized the remote sensing techniques for 1)
mapping the hydrothermally altered minerals (e.g. Abdelsalam et al.,
2000, Ramadan et al., 2001, Madani et al., 2003, and Ramadan and
Kontny, 2004), and 2) mapping the local fractures and lineaments that
may control the mineralization (e.g. Madani and Bishta, 2002). Hunt
(1979) stated that, the remote sensing technique is of valuable use in
mapping hydrothermally altered minerals that have distinct absorption
features. Abdelsalam et al., (2000) utilized the 5/7, 4/5 and 3/1 band
ratios image in RGB for mapping the Beddaho alteration zone in
northern Eritrea. Ramadan et al., (2001) mapped the alteration zones
associated with gold-bearing massive sulphide deposits, Allaqi suture,
South Eastern Desert of Egypt, using Landsat TM color composite
ratio images. Ramadan and Kontny (2004), utilized Landsat TM band
ratios to study Shalatein District, South Eastern Desert of Egypt, and
detected two types of alteration zones controlled by NW-SE structural
trend. Salem (2007) utilized the remote sensing techniques for
geology and gold mineralization at al Faw - Eqat area, South Eastern
Desert, Egypt. He used the PCA and band ratios techniques in tracing
the alteration zones possibly gold bearing in the study area. Madani et
al., (2008) utilized the band ratio technique for mapping the
listwaenite exposures along the southern margin of Jabal Al-Wask
serpentinites, western Saudi Arabia.

Ahmed A. Madani 38
Fig. 1. Location map for the study area.
Geologic Setting of Gossan Zones
Amphibole schist, andesites, andesite porphyries, rhyolites and
diabase intruded by plutons of diorites and granodiorites as well as dykes
are the main rock units covered the study area (Brown et al., 1963).
Gossans and iron rich zones occur within steeply dipping (50º-75º),
highly foliated metavolcanics and tuffs sequence composed mainly of
basalts, basaltic andesites, dacites and rhyolites. Throughout this study,
three field visits were conducted. The following paragraphs describe in
detail the geology of both central and western gossans.
The central gossan zone crops out along the NNE-SSW left lateral
strike slip fault and occurs as discrete pods of different dimensions Fig.
2(a). These dimensions are favorable for detection and delineation by
Landsat imagery (15 and 30m spatial resolution). It is characterized by
Fe and Mn stained lenses which occur within steeply dipping (50º-75º),
highly foliated siliceous gossans intercalated with andesitic and rhyolitic
tuffs. The development of iron staining is variable and increased
northward. Lenses rich in sulphides (mainly pyrite) were recorded within

Utilization of Landsat ETM+ Data for Mapping Gossans … 39
the siliceous gossan and surrounded by a red (hematitic) and yellow
(limonitic) iron staining materials Fig. 2(b). The central gossan zone is
overlain by thick sequence of metadacite (Sanders and Abdulhay, 1987).
The western gossans Fig. 2(c) consist of brownish limonitic, kaolinitic, sericitic, rhyolitic tuffs of about 6 m thickness underlain by a thick pile of lithic fragments quartz eye rhyolite and grading upward towards the green andesites of about 30 m thickness. Several small exposures of gossan zones were observed northward along the NNE-SSW strike slip fault facing the western gossan zone. Some of them were recorded by the processed Landsat image. The area of study was subjected to low grade metamorphism of green schist facies. The metamorphism event produced locally some quartz veins which cut the volcanic succession in the study area. A NNE-SSW left lateral strike slip fault was observed to displace these veins Fig. 2(d). This trend is the main trend affecting the gossans in the study area.
Fig. 2: a) Iron (Fe) and Manganese (Mn) staining in siliceous gossan, central gossan.
b) Reddish brown lens embedded within a siliceous gossan rich in pyrite, central
gossan.
c) Yellowish brown limonitic gossan (L) overlying the quartz eye rhyolites (R),
western gossan.
d) Quartz vein cut by NNE-SSW left lateral strike slip fault, central gossan.

Ahmed A. Madani 40
Data Analysis and Discussion
During this study the remote sensing techniques have been applied to discriminate, delineate and map the gossans and iron rich zones which occur within the metavolcanic sequence at Bahrah area, western Saudi Arabia. Results from this study confirm the usefulness of these techniques to discriminate and map these gossan zones. Several iron rich zones were identified in the processed Landsat imagery and verified in the field along the NNE trend and mapped using this approach. Subsets from multispectral and panchromatic Landsat-7 data covering the area of interest were performed using the PCI GeoAnalyst software. Band ratio technique is the most usable technique used to identify and map the alteration zones in several places in the world. In General, Landsat TM band-ratios 5/7 and 3/l emphasizes clay and Fe minerals that have specific spectral reflectance and absorption features in these bands (Sabins, 1997).
Madani et al., (2003) utilized the Landsat-7 ETM+ data for mapping the hydrothermal alteration zones at Haimur gold mine area, South Eastern Desert, Egypt. They utilized Principal Component Analysis (PCA) and band ratios to map the hydrothermal alteration products. They found that PC5 image represents the altered rock outcrops along the main shear zone at the study area. Also they generated the 5/7, 4/5 and 3/1 band ratio images to discriminate and map the carbonates, Fe-silicates, clay minerals and iron minerals in Haimur gold mine area.
Throughout this study, band ratios and density slicing techniques were used. The following paragraphs describe in detail the discrimination and mapping of the gossans and iron rich zones exposed at Bahrah area.
Mapping Gossan and Iron Rich Zones Using Density Slicing Technique
Density slicing technique was successfully used to map clay- and Fe-rich alteration zones along the the Beddaho Alteration Zone in northern Eritrea using Landsat TM band-ratio 5/7 and 3/l (Abdelsalam et al., 2000). The density slicing technique converts the continuous grey tone of an image into a series of density intervals, each corresponding to a specific range of digital numbers (DN) (Sabins, 1997). Visual inspection of different band ratio images generated for Bahrah area revealed that the Landsat band ratio 4/5 image is the most favorable ratio that discriminates the gossans and iron rich zones exposed within the metavolcanics sequence at the study area. On 4/5 band ratio image, the gossans and iron rich zones appear to have a black image signature Fig.

Utilization of Landsat ETM+ Data for Mapping Gossans … 41
3(a). Central and Western gossans have DN values range between 0 and 14. Density slicing technique was performed using these values over a mask area covers the metavolcanic sequence. Fig. 3(b) shows the result of the density slicing of 4/5 band ratio image in which the gossans and iron rich zones were observed as yellow polygons. Visual inspection for the distribution of such polygons revealed that the presence of certain alignment along the NNE-SSW to N-S trends. Field verification revealed the presence of strike slip movement for these trends.
Fig. 3: a) Landsat ETM+ band ratio 4/5 image covers the Bahrah area.
b) Subset image shows the gossans and iron rich zones (yellow) within the
metavolcanic sequence generated by density slicing technique.
Under the microscope the siliceous gossan is composed mainly of medium to coarse grained subhedral quartz grains having two different generations. Epidote, apatite, opaques and sericite also occur as accessories and alteration products. Two generations of pyrite having different grain sizes were recorded. The first generation of pyrite is

Ahmed A. Madani 42
coarse grained, subhedral and highly fractured Fig. 4(a), whereas the second generation is represented by small tiny crystals occur within gangue minerals. Covellite, chalcocite with little Fe-oxides (goethite) are also observed. The pyrites of western gossan were partially oxidized into Fe-oxide minerals, mainly goethite Fig. 4(b).
Hunt and Salisbury (1970) studied the spectral characteristics of iron minerals and stated the spectral reflectance curves of iron minerals to show low flat spectra. Sabins (1997) stated that the spectra of iron minerals show high red reflectance value around band 3 wavelength region and low reflectance values around blue band. In this study, the gossans have black image signature on 4/5 image which means the low ratio value. Visual inspection of the spectral curves of pyrite and hematite, the main constituents of gossans, Fig. 4 (c and d) show the presence of absorption feature around the wavelength region 0.8 to 0.9 µm which corresponds to the wavelength region of band 4. The presence of such absorption feature may lead to lower the ratio value and yields the black image signature to the gossans.
Fig. 4: a) Highly fractured agglomerated pyrite crystals, P.P.L., P.S., 110X.
b) Colloform goethite replaced pyrite crystals, P.P.L., P.S., 110X.
c & d) Spectral reflectance curves of pyrite and hematite. After Clarks et. al (1993).

Utilization of Landsat ETM+ Data for Mapping Gossans … 43
Automatic Lineaments Extraction
The surface expression of geological structures such as, fractures,
faults, joints, shear zones and foliations are shown in the form of
lineaments on airborne and orbital remote sensing data (Koch and
Mather, 1997). Automatic lineament extraction from remote sensing data
is an important approach for regional structural studies and
mineralization. Recognition of lineaments has been used for mineral
exploration studies (Rowan and Lathram, 1980). Madani and Bishta
(2002) studied lineaments characterization and their relation to the U-
mineralization exposed at Gattar granites, Northeastern Desert, Egypt.
The extracted lineament trends are compatible to great extent with the
main structural and mineralization trends of the study area.
The lineaments analysis step aims to understand the relationship
between the lineament trends (faults) as the main structural element
affecting the rock units exposed at the study area and the alignment of the
gossan zones. Landsat panchromatic image (15m) was prepared to
conduct this test under the user defined parameters of LINE module of
PCI software. These parameters produced well defined lineaments
compared with those which were produced under the default parameters
(Table 1). Automatic lineaments extraction from Landsat panchromatic
image was run with three major steps: 1) edge detection, 2) threshold and
3) lineaments extraction. Figure 5, shows the main lineament trends
automatically extracted over the metavolcanic sequence contains the
gossans and iron rich zones. The main lineament trends are NE-SW, N-S
(NNE-SSW, NW-SE constituting the 51.5%, 20.7% and 14.1%
respectively. E-W is subordinate direction constitute 13.3% of total
lineaments number. On the upper left of Fig. 5 lineament frequency rose
diagram shows the high degree of preferred orientation in NE-SW and in
NNE-SSW to N-S directions. Result of lineament analysis is in
agreement to a large extent with the results of the extensive geophysical
studies carried out on the Bahrah area by ARGAS (1983). These studies
revealed the presence of two main fault trends (NE and NW) affected the
mineralized area. Field investigations revealed that, the strike-slip faults
are the most dominating structural fabric in the study area. The strike-slip
faults are oriented NNE-SSW (N-S). The NNE–SSW trending lineaments
are parallel to the regional Neoproterozoic fabric in the study area and
are steeply dipping to the west. The NNE-SSW (N-S) set of strike-slip
faults are of left lateral movement. These faults sinistrally offset the east-

Ahmed A. Madani 44
west trending quartz veins (Fig. 4d). These quartz veins are good markers
indicating the horizontal displacements that vary from a centimeter to
meters. Structural information extracted from the lineaments analysis
together with the density slicing results and field check were used to
generate 1:100 000 image map showing the distribution of gossans and
iron rich zones at Bahrah area Fig. 5.
Table 1. User defined and default parameters used for automatic lineaments extraction over
Bahrah area.
Parameter Default User defined
Edge filter radius 3 10
Minimum edge gradient 15 20
Minimum line length 15 20
Line fitting tolerance 2 7
Maximum angular difference 10 15
Maximum linkage difference 30 20
Fig. 5. Image map shows the distribution of gossans, the automatic extracted lineaments
and major faults over the Bahrah area with the lineaments frequency rose diagram
on the upper left.
Conclusions
This study demonstrates clearly the usefulness of the band ratios and
density slicing techniques for mapping the gossans and iron rich zones
exposed at Bahrah area, Western Arabian Shield, Saudi Arabia. Visual
inspection revealed that, 4/5 band ratio image was found to be the best

Utilization of Landsat ETM+ Data for Mapping Gossans … 45
discriminator for gossans in which the gossans have black image
signature. Spectral curves of pyrite and hematite, the main constituents of
gossans, show the presence of absorption feature near band-4, which may
be responsible for lowering the ratio value. Several black spots were
observed along the NNE-SSW trend parallel to the central and western
gossan. To map such spots, the DN values of central and western gossans
were determined from 4/5 band ratio image (0-14) and used by density
slicing technique to slice the surface gossans and iron rich zones along
the NNE-SSW trend. Results of the automatic lineaments extraction
using Landsat band-8 revealed that, NE-SW, NNE-SSW (NS) and NW-
SE are the main lineament trends affecting the study area. These trends
constitute 51.5, 20.7 and 14.1% respectively. E-W trend is subordinate
and constitutes 13.3% of the total lineaments number. A map of scale
1:100 000 shows the gossans and iron rich zones distributed over the
Landsat (FCC) background was generated by integration of the results of
density slicing, field verification and lineament analysis.
Acknowledgements
The author would like to thank Prof. A. Eldougdoug and Dr. H.
Harbi from Mineral Resources and Rocks Department, Faculty of Earth
Sciences, King Abdulaziz University for their help during the field trips
and for fruitful discussion.
References
Abdelsalam, M.G., Stern, R.J. and Berhane, W.G. (2000) Mapping gossans in arid regions with
Landsat TM and SIR-C images: the Beddaho Alteration Zone in northern Eritrea, Journal of
African Earth Sciences, 30(4): 903-916.
Al Shanti, A. M. (1967) Preliminary report on gossan zones in Bahrah area: Saudi Arabian
Directorate General of Mineral Resources, Open- File Report, DGMR, pp: 303.
Al Shanti, M. M. and Roobol, M. J. (1979) A Late Proterozoic ophiolitic Complex at Jabal Ess
in Northern Saudi Arabia, Nature, 279(5713): 488-491.
Al Shanti, M. S. and Mitchell, A. H. G. (1976) Late Precambrian subduction and collision in the
Al Amar-Idsas region, Arabian Shi7eld, Kingdom of Saudi Arabia, Tectonopysics, 30: 41-
47.
ARGAS (1983) Bahrah Geophysical Report, Saudi Arabian Deputy Ministry for Mineral
Resources, Open-File Report, 83-ARG-07.
Bakor, A. R., Gass, I. G. and Neary, C. (1976) Jabal Al Wask, Northwest Saudi Arabia, an
Eocambrian back-arc ophiolite, Earth and Planetary Science Letters, 30: 1-9.
Brown, G. F., Jackson, R. O., Bouge, R.G. and Maclean, W. H. (1963) Geologic Map of the
Southern Hijaz Quadrangle, Kingdom of Saudi Arabia, U.S. Geological Survey,
Miscellaneous Geologic Investigation Map, I-210A, Scale 1:500 000.
Ahmed A. Madani 46
Camp, V. E. (1984) Island-arcs and their role in the evolution of the Western Arabian Shield,
Geological Society of America Bulletin, 95: 913-921.
Clark, R.N., Swayze G.A., Gallagher A.J., King T.V.V. and Calvin W.M. (1993) The U. S.
Geological Survey, Digital Spectral Library: Version 1: 0.2 to 3.0 microns: U.S. Geological
Survey Open File Report 93-592, pp: 1340.
Frisch, W. and Al Shanti, A. M. S. (1977) Ophiolite belts and the collision of island arcs in the
Arabian Shield, Tectonophysics, 43: 293-306.
Gass, I. G. (1977) The evolution of the Pan-African crystalline basement in NE Africa and
Arabia, Journal of the Geological Society, London, 134: 129-138.
Gass, I. G. (1981) Pan-African (Upper Proterozoic) plate tectonics of the Arabian-Nubian Shield,
In: Kröner, A. (ed.), Precambrian Plate Tectonics, Elsevier Amsterdam, pp: 387-405.
Greenwood, W.R., Hadley, D.G., Anderson, R.F., Fleck, R.J. and Schmidt, D.L. (1976). Late
Proterozoic cratonization in southwestern Saudi Arabia, Royal Society of London
Philosophical Transactions Series A, 280: 517-527.
Hunt, G.R. and Salisbury, J.W. (1970) Visible and near infrared spectra of Minerals and rocks:I.
Silicate Minerals, Mod. Geol., 1: 283-300.
Hunt, G.R. (1979) Near Infrared (1.3 – 2.4um) spectra of alteration minerals-potential for use in
remote sensing, Geophysics, 44: 1974-1986.
Koch, M. and Mather, P.M. (1997) Lineament mapping for groundwater resource assessment: a
comparison of digital Synthetic Aperture (SAR) imagery and stereoscopic Large Format
Camera (LFC) photographs in the Red Sea Hills, Sudan, International Journal of Remote
Sensing, 18: 1465–1482.
Last, B. J., Basahel, M. and Oskoui, R. (1985) Magnetic and Electromagnetic Surveys of the
Bahrah prospect (21/39D): Saudi Arabian Deputy Ministry for Mineral Resources, Open-
File Report, DGMR- OF-05, pp: 35.
Madani, A. and Bishta, A. (2002) Selection of the optimum bands of Landsat-7 ETM+ for
automatic lineaments extraction: A case study of Qattar Granites, NorthEastern Desert,
Egypt, 6th International Conference on the Geology of the Arab World, Cairo University, 6:
353-360.
Madani, A., Abdel Rahman, E. M., Fawzy, K. M. and Emam, A. (2003) Mapping of the
Hydrothermal Alteration Zones at Haimur Gold Mine Area, South Eastern Desert, Egypt
Using Remote Sensing Techniques, The Egyptian Journal of Remote Sensing & Space
Sciences, 6: 47-60.
Madani, A., Harbi H. and Eldougdoug A. (2008) Utilization of Remote Sensing Techniques for
Mapping the Listwaenite associated with Jabal Al-Wask Ophiolite Complex, Northwestern
Saudi Arabia, The Egyptian Journal of Remote Sensing & Space Sciences, 11: 57-72.
Ramadan T. and Kontny A. (2004) Mineralogical and structural characterization of alteration
zones detected by orbital remote sensing at Shalatein District, SE Desert, Egypt, Journal of
African Earth Sciences 40: 89–99.
Ramadan, T. M., Abdelsalam, M. G. and Stern, R. J. (2001) Mapping gold-bearing massive
sulfide deposits in the neoproterozoic Allaqi Suture, Southeast Egypt with Landsat TM and
SIR-C/X SAR images, Photogrammetric Engineering & Remote Sensing, 67(4): 491-497.
Rowan, L. C. and Lathram, E. H. (1980) Mineral Exploration., Siegel & Gillespie, editors, In:
Remote Sensing in Geology, John Wiley and Sons, New York, pp: 553-605.
Sabins, F. (1997) Remote Sensing: Principles and Interpretation, Third Edition, Freeman and
Company, New York.
Salem, S.A. (2007) Using Remote Sensing Techniques in the Geology and gold mineralization at
al Faw - Eqat area, South Eastern Desert, Egypt, The Egyptian Journal of Remote Sensing &
Space Sciences, 10: 137-150

Utilization of Landsat ETM+ Data for Mapping Gossans … 47
Sanders, R. N. and Abdulhay, G. J. (1987) Mineral Potential of the Bahrah Prospect, 21/39D,
Deputy Ministry for Mineral Resources, Jeddah, Kingdom of Saudi Arabia, Open-File
Report, DGMR–OF- 05, p. 40.
Sato, T. (1974) Distribution and geological setting of the Kuroko deposits. In: Ishihara, S. (Ed.),
Geology of Kuroko Deposits, The Society of Mining Geologist, Japan, Special Issue, 6: 1-9.
Schmidt, D. L., Hadley, D.G. and Stoeser, D. B. (1979) Late Proterozoic crustal history of the
Saudi Arabian Shield, southern Najd province, Kingdom of Saudi Arabia, In: Al Shanti,
A.M.S. (ed.), Evolution and Mineralization in the Arabian-Nubian Shield, King Abdulaziz
University, Institute of Applied Geology Bulletin, Oxford New York Pergamon Press, pp:
41-58.
Tawfiq, M.A. (1977) Geology and mineralization of Bahrah, Saudi Arabia: unpublished M.Sc.
Thesis, Institute of Applied Geology, King Abdulaziz University, Kingdom of Saudi Arabia.
Tawfiq, M.A. and Al-Shanti, A.M. (1984) Geology and mineralization of Bahrah area between
Jeddah and Makkah, Saudi Arabia, King Abdulaziz University, Faculty of Earth Sciences
Bull.,6.

Ahmed A. Madani 48
����� ��� � �������� �� ������� ������ ������ ��
������������� ���� ��� �!��"�� #��� $� ��
����"��� ���"�� �%&����
������� �� �
����� ����� ���� ���� ������ � ������� ����� �� ���� ����� �!�
������ ��"��� ������ �#�#�� �"�
�������. �� ���� � � � ������ ��� ������� �� �������
����� ����!� �"��� � �"�#�� $����� % ��&�� ���� �"���
�"��'��� ���'�� (���� )�* . �� �! % ��&�� ��+" ,"�
���- ��� ���� %! ���/!�� �����!�� �"� /���� ������ � '� ���
���"-"��0�� ��"������ ��� � �1��� �"��"��� � /�)� �!��.
� 2 ���� �!�2 �"��� %! 3/ ������� �� ������� ��� �
% ��&�� ���� -""!�� �� 4/�� 5"��� �"���� . %6 78 ���� ���+6�
� 2 ���� �!�2 ����9/; $����� % ��&�� -""!�� )��0� �
0� %�<� � ��+� ,"� ������� ����! � �"��� � �"�#����� . �2�
%�<�� ��� =->6 ��� + ��&� �� � �"�"��� %� '!� ? ��!
�#� ��� �"1"��� � 2 ���� � �"�"�& !���@ �2� �!-��� 9 . %!�
�!������ ��� % ��&<� �-"!!�� � 2�0� ?����� �� ������ ���
�"�#�� $����� % ��&�� ���� �"���� �� 4/�� 5"��� �"��� �
������� ����!� �"��� � . ?����� �� A"6 ������� ��� ��
�2� $ ���� ���� ������ � "�B �"���� ����+��C ������
7! ���PCI . ����!� �"�"8��� � � &�D� %6 78 ���� ���+6 �2�

Utilization of Landsat ETM+ Data for Mapping Gossans … 49
� ��� ����� <> � ������� : $�F 3 !FG �)�* )��&
� )��&– �3 !F� )�* 3 !F– � � &�D� ���� $�F )��&
���� 34!�;H,;٪� � JK,L٪ � H9,H٪ </�� ��'�� %! @
�"���� ����+<� . �!�2 ����� 78 �� %!� � 2 ���� ?������
+�� <���� $������ �"���� ����� �� � M "�!� ����! ��"�� N ��
���HKK,KKK:H %/ !6 OA�� ��&� �"�#�� $����� % ��&��
���� ����!� �"��� �.