Embed Size (px)
Citation preview
IntroductionThe mechanical and shear strength parameters(UCS, C, φ, etc.) of rocks are considered to beamong the most significant properties inmining, civil, and engineering geology projects(Singh et al., 2011). The UCS is mostcommonly determined in accordance with thesuggested methods of the International Societyfor Rock Mechanics (ISRM, 2007). UCS is alsoconsidered for a variety of issues encounteredduring blasting, excavation, and supportsystems in engineering applications (Hoek,1977). Shear strength parameters (C and φ)are used to express the strength of rockmaterials and the resistance to deformationunder shear stress. These parameters areaffected by many factors such as lithologicalcharacter, anisotropy, and environment of therock materials (Yang et al., 2011). Shear
strength parameters of rock materials can bequantified by means of direct shear tests andtriaxial compression tests as prescribed theAmerican Society for Testing and Materials(ASTM, 2004) and ISRM (2007), respectively.The latter test is widely used and accepted inmost mining practices.
However, UCS and triaxial compressiontests are expensive and time-consuming. Inaddition, the preparation of rock core samplesfor testing, placing the samples in a confiningpressure cell (Hoek cell), and operating theconfining pressure for triaxial testing requiresconsiderable time and attention (Kahramanand Alber, 2008; Kilic and Teymen, 2008).Furthermore, weak, thinly bedded, or denselyfractured rocks are not suitable for specimenpreparation and the determination of UCS.Triaxial testing is also difficult for such rocktypes. Therefore, some alternative testmethods such as point load index, Schmidthammer, and ultrasonic pulse velocity tests arecommonly used to estimate the UCS, C, and φof rocks owing to their rapidity, simplicity, lowcost, and ease of both specimen preparationand testing (Kahraman, 2001; Karaman andKesimal, 2015).
Although the aforementioned tests areknown to be extensively used for estimation ofrock strength (Kahraman, 2001; Kilic andTeymen, 2008; Bruno et al., 2012), there arefew studies on the utilization of the Braziliantest (BT) for the estimation of UCS, C, and φ ofintact rocks (Beyhan, 2008; Farah, 2011). TheBT is one of the most popular and commontests to obtain the tensile strength of brittlematerials such as concrete, rock, and rock–like
Utilization of the Brazilian test for estimatingthe uniaxial compressive strength and shearstrength parametersby K. Karaman*, F. Cihangir*, B. Ercikdi*, A. Kesimal*, and S. Demirel†
SynopsisUniaxial compressive strength (UCS) and shear strength parameters(cohesion and angle of internal friction, C and φ) of rocks are importantparameters needed for various engineering projects such as tunnelling andslope stability. However, direct determination of these parameters isdifficult and requires high-quality core samples for tests. Therefore, thisstudy aimed to explore the applicability of the Brazilian test (BT) – asimple, less sophisticated and inexpensive method for both specimenpreparation and testing – to estimate the UCS and shear strengthparameters of rocks. Thirty-seven rock types were sampled and tested, 24of which were volcanic, 8 were metamorphic, and 5 were sedimentary.Statistical equations were derived to estimate the UCS and shear strengthparameters of rocks using the BT. The validity of the statistically derivedequations was confirmed using predictive analytics software (PASWStatistics 18). A strong linear relation was found between BT and UCSvalues. BT and UCS values exhibited prominent linear correlations withthe cohesion values of rocks. The Mohr envelope was also used todetermine the cohesion and friction angle of rocks using BT and UCSvalues. It is deduced from the current study that the BT values can be usedto estimate the UCS and cohesion. However, no relation was observedbetween the angle of internal friction values and the UCS and BT for allrock types. Therefore, different approaches are suggested for theestimation of the internal angle of friction for application in thepreliminary design of projects.
KeywordsBrazilian test, shear strength parameters, triaxial compressive strength,uniaxial compressive strength, Mohr-Coulomb criterion
* Department of Mining Engineering, KaradenizTechnical University, Turkey.
† NVS Construction Industry and Trade LimitedCompany.
© The Southern African Institute of Mining andMetallurgy, 2015. ISSN 2225-6253. Paper receivedApr. 2014; revised paper received Jul. 2014.
185The Journal of The Southern African Institute of Mining and Metallurgy VOLUME 115 MARCH 2015 �
Utilization of the Brazilian test for estimating the uniaxial compressive strength
materials (Li et al., 2013). It owes its popularity to the easeof specimen preparation, which does not require particularcare and expensive techniques, compared to the direct tensiontest (Mellor and Hawkes, 1971; Hudson et al., 1972;Bieniawski and Hawkes, 1978; Coviello et al., 2005). The BThas also been suggested by many researchers for investi-gating the effect of anisotropy on the strength of coal (Evans,1961), siltstone, sandstone, and mudstone (Hobbs, 1964),and gneiss and schist (Barla, 1974). Farah (2011) correlatedthe UCS of 145 weathered Ocala limestone samples with theirpoint load strength and BT values. He stated that the BT is auseful method for prediction of UCS compared to the pointload test. Kahraman et al., (2012) found a reasonable linearcorrelation between UCS and BT results. Many researchershave correlated BT results with indirect tests (P-wavevelocity, block punch test, point load index, Schmidt hammertest etc.) to estimate indirect tensile strength of rocks (Kilicand Teymen, 2008; Mishra and Basu, 2012). Yang et al.(2011) conducted an experimental investigation on themechanical behaviour of coarse marble, under differentloading conditions, using the linear Mohr-Coulomb criterionto confirm the strength parameters (cohesion, C and internalfriction angle, φ). However, as mentioned above, limitedstudies were performed to estimate C and φ using the BT andits confirmation with the Mohr-Coulomb criterion, which iswidely accepted and used in the literature.
The purpose of the present study is to correlate C, φ, andUCS of rock samples with BT values; to develop empiricalequations for UCS, C and φ using the BT; and to confirm thepredicted UCS and C with measured UCS and C valuesobtained from direct methods i.e. the Mohr-Coulomb criterionor triaxial compressive test.
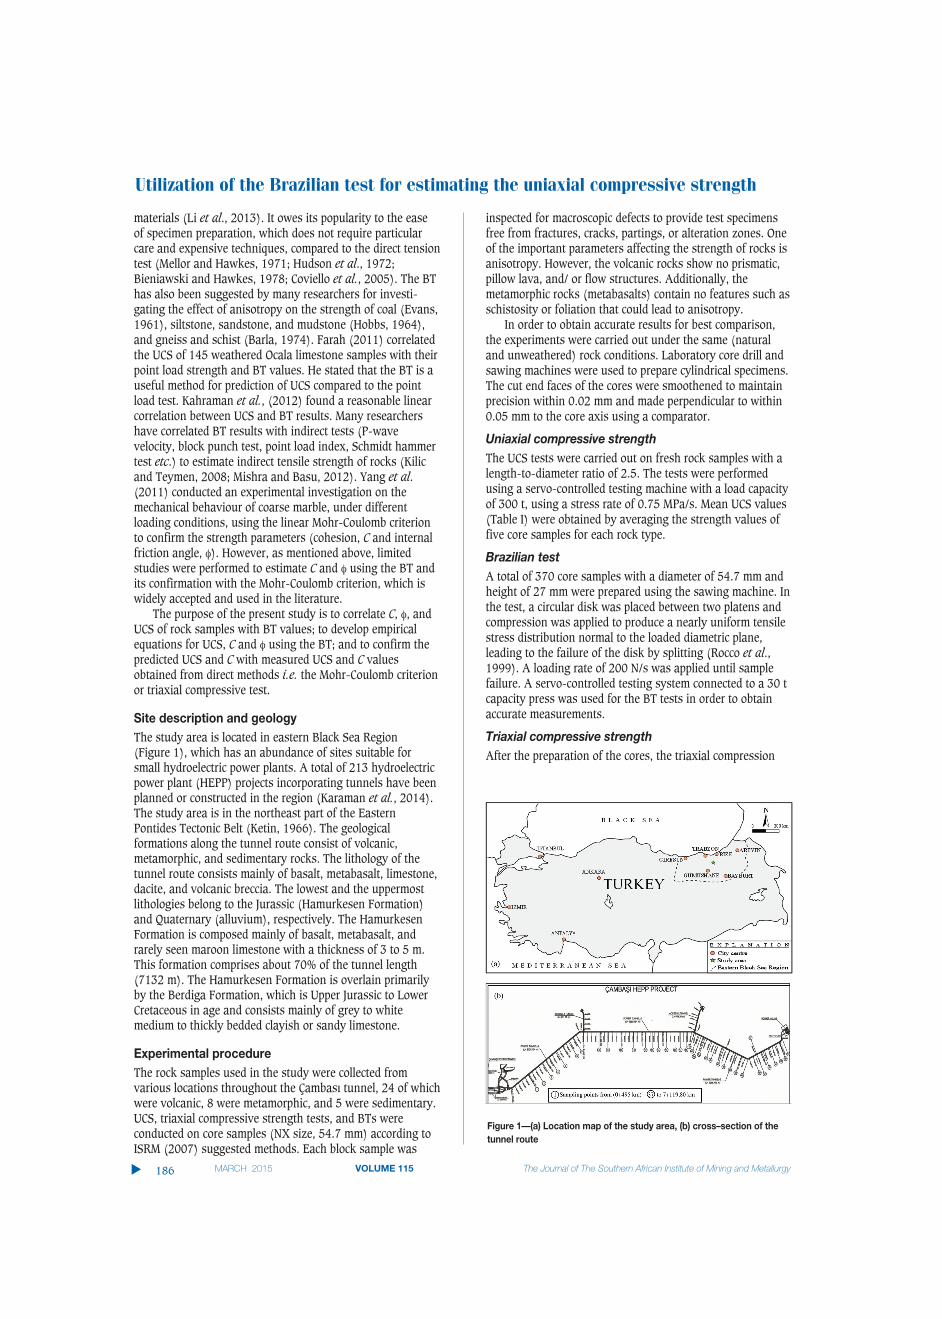
Site description and geologyThe study area is located in eastern Black Sea Region (Figure 1), which has an abundance of sites suitable forsmall hydroelectric power plants. A total of 213 hydroelectricpower plant (HEPP) projects incorporating tunnels have beenplanned or constructed in the region (Karaman et al., 2014).The study area is in the northeast part of the EasternPontides Tectonic Belt (Ketin, 1966). The geologicalformations along the tunnel route consist of volcanic,metamorphic, and sedimentary rocks. The lithology of thetunnel route consists mainly of basalt, metabasalt, limestone,dacite, and volcanic breccia. The lowest and the uppermostlithologies belong to the Jurassic (Hamurkesen Formation)and Quaternary (alluvium), respectively. The HamurkesenFormation is composed mainly of basalt, metabasalt, andrarely seen maroon limestone with a thickness of 3 to 5 m.This formation comprises about 70% of the tunnel length(7132 m). The Hamurkesen Formation is overlain primarilyby the Berdiga Formation, which is Upper Jurassic to LowerCretaceous in age and consists mainly of grey to whitemedium to thickly bedded clayish or sandy limestone.
Experimental procedureThe rock samples used in the study were collected fromvarious locations throughout the Çambası tunnel, 24 of whichwere volcanic, 8 were metamorphic, and 5 were sedimentary.UCS, triaxial compressive strength tests, and BTs wereconducted on core samples (NX size, 54.7 mm) according toISRM (2007) suggested methods. Each block sample was
inspected for macroscopic defects to provide test specimensfree from fractures, cracks, partings, or alteration zones. Oneof the important parameters affecting the strength of rocks isanisotropy. However, the volcanic rocks show no prismatic,pillow lava, and/ or flow structures. Additionally, themetamorphic rocks (metabasalts) contain no features such asschistosity or foliation that could lead to anisotropy.
In order to obtain accurate results for best comparison,the experiments were carried out under the same (naturaland unweathered) rock conditions. Laboratory core drill andsawing machines were used to prepare cylindrical specimens.The cut end faces of the cores were smoothened to maintainprecision within 0.02 mm and made perpendicular to within0.05 mm to the core axis using a comparator.
Uniaxial compressive strengthThe UCS tests were carried out on fresh rock samples with alength-to-diameter ratio of 2.5. The tests were performedusing a servo-controlled testing machine with a load capacityof 300 t, using a stress rate of 0.75 MPa/s. Mean UCS values(Table I) were obtained by averaging the strength values offive core samples for each rock type.
Brazilian testA total of 370 core samples with a diameter of 54.7 mm andheight of 27 mm were prepared using the sawing machine. Inthe test, a circular disk was placed between two platens andcompression was applied to produce a nearly uniform tensilestress distribution normal to the loaded diametric plane,leading to the failure of the disk by splitting (Rocco et al.,1999). A loading rate of 200 N/s was applied until samplefailure. A servo-controlled testing system connected to a 30 tcapacity press was used for the BT tests in order to obtainaccurate measurements.
Triaxial compressive strengthAfter the preparation of the cores, the triaxial compression
�
186 MARCH 2015 VOLUME 115 The Journal of The Southern African Institute of Mining and Metallurgy
Figure 1—(a) Location map of the study area, (b) cross–section of thetunnel route
tests for each rock sample were carried out using a servo-controlled testing machine with a servo-lateral pressure unithaving a load capacity of 30 MPa. The confining fluidpressure around the cylindrical specimen was kept constantwhile the axial compressive load was raised until failureoccurred. A Hoek cell unit with a diameter of 54 mm andheight of 108 mm was used to apply the required confiningfluid pressure. Six samples were used for triaxial compressivestrength under three different lateral confining pressures;5–15 MPa for each rock type. Shear envelopes of the rocksamples were then drawn to obtain shear strengthparameters (C and φ) by plotting the Mohr circles. A total of222 core samples were subjected to triaxial compressiontesting.
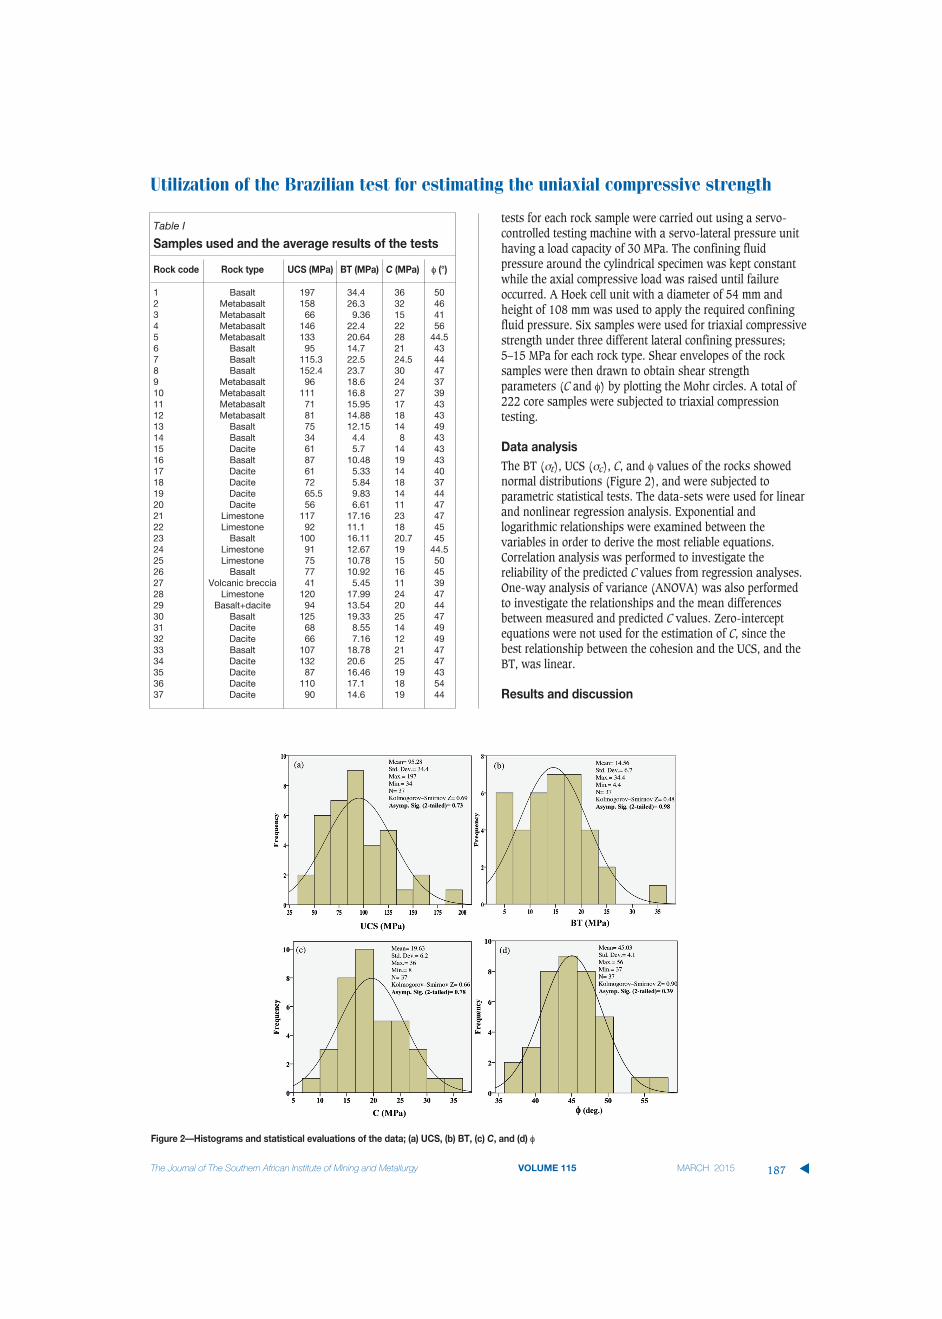
Data analysis The BT (σt), UCS (σc), C, and φ values of the rocks showednormal distributions (Figure 2), and were subjected toparametric statistical tests. The data-sets were used for linearand nonlinear regression analysis. Exponential andlogarithmic relationships were examined between thevariables in order to derive the most reliable equations.Correlation analysis was performed to investigate thereliability of the predicted C values from regression analyses.One-way analysis of variance (ANOVA) was also performedto investigate the relationships and the mean differencesbetween measured and predicted C values. Zero-interceptequations were not used for the estimation of C, since thebest relationship between the cohesion and the UCS, and theBT, was linear.
Results and discussion
Utilization of the Brazilian test for estimating the uniaxial compressive strength
187The Journal of The Southern African Institute of Mining and Metallurgy VOLUME 115 MARCH 2015 �
Table I
Samples used and the average results of the tests
Rock code Rock type UCS (MPa) BT (MPa) C (MPa) φ (°)
1 Basalt 197 34.4 36 502 Metabasalt 158 26.3 32 463 Metabasalt 66 9.36 15 414 Metabasalt 146 22.4 22 565 Metabasalt 133 20.64 28 44.56 Basalt 95 14.7 21 437 Basalt 115.3 22.5 24.5 448 Basalt 152.4 23.7 30 479 Metabasalt 96 18.6 24 3710 Metabasalt 111 16.8 27 3911 Metabasalt 71 15.95 17 4312 Metabasalt 81 14.88 18 4313 Basalt 75 12.15 14 4914 Basalt 34 4.4 8 4315 Dacite 61 5.7 14 4316 Basalt 87 10.48 19 4317 Dacite 61 5.33 14 4018 Dacite 72 5.84 18 3719 Dacite 65.5 9.83 14 4420 Dacite 56 6.61 11 4721 Limestone 117 17.16 23 4722 Limestone 92 11.1 18 4523 Basalt 100 16.11 20.7 4524 Limestone 91 12.67 19 44.525 Limestone 75 10.78 15 5026 Basalt 77 10.92 16 4527 Volcanic breccia 41 5.45 11 3928 Limestone 120 17.99 24 4729 Basalt+dacite 94 13.54 20 4430 Basalt 125 19.33 25 4731 Dacite 68 8.55 14 4932 Dacite 66 7.16 12 4933 Basalt 107 18.78 21 4734 Dacite 132 20.6 25 4735 Dacite 87 16.46 19 4336 Dacite 110 17.1 18 5437 Dacite 90 14.6 19 44
Figure 2—Histograms and statistical evaluations of the data; (a) UCS, (b) BT, (c) C, and (d) φ
Utilization of the Brazilian test for estimating the uniaxial compressive strength
Strength properties of intact rocksFrom the average results for the samples, which aresummarized in Table I, the UCS values of the tested rockswere classified according to the strength classification ofintact rock by Deere and Miller (1966) (Table II). Volcanic,metamorphic, and sedimentary rocks were individuallyevaluated according to the UCS classification. As shown inTable II, 56.8% of the rocks were classified as ‘moderatelyhard rock’ and 37.8% as ‘hard rock’. A ‘weak rock’ classifi-cation was obtained only for volcanic rocks at two pointsalong the tunnel route.
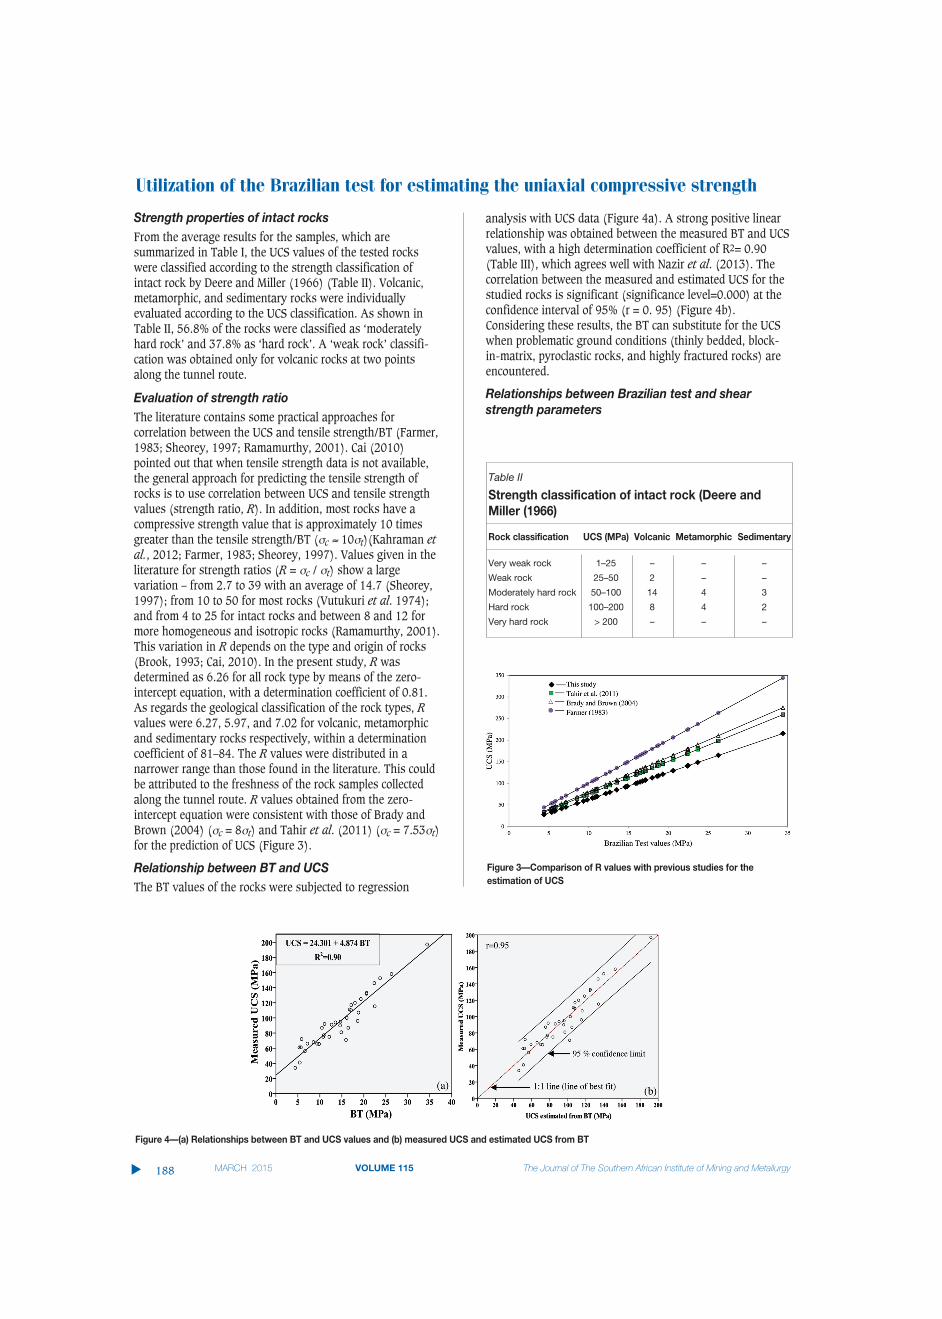
Evaluation of strength ratio The literature contains some practical approaches forcorrelation between the UCS and tensile strength/BT (Farmer,1983; Sheorey, 1997; Ramamurthy, 2001). Cai (2010)pointed out that when tensile strength data is not available,the general approach for predicting the tensile strength ofrocks is to use correlation between UCS and tensile strengthvalues (strength ratio, R). In addition, most rocks have acompressive strength value that is approximately 10 timesgreater than the tensile strength/BT (σc ≈ 10σt)(Kahraman etal., 2012; Farmer, 1983; Sheorey, 1997). Values given in theliterature for strength ratios (R = σc / σt) show a largevariation – from 2.7 to 39 with an average of 14.7 (Sheorey,1997); from 10 to 50 for most rocks (Vutukuri et al. 1974);and from 4 to 25 for intact rocks and between 8 and 12 formore homogeneous and isotropic rocks (Ramamurthy, 2001).This variation in R depends on the type and origin of rocks(Brook, 1993; Cai, 2010). In the present study, R wasdetermined as 6.26 for all rock type by means of the zero-intercept equation, with a determination coefficient of 0.81.As regards the geological classification of the rock types, Rvalues were 6.27, 5.97, and 7.02 for volcanic, metamorphicand sedimentary rocks respectively, within a determinationcoefficient of 81–84. The R values were distributed in anarrower range than those found in the literature. This couldbe attributed to the freshness of the rock samples collectedalong the tunnel route. R values obtained from the zero-intercept equation were consistent with those of Brady andBrown (2004) (σc = 8σt) and Tahir et al. (2011) (σc = 7.53σt)for the prediction of UCS (Figure 3).
Relationship between BT and UCS The BT values of the rocks were subjected to regression
analysis with UCS data (Figure 4a). A strong positive linearrelationship was obtained between the measured BT and UCSvalues, with a high determination coefficient of R2= 0.90(Table III), which agrees well with Nazir et al. (2013). Thecorrelation between the measured and estimated UCS for thestudied rocks is significant (significance level=0.000) at theconfidence interval of 95% (r = 0. 95) (Figure 4b).Considering these results, the BT can substitute for the UCSwhen problematic ground conditions (thinly bedded, block-in-matrix, pyroclastic rocks, and highly fractured rocks) areencountered.
Relationships between Brazilian test and shearstrength parameters
�
188 MARCH 2015 VOLUME 115 The Journal of The Southern African Institute of Mining and Metallurgy
Figure 3—Comparison of R values with previous studies for theestimation of UCS
Figure 4—(a) Relationships between BT and UCS values and (b) measured UCS and estimated UCS from BT
Table II
Strength classification of intact rock (Deere andMiller (1966)
Rock classification UCS (MPa) Volcanic Metamorphic Sedimentary
Very weak rock 1–25 – – –
Weak rock 25–50 2 – –
Moderately hard rock 50–100 14 4 3
Hard rock 100–200 8 4 2
Very hard rock > 200 – – –
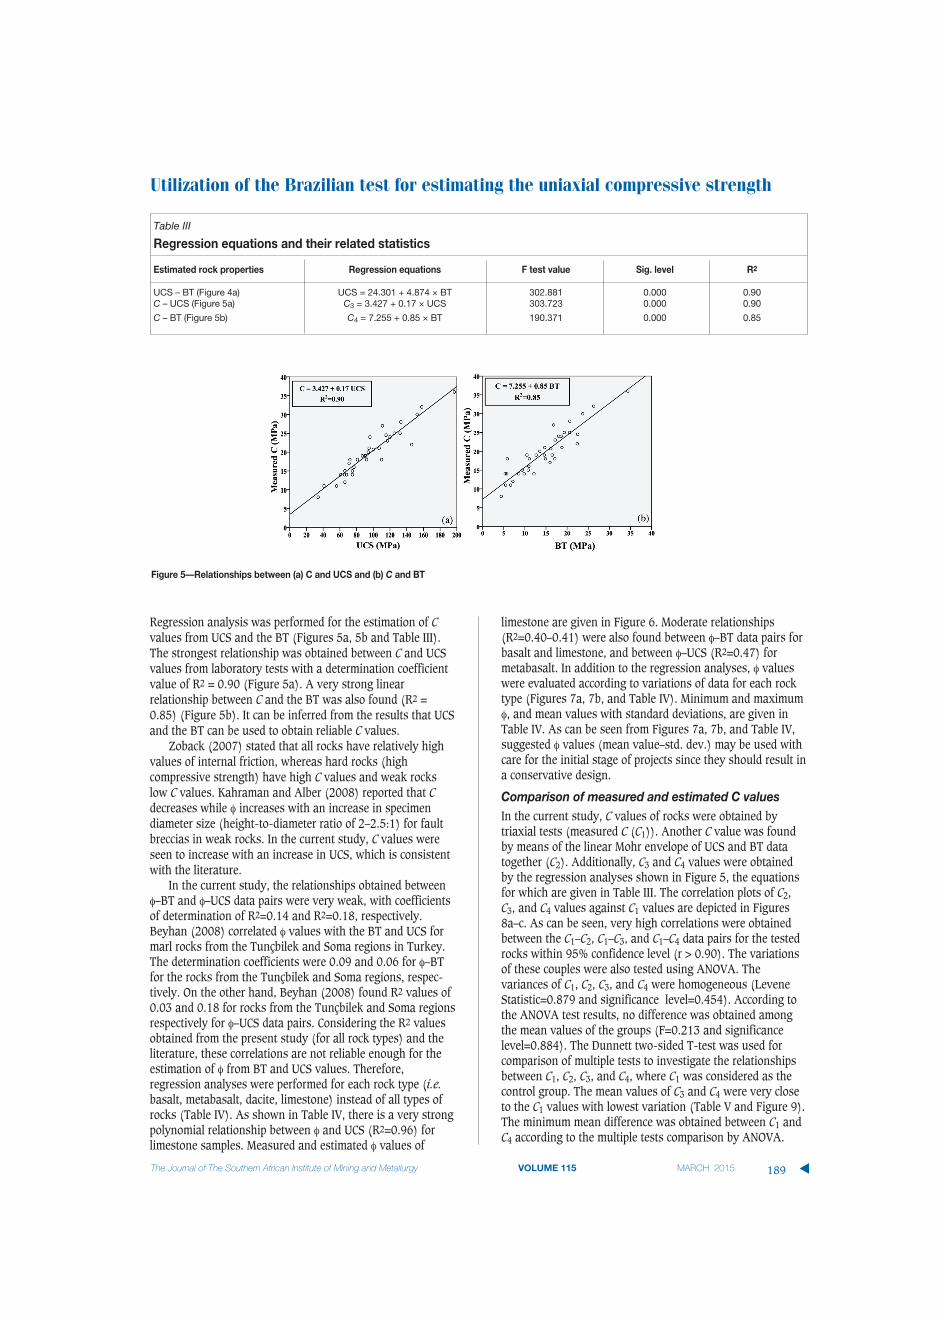
Regression analysis was performed for the estimation of Cvalues from UCS and the BT (Figures 5a, 5b and Table III).The strongest relationship was obtained between C and UCSvalues from laboratory tests with a determination coefficientvalue of R2 = 0.90 (Figure 5a). A very strong linearrelationship between C and the BT was also found (R2 =0.85) (Figure 5b). It can be inferred from the results that UCSand the BT can be used to obtain reliable C values.
Zoback (2007) stated that all rocks have relatively highvalues of internal friction, whereas hard rocks (highcompressive strength) have high C values and weak rockslow C values. Kahraman and Alber (2008) reported that Cdecreases while φ increases with an increase in specimendiameter size (height-to-diameter ratio of 2–2.5:1) for faultbreccias in weak rocks. In the current study, C values wereseen to increase with an increase in UCS, which is consistentwith the literature.
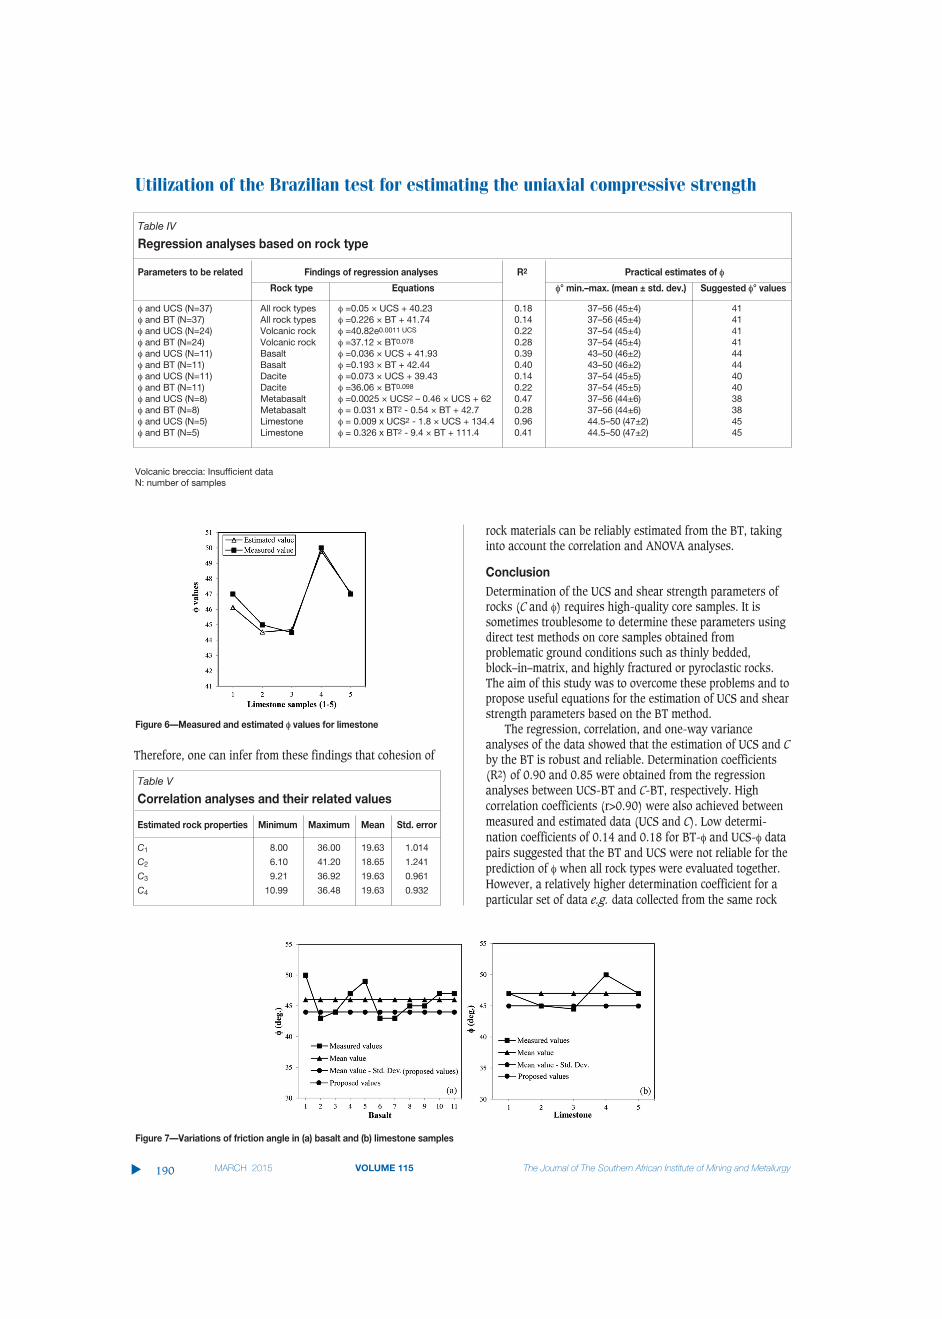
In the current study, the relationships obtained betweenφ–BT and φ–UCS data pairs were very weak, with coefficientsof determination of R2=0.14 and R2=0.18, respectively.Beyhan (2008) correlated φ values with the BT and UCS formarl rocks from the Tunçbilek and Soma regions in Turkey.The determination coefficients were 0.09 and 0.06 for φ–BTfor the rocks from the Tunçbilek and Soma regions, respec-tively. On the other hand, Beyhan (2008) found R2 values of0.03 and 0.18 for rocks from the Tunçbilek and Soma regionsrespectively for φ–UCS data pairs. Considering the R2 valuesobtained from the present study (for all rock types) and theliterature, these correlations are not reliable enough for theestimation of φ from BT and UCS values. Therefore,regression analyses were performed for each rock type (i.e.basalt, metabasalt, dacite, limestone) instead of all types ofrocks (Table IV). As shown in Table IV, there is a very strongpolynomial relationship between φ and UCS (R2=0.96) forlimestone samples. Measured and estimated φ values of
limestone are given in Figure 6. Moderate relationships(R2=0.40–0.41) were also found between φ–BT data pairs forbasalt and limestone, and between φ–UCS (R2=0.47) formetabasalt. In addition to the regression analyses, φ valueswere evaluated according to variations of data for each rocktype (Figures 7a, 7b, and Table IV). Minimum and maximumφ, and mean values with standard deviations, are given inTable IV. As can be seen from Figures 7a, 7b, and Table IV,suggested φ values (mean value–std. dev.) may be used withcare for the initial stage of projects since they should result ina conservative design.
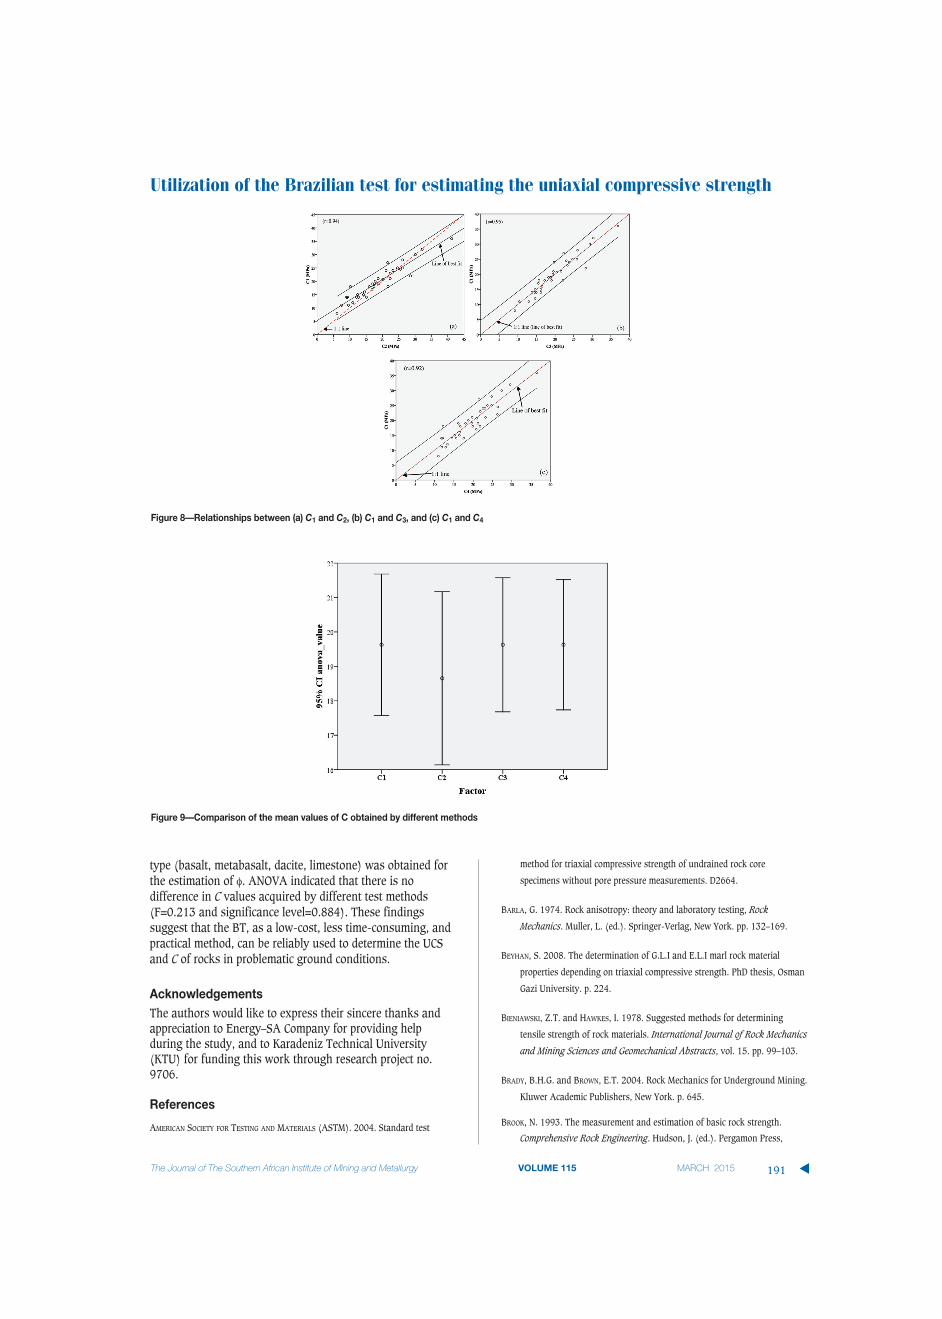
Comparison of measured and estimated C valuesIn the current study, C values of rocks were obtained bytriaxial tests (measured C (C1)). Another C value was foundby means of the linear Mohr envelope of UCS and BT datatogether (C2). Additionally, C3 and C4 values were obtainedby the regression analyses shown in Figure 5, the equationsfor which are given in Table III. The correlation plots of C2,C3, and C4 values against C1 values are depicted in Figures8a–c. As can be seen, very high correlations were obtainedbetween the C1–C2, C1–C3, and C1–C4 data pairs for the testedrocks within 95% confidence level (r > 0.90). The variationsof these couples were also tested using ANOVA. Thevariances of C1, C2, C3, and C4 were homogeneous (LeveneStatistic=0.879 and significance level=0.454). According tothe ANOVA test results, no difference was obtained amongthe mean values of the groups (F=0.213 and significancelevel=0.884). The Dunnett two-sided T-test was used forcomparison of multiple tests to investigate the relationshipsbetween C1, C2, C3, and C4, where C1 was considered as thecontrol group. The mean values of C3 and C4 were very closeto the C1 values with lowest variation (Table V and Figure 9).The minimum mean difference was obtained between C1 andC4 according to the multiple tests comparison by ANOVA.
Utilization of the Brazilian test for estimating the uniaxial compressive strength
The Journal of The Southern African Institute of Mining and Metallurgy VOLUME 115 MARCH 2015 189 �
Table III
Regression equations and their related statistics
Estimated rock properties Regression equations F test value Sig. level R2
UCS – BT (Figure 4a) UCS = 24.301 + 4.874 × BT 302.881 0.000 0.90C – UCS (Figure 5a) C3 = 3.427 + 0.17 × UCS 303.723 0.000 0.90
C – BT (Figure 5b) C4 = 7.255 + 0.85 × BT 190.371 0.000 0.85
Figure 5—Relationships between (a) C and UCS and (b) C and BT
Utilization of the Brazilian test for estimating the uniaxial compressive strength
Therefore, one can infer from these findings that cohesion of
rock materials can be reliably estimated from the BT, takinginto account the correlation and ANOVA analyses.
Conclusion Determination of the UCS and shear strength parameters ofrocks (C and φ) requires high-quality core samples. It issometimes troublesome to determine these parameters usingdirect test methods on core samples obtained fromproblematic ground conditions such as thinly bedded,block–in–matrix, and highly fractured or pyroclastic rocks.The aim of this study was to overcome these problems and topropose useful equations for the estimation of UCS and shearstrength parameters based on the BT method.
The regression, correlation, and one-way varianceanalyses of the data showed that the estimation of UCS and Cby the BT is robust and reliable. Determination coefficients(R2) of 0.90 and 0.85 were obtained from the regressionanalyses between UCS-BT and C-BT, respectively. High correlation coefficients (r>0.90) were also achieved betweenmeasured and estimated data (UCS and C). Low determi-nation coefficients of 0.14 and 0.18 for BT-φ and UCS-φ datapairs suggested that the BT and UCS were not reliable for theprediction of φ when all rock types were evaluated together.However, a relatively higher determination coefficient for aparticular set of data e.g. data collected from the same rock
�
190 MARCH 2015 VOLUME 115 The Journal of The Southern African Institute of Mining and Metallurgy
Figure 6—Measured and estimated φ values for limestone
Figure 7—Variations of friction angle in (a) basalt and (b) limestone samples
Table V
Correlation analyses and their related values
Estimated rock properties Minimum Maximum Mean Std. error
C1 8.00 36.00 19.63 1.014
C2 6.10 41.20 18.65 1.241
C3 9.21 36.92 19.63 0.961
C4 10.99 36.48 19.63 0.932
Table IV
Regression analyses based on rock type
Parameters to be related Findings of regression analyses R2 Practical estimates of φ
Rock type Equations φ° min.–max. (mean ± std. dev.) Suggested φ° values
φ and UCS (N=37) All rock types φ =0.05 × UCS + 40.23 0.18 37–56 (45±4) 41φ and BT (N=37) All rock types φ =0.226 × BT + 41.74 0.14 37–56 (45±4) 41φ and UCS (N=24) Volcanic rock φ =40.82e0.0011 UCS 0.22 37–54 (45±4) 41φ and BT (N=24) Volcanic rock φ =37.12 × BT0.078 0.28 37–54 (45±4) 41φ and UCS (N=11) Basalt φ =0.036 × UCS + 41.93 0.39 43–50 (46±2) 44φ and BT (N=11) Basalt φ =0.193 × BT + 42.44 0.40 43–50 (46±2) 44φ and UCS (N=11) Dacite φ =0.073 × UCS + 39.43 0.14 37–54 (45±5) 40φ and BT (N=11) Dacite φ =36.06 × BT0.098 0.22 37–54 (45±5) 40φ and UCS (N=8) Metabasalt φ =0.0025 × UCS2 – 0.46 × UCS + 62 0.47 37–56 (44±6) 38φ and BT (N=8) Metabasalt φ = 0.031 x BT2 - 0.54 × BT + 42.7 0.28 37–56 (44±6) 38φ and UCS (N=5) Limestone φ = 0.009 x UCS2 - 1.8 × UCS + 134.4 0.96 44.5–50 (47±2) 45φ and BT (N=5) Limestone φ = 0.326 x BT2 - 9.4 × BT + 111.4 0.41 44.5–50 (47±2) 45
Volcanic breccia: Insufficient dataN: number of samples
type (basalt, metabasalt, dacite, limestone) was obtained forthe estimation of φ. ANOVA indicated that there is nodifference in C values acquired by different test methods(F=0.213 and significance level=0.884). These findingssuggest that the BT, as a low-cost, less time-consuming, andpractical method, can be reliably used to determine the UCSand C of rocks in problematic ground conditions.
AcknowledgementsThe authors would like to express their sincere thanks andappreciation to Energy–SA Company for providing helpduring the study, and to Karadeniz Technical University(KTU) for funding this work through research project no.9706.
References
AMERICAN SOCIETY FOR TESTING AND MATERIALS (ASTM). 2004. Standard test
method for triaxial compressive strength of undrained rock core
specimens without pore pressure measurements. D2664.
BARLA, G. 1974. Rock anisotropy: theory and laboratory testing, Rock
Mechanics. Muller, L. (ed.). Springer-Verlag, New York. pp. 132–169.
BEYHAN, S. 2008. The determination of G.L.I and E.L.I marl rock material
properties depending on triaxial compressive strength. PhD thesis, Osman
Gazi University. p. 224.
BIENIAWSKI, Z.T. and HAWKES, I. 1978. Suggested methods for determining
tensile strength of rock materials. International Journal of Rock Mechanics
and Mining Sciences and Geomechanical Abstracts, vol. 15. pp. 99–103.
BRADY, B.H.G. and BROWN, E.T. 2004. Rock Mechanics for Underground Mining.
Kluwer Academic Publishers, New York. p. 645.
BROOK, N. 1993. The measurement and estimation of basic rock strength.
Comprehensive Rock Engineering. Hudson, J. (ed.). Pergamon Press,
Utilization of the Brazilian test for estimating the uniaxial compressive strength
The Journal of The Southern African Institute of Mining and Metallurgy VOLUME 115 MARCH 2015 191 �Figure 9—Comparison of the mean values of C obtained by different methods
Figure 8—Relationships between (a) C1 and C2, (b) C1 and C3, and (c) C1 and C4
Utilization of the Brazilian test for estimating the uniaxial compressive strength
Oxford. vol. 3. pp 41–66.
BRUNO, G., VESSIA, G., and BOBBO, L. 2012. Statistical method for assessing the
uniaxial compressive strength of carbonate rock by Schmidt hammer tests
performed on core samples. Rock Mechanics and Rock Engineering. DOI
10.1007/s00603-012-0230-5
CAI, M. 2010. Practical estimates of tensile strength and Hoek–Brown strength
parameter mi of brittle rocks. Rock Mechanics and Rock Engineering,
vol. 43. pp. 167–184.
COVIELLO, A., LAGIOIA, R., and NOVA, R. 2005. On the measurement of the tensile
strength of soft rocks. Rock Mechanics and Rock Engineering, vol. 38,
no. 4. pp. 251–273.
DEERE, D.U. and MILLER, R.P. 1966. Engineering classifications and index
properties for intact rock. Technical Report no. AFWL-TR 65-116, Air
Force Weapons Laboratory, Kirtland Air Force Base, New Mexico.
EVANS, I. 1961. The tensile strength of coal. Colliery Engineering, vol. 38.
pp. 428–34.
FARAH, R. 2011. Correlations between index properties and unconfined
compressive strength of weathered Ocala Limestone. MSc thesis,
University of North Florida School of Engineering. p. 83.
FARMER, I.W. 1983. Engineering Behavior of Rocks. Chapman and Hall,
London.
HOBBS, D.W. 1964. The strength and the stress-strain characteristics of coal in
triaxial compression. Journal of Geology, vol. 72. pp. 214–231.
HOEK, E. 1977. Rock mechanics laboratory testing in the context of a consulting
engineering organization. International Journal of Rock Mechanics and
Mining Sciences and Geomechanical Abstracts, vol. 14. pp. 93–101.
HUDSON, J.A., RUMMEL, F., and BROWN, E.T. 1972. The controlled failure of rock
disks and rings loaded in diametral compression: International Journal of
Rock Mechanics and Mining Sciences and Geomechanical Abstracts,
vol. 9. pp. 241–248.
INTERNATıONAL SOCıETY OF ROCK MECHANıCS (ISRM). 2007. The complete ISRM
suggested methods for rock characterization, testing and monitoring:
1974–2006. Suggested Methods prepared by the Commission on Testing
Methods, International Society for Rock Mechanics. Ulusay, R. and
Hudson, J.A. (eds.) ISRM Turkish National Group, Ankara, Turkey.
628 pp.
KAHRAMAN, S. 2001. Evaluation of simple methods for assessing the uniaxial
compressive strength of rock. International Journal of Rock Mechanics
and Mining Sciences and Geomechanical Abstracts, vol. 38, pp. 991–994.
KAHRAMAN, S. and ALBER, M. 2008. Triaxial strength of a fault breccia of weak
rocks in a strong matrix. Bulletin of Engineering Geology and the
Environment, vol. 67. pp. 435–441.
KAHRAMAN, S., FENER, M., and KOZMAN, E. 2012. Predicting the compressive and
tensile strength of rocks from indentation hardness index. Journal of the
Southern African Institute of Mining and Metallurgy, vol. 112.
pp. 331–339.
KARAMAN, K. and KESIMAL, A. 2015. Evaluation of the influence of porosity on
the engineering properties of rocks from the Eastern Black Sea Region: NE
Turkey. Arabian Journal of Geosciences, vol 8. pp. 557–564.
KARAMAN, K., KESIMAL, A., and ERSOY, H. 2014. A comparative assessment of
indirect methods for estimating the uniaxial compressive and tensile
strength of rocks. Arabian Journal of Geosciences. DOI 10.1007/s12517-
014-1384-0
KETIN, I. 1966. Tectonic units of Anatolia. Bulletin of the Mineral Research and
Exploration Institute of Turkey, vol. 66. pp. 22–34.
KILIC, A. and TEYMEN, A. 2008. Determination of mechanical properties of rocks
using simple methods. Bulletin of Engineering Geology and the
Environment, vol. 67. pp 237–244.
LI, D., NGAI, L., and WONG, Y. 2013. The Brazilian Disc test for rock mechanics
applications: review and new insights. Rock Mechanics and Rock
Engineering, vol. 46. pp. 269–287.
MELLOR, M. and HAWKES, I. 1971. Measurement of tensile strength by diametral
compression of discs and annuli. Engineering Geology, vol. 5.
pp. 173–225.
MISHRA, D.A. and BASU, A. 2012. Use of the block punch test to predict the
compressive and tensile strengths of rocks. International Journal of Rock
Mechanics and Mining Sciences and Geomechanical Abstracts, vol, 51.
pp. 119–127.
NAZIR, R., MOMENI, E., ARMAGHANI, D.J., and MOHDAMIN, M.F. 2013. Correlation
between unconfined compressive strength and indirect tensile strength of
limestone rock samples. Electronic Journal of Geotechnical Engineering,
vol. 18, no. 1. pp. 1737–1746.
RAMAMURTHY, T. 2001.Shear strength response of some geological materials in
triaxial compression. International Journal of Rock Mechanics and Mining
Sciences and Geomechanical Abstracts, vol. 38. pp. 683–697.
ROCCO, C., GUINEA, G.V., PLANAS, J., and ELICES, M. 1999. Mechanism of rupture
in splitting tests. ACI Materials Journal, vol. 96. pp. 52–60.
SHEOREY, P.R. 1997. Empirical Rock Failure Criteria. A.A. Balkema, Rotterdam.
p 176.
SINGH, M., RAJ, A., and SINGH, B. 2011. Modified Mohr–Coulomb criterion for
non-linear triaxial and polyaxial strength of intact rocks. International
Journal of Rock Mechanics and Mining Sciences and Geomechanical
Abstracts, vol. 48. pp. 546–555.
TAHIR, M., MOHAMMAD, N., and DIN, F. 2011. Strength parameters and their
inter-relationship for limestone of Cherat and Kohat areas of Khyber
Pakhtunkhwa. Journal of Himalayan Earth Sciences, vol. 44, no. 2.
pp. 45–51.
VUTUKURI, V.S., LAMA, R.D., and SALUJA, S.S. 1974. Handbook on Mechanical
Properties of Rocks. Vol. I—Testing Techniques and Results. Trans Tech
Publications. p. 280.
YANG, S.Q., JING, H.W., LI, Y.S., and HAN, L.J. 2011. Experimental investigation
on mechanical behavior of coarse marble under six different loading
paths. Experimental Mechanics, vol. 51. pp. 315–334.
ZOBACK, M.D. 2007. Reservoir Geomechanics: Earth Stress and Rock Mechanics
applied to Exploration, Production and Wellbore Stability. Cambridge
Press. p. 449. �
�
192 MARCH 2015 VOLUME 115 The Journal of The Southern African Institute of Mining and Metallurgy