Embed Size (px)
Citation preview
Unrestricted © Siemens AG 2017 Realize innovation.
Realistic and customercorrelated test schedules
Unrestricted © Siemens AG 20172017.05.22Page 2 Siemens PLM Software
Need for durability engineeringHow to capitalize on these implications ?
Unrestricted © Siemens AG 20172017.05.22Page 3 Siemens PLM Software
Unrestricted © Siemens AG 20172017.05.22Page 4 Siemens PLM Software
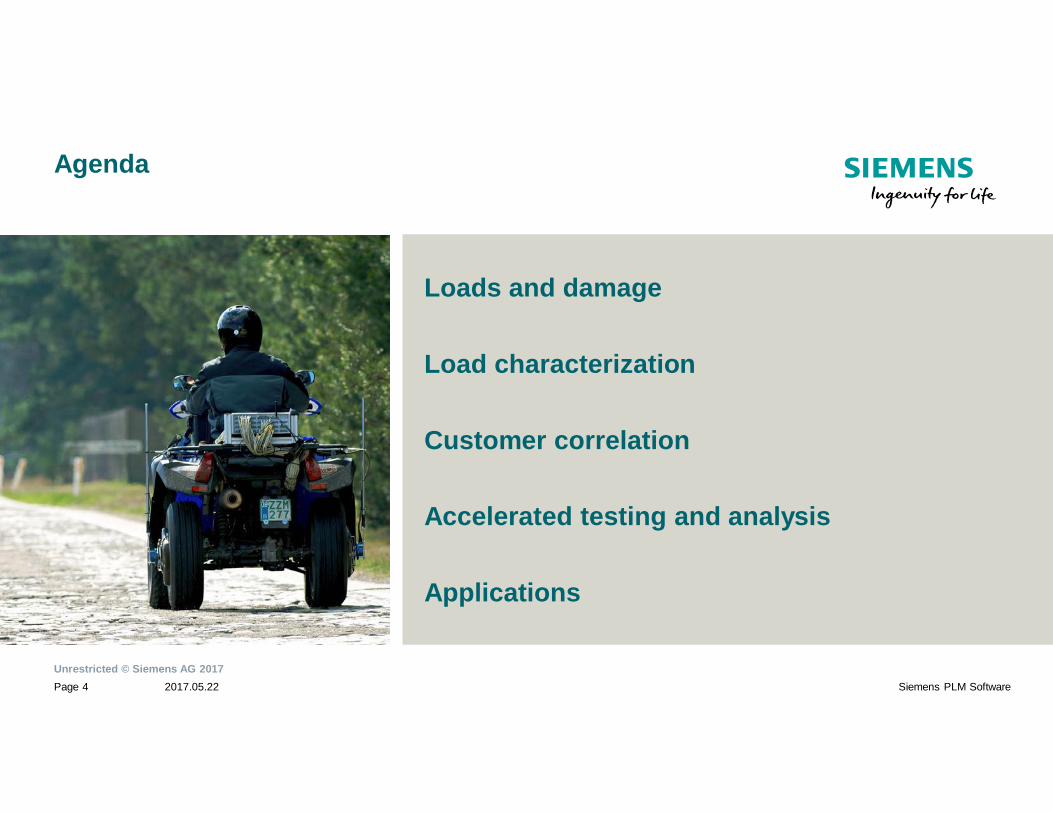
Agenda
Loads and damage
Load characterization
Customer correlation
Accelerated testing and analysis
Applications
Unrestricted © Siemens AG 20172017.05.22Page 5 Siemens PLM Software
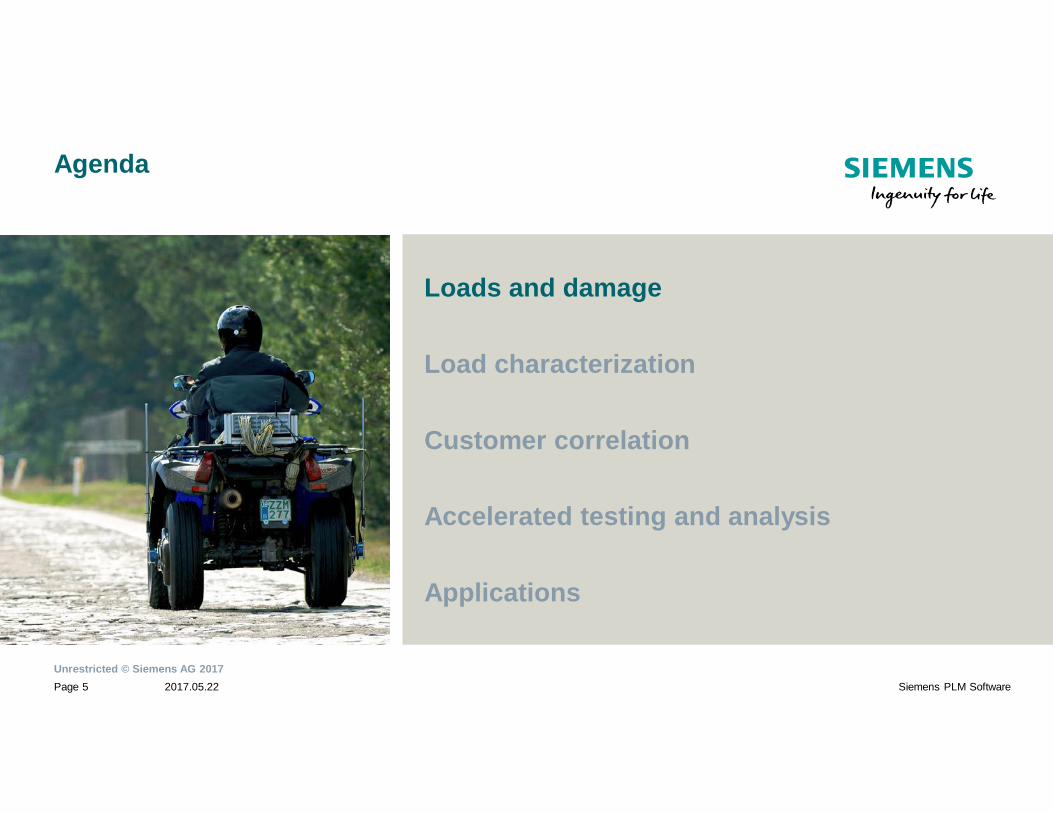
Agenda
Loads and damage
Load characterization
Customer correlation
Accelerated testing and analysis
Applications
Unrestricted © Siemens AG 20172017.05.22Page 6 Siemens PLM Software
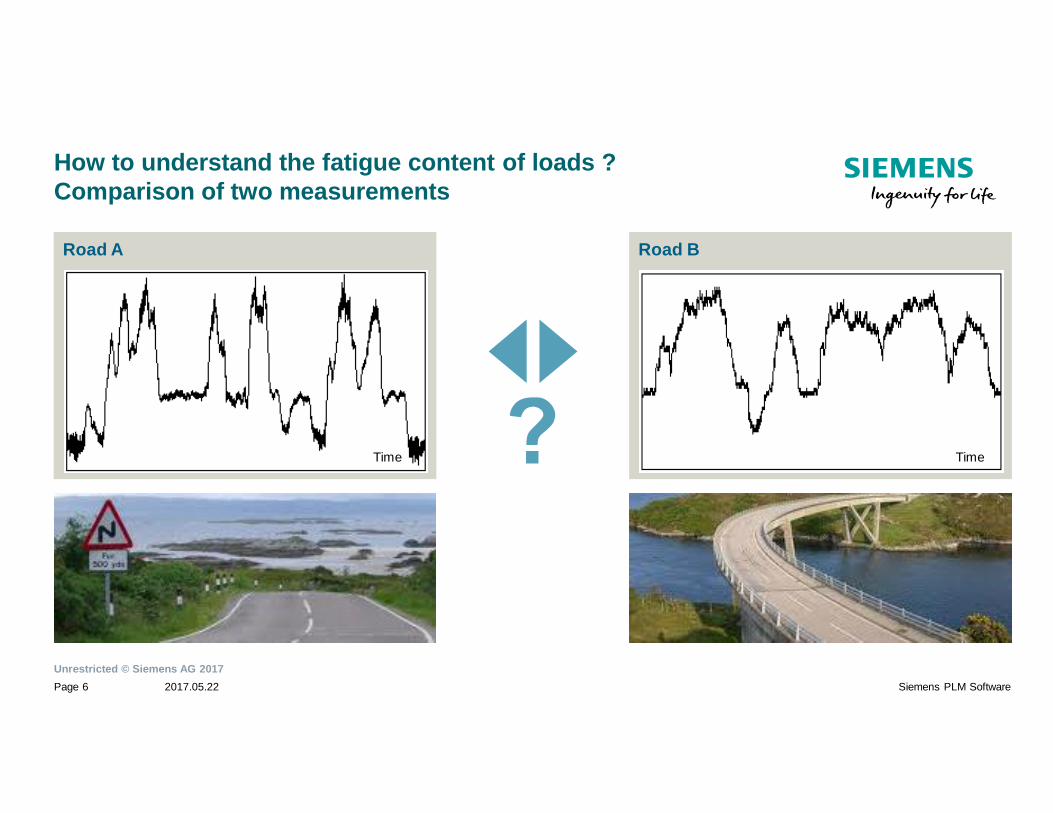
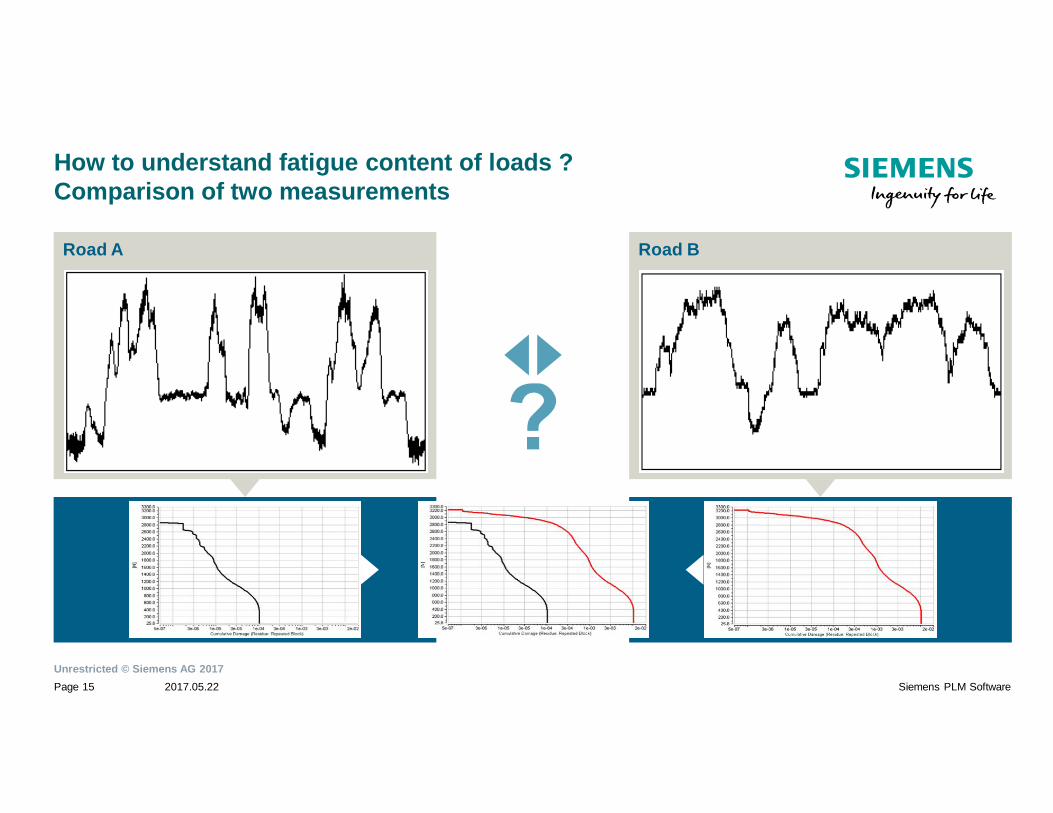
Road A
How to understand the fatigue content of loads ?Comparison of two measurements
Road B
Time Time

Unrestricted © Siemens AG 20172017.05.22Page 7 Siemens PLM Software
How to understand the fatigue content of loads ?Comparison of two measurements
Road A Road B
DamageDamage
Time Time
Unrestricted © Siemens AG 20172017.05.22Page 8 Siemens PLM Software
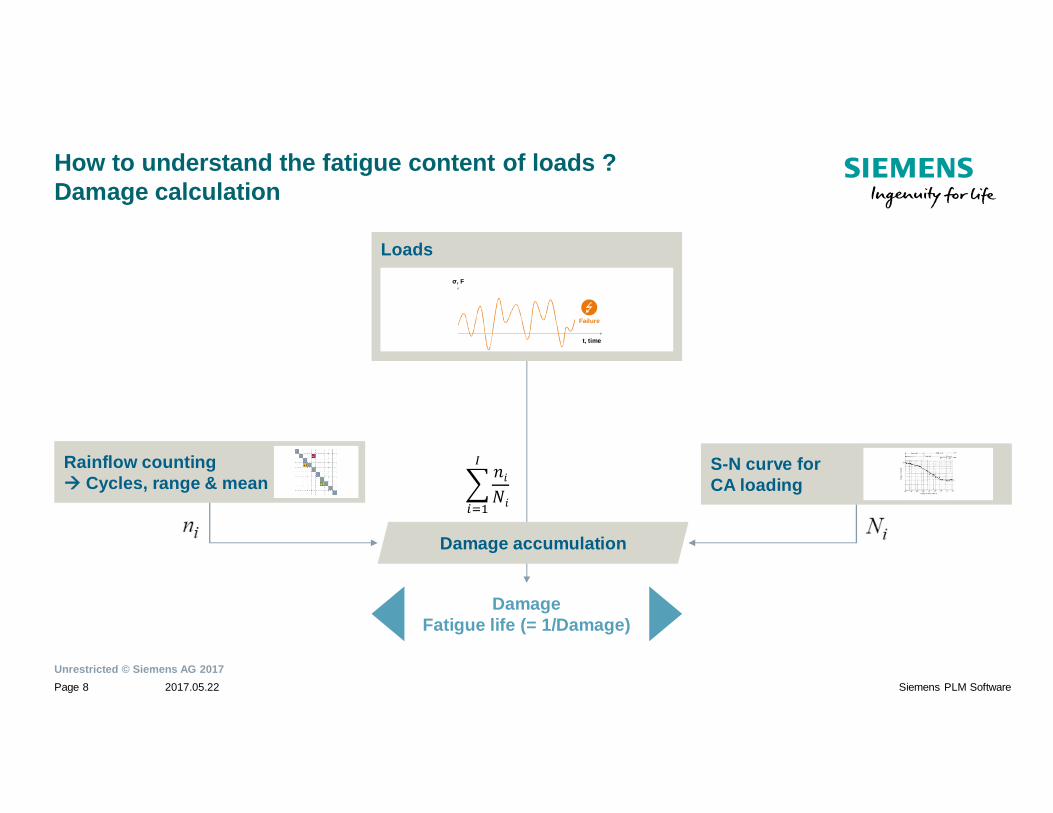
How to understand the fatigue content of loads ?Damage calculation
DamageFatigue life (= 1/Damage)
S-N curve forCA loading
Loads
Failure
t, time
, F
Rainflow countingCycles, range & mean
Damage accumulation
Unrestricted © Siemens AG 20172017.05.22Page 9 Siemens PLM Software
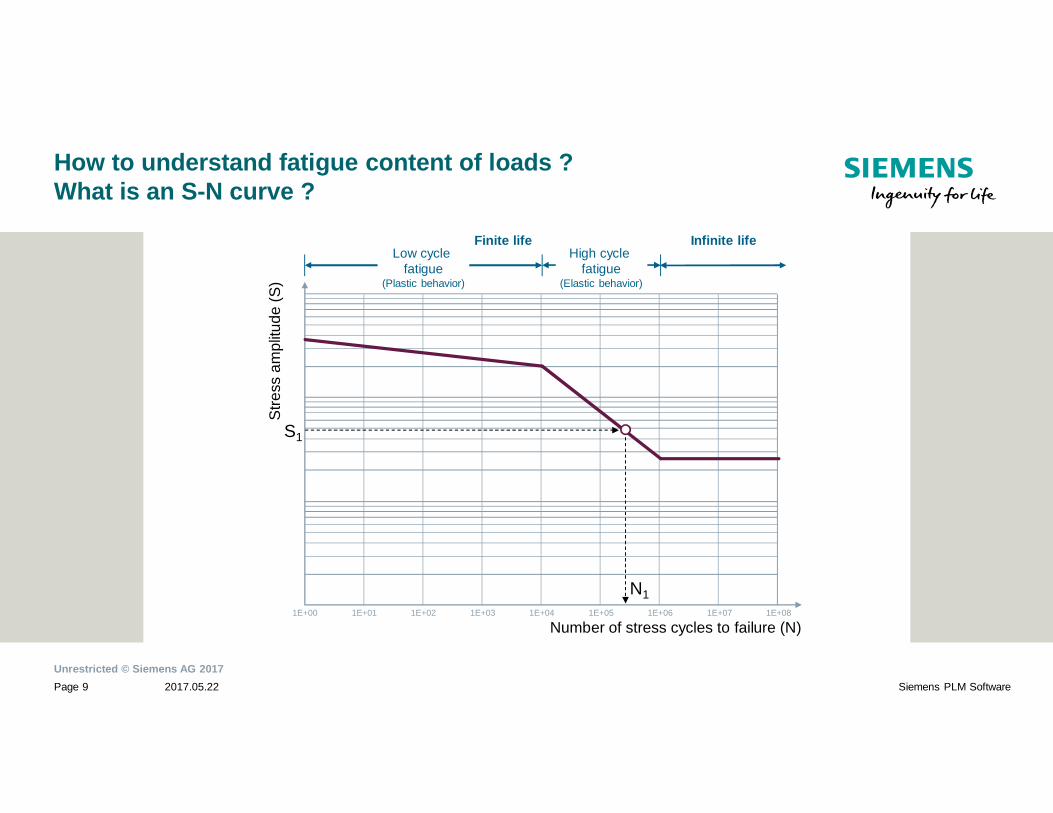
How to understand fatigue content of loads ?What is an S-N curve ?
Finite life Infinite lifeHigh cycle
fatigue(Elastic behavior)
Low cyclefatigue
(Plastic behavior)
Number of stress cycles to failure (N)
Stre
ssam
plitu
de(S
)
1E+00 1E+01 1E+02 1E+03 1E+04 1E+05 1E+06 1E+07 1E+08
N1
S1
Unrestricted © Siemens AG 20172017.05.22Page 10 Siemens PLM Software
10987654321
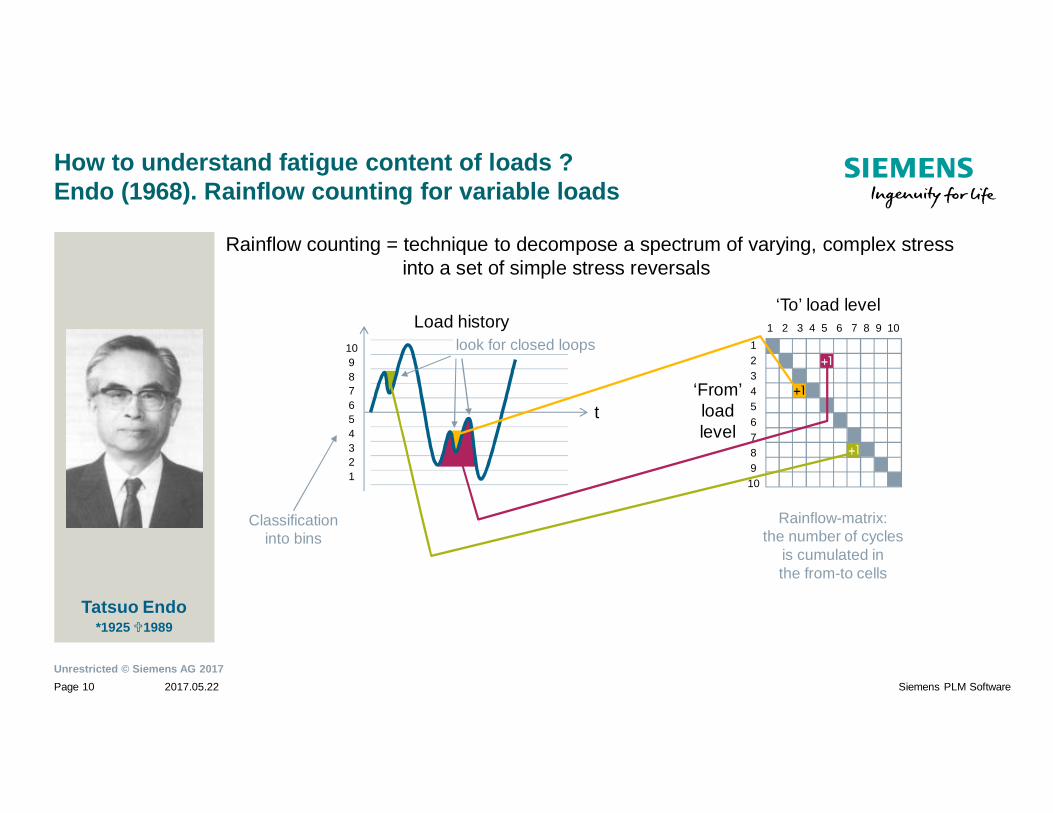
Classificationinto bins
How to understand fatigue content of loads ?Endo (1968). Rainflow counting for variable loads
Tatsuo Endo*1925 1989
Rainflow counting = technique to decompose a spectrum of varying, complex stressinto a set of simple stress reversals
‘From’loadlevel
‘To’ load level
12345678910
1 2 3 4 5 6 7 8 9 10
Rainflow-matrix:the number of cycles
is cumulated inthe from-to cells
Load history
t
look for closed loops
Unrestricted © Siemens AG 20172017.05.22Page 11 Siemens PLM Software
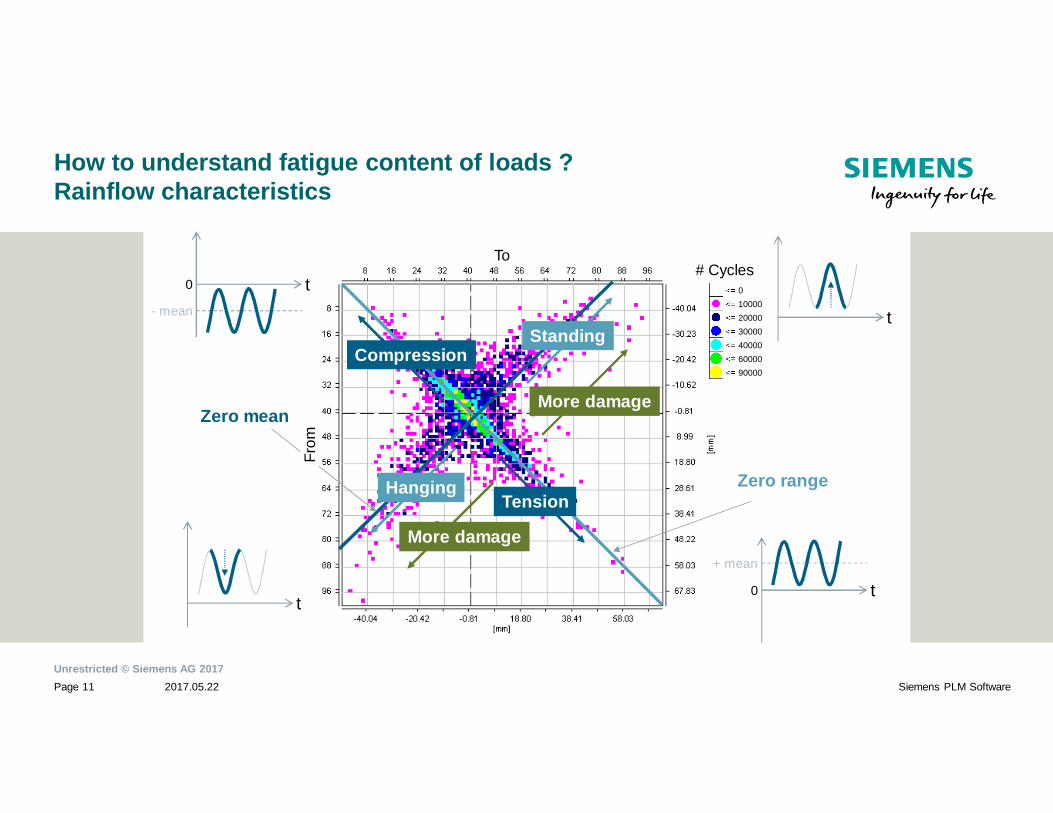
How to understand fatigue content of loads ?Rainflow characteristics
Zero range
Zero mean
Compression
Tension
Standing
Hanging
9000060000400003000020000100000
t
t0
- mean
t0
+ mean
t
More damage
More damage
To
From
# Cycles
Unrestricted © Siemens AG 20172017.05.22Page 12 Siemens PLM Software
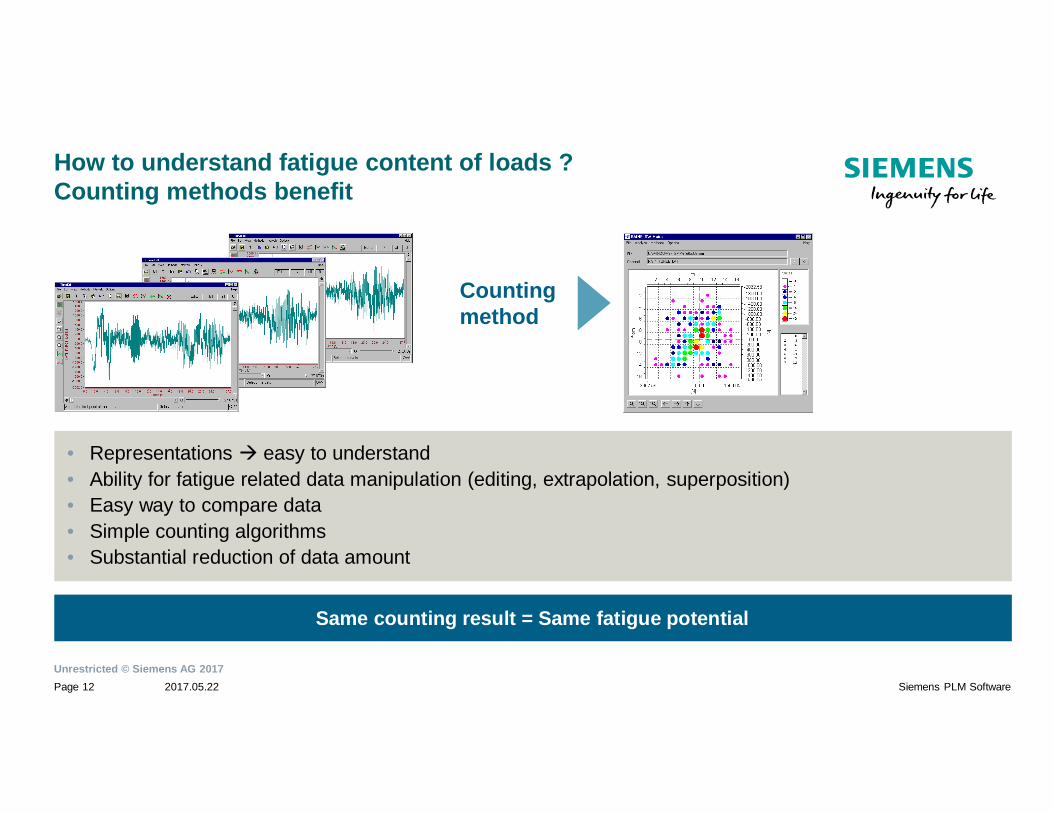
How to understand fatigue content of loads ?Counting methods benefit
• Representations easy to understand• Ability for fatigue related data manipulation (editing, extrapolation, superposition)• Easy way to compare data• Simple counting algorithms• Substantial reduction of data amount
Same counting result = Same fatigue potential
Countingmethod
Unrestricted © Siemens AG 20172017.05.22Page 13 Siemens PLM Software
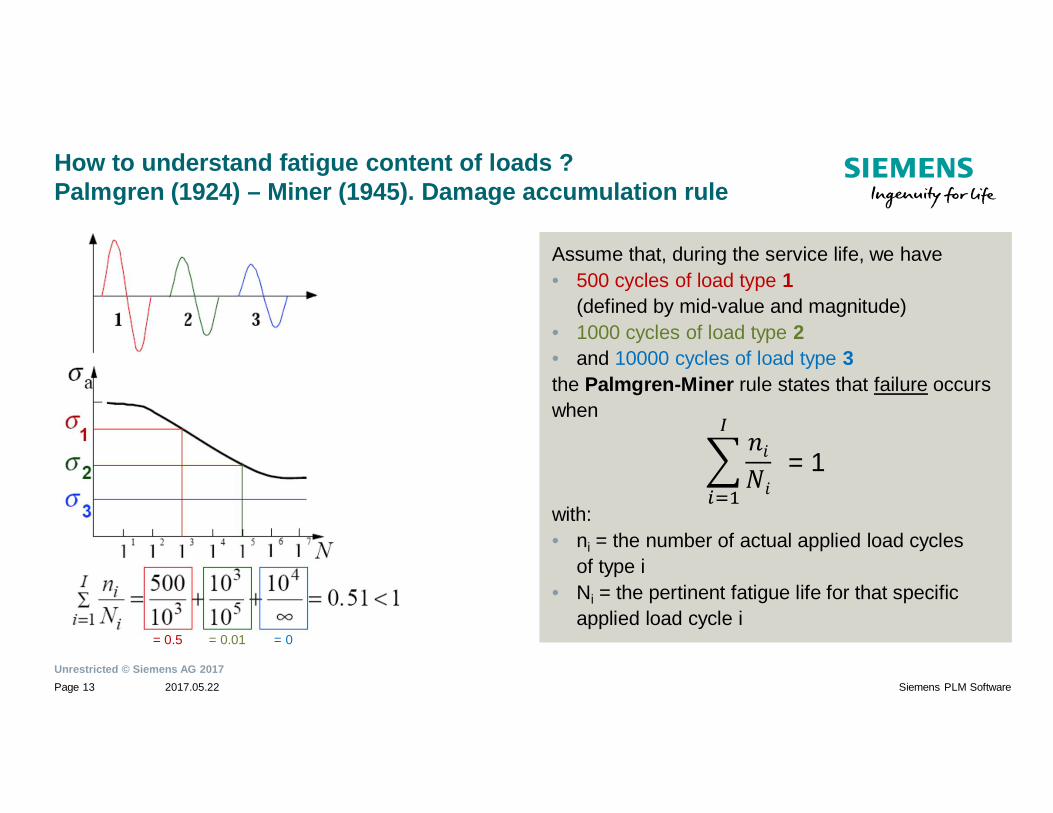
How to understand fatigue content of loads ?Palmgren (1924) – Miner (1945). Damage accumulation rule
Assume that, during the service life, we have• 500 cycles of load type 1
(defined by mid-value and magnitude)• 1000 cycles of load type 2• and 10000 cycles of load type 3the Palmgren-Miner rule states that failure occurswhen
with:• ni = the number of actual applied load cycles
of type i• Ni = the pertinent fatigue life for that specific
applied load cycle i
= 1
= 0.5 = 0.01 = 0

Unrestricted © Siemens AG 20172017.05.22Page 14 Siemens PLM Software
How to understand fatigue content of loads ?Rainflow Range-pair Damage Cumulative damage
Range-pair (cycle count)
4 0.9 1000.0300.0100.030.010.03.01.0Cycl e Count
184.1
11599.0
1000.0
2000.0
3000.0
4000.0
5000.0
6000.0
7000.0
8000.0
9000.0
10000.0
11000.0
[N]
File Channel Number of bins Lower Limi t Upper Limit Unit Hys teresis FilterD:\Program Files\LMS \TecWare 3.7SL1+\demo\general\nature.erfm FORCE_vert 64 -936.7174 10846.3457 [N] 1
Range Pair
Ran
ge
# Cycles
Cumulative damage
6 0 10010 20 30 40 50 60 70 80 90Cum ulative Damage [100%=6.2541E-3]
184.1
11599.0
1000.0
2000.0
3000.0
4000.0
5000.0
6000.0
7000.0
8000.0
9000.0
10000.0
11000.0
[N]
File Channel Number of b ins Lower Lim it Upper Limit Unit Hysteresis FilterD:\Program Files\LMS\TecWare 3.7SL1+\demo\general\nature.erfm FORCE_vert 64 -936.7174 10846.3457 [N] 1
Range Pair
Ran
ge
Pseudo-damage
Damageaccumulation(Miner’s rule)
Range-pair (damage)
5 0.00000 0.006250.00050 0.00100 0.00150 0.00200 0.00250 0.00300 0.00350 0.00400 0.00450 0.00500 0.00550Damage
184.1
11599.0
1000.0
2000.0
3000.0
4000.0
5000.0
6000.0
7000.0
8000.0
9000.0
10000.0
11000.0
[N]
File Channel Number of bins Lower Limi t Upper Limit Unit Hys teresis FilterD:\Program Files\LMS \TecWare 3.7SL1+\demo\general\nature.erfm FORCE_vert 64 -936.7174 10846.3457 [N] 1
Range Pair
Ran
ge
Damage
Take S-N curveinto account forpseudo-damage
distribution
Axes rotating:X-axis = MeanY-axis = Range
Folding:No distinction
betweenstanding
/hanging cycles
Rainflow (range/mean)
3 Mean
Ran
ge
Rainflow
1 To
From
Rainflow (symmetric)
2 To
From
Only ranges and# cycles are kept.
Mean value isignored
Unrestricted © Siemens AG 20172017.05.22Page 15 Siemens PLM Software
How to understand fatigue content of loads ?Comparison of two measurements
Road A Road B
DamageDamage
Unrestricted © Siemens AG 20172017.05.22Page 16 Siemens PLM Software
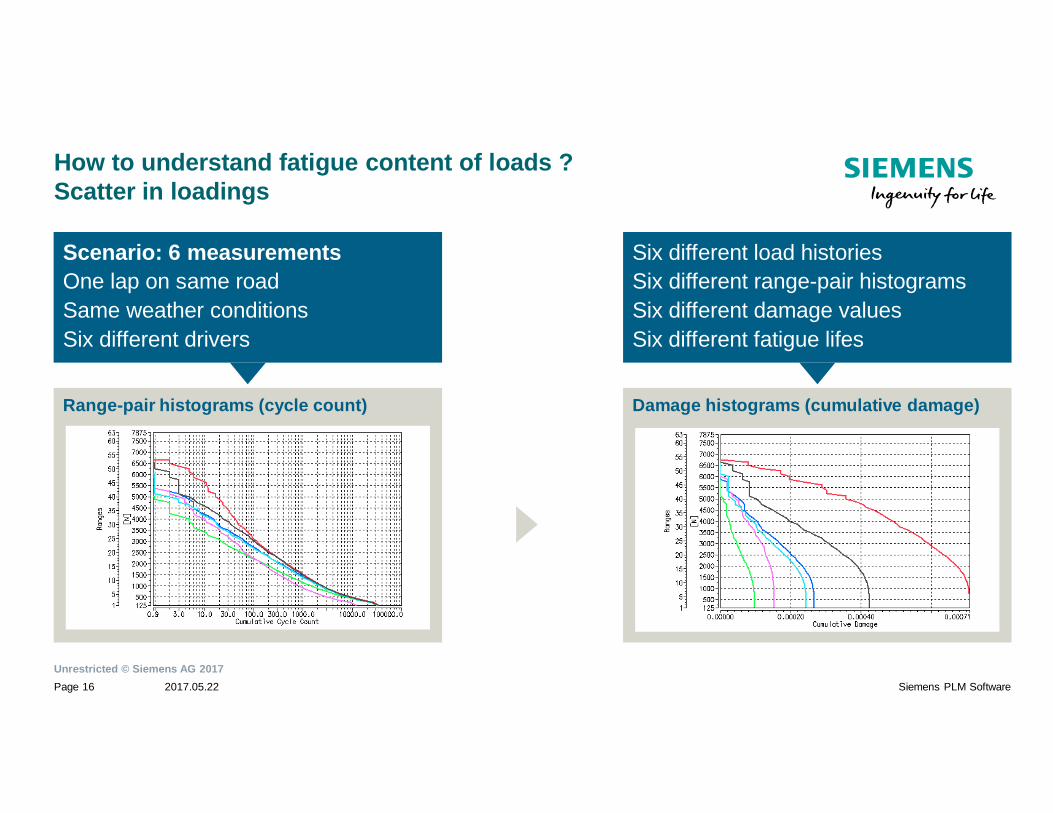
How to understand fatigue content of loads ?Scatter in loadings
Scenario: 6 measurementsOne lap on same roadSame weather conditionsSix different drivers
Range-pair histograms (cycle count)
Six different load historiesSix different range-pair histogramsSix different damage valuesSix different fatigue lifes
Damage histograms (cumulative damage)
Unrestricted © Siemens AG 20172017.05.22Page 17 Siemens PLM Software
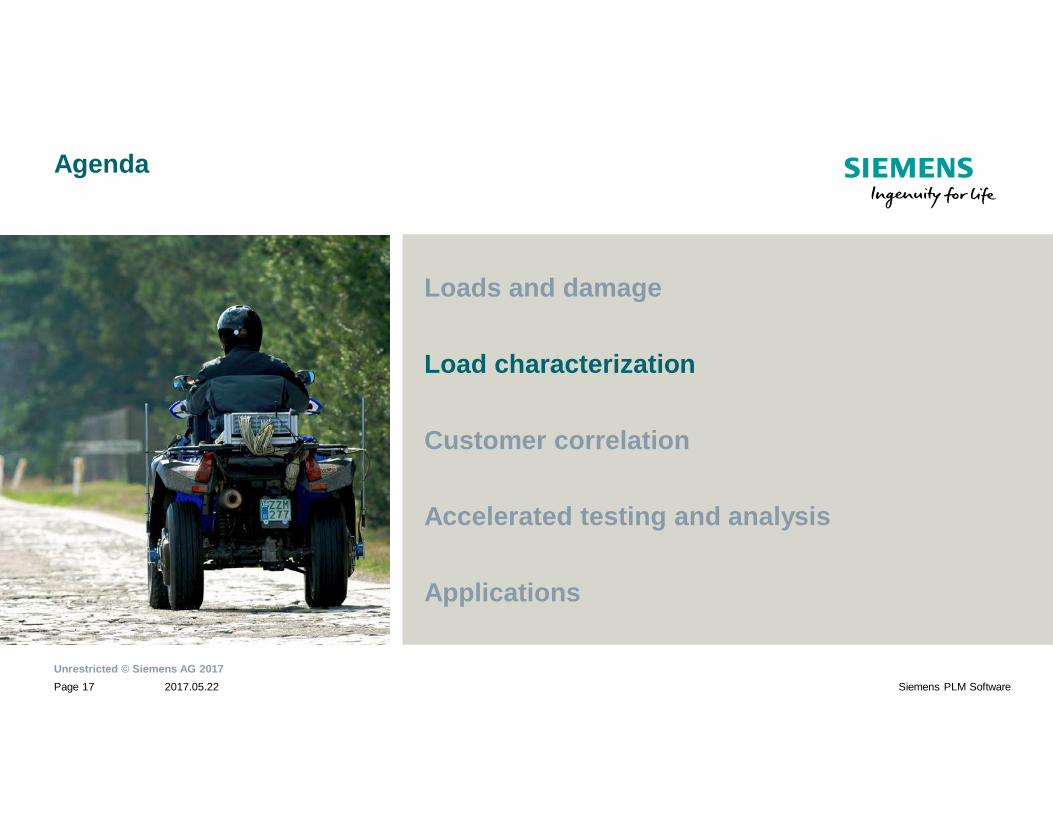
Agenda
Loads and damage
Load characterization
Customer correlation
Accelerated testing and analysis
Applications
Unrestricted © Siemens AG 20172017.05.22Page 18 Siemens PLM Software
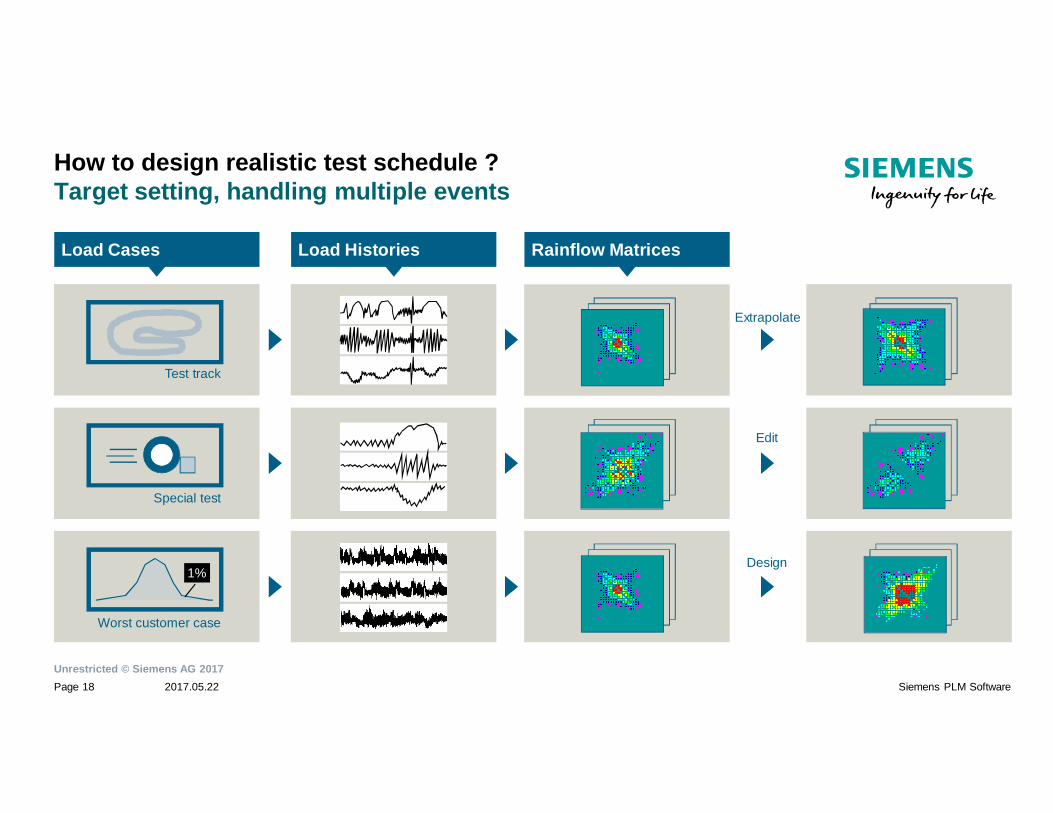
How to design realistic test schedule ?Target setting, handling multiple events
1%
Worst customer case
Test track
Special test
Load Cases Load Histories Rainflow Matrices
Extrapolate
Edit
Design
Unrestricted © Siemens AG 20172017.05.22Page 19 Siemens PLM Software
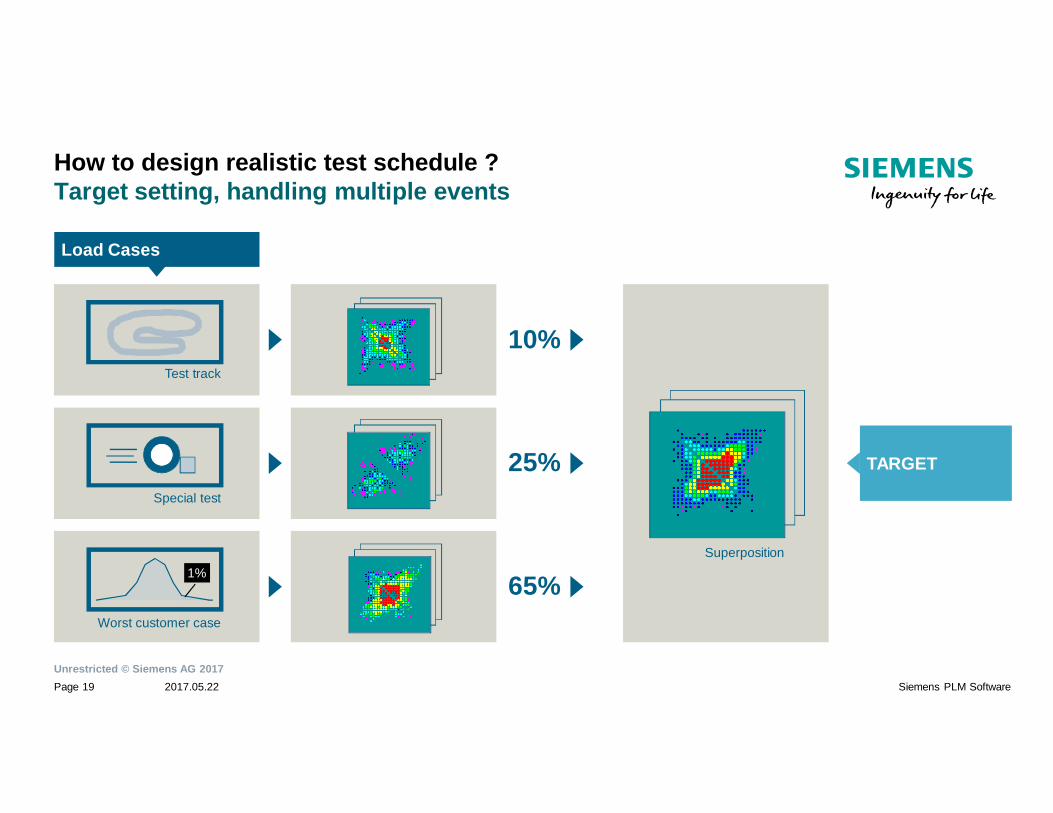
How to design realistic test schedule ?Target setting, handling multiple events
1%
Worst customer case
Test track
Special test
Load Cases
Superposition
10%
25%
65%
TARGET
Unrestricted © Siemens AG 20172017.05.22Page 20 Siemens PLM Software
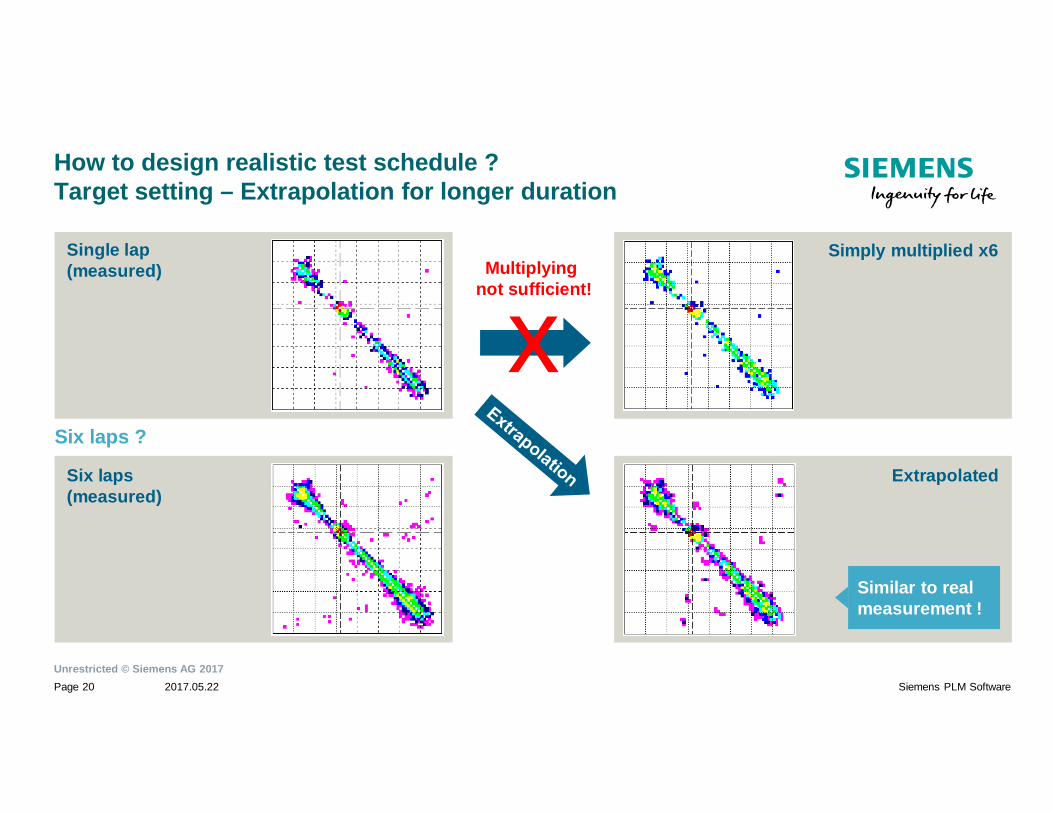
How to design realistic test schedule ?Target setting – Extrapolation for longer duration
Single lap(measured)
Simply multiplied x6
Six laps(measured)
Extrapolated
xMultiplying
not sufficient!
Six laps ?
Similar to realmeasurement !
Unrestricted © Siemens AG 20172017.05.22Page 21 Siemens PLM Software
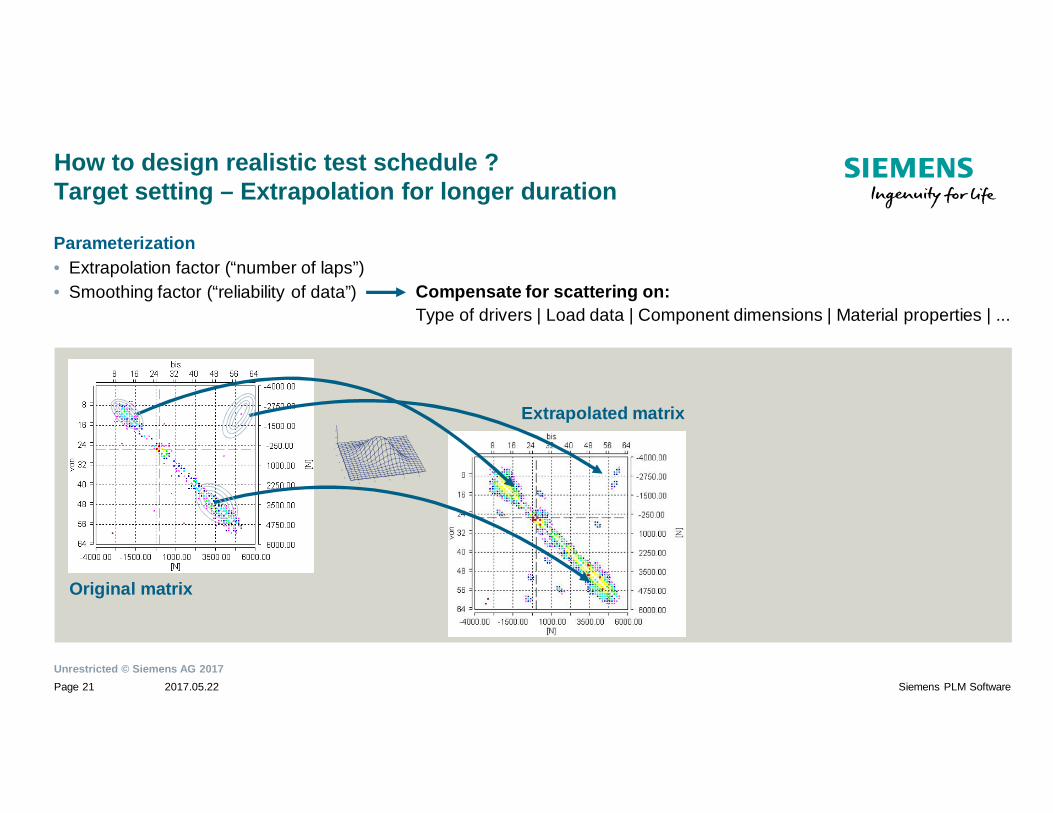
How to design realistic test schedule ?Target setting – Extrapolation for longer duration
Original matrix
Extrapolated matrix
Parameterization• Extrapolation factor (“number of laps”)• Smoothing factor (“reliability of data”)
-4-2
02
4-4
-20
24
00.
51
1.5
Compensate for scattering on:Type of drivers | Load data | Component dimensions | Material properties | ...
Unrestricted © Siemens AG 20172017.05.22Page 22 Siemens PLM Software
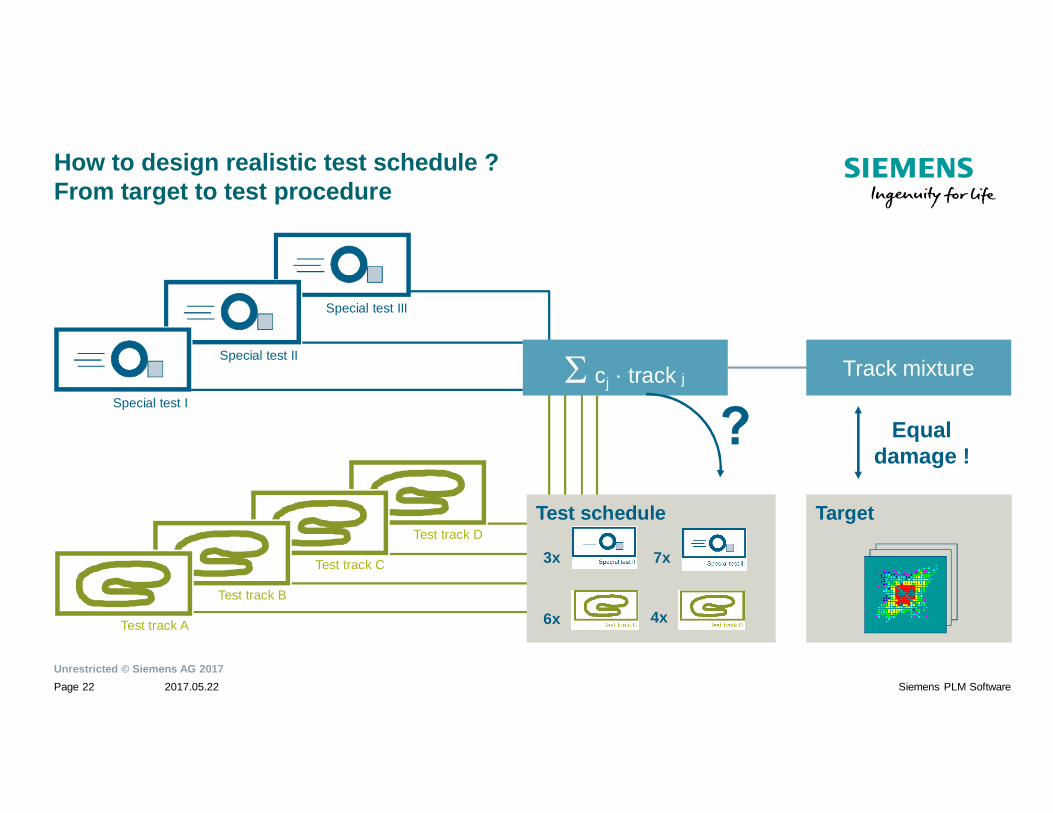
How to design realistic test schedule ?From target to test procedure
Track mixture
Target
Special test III
Special test II
Special test I
Test track D
Test track C
Test track B
Test track A
cj · track j
Test schedule
Equaldamage !
3x 7x
6x 4x
Unrestricted © Siemens AG 20172017.05.22Page 23 Siemens PLM Software
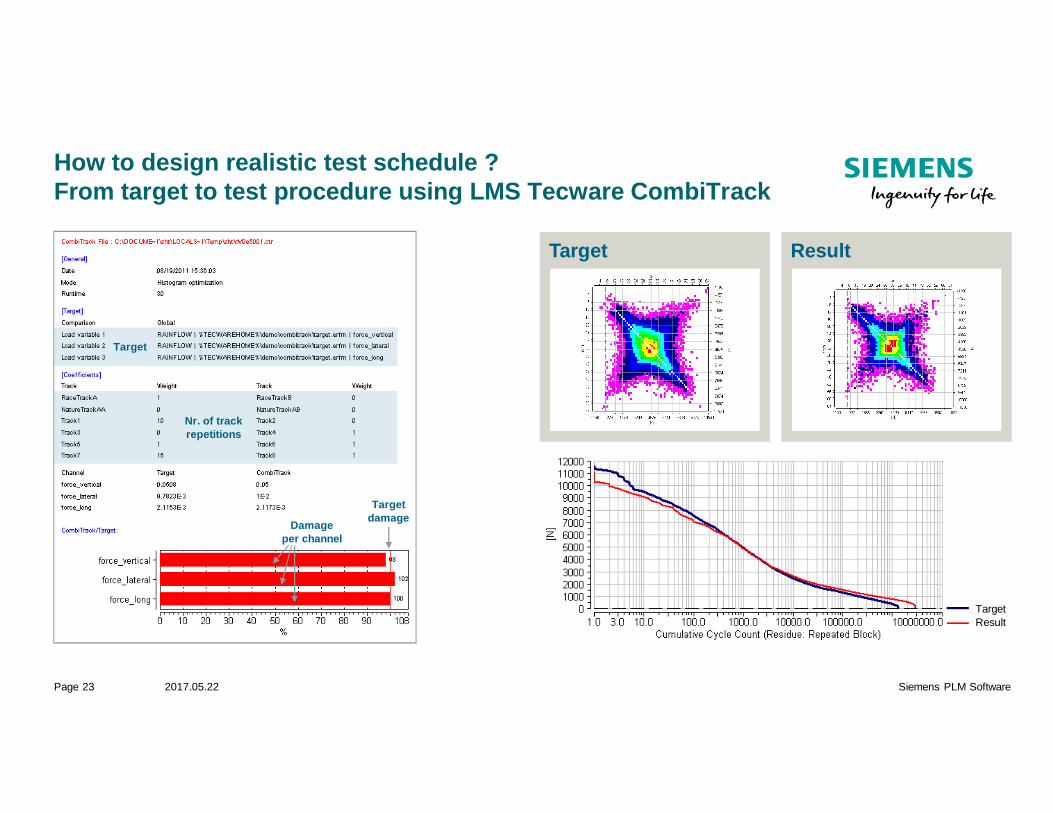
Target Result
How to design realistic test schedule ?From target to test procedure using LMS Tecware CombiTrack
TargetResult
Target
Nr. of trackrepetitions
TargetdamageDamage
per channel

Unrestricted © Siemens AG 20172017.05.22Page 24 Siemens PLM Software
Agenda
Loads and damage
Load characterization
Customer correlation
Accelerated testing and analysis
Applications
Unrestricted © Siemens AG 20172017.05.22Page 25 Siemens PLM Software
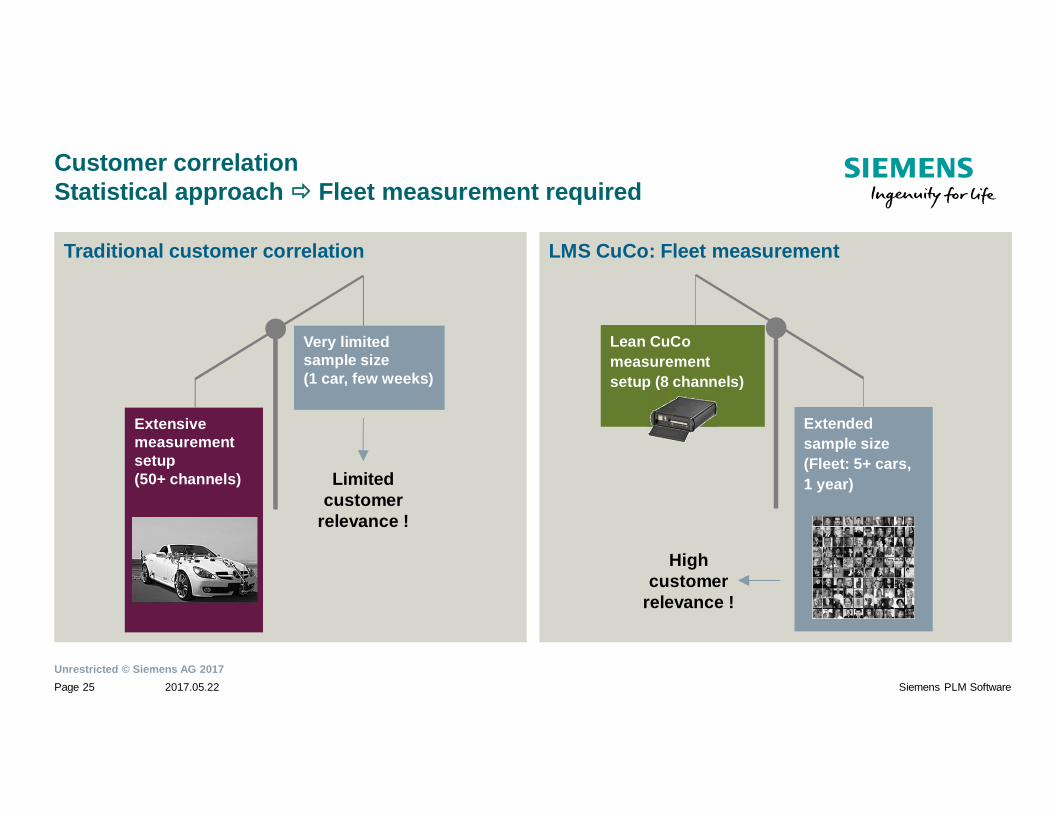
Customer correlationStatistical approach Fleet measurement required
LMS CuCo: Fleet measurementTraditional customer correlation
Extensivemeasurementsetup(50+ channels)
Very limitedsample size(1 car, few weeks)
Limitedcustomer
relevance !
Lean CuComeasurementsetup (8 channels)
Extendedsample size(Fleet: 5+ cars,1 year)
Highcustomer
relevance !
Unrestricted © Siemens AG 20172017.05.22Page 26 Siemens PLM Software
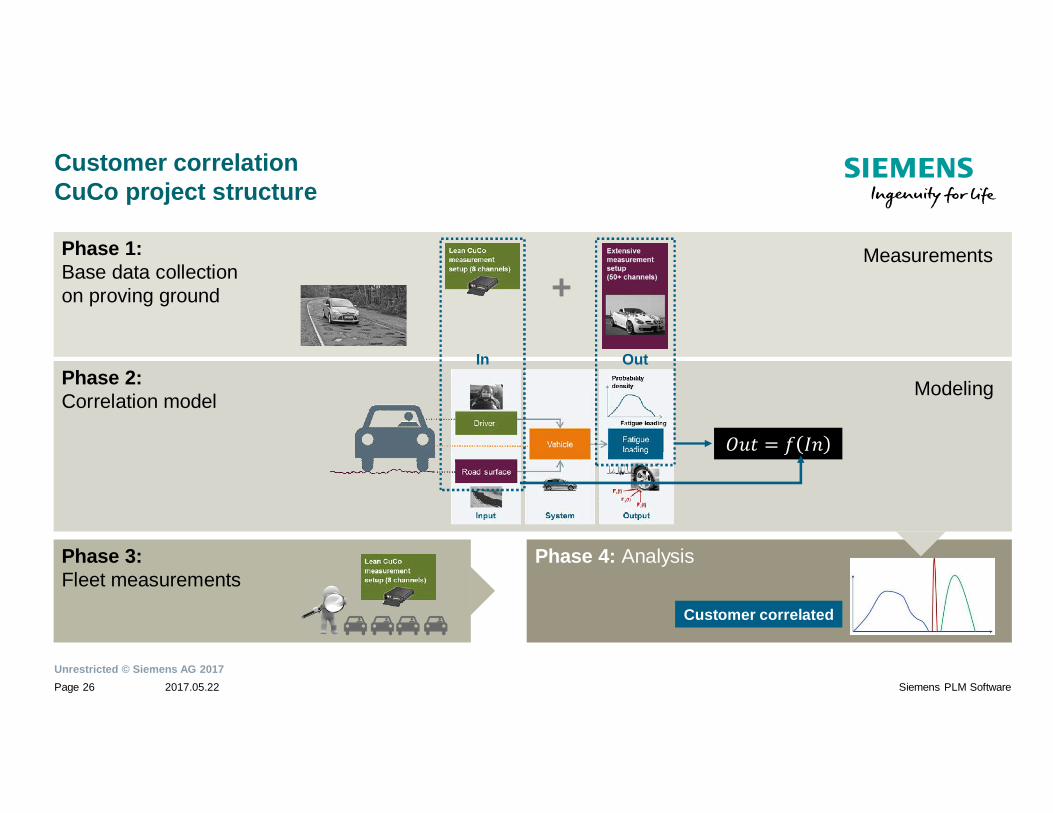
Phase 1:Base data collectionon proving ground +
Measurements
Customer correlationCuCo project structure
Phase 4: Analysis
Customer correlated
Phase 2:Correlation model
In Out
Modeling
Phase 3:Fleet measurements
Unrestricted © Siemens AG 20172017.05.22Page 27 Siemens PLM Software
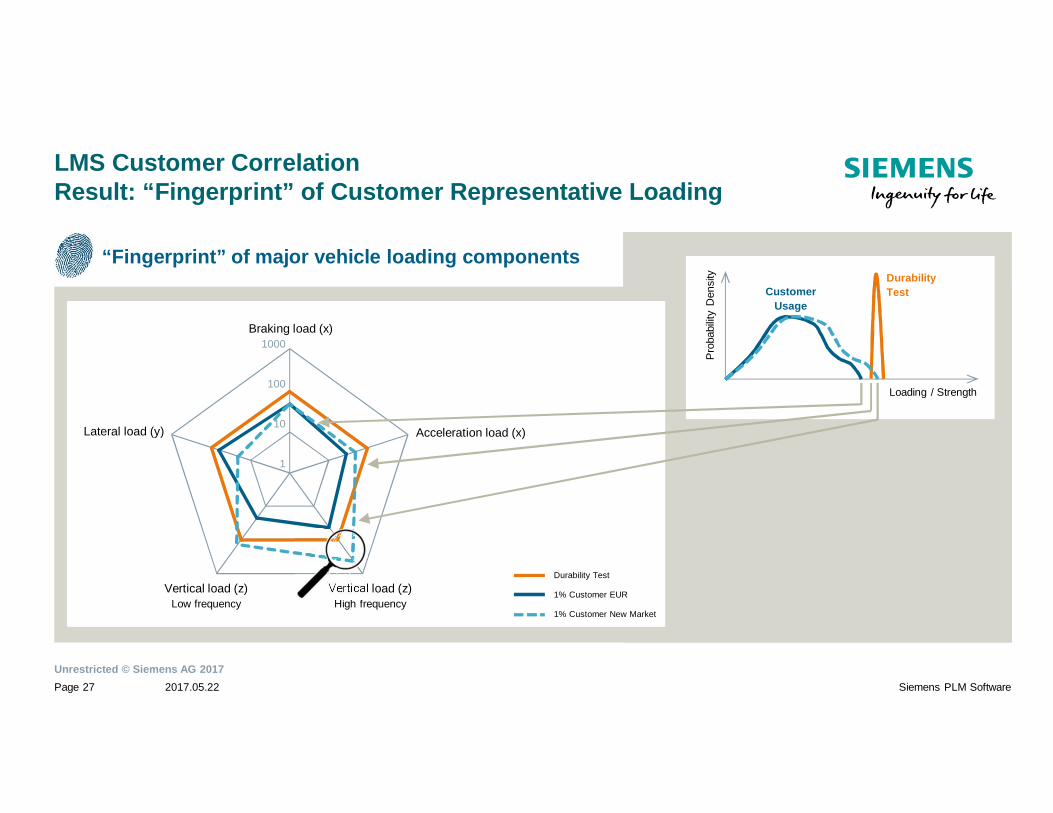
CustomerUsage
DurabilityTest
Pro
babi
lity
Den
sity
Loading / Strength
LMS Customer CorrelationResult: “Fingerprint” of Customer Representative Loading
“Fingerprint” of major vehicle loading components
Braking load (x)1000
100
10
1
Acceleration load (x)Lateral load (y)
Vertical load (z)Low frequency
Vertical load (z)High frequency
1% Customer EUR
Durability Test
1% Customer New Market
Unrestricted © Siemens AG 20172017.05.22Page 28 Siemens PLM Software
Agenda
Loads and damage
Load characterization
Customer correlation
Accelerated testing and analysis
Applications
Unrestricted © Siemens AG 20172017.05.22Page 29 Siemens PLM Software
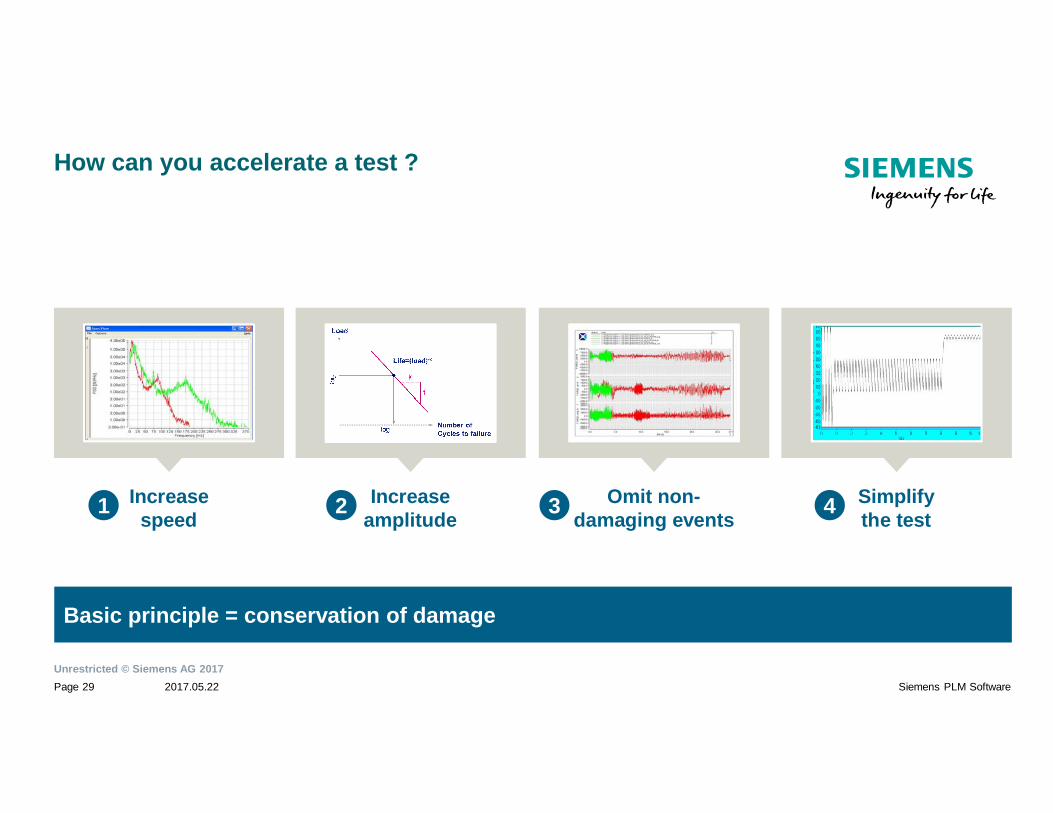
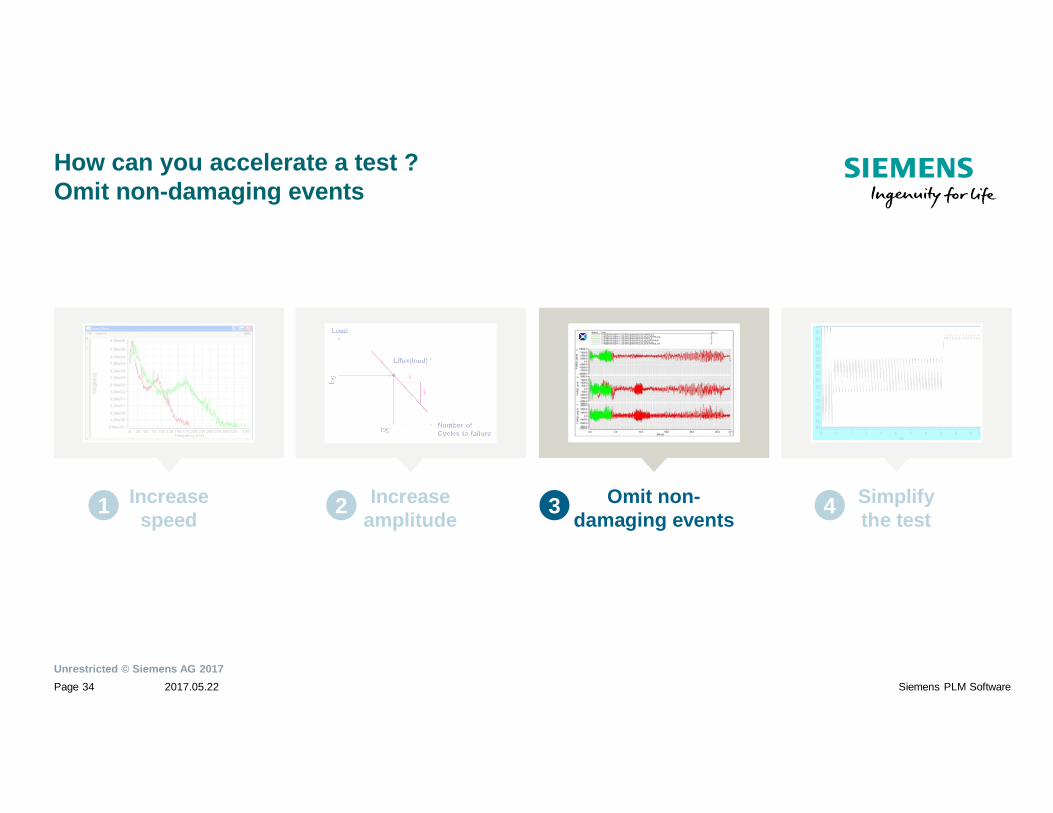
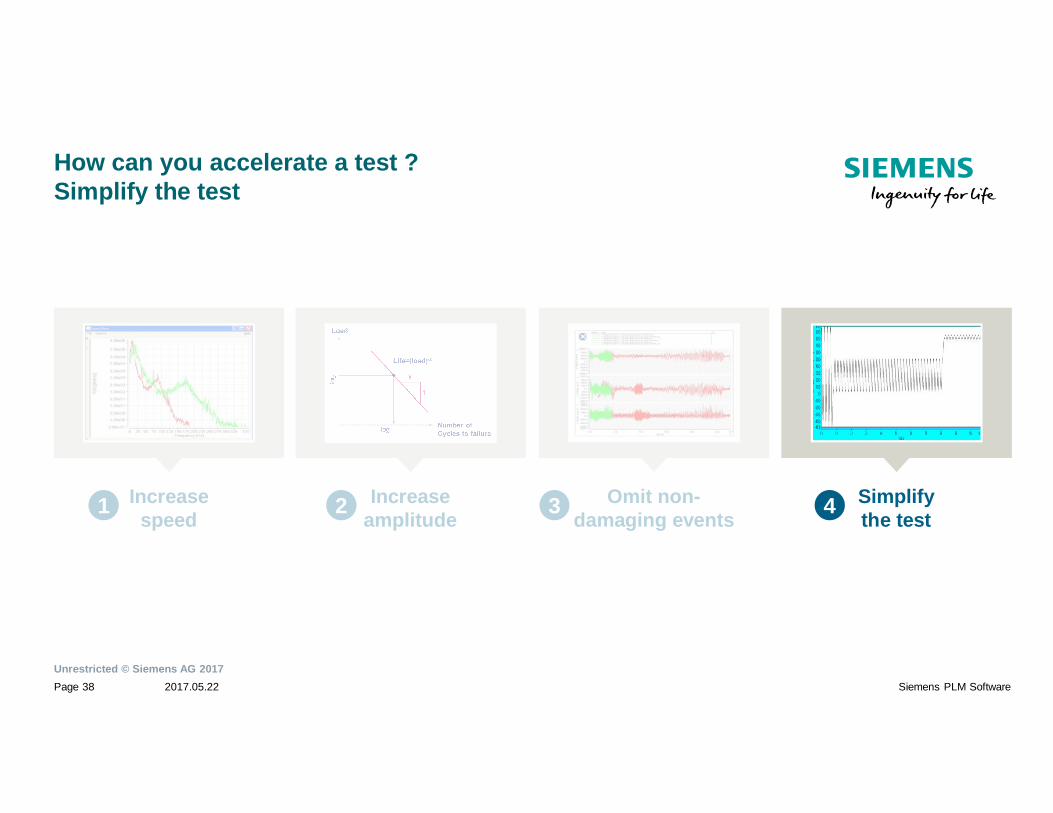
How can you accelerate a test ?
1 Increasespeed
Increaseamplitude2 Omit non-
damaging events3 Simplifythe test4
Basic principle = conservation of damage
Unrestricted © Siemens AG 20172017.05.22Page 30 Siemens PLM Software
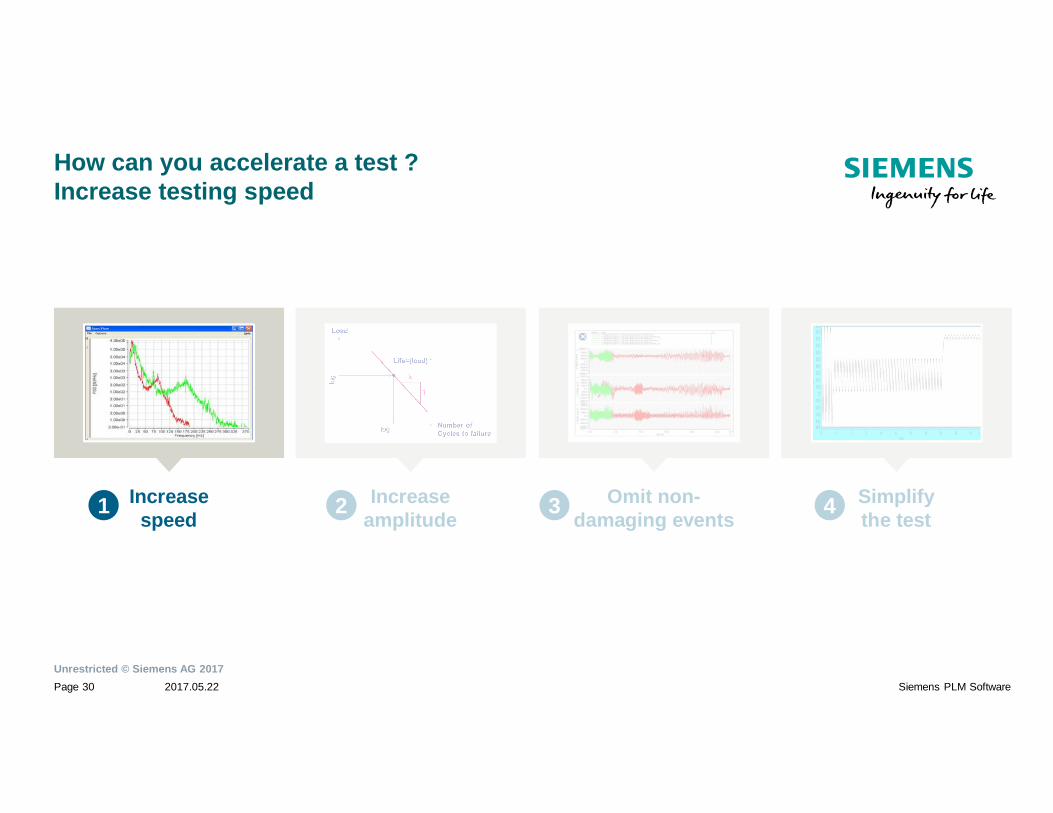
How can you accelerate a test ?Increase testing speed
1 Increasespeed
Increaseamplitude2 Omit non-
damaging events3 Simplifythe test4
Unrestricted © Siemens AG 20172017.05.22Page 31 Siemens PLM Software
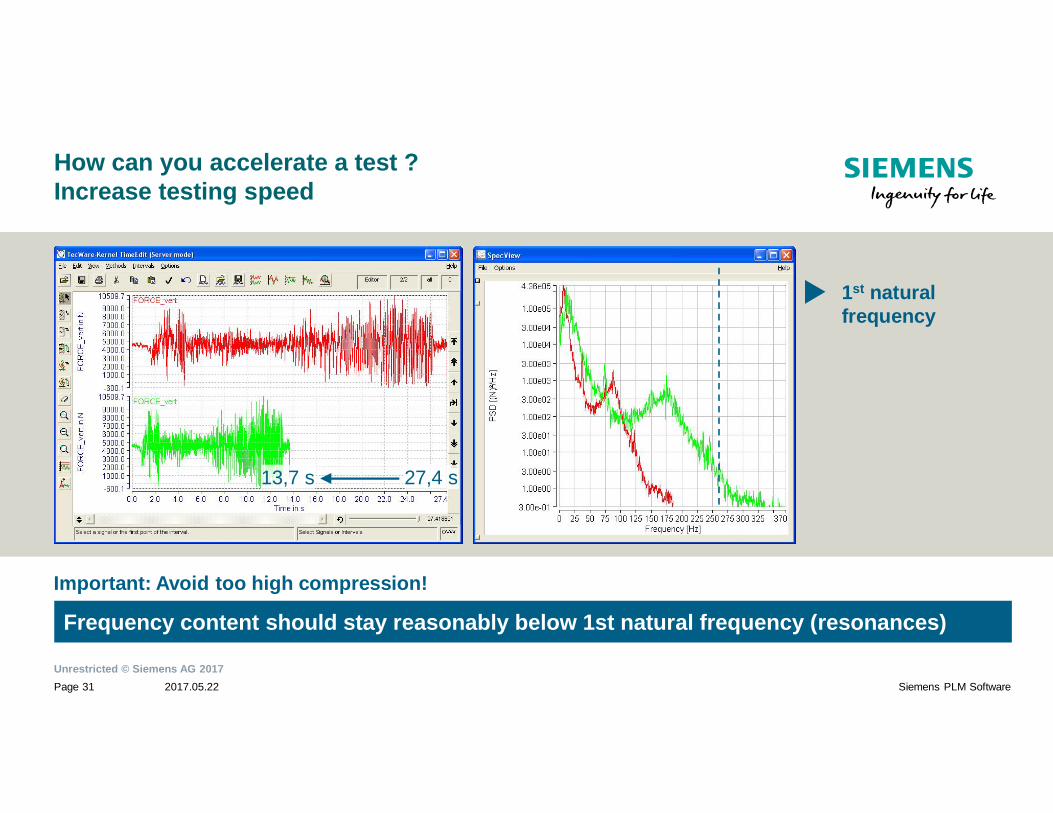
1st naturalfrequency
How can you accelerate a test ?Increase testing speed
Frequency content should stay reasonably below 1st natural frequency (resonances)
Important: Avoid too high compression!
27,4 s13,7 s
Unrestricted © Siemens AG 20172017.05.22Page 32 Siemens PLM Software
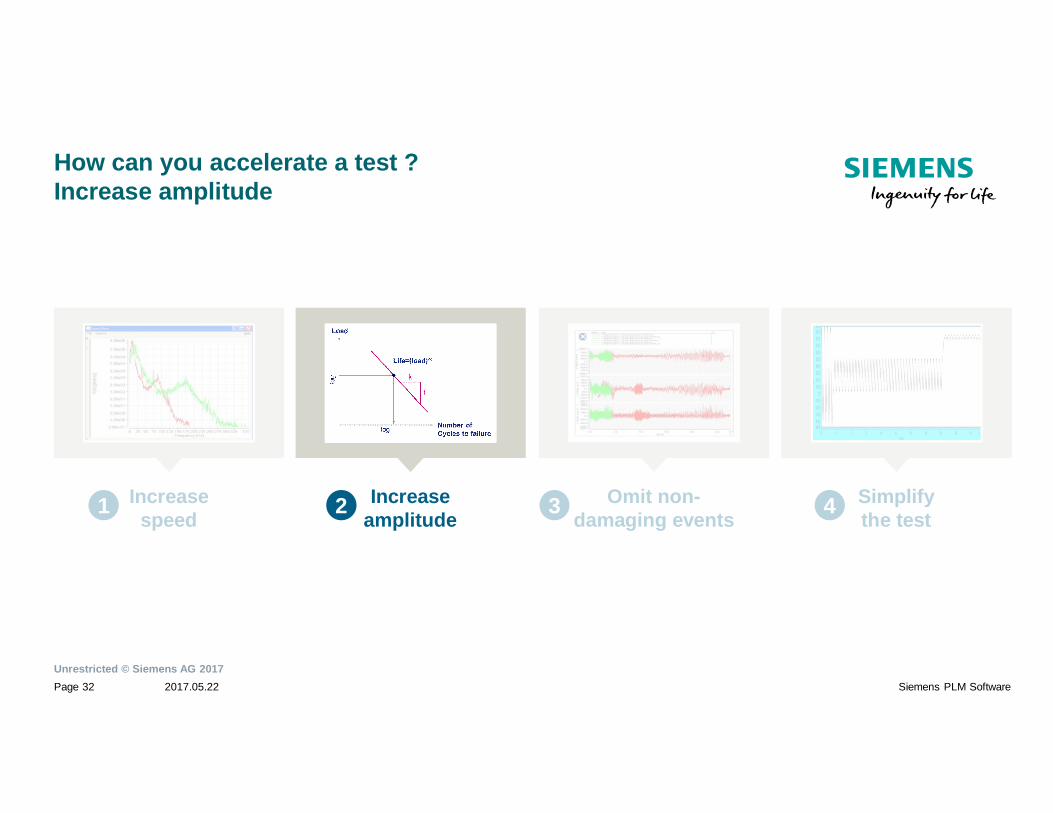
How can you accelerate a test ?Increase amplitude
1 Increasespeed
Increaseamplitude2 Omit non-
damaging events3 Simplifythe test4
Unrestricted © Siemens AG 20172017.05.22Page 33 Siemens PLM Software
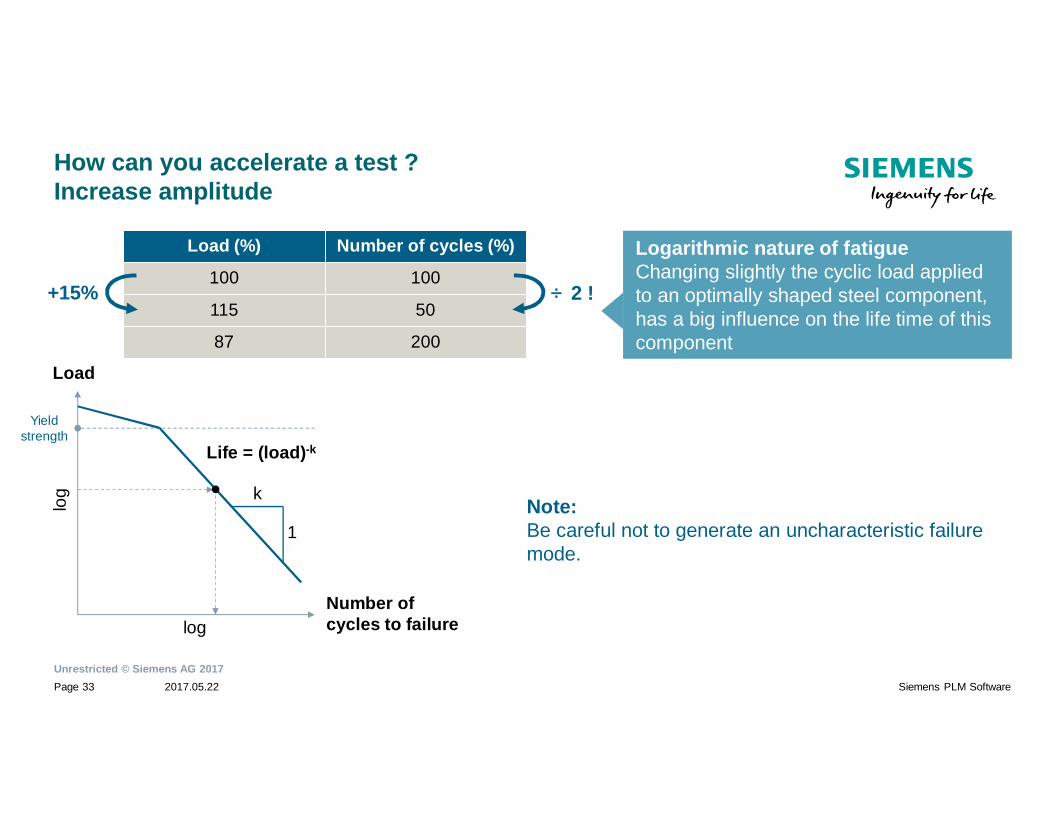
How can you accelerate a test ?Increase amplitude
Logarithmic nature of fatigueChanging slightly the cyclic load appliedto an optimally shaped steel component,has a big influence on the life time of thiscomponent
Load
Number ofcycles to failure
log
log
Life = (load)-k
1
k
+15% ÷2 !
Note:Be careful not to generate an uncharacteristic failuremode.
Yieldstrength
Load (%) Number of cycles (%)
100 100
115 50
87 200
Unrestricted © Siemens AG 20172017.05.22Page 34 Siemens PLM Software
How can you accelerate a test ?Omit non-damaging events
1 Increasespeed
Increaseamplitude2 Omit non-
damaging events3 Simplifythe test4
Unrestricted © Siemens AG 20172017.05.22Page 35 Siemens PLM Software
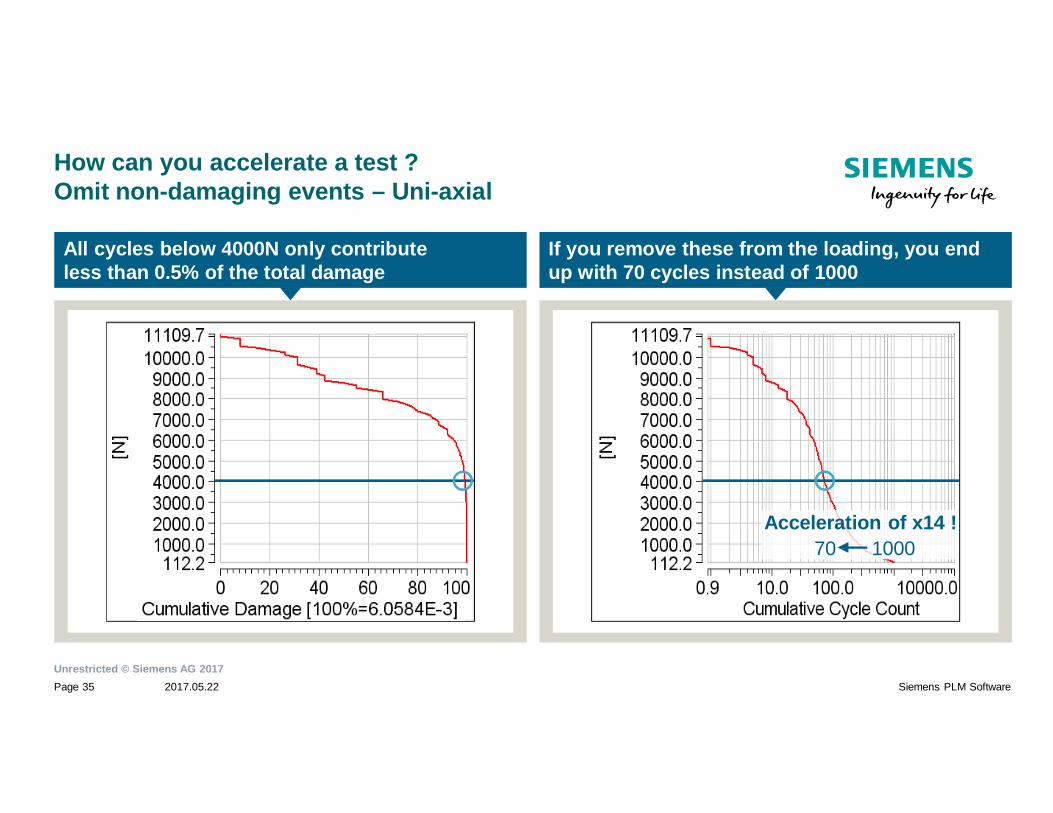
How can you accelerate a test ?Omit non-damaging events – Uni-axial
Acceleration of x14 !100070
All cycles below 4000N only contributeless than 0.5% of the total damage
If you remove these from the loading, you endup with 70 cycles instead of 1000
Unrestricted © Siemens AG 20172017.05.22Page 36 Siemens PLM Software
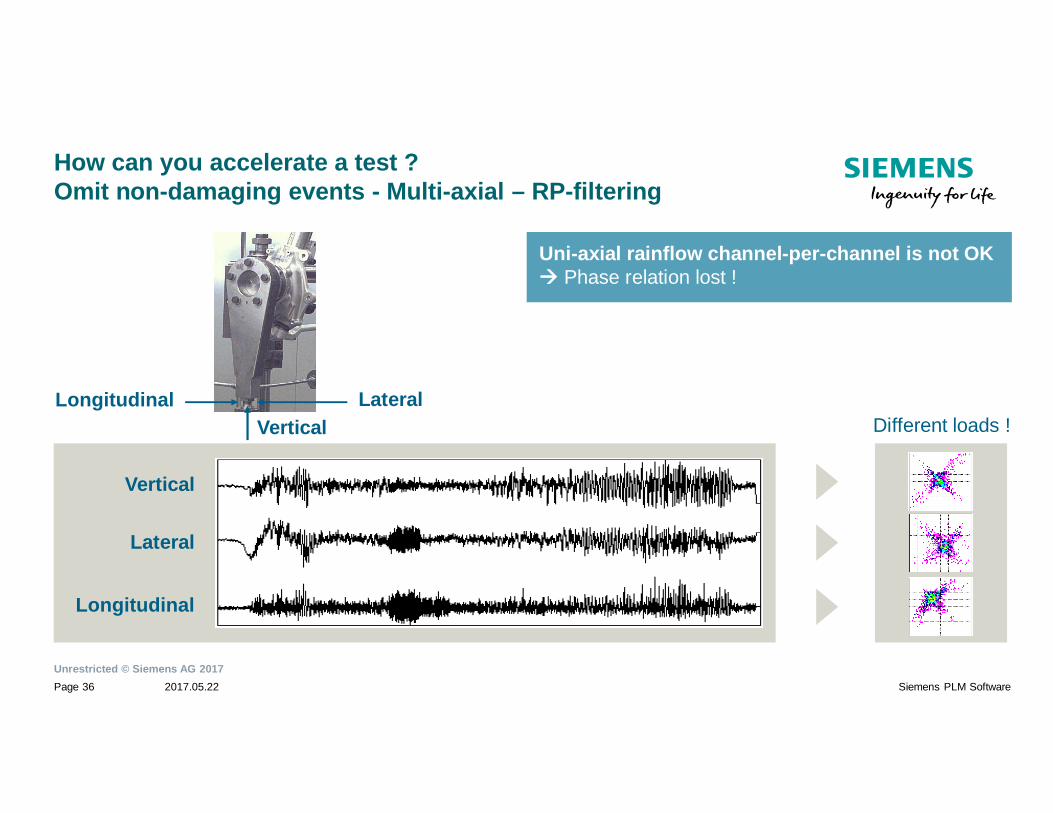
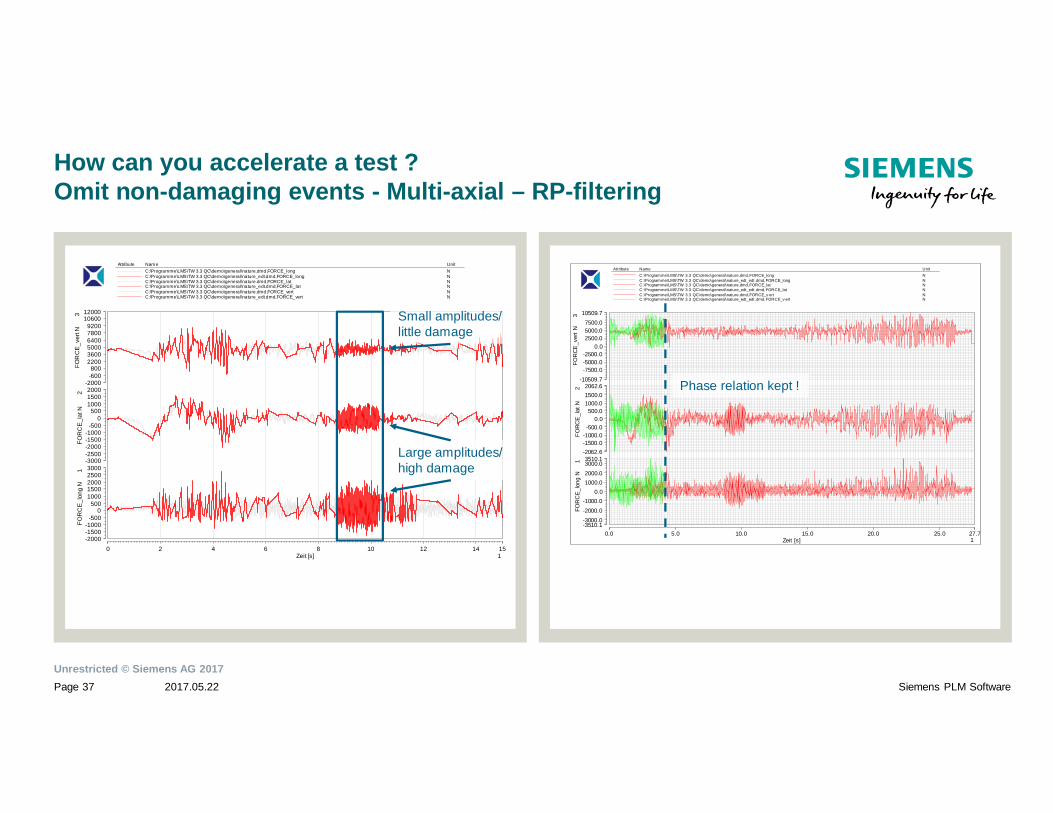
How can you accelerate a test ?Omit non-damaging events - Multi-axial – RP-filtering
Vertical
Lateral
Longitudinal
Longitudinal
Uni-axial rainflow channel-per-channel is not OKPhase relation lost !
VerticalLateral
Different loads !
Unrestricted © Siemens AG 20172017.05.22Page 37 Siemens PLM Software
How can you accelerate a test ?Omit non-damaging events - Multi-axial – RP-filtering
0 152 4 6 8 10 12 14Zeit [s] 1
-2000
3000
-1500-1000
-5000
5001000150020002500
FOR
CE
_lon
gN
1
-3000
2000
-2500-2000-1500-1000
-5000
50010001500
FOR
CE
_lat
N2
-2000
12000
-600800
220036005000640078009200
10600
FOR
CE
_ver
tN3
Attribute Name UnitC:\Programme\LMS\TW 3.3 QC\demo\general\nature.dmd,FORCE_long NC:\Programme\LMS\TW 3.3 QC\demo\general\nature_edt.dmd,FORCE_long NC:\Programme\LMS\TW 3.3 QC\demo\general\nature.dmd,FORCE_lat NC:\Programme\LMS\TW 3.3 QC\demo\general\nature_edt.dmd,FORCE_lat NC:\Programme\LMS\TW 3.3 QC\demo\general\nature.dmd,FORCE_vert NC:\Programme\LMS\TW 3.3 QC\demo\general\nature_edt.dmd,FORCE_vert N
Small amplitudes/little damage
Large amplitudes/high damage
0.0 27.75.0 10.0 15.0 20.0 25.0Zeit [s] 1
-3510.1
3510.1
-3000.0-2000.0-1000.0
0.01000.02000.03000.0
FOR
CE_
long
N1
-2062.6
2062.6
-1500.0-1000.0-500.0
0.0500.0
1000.01500.0
FORC
E_l
atN
2
-10509.7
10509.7
-7500.0-5000.0-2500.0
0.02500.05000.07500.0
FOR
CE_v
ertN
3
At tribute Name UnitC:\Programme\LMS\TW 3.3 QC\demo\general\nature.dmd,FORCE_long NC:\Programme\LMS\TW 3.3 QC\demo\general\nature_edt_edt .dmd,FORCE_long NC:\Programme\LMS\TW 3.3 QC\demo\general\nature.dmd,FORCE_lat NC:\Programme\LMS\TW 3.3 QC\demo\general\nature_edt_edt .dmd,FORCE_lat NC:\Programme\LMS\TW 3.3 QC\demo\general\nature.dmd,FORCE_v ert NC:\Programme\LMS\TW 3.3 QC\demo\general\nature_edt_edt .dmd,FORCE_v ert N
Phase relation kept !
Unrestricted © Siemens AG 20172017.05.22Page 38 Siemens PLM Software
How can you accelerate a test ?Simplify the test
1 Increasespeed
Increaseamplitude2 Omit non-
damaging events3 Simplifythe test4
Unrestricted © Siemens AG 20172017.05.22Page 39 Siemens PLM Software
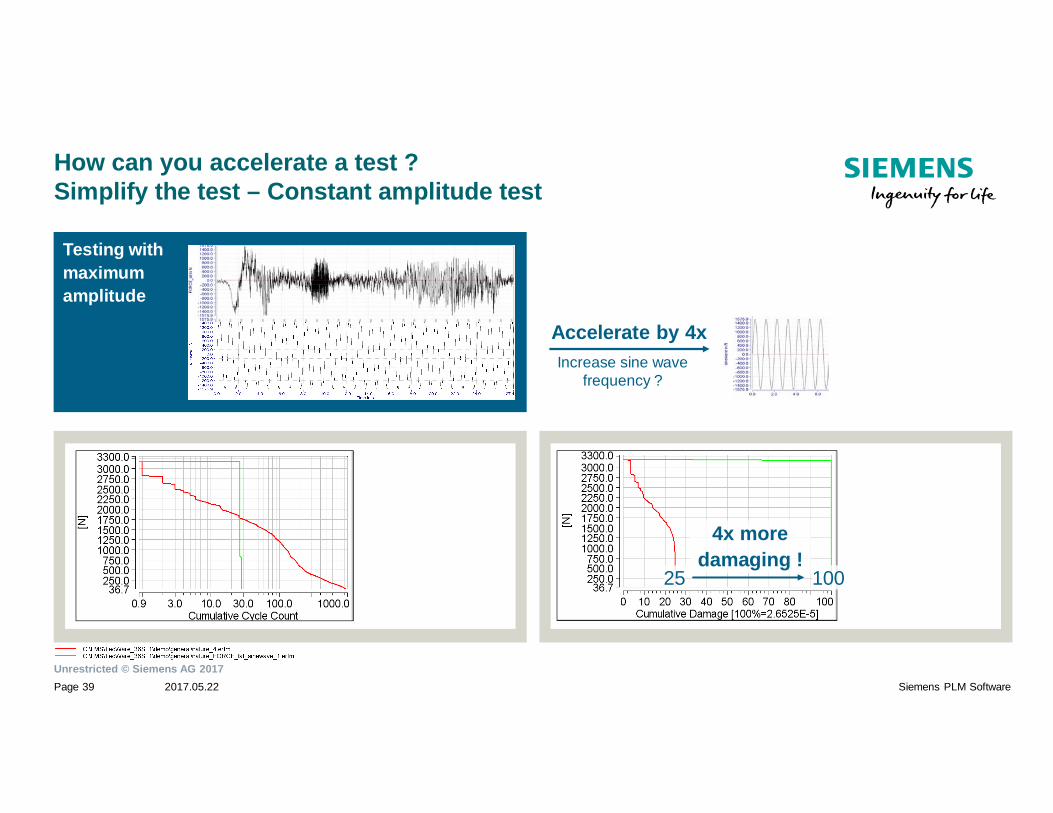
How can you accelerate a test ?Simplify the test – Constant amplitude test
Testing withmaximumamplitude
4x moredamaging !
10025
Accelerate by 4xIncrease sine wave
frequency ?
Unrestricted © Siemens AG 20172017.05.22Page 40 Siemens PLM Software
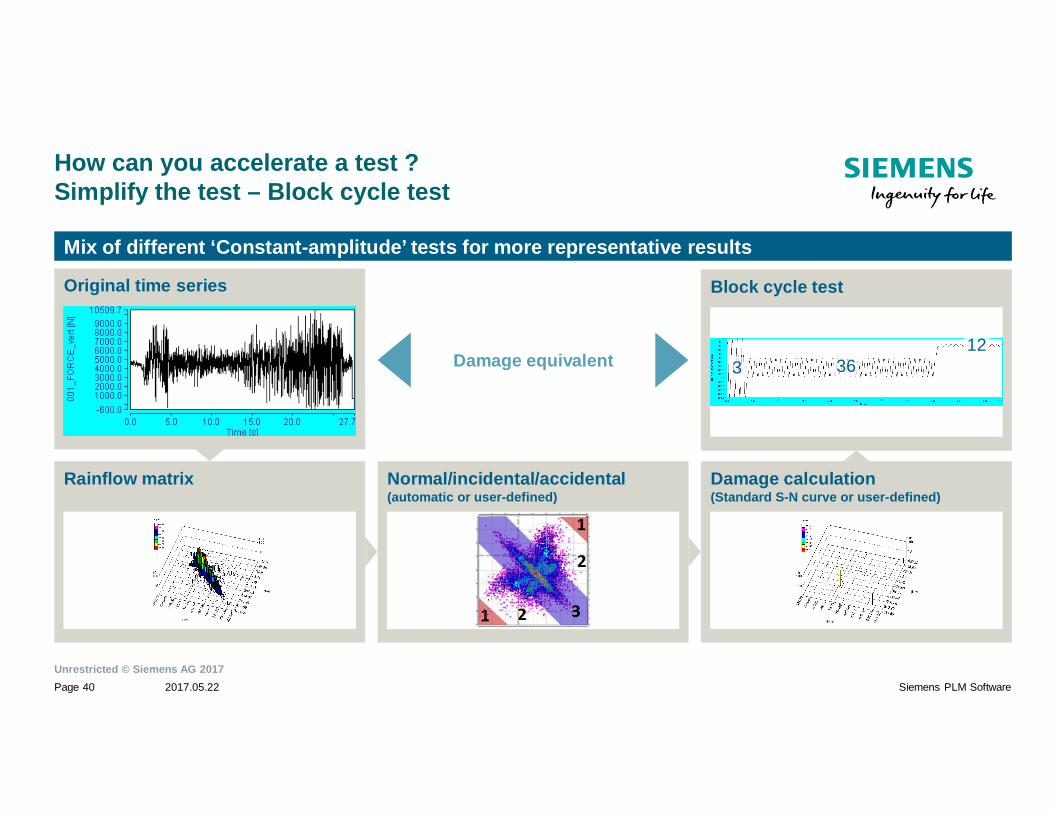
How can you accelerate a test ?Simplify the test – Block cycle test
Mix of different ‘Constant-amplitude’ tests for more representative results
Original time series
Normal/incidental/accidental(automatic or user-defined)
Damage calculation(Standard S-N curve or user-defined)
Rainflow matrix
Block cycle test
Damage equivalent 3 3612

Unrestricted © Siemens AG 20172017.05.22Page 41 Siemens PLM Software
Agenda
Loads and damage
Load characterization
Customer correlation
Accelerated testing and analysis
Applications
Unrestricted © Siemens AG 20172017.05.22Page 42 Siemens PLM Software
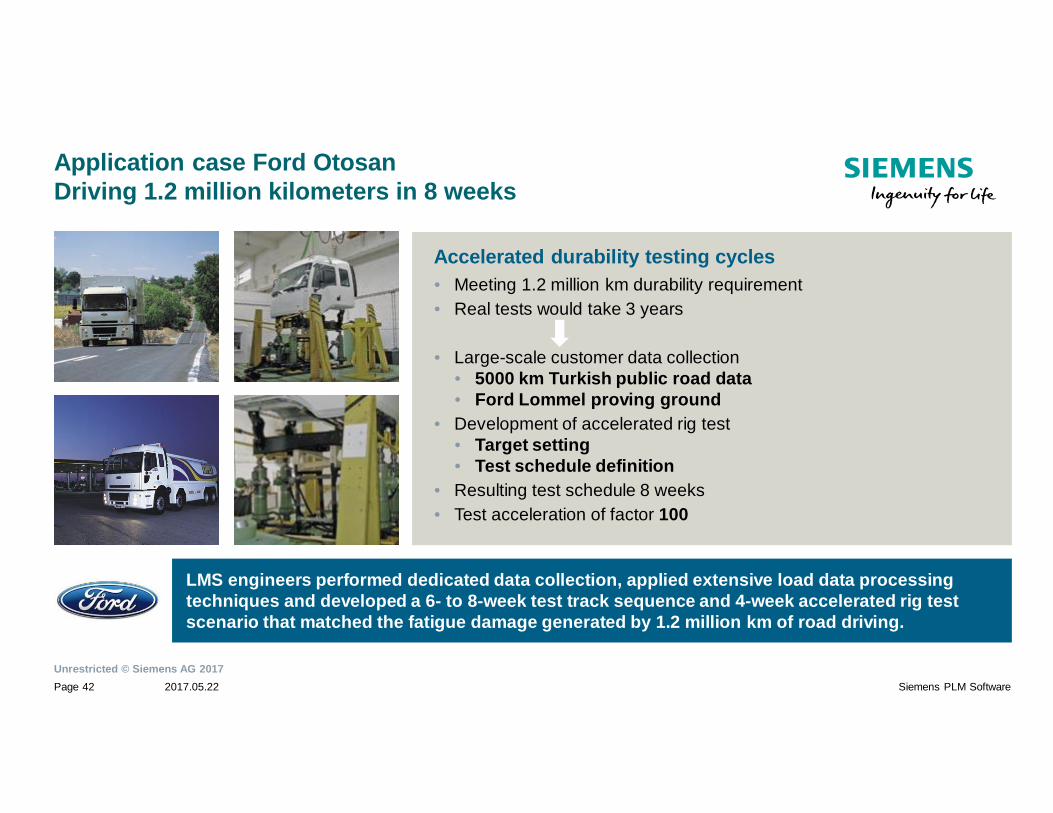
Accelerated durability testing cycles• Meeting 1.2 million km durability requirement• Real tests would take 3 years
• Large-scale customer data collection• 5000 km Turkish public road data• Ford Lommel proving ground
• Development of accelerated rig test• Target setting• Test schedule definition
• Resulting test schedule 8 weeks• Test acceleration of factor 100
Application case Ford OtosanDriving 1.2 million kilometers in 8 weeks
LMS engineers performed dedicated data collection, applied extensive load data processingtechniques and developed a 6- to 8-week test track sequence and 4-week accelerated rig testscenario that matched the fatigue damage generated by 1.2 million km of road driving.
Unrestricted © Siemens AG 20172017.05.22Page 43 Siemens PLM Software
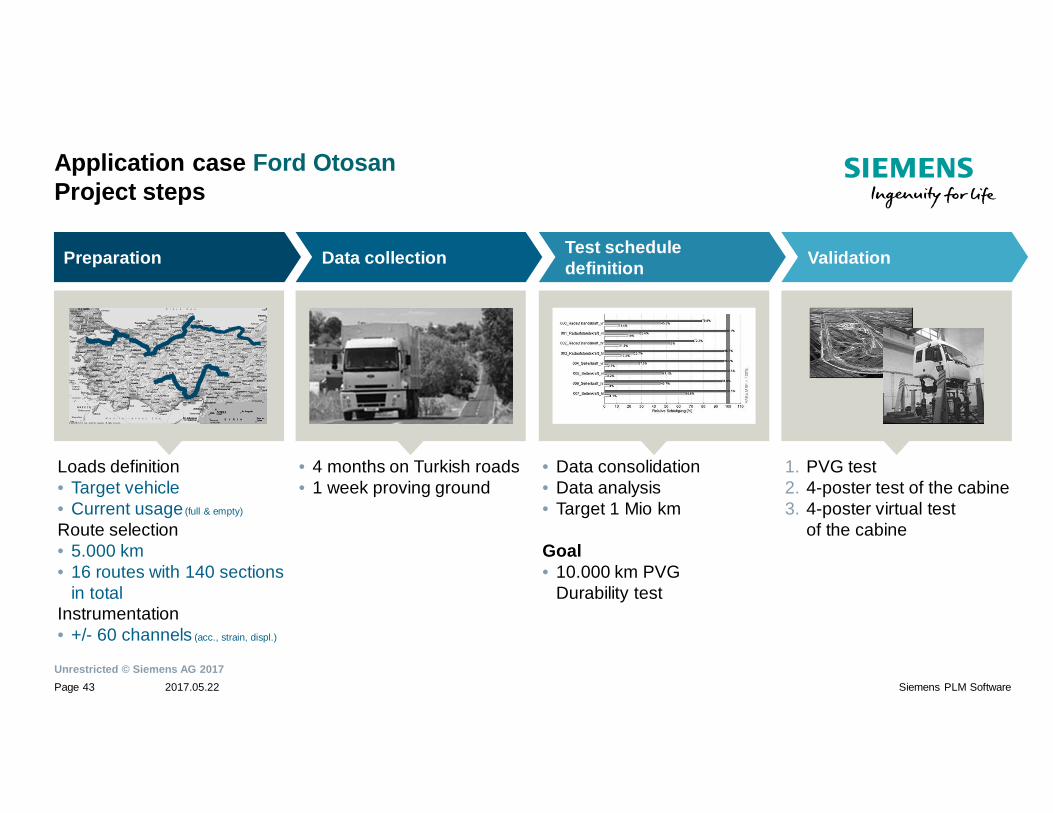
Application case Ford OtosanProject steps
Validation
1. PVG test2. 4-poster test of the cabine3. 4-poster virtual test
of the cabine
Test scheduledefinition
• Data consolidation• Data analysis• Target 1 Mio km
Goal• 10.000 km PVG
Durability test
Data collection
• 4 months on Turkish roads• 1 week proving ground
Preparation
Loads definition• Target vehicle• Current usage (full & empty)
Route selection• 5.000 km• 16 routes with 140 sections
in totalInstrumentation• +/- 60 channels (acc., strain, displ.)
Unrestricted © Siemens AG 20172017.05.22Page 44 Siemens PLM Software
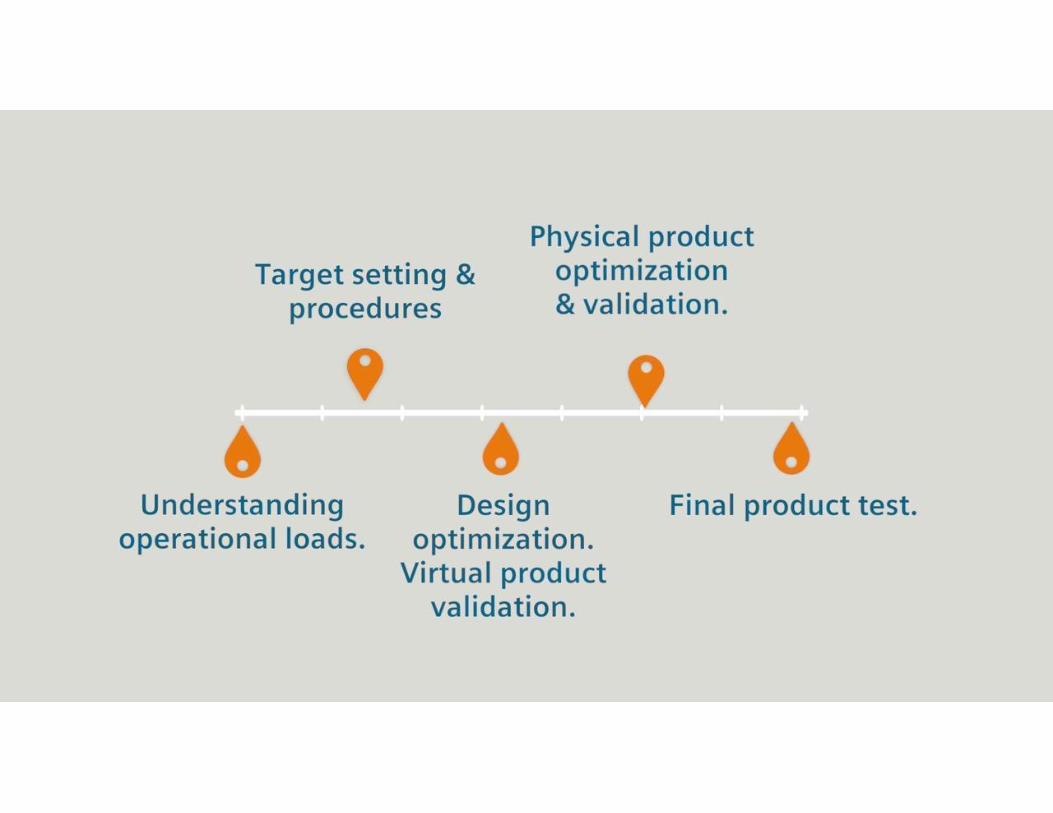
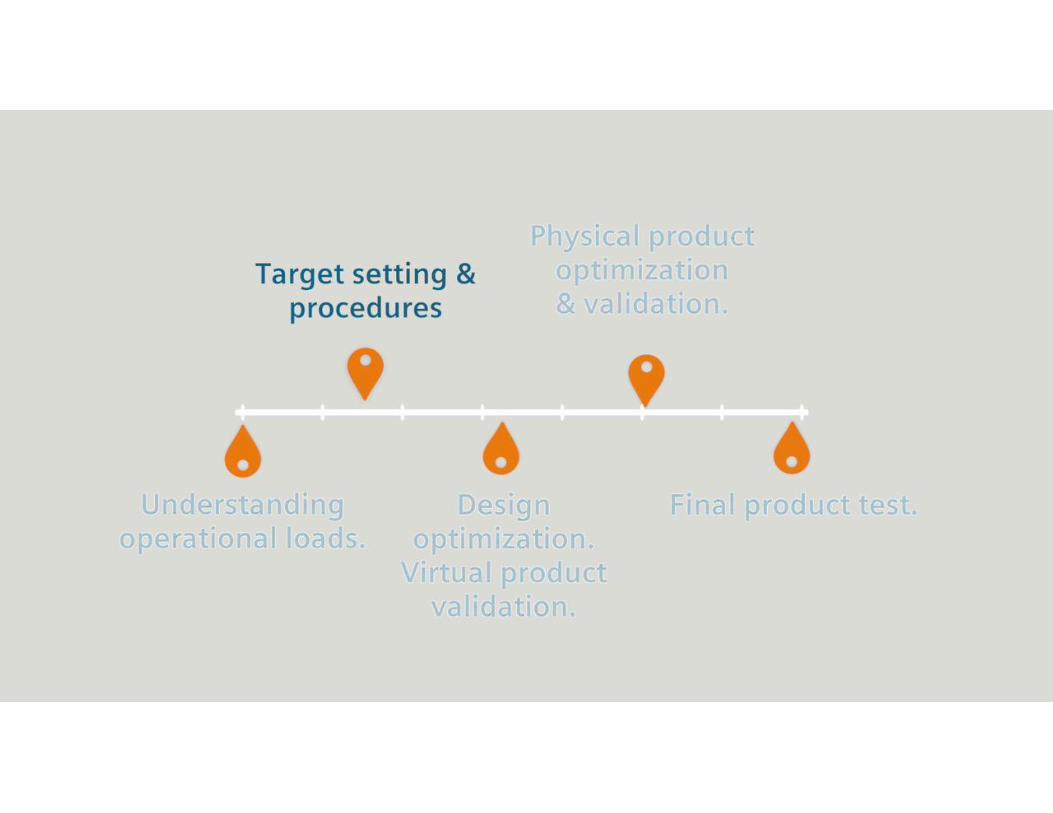
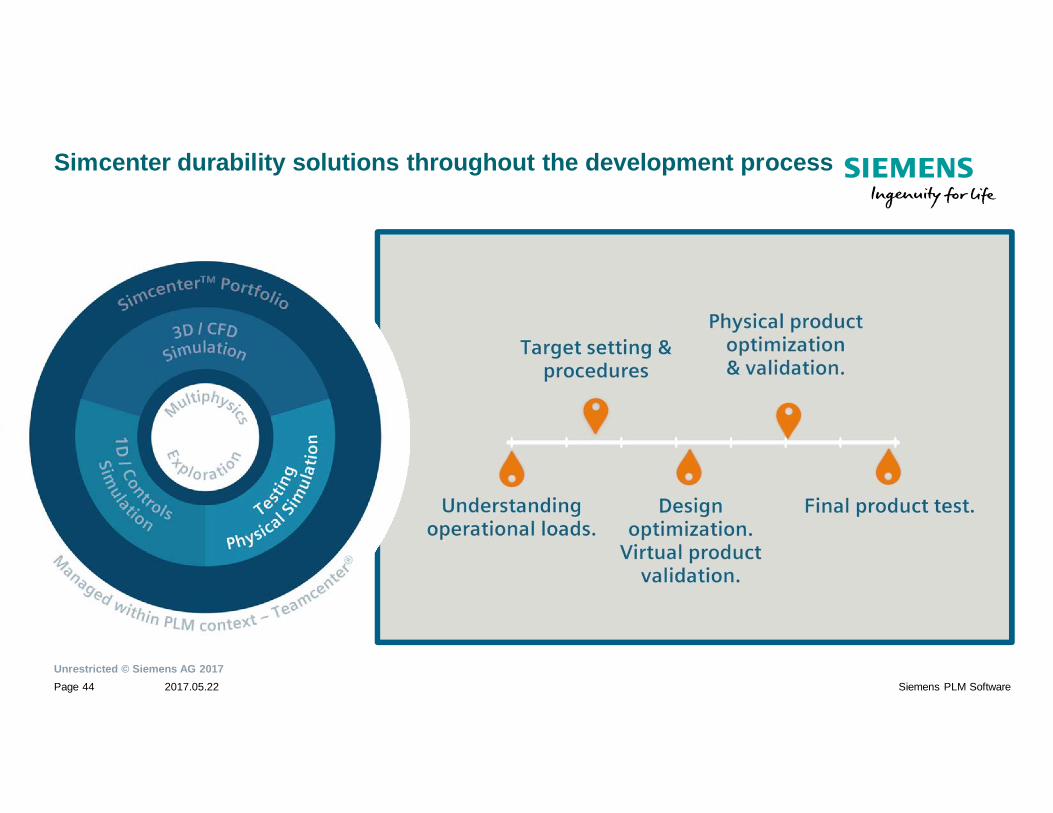
Simcenter durability solutions throughout the development process
Unrestricted © Siemens AG 20172017.05.22Page 45 Siemens PLM Software
Thank you! Want to know more?
• Text• Text• Text
• Text• Text• Text
• Text• Text• Text
• Text• Text• Text
Read more Explore, share and learn
Watch videos Contact the expert


![Correlated data generation using GAN and its Application ... · direction of generating image/continuous data [5,6]. ... It must be noted that generating realistic sentences of a](https://img.pdfslide.net/doc/110x75/5f57d0358a7a022f942324a5/correlated-data-generation-using-gan-and-its-application-direction-of-generating.jpg)