Embed Size (px)
Citation preview
Valentina StoevskaILO Department of Statistics
Workshop on MDG Data Reconciliation: Employment Indicators, Beirut, 12-13
July 2012 1
ILO data gatheringData sourcesProblems: ◦ data availability◦ data comparabilityTreatment of missing values◦ use of proxy indicators ◦ imputationsRegional and Global estimatesFuture challenges
Workshop on MDG Data Reconciliation: Employment Indicators, Beirut, 12-13 July 20122
Workshop on MDG Data Reconciliation: Employment Indicators, Beirut, 12-13 July 2012
Annual questionnaire, websites, NSP Meta data collected as well Consistency checks, validations Clarifications with the countries Dissemination (http://laborsta.ilo.org/, KILM) Clear international standards, ILO Resolutions
3
Workshop on MDG Data Reconciliation: Employment Indicators, Beirut, 12-13 July 2012
Labour Force Surveys Establishment surveys Official estimates Administrative records (incl. insurance records) Censuses Other surveys
4
Workshop on MDG Data Reconciliation: Employment Indicators, Beirut, 12-13 July 2012
Methodological and conceptual differences: definitions, coverage of the reference population, coverage of the sectors, classifications used, sources, etc
(e.g. only public sector, excl. enterprises with less than 5 employees, excl. informal sector, etc)
international comparisons difficult
5
Workshop on MDG Data Reconciliation: Employment Indicators, Beirut, 12-13 July 2012
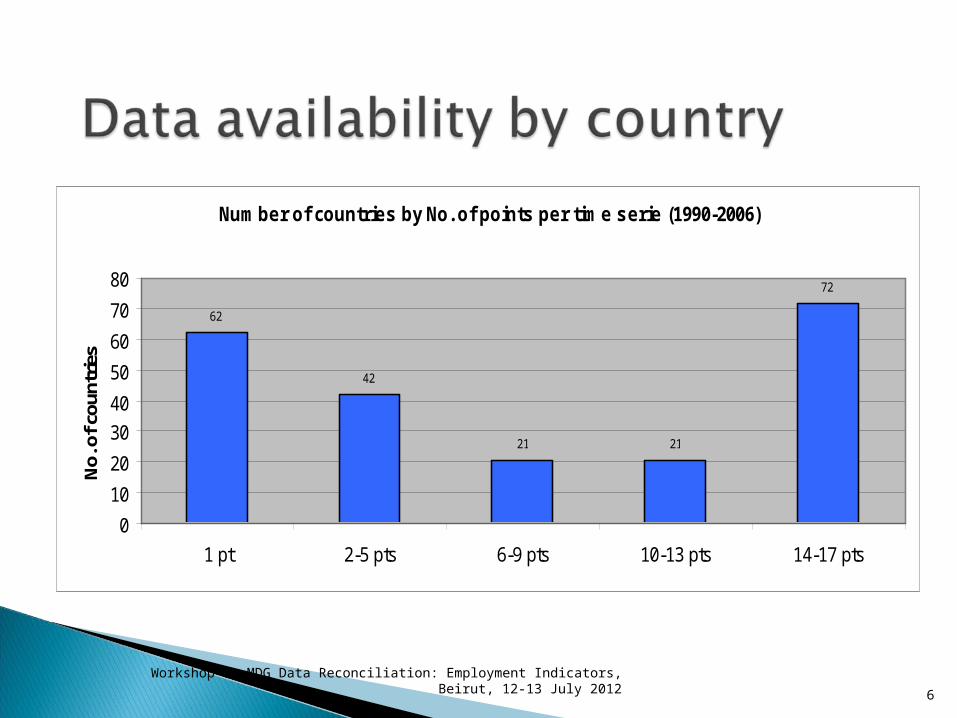
Number of countries by No. of points per time serie (1990-2006)
62
42
21 21
72
0
10
20
30
40
50
60
70
80
1 pt 2-5 pts 6-9 pts 10-13 pts 14-17 pts
No.
of c
ount
ries
6
Workshop on MDG Data Reconciliation: Employment Indicators, Beirut, 12-13 July 2012 7
Workshop on MDG Data Reconciliation: Employment Indicators, Beirut, 12-13 July 2012
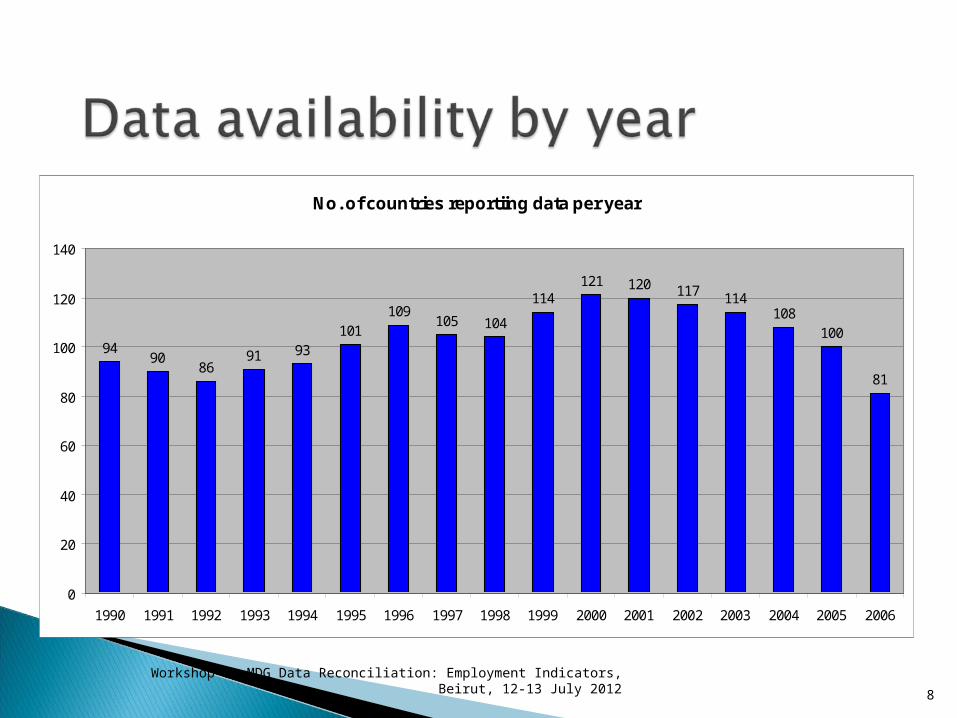
No. of countries reportiing data per year
9490
8691 93
101109
105 104
114121 120 117 114
108100
81
0
20
40
60
80
100
120
140
1990 1991 1992 1993 1994 1995 1996 1997 1998 1999 2000 2001 2002 2003 2004 2005 2006
8
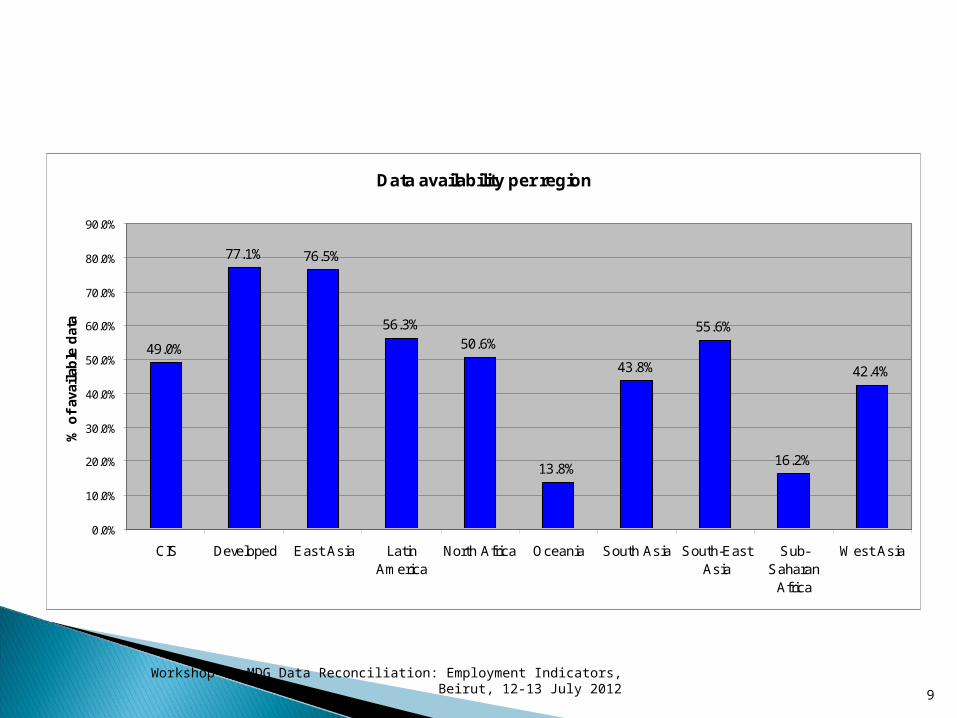
Data availability per region
49.0%
77.1% 76.5%
56.3%50.6%
13.8%
43.8%
55.6%
16.2%
42.4%
0.0%
10.0%
20.0%
30.0%
40.0%
50.0%
60.0%
70.0%
80.0%
90.0%
CIS Developed East Asia LatinAmerica
North Africa Oceania South Asia South-EastAsia
Sub-Saharan
Africa
West Asia
% o
f av
aila
ble
dat
a
Workshop on MDG Data Reconciliation: Employment Indicators, Beirut, 12-13 July 20129
Workshop on MDG Data Reconciliation: Employment Indicators, Beirut, 12-13 July 2012
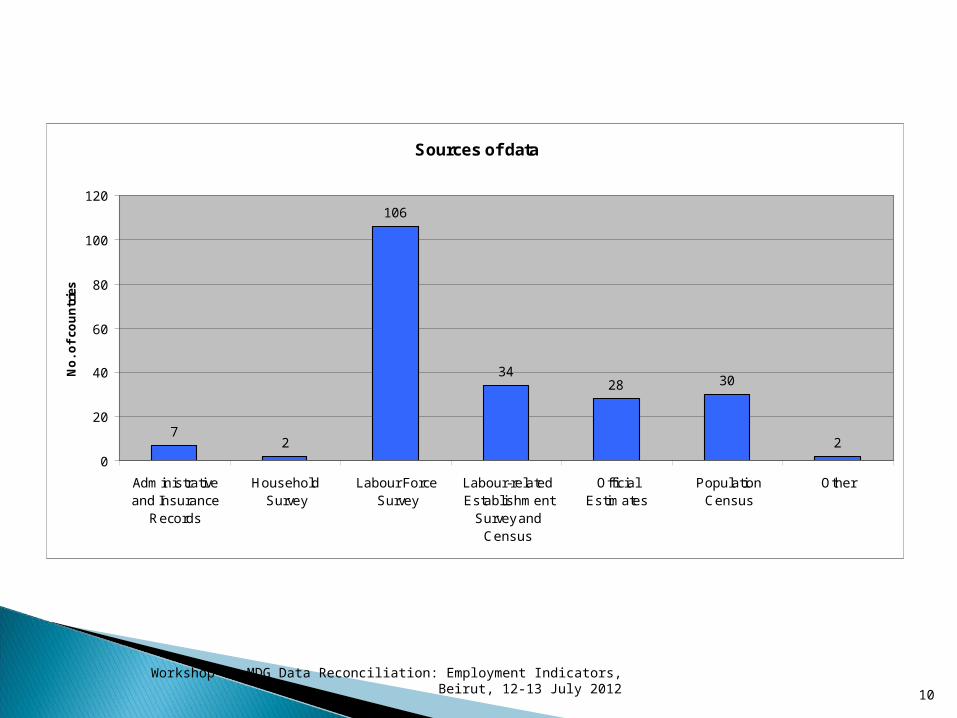
Sources of data
72
106
3428 30
2
0
20
40
60
80
100
120
Administrativeand Insurance
Records
HouseholdSurvey
Labour ForceSurvey
Labour-relatedEstablishment
Survey andCensus
OfficialEstimates
PopulationCensus
Other
No
. of
cou
ntr
ies
10
Estimations based on auxiliary variablesa) Total paid employmentb) Employeesc) Total employment in non-agricultured) Total employmente) Economically Active Population in non-agriculture
Sensitivity analysis conducted on a selected number of countries: there is strong correlation between the indicator and the auxiliary variables (a and b).
Workshop on MDG Data Reconciliation: Employment Indicators, Beirut, 12-13 July 201211
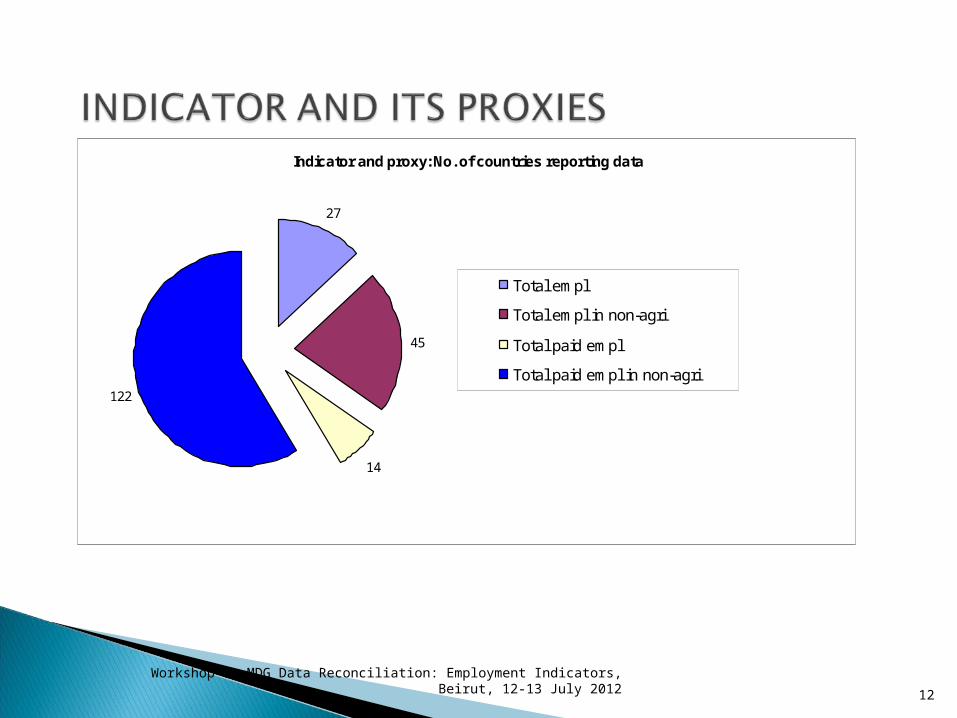
Indicator and proxy: No. of countries reporting data
27
45
14
122
Total empl
Total empl in non-agri
Total paid empl
Total paid empl in non-agri
Workshop on MDG Data Reconciliation: Employment Indicators, Beirut, 12-13 July 201212
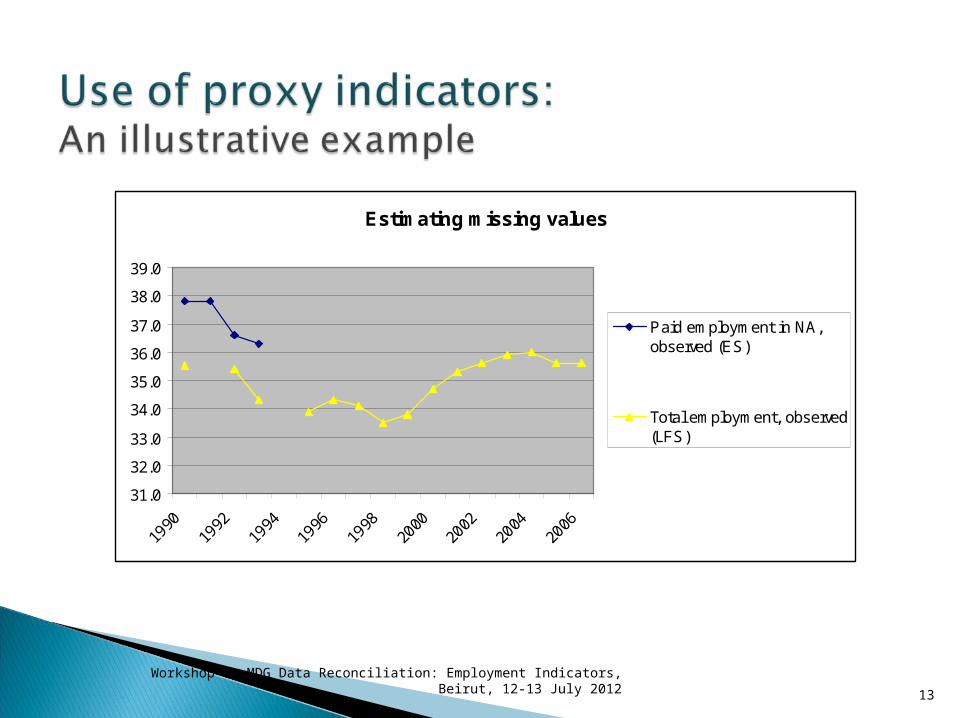
Estimating missing values
31.0
32.0
33.0
34.0
35.0
36.0
37.0
38.0
39.0
1990
1992
1994
1996
1998
2000
2002
2004
2006
Paid employment in NA,observed (ES)
#REF!
Total employment, observed(LFS)
Workshop on MDG Data Reconciliation: Employment Indicators, Beirut, 12-13 July 201213
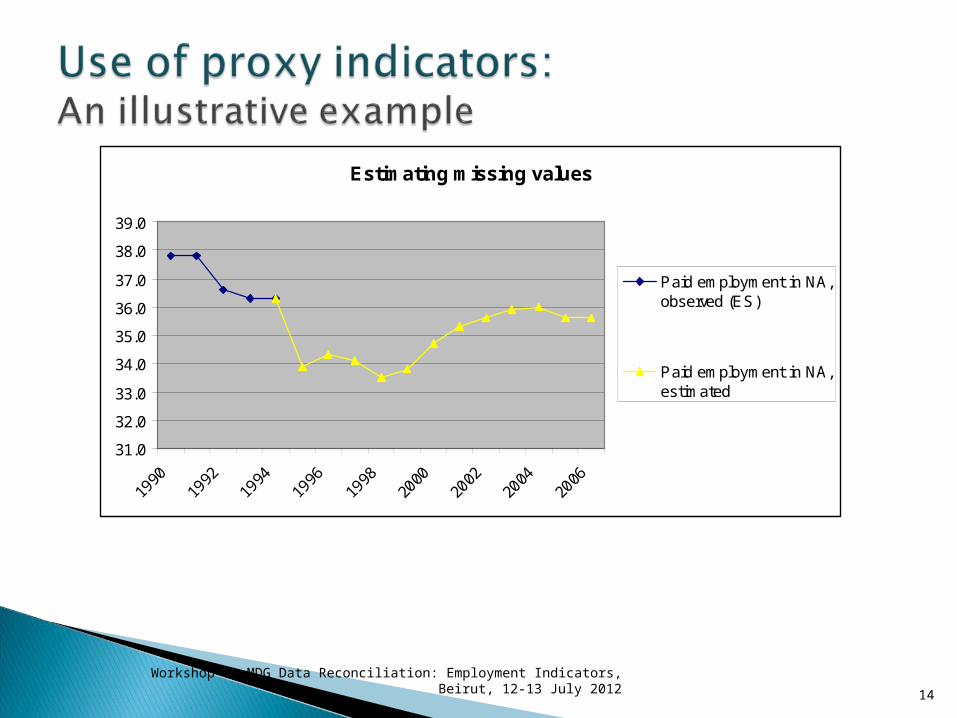
Estimating missing values
31.0
32.0
33.0
34.0
35.0
36.0
37.0
38.0
39.0
1990
1992
1994
1996
1998
2000
2002
2004
2006
Paid employment in NA,observed (ES)
#REF!
Paid employment in NA,estimated
Workshop on MDG Data Reconciliation: Employment Indicators, Beirut, 12-13 July 201214
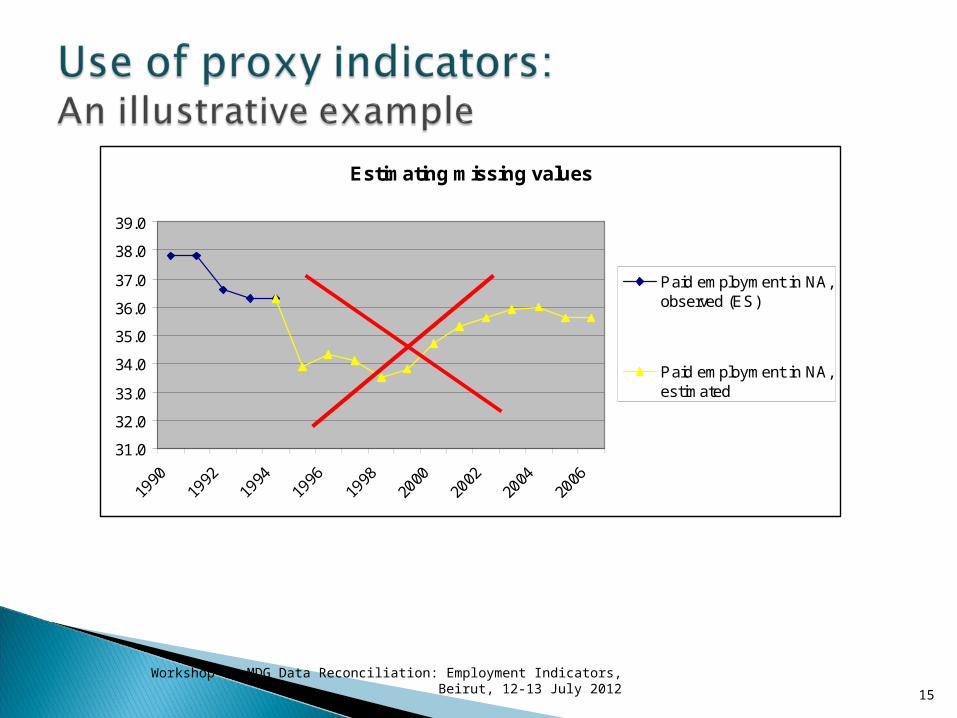
Estimating missing values
31.0
32.0
33.0
34.0
35.0
36.0
37.0
38.0
39.0
1990
1992
1994
1996
1998
2000
2002
2004
2006
Paid employment in NA,observed (ES)
#REF!
Paid employment in NA,estimated
Workshop on MDG Data Reconciliation: Employment Indicators, Beirut, 12-13 July 201215
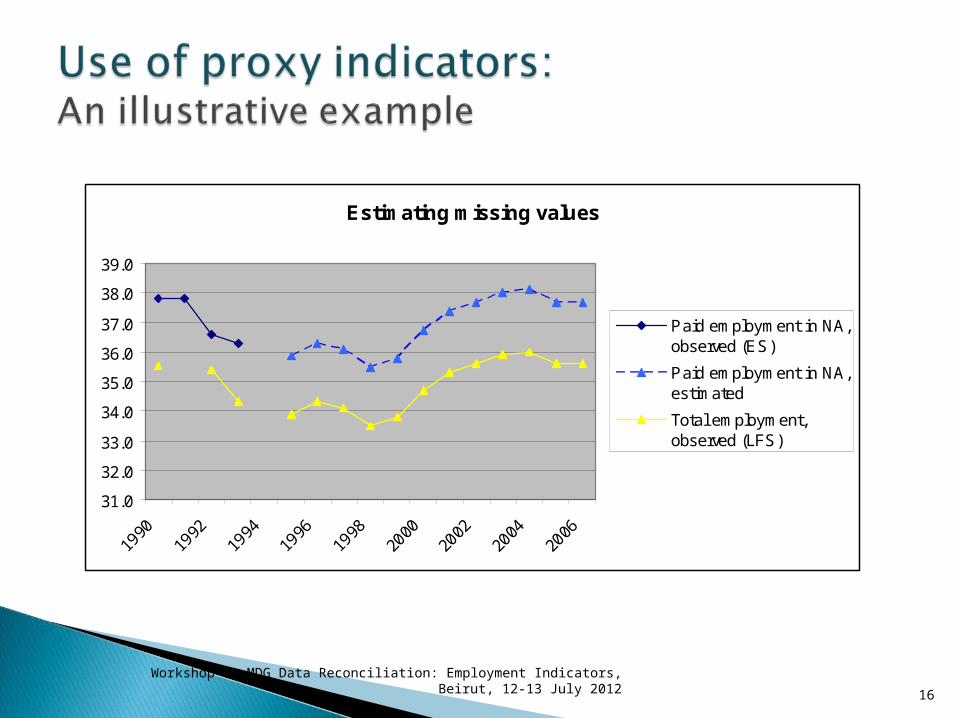
Estimating missing values
31.0
32.0
33.0
34.0
35.0
36.0
37.0
38.0
39.0
1990
1992
1994
1996
1998
2000
2002
2004
2006
Paid employment in NA,observed (ES)
Paid employment in NA,estimated
Total employment,observed (LFS)
Workshop on MDG Data Reconciliation: Employment Indicators, Beirut, 12-13 July 201216
Imputations for missing values-unavoidable in any aggregation process.
Assuming that, if there no data, the value of the indicator is zero results in biased regional and global estimates
Imputations:Implicit: assuming the value of the indicator is the
same as the average for the countries with available data
Explicit: (i) carry forward the last observed value; (ii) use the value of the indicator for a country with similar characteristics, (iii) predict the value by statistical modelling
Workshop on MDG Data Reconciliation: Employment Indicators, Beirut, 12-13 July 201217
In process of producing regional and global aggregates for MDG 3.2, ILO uses a methodology for explicit imputation for missing values
The sole purpose of these imputations is to produce the regional and global aggregates and may not be best-fitted for national reports.
The national imputations are best produced through methodologies that take directly into account the local specificities of the country concerned.
Workshop on MDG Data Reconciliation: Employment Indicators, Beirut, 12-13 July 201218
Separate two-level models developed for each region. The models take into account
- between-countries variation over time,- within-country variation over time.
Predicted values are based on the assumption that the data that are available for a given country are representative of that country’s deviation from the average trend across time in its region.
Workshop on MDG Data Reconciliation: Employment Indicators, Beirut, 12-13 July 201219
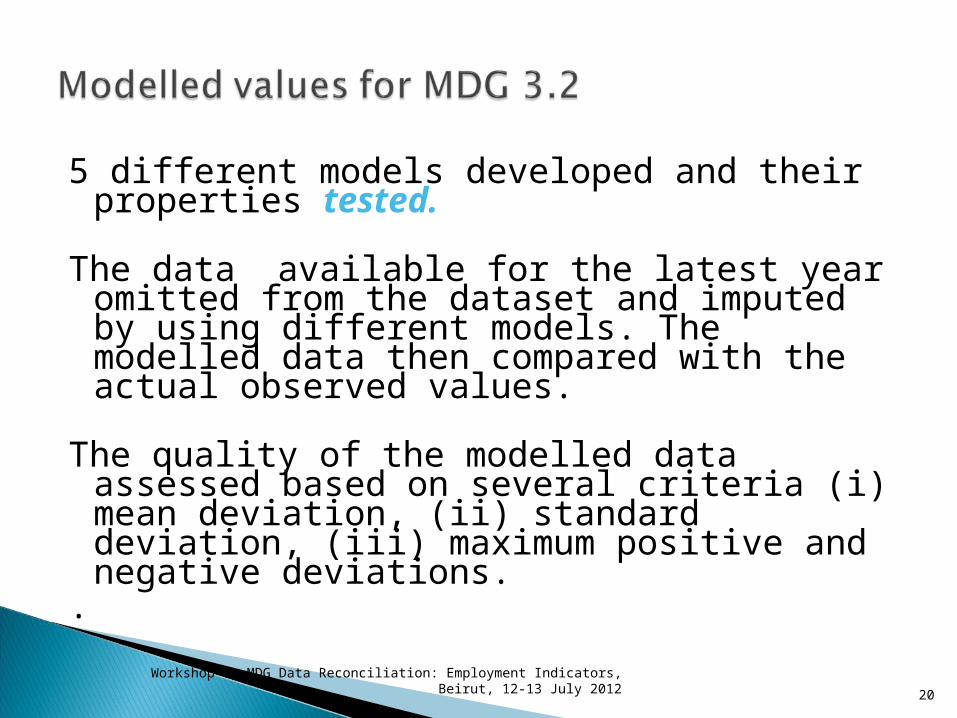
5 different models developed and their properties tested.
The data available for the latest year omitted from the dataset and imputed by using different models. The modelled data then compared with the actual observed values.
The quality of the modelled data assessed
based on several criteria (i) mean deviation, (ii) standard deviation, (iii) maximum positive and negative deviations.
.
Workshop on MDG Data Reconciliation: Employment Indicators, Beirut, 12-13 July 201220
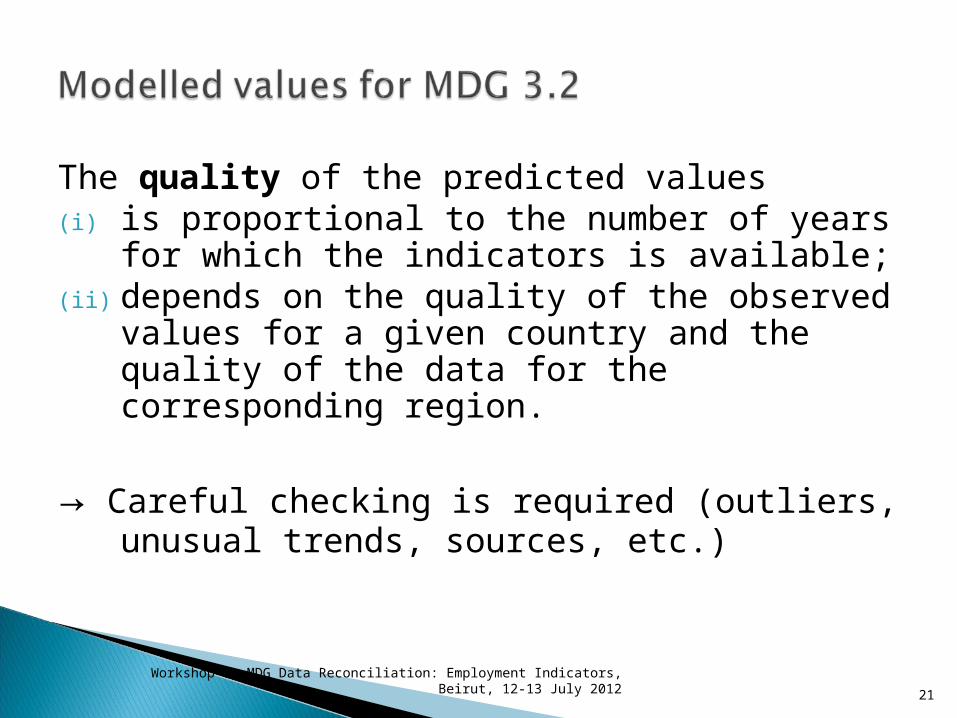
The quality of the predicted values (i) is proportional to the number of years for
which the indicators is available;(ii) depends on the quality of the observed
values for a given country and the quality of the data for the corresponding region.
→ Careful checking is required (outliers, unusual trends, sources, etc.)
Workshop on MDG Data Reconciliation: Employment Indicators, Beirut, 12-13 July 201221
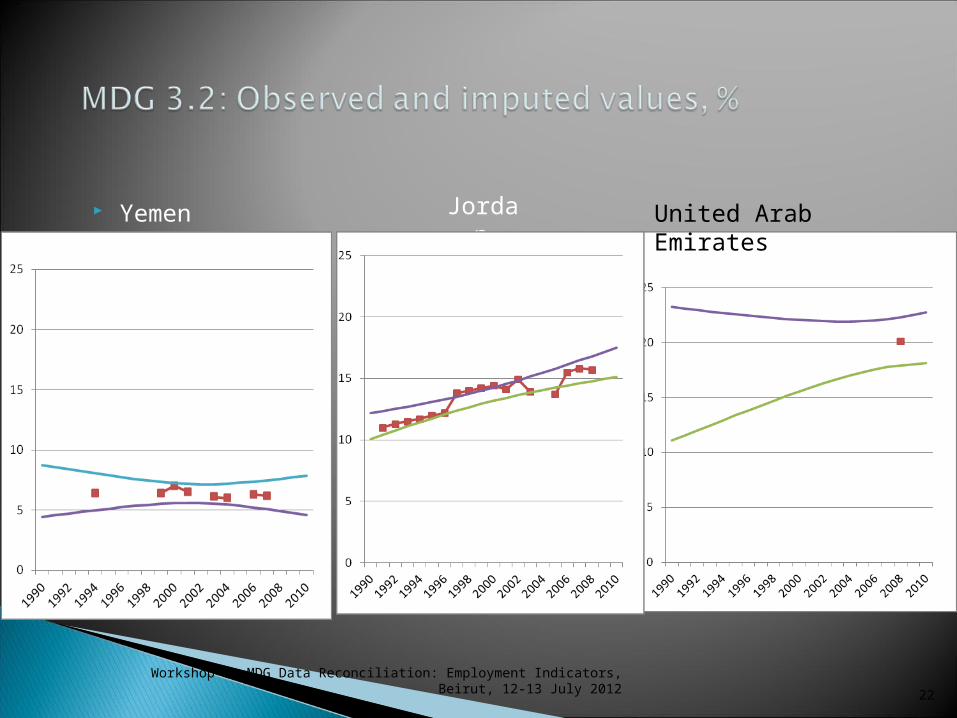
Yemen: Jordan
Workshop on MDG Data Reconciliation: Employment Indicators, Beirut, 12-13 July 2012
United Arab Emirates
22
Workshop on MDG Data Reconciliation: Employment Indicators, Beirut, 12-13 July 201223
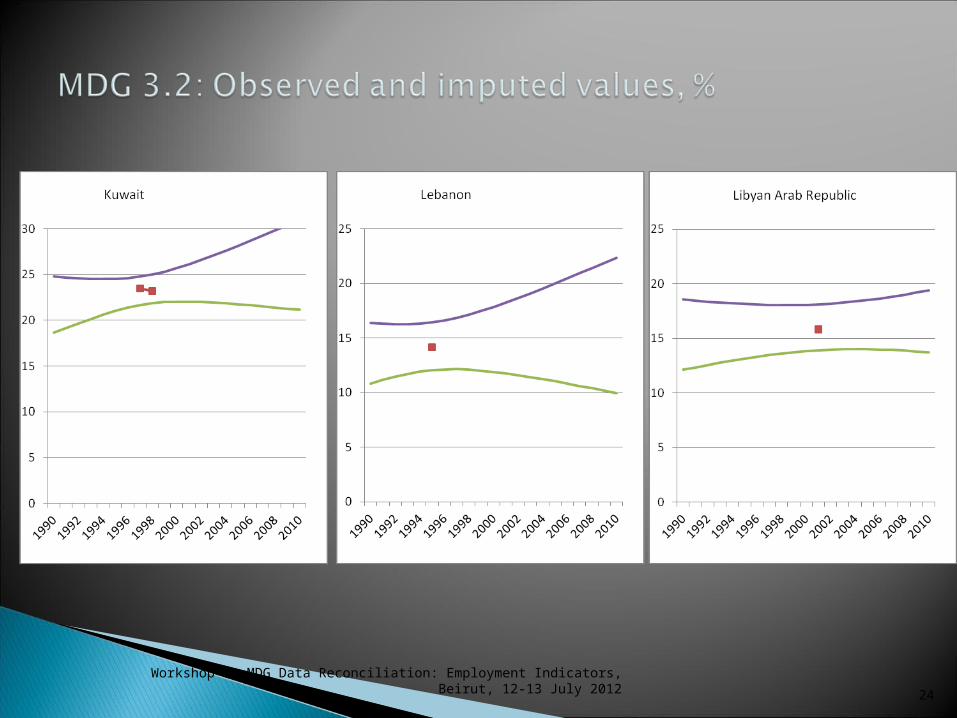
Workshop on MDG Data Reconciliation: Employment Indicators, Beirut, 12-13 July 201224
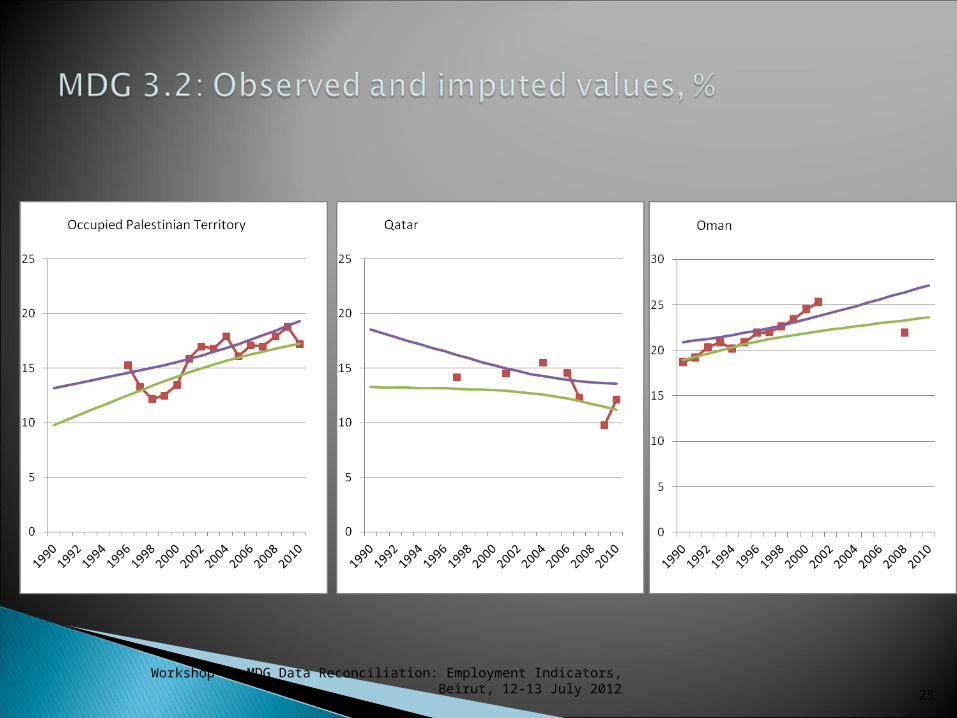
Workshop on MDG Data Reconciliation: Employment Indicators, Beirut, 12-13 July 201225
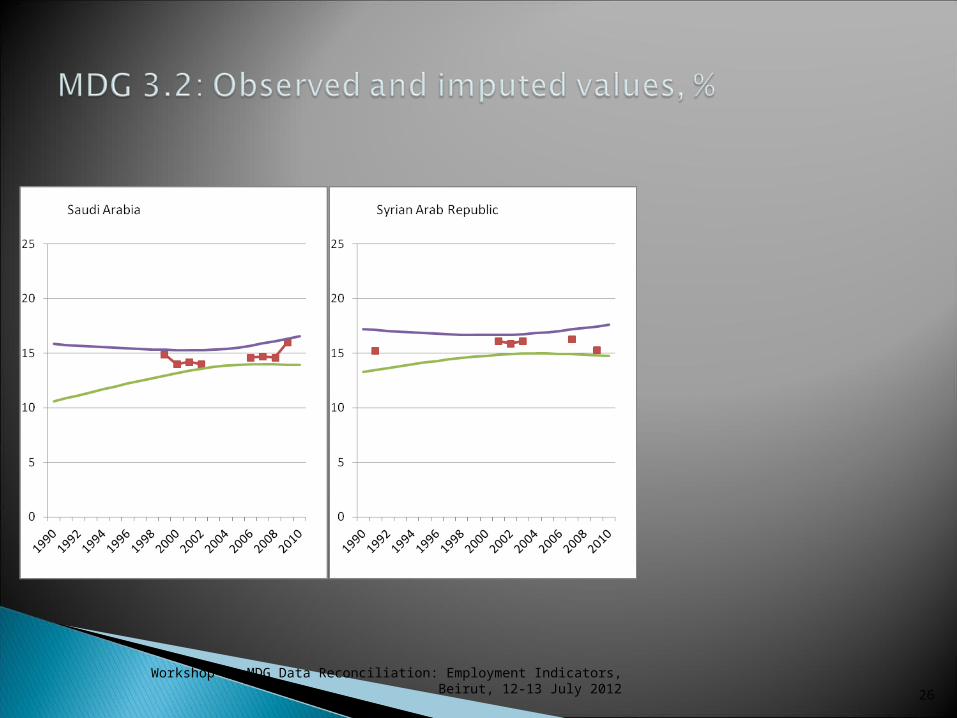
Workshop on MDG Data Reconciliation: Employment Indicators, Beirut, 12-13 July 201226
Methodological descriptions of the sources of data disseminated at http://laborsta.ilo.org/ .
The estimated values based on proxy indicators are disseminated on the MDG website (note: estimated).
The modelled data are not disseminated as their sole purpose is to produce the regional and global aggregates.
The ILO is making its methodology for imputing missing values in the process of producing regional and global aggregates publicly available.
Workshop on MDG Data Reconciliation: Employment Indicators, Beirut, 12-13 July 201227
Workshop on MDG Data Reconciliation: Employment Indicators, Beirut, 12-13
July 2012
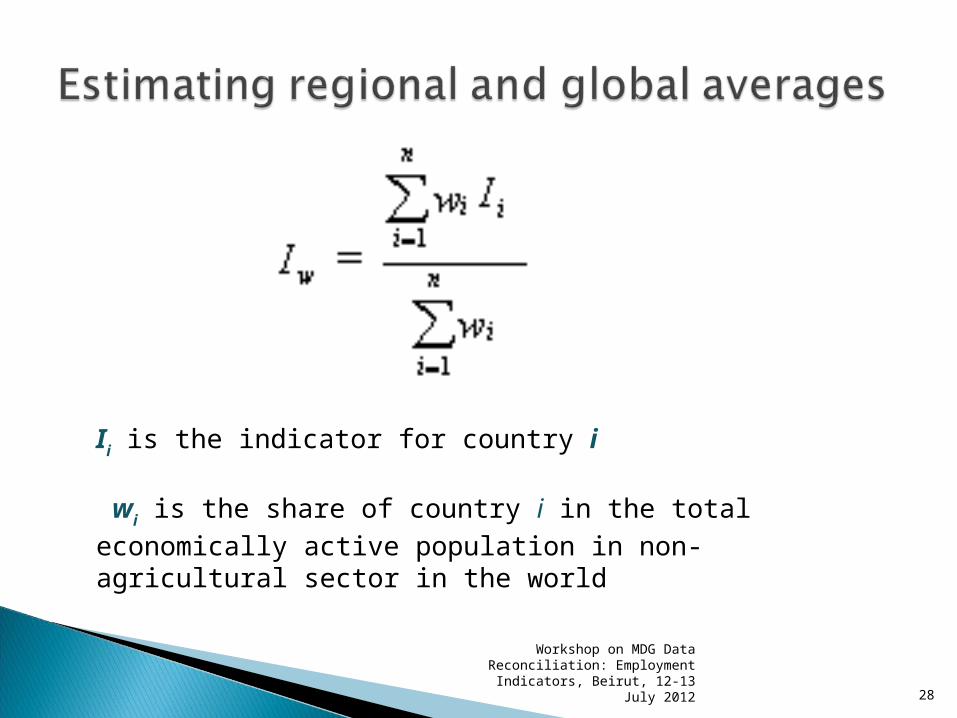
Ii is the indicator for country i
wi is the share of country i in the total economically active
population in non-agricultural sector in the world
28
Workshop on MDG Data Reconciliation: Employment Indicators, Beirut, 12-13
July 2012
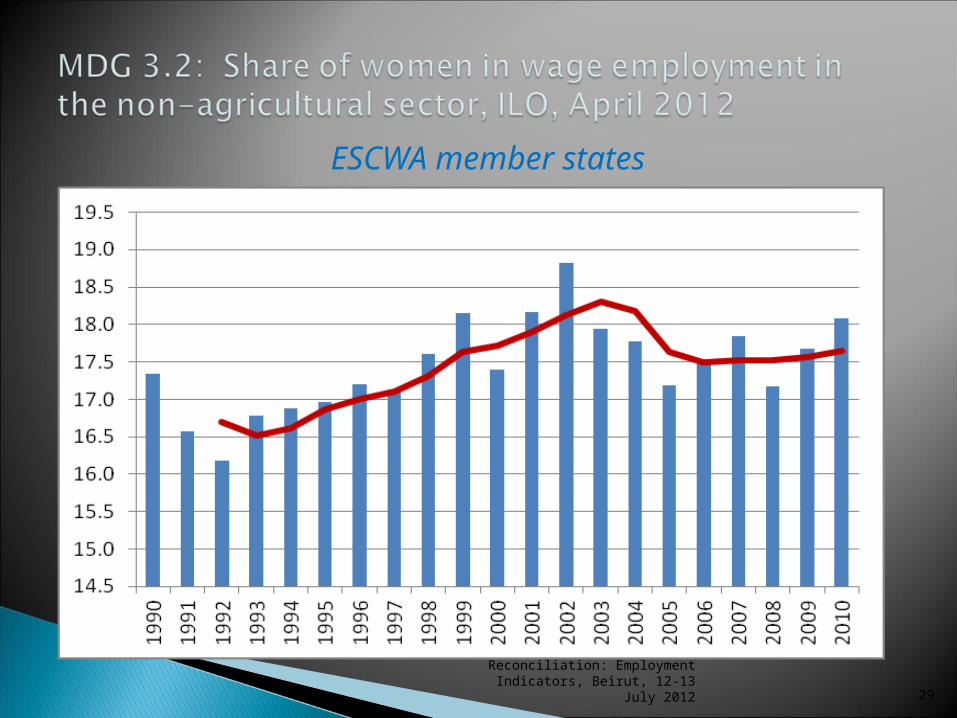
ESCWA member states
29
Workshop on MDG Data Reconciliation: Employment Indicators, Beirut, 12-13
July 2012
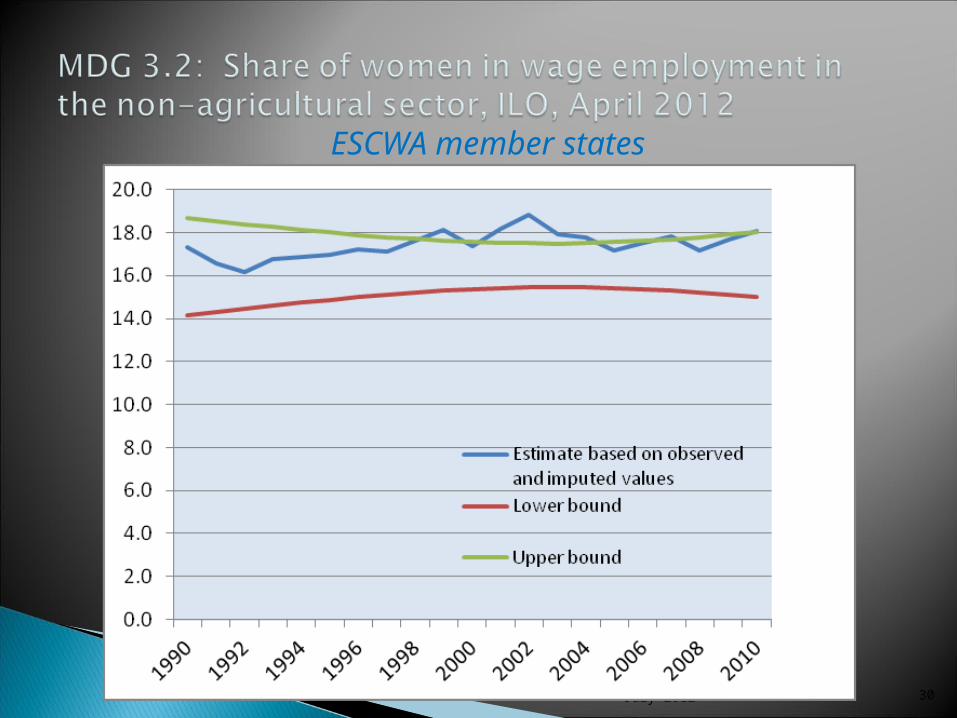
ESCWA member states
30