Embed Size (px)
Citation preview
Valero Energy Reports Third Quarter 2021 Results
• Reported net income attributable to Valero stockholders of $463 million, or $1.13 per
share.
• Reported adjusted net income attributable to Valero stockholders of $500 million, or $1.22
per share.
• Returned $400 million in cash to stockholders through dividends.
• Redeemed the total outstanding balance of $575 million Floating Rate Senior Notes due in
2023.
• Completed the Diamond Green Diesel expansion project (DGD 2).
• Completed and started up the new Pembroke Cogeneration Unit.
SAN ANTONIO, October 21, 2021 – Valero Energy Corporation (NYSE: VLO, “Valero”) today
reported net income attributable to Valero stockholders of $463 million, or $1.13 per share, for the
third quarter of 2021, compared to a net loss of $464 million, or $1.14 per share, for the third
quarter of 2020. Excluding the adjustments shown in the accompanying earnings release tables,
third quarter 2021 adjusted net income attributable to Valero stockholders was $500 million, or
$1.22 per share, compared to an adjusted net loss attributable to Valero stockholders of
$472 million, or $1.16 per share, for the third quarter of 2020.
Refining
The refining segment reported $835 million of operating income for the third quarter of 2021,
compared to a $629 million operating loss for the third quarter of 2020. Third quarter 2021
adjusted operating income was $853 million, compared to an adjusted operating loss of
$575 million for the third quarter of 2020. Refinery throughput volumes averaged 2.9 million
barrels per day in the third quarter of 2021, which was 338 thousand barrels per day higher than
the third quarter of 2020.
“We saw significant improvement in refining margins in the third quarter as economic activity and
mobility continued to recover in key markets,” said Joe Gorder, Valero Chairman and Chief
Executive Officer. “The continued improvement in earnings of our refining business, coupled with
the ongoing expansion of our renewables businesses, should strengthen our competitive advantage
and drive long-term shareholder returns.”
Renewable Diesel
The renewable diesel segment, which consists of the Diamond Green Diesel (DGD) joint venture,
reported $108 million of operating income for the third quarter of 2021, compared to $184 million
for the third quarter of 2020. Renewable diesel sales volumes averaged 671 thousand gallons per
day in the third quarter of 2021, which was 199 thousand gallons per day lower than the third
quarter of 2020. The lower operating income and sales volumes in the third quarter of 2021 are
primarily attributed to plant downtime due to Hurricane Ida.
Ethanol
The ethanol segment reported a $44 million operating loss for the third quarter of 2021, compared
to $22 million of operating income for the third quarter of 2020. Excluding the adjustments shown
in the accompanying earnings release tables, third quarter 2021 adjusted operating income was
$4 million, compared to $36 million for the third quarter of 2020. Ethanol production volumes
averaged 3.6 million gallons per day in the third quarter of 2021, which was 175 thousand gallons
per day lower than the third quarter of 2020.
Corporate and Other
General and administrative expenses were $195 million in the third quarter of 2021, compared to
$186 million in the third quarter of 2020. The effective tax rate for the third quarter of 2021 was
11 percent, which reflects the benefit from the portion of DGD’s net income that is not taxable to
Valero.
Investing and Financing Activities
Net cash provided by operating activities was $1.4 billion in the third quarter of 2021. Included in
this amount was a $379 million favorable impact from working capital and $59 million associated
with our joint venture partner’s share of DGD’s net cash provided by operating activities,
excluding changes in DGD’s working capital. Excluding these items, adjusted net cash provided
by operating activities was $1.0 billion.
Capital investments totaled $585 million in the third quarter of 2021, of which $191 million was
for sustaining the business, including costs for turnarounds, catalysts and regulatory compliance.
Excluding capital investments attributable to our partner’s 50 percent share of DGD and those
related to other variable interest entities, capital investments attributable to Valero were
$392 million.
Valero returned $400 million to stockholders through dividends for a payout ratio of 40 percent of
adjusted net cash provided by operating activities in the third quarter of 2021.
Valero continues to target a long-term total payout ratio between 40 and 50 percent of adjusted net
cash provided by operating activities. Valero defines total payout ratio as the sum of dividends and
stock buybacks divided by net cash provided by operating activities adjusted for changes in
working capital and DGD’s net cash provided by operating activities, excluding changes in its
working capital, attributable to our joint venture partner’s ownership interest in DGD.
Valero redeemed the entire outstanding principal amount of its $575 million Floating Rate Senior
Notes due in 2023 at par value, plus accrued and unpaid interest on September 27, 2021.
Liquidity and Financial Position
Valero ended the third quarter of 2021 with $14.2 billion of total debt and finance lease obligations
and $3.5 billion of cash and cash equivalents. The debt to capitalization ratio, net of cash and cash
equivalents, was 37 percent as of September 30, 2021.
Strategic Update
The Diamond Green Diesel expansion project at Valero’s St. Charles refinery (DGD 2), which
increases renewable diesel production capacity by 400 million gallons per year, was completed in
the third quarter and is in the process of starting up.
“We are excited to report that the Diamond Green Diesel expansion project at Valero’s St. Charles
refinery was successfully completed on-budget and ahead of schedule,” said Gorder. “This is a
testament to the strength of our engineering and operations teams, who got this accomplished
despite Hurricane Ida related challenges.”
The new DGD plant at Valero’s Port Arthur refinery (DGD 3), which is expected to have a
renewable diesel production capacity of 470 million gallons per year, is progressing well and is
still expected to commence operations in the first half of 2023, increasing DGD’s total annual
production capacity to approximately 1.2 billion gallons of renewable diesel and 50 million gallons
of renewable naphtha.
The large-scale carbon sequestration project with BlackRock and Navigator is also progressing on
schedule. Navigator has received the necessary board approvals to proceed with the carbon capture
pipeline system as a result of a successful binding open season. Valero is expected to be the anchor
shipper with eight of Valero’s ethanol plants connected to this system, producing a lower carbon
intensity ethanol product to be marketed in low-carbon fuel markets that is expected to result in a
higher product margin.
Refinery optimization projects that are expected to reduce cost and improve margin capture are
progressing on schedule. The Pembroke Cogeneration Unit, which is expected to provide an
efficient and reliable source of electricity and steam, was completed and commissioned in the third
quarter of 2021. The Port Arthur Coker project, which is expected to increase the refinery’s
utilization rate and improve turnaround efficiency, is still expected to be completed in 2023.
Capital investments attributable to Valero are forecasted to be $2.0 billion in 2021, of which
approximately 60 percent is for sustaining the business and approximately 40 percent is for growth
projects. Over 60 percent of Valero’s 2021 growth capital is allocated to expanding the renewable
diesel business.
Conference Call
Valero’s senior management will hold a conference call at 10 a.m. ET today to discuss this earnings
release and to provide an update on operations and strategy.
About Valero
Valero Energy Corporation, through its subsidiaries (collectively, “Valero”), is an international
manufacturer and marketer of transportation fuels and petrochemical products. Valero is a
Fortune 500 company based in San Antonio, Texas, and owns 15 petroleum refineries with a
combined throughput capacity of approximately 3.2 million barrels per day and 12 ethanol plants
with a combined production capacity of approximately 1.6 billion gallons per year. The petroleum
refineries are located in the United States (U.S.), Canada and the United Kingdom (U.K.), and the
ethanol plants are located in the Mid-Continent region of the U.S. Valero is also a joint venture
partner in Diamond Green Diesel, which owns and operates a renewable diesel plant in Norco,
Louisiana. Diamond Green Diesel owns North America’s largest biomass-based diesel plant.
Valero sells its products in the wholesale rack or bulk markets in the U.S., Canada, the U.K., Ireland
and Latin America. Approximately 7,000 outlets carry Valero’s brand names. Please visit
www.investorvalero.com for more information.
Valero Contacts
Investors:
Homer Bhullar, Vice President – Investor Relations and Finance, 210-345-1982
Eric Herbort, Senior Manager – Investor Relations, 210-345-3331
Gautam Srivastava, Senior Manager – Investor Relations, 210-345-3992
Media:
Lillian Riojas, Executive Director – Media Relations and Communications, 210-345-5002
Safe-Harbor Statement
Statements contained in this release and the accompanying tables that state the company’s or
management’s expectations or predictions of the future are forward-looking statements intended
to be covered by the safe harbor provisions of the Securities Act of 1933 and the Securities
Exchange Act of 1934. The words “believe,” “expect,” “should,” “estimates,” “intend,” “target,”
“will,” “plans,” “forecast,” and other similar expressions identify forward-looking statements.
Forward-looking statements in this release and the accompanying tables include those relating to
our greenhouse gas emissions targets, expected timing of completion and performance of projects,
future market and industry conditions, future operating and financial performance and
management of future risks. It is important to note that actual results could differ materially from
those projected in such forward-looking statements based on numerous factors, including those
outside of the company’s control, such as legislative or political changes or developments, market
dynamics, cyberattacks, weather events, and other matters affecting our operations or the demand
for our products. These factors also include, but are not limited to, the uncertainties that remain
with respect to the COVID-19 pandemic, variants of the virus, governmental and societal
responses thereto, including requirements and mandates with respect to vaccines, vaccine
distribution and administration levels, and the adverse effects the foregoing may have on our
business or economic conditions generally. For more information concerning these and other
factors that could cause actual results to differ from those expressed or forecasted, see Valero’s
annual report on Form 10-K, quarterly reports on Form 10-Q, and other reports filed with the
Securities and Exchange Commission and available on Valero’s website at www.valero.com.
Use of Non-GAAP Financial Information
This earnings release and the accompanying earnings release tables include references to financial
measures that are not defined under U.S. generally accepted accounting principles (GAAP). These
non-GAAP measures include adjusted net income (loss) attributable to Valero stockholders,
adjusted earnings (loss) per common share – assuming dilution, refining margin, renewable diesel
margin, ethanol margin, adjusted refining operating income (loss), adjusted renewable diesel
operating income, adjusted ethanol operating income (loss), adjusted net cash provided by (used
in) operating activities, and capital investments attributable to Valero. These non-GAAP financial

measures have been included to help facilitate the comparison of operating results between
periods. See the accompanying earnings release tables for a reconciliation of non-GAAP measures
to their most directly comparable U.S. GAAP measures. Note (h) to the earnings release tables
provides reasons for the use of these non-GAAP financial measures.
Three Months EndedSeptember 30,
Nine Months EndedSeptember 30,
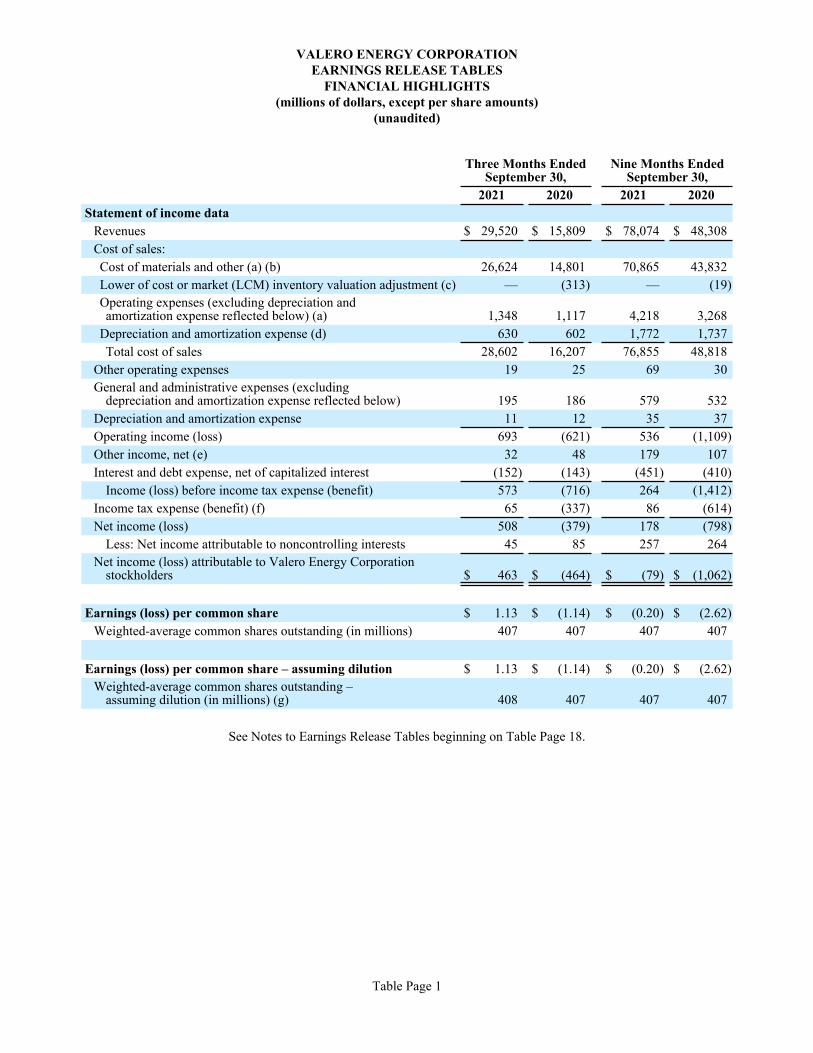
2021 2020 2021 2020Statement of income data
Revenues $ 29,520 $ 15,809 $ 78,074 $ 48,308 Cost of sales:Cost of materials and other (a) (b) 26,624 14,801 70,865 43,832 Lower of cost or market (LCM) inventory valuation adjustment (c) — (313) — (19) Operating expenses (excluding depreciation andamortization expense reflected below) (a) 1,348 1,117 4,218 3,268
Depreciation and amortization expense (d) 630 602 1,772 1,737 Total cost of sales 28,602 16,207 76,855 48,818
Other operating expenses 19 25 69 30 General and administrative expenses (excluding
depreciation and amortization expense reflected below) 195 186 579 532 Depreciation and amortization expense 11 12 35 37 Operating income (loss) 693 (621) 536 (1,109) Other income, net (e) 32 48 179 107 Interest and debt expense, net of capitalized interest (152) (143) (451) (410)
Income (loss) before income tax expense (benefit) 573 (716) 264 (1,412) Income tax expense (benefit) (f) 65 (337) 86 (614) Net income (loss) 508 (379) 178 (798)
Less: Net income attributable to noncontrolling interests 45 85 257 264 Net income (loss) attributable to Valero Energy Corporation
stockholders $ 463 $ (464) $ (79) $ (1,062)
Earnings (loss) per common share $ 1.13 $ (1.14) $ (0.20) $ (2.62) Weighted-average common shares outstanding (in millions) 407 407 407 407
Earnings (loss) per common share – assuming dilution $ 1.13 $ (1.14) $ (0.20) $ (2.62) Weighted-average common shares outstanding –
assuming dilution (in millions) (g) 408 407 407 407
See Notes to Earnings Release Tables beginning on Table Page 18.
VALERO ENERGY CORPORATIONEARNINGS RELEASE TABLES
FINANCIAL HIGHLIGHTS (millions of dollars, except per share amounts)
(unaudited)
Table Page 1
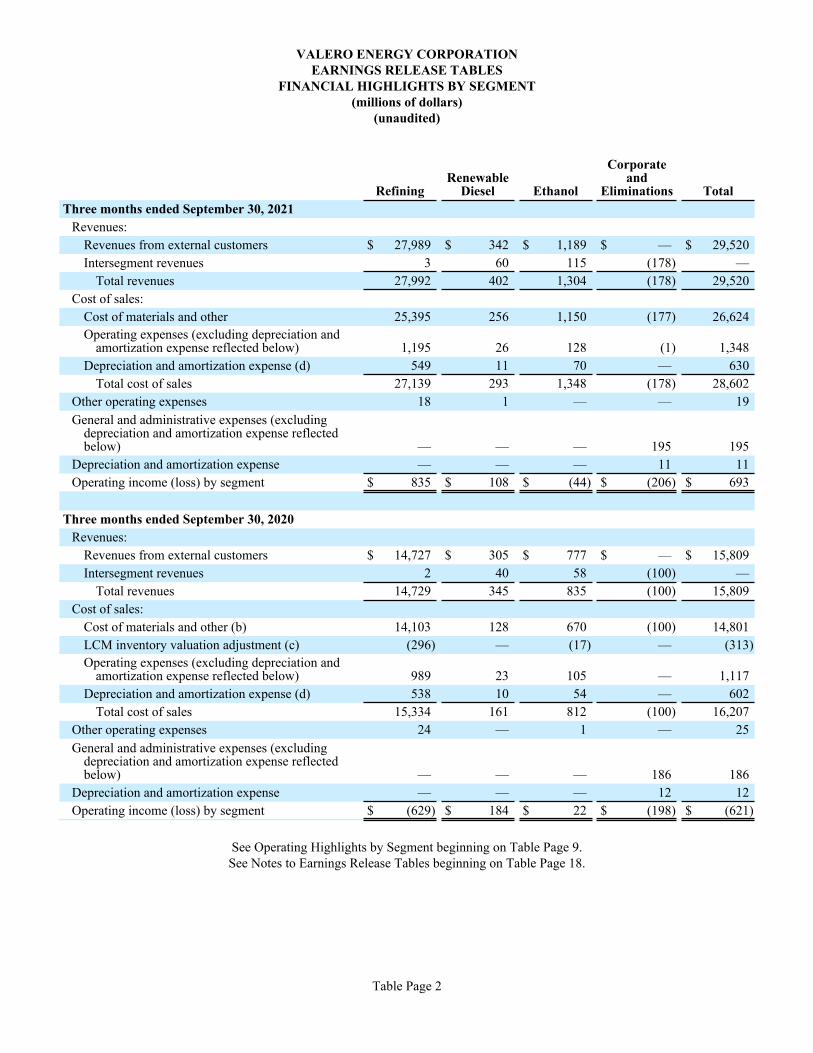
RefiningRenewable
Diesel Ethanol
Corporateand
Eliminations TotalThree months ended September 30, 2021
Revenues:Revenues from external customers $ 27,989 $ 342 $ 1,189 $ — $ 29,520 Intersegment revenues 3 60 115 (178) —
Total revenues 27,992 402 1,304 (178) 29,520 Cost of sales:
Cost of materials and other 25,395 256 1,150 (177) 26,624 Operating expenses (excluding depreciation and
amortization expense reflected below) 1,195 26 128 (1) 1,348 Depreciation and amortization expense (d) 549 11 70 — 630
Total cost of sales 27,139 293 1,348 (178) 28,602 Other operating expenses 18 1 — — 19 General and administrative expenses (excluding
depreciation and amortization expense reflectedbelow) — — — 195 195
Depreciation and amortization expense — — — 11 11 Operating income (loss) by segment $ 835 $ 108 $ (44) $ (206) $ 693
Three months ended September 30, 2020Revenues:
Revenues from external customers $ 14,727 $ 305 $ 777 $ — $ 15,809 Intersegment revenues 2 40 58 (100) —
Total revenues 14,729 345 835 (100) 15,809 Cost of sales:
Cost of materials and other (b) 14,103 128 670 (100) 14,801 LCM inventory valuation adjustment (c) (296) — (17) — (313) Operating expenses (excluding depreciation and
amortization expense reflected below) 989 23 105 — 1,117 Depreciation and amortization expense (d) 538 10 54 — 602
Total cost of sales 15,334 161 812 (100) 16,207 Other operating expenses 24 — 1 — 25 General and administrative expenses (excluding
depreciation and amortization expense reflectedbelow) — — — 186 186
Depreciation and amortization expense — — — 12 12 Operating income (loss) by segment $ (629) $ 184 $ 22 $ (198) $ (621)
See Operating Highlights by Segment beginning on Table Page 9.See Notes to Earnings Release Tables beginning on Table Page 18.
VALERO ENERGY CORPORATIONEARNINGS RELEASE TABLES
FINANCIAL HIGHLIGHTS BY SEGMENT(millions of dollars)
(unaudited)
Table Page 2
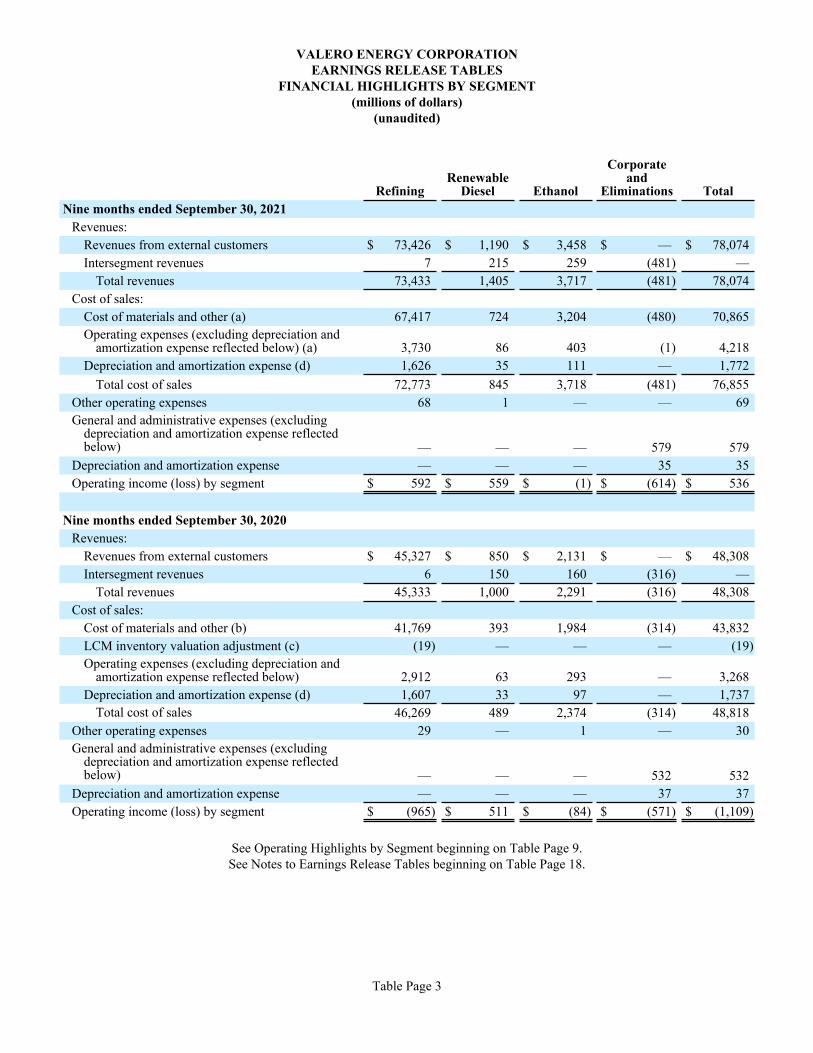
Nine months ended September 30, 2021Revenues:
Revenues from external customers $ 73,426 $ 1,190 $ 3,458 $ — $ 78,074 Intersegment revenues 7 215 259 (481) —
Total revenues 73,433 1,405 3,717 (481) 78,074 Cost of sales:
Cost of materials and other (a) 67,417 724 3,204 (480) 70,865 Operating expenses (excluding depreciation and
amortization expense reflected below) (a) 3,730 86 403 (1) 4,218 Depreciation and amortization expense (d) 1,626 35 111 — 1,772
Total cost of sales 72,773 845 3,718 (481) 76,855 Other operating expenses 68 1 — — 69 General and administrative expenses (excluding
depreciation and amortization expense reflectedbelow) — — — 579 579
Depreciation and amortization expense — — — 35 35 Operating income (loss) by segment $ 592 $ 559 $ (1) $ (614) $ 536
Nine months ended September 30, 2020Revenues:
Revenues from external customers $ 45,327 $ 850 $ 2,131 $ — $ 48,308 Intersegment revenues 6 150 160 (316) —
Total revenues 45,333 1,000 2,291 (316) 48,308 Cost of sales:
Cost of materials and other (b) 41,769 393 1,984 (314) 43,832 LCM inventory valuation adjustment (c) (19) — — — (19) Operating expenses (excluding depreciation and
amortization expense reflected below) 2,912 63 293 — 3,268 Depreciation and amortization expense (d) 1,607 33 97 — 1,737
Total cost of sales 46,269 489 2,374 (314) 48,818 Other operating expenses 29 — 1 — 30 General and administrative expenses (excluding
depreciation and amortization expense reflectedbelow) — — — 532 532
Depreciation and amortization expense — — — 37 37 Operating income (loss) by segment $ (965) $ 511 $ (84) $ (571) $ (1,109)
RefiningRenewable
Diesel Ethanol
Corporateand
Eliminations Total
See Operating Highlights by Segment beginning on Table Page 9.See Notes to Earnings Release Tables beginning on Table Page 18.
VALERO ENERGY CORPORATIONEARNINGS RELEASE TABLES
FINANCIAL HIGHLIGHTS BY SEGMENT(millions of dollars)
(unaudited)
Table Page 3
Three Months EndedSeptember 30,
Nine Months EndedSeptember 30,
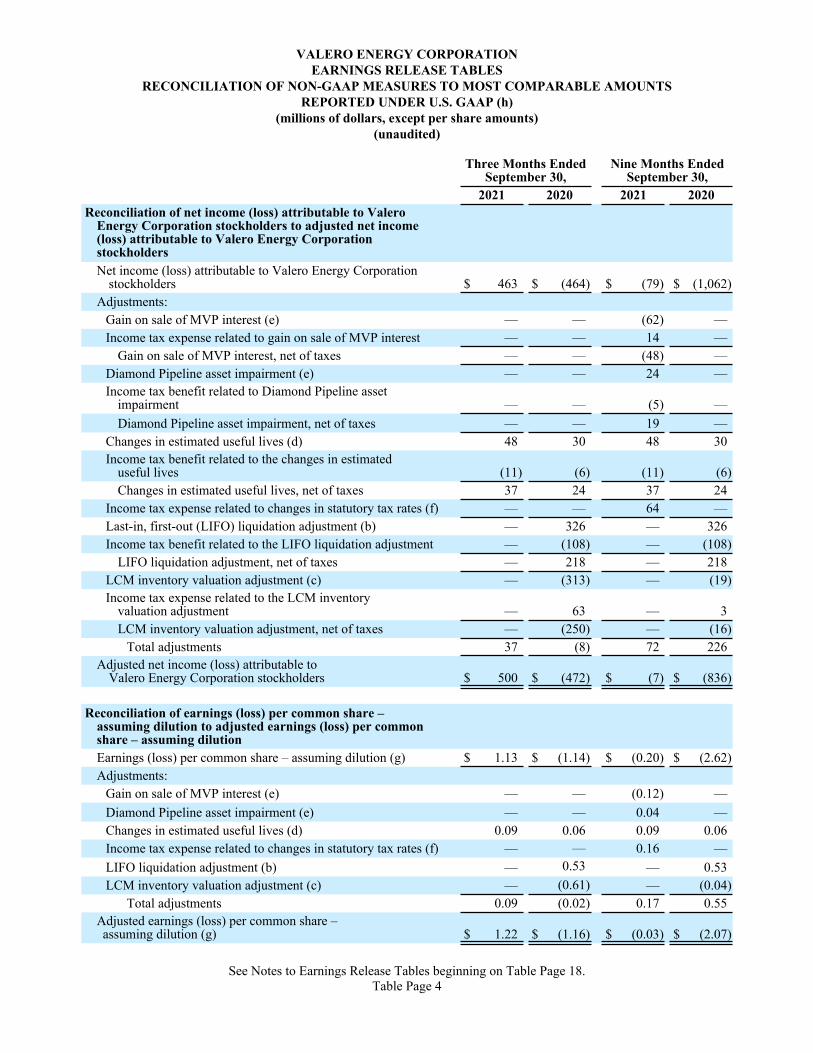
2021 2020 2021 2020Reconciliation of net income (loss) attributable to Valero
Energy Corporation stockholders to adjusted net income(loss) attributable to Valero Energy CorporationstockholdersNet income (loss) attributable to Valero Energy Corporation
stockholders $ 463 $ (464) $ (79) $ (1,062) Adjustments:
Gain on sale of MVP interest (e) — — (62) — Income tax expense related to gain on sale of MVP interest — — 14 —
Gain on sale of MVP interest, net of taxes — — (48) — Diamond Pipeline asset impairment (e) — — 24 — Income tax benefit related to Diamond Pipeline asset
impairment — — (5) — Diamond Pipeline asset impairment, net of taxes — — 19 —
Changes in estimated useful lives (d) 48 30 48 30 Income tax benefit related to the changes in estimated
useful lives (11) (6) (11) (6) Changes in estimated useful lives, net of taxes 37 24 37 24
Income tax expense related to changes in statutory tax rates (f) — — 64 — Last-in, first-out (LIFO) liquidation adjustment (b) — 326 — 326 Income tax benefit related to the LIFO liquidation adjustment — (108) — (108)
LIFO liquidation adjustment, net of taxes — 218 — 218 LCM inventory valuation adjustment (c) — (313) — (19) Income tax expense related to the LCM inventory
valuation adjustment — 63 — 3 LCM inventory valuation adjustment, net of taxes — (250) — (16)
Total adjustments 37 (8) 72 226 Adjusted net income (loss) attributable to
Valero Energy Corporation stockholders $ 500 $ (472) $ (7) $ (836)
Reconciliation of earnings (loss) per common share –assuming dilution to adjusted earnings (loss) per commonshare – assuming dilutionEarnings (loss) per common share – assuming dilution (g) $ 1.13 $ (1.14) $ (0.20) $ (2.62) Adjustments:
Gain on sale of MVP interest (e) — — (0.12) — Diamond Pipeline asset impairment (e) — — 0.04 — Changes in estimated useful lives (d) 0.09 0.06 0.09 0.06 Income tax expense related to changes in statutory tax rates (f) — — 0.16 — LIFO liquidation adjustment (b) — 0.53 — 0.53 LCM inventory valuation adjustment (c) — (0.61) — (0.04)
Total adjustments 0.09 (0.02) 0.17 0.55 Adjusted earnings (loss) per common share – assuming dilution (g) $ 1.22 $ (1.16) $ (0.03) $ (2.07)
See Notes to Earnings Release Tables beginning on Table Page 18.
VALERO ENERGY CORPORATIONEARNINGS RELEASE TABLES
RECONCILIATION OF NON-GAAP MEASURES TO MOST COMPARABLE AMOUNTSREPORTED UNDER U.S. GAAP (h)
(millions of dollars, except per share amounts)(unaudited)
Table Page 4
Three Months EndedSeptember 30,
Nine Months EndedSeptember 30,
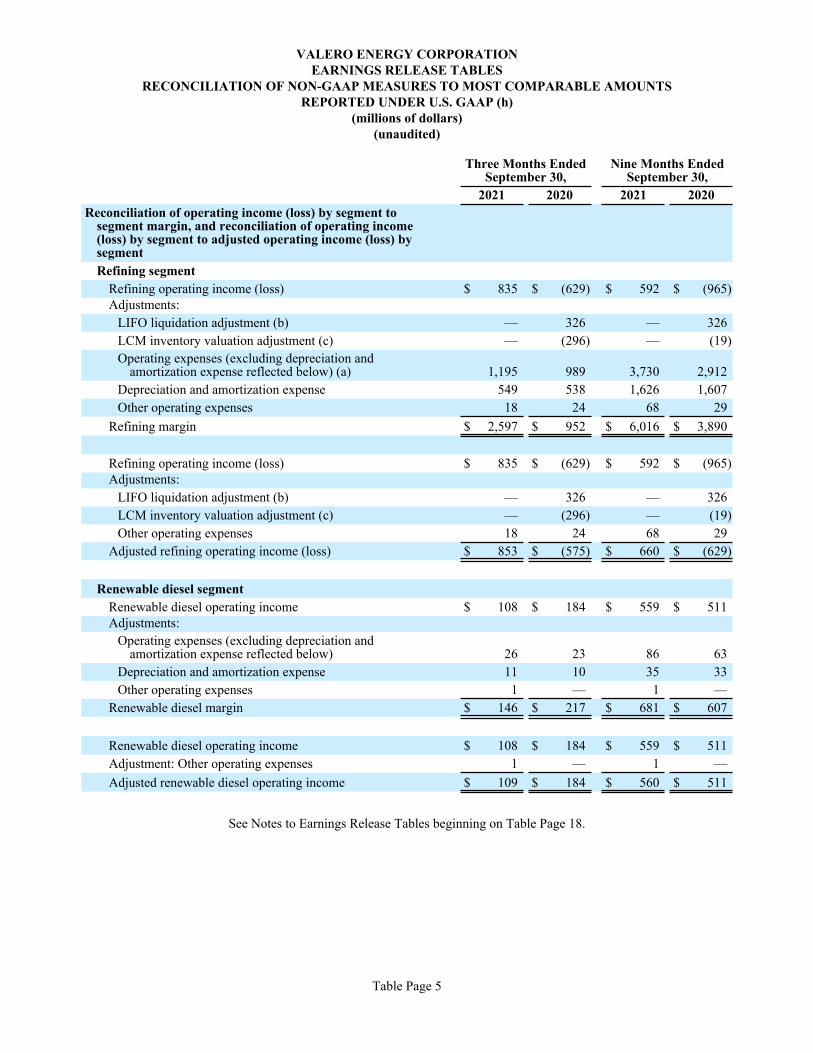
2021 2020 2021 2020Reconciliation of operating income (loss) by segment to
segment margin, and reconciliation of operating income(loss) by segment to adjusted operating income (loss) bysegmentRefining segment
Refining operating income (loss) $ 835 $ (629) $ 592 $ (965) Adjustments:
LIFO liquidation adjustment (b) — 326 — 326 LCM inventory valuation adjustment (c) — (296) — (19) Operating expenses (excluding depreciation and
amortization expense reflected below) (a) 1,195 989 3,730 2,912 Depreciation and amortization expense 549 538 1,626 1,607 Other operating expenses 18 24 68 29
Refining margin $ 2,597 $ 952 $ 6,016 $ 3,890
Refining operating income (loss) $ 835 $ (629) $ 592 $ (965) Adjustments:
LIFO liquidation adjustment (b) — 326 — 326 LCM inventory valuation adjustment (c) — (296) — (19) Other operating expenses 18 24 68 29
Adjusted refining operating income (loss) $ 853 $ (575) $ 660 $ (629)
Renewable diesel segmentRenewable diesel operating income $ 108 $ 184 $ 559 $ 511 Adjustments:
Operating expenses (excluding depreciation andamortization expense reflected below) 26 23 86 63
Depreciation and amortization expense 11 10 35 33 Other operating expenses 1 — 1 —
Renewable diesel margin $ 146 $ 217 $ 681 $ 607
Renewable diesel operating income $ 108 $ 184 $ 559 $ 511 Adjustment: Other operating expenses 1 — 1 — Adjusted renewable diesel operating income $ 109 $ 184 $ 560 $ 511
See Notes to Earnings Release Tables beginning on Table Page 18.
VALERO ENERGY CORPORATIONEARNINGS RELEASE TABLES
RECONCILIATION OF NON-GAAP MEASURES TO MOST COMPARABLE AMOUNTSREPORTED UNDER U.S. GAAP (h)
(millions of dollars)(unaudited)
Table Page 5
Three Months EndedSeptember 30,
Nine Months EndedSeptember 30,
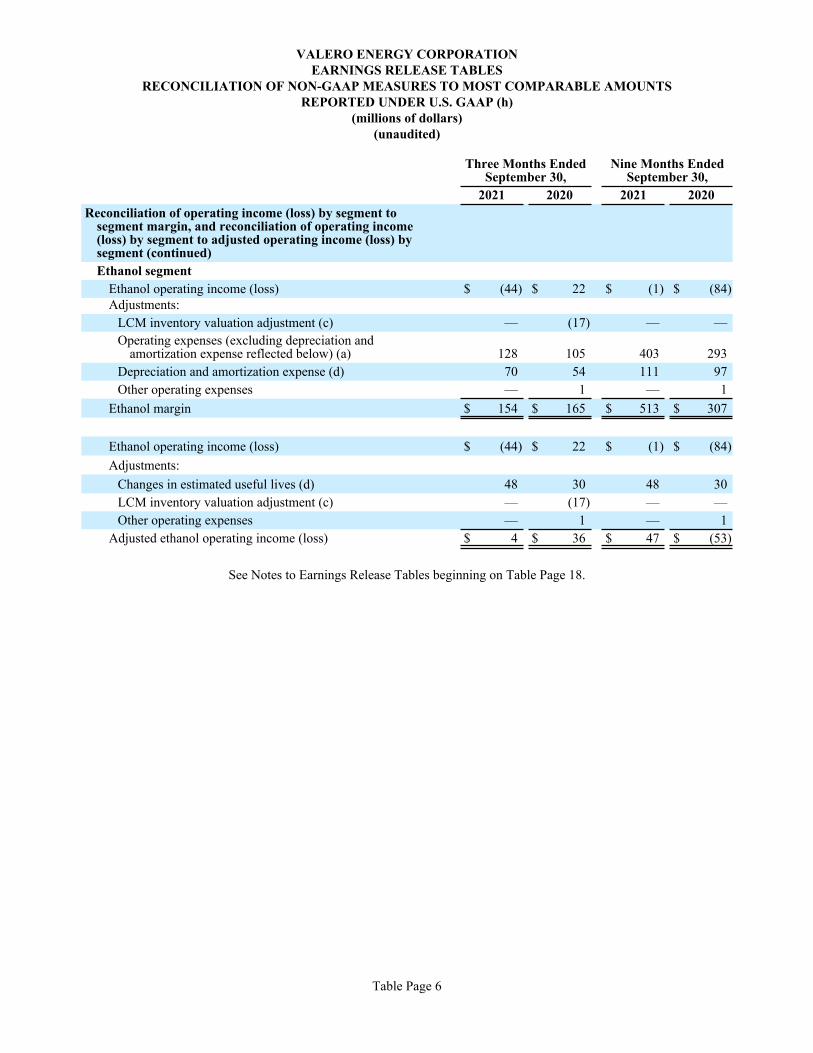
2021 2020 2021 2020Reconciliation of operating income (loss) by segment to
segment margin, and reconciliation of operating income(loss) by segment to adjusted operating income (loss) bysegment (continued)Ethanol segment
Ethanol operating income (loss) $ (44) $ 22 $ (1) $ (84) Adjustments:
LCM inventory valuation adjustment (c) — (17) — — Operating expenses (excluding depreciation and
amortization expense reflected below) (a) 128 105 403 293 Depreciation and amortization expense (d) 70 54 111 97 Other operating expenses — 1 — 1
Ethanol margin $ 154 $ 165 $ 513 $ 307
Ethanol operating income (loss) $ (44) $ 22 $ (1) $ (84) Adjustments:
Changes in estimated useful lives (d) 48 30 48 30 LCM inventory valuation adjustment (c) — (17) — — Other operating expenses — 1 — 1
Adjusted ethanol operating income (loss) $ 4 $ 36 $ 47 $ (53)
See Notes to Earnings Release Tables beginning on Table Page 18.
VALERO ENERGY CORPORATIONEARNINGS RELEASE TABLES
RECONCILIATION OF NON-GAAP MEASURES TO MOST COMPARABLE AMOUNTSREPORTED UNDER U.S. GAAP (h)
(millions of dollars)(unaudited)
Table Page 6
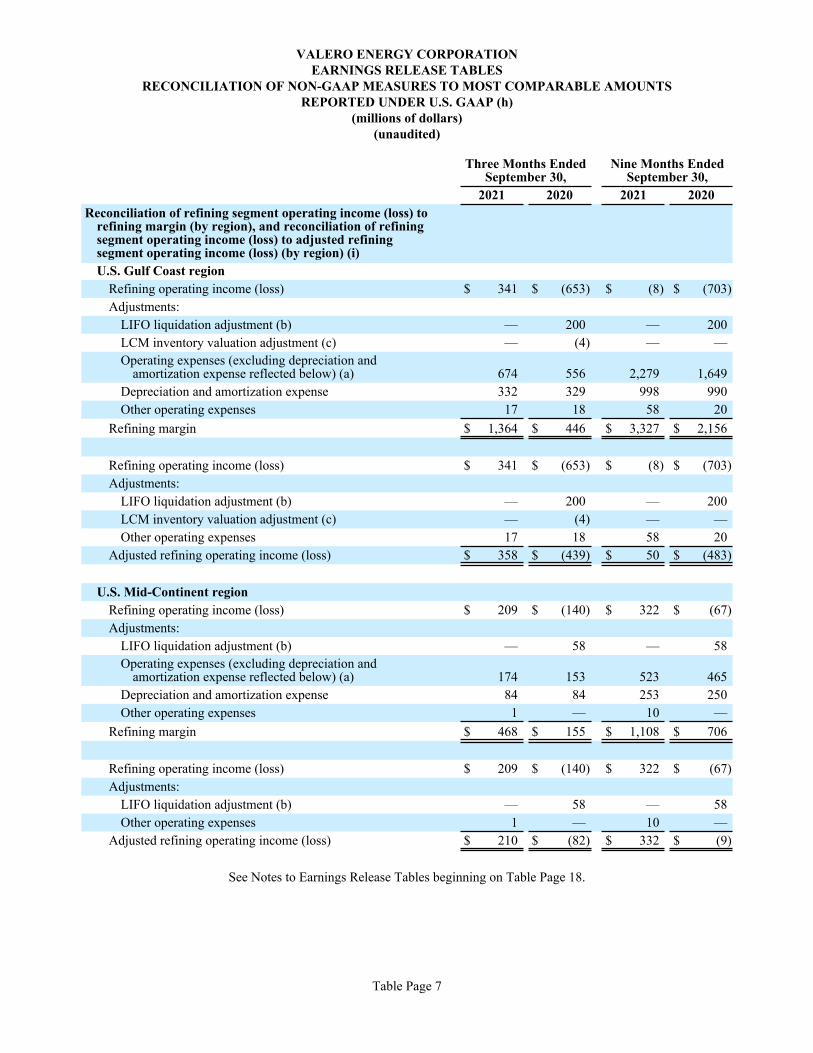
U.S. Gulf Coast regionRefining operating income (loss) $ 341 $ (653) $ (8) $ (703) Adjustments:
LIFO liquidation adjustment (b) — 200 — 200 LCM inventory valuation adjustment (c) — (4) — — Operating expenses (excluding depreciation and
amortization expense reflected below) (a) 674 556 2,279 1,649 Depreciation and amortization expense 332 329 998 990 Other operating expenses 17 18 58 20
Refining margin $ 1,364 $ 446 $ 3,327 $ 2,156
Refining operating income (loss) $ 341 $ (653) $ (8) $ (703) Adjustments:
LIFO liquidation adjustment (b) — 200 — 200 LCM inventory valuation adjustment (c) — (4) — — Other operating expenses 17 18 58 20
Adjusted refining operating income (loss) $ 358 $ (439) $ 50 $ (483)
U.S. Mid-Continent regionRefining operating income (loss) $ 209 $ (140) $ 322 $ (67) Adjustments:
LIFO liquidation adjustment (b) — 58 — 58 Operating expenses (excluding depreciation and
amortization expense reflected below) (a) 174 153 523 465 Depreciation and amortization expense 84 84 253 250 Other operating expenses 1 — 10 —
Refining margin $ 468 $ 155 $ 1,108 $ 706
Refining operating income (loss) $ 209 $ (140) $ 322 $ (67) Adjustments:
LIFO liquidation adjustment (b) — 58 — 58 Other operating expenses 1 — 10 —
Adjusted refining operating income (loss) $ 210 $ (82) $ 332 $ (9)
Three Months EndedSeptember 30,
Nine Months EndedSeptember 30,
2021 2020 2021 2020Reconciliation of refining segment operating income (loss) to
refining margin (by region), and reconciliation of refiningsegment operating income (loss) to adjusted refiningsegment operating income (loss) (by region) (i)
See Notes to Earnings Release Tables beginning on Table Page 18.
VALERO ENERGY CORPORATIONEARNINGS RELEASE TABLES
RECONCILIATION OF NON-GAAP MEASURES TO MOST COMPARABLE AMOUNTSREPORTED UNDER U.S. GAAP (h)
(millions of dollars)(unaudited)
Table Page 7
Three Months EndedSeptember 30,
Nine Months EndedSeptember 30,
2021 2020 2021 2020Reconciliation of refining segment operating income (loss) to
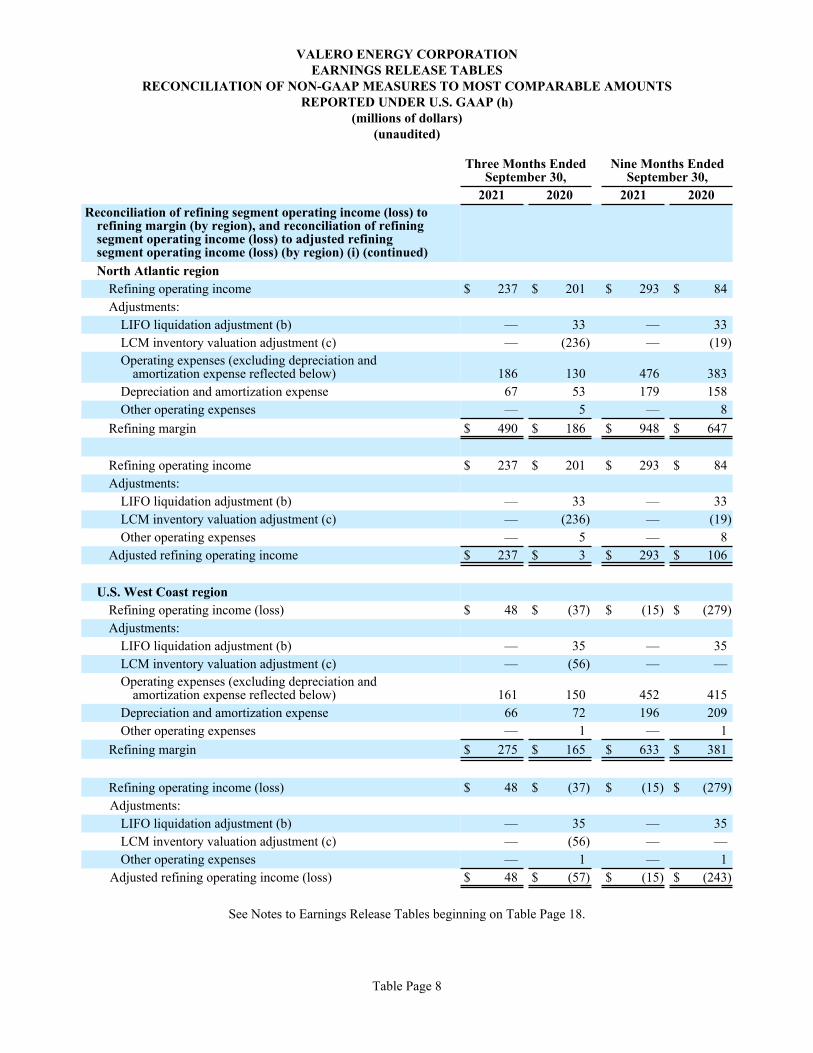
refining margin (by region), and reconciliation of refiningsegment operating income (loss) to adjusted refiningsegment operating income (loss) (by region) (i) (continued)North Atlantic region
Refining operating income $ 237 $ 201 $ 293 $ 84 Adjustments:
LIFO liquidation adjustment (b) — 33 — 33 LCM inventory valuation adjustment (c) — (236) — (19) Operating expenses (excluding depreciation and
amortization expense reflected below) 186 130 476 383 Depreciation and amortization expense 67 53 179 158 Other operating expenses — 5 — 8
Refining margin $ 490 $ 186 $ 948 $ 647
Refining operating income $ 237 $ 201 $ 293 $ 84 Adjustments:
LIFO liquidation adjustment (b) — 33 — 33 LCM inventory valuation adjustment (c) — (236) — (19) Other operating expenses — 5 — 8
Adjusted refining operating income $ 237 $ 3 $ 293 $ 106
U.S. West Coast regionRefining operating income (loss) $ 48 $ (37) $ (15) $ (279) Adjustments:
LIFO liquidation adjustment (b) — 35 — 35 LCM inventory valuation adjustment (c) — (56) — — Operating expenses (excluding depreciation and
amortization expense reflected below) 161 150 452 415 Depreciation and amortization expense 66 72 196 209 Other operating expenses — 1 — 1
Refining margin $ 275 $ 165 $ 633 $ 381
Refining operating income (loss) $ 48 $ (37) $ (15) $ (279) Adjustments:
LIFO liquidation adjustment (b) — 35 — 35 LCM inventory valuation adjustment (c) — (56) — — Other operating expenses — 1 — 1
Adjusted refining operating income (loss) $ 48 $ (57) $ (15) $ (243)
See Notes to Earnings Release Tables beginning on Table Page 18.
VALERO ENERGY CORPORATIONEARNINGS RELEASE TABLES
RECONCILIATION OF NON-GAAP MEASURES TO MOST COMPARABLE AMOUNTSREPORTED UNDER U.S. GAAP (h)
(millions of dollars)(unaudited)
Table Page 8
Three Months EndedSeptember 30,
Nine Months EndedSeptember 30,
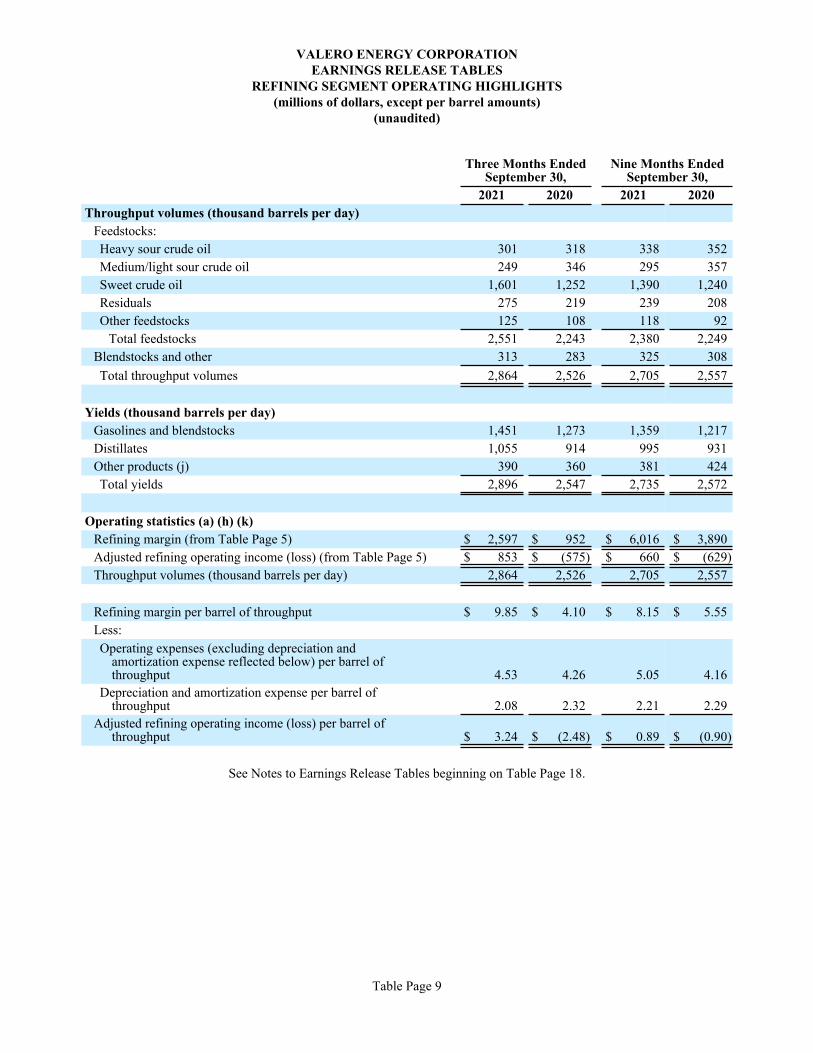
2021 2020 2021 2020Throughput volumes (thousand barrels per day)
Feedstocks:Heavy sour crude oil 301 318 338 352 Medium/light sour crude oil 249 346 295 357 Sweet crude oil 1,601 1,252 1,390 1,240 Residuals 275 219 239 208 Other feedstocks 125 108 118 92
Total feedstocks 2,551 2,243 2,380 2,249 Blendstocks and other 313 283 325 308 Total throughput volumes 2,864 2,526 2,705 2,557
Yields (thousand barrels per day)Gasolines and blendstocks 1,451 1,273 1,359 1,217 Distillates 1,055 914 995 931 Other products (j) 390 360 381 424 Total yields 2,896 2,547 2,735 2,572
Operating statistics (a) (h) (k)Refining margin (from Table Page 5) $ 2,597 $ 952 $ 6,016 $ 3,890 Adjusted refining operating income (loss) (from Table Page 5) $ 853 $ (575) $ 660 $ (629) Throughput volumes (thousand barrels per day) 2,864 2,526 2,705 2,557
Refining margin per barrel of throughput $ 9.85 $ 4.10 $ 8.15 $ 5.55 Less:Operating expenses (excluding depreciation and
amortization expense reflected below) per barrel ofthroughput 4.53 4.26 5.05 4.16
Depreciation and amortization expense per barrel ofthroughput 2.08 2.32 2.21 2.29
Adjusted refining operating income (loss) per barrel ofthroughput $ 3.24 $ (2.48) $ 0.89 $ (0.90)
See Notes to Earnings Release Tables beginning on Table Page 18.
VALERO ENERGY CORPORATIONEARNINGS RELEASE TABLES
REFINING SEGMENT OPERATING HIGHLIGHTS(millions of dollars, except per barrel amounts)
(unaudited)
Table Page 9
Three Months EndedSeptember 30,
Nine Months EndedSeptember 30,
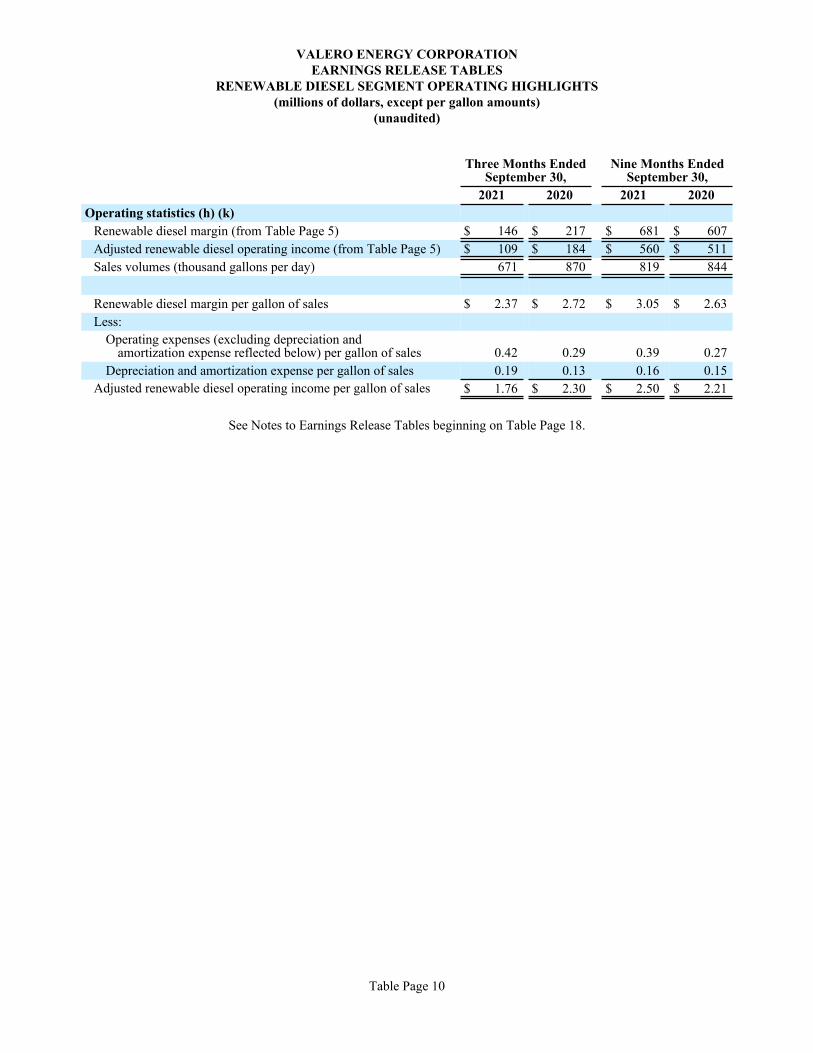
2021 2020 2021 2020Operating statistics (h) (k)
Renewable diesel margin (from Table Page 5) $ 146 $ 217 $ 681 $ 607 Adjusted renewable diesel operating income (from Table Page 5) $ 109 $ 184 $ 560 $ 511 Sales volumes (thousand gallons per day) 671 870 819 844
Renewable diesel margin per gallon of sales $ 2.37 $ 2.72 $ 3.05 $ 2.63 Less:
Operating expenses (excluding depreciation andamortization expense reflected below) per gallon of sales 0.42 0.29 0.39 0.27
Depreciation and amortization expense per gallon of sales 0.19 0.13 0.16 0.15 Adjusted renewable diesel operating income per gallon of sales $ 1.76 $ 2.30 $ 2.50 $ 2.21
See Notes to Earnings Release Tables beginning on Table Page 18.
VALERO ENERGY CORPORATIONEARNINGS RELEASE TABLES
RENEWABLE DIESEL SEGMENT OPERATING HIGHLIGHTS (millions of dollars, except per gallon amounts)
(unaudited)
Table Page 10
Three Months EndedSeptember 30,
Nine Months EndedSeptember 30,
2021 2020 2021 2020Operating statistics (a) (h) (k)
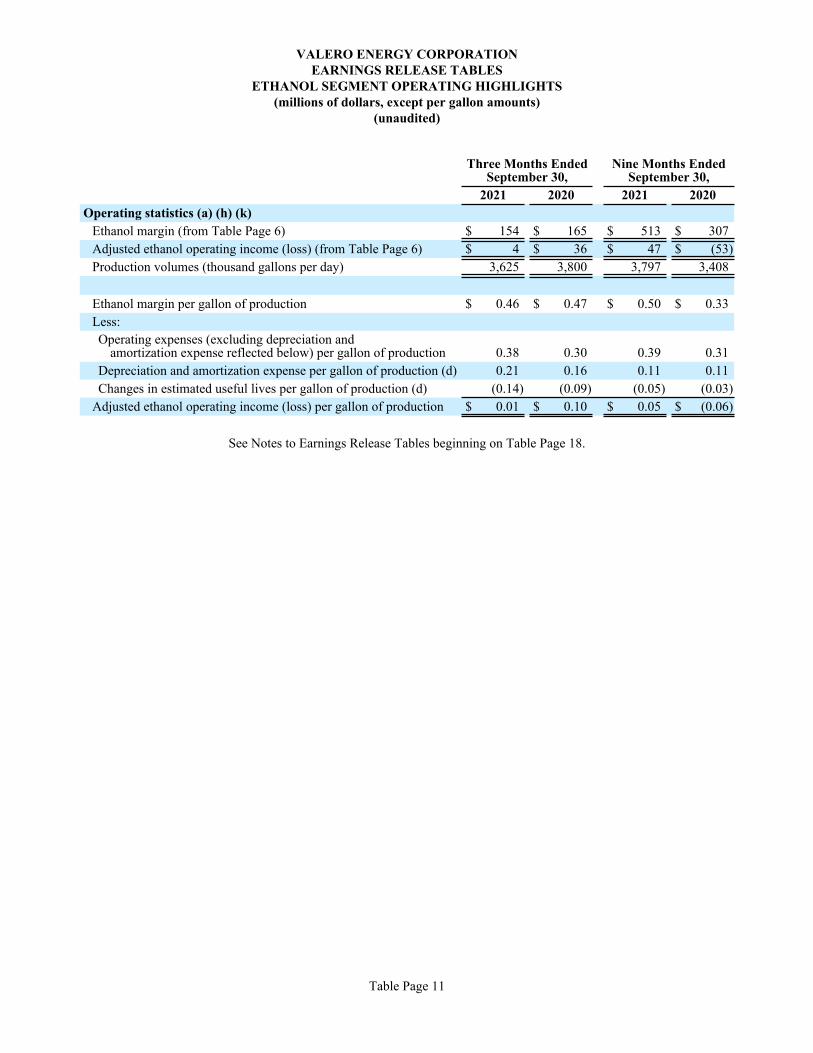
Ethanol margin (from Table Page 6) $ 154 $ 165 $ 513 $ 307 Adjusted ethanol operating income (loss) (from Table Page 6) $ 4 $ 36 $ 47 $ (53) Production volumes (thousand gallons per day) 3,625 3,800 3,797 3,408
Ethanol margin per gallon of production $ 0.46 $ 0.47 $ 0.50 $ 0.33 Less:Operating expenses (excluding depreciation and
amortization expense reflected below) per gallon of production 0.38 0.30 0.39 0.31 Depreciation and amortization expense per gallon of production (d) 0.21 0.16 0.11 0.11 Changes in estimated useful lives per gallon of production (d) (0.14) (0.09) (0.05) (0.03)
Adjusted ethanol operating income (loss) per gallon of production $ 0.01 $ 0.10 $ 0.05 $ (0.06)
See Notes to Earnings Release Tables beginning on Table Page 18.
VALERO ENERGY CORPORATIONEARNINGS RELEASE TABLES
ETHANOL SEGMENT OPERATING HIGHLIGHTS(millions of dollars, except per gallon amounts)
(unaudited)
Table Page 11
Three Months EndedSeptember 30,
Nine Months EndedSeptember 30,
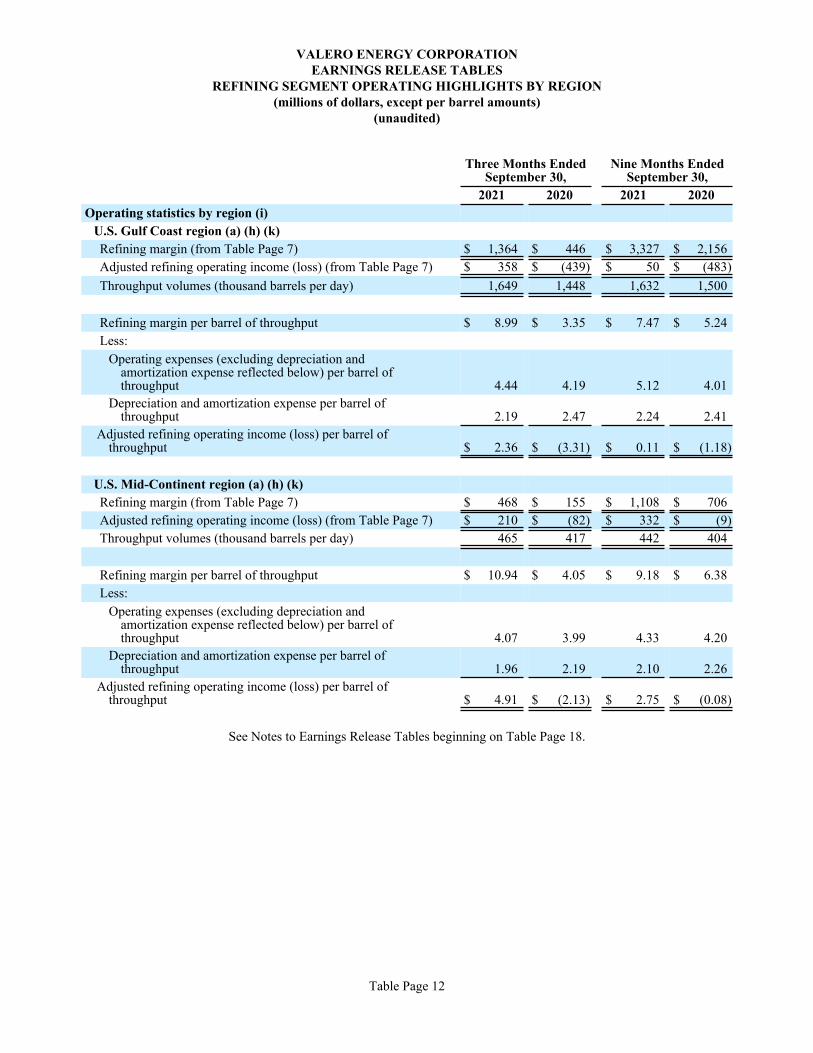
2021 2020 2021 2020Operating statistics by region (i)
U.S. Gulf Coast region (a) (h) (k)Refining margin (from Table Page 7) $ 1,364 $ 446 $ 3,327 $ 2,156 Adjusted refining operating income (loss) (from Table Page 7) $ 358 $ (439) $ 50 $ (483) Throughput volumes (thousand barrels per day) 1,649 1,448 1,632 1,500
Refining margin per barrel of throughput $ 8.99 $ 3.35 $ 7.47 $ 5.24 Less:
Operating expenses (excluding depreciation andamortization expense reflected below) per barrel ofthroughput 4.44 4.19 5.12 4.01
Depreciation and amortization expense per barrel of throughput 2.19 2.47 2.24 2.41
Adjusted refining operating income (loss) per barrel ofthroughput $ 2.36 $ (3.31) $ 0.11 $ (1.18)
U.S. Mid-Continent region (a) (h) (k)Refining margin (from Table Page 7) $ 468 $ 155 $ 1,108 $ 706 Adjusted refining operating income (loss) (from Table Page 7) $ 210 $ (82) $ 332 $ (9) Throughput volumes (thousand barrels per day) 465 417 442 404
Refining margin per barrel of throughput $ 10.94 $ 4.05 $ 9.18 $ 6.38 Less:
Operating expenses (excluding depreciation andamortization expense reflected below) per barrel ofthroughput 4.07 3.99 4.33 4.20
Depreciation and amortization expense per barrel of throughput 1.96 2.19 2.10 2.26
Adjusted refining operating income (loss) per barrel ofthroughput $ 4.91 $ (2.13) $ 2.75 $ (0.08)
See Notes to Earnings Release Tables beginning on Table Page 18.
VALERO ENERGY CORPORATIONEARNINGS RELEASE TABLES
REFINING SEGMENT OPERATING HIGHLIGHTS BY REGION(millions of dollars, except per barrel amounts)
(unaudited)
Table Page 12
Three Months EndedSeptember 30,
Nine Months EndedSeptember 30,
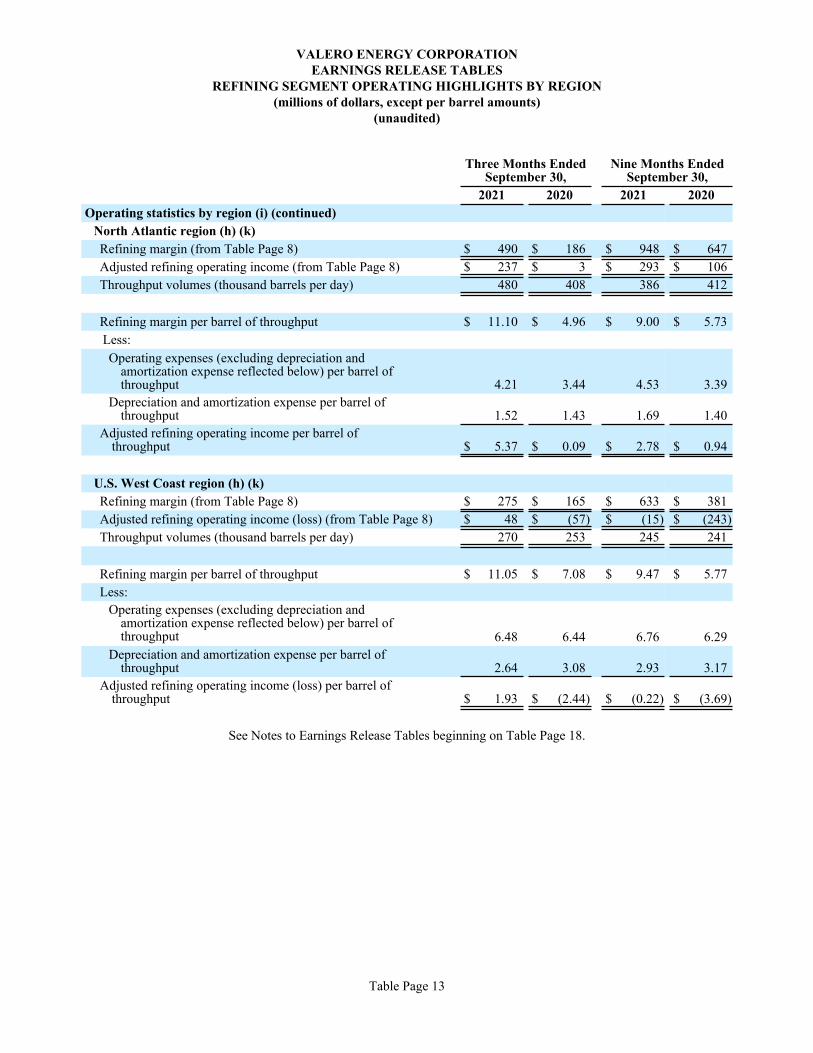
2021 2020 2021 2020Operating statistics by region (i) (continued)
North Atlantic region (h) (k)Refining margin (from Table Page 8) $ 490 $ 186 $ 948 $ 647 Adjusted refining operating income (from Table Page 8) $ 237 $ 3 $ 293 $ 106 Throughput volumes (thousand barrels per day) 480 408 386 412
Refining margin per barrel of throughput $ 11.10 $ 4.96 $ 9.00 $ 5.73 Less:Operating expenses (excluding depreciation and
amortization expense reflected below) per barrel ofthroughput 4.21 3.44 4.53 3.39
Depreciation and amortization expense per barrel of throughput 1.52 1.43 1.69 1.40
Adjusted refining operating income per barrel ofthroughput $ 5.37 $ 0.09 $ 2.78 $ 0.94
U.S. West Coast region (h) (k)Refining margin (from Table Page 8) $ 275 $ 165 $ 633 $ 381 Adjusted refining operating income (loss) (from Table Page 8) $ 48 $ (57) $ (15) $ (243) Throughput volumes (thousand barrels per day) 270 253 245 241
Refining margin per barrel of throughput $ 11.05 $ 7.08 $ 9.47 $ 5.77 Less:
Operating expenses (excluding depreciation andamortization expense reflected below) per barrel ofthroughput 6.48 6.44 6.76 6.29
Depreciation and amortization expense per barrel of throughput 2.64 3.08 2.93 3.17
Adjusted refining operating income (loss) per barrel ofthroughput $ 1.93 $ (2.44) $ (0.22) $ (3.69)
See Notes to Earnings Release Tables beginning on Table Page 18.
VALERO ENERGY CORPORATIONEARNINGS RELEASE TABLES
REFINING SEGMENT OPERATING HIGHLIGHTS BY REGION(millions of dollars, except per barrel amounts)
(unaudited)
Table Page 13
Three Months EndedSeptember 30,
Nine Months EndedSeptember 30,
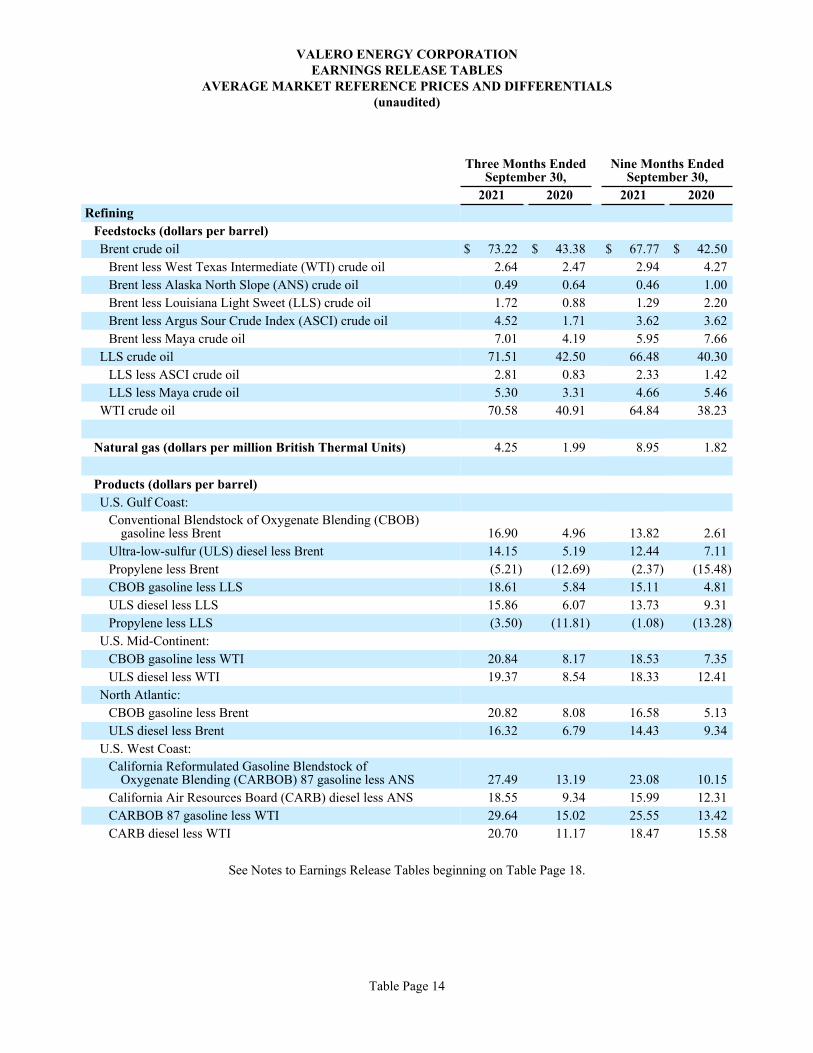
2021 2020 2021 2020Refining
Feedstocks (dollars per barrel)Brent crude oil $ 73.22 $ 43.38 $ 67.77 $ 42.50
Brent less West Texas Intermediate (WTI) crude oil 2.64 2.47 2.94 4.27 Brent less Alaska North Slope (ANS) crude oil 0.49 0.64 0.46 1.00 Brent less Louisiana Light Sweet (LLS) crude oil 1.72 0.88 1.29 2.20 Brent less Argus Sour Crude Index (ASCI) crude oil 4.52 1.71 3.62 3.62 Brent less Maya crude oil 7.01 4.19 5.95 7.66
LLS crude oil 71.51 42.50 66.48 40.30 LLS less ASCI crude oil 2.81 0.83 2.33 1.42 LLS less Maya crude oil 5.30 3.31 4.66 5.46
WTI crude oil 70.58 40.91 64.84 38.23
Natural gas (dollars per million British Thermal Units) 4.25 1.99 8.95 1.82
Products (dollars per barrel)U.S. Gulf Coast:
Conventional Blendstock of Oxygenate Blending (CBOB)gasoline less Brent 16.90 4.96 13.82 2.61
Ultra-low-sulfur (ULS) diesel less Brent 14.15 5.19 12.44 7.11 Propylene less Brent (5.21) (12.69) (2.37) (15.48) CBOB gasoline less LLS 18.61 5.84 15.11 4.81 ULS diesel less LLS 15.86 6.07 13.73 9.31 Propylene less LLS (3.50) (11.81) (1.08) (13.28)
U.S. Mid-Continent:CBOB gasoline less WTI 20.84 8.17 18.53 7.35 ULS diesel less WTI 19.37 8.54 18.33 12.41
North Atlantic:CBOB gasoline less Brent 20.82 8.08 16.58 5.13 ULS diesel less Brent 16.32 6.79 14.43 9.34
U.S. West Coast:California Reformulated Gasoline Blendstock of
Oxygenate Blending (CARBOB) 87 gasoline less ANS 27.49 13.19 23.08 10.15 California Air Resources Board (CARB) diesel less ANS 18.55 9.34 15.99 12.31 CARBOB 87 gasoline less WTI 29.64 15.02 25.55 13.42 CARB diesel less WTI 20.70 11.17 18.47 15.58
See Notes to Earnings Release Tables beginning on Table Page 18.
VALERO ENERGY CORPORATIONEARNINGS RELEASE TABLES
AVERAGE MARKET REFERENCE PRICES AND DIFFERENTIALS(unaudited)
Table Page 14
Three Months EndedSeptember 30,
Nine Months EndedSeptember 30,
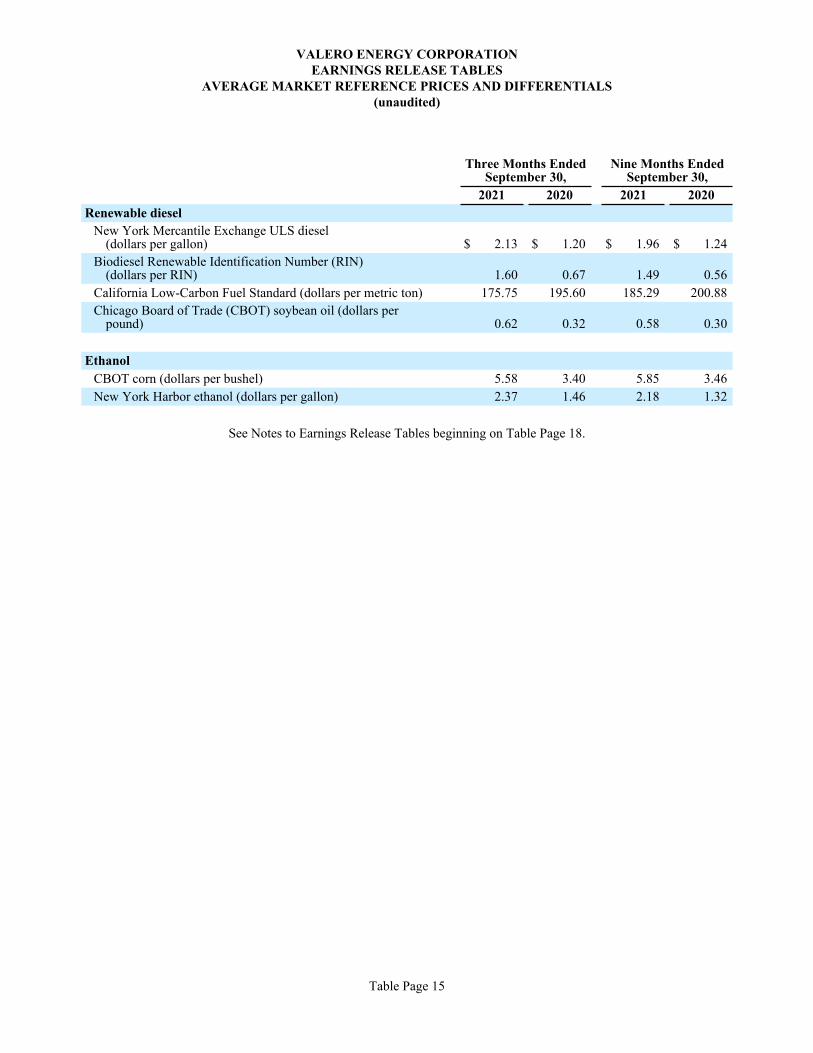
2021 2020 2021 2020Renewable diesel
New York Mercantile Exchange ULS diesel(dollars per gallon) $ 2.13 $ 1.20 $ 1.96 $ 1.24
Biodiesel Renewable Identification Number (RIN)(dollars per RIN) 1.60 0.67 1.49 0.56
California Low-Carbon Fuel Standard (dollars per metric ton) 175.75 195.60 185.29 200.88 Chicago Board of Trade (CBOT) soybean oil (dollars per
pound) 0.62 0.32 0.58 0.30
EthanolCBOT corn (dollars per bushel) 5.58 3.40 5.85 3.46 New York Harbor ethanol (dollars per gallon) 2.37 1.46 2.18 1.32
See Notes to Earnings Release Tables beginning on Table Page 18.
VALERO ENERGY CORPORATIONEARNINGS RELEASE TABLES
AVERAGE MARKET REFERENCE PRICES AND DIFFERENTIALS(unaudited)
Table Page 15
September 30,2021
December 31,2020
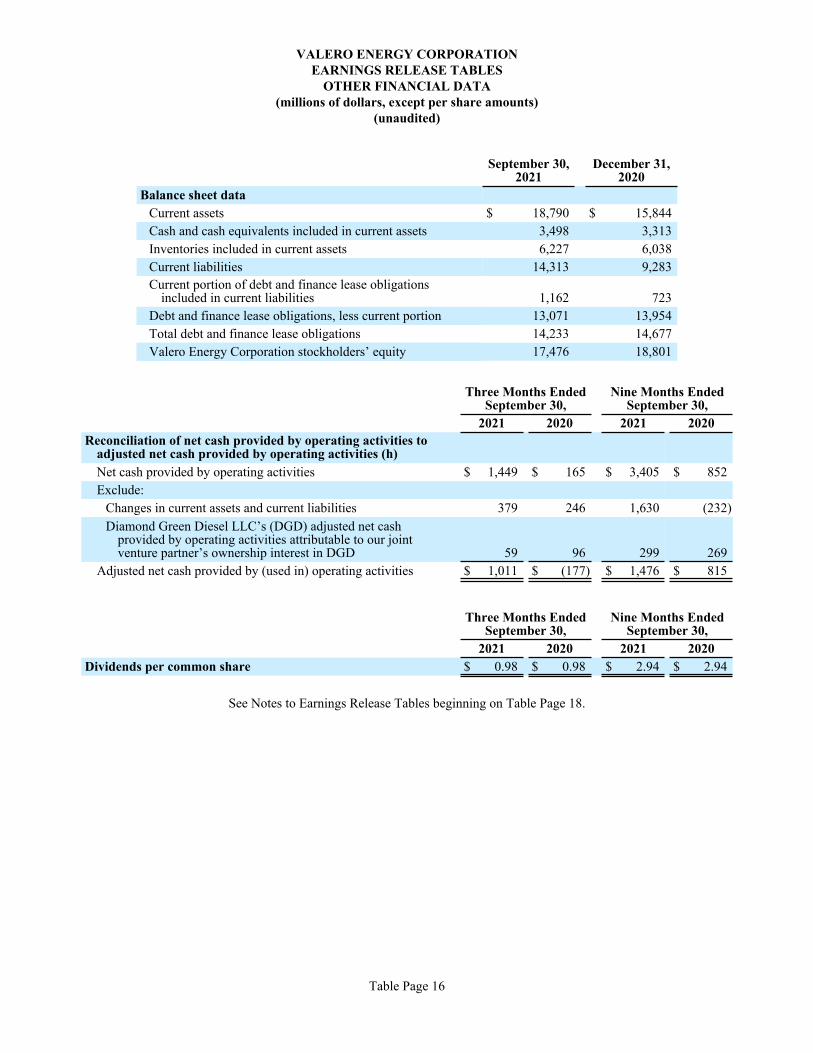
Balance sheet dataCurrent assets $ 18,790 $ 15,844 Cash and cash equivalents included in current assets 3,498 3,313 Inventories included in current assets 6,227 6,038 Current liabilities 14,313 9,283 Current portion of debt and finance lease obligations
included in current liabilities 1,162 723 Debt and finance lease obligations, less current portion 13,071 13,954 Total debt and finance lease obligations 14,233 14,677 Valero Energy Corporation stockholders’ equity 17,476 18,801
Three Months EndedSeptember 30,
Nine Months EndedSeptember 30,
2021 2020 2021 2020Reconciliation of net cash provided by operating activities to
adjusted net cash provided by operating activities (h)Net cash provided by operating activities $ 1,449 $ 165 $ 3,405 $ 852 Exclude:
Changes in current assets and current liabilities 379 246 1,630 (232) Diamond Green Diesel LLC’s (DGD) adjusted net cash
provided by operating activities attributable to our jointventure partner’s ownership interest in DGD 59 96 299 269
Adjusted net cash provided by (used in) operating activities $ 1,011 $ (177) $ 1,476 $ 815
Three Months EndedSeptember 30,
Nine Months EndedSeptember 30,
2021 2020 2021 2020Dividends per common share $ 0.98 $ 0.98 $ 2.94 $ 2.94
See Notes to Earnings Release Tables beginning on Table Page 18.
VALERO ENERGY CORPORATIONEARNINGS RELEASE TABLES
OTHER FINANCIAL DATA(millions of dollars, except per share amounts)
(unaudited)
Table Page 16
Three Months EndedSeptember 30,
Nine Months Ended September 30,
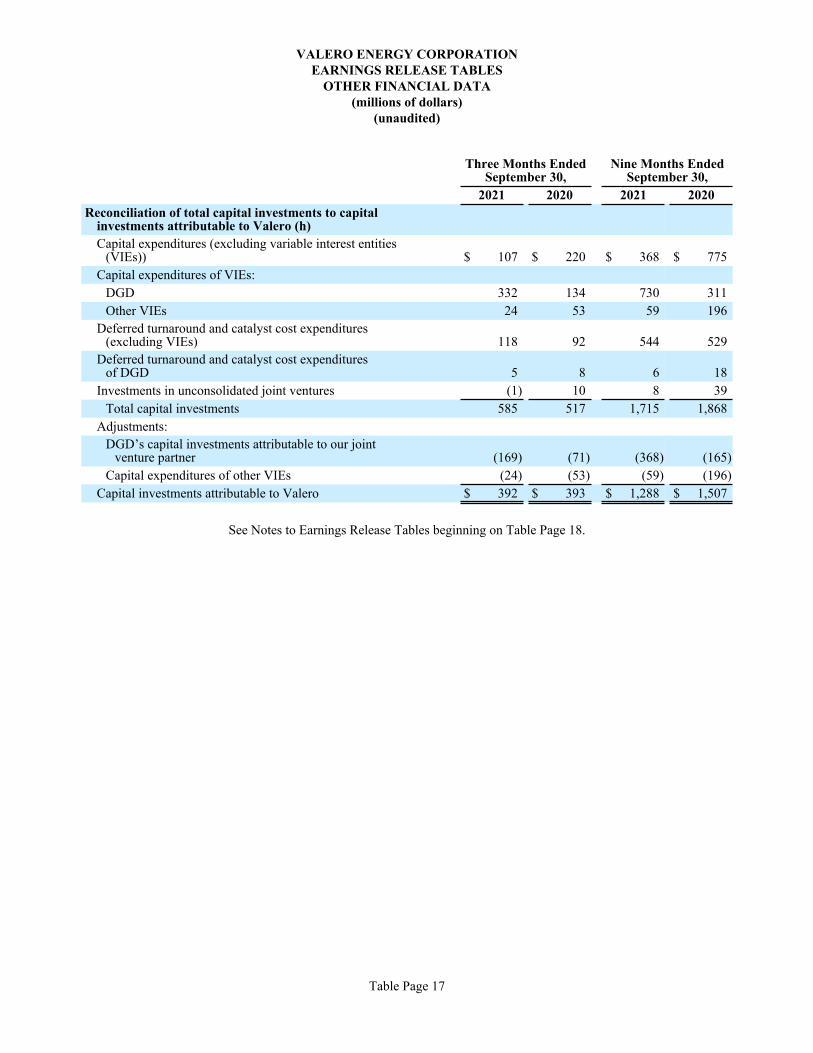
2021 2020 2021 2020Reconciliation of total capital investments to capital
investments attributable to Valero (h)Capital expenditures (excluding variable interest entities
(VIEs)) $ 107 $ 220 $ 368 $ 775 Capital expenditures of VIEs:
DGD 332 134 730 311 Other VIEs 24 53 59 196
Deferred turnaround and catalyst cost expenditures(excluding VIEs) 118 92 544 529
Deferred turnaround and catalyst cost expendituresof DGD 5 8 6 18
Investments in unconsolidated joint ventures (1) 10 8 39 Total capital investments 585 517 1,715 1,868
Adjustments:DGD’s capital investments attributable to our joint
venture partner (169) (71) (368) (165) Capital expenditures of other VIEs (24) (53) (59) (196)
Capital investments attributable to Valero $ 392 $ 393 $ 1,288 $ 1,507
See Notes to Earnings Release Tables beginning on Table Page 18.
VALERO ENERGY CORPORATIONEARNINGS RELEASE TABLES
OTHER FINANCIAL DATA(millions of dollars)
(unaudited)
Table Page 17
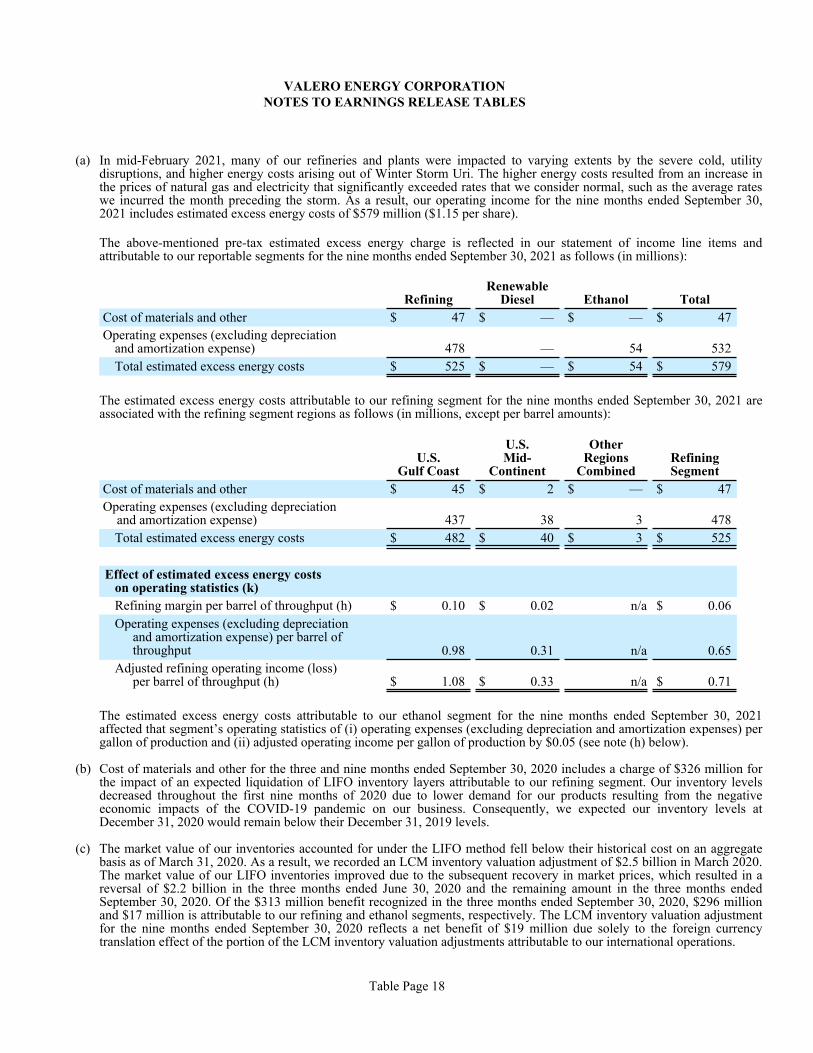
(a) In mid-February 2021, many of our refineries and plants were impacted to varying extents by the severe cold, utility disruptions, and higher energy costs arising out of Winter Storm Uri. The higher energy costs resulted from an increase in the prices of natural gas and electricity that significantly exceeded rates that we consider normal, such as the average rates we incurred the month preceding the storm. As a result, our operating income for the nine months ended September 30, 2021 includes estimated excess energy costs of $579 million ($1.15 per share).
The above-mentioned pre-tax estimated excess energy charge is reflected in our statement of income line items and attributable to our reportable segments for the nine months ended September 30, 2021 as follows (in millions):
RefiningRenewable
Diesel Ethanol TotalCost of materials and other $ 47 $ — $ — $ 47 Operating expenses (excluding depreciation
and amortization expense) 478 — 54 532 Total estimated excess energy costs $ 525 $ — $ 54 $ 579
The estimated excess energy costs attributable to our refining segment for the nine months ended September 30, 2021 are associated with the refining segment regions as follows (in millions, except per barrel amounts):
U.S.Gulf Coast
U.S.Mid-
Continent
OtherRegions
CombinedRefiningSegment
Cost of materials and other $ 45 $ 2 $ — $ 47 Operating expenses (excluding depreciation
and amortization expense) 437 38 3 478 Total estimated excess energy costs $ 482 $ 40 $ 3 $ 525
Effect of estimated excess energy costson operating statistics (k)Refining margin per barrel of throughput (h) $ 0.10 $ 0.02 n/a $ 0.06 Operating expenses (excluding depreciation
and amortization expense) per barrel of throughput 0.98 0.31 n/a 0.65
Adjusted refining operating income (loss)per barrel of throughput (h) $ 1.08 $ 0.33 n/a $ 0.71
The estimated excess energy costs attributable to our ethanol segment for the nine months ended September 30, 2021 affected that segment’s operating statistics of (i) operating expenses (excluding depreciation and amortization expenses) per gallon of production and (ii) adjusted operating income per gallon of production by $0.05 (see note (h) below).
(b) Cost of materials and other for the three and nine months ended September 30, 2020 includes a charge of $326 million for the impact of an expected liquidation of LIFO inventory layers attributable to our refining segment. Our inventory levels decreased throughout the first nine months of 2020 due to lower demand for our products resulting from the negative economic impacts of the COVID-19 pandemic on our business. Consequently, we expected our inventory levels at December 31, 2020 would remain below their December 31, 2019 levels.
(c) The market value of our inventories accounted for under the LIFO method fell below their historical cost on an aggregate basis as of March 31, 2020. As a result, we recorded an LCM inventory valuation adjustment of $2.5 billion in March 2020. The market value of our LIFO inventories improved due to the subsequent recovery in market prices, which resulted in a reversal of $2.2 billion in the three months ended June 30, 2020 and the remaining amount in the three months ended September 30, 2020. Of the $313 million benefit recognized in the three months ended September 30, 2020, $296 million and $17 million is attributable to our refining and ethanol segments, respectively. The LCM inventory valuation adjustment for the nine months ended September 30, 2020 reflects a net benefit of $19 million due solely to the foreign currency translation effect of the portion of the LCM inventory valuation adjustments attributable to our international operations.
VALERO ENERGY CORPORATIONNOTES TO EARNINGS RELEASE TABLES
Table Page 18
(d) Depreciation and amortization expense for the three and nine months ended September 30, 2021 and 2020 includes accelerated depreciation of $48 million and $30 million, respectively, related to changes in the estimated useful lives of two of our ethanol plants.
(e) On April 19, 2021, we sold a 24.99 percent membership interest in MVP Terminalling, LLC (MVP), an unconsolidated joint venture with a subsidiary of Magellan Midstream Partners, L.P., for $270 million. “Other income, net” for the nine months ended September 30, 2021 includes a gain on the sale of $62 million.
“Other income, net” for the nine months ended September 30, 2021 also includes a $24 million charge representing our portion of the asset impairment loss recognized by Diamond Pipeline LLC, an unconsolidated joint venture with a subsidiary of Plains All American Pipeline, L.P., resulting from the joint venture’s cancellation of its pipeline extension project.
(f) Certain statutory tax rate changes were enacted during the second quarter of 2021 (primarily an increase in the U.K. rate from 19 percent to 25 percent effective in 2023), which resulted in the remeasurement of our deferred tax liabilities. Under U.S. generally accepted accounting principles (GAAP), we are required to recognize the effect of a change in tax law in the period of enactment. As a result, we recognized income tax expense of $64 million during the nine months ended September 30, 2021, which represents the net increase in our deferred tax liabilities resulting from the changes in the tax rates.
(g) Common equivalent shares have been excluded from the computation of loss per common share – assuming dilution and adjusted loss per common share – assuming dilution for the nine months ended September 30, 2021 and for the three and nine months ended September 30, 2020, as the effect of including such shares is antidilutive.
(h) We use certain financial measures (as noted below) in the earnings release tables and accompanying earnings release that are not defined under U.S. GAAP and are considered to be non-GAAP measures.
We have defined these non-GAAP measures and believe they are useful to the external users of our financial statements, including industry analysts, investors, lenders, and rating agencies. We believe these measures are useful to assess our ongoing financial performance because, when reconciled to their most comparable U.S. GAAP measures, they provide improved comparability between periods after adjusting for certain items that we believe are not indicative of our core operating performance and that may obscure our underlying business results and trends. These non-GAAP measures should not be considered as alternatives to their most comparable U.S. GAAP measures nor should they be considered in isolation or as a substitute for an analysis of our results of operations as reported under U.S. GAAP. In addition, these non-GAAP measures may not be comparable to similarly titled measures used by other companies because we may define them differently, which diminishes their utility.
Non-GAAP measures are as follows:
◦ Adjusted net income (loss) attributable to Valero Energy Corporation stockholders is defined as net income (loss) attributable to Valero Energy Corporation stockholders adjusted to reflect the items noted below, along with their related income tax effect. The income tax effect for the adjustments was calculated using a combined federal and state statutory rate for the U.S.-based adjustments of 22 percent and a local statutory income tax rate for foreign-based adjustments. We have adjusted for these items because we believe that they are not indicative of our core operating performance and that their adjustment results in an important measure of our ongoing financial performance to better assess our underlying business results and trends. The basis for our belief with respect to each adjustment is provided below.
– Gain on sale of MVP interest – The gain on the sale of a 24.99 percent membership interest in MVP (see note (e)) is not indicative of our ongoing operations.
– Diamond Pipeline asset impairment – The asset impairment loss related to the cancellation of a capital project associated with Diamond Pipeline LLC (see note (e)) is not indicative of our ongoing operations.
– Changes in estimated useful lives – The accelerated depreciation recognized as a result of changes in the estimated useful lives of two of our ethanol plants (see note (d)) is not indicative of our ongoing operations.
VALERO ENERGY CORPORATIONNOTES TO EARNINGS RELEASE TABLES (Continued)
Table Page 19
– Income tax expense related to changes in statutory tax rates – The income tax expense related to changes in certain statutory tax rates (see note (f)) is not indicative of income tax expense associated with the pre-tax results for the nine months ended September 30, 2021.
– LIFO liquidation adjustment – Generally, the LIFO inventory valuation method provides for the matching of current costs with current revenues. However, a LIFO liquidation results in a portion of our current-year cost of sales being impacted by historical costs, which obscures our current-year financial performance. Therefore, we have excluded the historical cost impact from adjusted net income (loss) attributable to Valero Energy Corporation stockholders. See note (b) for additional details.
– LCM inventory valuation adjustment – The LCM inventory valuation adjustment, which is described in note (c), is the result of the market value of our inventories as of March 31, 2020 falling below their historical cost, with the decline in market value resulting from the decline in crude oil and product market prices associated with the negative economic impacts from the COVID-19 pandemic. As market prices improved over the subsequent months, we reversed the writedown. The adjustment obscures our financial performance because it does not result from decisions made by us; therefore, we have excluded the adjustment from adjusted net income (loss) attributable to Valero Energy Corporation stockholders.
◦ Adjusted earnings (loss) per common share – assuming dilution is defined as adjusted net income (loss) attributable to Valero Energy Corporation stockholders divided by the number of weighted-average shares outstanding in the applicable period, assuming dilution (see note (g)).
◦ Refining margin is defined as refining segment operating income (loss) excluding the LIFO liquidation adjustment (see note (b)), the LCM inventory valuation adjustment (see note (c)), operating expenses (excluding depreciation and amortization expense), depreciation and amortization expense, and other operating expenses. We believe refining margin is an important measure of our refining segment’s operating and financial performance as it is the most comparable measure to the industry’s market reference product margins, which are used by industry analysts, investors, and others to evaluate our performance.
◦ Renewable diesel margin is defined as renewable diesel segment operating income excluding operating expenses (excluding depreciation and amortization expense), depreciation and amortization expense, and other operating expenses. We believe renewable diesel margin is an important measure of our renewable diesel segment’s operating and financial performance as it is the most comparable measure to the industry’s market reference product margins, which are used by industry analysts, investors, and others to evaluate our performance.
◦ Ethanol margin is defined as ethanol segment operating income (loss) excluding the LCM inventory valuation adjustment (see note (c)), operating expenses (excluding depreciation and amortization expense), depreciation and amortization expense, and other operating expenses. We believe ethanol margin is an important measure of our ethanol segment’s operating and financial performance as it is the most comparable measure to the industry’s market reference product margins, which are used by industry analysts, investors, and others to evaluate our performance.
◦ Adjusted refining operating income (loss) is defined as refining segment operating income (loss) excluding the LIFO liquidation adjustment (see note (b)), the LCM inventory valuation adjustment (see note (c)), and other operating expenses. We believe adjusted refining operating income (loss) is an important measure of our refining segment’s operating and financial performance because it excludes items that are not indicative of that segment’s core operating performance.
◦ Adjusted renewable diesel operating income is defined as renewable diesel segment operating income excluding other operating expenses. We believe adjusted renewable diesel operating income is an important measure of our renewable diesel segment’s operating and financial performance because it excludes an item that is not indicative of that segment’s core operating performance.
◦ Adjusted ethanol operating income (loss) is defined as ethanol segment operating income (loss) excluding the changes in estimated useful lives (see note (d)), the LCM inventory valuation adjustment (see note (c)), and other operating expenses. We believe adjusted ethanol operating income (loss) is an important measure of our ethanol segment’s operating and financial performance because it excludes items that are not indicative of that segment’s core operating performance.
VALERO ENERGY CORPORATIONNOTES TO EARNINGS RELEASE TABLES (Continued)
Table Page 20
◦ Adjusted net cash provided by operating activities is defined as net cash provided by operating activities excluding the items noted below. We believe adjusted net cash provided by operating activities is an important measure of our ongoing financial performance to better assess our ability to generate cash to fund our investing and financing activities. The basis for our belief with respect to each excluded item is provided below.
– Changes in current assets and current liabilities – Current assets net of current liabilities represents our operating liquidity. We believe that the change in our operating liquidity from period to period does not represent cash generated by our operations that is available to fund our investing and financing activities.
– DGD’s adjusted net cash provided by operating activities attributable to our joint venture partner’s ownership interest in DGD – We are a 50/50 joint venture partner in DGD and we consolidate DGD’s financial statements. Our renewable diesel segment includes the operations of DGD and the associated activities to market renewable diesel. Because we consolidate DGD’s financial statements, all of DGD’s net cash provided by operating activities (or operating cash flow) is included in our consolidated net cash provided by operating activities.
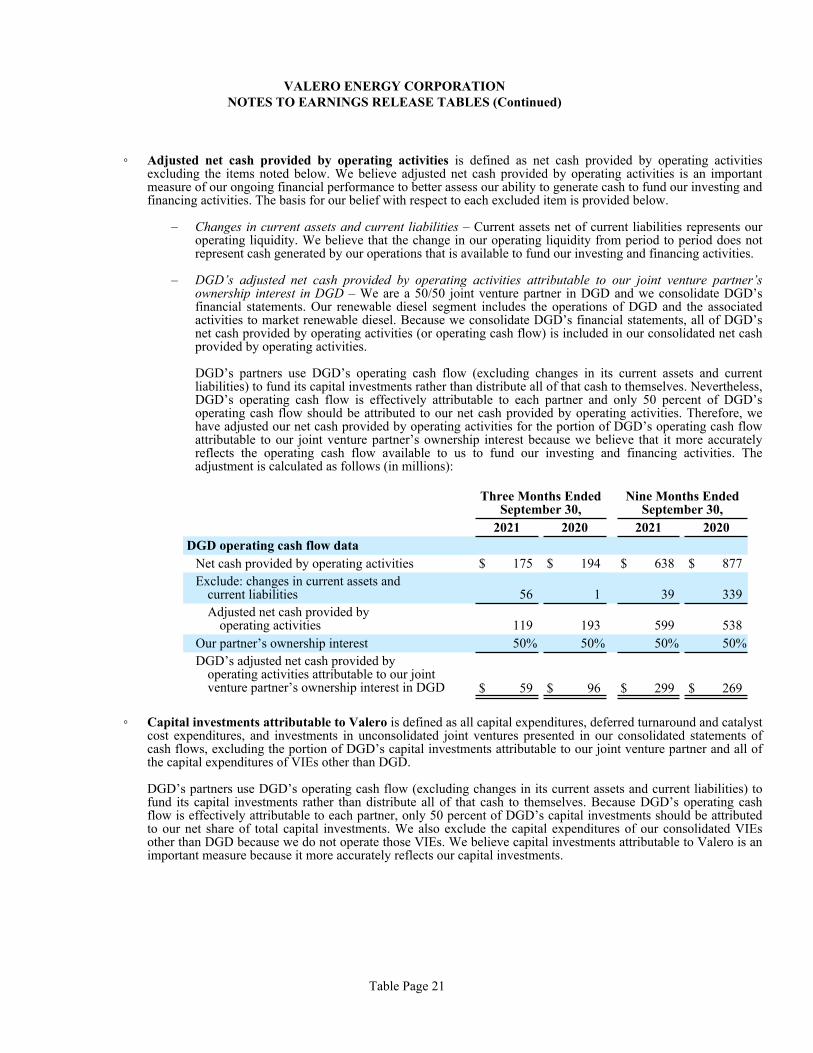
DGD’s partners use DGD’s operating cash flow (excluding changes in its current assets and current liabilities) to fund its capital investments rather than distribute all of that cash to themselves. Nevertheless, DGD’s operating cash flow is effectively attributable to each partner and only 50 percent of DGD’s operating cash flow should be attributed to our net cash provided by operating activities. Therefore, we have adjusted our net cash provided by operating activities for the portion of DGD’s operating cash flow attributable to our joint venture partner’s ownership interest because we believe that it more accurately reflects the operating cash flow available to us to fund our investing and financing activities. The adjustment is calculated as follows (in millions):
Three Months EndedSeptember 30,
Nine Months EndedSeptember 30,
2021 2020 2021 2020DGD operating cash flow data
Net cash provided by operating activities $ 175 $ 194 $ 638 $ 877 Exclude: changes in current assets and
current liabilities 56 1 39 339 Adjusted net cash provided by
operating activities 119 193 599 538 Our partner’s ownership interest 50% 50% 50% 50%DGD’s adjusted net cash provided by
operating activities attributable to our jointventure partner’s ownership interest in DGD $ 59 $ 96 $ 299 $ 269
◦ Capital investments attributable to Valero is defined as all capital expenditures, deferred turnaround and catalyst cost expenditures, and investments in unconsolidated joint ventures presented in our consolidated statements of cash flows, excluding the portion of DGD’s capital investments attributable to our joint venture partner and all of the capital expenditures of VIEs other than DGD.
DGD’s partners use DGD’s operating cash flow (excluding changes in its current assets and current liabilities) to fund its capital investments rather than distribute all of that cash to themselves. Because DGD’s operating cash flow is effectively attributable to each partner, only 50 percent of DGD’s capital investments should be attributed to our net share of total capital investments. We also exclude the capital expenditures of our consolidated VIEs other than DGD because we do not operate those VIEs. We believe capital investments attributable to Valero is an important measure because it more accurately reflects our capital investments.
VALERO ENERGY CORPORATIONNOTES TO EARNINGS RELEASE TABLES (Continued)
Table Page 21
(i) The refining segment regions reflected herein contain the following refineries: U.S. Gulf Coast- Corpus Christi East, Corpus Christi West, Houston, Meraux, Port Arthur, St. Charles, Texas City, and Three Rivers Refineries; U.S. Mid Continent- Ardmore, McKee, and Memphis Refineries; North Atlantic- Pembroke and Quebec City Refineries; and U.S. West Coast- Benicia and Wilmington Refineries.
(j) Primarily includes petrochemicals, gas oils, No. 6 fuel oil, petroleum coke, sulfur, and asphalt.
(k) Valero uses certain operating statistics (as noted below) in the earnings release tables and the accompanying earnings release to evaluate performance between comparable periods. Different companies may calculate them in different ways.
All per barrel of throughput, per gallon of sales, and per gallon of production amounts are calculated by dividing the associated dollar amount by the throughput volumes, sales volumes, and production volumes for the period, as applicable.
Throughput volumes, sales volumes, and production volumes are calculated by multiplying throughput volumes per day, sales volumes per day, and production volumes per day (as provided in the accompanying tables), respectively, by the number of days in the applicable period. We use throughput volumes, sales volumes, and production volumes for the refining segment, renewable diesel segment, and ethanol segment, respectively, due to their general use by others who operate facilities similar to those included in our segments. We believe the use of such volumes results in per unit amounts that are most representative of the product margins generated and the operating costs incurred as a result of our operation of those facilities.
VALERO ENERGY CORPORATIONNOTES TO EARNINGS RELEASE TABLES (Continued)
Table Page 22