Embed Size (px)
Citation preview

VALIDATED REPORT 2015-2016
AGRICULTURE AND FOOD AUTHORITY
HORTICULTURAL CROP S DIRECTORATE

i
Foreword The Horticultural Crops Directorate (HCD) of the Agriculture and Food Authority (AFA), in conjunction with industry
stakeholders undertook a data validation exercise on the performance of the horticulture subsector in the period 2015
and 2016. The findings are presented in this report, which covers the performance of the fruits, vegetables and flowers
grown in all the Counties. The performance of the sub-sector is important considering that it provides income, food
security and foreign exchange to the economy. The data provided herein is obtained from the sub-County level by the
Sub-County agriculture staff, hence improving country-wide representation. The information generated may be used for
planning, research, promotion, and development and investment purposes.
The data provides information on area covered by each crop and value at the farm gate level. For cut flowers the crop
value refers to the Free on Foard (FOB) value. The overall potential for each crop and challenges experienced have been
discussed.
The main challenge remains the non-standardized methodology of collecting the data at the county level, sometimes
giving notable variations in production per unit area and average farm gate prices within neighboring Sub-Counties. Data
validation is undertaken by a multi-disciplinary team which is able to interrogate anomalies in submissions made in
order to improve on accuracy. Another notable challenge was under-reporting for some crops particularly those grown
by large-scale estates. Sub-county agriculture staffs generally do not have access to these estates and are therefore
unable to vouch for the statistics provided.
Overall, there is need to develop the capacity of the data validation team as well as that of the county extension staff to
enhance the validity of the data collected.
ii
Acknowledgement This report is a product of wide consultations among horticulture sector stakeholders whose input has been invaluable.
Special acknowledgement goes to the Kenya National Bureau of Statistics (KNBS), which provided financial and technical
support towards data collection from the counties. Members of the data validation team drawn from the Ministry of
Agriculture, Livestock and Fisheries (MoALF) and are herewith acknowledged.
The County agriculture staff, notably the County Executives Committee members (CECs), County Directors of Agriculture
(CDAs), County Horticulture Crops Officers and Sub County Horticulture Crops Officers offered vital support in availing
data for scrutiny and organizing meetings to deliberate respective reports. This support is highly acknowledged.
With the guidance and facilitation of Mr. Zakayo Magara the Interim Head of Directorate, the coordination of data collection and compilation of this report was undertaken by a team of dedicated technical officers - Grace Kyallo, the Interim Manager Technical and Advisory Services James Kamau Paul, Gilbert Kipyegon, Willis Audi, Jemimah Ndabarua and Caleb Yatich of HCD; John G. Mburu and Patrick Nderitu of KNBS.
I wish to acknowledge the horticulture farming fraternity that continues to generate the data and information used in
preparing this report. Since it is not possible to name each one of you that significantly contributed towards this work,
kindly receive our appreciation for your invaluable input.

iii
Methodology The data collection exercise was preceded by development of data capturing templates. The templates were forwarded
to the County Directors of Agriculture prior to the field visits. The data validation team was trained on the use of the
templates and data collection procedures prior to the field visits.
Data collected from all the 47 counties was validated through county forums during which the pre-filled data templates
were interrogated. The forums were attended by the CDAs and the Sub-County Agriculture Officers (SCAOs) from
respective counties, chaired by a member of the validation team. A workshop was the convened to clean out the data
and subject it to analytical tools.
The report generated from the workshop was discussed and validated by stakeholders before production of the final
report.

iv
TABLE OF CONTENTS:
FOREWORD............................................................................................................................................... I
ACKNOWLEDGEMENT .......................................................................................................................... II
METHODOLOGY ................................................................................................................................... III
1 CHAPTER ONE ................................................................................................................................. 1
1.1 INTRODUCTION......................................................................................................................................... 1
1.2 Review of Performance of Horticultural Crops by Category ...................................................................... 1
1.2.1 Floriculture ........................................................................................................... 1
1.2.2 Exotic Vegetables ................................................................................................. 2
1.2.3 Fruit Production ................................................................................................... 3
1.2.4 Indigenous Vegetables (African Leafy Vegetables) ................................................. 4
1.2.5 Nuts and Oil Crops Production .............................................................................. 5
1.2.6 Aromatic Plants .................................................................................................... 5
1.2.7 Asian Vegetables .................................................................................................. 6
1.2.8 Medicinal Plants ................................................................................................... 6
1.3 Horticultural Exports 2014-2016 ............................................................................................................... 8
1.3.1 Vegetable exports ................................................................................................ 8
1.3.2 Fruits Exports ....................................................................................................... 9
2 CHAPTER TWO ............................................................................................................................. 10
2.1 EXOTIC VEGETABLES PERFORMANCE ...................................................................................................... 10
2.2 Summary of Performance of exotic vegetables for the years 2015-2016 ................................................. 11
2.2.1 Irish potatoes (Solanum tuberosum) ................................................................... 11
2.2.2 Tomatoes (Lycopersicon esculentum) .................................................................. 11
2.2.3 Cabbage (Brassica oleracea var. capitata) ........................................................... 12
2.2.4 Kales (Brassica oleracea) .................................................................................... 13
2.2.5 Garden peas (Pisum sativum) .............................................................................. 14
2.2.6 Carrots (Daucus carota) ...................................................................................... 15
2.2.7 French beans (Phaseolus sp.) .............................................................................. 16
2.2.8 Spinach (Spinacia oleracea) ................................................................................ 16
2.2.9 Snow peas (Pisum sativum var. saccharatum) ..................................................... 17
2.2.10 Butter nut (Curcubita moschata) ......................................................................... 18

v
2.2.11 Courgette (Cucurbita pepo) ................................................................................. 19
2.2.12 Snap peas (Pisum sativum var. macrocarpon) ..................................................... 19
2.2.13 Baby corn (Zea mays var. scarni) ........................................................................ 20
2.2.14 Lettuce (Lactuca sativa) ...................................................................................... 20
2.2.15 Broccoli (Brassica oleraceae var. italica) ............................................................. 21
2.2.16 Cauliflower (Brassica oleracea var. botrytis) ....................................................... 21
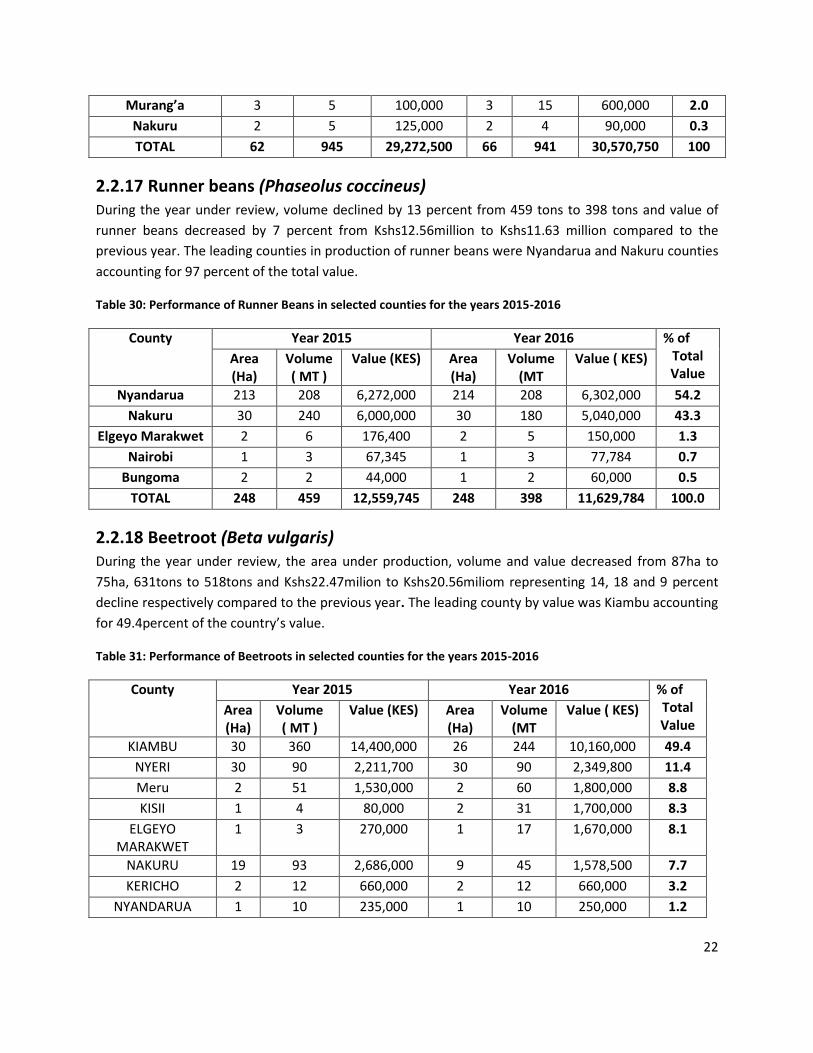
2.2.17 Runner beans (Phaseolus coccineus) ................................................................... 22
2.2.18 Beetroot (Beta vulgaris) ..................................................................................... 22
2.2.19 Celery (Apium graveolens) .................................................................................. 23
2.3 Indigenous vegetables (African Leafy Vegetables) .................................................................................. 23
2.3.1 Cowpeas (Vigna unguiculata) ............................................................................. 24
2.3.2 African Nightshade (Solanum nigrum complexes) ................................................ 25
2.3.3 Spider plant (Cleome gynandra) .......................................................................... 25
2.3.4 Pumpkin leaves (Cucurbita maxima) ................................................................... 26
2.3.5 Leaf Amaranth (Amaranthus Sp.) ........................................................................ 27
2.3.6 Grain Amaranth (Amaranthus Sp.) ...................................................................... 28
2.3.7 Pumpkin fruit (Cucurbita maxima) ...................................................................... 28
2.4 Aromatic Plants ...................................................................................................................................... 29
2.4.1 Bulb onion (Allium cepa L.) ................................................................................. 30
2.4.2 Spring onion (Allium fistulosum) ......................................................................... 31
2.4.3 Coriander (Coriandrum sativum) ......................................................................... 31
2.4.4 Long cayenne (Capsicum annuum) ...................................................................... 32
2.4.5 Bullet chilies (Capsicum annuum) ........................................................................ 33
2.4.6 African birds eye chilies (Capsicum frutescens) .................................................... 34
2.4.7 Bell pepper (Capsicum annuum L.) ...................................................................... 34
2.4.8 Leeks (Allium ampeloprasum) ............................................................................. 35
2.4.9 Garlic (Allium sativum) ....................................................................................... 36
2.4.10 Rosemary (Rosamarinus officinalis) .................................................................... 36
2.5 Asian Vegetables .................................................................................................................................... 37
2.5.1 Eggplant (Solanum melongena) .......................................................................... 37
2.5.2 Dudhi (Lagenaria siceraria) ................................................................................. 38
2.5.3 Karella (Momordica charantia) ........................................................................... 38
2.5.4 Okra (Hibiscus esculentus) .................................................................................. 39
2.6 Medicinal Plants ..................................................................................................................................... 39
3 CHAPTER THREE ......................................................................................................................... 40
3.1 FRUITS .................................................................................................................................................... 40

vi
3.1.1 Overall performance ........................................................................................... 40
3.1.2 Banana (Musa sp) ............................................................................................... 41
3.1.3 Mango (Mangifera indica) .................................................................................. 42
3.1.4 Avocado (Persea americana) .............................................................................. 43
3.1.5 Oranges (Citrus sinensis) ..................................................................................... 44
3.1.6 Lemons (Citrus limon) ......................................................................................... 45
3.1.7 Tangerines (Citrus tangerina) .............................................................................. 46
3.1.8 Passion fruit (Passiflora edulis) ........................................................................... 46
3.1.9 Pineapples (Ananas comosus) ............................................................................. 47
3.1.10 Pawpaw (Carica papaya) .................................................................................... 48
3.1.11 Melon (Cucumis melo sp.) ................................................................................... 49
3.1.12 Custard apple (Annona reticulata) ...................................................................... 50
3.1.13 Loquats (Eriobotrya japonica) ............................................................................. 51
3.1.14 White sapote (Casimiroa edulis) ......................................................................... 51
3.1.15 Apples (Malus domestica) ................................................................................... 52
3.1.16 Plums (Prunus domestica) ................................................................................... 53
3.1.17 Pears (Pyrus communis) ...................................................................................... 53
4 CHAPTER FOUR ............................................................................................................................ 54
4.1 Nuts and Oils .......................................................................................................................................... 54
4.1.1 Coconut (Cocos nucifera) .................................................................................... 55
4.1.2 Macadamia (Macadamia integrifolia) ................................................................. 55
4.1.3 Ground nuts (Arachis hypogaea) ......................................................................... 56
4.1.4 Cashew nuts (Anacardium occidentale) ............................................................... 57
4.1.5 Bambara nuts (Vigna subterranean) ................................................................... 58
5 ANNEX 1 .......................................................................................................................................... 59
5.1 NATIONAL SUMMARY ............................................................................................................................. 59

vii
LIST OF TABLES: Table 1: Summary of Performance of Horticultural products per category for the years 2015-2016 ...................... 1
Table 2: Performance of Flowers in 2015-2016 ...................................................................................................... 2
Table 3: Summary of Performance of Exotic Vegetables in 2015-2016 .................................................................. 2
Table 4: Performance of Fruit in 2015-2016 ........................................................................................................... 3
Table 5: Production of Indigenous vegetables for the year 2015-2016 .................................................................. 4
Table 6: Summary of the Performance of Nuts and Oil Crops in 2015-2016 ........................................................... 5
Table 7: Performance of Aromatic Crops in 2015-2016 .......................................................................................... 5
Table 8: Performance of Asian Vegetables in 2015-2016 ....................................................................................... 6
Table 9: Performance of Medicinal Plants in 2015-2016 ........................................................................................ 7
Table 10: Horticulture Production by top 23 Counties, 2015-2016 ......................................................................... 7
Table 11: Fresh Horticultural Exports ..................................................................................................................... 8
Table 12: Summary of vegetable exports 2015-2016 ............................................................................................. 9
Table 13: Summary of Fruits Exports 2015-2016 .................................................................................................. 10
Table 14: Performance of Irish Potatoes in selected counties for the years 2015-2016........................................ 11
Table 15: Performance of Tomatoes in selected counties for the years 2015-2016 .............................................. 12
Table 16: Performance of cabbages in selected counties for the years 2015-2016 ............................................... 13
Table 17: Performance of kales in selected counties for the years 2015-2016 ..................................................... 13
Table 18: Performance of Garden peas in selected counties for the years 2015-2016 ......................................... 14
Table 19: Performance of Carrots in selected counties for the years 2015-2016 .................................................. 15
Table 20: Performance of French Beans in selected counties for the years 2015-2016 ........................................ 16
Table 21: Performance of Spinach in selected counties for the years 2015-2016 ................................................. 17
Table 22: Performance of Snow Peas in selected counties for the years 2015-2016 ............................................ 17
Table 23: Performance of Butter nut in selected counties for the years 2015-2016 ............................................. 18
Table 24: Performance of Courgette in selected counties for the years 2015-2016 .............................................. 19
Table 25: Performance of Snap peas in selected counties for the years 2015-2016 ............................................. 19
Table 26: Performance of Baby Corn in selected counties for the years 2015-2016 ............................................. 20
Table 27: Performance of Lettuce in selected counties for the years 2015-2016 .................................................. 20
Table 28: Performance of Broccoli in selected counties for the years 2015-2016 ................................................. 21
Table 29: Performance of Cauliflower in selected counties for the years 2015-2016 ........................................... 21
Table 30: Performance of Runner Beans in selected counties for the years 2015-2016 ....................................... 22
Table 31: Performance of Beetroots in selected counties for the years 2015-2016 .............................................. 22
Table 32: Performance of Celery in selected counties for the years 2015-2016 ................................................... 23
Table 33: Production of Indigenous vegetables for the year 2015-2016............................................................... 23
Table 34: Performance of Cowpeas in selected counties for the years 2015-2016 ............................................... 24
Table 35: Performance of African Nightshade in selected counties for the years 2015-2016 ............................... 25
Table 36: Performance of Spider Plant in selected counties for the years 2015-2016 .......................................... 26
Table 37: Performance of Pumpkin Leaves in selected counties for the years 2015-2016 .................................... 26
Table 38: Performance of Leaf Amaranth in selected counties for the years 2015-2016 ...................................... 27
Table 39: Performance of Grain Amaranth in selected counties for the years 2015-2016 .................................... 28
Table 40: Performance of Pumpkin Fruits in selected counties for the years 2015-2016...................................... 29
Table 41: Summary of the performance of Aromatics for the years 2015-2016 ................................................... 29
Table 42: Performance of Bulb onions in selected counties for the years 2015-2016 ........................................... 30
Table 43: Performance of Spring onions in selected counties for the years 2015-2016 ........................................ 31
Table 44: Performance of Coriander in selected counties for the years 2015-2016 .............................................. 32
Table 45: Performance of Long Cayenne in selected counties for the years 2015-2016 ....................................... 32
Table 46: Performance of Bullet Chilies in selected counties for the years 2015-2016 ......................................... 33

viii
Table 47: Performance of African birds eye chilies in selected counties for the years 2015-2016 ........................ 34
Table 48: Performance of Bell pepper in selected counties for the years 2015-2016 ........................................... 35
Table 49: Performance of Leeks in selected counties for the years 2015-2016 .................................................... 35
Table 50: Performance of Garlic in selected counties for the years 2015-2016 .................................................... 36
Table 51: Performance of Rosemary in selected counties for the years 2015-2016.............................................. 36
Table 52: Summary of the Performance of Asian Vegetables for the years 2015-2016 ........................................ 37
Table 53: Performance of Eggplant in selected counties for the years 2015-2016 ................................................ 37
Table 54: Performance of Dudhi in selected counties for the years 2015-2016 .................................................... 38
Table 55: Performance of Karella in selected counties for the years 2015-2016 .................................................. 38
Table 56: Performance of Okra in selected counties for the years 2015-2016 ...................................................... 39
Table 57: Summary of the Performance of Medicinal Plants for the years 2015-2016 ......................................... 39
Table 58: Fruits Production in selected Counties 2015-2016 ................................................................................ 40
Table 59: Production of Bananas in selected Counties 2015-2016 ....................................................................... 42
Table 60: Production of Mangoes in selected Counties, 2015-2016 ..................................................................... 42
Table 61: Production of Avocado in selected Counties, 2015-2016 ...................................................................... 43
Table 62: Production of Oranges in selected Counties, 2015-2016 ....................................................................... 44
Table 63: Production of Lemons in selected Counties, 2015-2016 ....................................................................... 45
Table 64: Production of Tangerines in selected Counties, 2015-2016 .................................................................. 46
Table 65: Production of Passion Fruits in selected Counties, 2015-2016 .............................................................. 47
Table 66: Production of Pineapples in selected Counties, 2015-2016 .................................................................. 48
Table 67: Production of Pawpaw in selected counties 2015-2016 ........................................................................ 48
Table 68: Production of Melons in selected Counties 2015-2016 ......................................................................... 49
Table 69: Production of Custard apple in selected Counties 2015-2016 ............................................................... 50
Table 70: Production of Loquats in selected counties 2015-2016 ......................................................................... 51
Table 71: Production of white sapote in selected counties 2015-2016 ................................................................ 52
Table 72: Production of Apples in selected counties 2015-2016 .......................................................................... 52
Table 73: Production of Plums in selected counties 2015-2016 ........................................................................... 53
Table 74: Production of Pears in selected counties 2015-2016 ............................................................................ 54
Table 75: Summary of the Performance of nuts and oils for the years 2015-2016 ............................................... 54
Table 76: Performance of Coconuts in selected counties for the years 2015-2016 ............................................... 55
Table 77: Performance of Macadamia counties for the years 2015-2016 ............................................................. 56
Table 78: Performance of Ground nuts in selected counties for the years 2015-2016 .......................................... 56
Table 79: Performance of Cashew nuts in selected counties for the years 2015-2016 ......................................... 57
Table 80: Performance of Bambara Nuts in selected counties for the years 2015-2016 ....................................... 58
Table 81: Horticulture production performance by county 2015-2016 ................................................................ 59
ACRONYMS
AFA- Agriculture and Food Authority
ALV – African Leafy Vegetables

ix
CDA- County Director of Agriculture
Ha- Hectare
HCD- Horticultural Crops Directorate
MoALF- Ministry of Agriculture, Livestock and Fisheries
MT- Metric Ton
KES- Kenya Shillings
KNBS- Kenya National Bureau of Statistics
SCAO- Sub- County Agriculture Officer

1
1 CHAPTER ONE
1.1 INTRODUCTION
The agriculture sector is the mainstay of Kenya’s economy contributing 29.3 to the Gross Domestic
Product (GDP) and accounting for 80 of national employment. According to the Kenya Economic Survey
2016, the leading subsectors in 2016 were Dairy, Tea and Horticulture, in that order.
The domestic value of horticulture production in 2016 amounted to Ksh216.37 Billion as compared to
207.73 Billion in 2015; this is equivalent to an increase of 4 percent. Over the same period, cultivated
area increased by 5 percent from 588,411 Ha to 619,114 Ha with a total production of 8.127 Million
Tons in 2016 compared to 7.983 million tons in 2015. This was a 2 percent drop in production that was
attributed to prolonged drought.
Table 1: Summary of Performance of Horticultural products per category for the years 2015-2016
Crop YEAR 2015 YEAR 2016 % of Total Value
Area (Ha) Volume ( MT )
Value (KES) Area (Ha)
Volume (MT
Value ( KES)
Cut Flowers 11,165 122,825 62,937,532,229 13,265 133,658 70,829,466,905 32.7
Exotic Veg 267,417 3,815,853 66,630,266,876 275,925 3,885,395 66,966,189,547 31.0
Fruits 160,968 3,292,200 56,107,118,805 172,527 3,191,175 57,299,316,546 26.5
Nuts 87,781 280,864 8,811,113,217 93,006 240,251 7,983,030,308 3.7
Indigenous Veg 45,051 241,356 6,198,132,755 45,099 224,751 5,621,514,888 2.6
Summer flowers 5,185 260,517 3,237,546,671 8,257 194,284 3,453,496,751 1.6
Aromatic 8,702 90,256 3,257,445,439 9,387 94,491 3,347,433,934 1.5
Asian Veg 1,347 20,123 428,821,622 1,510 16,311 738,234,406 0.3
Medicinal 498 3,989 125,650,500 460 3,492 128,330,500 0.1
Total 588,114 8,127,983 207,733,628,114 619,436 7,983,808 216,367,013,785 100.0
Source: HCD
1.2 Review of Performance of Horticultural Crops by Category
1.2.1 Floriculture In 2016, floriculture contributed Ksh70.83 billion accounting for 33 percent of the total value of
horticulture. This was a 13 percent increase in value compared to Ksh62.94 billion realized in the year
2015. The area increased from 11,165ha in 2015 to 13,265ha in 2016 representing 18.8 percent growth
while volume increased from 122,825 tons in 2015 to 133,658 tons in 2016 representing 8.8 percent
increase.

2
Table 2: Performance of Flowers in 2015-2016
Flower Type 2015 2016 % of Total Value
Volume (Kilograms)
Value (KES) Volume (Kilograms)
Value (KES)
Roses 105,164,150 44,205,855,724 114,285,596 50,384,447,171 71.1
Cuttings 2,609,222 8,710,295,551 1,362,282 8,797,717,890 12.4
Mixed Flowers 2,913,116 1,730,486,138 5,487,176 2,850,841,279 4.0
Statice/Limonium 802,623 273,115,176 1,015,230 2,545,315,319 3.6
Carnation / Dianthus 3,085,351 1,880,241,293 2,741,710 1,321,319,154 1.9
Gypsophilla / Million Stars 1,602,302 601,446,431 1,624,830 793,626,398 1.1
Hypericum 1,399,608 738,303,338 1,792,984 705,354,785 1.0
Chrysanthemums 126,875 83,057,690 250,120 560,612,019 0.8
Alstroemeria 891,350 405,560,676 1,205,935 496,493,977 0.7
Solidago 1,113,454 451,867,391 736,624 405,494,583 0.6
Geranium Cuttings 14,607 1,888,000,778 22,292 382,718,114 0.5
Calla Lillies 236,197 257,757,724 272,128 214,464,762 0.3
Hydrangea 198,791 95,617,963 398,913 199,139,017 0.3
Lilies/Longiflora 331,240 245,080,827 276,721 159,407,134 0.2
Mathiola 285,278 183,102,212 249,876 139,919,488 0.2
Veronica 406,498 125,920,308 353,907 134,804,345 0.2
Eryngium 195,130 96,206,647 223,304 111,023,898 0.2
Others 1,486,683 965,616,546 1,358,704 626,767,572 0.9
TOTAL 122,862,474 62,937,532,413 133,658,334 70,829,466,905 100.0
1.2.2 Exotic Vegetables In 2016, Exotic vegetables contributed 32 percent to the domestic value of horticulture. The area under
vegetables, production and value were 275,925Ha, 3.89 million tons and Ksh 66.97 Billion, respectively.
Crop area increased by 3 percent and production decreased by 2 percent, while there was a slight
reduction in value by 1 percent. The leading vegetables in production and value were Irish potatoes,
tomatoes and cabbages.
Table 3: Summary of Performance of Exotic Vegetables in 2015-2016
Crop YEAR 2015 YEAR 2016 % of Total Value
Area(Ha) Volume(MT) Value (KES) Area(Ha) Volume(MT) Value ( KES)
Potatoes 149,876 1,927,974 28,721,831,732 151,694 1,936,481 27,978,366,910 41.2
Tomatoes 18,077 360,677 12,922,022,714 20,011 382,025 13,687,162,311 20.8
Cabbage 25,926 733,817 9,483,019,065 26,931 775,994 9,667,526,306 14.2
Kales 30,892 445,489 7,178,552,411 32,347 450,121 7,014,782,771 10.3

3
Garden Peas 20,415 82,155 2,191,492,833 21,501 74,643 2,261,173,777 3.4
Carrots 6,422 112,014 1,941,955,201 6,865 110,908 1,930,229,193 2.8
French Beans 5,671 34,779 1,382,209,471 5,983 41,745 1,813,148,952 2.7
Spinach 4,996 72,124 1,056,269,227 5,615 75,563 1,175,716,710 1.7
Snow peas 1,662 10,413 562,403,213 1,664 10,391 589,957,813 0.9
Butternut 1,168 17,850 492,941,971 912 10,146 251,472,671 0.6
Courgette 610 4,613 187,657,076 603 4,046 151,999,860 0.4
Snap peas 376 2,704 149,823,660 373 2,706 139,297,300 0.2
Babycorn 366 3,606 91,221,960 464 3,457 81,587,604 0.2
Cucumber 302 2,581 85,553,980 297 2,313 76,236,778 0.1
Lettuce 104 1,568 41,234,400 104 1,577 43,797,700 0.1
Brocolli 63 757 29,768,000 84 874 34,341,000 0.1
Cauliflower 62 945 29,272,500 66 941 30,570,750 0.1
Beetroot 87 631 22,472,708 75 518 20,558,308 0.1
Runnerbeans 248 459 12,559,745 248 398 11,629,784 0.0
Asparagus 80 560 44,800,003 72 402 2,100,037 0.0
Radish 2 14 600,006 6 41 2,045,006 0.0
Sweetcorn 10 86 1,790,000 9 93 2,008,000 0.0
Turnips 2 38 815,000 1 13 480,007 0.0
Total 267,417 3,815,853 66,630,266,876 275,925 3,885,395 66,966,189,547 100
1.2.3 Fruit Production In 2016, fruits contributed Ksh.57 billion accounting for 27 percent of the total value of horticultural
produce. The area under fruit was 172,527 Ha with a production of 3.2 million tons. The area and value
increased by 7 percent and 2 percent, respectively but production decreased by 3 percent The major
fruits grown in order of importance were; banana, mangoes, pineapples, avocado, pawpaw, oranges,
water melon and passion fruit.
Table 4: Performance of Fruit in 2015-2016
Crop 2015 2016 % of Total
Value AREA
(HA) VOLUME (Tons)
VALUE(KES) AREA (HA)
VOLUME (Tons)
VALUE(KES)
Bananas 60,743 1,257,663 16,977,647,483 63,074 1,242,559 18,109,189,023 31.605
Mango 46,364 806,575 12,195,592,706 49,098 779,147 11,892,258,419 20.755
Pineapples 8,917 366,307 9,668,826,675 9,137 360,494 9,666,349,880 16.870
Avocado 13,305 331,755 6,010,994,155 18,124 368,370 6,924,034,856 12.084
Water Melon 5,444 194,343 4,103,311,368 7,956 173,697 4,000,498,015 6.982
Pawpaw 9,346 127,782 2,102,857,542 8,112 107,591 2,205,138,840 3.848
Oranges 7,062 107,121 2,169,611,035 7,268 85,233 2,166,297,972 3.781
Passion 3,363 46,628 1,659,787,439 3,825 31,571 1,399,002,305 2.442

4
Tamarillo 800 14,454 532,330,425 873 7,434 341,770,685 0.596
Tangerines 1,147 14,939 295,663,135 1,122 10,172 228,616,668 0.399
Lemon 1,247 12,144 217,454,629 1,345 10,817 201,641,967 0.352
Guava 2,687 8,713 71,507,783 1,806 9,800 57,737,125 0.101
Apples 56 589 42,542,405 82 623 34,364,854 0.060
Plums 174 1,826 30,546,297 211 1,952 29,929,886 0.052
Loquats 177 689 11,515,064 238 965 22,847,580 0.040
Custard Apple 103 552 12,994,300 147 581 13,909,917 0.024
White Sapote 27 112 2,640,364 39 155 4,354,554 0.008
Grapes 3 4 648,000 35 7 687,000 0.001
Strawberry 3 4 648,000 35 7 687,000 0.001
TOTAL 160,968 3,292,200 56,107,118,805 172,527 3,191,175 57,299,316,546 100.00
1.2.4 Indigenous Vegetables (African Leafy Vegetables) The preference for the indigenous vegetable popularly known as African leafy vegetables (ALVs) has
been on the increase because of increased awareness on the health and nutritional benefits. During
2016 the area under these vegetables increased by less than 1 percent and the yields and value reduced
by 7 percent and 9 percent, respectively. In this category of vegetables, Cow peas contributed 43
percent followed by African Nightshade and Spider plant that contributed 27 and 11 percent
respectively.
Table 5: Production of Indigenous vegetables for the year 2015-2016
Crop
Year 2015 Year 2016 % of Total Value
Area (Ha)
Volume ( MT )
Value (KES) Area (Ha)
Volume (MT
Value ( KES)
Cow peas 31,714 133,737 3,085,662,097 31,020 115,801 2,434,852,370 43.31
African night shade
5,035 45,457 1,244,412,857 5,565 51,424 1,524,092,340 27.11
Spider plants 2,873 18,290 679,121,858 3,255 18,434 642,929,130 11.44
Pumpkin fruit 866 15,312 466,999,500 1,018 14,430 410,236,763 7.30
Leaf Amarathus 1,346 11,640 328,964,772 1,518 12,544 307,124,947 5.46
Slender Leaf 879 6,532 192,450,432 514 2,218 88,111,165 1.57
Pumpkin leaves 599 3,580 75,864,740 681 4,017 75,938,620 1.35
Jute mallow 544 1,604 50,482,093 599 1,892 68,351,270 1.22
Grain amaranth 273 534 33,259,536 289 588 38,280,798 0.68
Vine spine 148 1,099 30,928,000 162 1,147 23,150,005 0.41
Stinging neetle 724 3,177 5,865,990 426 1,954 4,807,400 0.09
Malabor 48 269 2,893,880 50 236 3,015,080 0.05
Russian Confrey
2 125 1,227,000 2 65 625,000 0.01
Total 45,051 241,356 6,198,132,755 45,099 224,751 5,621,514,888 100.00

5
1.2.5 Nuts and Oil Crops Production In 2016, nuts and oil crops contributed Ksh5.79 billion accounting for 3.7 percent of the domestic value
of horticulture. The area under crop increased by 6 percent but production and value decreased by 14
and 9 percent, respectively compared to the previous year. The increase in the area was attributed to
better prices offered to farmers in 2014 and reduced production and value of nuts was attributed to
drought and poor prices in 2015.
Table 6: Summary of the Performance of Nuts and Oil Crops in 2015-2016
Crop
Year 2015 Year 2016 % of Total Value
Area (Ha)
Volume ( MT )
Value (KES) Area (Ha)
Volume (MT
Value ( KES)
Macadamia 9,727 134,376 4,303,516,406 6,173 113,498 3,750,447,258 47.0
Coconuts 43,404 107,340 1,862,232,954 47,401 93,626 1,965,502,566 24.6
Groundnuts 10,040 14,754 1,503,855,313 9,417 11,956 1,262,809,833 15.8
Cashew nut 24,466 23,493 1,056,308,294 29,837 20,033 908,018,651 11.4
Bambara 145 902 85,200,250 178 1,138 96,252,000 1.2
Total 87,782 280,865 8,811,113,217 93,006 240,251 7,983,030,308 100.0
1.2.6 Aromatic Plants Aromatics crops accounted for 2 percent of the total value of horticultural products by value. The area
under production increased from 8,702 Ha in 2015 to 9,387 Ha in 2016 due to good returns per unit
while production increased from 90,256 tons to 94,491 tons representing 8 and 6 percent growth
respectively. The value increased form Ksh3.2 Billion in 2015 to Ksh3.34 Billion in 2016 representing 3
increases. The leading crops in this category were bulb onions, spring onions and coriander accounting
for 58, 16 and 10 percent, respectively.
Table 7: Performance of Aromatic Crops in 2015-2016
Crops Year 2015 Year 2016 % of Total Value
Area (Ha)
Volume ( MT )
Value (KES) Area (Ha)
Volume (MT
Value ( KES)
Bulb onion 3,663 42,327 1,733,916,835 4,085 46,170 1,941,598,792 58.0
Spring onion 2,654 24,644 613,008,080 2,706 22,678 544,304,610 16.3
Coriander 691 8,778 317,019,441 727 8,948 320,748,279 9.6
Bell pepper 898 7,510 305,588,020 866 5,940 238,247,612 7.1
Leeks 112 1,539 100,225,100 113 1,451 97,391,878 2.9
Long cayenne 288 2,459 83,972,722 280 2,545 78,327,458 2.3
African Birds Eye Chilies
110 787 35,342,839 156 878 42,347,400 1.3
Bullet chilies 36 377 19,874,925 67 442 19,046,503 0.57

6
Chives 149 1,159 16,896,000 142 1,112 17,103,000 0.51
Celery 21 339 11,704,275 25 452 15,308,000 0.46
Garlic 8 58 8,250,000 18 99 12,260,000 0.37
Rosemary 37 99 4,968,200 48 174 6,639,400 0.20
Tumeric 10 63 1,332,002 7 181 5,450,002 0.16
Ginger 14 47 1,760,000 135 3,345 4,895,000 0.15
Parsley 8 47 2,187,000 8 49 2,397,000 0.07
Mint 4 24 1,400,000 6 27 1,369,000 0.04
Total 8,702 90,256 3,257,445,439 9,387 94,491 3,347,433,934 100
1.2.7 Asian Vegetables
Asian vegetables are grown for sale to the Asian community living in Kenya as well as for the
export market. During the period under review, the area under production increased by 12
percent from 1,347 Ha in 2015 to 1,510 Ha in 2016 while production decreased by 18 percent
from 20,123 ton to 16,300 ton over the same period. The value of the vegetables increased
from Kshs428.8 million in 2015 to Kshs738.2 million in 2016 representing a 72 percent increase,
attributed to increased farm gate prices.
Table 8: Performance of Asian Vegetables in 2015-2016
Crops Year 2015 Year 2016 % of Total Value
Area (Ha)
Volume ( MT )
Value (KES) Area (Ha)
Volume (MT
Value ( KES)
Egg plant 736 11,563 242,677,389 818 11,193 356,361,725 48.3
Okra 417 7,155 109,333,733 516 3,941 330,500,277 44.8
Dudhi 102 883 30,028,940 104 797 26,191,600 3.5
Karella 53 367 39,510,000 34 221 22,973,700 3.1
Valore 30 115 4,624,560 35 143 1,732,104 0.2
Tindori 9 40 2,647,000 3 16 475,000 0.1
Total 1,347 20,123 428,821,622 1,510 16,311 738,234,406 100.0
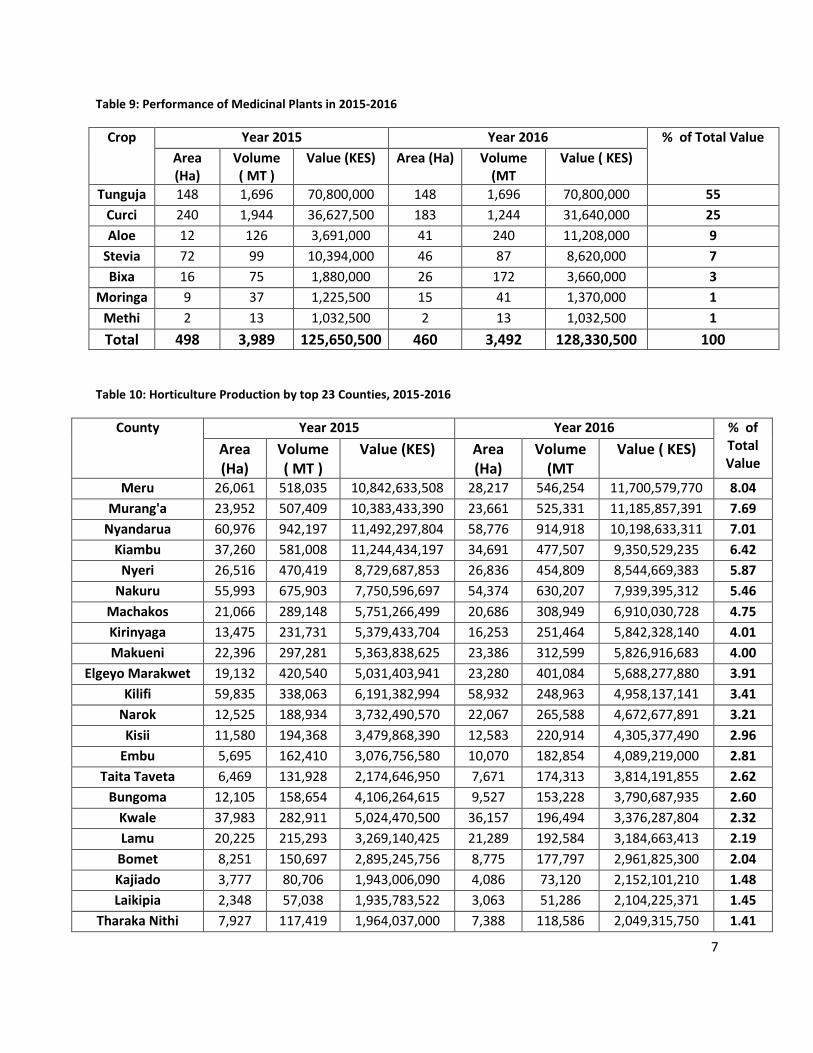
1.2.8 Medicinal Plants During the period under review, medicinal plants showed a decrease in the area under production as
well as the quantity produced from 490 Ha in 2015 to 460 Ha and 3,989 tons to 3,492 tons. This
decrease is attributed low replanting. The crop value however increased from Ksh125 Million to Ksh128
Million due to increased farm gate prices. In view of the growing demand for medicinal crops,
interventions are required to facilitate farmers to increase supply
7
Table 9: Performance of Medicinal Plants in 2015-2016
Crop Year 2015 Year 2016 % of Total Value
Area (Ha)
Volume ( MT )
Value (KES) Area (Ha) Volume (MT
Value ( KES)
Tunguja 148 1,696 70,800,000 148 1,696 70,800,000 55
Curci 240 1,944 36,627,500 183 1,244 31,640,000 25
Aloe 12 126 3,691,000 41 240 11,208,000 9
Stevia 72 99 10,394,000 46 87 8,620,000 7
Bixa 16 75 1,880,000 26 172 3,660,000 3
Moringa 9 37 1,225,500 15 41 1,370,000 1
Methi 2 13 1,032,500 2 13 1,032,500 1
Total 498 3,989 125,650,500 460 3,492 128,330,500 100
Table 10: Horticulture Production by top 23 Counties, 2015-2016
County
Year 2015 Year 2016 % of Total Value
Area (Ha)
Volume ( MT )
Value (KES) Area (Ha)
Volume (MT
Value ( KES)
Meru 26,061 518,035 10,842,633,508 28,217 546,254 11,700,579,770 8.04
Murang'a 23,952 507,409 10,383,433,390 23,661 525,331 11,185,857,391 7.69
Nyandarua 60,976 942,197 11,492,297,804 58,776 914,918 10,198,633,311 7.01
Kiambu 37,260 581,008 11,244,434,197 34,691 477,507 9,350,529,235 6.42
Nyeri 26,516 470,419 8,729,687,853 26,836 454,809 8,544,669,383 5.87
Nakuru 55,993 675,903 7,750,596,697 54,374 630,207 7,939,395,312 5.46
Machakos 21,066 289,148 5,751,266,499 20,686 308,949 6,910,030,728 4.75
Kirinyaga 13,475 231,731 5,379,433,704 16,253 251,464 5,842,328,140 4.01
Makueni 22,396 297,281 5,363,838,625 23,386 312,599 5,826,916,683 4.00
Elgeyo Marakwet 19,132 420,540 5,031,403,941 23,280 401,084 5,688,277,880 3.91
Kilifi 59,835 338,063 6,191,382,994 58,932 248,963 4,958,137,141 3.41
Narok 12,525 188,934 3,732,490,570 22,067 265,588 4,672,677,891 3.21
Kisii 11,580 194,368 3,479,868,390 12,583 220,914 4,305,377,490 2.96
Embu 5,695 162,410 3,076,756,580 10,070 182,854 4,089,219,000 2.81
Taita Taveta 6,469 131,928 2,174,646,950 7,671 174,313 3,814,191,855 2.62
Bungoma 12,105 158,654 4,106,264,615 9,527 153,228 3,790,687,935 2.60
Kwale 37,983 282,911 5,024,470,500 36,157 196,494 3,376,287,804 2.32
Lamu 20,225 215,293 3,269,140,425 21,289 192,584 3,184,663,413 2.19
Bomet 8,251 150,697 2,895,245,756 8,775 177,797 2,961,825,300 2.04
Kajiado 3,777 80,706 1,943,006,090 4,086 73,120 2,152,101,210 1.48
Laikipia 2,348 57,038 1,935,783,522 3,063 51,286 2,104,225,371 1.45
Tharaka Nithi 7,927 117,419 1,964,037,000 7,388 118,586 2,049,315,750 1.41
8
Trans Nzoia 3,536 54,060 1,051,274,119 4,509 63,170 1,933,613,958 1.33
Kericho 2,915 119,859 1,836,816,275 3,190 107,732 1,916,391,138 1.32
Others 74,951 819,147 20,145,885,881 86,703 800,402 17,041,613,793 11.71
Total 576,949 8,005,158 144,796,095,885 606,170 7,850,153 145,537,546,882 100.00
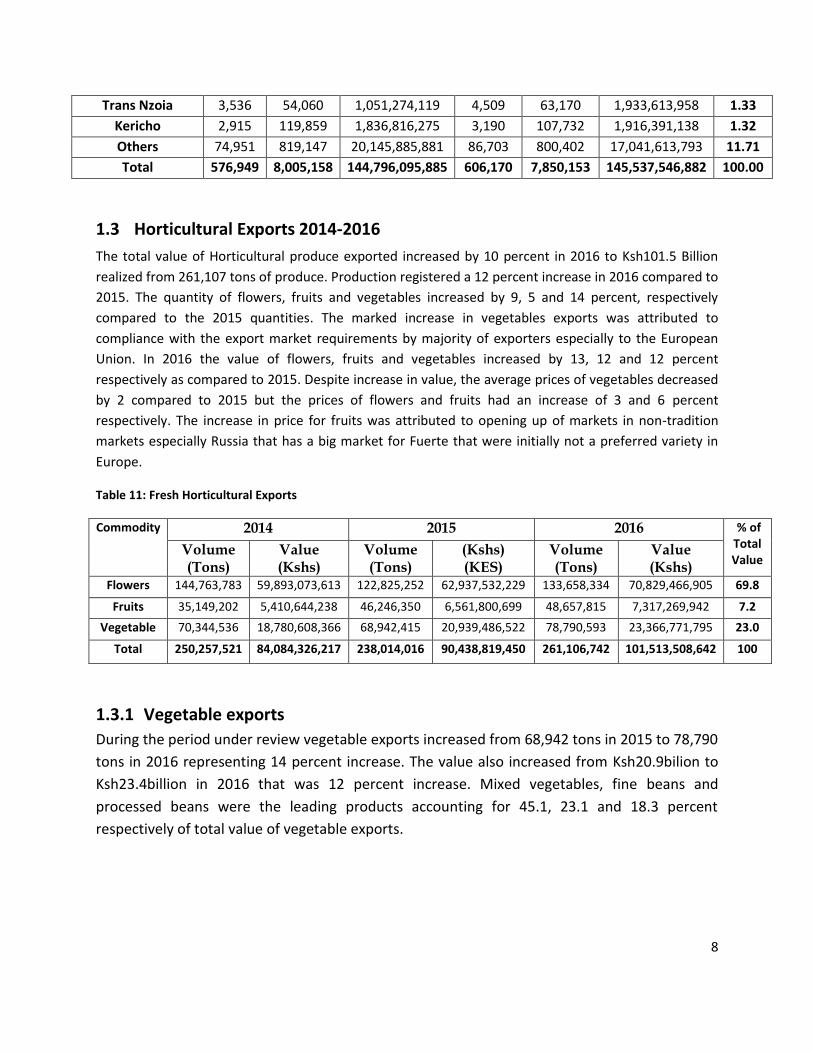
1.3 Horticultural Exports 2014-2016
The total value of Horticultural produce exported increased by 10 percent in 2016 to Ksh101.5 Billion
realized from 261,107 tons of produce. Production registered a 12 percent increase in 2016 compared to
2015. The quantity of flowers, fruits and vegetables increased by 9, 5 and 14 percent, respectively
compared to the 2015 quantities. The marked increase in vegetables exports was attributed to
compliance with the export market requirements by majority of exporters especially to the European
Union. In 2016 the value of flowers, fruits and vegetables increased by 13, 12 and 12 percent
respectively as compared to 2015. Despite increase in value, the average prices of vegetables decreased
by 2 compared to 2015 but the prices of flowers and fruits had an increase of 3 and 6 percent
respectively. The increase in price for fruits was attributed to opening up of markets in non-tradition
markets especially Russia that has a big market for Fuerte that were initially not a preferred variety in
Europe.
Table 11: Fresh Horticultural Exports
Commodity 2014 2015 2016 % of Total Value
Volume (Tons)
Value (Kshs)
Volume (Tons)
(Kshs) (KES)
Volume (Tons)
Value (Kshs)
Flowers 144,763,783 59,893,073,613 122,825,252 62,937,532,229 133,658,334 70,829,466,905 69.8
Fruits 35,149,202 5,410,644,238 46,246,350 6,561,800,699 48,657,815 7,317,269,942 7.2
Vegetable 70,344,536 18,780,608,366 68,942,415 20,939,486,522 78,790,593 23,366,771,795 23.0
Total 250,257,521 84,084,326,217 238,014,016 90,438,819,450 261,106,742 101,513,508,642 100
1.3.1 Vegetable exports
During the period under review vegetable exports increased from 68,942 tons in 2015 to 78,790
tons in 2016 representing 14 percent increase. The value also increased from Ksh20.9bilion to
Ksh23.4billion in 2016 that was 12 percent increase. Mixed vegetables, fine beans and
processed beans were the leading products accounting for 45.1, 23.1 and 18.3 percent
respectively of total value of vegetable exports.

9
Table 12: Summary of vegetable exports 2015-2016
Type of Vegetable 2015 2016 % of Total Value
Volume (Kilograms)
Value (KES) Volume (Kilograms)
Value (KES)
Mixed Vegetables 28,129,938 9,122,920,193 29,533,334 10,543,733,171 45.12
Fine Beans 23,090,599 7,109,920,896 20,100,179 5,386,523,836 23.05
Bean Processed 9,155,306 1,377,034,672 20,463,614 4,277,472,739 18.31
Snow/Mangetout 2,608,956 983,973,569 2,666,583 827,285,127 3.54
Herbs 1,090,169 596,880,092 1,133,189 731,876,331 3.13
Chilies 925,675 294,343,279 902,672 434,655,696 1.86
Aubergines 993,636 226,736,136 1,357,063 394,019,334 1.69
Snap Peas 1,065,624 465,296,066 1,088,506 343,578,595 1.47
Garden Peas 166,361 76,365,718 258,549 109,080,932 0.47
Basil 206,397 81,596,167 214,552 96,436,210 0.41
Chives 80,303 38,251,851 103,061 51,048,691 0.22
Runner Beans 391,104 140,622,086 112,287 36,517,618 0.16
Baby Corn 74,911 27,157,949 60,126 23,558,438 0.10
Dudhi 18,823 6,068,929 41,725 14,382,833 0.06
Okra 52,013 13,804,657 39,483 13,727,279 0.06
Pepper Mint 26,223 10,377,465 26,422 11,247,542 0.05
Patra/Arrow Root Leaves 17,415 6,202,449 29,626 10,515,491 0.05
Karella 46,619 14,693,091 27,023 8,955,757 0.04
Onions 43,590 16,396,252 28,481 6,639,060 0.03
Carrots 10,471 3,933,467 18,022 6,444,489 0.03
Thyme 13,281 5,743,717 13,844 6,235,825 0.03
Turia 4,231 1,221,939 17,920 4,930,443 0.02
Others 730,413 319,295,566 553,764 27,301,588 0.12
TOTAL 68,942,057 20,938,755,206 78,790,023 23,366,167,025 100.0
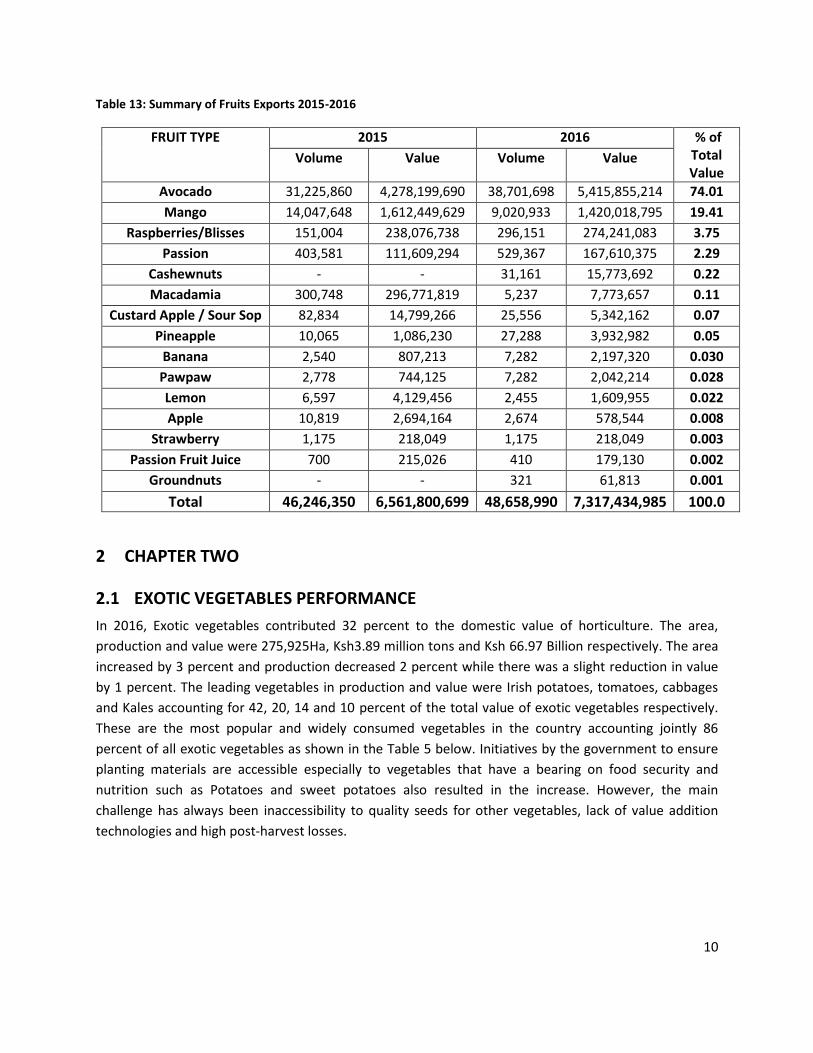
1.3.2 Fruits Exports During the period under review fruits contributed Ksh7.3 Billion by value of horticultural exports.
Avocado contributed Ksh5.4billion accounting for 74 percent of fruits exports by value while mango
export was Ksh1.4billion accounting for 19.4percent of fruits exports. Raspberries have moved to
position three in export values and the potential for the fruits is high. The average price of raspberries
was the highest among the fruits exported.
10
Table 13: Summary of Fruits Exports 2015-2016
FRUIT TYPE 2015 2016 % of Total Value
Volume Value Volume Value
Avocado 31,225,860 4,278,199,690 38,701,698 5,415,855,214 74.01
Mango 14,047,648 1,612,449,629 9,020,933 1,420,018,795 19.41
Raspberries/Blisses 151,004 238,076,738 296,151 274,241,083 3.75
Passion 403,581 111,609,294 529,367 167,610,375 2.29
Cashewnuts - - 31,161 15,773,692 0.22
Macadamia 300,748 296,771,819 5,237 7,773,657 0.11
Custard Apple / Sour Sop 82,834 14,799,266 25,556 5,342,162 0.07
Pineapple 10,065 1,086,230 27,288 3,932,982 0.05
Banana 2,540 807,213 7,282 2,197,320 0.030
Pawpaw 2,778 744,125 7,282 2,042,214 0.028
Lemon 6,597 4,129,456 2,455 1,609,955 0.022
Apple 10,819 2,694,164 2,674 578,544 0.008
Strawberry 1,175 218,049 1,175 218,049 0.003
Passion Fruit Juice 700 215,026 410 179,130 0.002
Groundnuts - - 321 61,813 0.001
Total 46,246,350 6,561,800,699 48,658,990 7,317,434,985 100.0
2 CHAPTER TWO
2.1 EXOTIC VEGETABLES PERFORMANCE
In 2016, Exotic vegetables contributed 32 percent to the domestic value of horticulture. The area,
production and value were 275,925Ha, Ksh3.89 million tons and Ksh 66.97 Billion respectively. The area
increased by 3 percent and production decreased 2 percent while there was a slight reduction in value
by 1 percent. The leading vegetables in production and value were Irish potatoes, tomatoes, cabbages
and Kales accounting for 42, 20, 14 and 10 percent of the total value of exotic vegetables respectively.
These are the most popular and widely consumed vegetables in the country accounting jointly 86
percent of all exotic vegetables as shown in the Table 5 below. Initiatives by the government to ensure
planting materials are accessible especially to vegetables that have a bearing on food security and
nutrition such as Potatoes and sweet potatoes also resulted in the increase. However, the main
challenge has always been inaccessibility to quality seeds for other vegetables, lack of value addition
technologies and high post-harvest losses.

11
2.2 Summary of Performance of exotic vegetables for the years 2015-2016
2.2.1 Irish potatoes (Solanum tuberosum) Irish potato is one of the staple foods in Kenya and accounted for 41.2 percent of the total value of
exotic vegetables. The area under potato production increased by 1 percent in 2016 compared to 2015.
However, there was a decrease in the value from potato production in 2016 by 3 percent compared to
2015. Lack of clean planting materials and bacterial wilt are the major challenges in Irish potato
production. The average farm gate price of Irish potatoes per kg declined from an average of Kshs14.89
in 2015 to Kshs14.44 in 2016 resulting to a reduction in value in major producing Counties. There was
also a marginal reduction in yield per unit area from 12.86 tons/ha in 2015 to 12.76 tons per Ha in 2016
representing a 1 reduction.
Table 14: Performance of Irish Potatoes in selected counties for the years 2015-2016
County
Year 2015 Year 2016 % of Total Value
Area (Ha)
Volume ( MT )
Value (KES) Area (Ha) Volume (MT)
Value ( KES)
Nyandarua 33,948 573,915 7,536,103,350 32,420.00 539,985 6,352,035,350 22.7
Nakuru 40,881 369,233 4,930,382,726 35,376.00 403,080 5,051,468,802 18.1
Elgeyo Marakwet
13,486 314,298 2,942,306,435 16,050.00 289,487 3,489,319,925 12.5
Nyeri 15,394 185,177 3,573,709,333 15,424 175,905 3,380,878,000 12.1
Meru 4,997 90,374 2,250,736,411 5,727 80,662 2,388,823,754 8.5
Kiambu 17,717 132,475 2,774,515,363 16,734 119,809 1,844,436,800 6.6
Narok 6,809 94,016 1,362,622,437 12,065 141,542 1,767,460,967 6.3
Bomet 4,225 69,505 1,401,600,000 4,960 79,262 1,454,740,000 5.2
Murang’a 7,043 20,108 331,454,794 6,648 35,081 813,097,700 2.9
Bungoma 931 18,895 451,500,020 818 12,850 409,625,020 1.5
Nandi 638 12,033 376,413,195 806 16,643 203,235,695 0.7
Laikipia 525 10,938 124,999,464 1,082 5,410 129,840,000 0.5
Kirinyaga 677 3,283 90,887,826 811 3,690 109,800,000 0.4
Kericho 309 1,979 37,630,300 442 4,159 106,631,250 0.4
West Pokot 718 4,831 96,620,000 770 5,096 101,920,000 0.4
Others 1,578 26,914 440,350,078 1,562 23,821 375,053,647 1.3
TOTAL 149,876 1,927,974 28,721,831,732 151,694 1,936,481 27,978,366,910 100.0
2.2.2 Tomatoes (Lycopersicon esculentum) Tomatoes are the second most important exotic vegetable accounting for 20 percent by value of the
exotic vegetables in 2016. The area increased from 18,378ha in 2015 to 20,111ha in 2016 representing
11percent increase while production increased from 330,679tons to 341,026tons a 6 percent increase.

12
There was a 6 percent increase in value from Ksh12.92bilion to Ksh13.68bilion that was attributed to
increased volumes and better farm gate prices in the main producing counties. The increase in
production may have been as a result of enhanced irrigation and expansion in green house production.
However, pests and diseases are the major challenges in tomato production. The prevalence of tomato
leaf miner Tuta absoluta an important pest in tomato production, bacterial wilt and late blight are the
major challenges faced by tomato farmers.
Table 15: Performance of Tomatoes in selected counties for the years 2015-2016
County YEAR 2015 YEAR 2016 % of Total value
Area (Ha)
Volume (MT)
Value (KES)
Area (Ha)
Volume (MT)
Value (KES)
Kirinyaga 2,015 42,780 2,099,670,000 3,128 54,185 2,323,140,000 17.0
Kajiado 1,360 27,440 1,388,231,040 1,452 32,789 1,612,592,000 11.8
Taita Taveta 579 13,745 556,580,000 830 18,026 1,157,692,000 8.5
Laikipia 536 12,674 650,058,200 583 14,070 986,420,000 7.2
Bungoma 1,055 25,429 1,211,210,000 811 21,305 951,330,000 7.0
Trans Nzoia 659 14,690 617,200,030 733 16,660 638,237,500 4.7
Narok 784 14,920 528,959,999 1,561 20,744 596,402,394 4.4
Nakuru 851 14,158 293,884,050 946 15,179 491,697,047 3.6
Kisumu 591 16,512 725,882,539 646 8,545 397,342,500 2.9
Homa Bay 752 6,771 324,371,006 669 8,249 393,580,000 2.9
Machakos 795 9,500 245,599,000 689 12,765 380,772,000 2.8
Kiambu 986 16,545 692,217,200 965 9,132 327,305,000 2.4
Meru 928 7,903 229,754,016 1,050 9,951 322,565,018 2.4
Bomet 862 10,785 283,500,000 527 9,047 261,152,000 1.9
Lamu 360 7,719 284,855,000 374 7,190 247,700,000 1.8
Others 5,265 89,108 2,790,050,634 5,147 83,189 2,599,234,852 19.0
TOTAL 18,378 330,679 12,922,022,714 20,111 341,026 13,687,162,311 100.0
2.2.3 Cabbage (Brassica oleracea var. capitata) Cabbage is mainly grown for the domestic market. In 2016, the area under cabbage production
increased from 25,926ha in 2015 to 26,931ha in 2016 while production increased from 733,817tons to
775,994tons in the same period which was a 4 percent and 6 percent rise respectively. The value had a
marginal rise from Ksh9.48bilion to Ksh9.67bilion representing a 2 percent rise as compared to 2015.
Meru and Nyandarua Counties led in value and volume in 2016 accounting for 22 percent and 18
percent of the country’s total value. Cabbage is one of the highly consumed vegetables in Kenya, has a
long shelf life and is easy to transport thus increasing its demand. High cost of farm inputs and pests like
the diamond back moth are major challenges in cabbage production.

13
Table 16: Performance of cabbages in selected counties for the years 2015-2016
County YEAR 2015 YEAR 2016 % of Total value
Area (Ha)
Volume ( MT )
Value (KES) Area (Ha)
Volume (MT
Value ( KES)
Meru 1,808 84,102 1,679,813,772 2,589 107,231 2,112,732,120 21.9
Nyandarua 8,557 237,745 1,775,995,792 8,340 232,725 1,779,735,792 18.4
Nyeri 2,294 54,400 802,879,993 2,292 55,928 813,014,000 8.4
Elgeyo Marakwet
998 32,110 611,229,016 959 31,798 608,045,018 6.3
Bungoma 1,256 34,260 666,340,000 1,033 26,222 591,722,500 6.1
Kisii 1,077 43,036 643,398,000 974 38,833 582,100,000 6.0
Nakuru 1,980 65,486 732,727,000 2,096 63,342 577,228,302 6.0
Narok 808 20,643 331,336,817 1,636 39,413 543,066,700 5.6
Bomet 665 29,127 360,342,000 668 34,383 394,260,000 4.1
Kiambu 2,278 44,367 505,781,000 1,942 41,874 379,655,000 3.9
Trans Nzoia 511 10,684 79,172,020 560 11,807 215,614,800 2.2
Murang’a 345 5,501 99,442,280 384 6,415 116,970,000 1.2
Taita Taveta 100 4,859 138,520,000 87 4,131 116,700,000 1.2
Nandi 341 8,045 223,055,000 299 9,245 116,096,800 1.2
Makueni 259 3,744 110,720,000 201 3,794 113,220,000 1.2
Others 2,652 55,709 722,266,375 2,873 68,853 607,365,274 6.3
TOTAL 25,926 733,817 9,483,019,065 26,931 775,994 9,667,526,306 100.0
2.2.4 Kales (Brassica oleracea) Kales or “Sukuma wiki” as commonly referred to is produced for the domestic market. It is the most
popular leafy vegetable and highly consumed vegetable in the country and is grown in all the 47
counties. The area under kales increased from 30,890ha to 32,347ha while production increased from
482,489tons to 478,121tons in 2016 which a 5 and 1percent increase respectively. However, the value
of cabbage declined by 2 percent from Ksh7.37bilion to Ksh6.95bilion in 2016 compared to the previous
year.
Table 17: Performance of kales in selected counties for the years 2015-2016
County YEAR 2015 YEAR 2016 % of Total Value
Area (Ha)
Volume Total Area (Ha)
Volume Value ( KES)
Kiambu 3,684 82,606 1,026,525,000 3,325 93,037 1,187,629,000 17.1
Nakuru 1,763 65,526 745,555,773 1,973 61,937 670,310,036 9.6
Kisii 1,821 24,077 372,862,500 1,801 27,807 467,174,250 6.7
Bomet 871 19,932 325,780,000 973 25,127 416,220,000 6.0
Narok 1,266 25,883 433,817,379 1,835 21,027 394,819,300 5.7
Meru 1,397 25,717 571,547,480 1,158 19,487 327,017,200 4.7
14
Nyandarua 1,685 27,357 277,713,623 1,380 22,025 239,096,350 3.4
Siaya 1,750 13,551 212,500,732 1,803 15,328 235,662,200 3.4
Homa Bay 957 8,543 237,741,000 806 8,426 225,645,000 3.2
Kericho 275 11,103 191,290,000 287 11,720 197,930,000 2.8
Nandi 840 12,740 110,120,000 1,070 16,531 186,550,000 2.7
Murang'a 594 6,681 121,308,000 579 9,584 184,137,750 2.6
Kakamega 1,007 10,635 224,320,000 1,060 9,322 181,390,000 2.6
Elgeyo Marakwet 861 12,250 168,370,000 917 13,121 177,250,000 2.5
Taita Taveta 226 5,834 151,670,000 380 8,405 162,430,000 2.3
Bungoma 1,588 8,710 146,640,000 1,006 9,449 161,400,000 2.3
Lamu 276 5,533 176,598,000 291 5,420 140,520,000 2.0
Trans Nzoia 703 9,572 94,320,011 833 11,695 132,510,000 1.9
Nyamira 483 11,054 118,372,560 731 11,837 127,829,005 1.8
Others 8,842 95,185 1,671,650,353 10,141 76,837 1,139,262,680 16.4
Total 30,890 482,489 7,378,702,411 32,347 478,121 6,954,782,771 100.0
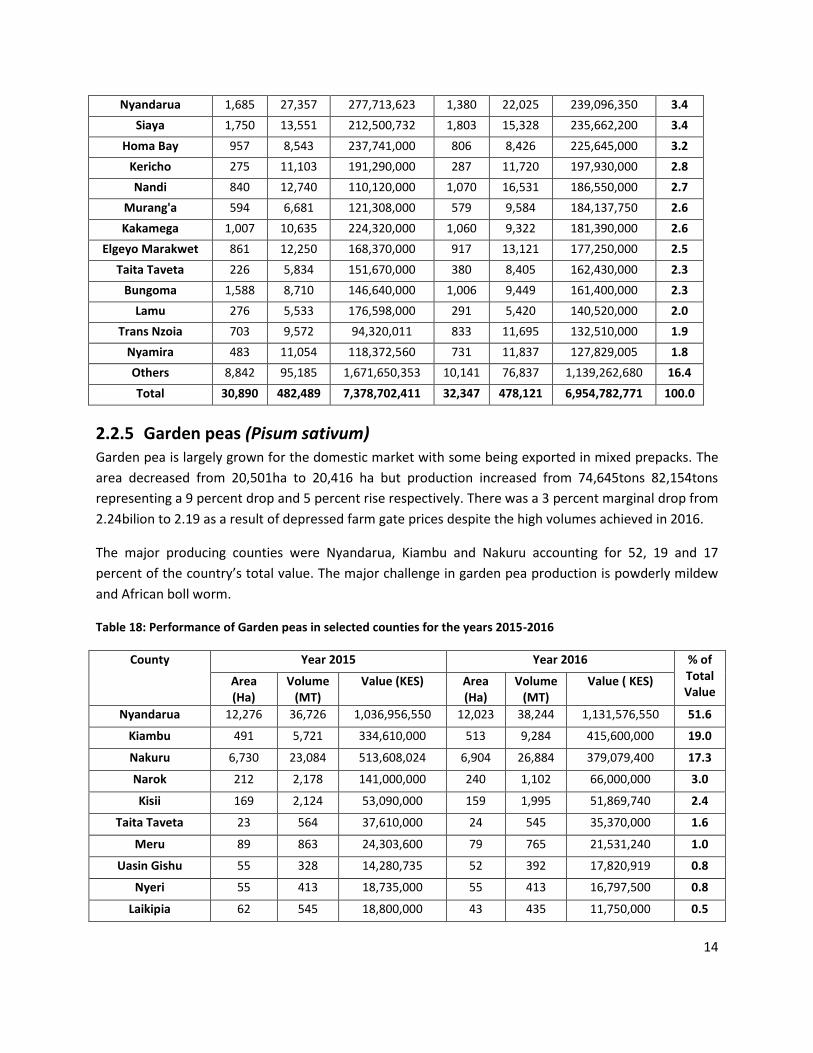
2.2.5 Garden peas (Pisum sativum) Garden pea is largely grown for the domestic market with some being exported in mixed prepacks. The
area decreased from 20,501ha to 20,416 ha but production increased from 74,645tons 82,154tons
representing a 9 percent drop and 5 percent rise respectively. There was a 3 percent marginal drop from
2.24bilion to 2.19 as a result of depressed farm gate prices despite the high volumes achieved in 2016.
The major producing counties were Nyandarua, Kiambu and Nakuru accounting for 52, 19 and 17
percent of the country’s total value. The major challenge in garden pea production is powderly mildew
and African boll worm.
Table 18: Performance of Garden peas in selected counties for the years 2015-2016
County Year 2015 Year 2016 % of Total Value
Area (Ha)
Volume (MT)
Value (KES) Area (Ha)
Volume (MT)
Value ( KES)
Nyandarua 12,276 36,726 1,036,956,550 12,023 38,244 1,131,576,550 51.6
Kiambu 491 5,721 334,610,000 513 9,284 415,600,000 19.0
Nakuru 6,730 23,084 513,608,024 6,904 26,884 379,079,400 17.3
Narok 212 2,178 141,000,000 240 1,102 66,000,000 3.0
Kisii 169 2,124 53,090,000 159 1,995 51,869,740 2.4
Taita Taveta 23 564 37,610,000 24 545 35,370,000 1.6
Meru 89 863 24,303,600 79 765 21,531,240 1.0
Uasin Gishu 55 328 14,280,735 52 392 17,820,919 0.8
Nyeri 55 413 18,735,000 55 413 16,797,500 0.8
Laikipia 62 545 18,800,000 43 435 11,750,000 0.5

15
Nandi 30 267 17,080,000 25 217 11,340,000 0.5
Elgeyo Marakwet 127 1,050 8,357,067 128 1,076 10,215,482 0.5
Trans Nzoia 78 337 10,102,800 67 302 8,129,002 0.4
Kericho 13 125 3,280,000 22 134 3,740,000 0.2
Kajiado 25 145 2,200,000 20 128 1,960,000 0.1
Others 66 175 7,160,000 62 238 8,713,000 0.4
TOTAL 20,501 74,645 2,241,173,776 20,416 82,154 2,191,492,833 100.0
2.2.6 Carrots (Daucus carota) Carrots are mainly produced for domestic market although there is a small volume that is exported in
mixed vegetable pre-packs. There was an increase in the area under carrot production by 6 percent from
7,423Ha in 2015 to 7,864Ha in 2016. However, the volume and value decreased from 112,015tons to
110,908tons and Ksh1.94bilion to Ksh1.93billion a 1percent drop in production and value in 2016
compared to 2015. The decline in volume produced may have been attributed to by the reduced rainfall
in 2016.
Table 19: Performance of Carrots in selected counties for the years 2015-2016
County YEAR 2015 YEAR 2016 % of Total Value
Area (Ha) Volume (MT)
Total Value Area (Ha)
Volume (MT)
Value ( KES)
Nyeri 1,547 26,943 568,591,000 1,551 26,980 568,768,000 29.5
Kiambu 846 19,635 334,337,360 844 19,238 384,984,000 19.9
Nakuru 1,778 26,023 295,291,000 1,765 20,472 231,808,520 12.0
Nyandarua 1,400 17,461 191,507,038 1,456 18,188 227,910,238 11.8
Meru 935 9,436 233,570,000 1,150 10,973 125,432,640 6.5
Narok 171 2,699 61,312,000 366 5,085 118,512,000 6.1
Bungoma 108 1,724 62,920,000 96 2,260 78,560,240 4.1
Kisii 114 1,774 44,609,000 105 1,633 47,290,000 2.4
Bomet 63 676 32,075,000 57 650 28,510,000 1.5
Trans Nzoia 57 516 10,600,004 74 602 18,700,000 1.0
Nandi 23 285 10,600,000 34 381 16,480,000 0.9
Kirinyaga 34 492 13,340,000 36 592 13,740,000 0.7
Elgeyo Marakwet 53 937 11,467,717 50 998 10,939,039 0.6
Kajiado 70 874 8,766,250 81 899 9,155,750 0.5
Laikipia 30 263 8,116,894 22 213 7,141,893 0.4
Others 194 2,277 54,851,938 177 1,744 42,296,872 2.2
TOTAL 7,423 112,015 1,941,955,201 7,864 110,908 1,930,229,192 100.0

16
2.2.7 French beans (Phaseolus sp.) French beans are grown mainly for the export market where they are exported either as fresh or
canned. However, the consumption of French beans locally has increased thus a rise in demand at the
domestic markets. The area under French beans production increased from 5,671Ha in 2015 to 5,983Ha
in 2016 which was 6 percent increase compared to 2015. French beans production increased from
34,779 tons to 41,789 tons while the value increased from Ksh1.38Bilion to Ksh1.81Bilion representing
20 percent and 31 percent increase from 2015. The leading counties were Kirinyaga, Machakos and
Murang’a that accounted for 32, 20.7 and 13.5 percent respectively of the countries value in 2016. The
main challenges in French beans production are bean rust and aphids.
Table 20: Performance of French Beans in selected counties for the years 2015-2016
County Year 2015 Year 2016 % of Total Value
Area (Ha)
Volume ( MT )
Value (KES) Area (Ha)
Volume (MT
Value ( KES)
Kirinyaga 1,744 9,310 455,552,857 2,712 11,804 580,750,000 32.0
Machakos 1,639 5,310 186,598,000 1,700 6,495 374,950,000 20.7
Murang'a 823 6,400 223,715,688 882 7,008 243,944,350 13.5
Meru 446 4,157 147,917,100 567 5,323 179,294,000 9.9
Narok 240 1,695 101,500,000 245 1,795 108,000,000 6.0
Makueni 126 750 37,555,000 126 1,500 75,055,000 4.1
Nakuru 103 944 27,895,000 218 1,428 52,640,014 2.9
Taita Taveta 60 1,280 45,810,000 53 1,075 38,197,500 2.1
Kiambu 120 1,747 34,933,333 120 1,747 34,933,333 1.9
Laikipia 42 645 24,100,000 39 645 31,300,000 1.7
Embu 67 644 21,120,000 74 644 19,920,000 1.1
Nandi 22 200 8,000,000 44 400 16,000,000 0.9
Nyeri 41 285 14,173,800 42 286 14,181,300 0.8
Trans Nzoia 64 314 14,300,000 70 340 13,600,000 0.8
Kajiado 19 216 9,950,000 27 236 11,350,500 0.6
Others 135 882 29,088,693 105 1,020 19,032,954 1.0
TOTAL 5,691 34,779 1,382,209,471 5,983 41,785 1,813,148,952 100.0
2.2.8 Spinach (Spinacia oleracea) During the period under review the area under spinach production and volume increased from 4,996ha
to 5,615ha and production increased from 72,124tons to 75,563tons which was a 12 and 5 percent
increase respectively. Despite 5 percent marginal growth in production the value increased from
Ksh1.06bilion in 2015 to Ksh1.54bilion in 2016 representing 11 percent growth. This increase was
attributed to by the high demand for the spinach although it is highly susceptible to rust and has a low

17
shelf life compared to the other leafy vegetables. Kiambu and Nakuru Counties were leading in value at
23percent and 14percent of the country’s total value in 2016.
Table 21: Performance of Spinach in selected counties for the years 2015-2016
County YEAR 2015 YEAR 2016 % of Total Value
Area (Ha)
Volume ( MT )
Value (KES) Area (Ha)
Volume (MT
Value ( KES)
Kiambu 966 22,447 314,334,780 794 17,738 268,808,000 23.3
Nakuru 283 3,127 30,215,000 695 11,118 160,154,759 13.9
Nyandarua 872 13,910 111,871,020 751 9,302 86,051,020 7.5
Narok 188 1,510 20,953,640 907 7,289 78,553,644 6.8
Taita Taveta 91 3,765 92,050,000 102 3,021 71,775,000 6.2
Meru 579 4,948 100,725,011 177 3,328 67,775,012 5.9
Laikipia 145 3,824 91,305,363 141 3,817 57,015,222 4.9
Murang’a 187 2,195 36,169,000 193 2,149 39,938,650 3.5
Nyeri 205 2,683 33,161,800 214 2,805 35,176,100 3.0
Machakos 203 1,581 5,121,800 176 862 31,977,800 2.8
Elgeyo Marakwet 120 1,464 29,135,600 108 1,355 28,099,899 2.4
Kajiado 265 3,340 28,510,750 285 3,667 27,090,000 2.3
Nairobi 41 546 13,931,986 76 803 22,915,000 2.0
Makueni 70 304 15,800,000 46 410 20,017,920 1.7
Trans Nzoia 43 406 4,520,002 51 432 5,680,000 0.5
Others 739 6,075 128,463,476 899 7,469 153,688,684 13.3
TOTAL 4,996 72,124 1,056,269,227 5,615 75,563 1,154,716,710 100.0
2.2.9 Snow peas (Pisum sativum var. saccharatum) Snow peas are mainly grown for the export market with only a very small quantity being consumed
locally. The value of snow peas produced in 2016 increased by 5 percent from Ksh 562 Million in 2015 to
Ksh 590 Million. Meru and Nyandarua Counties were leading and contributed to 64 percent of the total
value in 2016. The main challenges in snow peas are Powderly mildew disease and leaf miner pest.
Table 22: Performance of Snow Peas in selected counties for the years 2015-2016
County YEAR 2015 YEAR 2016 % of Total
Value Area (Ha) Volume
( MT ) Value (KES) Area
(Ha) Volume (MT
Value ( KES)
Meru 792 4,623 204,574,000 755 4,594 205,020,000 34.73
Nyandarua 386 1,959 150,322,813 452 2,355 170,122,813 28.82
Nyeri 274 2,064 123,398,000 275 2,066 123,421,000 20.91
Laikipia 32 555 19,435,000 29 476 36,474,000 6.18

18
Narok 55 275 16,500,000 55 275 17,000,000 2.88
Kiambu 12 240 14,400,000 13 220 11,970,000 2.03
Trans Nzoia 31 150 7,440,000 50 206 11,760,000 1.99
Taita Taveta 17 296 12,800,000 14 252 11,200,000 1.90
Kajiado 2 10 980,000 4 25 1,450,000 0.25
Elgeyo Marakwet 10 10 600,000 10 10 600,000 0.10
Murang’a 37 212 10,838,400 4 6 480,000 0.08
Nakuru 5 12 695,000 3 7 460,000 0.08
Bungoma 10 7 420,000 5 8 320,000 0.05
TOTAL 1,663 10,413 562,403,213 1,669 10,500 590,277,813 100.0
2.2.10 Butter nut (Curcubita moschata) Butter nut is grown for both domestic and export markets. It is a potential food security crop due its
long shelf life. The area under the crop, volume produced and value all decreased in 2016 by 22, 43 and
49 percent respectively compared to 2015. The decline in production may have been attributed by the
reduced rainfall in 2016. Meru, Homabay and Kirinyaga Counties are the leading producers accounting
for 20.9, 15.6 and 10.1 percent of the country’s total value in 2016. The major challenge in butter nut
production is melon fly.
Table 23: Performance of Butter nut in selected counties for the years 2015-2016
County
Year 2015 Year 2016 % of Total Value
Area (Ha)
Volume ( MT )
Value (KES) Area (Ha)
Volume (MT
Value ( KES)
Meru 172 2,757 50,280,720 144 2,581 52,570,800 20.9
Homa Bay 418 2,795 53,876,274 276 2,004 39,305,029 15.6
Kirinyaga 123 1,850 22,350,000 153 1,990 25,412,500 10.1
Siaya 35 561 27,060,000 31 480 24,000,000 9.5
Elgeyo Marakwet 44 755 29,703,824 25 431 20,485,424 8.1
Trans Nzoia 16 119 2,200,001 23 193 18,156,000 7.2
Tharaka Nithi 26 309 11,270,000 26 320 11,110,000 4.4
Murang’a 33 228 8,533,152 26 213 9,854,400 3.9
Bungoma 17 230 8,620,000 15 230 9,370,000 3.7
Laikipia 17 289 8,550,000 16 271 8,492,000 3.4
Narok 16 208 4,400,000 14 168 5,280,000 2.1
Kwale 10 150 6,000,000 13 130 5,200,000 2.1
Bomet 37 240 8,400,000 45 272 4,614,500 1.8
Kiambu 36 162 4,365,000 33 113 3,612,000 1.4
Machakos 9 47 2,390,000 7 55 3,270,000 1.3
Others 180 750 244,943,000 77 695 10,740,019 4.3
Total 1,188 11,450 492,941,971 924 10,146 251,472,671 100.0

19
2.2.11 Courgette (Cucurbita pepo) Courgettes are consumed in small quantities in the domestic market with majority of the quantities
going to the export market in mixed pre-packs. During the year under review, the area under production
decreased by 1percent but the volume decreased from 4,613tons to 4,046tons representing 12 percent
drop. The depressed production was attributed to prevelance of melon fly and prolonged drought.
The value decreased from Ksh 187million to Ksh 151million a 19 percent decrease. The leading county
was Kiambu accounting for 51.5percent followed by Meru and Nakuru that accounted for 11.3 and
10.1percent respectively of the country’s total value.
Table 24: Performance of Courgette in selected counties for the years 2015-2016
County
Year 2015 Year 2016 % of Total Value
Area (Ha)
Volume ( MT )
Value (KES) Area (Ha)
Volume (MT
Value ( KES)
Kiambu 272 2,200 116,981,400 252 1,593 77,911,000 51.3
Meru 81 423 15,396,494 90 470 17,107,216 11.3
Nakuru 45 360 12,960,000 43 316 15,360,000 10.1
Murang’a 70 281 7,636,024 65 302 10,927,850 7.2
Kirinyaga 19 300 8,520,000 22 332 9,560,000 6.3
Taita Taveta 27 512 12,824,000 27 497 7,012,500 4.6
Laikipia 8 62 1,876,174 9 116 4,805,100 3.2
Kajiado 44 204 4,340,450 50 226 4,692,000 3.1
Nairobi 5 61 2,109,334 7 76 2,425,944 1.6
Machakos 35 198 4,685,000 34 106 1,867,450 1.2
Nyeri 3 11 208,200 3 11 210,800 0.1
Bungoma 1 3 120,000 1 4 120,000 0.1
TOTAL 610 4,613 187,657,076 603 4,046 151,999,860 100.0
2.2.12 Snap peas (Pisum sativum var. macrocarpon) Snap pea or sugar snap is mainly grown for the export market with only small volumes going to the
domestic market. During the year under review the area under Snap peas production increased from
376ha to 385ha and value from Ksh137milion to Ksh139million representing 2 and 1 percent increase
compared to 2015. The leading county was Nyeri which accounted for 63.9 percent of the country’s
total value. The main challenges in the production of snap peas are Powderly mildew and leaf miner.
Table 25: Performance of Snap peas in selected counties for the years 2015-2016
County
Year 2015 Year 2016 % of Total
Value Area (Ha) Volume
( MT ) Value (KES) Area
(Ha) Volume
(MT Value ( KES)
Nyeri 224 1,788 89,412,700 227 1,787 89,397,300 63.9
Nakuru 53 318 15,900,000 58 310 15,900,000 11.4

20
Narok 32 170 11,000,000 30 160 10,000,000 7.2
Laikipia 16 120 5,656,960 20 170 9,800,000 7.0
Nyandarua 20 120 6,000,000 24 115 6,000,000 4.3
Meru 6 64 3,814,000 8 58 3,840,000 2.7
Elgeyo Marakwet 12 60 3,000,000 11 65 3,000,000 2.1
Trans Nzoia 12 72 2,880,000 6 40 1,700,000 1.2
Murang’a 1 3.5 160,000 1 3 160,000 0.1
TOTAL 376 2,716 137,823,660 385 2,708 139,797,300 100.0
2.2.13 Baby corn (Zea mays var. scarni) Baby corn is grown mainly for the export market. It is used in the preparation of vegetable prepacks
where it is mixed with other vegetables. During the year under review, the area under baby corn
production increased by 27 percent from 3,606Ha in 2015 to 3,457Ha in 2016. However, the volume and
value decreased by 4 and 11 percent in 2016 compared to 2015.
Table 26: Performance of Baby Corn in selected counties for the years 2015-2016
County
Year 2015 Year 2016 % of Total Value
Area (Ha)
Volume ( MT )
Value (KES) Area (Ha)
Volume (MT
Value ( KES)
Makueni 142 1,280 29,200,000 140 1,274 27,775,204 34.0
Laikipia 57 930 30,800,000 57 860 23,050,000 28.3
Kirinyaga 108 815 14,810,000 212 858 17,280,000 21.2
Meru 35 312 9,795,960 39 353 11,084,400 13.6
Kiambu 16 232 5,568,000 4 60 1,320,000 1.6
Kajiado 8 37 1,048,000 10 42 858,000 1.1
Murang'a 1 6 140,000 2 10 220,000 0.3
Total 367 3,612 91,361,960 464 3,457 81,587,604 100.0
2.2.14 Lettuce (Lactuca sativa) The area under lettuce production decreased from 108ha in 2015 to 105ha in 2016. However, the
volume and value increased by 1 and 6 percent respectively in 2016 compared to 2015. The leading
counties were Taita taveta and Kiambu accounting for 42 and 21 percent of the total value.
Table 27: Performance of Lettuce in selected counties for the years 2015-2016
County
Year 2015 Year 2016 % of
Area (Ha)
Volume (MT)
Value (KES) Area (Ha)
Volume (MT)
Value ( KES) Total Value
Taita Taveta 22 726 18,700,000 20 728 18,500,000 42
Kiambu 42 420 11,814,400 32 280 9,389,000 21

21
Nairobi 3 47 3,180,000 10 170 8,040,000 18
Kisumu 35 375 7,500,000 35 375 7,500,000 17
Nakuru 4 20 290,000 6 24 327,800 0.7
Nyeri 2 4.5 65,250 2 6.5 105,890 0.2
Total 108 1,593 41,549,650 105 1,584 43,862,690 100.0
2.2.15 Broccoli (Brassica oleraceae var. italica) Broccoli is produced for the upscale markets in the urban centers and hotels as well as for export.
During the year under review the area under broccoli production increased from 63ha to 84ha while
production increased from 757tons to 874 tons and value increased from Kshs 29.7 million to Kshs
34.3million a 33, 15 and 15 percent increase respectively. The demand for Broccoli is increasing due to
its high nutrition value and medicinal attributes.
Table 28: Performance of Broccoli in selected counties for the years 2015-2016
County
Year 2015 Year 2016 % of Total Value
Area (Ha)
Volume ( MT )
Value (KES) Area (Ha)
Volume (MT
Value ( KES)
Kiambu 41 492 15,248,000 58 585 14,736,000 43
Nairobi 2 42 2,220,000 5 117 8,220,000 24
Laikipia 8 160 9,600,000 10 105 7,875,000 23
Nyandarua 3 35 1,750,000 3 25 2,000,000 6
Murang’a 6 11 440,000 5 25 1,000,000 3
Nakuru 4 17 510,000 4 17 510,000 1
TOTAL 63 757 29,768,000 84 874 34,341,000 100
2.2.16 Cauliflower (Brassica oleracea var. botrytis) During the year under review the area under production increased from 62ha in 2015 to 66ha and value
from Kshs29.2million to Kshs30.5 million. However the volume declined by 0.4 percent from 945tons in
2015 to 941tons in 2016. The area under production and value in 2016 increased by 7 and 4 percent
respectively compared to 2015. Kiambu, Nairobi and Taita Taveta were the leading counties in value in
2016 at 48, 27 and 20 percent of the total value.
Table 29: Performance of Cauliflower in selected counties for the years 2015-2016
County
Year 2015 Year 2016 % of Total Value
Area (Ha)
Volume ( MT )
Value (KES) Area (Ha)
Volume (MT
Value ( KES)
Kiambu 45 578 20,087,500 45 472 14,720,000 48.2
Nairobi 2 4 1,820,000 6 109 8,220,000 26.9
Taita Taveta 9 333 6,660,000 9 312 6,190,000 20.2
Nyandarua 2 20 480,000 2 30 750,750 2.5
22
Murang’a 3 5 100,000 3 15 600,000 2.0
Nakuru 2 5 125,000 2 4 90,000 0.3
TOTAL 62 945 29,272,500 66 941 30,570,750 100
2.2.17 Runner beans (Phaseolus coccineus) During the year under review, volume declined by 13 percent from 459 tons to 398 tons and value of
runner beans decreased by 7 percent from Kshs12.56million to Kshs11.63 million compared to the
previous year. The leading counties in production of runner beans were Nyandarua and Nakuru counties
accounting for 97 percent of the total value.
Table 30: Performance of Runner Beans in selected counties for the years 2015-2016
County
Year 2015 Year 2016 % of Total Value
Area (Ha)
Volume ( MT )
Value (KES) Area (Ha)
Volume (MT
Value ( KES)
Nyandarua 213 208 6,272,000 214 208 6,302,000 54.2
Nakuru 30 240 6,000,000 30 180 5,040,000 43.3
Elgeyo Marakwet 2 6 176,400 2 5 150,000 1.3
Nairobi 1 3 67,345 1 3 77,784 0.7
Bungoma 2 2 44,000 1 2 60,000 0.5
TOTAL 248 459 12,559,745 248 398 11,629,784 100.0
2.2.18 Beetroot (Beta vulgaris) During the year under review, the area under production, volume and value decreased from 87ha to
75ha, 631tons to 518tons and Kshs22.47milion to Kshs20.56miliom representing 14, 18 and 9 percent
decline respectively compared to the previous year. The leading county by value was Kiambu accounting
for 49.4percent of the country’s value.
Table 31: Performance of Beetroots in selected counties for the years 2015-2016
County
Year 2015 Year 2016 % of Total Value
Area (Ha)
Volume ( MT )
Value (KES) Area (Ha)
Volume (MT
Value ( KES)
KIAMBU 30 360 14,400,000 26 244 10,160,000 49.4
NYERI 30 90 2,211,700 30 90 2,349,800 11.4
Meru 2 51 1,530,000 2 60 1,800,000 8.8
KISII 1 4 80,000 2 31 1,700,000 8.3
ELGEYO MARAKWET
1 3 270,000 1 17 1,670,000 8.1
NAKURU 19 93 2,686,000 9 45 1,578,500 7.7
KERICHO 2 12 660,000 2 12 660,000 3.2
NYANDARUA 1 10 235,000 1 10 250,000 1.2
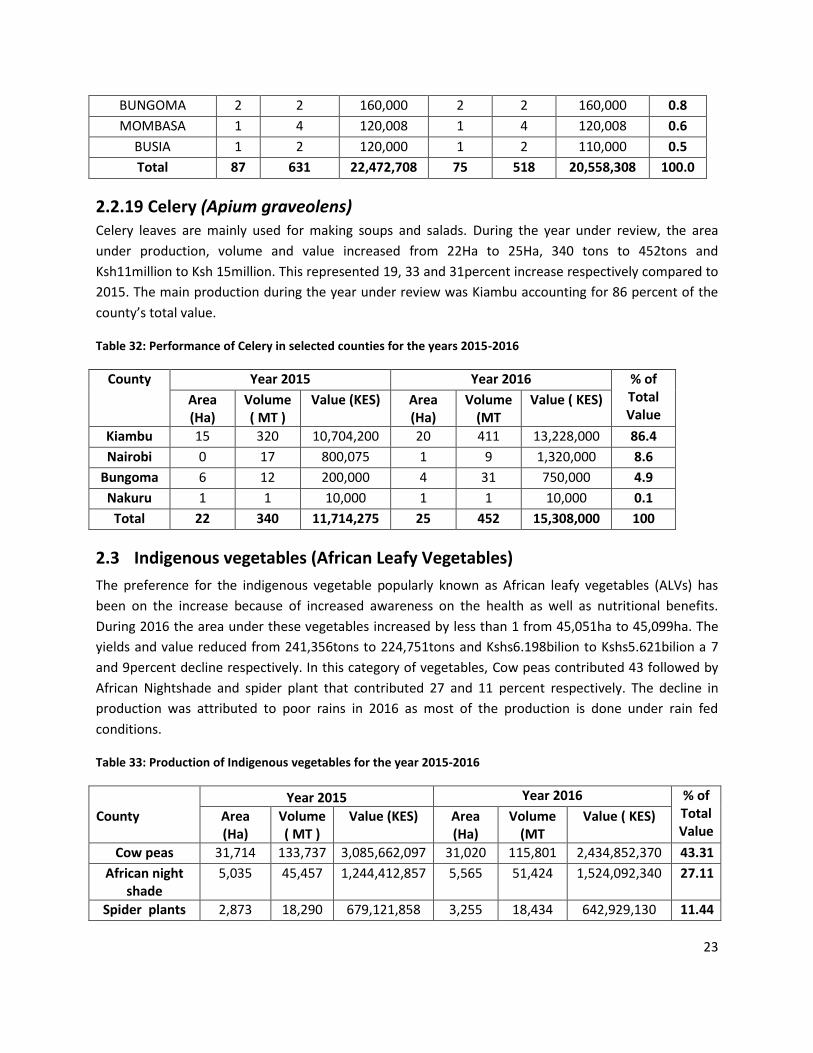
23
BUNGOMA 2 2 160,000 2 2 160,000 0.8
MOMBASA 1 4 120,008 1 4 120,008 0.6
BUSIA 1 2 120,000 1 2 110,000 0.5
Total 87 631 22,472,708 75 518 20,558,308 100.0
2.2.19 Celery (Apium graveolens) Celery leaves are mainly used for making soups and salads. During the year under review, the area
under production, volume and value increased from 22Ha to 25Ha, 340 tons to 452tons and
Ksh11million to Ksh 15million. This represented 19, 33 and 31percent increase respectively compared to
2015. The main production during the year under review was Kiambu accounting for 86 percent of the
county’s total value.
Table 32: Performance of Celery in selected counties for the years 2015-2016
County
Year 2015 Year 2016 % of Total Value
Area (Ha)
Volume ( MT )
Value (KES) Area (Ha)
Volume (MT
Value ( KES)
Kiambu 15 320 10,704,200 20 411 13,228,000 86.4
Nairobi 0 17 800,075 1 9 1,320,000 8.6
Bungoma 6 12 200,000 4 31 750,000 4.9
Nakuru 1 1 10,000 1 1 10,000 0.1
Total 22 340 11,714,275 25 452 15,308,000 100
2.3 Indigenous vegetables (African Leafy Vegetables)
The preference for the indigenous vegetable popularly known as African leafy vegetables (ALVs) has
been on the increase because of increased awareness on the health as well as nutritional benefits.
During 2016 the area under these vegetables increased by less than 1 from 45,051ha to 45,099ha. The
yields and value reduced from 241,356tons to 224,751tons and Kshs6.198bilion to Kshs5.621bilion a 7
and 9percent decline respectively. In this category of vegetables, Cow peas contributed 43 followed by
African Nightshade and spider plant that contributed 27 and 11 percent respectively. The decline in
production was attributed to poor rains in 2016 as most of the production is done under rain fed
conditions.
Table 33: Production of Indigenous vegetables for the year 2015-2016
County
Year 2015 Year 2016 % of Total Value
Area (Ha)
Volume ( MT )
Value (KES) Area (Ha)
Volume (MT
Value ( KES)
Cow peas 31,714 133,737 3,085,662,097 31,020 115,801 2,434,852,370 43.31
African night shade
5,035 45,457 1,244,412,857 5,565 51,424 1,524,092,340 27.11
Spider plants 2,873 18,290 679,121,858 3,255 18,434 642,929,130 11.44

24
Pumpkin fruit 866 15,312 466,999,500 1,018 14,430 410,236,763 7.30
Leaf Amarathus 1,346 11,640 328,964,772 1,518 12,544 307,124,947 5.46
Slender 879 6,532 192,450,432 514 2,218 88,111,165 1.57
Pumpkin leaves 599 3,580 75,864,740 681 4,017 75,938,620 1.35
Jute mallow 544 1,604 50,482,093 599 1,892 68,351,270 1.22
Grain amaranth 273 534 33,259,536 289 588 38,280,798 0.68
Vine spine 148 1,099 30,928,000 162 1,147 23,150,005 0.41
Stinging neetle 724 3,177 5,865,990 426 1,954 4,807,400 0.09
Malabor 48 269 2,893,880 50 236 3,015,080 0.05
Russian 2 125 1,227,000 2 65 625,000 0.01
Total 45,051 241,356 6,198,132,755 45,099 224,751 5,621,514,888 100.0
2.3.1 Cowpeas (Vigna unguiculata) Cowpeas are grown mainly for the domestic market. In 2016, cow peas contributed to 43 percent of the
total value of African vegetables produced. During the year under review, the area under cow peas was
31,020Ha producing 115,801tons valued at Ksh 2.4Billion. This represented a decrease in area, volume
and value by 2, 13 and 21 percent respectively compared to 2015. The decline in volume may have been
attributed by the depressed rains in 2016.
Table 34: Performance of Cowpeas in selected counties for the years 2015-2016
County Year 2015 Year 2016 % of Total Value
Area (Ha)
Volume (MT)
Value (KES) Area (Ha)
Volume (MT)
Value (KES)
Makueni 6,850 52,355 867,482,000 6,770 42,076 841,520,000 34.6
Kitui 3,600 14,700 288,120,000 2,520 12,520 231,620,000 9.5
Kwale 4,337 18,845 397,555,000 4,130 13,612 209,264,800 8.6
Machakos 3,629 8,280 170,700,000 3,945 9,642 201,481,200 8.3
Kilifi 4,648 9,186 489,330,000 6,030 9,355 180,856,750 7.4
Homa Bay 639 2,442 81,397,000 927 3,613 119,375,600 4.9
Busia 808 2,298 88,825,001 883 2,380 89,775,001 3.7
Siaya 2,800 7,925 236,407,750 1,291 3,205 73,150,000 3.0
Kisii 458 1,854 66,375,000 504 2,190 58,093,800 2.4
Taita Taveta 549 4,037 69,965,000 580 4,133 56,620,000 2.3
Kakamega 937 2,983 58,969,000 890 2,210 49,253,000 2.0
Vihiga 280 847 29,300,220 364 1,198 42,060,000 1.7
Mombasa 58 1,130 22,600,000 106 1,580 35,601,200 1.5
Meru 502 522 25,642,624 628 675 31,627,360 1.3
Nyamira 163 1,077 25,032,800 256 1,641 29,695,814 1.2
Other 1,457 5,258 167,960,702 1,197 5,772 184,857,845 7.6
Total 31,714 133,737 3,085,662,097 31,020 115,801 2,434,852,370 100.0

25
2.3.2 African Nightshade (Solanum nigrum complexes) African Nightshade is a popular vegetable in Kenya and was the second most important African
vegetable in 2016 contributing to 27 percent of the total value. During the year under review, the area
under production was 5,565Ha producing 51,424tons valued at Ksh 1.5Billion. This represented an
increase in area, volume and value by 11, 13 and 22 percent respectively compared to the previous year.
Kisii and Nyamira Counties led in value contributing to 28 and 16 percent of the total value in 2016.
Table 35: Performance of African Nightshade in selected counties for the years 2015-2016
County Year 2015 Year 2016 % of Total Value
Area (Ha)
Volume ( MT )
Value (KES) Area (Ha)
Volume (MT)
Value ( KES)
Kisii 1,026 9,342 354,917,000 1,094 10,293 420,469,000 28.2
Nyamira 848 12,110 181,650,000 1,052 13,984 243,029,038 16.3
Narok 265 4,925 134,848,000 264 4,885 179,998,000 12.1
Other 677 5,314 159,749,725 739 4,595 130,244,375 8.7
Kisumu 101 1,175 37,600,000 162 2,983 107,262,500 7.2
Trans Nzoia 97 1,056 12,500,001 171 2,381 69,635,000 4.7
Nyandarua 373 4,476 71,616,000 242 2,420 48,400,000 3.3
Homa Bay 404 1,101 37,607,000 454 1,315 45,007,200 3.0
Kiambu 89 1,538 38,981,365 99 1,626 41,625,000 2.8
Kakamega 460 1,428 56,840,000 489 1,195 39,010,000 2.6
Vihiga 40 295 17,600,000 50 581 34,950,000 2.3
Bungoma 358 663 21,348,000 315 1,378 34,188,000 2.3
Taita Taveta 23 361 8,863,000 95 1,413 31,302,500 2.1
Migori 132 556 23,385,748 152 578 25,571,700 1.7
Nakuru 58 602 12,427,000 77 1,135 23,050,009 1.5
Busia 85 515 7,448,001 110 664 15,035,001 1.0
Total 5,036 45,457 1,177,380,840 5,565 51,426 1,488,777,323 100.0
2.3.3 Spider plant (Cleome gynandra) Spider plant is locally known as “Sagaa” and is grown for the domestic market. During the year under
review, the area under production was 3,255Ha producing 18,434tons valued at Ksh 643Million.This
represented an increase of area and volume by 13 and 1 percent compared to the previous year.
However, the value declined by 5 percent from Ksh 679Million in 2015 to Ksh 643Million in 2015. The
leading counties were Nyamira, Kisii, Narok and Kisumu which accounted for 29, 21, 8 and 7 percent of
the total value.
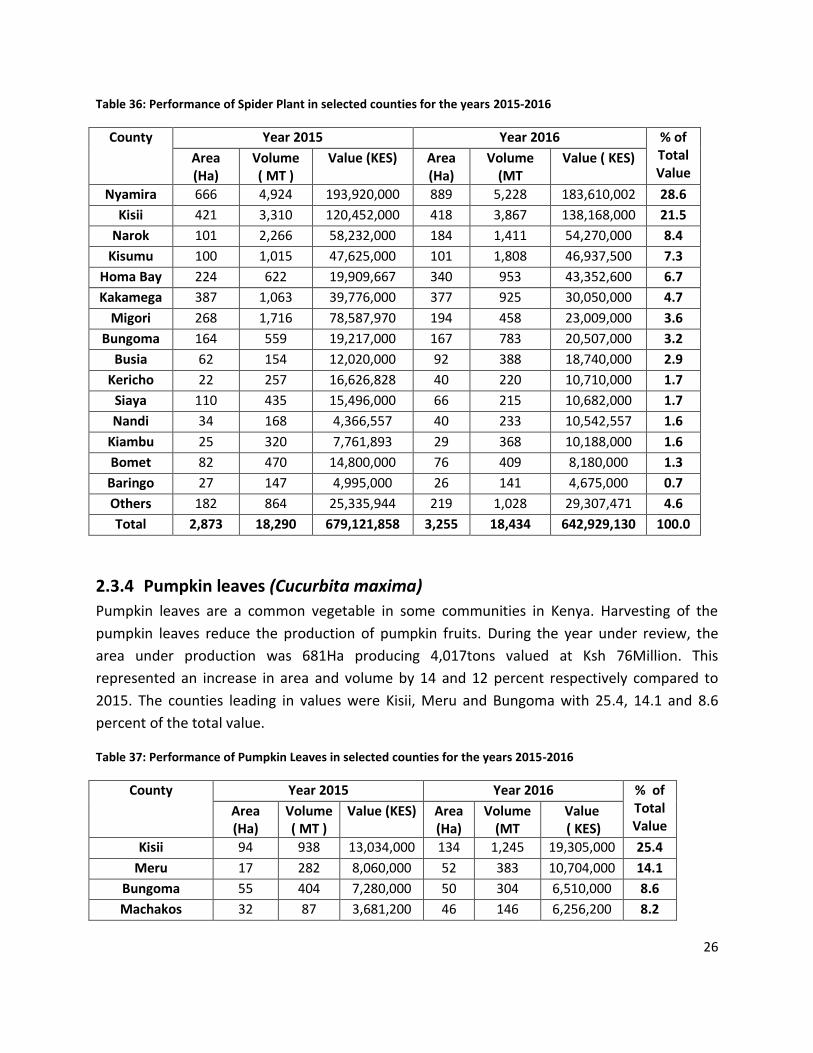
26
Table 36: Performance of Spider Plant in selected counties for the years 2015-2016
County Year 2015 Year 2016 % of Total Value
Area (Ha)
Volume ( MT )
Value (KES) Area (Ha)
Volume (MT
Value ( KES)
Nyamira 666 4,924 193,920,000 889 5,228 183,610,002 28.6
Kisii 421 3,310 120,452,000 418 3,867 138,168,000 21.5
Narok 101 2,266 58,232,000 184 1,411 54,270,000 8.4
Kisumu 100 1,015 47,625,000 101 1,808 46,937,500 7.3
Homa Bay 224 622 19,909,667 340 953 43,352,600 6.7
Kakamega 387 1,063 39,776,000 377 925 30,050,000 4.7
Migori 268 1,716 78,587,970 194 458 23,009,000 3.6
Bungoma 164 559 19,217,000 167 783 20,507,000 3.2
Busia 62 154 12,020,000 92 388 18,740,000 2.9
Kericho 22 257 16,626,828 40 220 10,710,000 1.7
Siaya 110 435 15,496,000 66 215 10,682,000 1.7
Nandi 34 168 4,366,557 40 233 10,542,557 1.6
Kiambu 25 320 7,761,893 29 368 10,188,000 1.6
Bomet 82 470 14,800,000 76 409 8,180,000 1.3
Baringo 27 147 4,995,000 26 141 4,675,000 0.7
Others 182 864 25,335,944 219 1,028 29,307,471 4.6
Total 2,873 18,290 679,121,858 3,255 18,434 642,929,130 100.0
2.3.4 Pumpkin leaves (Cucurbita maxima)
Pumpkin leaves are a common vegetable in some communities in Kenya. Harvesting of the
pumpkin leaves reduce the production of pumpkin fruits. During the year under review, the
area under production was 681Ha producing 4,017tons valued at Ksh 76Million. This
represented an increase in area and volume by 14 and 12 percent respectively compared to
2015. The counties leading in values were Kisii, Meru and Bungoma with 25.4, 14.1 and 8.6
percent of the total value.
Table 37: Performance of Pumpkin Leaves in selected counties for the years 2015-2016
County Year 2015 Year 2016 % of Total Value
Area (Ha)
Volume ( MT )
Value (KES) Area (Ha)
Volume (MT
Value ( KES)
Kisii 94 938 13,034,000 134 1,245 19,305,000 25.4
Meru 17 282 8,060,000 52 383 10,704,000 14.1
Bungoma 55 404 7,280,000 50 304 6,510,000 8.6
Machakos 32 87 3,681,200 46 146 6,256,200 8.2

27
Kakamega 69 326 8,782,500 76 258 6,250,500 8.2
Kisumu 20 135 5,620,000 20 615 5,620,000 7.4
Nyamira 33 216 3,087,500 21 235 3,377,500 4.4
Elgeyo Marakwet 28 123 3,525,000 29 116 3,315,000 4.4
Vihiga 18 54 2,510,000 25 75 2,404,000 3.2
Nandi 21 52 1,260,000 22 112 2,360,000 3.1
Busia 18 126 2,545,000 22 104 1,995,000 2.6
Siaya 40 48 2,400,000 30 30 1,500,000 2.0
West Pokot 45 66 1,320,000 45 66 1,320,000 1.7
Homa Bay 26 45 1,257,600 25 50 1,264,000 1.7
Kwale 27 216 2,160,000 9 72 720,000 0.9
Others 98 464 9,341,940 75 208 3,037,420 4.0
Total 639 3,580 75,864,740 681 4,017 75,938,620 100.0
2.3.5 Leaf Amaranth (Amaranthus Sp.) Leaf Amaranth also known as African Spinach and is produced mainly for the domestic market across
most counties. It is consumed in combination with other leafy vegetables and is rich in iron. During the
year under review, the area under production was 1,518Ha producing 12,544tons valued at Ksh
307.1Million. This represented an increase in area and volume by 13 and 8 percent respectively but the
value decreased by 7 percent compared to 2015.
Table 38: Performance of Leaf Amaranth in selected counties for the years 2015-2016
County Year 2015 Year 2016 % of Total Value
Area (Ha)
Volume ( MT )
Value (KES) Area (Ha)
Volume (MT
Value ( KES)
Kisii 261 2,882 58,590,970 280 3,290 67,774,000 22.1
Vihiga 44 440 9,065,000 62 685 32,670,000 10.7
Kiambu 130 1,179 23,850,500 110 1,257 29,535,000 9.6
Mombasa 17 174 6,350,000 96 842 26,519,800 8.7
Kilifi 161 2,037 17,393,087 218 1,534 23,990,057 7.8
Kwale 102 1,264 28,220,000 85 1,050 23,000,000 7.5
Taita Taveta 11 205 4,968,000 22 400 13,980,000 4.6
Nyamira 77 301 7,242,500 72 511 12,720,000 4.2
Homa Bay 43 159 3,968,250 124 459 11,471,850 3.7
Busia 72 212 7,280,015 82 287 10,580,015 3.5
Bomet 78 516 5,947,200 69 476 6,987,200 2.3
Nairobi 11 155 5,524,000 15 201 6,982,000 2.3
Machakos 7 75 2,625,000 23 146 4,840,000 1.6
Bungoma 57 251 6,960,000 39 167 5,340,000 1.7
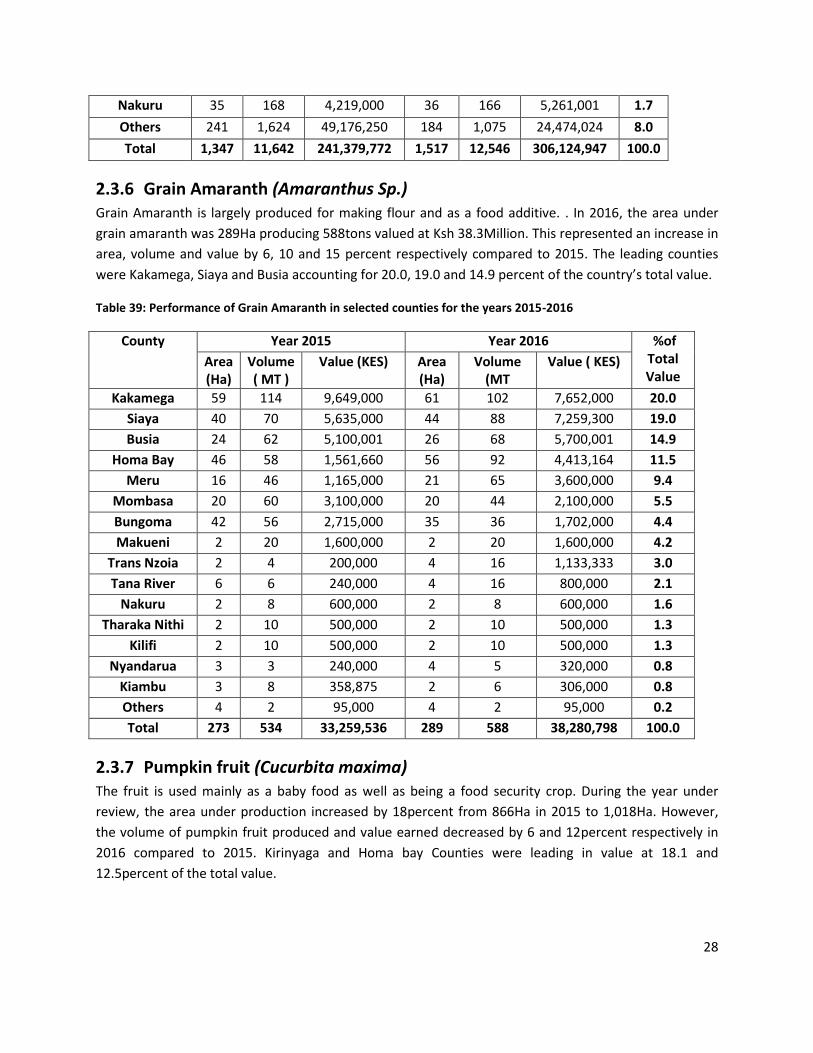
28
Nakuru 35 168 4,219,000 36 166 5,261,001 1.7
Others 241 1,624 49,176,250 184 1,075 24,474,024 8.0
Total 1,347 11,642 241,379,772 1,517 12,546 306,124,947 100.0
2.3.6 Grain Amaranth (Amaranthus Sp.) Grain Amaranth is largely produced for making flour and as a food additive. . In 2016, the area under
grain amaranth was 289Ha producing 588tons valued at Ksh 38.3Million. This represented an increase in
area, volume and value by 6, 10 and 15 percent respectively compared to 2015. The leading counties
were Kakamega, Siaya and Busia accounting for 20.0, 19.0 and 14.9 percent of the country’s total value.
Table 39: Performance of Grain Amaranth in selected counties for the years 2015-2016
County Year 2015 Year 2016 %of Total Value
Area (Ha)
Volume ( MT )
Value (KES) Area (Ha)
Volume (MT
Value ( KES)
Kakamega 59 114 9,649,000 61 102 7,652,000 20.0
Siaya 40 70 5,635,000 44 88 7,259,300 19.0
Busia 24 62 5,100,001 26 68 5,700,001 14.9
Homa Bay 46 58 1,561,660 56 92 4,413,164 11.5
Meru 16 46 1,165,000 21 65 3,600,000 9.4
Mombasa 20 60 3,100,000 20 44 2,100,000 5.5
Bungoma 42 56 2,715,000 35 36 1,702,000 4.4
Makueni 2 20 1,600,000 2 20 1,600,000 4.2
Trans Nzoia 2 4 200,000 4 16 1,133,333 3.0
Tana River 6 6 240,000 4 16 800,000 2.1
Nakuru 2 8 600,000 2 8 600,000 1.6
Tharaka Nithi 2 10 500,000 2 10 500,000 1.3
Kilifi 2 10 500,000 2 10 500,000 1.3
Nyandarua 3 3 240,000 4 5 320,000 0.8
Kiambu 3 8 358,875 2 6 306,000 0.8
Others 4 2 95,000 4 2 95,000 0.2
Total 273 534 33,259,536 289 588 38,280,798 100.0
2.3.7 Pumpkin fruit (Cucurbita maxima) The fruit is used mainly as a baby food as well as being a food security crop. During the year under
review, the area under production increased by 18percent from 866Ha in 2015 to 1,018Ha. However,
the volume of pumpkin fruit produced and value earned decreased by 6 and 12percent respectively in
2016 compared to 2015. Kirinyaga and Homa bay Counties were leading in value at 18.1 and
12.5percent of the total value.

29
Table 40: Performance of Pumpkin Fruits in selected counties for the years 2015-2016
County Year 2015 Year 2016 % of Total Value
Area (Ha)
Volume ( MT )
Value (KES) Area (Ha)
Volume (MT
Value ( KES)
Kirinyaga 74 2,712 60,500,000 79 2,902 74,400,000 18.1
Homa Bay 147 1,398 44,992,890 183 1,698 51,303,450 12.5
Bomet 52 728 17,160,000 80 1,154 36,669,600 8.9
Kakamega 61 880 27,254,500 66 824 29,494,500 7.2
Bungoma 65 735 28,320,000 49 736 29,260,000 7.1
Kilifi 22 885 26,226,000 12 802 24,064,000 5.9
Murang’a 24 130 13,102,000 31 300 15,643,000 3.8
Kwale 32 1,433 42,975,000 14 500 15,000,000 3.7
Taita Taveta 16 380 8,298,000 20 474 14,677,000 3.6
Meru 17 436 10,980,000 51 997 14,607,500 3.6
Kericho 27 368 5,710,700 34 532 14,158,000 3.5
Nandi 21 192 5,640,000 22 220 9,800,000 2.4
Kisii 14 125 1,946,000 25 233 8,985,000 2.2
West Pokot 46 267 8,950,000 46 267 8,830,000 2.2
Tana River 29 238 6,800,000 27 251 8,060,000 2.0
Others 219 4,485 158,144,410 229 2,640 55,284,713 13.5
TOTAL 866 15,492 466,999,500 968 14,530 410,236,763 100.0
2.4 Aromatic Plants
Aromatics crops accounted for of the total value of horticultural products by value. The area under
production increased from 8,702Ha in 2015 to 9,387 due to good returns per unit weight while
production increased from 90,256tons to 94,491 representing 8 and 6 percent growth respectively. The
value increased form 3.2Bilion in 2015 to 3.34Billion in 2016 representing 3 percent increase. The
leading crops in this category were Bulb onions, spring onions and Coriander accounting for 58, 16 and
10 percent respectively.
Table 41: Summary of the performance of Aromatics for the years 2015-2016
Crops Year 2015 Year 2016 % of Total Value
Area (Ha)
Volume ( MT )
Value (KES) Area (Ha)
Volume (MT
Value ( KES)
Bulb onion 3,663 42,327 1,733,916,835 4,085 46,170 1,941,598,792 58.0
Spring onion 2,654 24,644 613,008,080 2,706 22,678 544,304,610 16.3
Coriander 691 8,778 317,019,441 727 8,948 320,748,279 9.6
Bell pepper 898 7,510 305,588,020 866 5,940 238,247,612 7.1
Leeks 112 1,539 100,225,100 113 1,451 97,391,878 2.9

30
Long cayenne 288 2,459 83,972,722 280 2,545 78,327,458 2.3
African Birds Eye
110 787 35,342,839 156 878 42,347,400 1.27
Bullet chillies 36 377 19,874,925 67 442 19,046,503 0.57
Chives 149 1,159 16,896,000 142 1,112 17,103,000 0.51
Celery 21 339 11,704,275 25 452 15,308,000 0.46
Garlic 8 58 8,250,000 18 99 12,260,000 0.37
Rosemary 37 99 4,968,200 48 174 6,639,400 0.20
Tumeric 10 63 1,332,002 7 181 5,450,002 0.16
Ginger 14 47 1,760,000 135 3,345 4,895,000 0.15
Parsley 8 47 2,187,000 8 49 2,397,000 0.07
Mint 4 24 1,400,000 6 27 1,369,000 0.04
Total 8,702 90,256 3,257,445,439 9,387 94,491 3,347,433,934 100.0
2.4.1 Bulb onion (Allium cepa L.) Bulb onion is mainly grown for the domestic market. The demand surpasses the local supply resulting to
the importation of bulb onion from the neighboring countries especially Tanzania. In 2016 the area
under production was 4,185Ha producing 47,170tons valued at Ksh 2Billion. This represented an
increase in area, volume and value by 12, 9 and 12 percent respectively compared to the previous year.
There is potential to increase production by expanding the area under irrigable agriculture and
enhancing appropriate pre and post-harvest handling practices to reduce the post-harvest losses.
Table 42: Performance of Bulb onions in selected counties for the years 2015-2016
County
Year 2015 Year 2016 % of Total Value
Area (Ha)
Volume ( MT )
Value (KES) Area (Ha)
Volume (MT
Value ( KES)
Taita Taveta 146 2,500 149,269,000 279 4,876 252,768,500 13.0
Bungoma 486 7,297 253,418,500 394 5,682 184,908,010 9.5
West Pokot 308 4,598 137,850,000 309 4,620 183,300,000 9.4
Meru 304 2,476 98,209,000 541 4,421 161,235,000 8.3
Lamu 136 2,573 157,320,000 138 2,368 136,800,000 7.0
Kajiado 165 2,260 120,620,000 177 2,415 128,276,500 6.6
Laikipia 146 1,468 62,878,000 182 2,808 116,523,606 6.0
Garissa 89 685 80,250,000 105 810 93,960,000 4.8
Homa Bay 356 1,582 66,436,800 436 2,232 90,583,540 4.7
Siaya 245 3,083 132,875,000 80 1,043 77,480,000 4.0
Kisii 147 1,606 56,717,000 146 1,611 58,070,000 3.0
Machakos 47 512 21,929,178 119 833 48,926,178 2.5
Trans Nzoia 122 1,348 30,050,004 194 2,618 48,902,000 2.5
Nyandarua 202 2,948 47,320,000 228 2,380 37,181,000 1.9
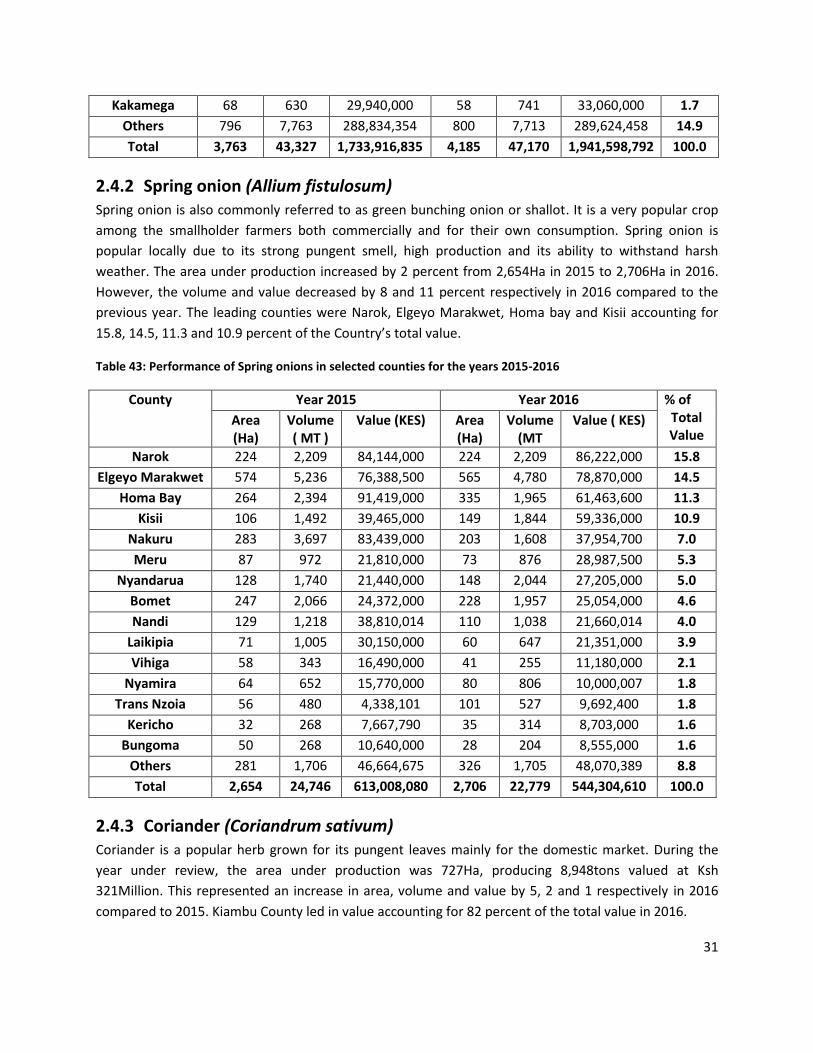
31
Kakamega 68 630 29,940,000 58 741 33,060,000 1.7
Others 796 7,763 288,834,354 800 7,713 289,624,458 14.9
Total 3,763 43,327 1,733,916,835 4,185 47,170 1,941,598,792 100.0
2.4.2 Spring onion (Allium fistulosum) Spring onion is also commonly referred to as green bunching onion or shallot. It is a very popular crop
among the smallholder farmers both commercially and for their own consumption. Spring onion is
popular locally due to its strong pungent smell, high production and its ability to withstand harsh
weather. The area under production increased by 2 percent from 2,654Ha in 2015 to 2,706Ha in 2016.
However, the volume and value decreased by 8 and 11 percent respectively in 2016 compared to the
previous year. The leading counties were Narok, Elgeyo Marakwet, Homa bay and Kisii accounting for
15.8, 14.5, 11.3 and 10.9 percent of the Country’s total value.
Table 43: Performance of Spring onions in selected counties for the years 2015-2016
County Year 2015 Year 2016 % of Total Value
Area (Ha)
Volume ( MT )
Value (KES) Area (Ha)
Volume (MT
Value ( KES)
Narok 224 2,209 84,144,000 224 2,209 86,222,000 15.8
Elgeyo Marakwet 574 5,236 76,388,500 565 4,780 78,870,000 14.5
Homa Bay 264 2,394 91,419,000 335 1,965 61,463,600 11.3
Kisii 106 1,492 39,465,000 149 1,844 59,336,000 10.9
Nakuru 283 3,697 83,439,000 203 1,608 37,954,700 7.0
Meru 87 972 21,810,000 73 876 28,987,500 5.3
Nyandarua 128 1,740 21,440,000 148 2,044 27,205,000 5.0
Bomet 247 2,066 24,372,000 228 1,957 25,054,000 4.6
Nandi 129 1,218 38,810,014 110 1,038 21,660,014 4.0
Laikipia 71 1,005 30,150,000 60 647 21,351,000 3.9
Vihiga 58 343 16,490,000 41 255 11,180,000 2.1
Nyamira 64 652 15,770,000 80 806 10,000,007 1.8
Trans Nzoia 56 480 4,338,101 101 527 9,692,400 1.8
Kericho 32 268 7,667,790 35 314 8,703,000 1.6
Bungoma 50 268 10,640,000 28 204 8,555,000 1.6
Others 281 1,706 46,664,675 326 1,705 48,070,389 8.8
Total 2,654 24,746 613,008,080 2,706 22,779 544,304,610 100.0
2.4.3 Coriander (Coriandrum sativum) Coriander is a popular herb grown for its pungent leaves mainly for the domestic market. During the
year under review, the area under production was 727Ha, producing 8,948tons valued at Ksh
321Million. This represented an increase in area, volume and value by 5, 2 and 1 respectively in 2016
compared to 2015. Kiambu County led in value accounting for 82 percent of the total value in 2016.

32
Table 44: Performance of Coriander in selected counties for the years 2015-2016
County
Year 2015 Year 2016 % of Total Value
Area (Ha)
Volume ( MT )
Value (KES) Area (Ha)
Volume (MT
Value ( KES)
Kiambu 480 7,503 266,029,300 482 7,555 263,811,000 82.2
Kajiado 21 405 15,300,000 21 405 15,300,000 4.8
Nakuru 35 150 7,500,000 40 183 7,357,501 2.3
Murang'a 30 126 6,020,500 26 98 6,543,600 2.0
Taita Taveta 11 74 2,365,000 19 134 5,410,000 1.7
Nairobi 7 66 3,178,641 9 96 5,240,592 1.6
Meru 5 101 3,057,680 5 117 3,555,200 1.1
Kirinyaga 20 99 2,140,000 24 112 2,460,000 0.8
Kericho 3 13 810,000 6 30 1,675,000 0.5
Machakos 17 36 1,780,000 23 36 1,630,000 0.5
Makueni 4 46 1,600,000 4 48 1,600,000 0.5
Uasin Gishu 7 29 1,337,670 7 26 1,070,136 0.3
Kwale 12 30 960,000 12 30 1,050,000 0.3
Kisii 2 15 600,000 4 22 850,000 0.3
Nyeri 2 15 745,500 4 15 763,200 0.2
Other 37 104 3,595,150 40 70 2,432,050 0.8
Total 693 8,812 317,019,441 726 8,977 320,748,279 100
2.4.4 Long cayenne (Capsicum annuum) This is a hot type of pepper produced for domestic and export markets. During the year under review,
the area under long cayenne decreased by 3 percent from 288Ha to 280Ha. However, the volume
produced increased by 3 percent from 2,459tons in 2015 to 2,545tons in 2016 with the values earned
declining by 7 percent in 2016 compared to 2015. The counties with the highest values were Taita
Taveta, Kajiado, Machakos, and Tana River with 35, 11, 10 and 9 percent respectively of the country’s
total value.
Table 45: Performance of Long Cayenne in selected counties for the years 2015-2016
County
Year 2015 Year 2016 % of Total Value
Area (Ha)
Volume ( MT )
Value (KES) Area (Ha)
Volume (MT
Value ( KES)
Taita taveta 73 936 23,837,000 76 1,022 27,595,000 35.2
Kajiado 21 363 8,280,000 23 366 8,430,000 10.8
Machakos 18 88 8,320,000 8 80 8,000,000 10.2
Tana river 12 166 4,950,000 18 270 7,100,000 9.1
Kiambu 11 92 5,141,500 8 72 3,540,000 4.5

33
Elgeyo marakwet 17 135 3,450,000 18 142 3,520,000 4.5
Garissa 21 60 2,195,000 28 80 2,990,000 3.8
Laikipia 10 160 3,200,000 9 147 2,704,000 3.5
Trans nzoia 26 95 4,375,000 20 55 2,658,504 3.4
Makueni 16 39 2,540,000 10 40 2,550,000 3.3
Kwale 11 88 2,200,000 11 88 2,200,000 2.8
Meru 4 28 1,039,000 7 43 1,840,000 2.3
Kirinyaga 3 25 1,500,000 3 25 1,500,000 1.9
Bungoma 7 31 1,810,000 7 22 1,280,000 1.6
Nakuru 7 10 268,000 9 15 477,000 0.6
Bomet 6 28 825,000 6 28 455,000 0.6
Others 16 116 10,042,222 11 52 1,487,954 1.9
Total 278 2,459 83,972,722 270 2,545 78,327,458 100.0
2.4.5 Bullet chilies (Capsicum annuum) In the year 2016, the area under Bullet chilies and volume increased from 36ha to 76ha and from
337tone to 442tons representing 86 and 17percent increase respectively compared 2015. However, the
values earned decreased by 4 percent from Ksh 19.9Million in 2015 to Ksh 19.0Million in 2016. The
counties with highest values in the year 2016 were Nakuru, Taita Taveta, Kajido and Makueni accounting
for 25.2, 17.7 and17.3 percent respectively of the country’s total value.
Table 46: Performance of Bullet Chilies in selected counties for the years 2015-2016
County
Year 2015 Year 2016 % of Total Value
Area (Ha)
Volume ( MT )
Value (KES) Area (Ha)
Volume (MT
Value ( KES)
Nakuru - - - 12 48 4,800,000 25.2
Taita taveta 9 135 11,700,000 9 102 3,366,000 17.7
Kajiado 8 140 3,300,000 8 140 3,300,000 17.3
Makueni 6 24 1,830,000 6 27 1,830,000 9.6
Machakos - - - 8 16 1,600,000 8.4
Narok 5 18 1,212,500 5 18 1,266,000 6.6
Meru 4 27 919,925 7 36 1,150,500 6.0
Bomet 2 13 382,500 4 24 1,005,000 5.3
Kirinyaga 2 18 480,000 2 18 480,000 2.5
Kilifi - - - 5 12 200,003 1.1
Vihiga 1 2 50,000 1 2 49,000 0.3
Total 36 377 19,874,925 67 442 19,046,503 100.0

34
2.4.6 African birds eye chilies (Capsicum frutescens) The African Birds Eye is produced for both the domestic and export markets and consumed either fresh
or processed. During the year under review, the area under African birds eye chillies, volume and value
increased by 42, 12 and 20 percent respectively compared to 2015. In 2016 Kilifi County led in both
volume and value producing 446tons which earned 52.7 percent of the country’s total value.
Table 47: Performance of African birds eye chilies in selected counties for the years 2015-2016
County
Year 2015 Year 2016 % of Total Value
Area (Ha)
Volume ( MT )
Value (KES)
Area (Ha)
Volume (MT
Value ( KES)
Kilifi 32 450 22,294,800 39 446 22,300,000 52.7
Nakuru - - - 12 40 4,000,000 9.4
Kisumu 5 84 2,700,039 4 53 3,150,000 7.4
Kajiado 4 78 2,600,000 4 78 2,600,000 6.1
Makueni 5 36 2,200,000 6 33 2,018,000 4.8
Homa Bay 29 57 1,144,000 48 97 1,934,400 4.6
Bomet 2 9 1,060,000 2 10 1,250,000 3.0
Kakamega 3 9 792,000 3 12 1,080,000 2.6
Tharaka Nithi 9 16 732,000 6 15 900,000 2.1
Tana River 8 18 330,000 16 42 880,000 2.1
Siaya 2 5 500,000 3 8 750,000 1.8
Nandi 2 15 450,000 2 24 720,000 1.7
Kisii 1 5 250,000 1 5 250,000 0.6
West Pokot 8 2 240,000 8 2 240,000 0.6
Taita Taveta - - - 3 11 225,000 0.5
Others 1 2 50,000 1 2 50,000 0.1
Total 110 787 35,342,839 156 878 42,347,400 100.0
2.4.7 Bell pepper (Capsicum annuum L.) Bell pepper is also referred to as sweet pepper or capsicum. The most popular variety is the green sweet
pepper although the yellow and the red are also gaining popularity. The area under production, volume
and value in 2016 declined with 4, 21 and 22 percent respectively compared to the previous year. The
reduced rainfall in 2016 and prevalence of false codling moth in peppers could have contributed to the
declined in the volume produced.

35
Table 48: Performance of Bell pepper in selected counties for the years 2015-2016
County
Year 2015 Year 2016 % of Total Value
Area (Ha)
Volume ( MT )
Value (KES) Area (Ha)
Volume (MT
Value ( KES)
Kiambu 263 1,585 100,430,000 212 934 49,879,300 20.9
Taita Taveta 83 983 49,725,000 63 600 33,970,000 14.3
Kwale 102 1,740 36,300,000 88 1,368 28,200,000 11.8
Kajiado 61 445 22,450,250 63 489 24,850,250 10.4
Machakos 61 715 17,000,001 84 772 20,060,000 8.4
Embu 6 50 15,000,000 5 50 15,000,000 6.3
Murang'a 60 218 10,496,000 56 239 11,780,000 4.9
Nyeri 42 245 7,380,400 43 239 10,737,000 4.5
Tana River 24 314 8,100,000 22 340 7,300,000 3.1
Garissa 49 190 5,550,000 59 235 6,560,000 2.8
Laikipia 17 351 9,828,000 20 162 5,184,000 2.2
Siaya 20 74 3,626,000 19 89 4,984,000 2.1
Nandi 9 60 3,200,000 18 133 4,360,000 1.8
Nairobi 6 49 1,460,000 15 116 3,712,000 1.6
Kilifi 12 180 5,400,000 21 173 3,329,005 1.4
Other 84 311 9,642,369 106 301 8,342,057 3.5
Total 898 7,510 305,588,020 894 6,240 238,247,612 100.0
2.4.8 Leeks (Allium ampeloprasum) Leeks are grown for both for local and export market. The area under production increased by 1 percent
in 2016 compared to 2015 from 112Ha to 113Ha. However, the volume and value decreased by 6 and 3
percent in 2016 compared to 2015 from 1539tons to 1451 tons and Kshs 100million to Kshs 97million.
The decline in volume may have been attributed to by the reduced rainfall in 2016. Leek is gaining
popularity as a commercial crop for the smallholder farmers thus the increase in hectare in 2016.
Table 49: Performance of Leeks in selected counties for the years 2015-2016
County
Year 2015 Year 2016 % of Total Value
Area (Ha)
Volume ( MT )
Value (KES) Area (Ha)
Volume (MT
Value ( KES)
Taita Taveta 39 1,008 74,600,000 39 1,008 74,600,000 76.6
Nakuru 51 356 18,700,000 42 230 11,500,050 11.8
Nairobi 3 21 983,890 7 66 4,823,800 5.0
Kiambu 10 101 3,330,000 17 96 3,880,000 4.0
Nyandarua 3 25 1,250,000 3 25 1,250,000 1.3
Kajiado 1 12 600,000 1 12 600,000 0.6

36
Bungoma 3 4 280,000 2 4 280,000 0.3
Nyeri 1 6 199,300 1 5 200,500 0.2
Vihiga 1 3 160,000 1 3 160,000 0.2
Uasin Gishu 1 3 121,910 1 2 97,528 0.1
Total 112 1,539 100,225,100 113 1,451 97,391,878 100.0
2.4.9 Garlic (Allium sativum) Garlic is a leading source of income among the herbs and spices. In 2016 the area under production was
18Ha producing 99tons valued at Ksh 12.3Million. This represented an increase in area, volume and
value by 125, 71 and 49 percent respectively compared to 2015. Bomet County led in production
producing 70tons that earned 57 percent of the total value.
Table 50: Performance of Garlic in selected counties for the years 2015-2016
County
Year 2015 Year 2016 % of Total Value
Area (Ha)
Volume ( MT )
Value (KES) Area (Ha)
Volume (MT
Value ( KES)
Bomet 4 40 4,000,000 7 70 7,000,000 57
Bungoma 2 12 3,600,000 3 12 3,600,000 29
Kajiado 2 6 650,000 7 15 1,600,000 13
Nakuru - - - 1 2 60,000 0.4
Total 8 58 8,250,000 18 99 12,260,000 100
2.4.10 Rosemary (Rosamarinus officinalis) During the year under review, the area under production, volume and value increased by 30, 76 and 34
percent respectively compared to 2015. The leading counties in value in 2016 were Kiambu and
Bungoma at 44 and 18 percent of the total value.
Table 51: Performance of Rosemary in selected counties for the years 2015-2016
County
Year 2015 Year 2016 % of Total Value
Area (Ha) Volume ( MT )
Value (KES) Area (Ha)
Volume (MT
Value ( KES)
Kiambu 27 63 3,228,000 27 56 2,948,000 44
Bungoma 4 6 600,000 3 42 1,200,000 18
Nakuru - - - 2 21 1,000,000 15
Kwale 4 24 720,000 4 24 720,000 11
Nyeri 0 1 225,200 0 1 226,400 3
Kakamega 1 0 3,000 8 22 225,000 3
Vihiga 1 1 32,000 4 4 160,000 2
Kisii 0 4 160,000 0 4 160,000 2
Total 37 99 4,968,200 48 174 6,639,400 100

37
2.5 Asian Vegetables
Table 52: Summary of the Performance of Asian Vegetables for the years 2015-2016
Crops Year 2015 Year 2016 % of Total Value
Area (Ha)
Volume ( MT )
Value (KES) Area (Ha) Volume (MT
Value ( KES)
Egg plant
736 11,563 242,677,389 818 11,193 356,361,725 48.3
Okra 417 7,155 109,333,733 516 3,941 330,500,277 44.8
Dudhi 102 883 30,028,940 104 797 26,191,600 3.5
Karella 53 367 39,510,000 34 221 22,973,700 3.1
Valore 30 115 4,624,560 35 143 1,732,104 0.2
Tindori 9 40 2,647,000 3 16 475,000 0.1
Total 1,347 20,123 428,821,622 1,510 16,311 738,234,406 100.0
2.5.1 Eggplant (Solanum melongena) Eggplant or Aubergine is also known as brinjals or ravaya. They are grown both for export and domestic
markets. The area under production increased by 11 percent in 2016 from 736Ha to 818Ha in 2015,
while the volume declined by 3 percent from 11,563tons in 2015 to 11,193tons in 2016. However, the
value in 2016 increased by 47 percent from Ksh 242million to Ksh 356million compared to 2015.
Table 53: Performance of Eggplant in selected counties for the years 2015-2016
County
Year 2015 Year 2016 % of Total Value
Area (Ha)
Volume ( MT )
Value (KES) Area (Ha)
Volume (MT
Value ( KES)
Taita Taveta 98 1,791 36,250,000 260 3,748 108,840,000 30.5
Machakos 117 2,065 1,850,000 93 1,391 50,807,300 14.3
Kilifi 126 2,297 57,425,000 100 1,332 39,945,000 11.2
Kwale 133 2,295 50,775,000 108 1,620 37,275,000 10.5
Bungoma 42 630 19,620,000 39 630 30,960,000 8.7
Meru 55 665 21,909,560 58 733 24,878,400 7.0
Makueni 57 628 16,000,000 33 399 15,636,020 4.4
Nairobi 6 54 2,524,748 11 142 9,950,434 2.8
Murang'a 46 284 7,368,500 41 312 7,590,000 2.1
Kisumu 10 200 6,818,181 10 200 6,818,181 1.9
Kiambu 25 200 8,916,400 27 160 6,780,000 1.9
Kajiado 29 247 5,600,000 32 281 6,249,390 1.8
Siaya 2 30 1,500,000 5 75 3,750,000 1.1
Kirinyaga 10 83 3,328,000 10 80 3,200,000 0.9

38
Mombasa 1 20 600,000 8 56 2,640,000 0.7
Other 11 74 2,192,000 10 34 1,042,000 0.3
Total 767 11,563 242,677,389 852 11,193 356,361,725 100.0
2.5.2 Dudhi (Lagenaria siceraria) Dudhi is also known as bottle gourd and is grown for export market as well as small high end market.
The area under production increased from 103ha to 104ha while production increased from 793tons to
797tons a 2percent and 10percent increase respectively. The value also increased from 26.028Milion to
Ksh 26.192 as compared to 2015.
Table 54: Performance of Dudhi in selected counties for the years 2015-2016
County
Year 2015 Year 2016 % of Total Value
Area (Ha)
Volume ( MT )
Value (KES) Area (Ha)
Volume (MT
Value ( KES)
Meru 37 379.47 10,583,940 41 420 11,726,600 45
Murang'a 35 210 7,350,000 34 216 7,560,000 29
Machakos 14 98 4,000,000 10 70 2,800,000 11
Mombasa 1 4.5 165,000 6 21 1,785,000 7
Tharaka Nithi 12 72 1,980,000 9 51 1,275,000 5
Kajiado 4 29 5,950,000 4 19 1,045,000 4
Total 103 793 26,028,940 104 797 26,191,600 100
2.5.3 Karella (Momordica charantia) Karella is grown for both export and domestic market. During the year under review, the area, volume
and value decreased from 53Ha to 34Ha, 367tons to 221tons, Ksh 39.5Million to Ksh 23Million
respectively as compared to 2015. In 2016, the area under production, volume and values decreased by
36, 40, and 42 percent respectively compared to 2015. The decline may have been attributed to several
notifications as a result of some quarantine pests found on this produce in Europe leading to most
export companies shying away from the crop. Locally, karella is considered to have medicinal attributes.
Table 55: Performance of Karella in selected counties for the years 2015-2016
County
Year 2015 Year 2016 % of Total Value
Area (Ha) Volume ( MT )
Value (KES) Area (Ha)
Volume (MT
Value ( KES)
Machakos 34 272 35,360,000 16 112 16,800,000 73
Meru 6 24 1,300,000 4 22 1,860,000 8
Mombasa 1 7 345,000 4 25 1,635,000 7
Kajiado 8 44 1,425,000 6 41 1,585,000 7

39
Makueni 4 17 840,000 4 18 853,700 4
Kisumu 1 3 240,000 1 3 240,000 1
Total 53 367 39,510,000 34 221 22,973,700 100
2.5.4 Okra (Hibiscus esculentus) Okra though an export crop and classified as an Asian vegetable, it is preferred locally by the coastal
people. The area under production increased from by 24 percent from 417Ha in 2015 to 517Ha in 2016,
however the volume produced decreased from 7,155tons in 2015 to 3,941tons in 2016.
Table 56: Performance of Okra in selected counties for the years 2015-2016
County
Year 2015 Year 2016 % of Total Value
Area (Ha)
Volume ( MT )
Value (KES) Area (Ha)
Volume (MT
Value ( KES)
Taita Taveta 46 684 20,514,000 80 1,177 72,712,000 43.15
Kilifi 149 4,921 31,857,593 219 1,315 39,616,057 23.51
Kwale 159 992 31,195,000 129 840 28,150,000 16.71
Mombasa 2 39 1,950,000 35 162 8,300,000 4.93
Makueni 23 160 8,200,000 21 153 7,335,420 4.35
Siaya 5 30 1,500,000 5 70 3,500,000 2.08
Machakos 18 180 10,800,000 5 50 3,000,000 1.78
Turkana - - - 5 27 2,650,000 1.57
Kajiado 9 113 2,160,000 10 110 1,985,000 1.18
Meru 4 28 881,140 5 30 1,034,600 0.61
Kitui 2 8 276,000 2 6 193,200 0.11
Vihiga - - - 1 1 24,000 0.01
Total 417 7,155 109,333,733 517 3,941 168,500,277 100.0
2.6 Medicinal Plants
During the year under review, medicinal plants showed a decrease in the land under production as well
as the quantity produced from 490Ha in 2015 to 460 and 3,989tons to 3,492tons. This decrease is
attributed to harvesting of the plants without planting more due to increased demand for the products.
However the value increased from 125M to 128M due to increased farm gate prices. Farmers should be
encouraged to plant mare of medicinal plants to supply the growing demand for medicinal crops.
Table 57: Summary of the Performance of Medicinal Plants for the years 2015-2016
Crop Year 2015 Year 2016 % of Total Value
Area (Ha)
Volume ( MT )
Value (KES) Area (Ha)
Volume (MT
Value ( KES)
Tunguja 148 1,696 70,800,000 148 1,696 70,800,000 55

40
Curci 240 1,944 36,627,500 183 1,244 31,640,000 25
Aloe 12 126 3,691,000 41 240 11,208,000 9
Stevia 72 99 10,394,000 46 87 8,620,000 7
Bixa 16 75 1,880,000 26 172 3,660,000 3
Moringa 9 37 1,225,500 15 41 1,370,000 1
Methi 2 13 1,032,500 2 13 1,032,500 1
Total 498 3,989 125,650,500 460 3,492 128,330,500 100
3 CHAPTER THREE
3.1 FRUITS
3.1.1 Overall performance In 2016, fruits contributed Ksh57 billion; accounting to 27 percent of the domestic value of horticultural
produce. During the year under review, the area, yields and value increased from 160,968Ha in 2015 to
172,527Ha in 2016 a 7percent increase, while production decreased from 3,292,200 in 2015 to
3,191,175 tons a 3 percent decrease. The decrease in production was attributed to drought experienced
in 2016 and reduced water for irrigation. The value on the other hand increased from 56,107,118,805
billion to 57,299,316,546 billion despite decrease in production a 2percent increase compared to 2015
value. This was due to increase in farm gate prices.
The major fruit grown in order of importance are; banana 32percent, mangoes 21percent, pineapples
17percent, avocado 12percent, water melon 7percent paw paw 4percent, oranges 4percent, passion
fruit 2percent and tamarillo 1percent of the total value of fruits. The potential of most fruits remain
unexploited. However, there is potential for growth due to increasing demand both in domestic and
export market for fresh fruits and fruit products such as juices and concentrates. In addition there are a
number of initiatives to support fruit production and value addition. Further, the government is
supporting organizations of smallholder producers into commodity associations and producer business
groups to facilitate production and marketing. Challenges in fruit cultivation include low adoption of
modern technologies, inadequate quality planting materials, high post-harvest loses and prevalence of
pests and diseases.
Table 58: Fruits Production in selected Counties 2015-2016
COUNTY 2015 2016 % of
Total Value
AREA
(HA)
VOLUME
(Tons)
VALUE(KES) AREA
(HA)
VOLUME
(Tons)
VALUE(KES)
Bananas 60,743 1,257,663 16,977,647,483 63,074 1,242,559 18,109,189,023 31.61

41
Mango 46,364 806,575 12,195,592,706 49,098 779,147 11,892,258,419 20.75
Pineapples 8,917 366,307 9,668,826,675 9,137 360,494 9,666,349,880 16.87
Avocado 13,305 331,755 6,010,994,155 18,124 368,370 6,924,034,856 12.08
Water Melon 5,444 194,343 4,103,311,368 7,956 173,697 4,000,498,015 6.98
Pawpaw 9,346 127,782 2,102,857,542 8,112 107,591 2,205,138,840 3.85
Oranges 7,062 107,121 2,169,611,035 7,268 85,233 2,166,297,972 3.78
Passion 3,363 46,628 1,659,787,439 3,825 31,571 1,399,002,305 2.44
Tamarillo 800 14,454 532,330,425 873 7,434 341,770,685 0.596
Tangerines 1,147 14,939 295,663,135 1,122 10,172 228,616,668 0.40
Lemon 1,247 12,144 217,454,629 1,345 10,817 201,641,967 0.35
Guava 2,687 8,713 71,507,783 1,806 9,800 57,737,125 0.10
Apples 56 589 42,542,405 82 623 34,364,854 0.06
Plums 174 1,826 30,546,297 211 1,952 29,929,886 0.05
Loquats 177 689 11,515,064 238 965 22,847,580 0.04
Custard Apple 103 552 12,994,300 147 581 13,909,917 0.024
White Sapote 27 112 2,640,364 39 155 4,354,554 0.008
Grapes 3 4 648,000 35 7 687,000 0.001
Strawberry 3 4 648,000 35 7 687,000 0.001
TOTAL 160,968 3,292,200 56,107,118,805 172,527 3,191,175 57,299,316,546 100.0
3.1.2 Banana (Musa sp) Banana is an important fruit in the country accounting for 32 of total value of fruits. It is a major source
of income and food security among smallholders and large scale farmers. In 2016, the area under
banana was 63,299 Ha with a total production of 1,288,588 tons valued at Kshs16, 877,130,503. The
Area under production increased from 60,718 Ha to 63,299 Ha and value increase by Ksh774 Million
representing 4.25 percent and 4.78 percent respectively but production went down by 0.12 percent. The
drop in production was attributed to prolonged drought experienced in major growing areas. The main
varieties grown include: dessert banana cultivars - Grand Nain, Gross Mitchel, Williams’s hybrid, Valery,
Chinese Cavendish, Giant Cavendish, Dwarf Cavendish and Apple banana. Cooking cultivars include:
Gradi Shisikame, Mutahato, Uganda green and Ng’ombe and multipurpose cultivars such as Muraru and
Gold finger. The leading counties in banana production were: Meru 17percent, Kirinyaga 11percent,
Muranga 9 percent, Kisii 8percent, Tharaka 6percent, Kiambu 5 percent and Taita Taveta 5 percent
others as shown in the table 61 below: The main challenges in banana production are nematodes and
diseases like panama and sigartoka.

42
Table 59: Production of Bananas in selected Counties 2015-2016
COUNTY 2015 2016 % of Total Value
AREA (HA)
VOLUME (Tons)
VALUE(KES) AREA (HA)
VOLUME (Tons)
VALUE(KES)
Meru 7,038 251,132 2,618,313,576 7,503 276,919 2,911,079,680 17.1
Kirinyaga 6,318 142,036 1,847,385,000 6,670 145,036 1,864,092,640 11.0
Murang'a 5,757 159,790 1,759,061,445 5,987 154,172 1,611,924,000 9.5
Kisii 3,088 60,975 897,400,000 3,919 77,415 1,337,769,300 7.9
Tharaka Nithi 4,204 75,544 952,405,000 3,734 76,633 967,680,000 5.7
Kiambu 4,856 132,253 1,406,277,000 4,288 63,300 895,420,000 5.3
Taita Taveta 2,891 67,865 735,796,500 2,954 78,329 810,836,100 4.8
Tana River 1,985 22,692 667,880,000 1,852 23,091 683,615,000 4.0
Embu 850 28,050 567,000,000 862 27,584 644,464,000 3.8
Kakamega 3,402 38,929 528,375,280 3,824 34,717 608,156,000 3.6
Nyamira 2,005 30,708 475,470,000 2,259 42,475 553,600,086 3.3
Bungoma 2,057 30,856 432,993,000 1,987 40,098 522,038,000 3.1
Machakos 2,206 20,544 386,522,500 2,572 23,334 472,857,500 2.8
Nyeri 1,730 39,584 283,726,030 1,876 37,230 294,865,460 1.7
Narok 523 9,946 233,115,000 572 9,859 275,127,000 1.6
Others 11,809 179,246 2,911,308,928 12,441 178,395 2,523,605,737 14.9
TOTAL 60,718 1,290,150 16,703,029,259 63,299 1,288,588 16,977,130,503 100.0
3.1.3 Mango (Mangifera indica) Mangoes production has been on the increase due to increased demand for fresh market, fruits
processing, and health concerns. In 2016, the area under mangoes was 49,098 Ha with a production of
779,147 Metric tons, valued at Kshs11.89 billion as compared to Kshs12.2 billion achieved in 2015 from
806,575 tons of mangoes in 2015. This decrease can be attributed to poor rains received in 2016 as
mangoes are mainly produced under rain fed conditions. The leading counties in mangoes ranked by
value were; Makueni, Machakos, Kilifi and Kwale whose contribution to the total value was 30, 23, 16
and 8 percent of the country’s total value respectively. The main challenges in mango are fruit flies, rust,
disease free seedlings that are true to type and marketing of the fruits especially during periods of glut.
Table 60: Production of Mangoes in selected Counties, 2015-2016
COUNTY 2015 2016 % of Total Value
AREA (HA)
VOLUME (Tons)
VALUE(KES) AREA (HA)
VOLUME (Tons)
VALUE(KES)
Makueni 11,468 214,702 3,353,880,000 12,422 225,300 3,617,524,000 30.4
Machakos 5,815 152,496 2,354,522,000 6,387 168,552 2,764,574,500 23.2
Kilifi 7,808 112,542 1,767,363,080 9,155 108,139 1,844,181,000 15.5
Kwale 3,883 92,259 1,516,780,000 3,898 53,339 934,555,000 7.9

43
Meru 2,700 26,459 514,981,755 3,025 27,742 533,531,950 4.5
Embu 780 15,600 288,600,000 850 14,450 332,000,000 2.8
Bungoma 1,290 15,096 204,456,000 1,125 19,936 251,680,000 2.1
Tana River 1,436 34,416 211,328,000 1,356 32,066 211,268,000 1.8
Elgeyo Marakwet
574 12,620 215,330,000 751 14,343 132,782,530 1.1
Murang’a 914 6,811 119,214,000 926 9,192 130,583,000 1.1
Tharaka Nithi 1,167 9,877 130,842,500 1,165 10,233 124,448,750 1.0
Kitui 1,510 13,978 135,924,000 1,359 12,580 122,331,600 1.0
Siaya 550 5,920 352,400,000 258 4,885 107,300,000 0.9
Taita Taveta 296 3,634 74,111,550 320 4,165 90,148,000 0.8
Busia 378 6,132 116,400,010 408 4,643 86,282,250 0.7
Others 5,797 84,034 839,459,811 5,693 71,583 609,067,839 5.1
TOTAL 46,364 806,575 12,195,592,706 49,098 781,147 11,892,258,419 100.0
3.1.4 Avocado (Persea americana) Avocado is an important commercial fruit grown mainly by both small and large scale farmers. The main
avocado varieties grown for export market are Hass and Fuertes. In addition, three others are traded in
the local market which includes Puebla, Duke, and G6.
In 2016, avocado contributed Kshs4.63 billion from 246,057 tons of fruits accounting for 8 percent by
value of the fruit sub-sector. The value increased form Kshs4.45Billion in2015 to Kshs4.63 Billion in 2016
which was a 4.2 percent increase from 2015. This was due to improved prices in the international
market as well as opening of the Russian market that demands high volumes of Fuertes avocados which
were not very popular in the European market.
The area under production increased form 12,383 Ha in 2015 to 13,017 in 2016 a 6.1 percent change
that was attributed to planting of new orchards in non-traditional areas of the rift valley. Production
increased from 230,984 tons to 246,057 in 2016 representing 6.6 percent increase. The leading county
was Murang’a that accounted for 53 by value of produce followed by Kisii, Kiambu and Nyamira that
contributed 11, 9 and 4 percent respectively of the total value.
Table 61: Production of Avocado in selected Counties, 2015-2016
COUNTY 2015 2016 % of Total
Value AREA
(HA) VOLUME (Tons)
VALUE(KES) AREA (HA)
VOLUME (Tons)
VALUE(KES)
Murang’a 4,309 112,510 2,320,318,000 4,310 118,356 2,438,827,000 52.6
Kisii 1,744 27,068 336,612,220 1,519 29,383 487,573,500 10.5
Kiambu 633 10,247 331,956,000 677 12,382 407,352,500 8.8
Nyamira 1,185 25,600 300,580,000 1,454 24,435 198,640,199 4.3
Machakos 350 4,294 203,880,000 519 4,172 112,439,000 2.4
Vihiga 191 5,219 86,870,300 196 6,039 103,284,667 2.2

44
Kirinyaga 444 5,459 99,406,000 422 5,023 100,172,000 2.2
Bungoma 321 3,606 102,600,000 266 4,275 78,103,900 1.7
Migori 307 3,340 56,419,560 297 3,365 72,589,182 1.6
Meru 469 4,581 60,319,101 458 4,671 66,462,112 1.4
Elgeyo Marakwet 159 2,065 60,670,000 276 2,477 58,821,600 1.3
Taita Taveta 143 902 17,063,700 174 4,739 43,870,900 0.9
Kericho 105 1,827 65,544,968 76 1,413 43,073,750 0.9
Kakamega 143 2,003 35,432,906 164 2,112 40,096,000 0.9
Nandi 95 1,496 34,948,025 123 1,718 39,485,375 0.9
Bomet 229 2,622 77,553,000 209 2,602 35,055,000 0.8
Others 1,557 18,146 257,550,795 1,877 18,896 306,608,172 6.6
TOTAL 12,383 230,984 4,447,724,575 13,017 246,057 4,632,454,856 100.0
3.1.5 Oranges (Citrus sinensis) Orange production is mainly done in the low lands of Kenya. During the year under review, oranges
contributed to Kshs2.16billion which accounted for 4 percent of the value of fruits. The area under
production was 7,268Ha producing 85,234 tons of oranges. Compared to 2015, the area increased form
7,173ha to 7,268 which was a 3 percent increase, but production and value reduced from 118,123tons
to 85,234tons and from Kshs2.478bilion to Kshs2.166 which was a 20 percent and 0.4 percent dip
respectively as compared to 2015. The leading counties were Machakos, Kwale, Lamu, Makueni and
Kilifi accounting for 34, 23, 11, 9 and 8 percent of the country’s total value.
The main challenges in oranges production are citrus greening, aphids, scales and clean planting
materials.
Table 62: Production of Oranges in selected Counties, 2015-2016
COUNTY 2016 2015 % of Total Value
AREA (HA)
VOLUME (Tons)
VALUE(KES) AREA (HA)
VOLUME (Tons)
VALUE(KES)
Machakos 1,044 16,032 499,600,000 1,098 20,030 737,245,000 34.0
Kwale 1,843 41,177 715,540,000 1,840 26,320 489,900,000 22.6
Lamu 781 9,468 284,146,600 822 8,233 247,084,000 11.4
Makueni 1,123 8,956 182,052,000 1,171 9,334 189,529,880 8.7
Kilifi 1,176 30,439 522,756,812 834 6,689 174,092,084 8.0
Muran’a 353 4,481 91,263,000 352 5,761 101,895,000 4.7
Taita Taveta 136 2,063 29,446,500 252 2,836 51,886,900 2.4
Elgeyo Marakwet 112 1,636 48,254,318 205 1,688 49,234,550 2.3
Meru 59 348 15,915,000 70 390 18,231,500 0.8
Kajiado 49 360 13,760,500 58 477 15,665,950 0.7
Homa Bay 29 273 11,823,108 36 329 14,322,520 0.7

45
Laikipia 23 232 9,248,000 24 261 13,250,000 0.6
Marsabit 72 148 6,200,000 74 258 13,100,000 0.6
Trans Nzoia 116 1,120 8,980,000 158 1,124 10,339,939 0.5
Bungoma 37 230 7,250,000 27 280 7,300,000 0.3
Others 220 1,160 32,355,191 247 1,224 33,220,650 1.5
TOTAL 7,173 118,123 2,478,591,029 7,268 85,234 2,166,297,973 100
3.1.6 Lemons (Citrus limon) The demand for lemons has been on the increase due to health concerns among the middle class of
Kenya. During the year under review, the area under lemons increased by 8 percent that is from
1,247ha to 1,346ha, but production and value decreased from 13,144tons to 11,618tons and
Kshs236.45milion to Kshs215.84milion a 11 and 7percent reduction respectively compared with 2015.
This was attributed to low production realized in Lamu and Kilifi counties that contributes almost 40
percent of the country’s lemons. The leading counties are Kilifi, Lamu, Kwale and Elgeyo Marakwet
accounting for 20, 18, 16 and 10 percent per total country’s value respectively.
Table 63: Production of Lemons in selected Counties, 2015-2016
COUNTY 2015 2016 % of Total Value
AREA (HA)
VOLUME (Tons)
VALUE(KES) AREA (HA)
VOLUME (Tons)
VALUE(KES)
Kilifi 125 1,022 37,020,000 160 1,274 40,460,022 18.7
Lamu 142 2,056 41,124,000 149 1,788 35,760,000 16.6
Kwale 244 3,865 46,525,000 244 2,500 32,875,000 15.2
Elgeyo Marakwet
80 1,066 19,941,074 138 1,093 20,509,600 9.5
Makueni 114 909 16,620,000 119 947 16,987,444 7.9
Taita Taveta 93 1,399 21,045,000 105 1,253 15,422,000 7.1
Homa Bay 16 204 9,103,105 17 218 10,061,228 4.7
Others 80 409 8,614,100 95 490 9,934,924 4.6
Machakos 83 615 9,755,000 84 616 9,900,000 4.6
Tana River 120 640 8,950,000 100 562 7,610,000 3.5
Kisumu 9 170 3,362,000 7 167 3,282,000 1.5
Baringo 53 254 3,084,000 55 255 3,110,000 1.4
Meru 51 292 3,895,600 36 232 2,914,000 1.4
Laikipia 11 80 2,400,000 10 70 2,550,000 1.2
West Pokot 13 85 2,315,750 13 85 2,315,750 1.1
Siaya 13 78 2,700,000 14 68 2,150,000 1.0
TOTAL 1,247 13,144 236,454,629 1,346 11,618 215,841,968 100

46
3.1.7 Tangerines (Citrus tangerina) Tangerines production in the country is majorly done in Kwale, Makueni and Kilifi counties accounting
for 52, 37, and 6 percent respectively as clearly shown by the table. During 2015, the area, production
and value were higher as compared to 2016. The area under production reduced by 2 percent while the
quantities produced fell by 32 percent as compared to 2015. On the other hand, the value reduced by 23
percent as opposed to the decrease in production that stood at 32 percent. This was because the
average farm gate prices were high compared to the reference year.
Table 64: Production of Tangerines in selected Counties, 2015-2016
COUNTY 2015 2016 % of Total Value
AREA (HA)
VOLUME (Tons)
VALUE(KES) AREA (HA)
VOLUME (Tons)
VALUE(KES)
Kwale 410 6,070 190,070,000 415 5,595 119,595,000 52.2
Makueni 463 3,246 81,671,000 477 3,361 84,992,000 37.1
Kilifi 207 2,132 22,393,924 126 1,216 12,960,018 5.7
Elgeyo Marakwet 11 153 3,072,222 22 159 3,192,500 1.4
Taita Taveta 9 117 3,339,000 16 107 2,179,000 1.0
Meru 24 76 1,578,400 27 85 1,721,000 0.8
Homa Bay 2 27 889,785 2 30 988,650 0.4
Kajiado 2 12 240,000 8 42 840,000 0.4
Machakos 8 36 520,000 9 37 632,000 0.3
Laikipia 5 28 495,000 4 31 495,000 0.2
Samburu 1 17 350,000 2 18 400,000 0.2
Others 6 51 1,043,804 8 44 921,500 0.4
TOTAL 1,148 11,965 305,663,135 1,116 10,725 228,916,668 100
3.1.8 Passion fruit (Passiflora edulis) Passion fruit is an important fruit with great commercial potential since demand for both fresh fruit and
processed juice supersedes the domestic production. In 2016, passion fruit contributed Kshs.1.64 billion
accounting for 2.54 percent of the total value of fruits. The area under the crop was 3175Ha and
production of 42,210MT. The area, production and value increased by 14, 39 and 35 percent
respectively. Passion fruit production is faced with challenges among them increased incidences of
fusarium wilt, dieback and woodiness virus disease. In addition, premature harvesting of fruits has
negatively impacted the global competitiveness of the passion fruit from Kenya.
The leading counties accounting for up to 67 percent of the country’s values of passion fruit were Embu,
Kwale, Elgeyo Marakwet and Nyeri accounting for 22, 17, 11 and 8 percent of the total county’s value
respectively.

47
Table 65: Production of Passion Fruits in selected Counties, 2015-2016
COUNTY 2015 2016 % of Total Value
AREA (HA)
VOLUME
(Tons)
VALUE(KES) AREA (HA)
VOLUME
(Tons)
VALUE(KES)
Kwale 972 12,749 365,776,000 1,020 10,663 283,590,000 20.1
Elgeyo Marakwet
416 6,250 261,620,000 688 4,589 197,890,000 14.0
Uasin Gishu 186 2,309 116,039,200 196 1,971 108,831,360 7.7
Narok 237 1,586 89,640,000 234 1,664 94,021,999 6.7
Nandi 64 644 20,530,000 87 1,739 86,910,000 6.2
Bungoma 76 1,397 75,335,000 84 1,469 74,358,000 5.3
Meru 124 1,030 50,340,000 146 1,326 71,240,000 5.0
Bomet 76 1,008 51,560,000 87 906 53,030,000 3.8
Migori 184 1,474 58,306,230 123 1,049 47,205,000 3.3
Kiambu 68 942 48,205,000 72 763 44,485,000 3.1
Murang’a 57 547 33,558,080 68 588 34,740,978 2.5
Kirinyaga 179 555 31,407,600 184 569 32,252,000 2.3
Kericho 21 428 21,349,000 33 505 28,927,500 2.0
Embu 42 378 22,350,000 50 465 26,200,000 1.9
Kisii 37 345 18,940,000 39 421 24,143,600 1.7
Nakuru 26 249 13,370,000 31 280 15,490,000 1.1
West Pokot 13 136 6,520,000 14 146 6,520,000 0.5
Others 639 4,156 192,103,266 733 4,254 182,766,868 12.9
TOTAL 3,417 36,183 1,476,949,376 3,889 33,367 1,412,602,305 100.0
3.1.9 Pineapples (Ananas comosus) Pineapple is grown for both fresh market and processing market. The main variety grown is smooth
cayenne. During the year under review, the area, production and value of the crop were 9,137Ha,
360,494 Tons and Kshs9.67 Billion respectively. The major counties accounting for 90 of total value of
pineapple were Murang’a, Kiambu, Kericho and Mackakos and individually accounting for 50percent,
21percent, 11percent and 8 percent respectively. The major constraints to pineapple production are
unavailability of quality planting material and insect pest’s especially mealy bugs and nematodes besides
poor agronomic practices among smallholders. In addition, there is limited cottage industry to process
pineapple in diverse range of products.

48
Table 66: Production of Pineapples in selected Counties, 2015-2016
COUNTY 2015 2016 % of Total
Value AREA
(HA) VOLUME
(Tons) VALUE(KES) AREA
(HA) VOLUME
(Tons) VALUE(KES)
Murang’a 3,507 161,855 4,693,795,000 3,507 159,733 4,791,990,000 49.6
Kiambu 2,011 67,866 2,008,800,000 1,970 67,046 2,032,460,000 21.0
Kericho 1,200 77,050 1,086,689,031 1,242 73,255 1,097,870,000 11.4
Machakos 619 25,588 780,434,000 619 27,753 821,488,800 8.5
Migori 584 10,916 356,544,920 476 8,355 215,301,700 2.2
Kilifi 53 6,280 188,400,000 102 6,298 188,522,024 2.0
Meru 250 4,036 112,996,000 546 5,382 150,720,000 1.6
Bungoma 27 1,754 100,300,000 33 734 104,300,000 1.1
Kisii 174 3,309 140,274,000 175 3,564 97,700,000 1.0
Nandi 89 2,144 74,670,000 90 2,989 48,114,000 0.5
Bomet 83 1,339 25,771,250 35 992 18,840,000 0.2
Busia 59 765 22,050,000 56 723 16,181,666 0.2
Others 262 3,405 78,102,474 288 3,670 82,861,690 0.9
TOTAL 8,917 366,307 9,668,826,675 9,137 360,494 9,666,349,880 100.0
3.1.10 Pawpaw (Carica papaya) In year 2016, pawpaw contributed 2.21 billion shillings accounting for 4percent of the fruits subsector.
The area and production decreased from 9,346ha to 8,112ha and from 127,782tons to 107,591tons
representing a 13 percent and 16 percent drop respectively while the value increased from Kshs2.1Bilion
to Kshs2.2Bilion a 5 percent rise compared with 2015 figures.
The leading counties in pawpaw by value are Machakos, Meru and Makueni accounting for 15 percent,
13 percent and 10 percent respectively. The main varieties grown include Mountain, Solo, Sunrise,
Honey dew and Hawaii. The following varieties, Sunrise hybrid, Sunrise Pekerra, Solo Sunset, Malaysian
5 percent, 7 percent, 10 percent, and 12 percent, are under trial in various KARI centres.
The major challenges to production of pawpaw are lack of quality planting material arising from genetic
erosion due to open pollination during production; since we do not have established seed producers for
pawpaw seed, basic seed is usually imported, low productivity, insect pests and diseases; especially
spider mites and powdery mildew.
Table 67: Production of Pawpaw in selected counties 2015-2016
COUNTY 2015 2016 % of Total Value AREA
(HA) VOLUME
(Tons) VALUE(KES) AREA
(HA) VOLUME
(Tons) VALUE(KES)
Machakos 1,618 14,182 302,546,000 1,742 15,108 326,068,000 14.8

49
Meru 320 6,982 194,765,000 532 9,944 289,175,000 13.1
Makueni 378 5,521 156,967,500 506 7,430 225,510,000 10.2
Tharaka Nithi 1,101 9,370 155,425,000 1,093 9,150 187,300,000 8.5
Kilifi 1,946 37,943 209,526,167 450 22,537 172,748,592 7.8
Elgeyo Marakwet 112 3,540 95,528,836 187 4,921 136,362,282 6.2
Murang’a 215 3,834 98,109,447 230 2,208 96,403,140 4.4
Kwale 974 16,368 198,125,000 814 7,862 94,230,000 4.3
Homa Bay 124 1,473 49,718,379 167 2,054 71,753,120 3.3
Bungoma 73 862 39,860,000 60 1,236 61,069,500 2.8
Migori 320 4,926 97,265,225 240 3,412 58,830,850 2.7
West Pokot 262 1,796 53,926,000 266 1,824 54,766,000 2.5
Tana River 404 4,340 62,300,000 229 2,740 52,300,000 2.4
Kirinyaga 343 1,898 51,944,000 364 2,824 49,560,000 2.2
Kisii 89 1,940 31,640,000 90 2,333 44,320,000 2.0
Siaya 100 1,538 57,449,000 121 1,104 42,520,000 1.9
Others 968 11,268 247,761,988 1,023 10,903 242,222,357 11.0
Total 9,346 127,782 2,102,857,542 8,112 107,591 2,205,138,840 100.0
3.1.11 Melon (Cucumis melo sp.) The area under Melon was 7,956Ha producing 173,697Mt with a value of Ksh4.0 billion. The area under
melons increased from 5,444Ha in 2015 to 7,956Ha in 2016 representing a 46 percent increase, but the
production and value of the fruit decreased by 11 percent and 3percent respectively. The data reported
is the aggregated data for water melon and sweet melon though currently there is increased production
of the horned melon. The leading counties in melon production are Makueni, Tana River Kilifi, Migori,
Kwale and Meru accounting for 25 percent, 19 percent, 8percent, 7 percent, 5 percent and 4.5 percent
respectively of the countries value. Prevalence of pests and diseases is a major constraint to increased
production of sweet melon.
Table 68: Production of Melons in selected Counties 2015-2016
COUNTY 2015 2016 % of Total Value
AREA (HA)
VOLUME (Tons)
VALUE(KES) AREA (HA)
VOLUME (Tons)
VALUE(KES)
Lamu 1,042 89,453 1,610,149,500 1,097 77,785 1,400,130,000 35.0
Kirinyaga 155 7,246 351,700,000 192 9,056 403,560,000 10.1
Tana River 370 9,320 211,700,000 438 11,092 242,360,000 6.1
Machakos 432 4,315 127,394,000 774 7,728 210,348,000 5.3
Makueni 112 2,850 106,200,000 149 3,610 192,350,160 4.8
Migori 740 16,784 252,169,230 2,563 11,325 167,142,200 4.2
Taita Taveta 92 2,436 142,120,000 122 3,242 158,466,000 4.0

50
Siaya 169 5,394 289,088,000 163 4,074 156,120,000 3.9
Kilifi 87 9,175 139,705,000 45 8,600 133,500,000 3.3
Meru 178 4,252 111,335,755 243 5,673 114,179,728 2.9
Homa Bay 293 3,199 98,581,625 254 3,069 102,517,450 2.6
Kisumu 152 2,663 75,840,225 172 3,210 90,490,225 2.3
Baringo 198 3,854 88,048,000 199 3,870 88,648,000 2.2
Kwale 164 4,180 105,800,000 140 2,660 78,680,000 2.0
Elgeyo Marakwet 75 1,800 42,115,350 117 2,532 65,121,027 1.6
Garissa 161 1,510 52,000,000 185 1,728 62,240,000 1.6
Tharaka Nithi 67 1,545 35,630,000 79 2,025 54,530,000 1.4
Narok 108 1,003 45,712,791 127 1,197 50,927,000 1.3
Kajiado 230 2,636 44,270,240 243 2,793 49,432,000 1.2
Others 619 20,729 173,751,652 656 8,429 179,756,226 4.5
Total 5,444 194,343 4,103,311,368 7,956 173,697 4,000,498,015 100.0
3.1.12 Custard apple (Annona reticulata) During the year under review, the area under custard apples increased from 103Ha in 2015 to 147Ha
representing a 43percent growth. The quantity produced also increased from 551 tons in 2015 to 581
tons in 2016 while the value increased from Kshs12.99 Billion to Kshs13.91 Billion in 2016 representing 5
percent and 7 percent growth respectively. Custard apple popularity has increased in the resent past
due to the health benefits associated with its consumption.
Table 69: Production of Custard apple in selected Counties 2015-2016
COUNTY 2015 2016 % of Total Value AREA
(HA) VOLUME
(Tons) VALUE(KES) AREA
(HA) VOLUME
(Tons) VALUE(KES)
Taita Taveta 52 280 8,167,200 58 257 7,241,300 52.1
Elgeyo Marakwet 8 85 1,572,000 12 79 1,708,004 12.3
Nandi 1 8 262,500 3 33 1,360,000 9.8
Nakuru 5 20 614,000 14 37 1,120,000 8.1
Kilifi 14 35 1,015,000 38 35 725,013 5.2
Trans Nzoia 3 12 120,000 3 30 600,000 4.3
Tharaka Nithi 4 4 300,000 2 4 300,000 2.2
Samburu 1 5 250,000 2 6 300,000 2.2
Vihiga 3 2 220,000 3 3 220,000 1.6
Laikipia 2 4 123,000 2 4 123,000 0.9
Kakamega 2 11 108,000 2 13 120,000 0.9
Makueni 8 80 80,000 8 80 80,000 0.6
Kisumu 0 1 12,600 0 1 12,600 0.1

51
Others 1 5 150,000 1 5 140,000 1.0
Total 103 552 12,994,300 147 581 13,909,917 100.0
3.1.13 Loquats (Eriobotrya japonica) Loquat is mainly grown for household consumption and a little surplus finds its way to the local market.
In 2015 the area under loquat was 177 Ha which increased to 238Ha in 2016 representing a 34percent
increase. Production increased from 689 tons in 2015 to 965 tons representing a 40 percent rise while
the value increased by 98 percent. The major counties in production of loquat by value were Bungoma,
kisii, Uasian Gishu and Makueni accounting for 33 percent, 17 percent and 10 percent of the country’s
total value. The major constraints to increased production of loquat are prevalence of insect pests and
diseases, high postharvest losses, lack of suitable varieties and unavailability of quality planting material.
Table 70: Production of Loquats in selected counties 2015-2016
COUNTY 2015 2016 % of Total
Value AREA (HA)
VOLUME (Tons)
VALUE(KES) AREA (HA)
VOLUME (Tons)
VALUE(KES)
Bungoma 6 17 170,000 6 18 7,630,000 33.4
Kisii 37 83 2,540,000 46 148 3,960,000 17.3
Uasin Gishu 7 29 2,801,600 7 25 2,241,280 9.8
Makueni 37 73 1,080,000 35 139 2,088,000 9.1
Meru 16 60 745,000 46 171 1,487,000 6.5
Kiambu 17 189 1,363,364 17 75 1,462,000 6.4
Machakos 2 6 180,000 12 66 800,000 3.5
Vihiga 8 16 164,000 14 56 568,000 2.5
Kakamega 18 124 908,000 19 86 560,000 2.5
Nandi 2 4 400,000 2 4 450,000 2.0
Nakuru 5 33 368,000 8 63 432,000 1.9
Kericho 1 8 208,000 1 15 390,000 1.7
Kirinyaga 2 3 200,000 2 18 360,000 1.6
Nyeri 8 29 128,100 8 30 131,300 0.6
Laikipia 6 5 100,000 6 5 100,000 0.4
Others 5 10 159,000 9 46 188,000 0.8
Total 177 689 11,515,064 238 965 22,847,580 100.0
3.1.14 White sapote (Casimiroa edulis) White sapote is mainly grown in the high and medium altitudes areas of the country. During the year
under review, the area increased from 27Ha to 39Ha representing a 44 percent growth. The production
and value also increased from 112 tons in 2015 to 155 tons in 2016 while the value increased from
Kshs2.6M to Kshs4.3M representing 38percent and 65percent growth respectively. The increase in area
production and value could be attributed to more of awareness on the crop and marketing. The major
counties in production of white sapote were Narok, Meru and Elgeyo Marakwet accounting for 27

52
percent, 21 percent and 20 percent of the country’s total value. The major constraint to increased
production of white sapote are lack of suitable varieties, unavailability of quality planting material and
limited knowledge on appropriate agronomic practices.
Table 71: Production of white sapote in selected counties 2015-2016
COUNTY 2015 2016 % of Total Value
AREA (HA)
VOLUME (Tons)
VALUE(KES) AREA (HA)
VOLUME (Tons)
VALUE(KES)
Narok 12 36 520,000 10 30 1,164,000 26.7
Elgeyo Marakwet 3 16 790,000 8 18 899,554 20.7
Meru 2 18 840,000 2 18 870,000 20.0
Trans Nzoia 0 - - 3 28 500,000 11.5
Kakamega 4 25 296,364 4 27 340,000 7.8
Nandi - - - 2 20 210,000 4.8
Nakuru - - - 1 3 150,000 3.4
Bungoma 2 6 60,000 2 6 120,000 2.8
Vihiga 3 10 103,000 7 5 70,000 1.6
Laikipia 1 2 31,000 1 2 31,000 0.7
TOTAL 27 112 2,640,364 39 155 4,354,554 100.0
3.1.15 Apples (Malus domestica) Apples are grown by smallholder farmers for the domestic market. During the year under review, apple
had mixed performance. The area increased from 56Ha to 79Ha while production increased from 589
tons to 623 tons representing 41perccent and 6percent increases. This was attributed to promotion of
the crop and some young orchards reaching production stage. However, the value decreased from
Kshs42.5M to Kshs34.3M representing 19 percent drop which was as a result of reduced farm gate
prices due to cheap imports. The major counties in production of apple were Kiambu, Narok, and
Nakuru accounting for 36.7, 32.0 and 15.6percent of the total county’s value. The major constraint to
increased production of apple is unavailability of quality and appropriate planting materials.
Table 72: Production of Apples in selected counties 2015-2016
COUNTY 2015 2016 % of Total Value
AREA (HA)
VOLUME (Tons)
VALUE(KES) AREA (HA)
VOLUME (Tons)
VALUE(KES)
Kiambu 7 156 10,800,000 10 174 12,600,000 36.7
Narok 20 215 13,250,000 16 171 11,000,000 32.0
Nakuru 15 100 16,260,000 23 116 5,377,501 15.6
Nyandarua 8 104 1,877,145 24 148 4,498,145 13.1
Nyeri 2 1 90,000 2 3 450,000 1.3

53
Trans Nzoia 1 5 50,000 1 5 250,000 0.7
Uasin Gishu 1 3 130,260 1 2 104,208 0.3
Laikipia 1 4 80,000 1 4 80,000 0.2
West Pokot 2 0 5,000 2 0 5,000 0.01
Total 56 589 42,542,405 79 623 34,364,854 100.0
3.1.16 Plums (Prunus domestica) Plum is grown mostly for domestic fresh and processing markets. During the year under review, the area
under production increased from 174Ha in the year 2015 to 211 Ha in 2016 representing a 21 percent
increase. Production also increased from 1,826 tons to 1,952 tons representing 7 percent growth while
the value increased from Kshs29.40M to Kshs29.93M representing a growth of 2percent. The major
counties in production of plum by value were Kiambu 41.6percent, Nyandarua 18.9percent, Narok 17.1
percent and Nakuru 16.7percent respectively.
Table 73: Production of Plums in selected counties 2015-2016
COUNTY 2015 2016 % of Total Value
AREA (HA)
VOLUME (Tons)
VALUE(KES) AREA (HA)
VOLUME (Tons)
VALUE(KES)
Kiambu 47 513 17,937,500 41 318 12,440,000 41.6
Nyandarua 56 767 4,122,400 59 812 5,665,400 18.9
Nakuru 36 395 3,967,860 46 509 5,110,001 17.1
Narok 5 30 1,500,000 28 191 5,000,000 16.7
Elgeyo Marakwet 8 24 887,000 16 23 835,000 2.8
Taita Taveta 6 60 600,000 6 60 600,000 2.0
Trans Nzoia 1 4 36,000 1 10 100,000 0.3
Laikipia 1 5 70,000 1 5 70,000 0.2
Murang’a 10 14 192,920 6 14 59,105 0.2
Nyeri 3 6 90,000 4 3 45,000 0.2
West Pokot - - - 1 1 5,000 .017
Uasin Gishu 1 9 476 2 8 381 .001
TOTAL 174 1,826 29,404,156 211 1,952 29,929,886 100.0
3.1.17 Pears (Pyrus communis) Pears are mainly grown for the domestic market. The production during the reporting year was 1,775
tons with a value of Ksh43.1 Million. The area under production reduced from 354Ha in 2015 to 254Ha
in 2016 representing a 28 percent decrease while production dropped from 4,333 tons in 2015 to 4,272
tons in 2016 representing a 1 percent decrease. Despite the drop in area and production, the value
increased by 6percent due to the increased farm gate prices in the major producing areas.
The major counties in production of pears were Nakuru, Kiambu and Narok that accounted for 41
percent, 33 percent and 13 percent respectively of the county’s total value. The major constraint to

54
increased production of pears is unavailability of quality planting material and limited knowledge on
appropriate agronomic practices on the part of smallholder farmers.
Table 74: Production of Pears in selected counties 2015-2016
COUNTY 2015 2016 % of Total Value
AREA (HA)
VOLUME (Tons)
VALUE(KES) AREA (HA)
VOLUME (Tons)
VALUE(KES)
Nakuru 29 1,356 26,625,038 42 1,895 37,640,002 40.6
Kiambu 119 1,545 38,944,000 120 1,194 30,582,500 33.0
Narok 14 138 1,663,636 18 186 12,140,000 13.1
Nyandarua 63 1,042 16,317,500 38 765 8,419,500 9.08
Taita Taveta 110 130 1,300,000 11 110 1,300,000 1.40
Murang’a 6 66 1,248,899 6 65 1,203,007 1.30
Elgeyo Marakwet 10 36 1,044,000 16 33 1,016,241 1.10
Laikipia 1 8 130,000 1 8 130,000 0.14
Uasin Gishu 1 5 150,300 1 4 120,240 0.13
Trans Nzoia 1 5 48,000 1 10 100,000 0.11
Nyeri 1 2 40,000 1 2 40,000 0.04
TOTAL 354 4,333 87,511,374 254 4,272 92,691,490 100.0
4 CHAPTER FOUR
4.1 Nuts and Oils
The area under nuts and oils increased from 81,000Ha to 89,420Ha in 2016 but production and value
decreased from 169,321 tons to 147,928tons representing a 13 percent decrease and Kshs6.14Bilions to
Kshs5.79Billions respectively which was a 57 percent decrease in 2016. The main nuts that experienced
a significant drop were Macadamia, groundnuts and Cashew nuts with coconuts and Bambara nuts
showing some growth.
Table 75: Summary of the Performance of nuts and oils for the years 2015-2016
Crop
Year 2015 Year 2016 % of Total Value
Area (Ha)
Volume ( MT )
Value (KES) Area (Ha)
Volume (MT
Value ( KES)
Coconuts 43,404 107,340 1,862,232,954 47,401 93,626 1,965,502,566 34
Macadamia 2,946 22,833 1,634,880,847 2,587 21,175 1,560,590,360 27
Groundnuts 10,040 14,754 1,503,855,313 9,417 11,956 1,262,809,833 22
Cashew nut 24,466 23,493 1,056,308,294 29,837 20,033 908,018,651 16
Bambara 145 902 85,200,250 178 1,138 96,252,000 2
Total 81,000 169,321 6,142,477,658 89,420 147,928 5,793,173,410 100

55
4.1.1 Coconut (Cocos nucifera) Coconut is multipurpose tree grown for various use among them the nuts, roofing materials as well as
timber. Coconuts accounted for 34percent by value of all nuts and oils making it the leading in this
category. The area under production increased from 43,404ha in 2015 to 47,401ha in 2016 representing
a 9percent increase, but production reduced from 107,340MT in 2015 to 93,636MT in 2016 representing
13percent decrease due to the poor rains experienced in the producing areas. The value of the nuts
increased from Kshs1, 862,232,954 in 2015 to Kshs1, 965,502,566 in 2016 representing 6 percent due to
good farm gate prices as a result of high demand couples with reduced volumes.
Table 76: Performance of Coconuts in selected counties for the years 2015-2016
County
Year 2015 Year 2016 % of Total Value
Area (Ha)
Volume ( MT )
Value (KES) Area (Ha)
Volume (MT
Value ( KES)
Kilifi 23,375 56,924 1,232,123,354 27,217 54,313 1,237,649,966 62.97
Kwale 14,484 40,890 480,180,000 14,361 30,821 515,393,000 26.22
Lamu 4,954 8,650 136,275,000 5,215 7,444 189,450,000 9.64
Taita Taveta 48 285 2,380,000 96 474 9,484,000 0.48
Tana River 410 410 8,200,000 389 389 8,380,000 0.43
Mombasa 100 150 2,500,000 102 153 4,590,000 0.23
Bungoma 21 23 430,000 9 24 400,000 0.02
Busia 12 7 127,600 12 7 127,600 0.006
Kakamega 0 1 17,000 0 1 28,000 0.001
Total 43,404 107,340 1,862,232,954 47,401 93,626 1,965,502,566 100.00
4.1.2 Macadamia (Macadamia integrifolia) Macadamia are normally grown in the marginal and main coffee zones and are mainly grown for their
precious nuts that are used as whole nuts as well as with various confectionaries.
During the year under review the total value of macadamia was Kshs1.56Billion accounting for 27
percent of all nuts and oils. The area under nuts production decreased from 2,946Ha to 2,587Ha
representing a decrease of 12 percent, the production decreased from 22,833MT to 21,175MT,
representing a 7percent decrease.
The value of decreased by 5percent as compared to 2015. This was attributed to low prices in the
international market that account for more than 90 percent of Kenya’s macadamia market.

56
Table 77: Performance of Macadamia counties for the years 2015-2016
County
Year 2015 Year 2016 % of Total Value
Area (Ha)
Volume ( MT )
Value (KES) Area (Ha)
Volume (MT
Value ( KES)
Embu 375 4,875 429,000,000 375 6,000 570,000,000 36.5
Murang’a 393 2,772 210,862,909 405 3,776 267,972,700 17.17
Meru 598 6,138 428,713,320 364 3,156 183,994,800 11.79
Machakos 100 1,744 104,071,500 127 2,004 121,079,000 7.76
Kiambu 269 1,893 119,092,158 273 1,469 109,266,000 7.00
Nyeri 263 1,490 109,240,000 346 1,593 90,076,900 5.77
Tharaka Nithi 210 1,045 79,500,000 210 1,115 86,500,000 5.54
Kirinyaga 171 710 56,350,000 119 875 68,550,000 4.39
Baringo 282 659 34,923,960 295 681 36,763,960 2.36
Trans Nzoia 13 162 12,720,000 14 166 13,960,000 0.89
Taita Taveta 257 1,305 47,165,000 46 253 7,590,000 0.49
Bungoma 3 31 1,510,000 2 62 3,100,000 0.20
Nandi 3 2 1,000,000 3 18 990,000 0.06
Laikipia 6 4 520,000 7 4 525,000 0.03
Kakamega 2 2 192,000 1 2 192,000 .012
Elgeyo Marakwet 2 1 20,000 2 1 30,000 .002
Total 2,946 22,833 1,634,880,847 2,587 21,175 1,560,590,360 100.0
4.1.3 Ground nuts (Arachis hypogaea) Ground nuts are normally produced for household consumption with the surplus finding its way to the
market. During the year 2016, the area was 9,417Ha which was a 6percent reduction compared with
10,040Ha in 2015. The quantity produced decreased from 14,754 Ha in 2015 to 11,956Ha in 2016, a
decrease of 19percent. The value of the crop dropped from Kshs1.50Bilion to Kshs1.26Bilion
representing 16 percent drop as compared to the year 2015. This was attributed to poor rains
experienced during the under review as groundnuts are produced under rain fed conditions.
Table 78: Performance of Ground nuts in selected counties for the years 2015-2016
County
Year 2015 Year 2016 % of Total Value
Area (Ha)
Volume ( MT )
Value (KES) Area (Ha)
Volume (MT
Value ( KES)
Kisumu 1,625 2,546 365,159,999 1,770 2,280 312,063,772 24.7
Homa Bay 2,034 1,821 183,328,860 2,010 1,815 181,005,400 14.3
Busia 1,030 1,266 144,498,000 1,068 1,327 149,364,000 11.8
Kakamega 1,371 2,266 261,278,500 659 1,583 128,344,000 10.2
Elgeyo Marakwet 57 126 10,702,222 380 934 93,756,666 7.4

57
Bungoma 1,041 1,655 104,839,000 424 653 80,260,000 6.4
Baringo 582 601 72,800,000 531 655 78,090,000 6.2
Tharaka Nithi 250 405 50,000,000 250 450 50,000,000 4.0
Meru 283 792 55,305,000 247 707 46,070,000 3.6
Siaya 650 438 41,934,000 720 395 32,369,000 2.6
Migori 314 679 55,306,700 720 225 19,980,040 1.6
Kwale 57 405 22,698,000 63 208 19,579,000 1.6
Kisii 218 145 13,429,600 233 192 16,426,350 1.3
Vihiga 110 155 12,677,182 111 133 13,838,000 1.1
Lamu 78 810 42,430,000 81 68 9,990,000 0.8
Trans Nzoia 10 16 5,000,000 17 27 8,500,000 0.7
West Pokot 39 58 5,500,000 50 93 8,480,000 0.7
Taita Taveta 10 30 3,000,000 41 123 8,430,000 0.7
Tana River 20 64 2,080,000 21 54 2,160,000 0.2
Others 263 476 51,888,250 21 35 4,103,605 0.3
Total 10,040 14,754 1,503,855,313 9,417 11,956 1,262,809,833 100.0
4.1.4 Cashew nuts (Anacardium occidentale) Cashew nuts are mainly in the coast region with a few from other counties neighbouring the coast.
During the year under review, the area increased from 24,466ha to 29,837ha representing a 22 percent
increase as compared to 2015. This was attributed to promotion of the crop by the county government
in the main producing counties. Production and value reduced by 15 percent and 14 percent
respectively as compared to 2015. This was attributed to aging and un-attended orchards as well as low
rainfall during the year 2016. The leading counties were Lamu, Kilifi and Kwale accounting for 98 percent
by value of the country’s total.
Table 79: Performance of Cashew nuts in selected counties for the years 2015-2016
County
Year 2015 Year 2016 % of Total Value
Area (Ha)
Volume ( MT )
Value (KES) Area (Ha)
Volume (MT
Value ( KES)
Lamu 7,878 6,385 321,021,000 8,293 6,680 376,900,000 41.51
Kilifi 7,439 8,843 404,594,664 13,536 7,900 315,044,938 34.70
Kwale 8,710 7,512 300,480,000 7,610 4,698 187,920,000 20.70
Tharaka Nithi 135 546 21,788,930 135 547 20,614,213 2.27
Tana River 280 140 6,300,000 240 150 5,650,000 0.62
Meru 16 59 1,822,200 16 50 1,558,000 0.17
Busia 1 3 165,000 1 3 195,000 0.02
Taita Taveta 7 4 136,500 7 4 136,500 0.02
Total 24,466 23,493 1,056,308,294 29,837 20,033 908,018,651 100.0

58
4.1.5 Bambara nuts (Vigna subterranean)
Bambara nuts are mainly produced in the western part of the country that account for 95 percent of the
total production with the rest coming from the coast region. During the area under review, the area for
production increased from 145ha to 178ha in 2016, production volume increased from 902MT to
1,138MT in 2016. The area, production and value increased by 23percent, 26percent and 13percent
respectively compared with 2015. The main producing county was Kakamega, which recorded the
highest growth of 49percent in area and production and 21percent in value.
Table 80: Performance of Bambara Nuts in selected counties for the years 2015-2016
County
Year 2015 Year 2016 % of Total Value
Area (Ha)
Volume ( MT )
Value (KES) Area (Ha)
Volume (MT
Value ( KES)
Busia 58 215 30,625,000 55 205 27,185,000 30.4
Kakamega 91 811 66,647,000 61 646 54,925,250 61.4
Kwale 10 60 3,600,000 10 100 6,000,000 6.7
Bungoma 6 4 530,000 6 4 600,000 0.7
Lamu 5 5 450,000 5 4 360,000 0.4
Vihiga 6 30 340,000 5 22 310,000 0.3
Mombasa 2 4 98,000 2 3 90,000 0.1
Total 178 1,129 102,290,000 144 984 89,470,250 100.0

59
5 ANNEX 1
5.1 NATIONAL SUMMARY
Table 81: Horticulture production performance by county 2015-2016
COUNTY 2015 2016 % of Total
Volume AREA (HA)
VOLUME (Tons)
VALUE(KES) AREA (HA)
VOLUME (Tons)
VALUE(KES)
Meru 26,061 518,035 10,842,633,508 28,217 546,254 11,700,579,770 8.04
Murang'a 23,952 507,409 10,383,433,390 23,661 525,331 11,185,857,391 7.69
Nyandarua 60,976 942,197 11,492,297,804 58,776 914,918 10,198,633,311 7.01
Kiambu 37,260 581,008 11,244,434,197 34,691 477,507 9,350,529,235 6.42
Nyeri 26,516 470,419 8,729,687,853 26,836 454,809 8,544,669,383 5.87
Nakuru 55,993 675,903 7,750,596,697 54,374 630,207 7,939,395,312 5.46
Machakos 21,066 289,148 5,751,266,499 20,686 308,949 6,910,030,728 4.75
Kirinyaga 13,475 231,731 5,379,433,704 16,253 251,464 5,842,328,140 4.01
Makueni 22,396 297,281 5,363,838,625 23,386 312,599 5,826,916,683 4.00
Elgeyo Marakwet 19,132 420,540 5,031,403,941 23,280 401,084 5,688,277,880 3.91
Kilifi 59,835 338,063 6,191,382,994 58,932 248,963 4,958,137,141 3.41
Narok 12,525 188,934 3,732,490,570 22,067 265,588 4,672,677,891 3.21
Kisii 11,580 194,368 3,479,868,390 12,583 220,914 4,305,377,490 2.96
Embu 5,695 162,410 3,076,756,580 10,070 182,854 4,089,219,000 2.81
Taita Taveta 6,469 131,928 2,174,646,950 7,671 174,313 3,814,191,855 2.62
Bungoma 12,105 158,654 4,106,264,615 9,527 153,228 3,790,687,935 2.60
Kwale 37,983 282,911 5,024,470,500 36,157 196,494 3,376,287,804 2.32
Lamu 20,225 215,293 3,269,140,425 21,289 192,584 3,184,663,413 2.19
Bomet 8,251 150,697 2,895,245,756 8,775 177,797 2,961,825,300 2.04
Kajiado 3,777 80,706 1,943,006,090 4,086 73,120 2,152,101,210 1.48
Laikipia 2,348 57,038 1,935,783,522 3,063 51,286 2,104,225,371 1.45
Tharaka Nithi 7,927 117,419 1,964,037,000 7,388 118,586 2,049,315,750 1.41
Trans Nzoia 3,536 54,060 1,051,274,119 4,509 63,170 1,933,613,958 1.33
Kericho 2,915 119,859 1,836,816,275 3,190 107,732 1,916,391,138 1.32
Homa Bay 9,857 47,614 1,554,020,646 9,796 55,342 1,745,431,556 1.20
Siaya 2,531 78,308 2,643,990,695 8,432 58,036 1,688,934,500 1.16
Kisumu 4,544 42,110 1,652,637,306 4,699 38,999 1,668,809,109 1.15
Nyamira 5,488 84,185 1,925,658,700 7,901 120,266 1,536,986,962 1.06
Kakamega 9,185 73,068 1,843,000,568 9,022 61,263 1,420,412,670 0.98
Tana River 5,630 79,069 1,359,683,000 5,302 77,012 1,382,780,000 0.95
Migori 11,152 154,963 2,837,423,318 13,975 111,854 1,254,257,077 0.86
Nandi 3,289 55,131 1,208,754,608 3,661 67,160 1,068,512,458 0.73
Busia 4,343 30,695 1,155,064,825 4,978 34,499 1,005,930,101 0.69
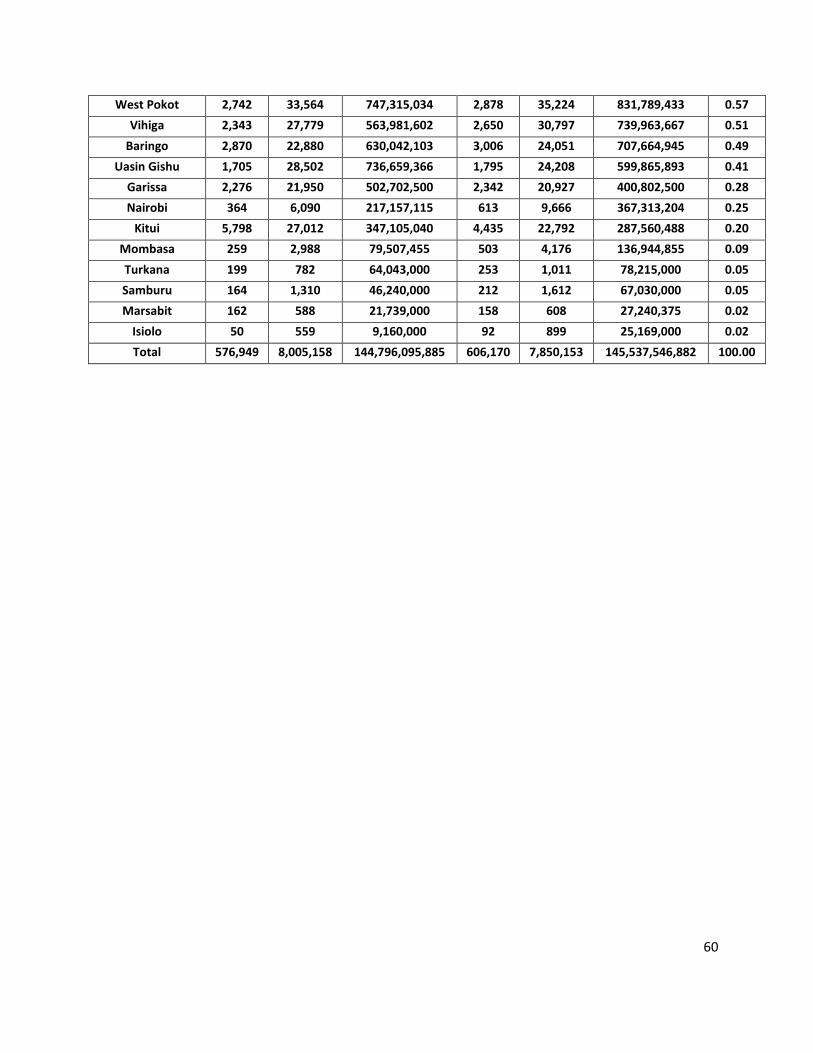
60
West Pokot 2,742 33,564 747,315,034 2,878 35,224 831,789,433 0.57
Vihiga 2,343 27,779 563,981,602 2,650 30,797 739,963,667 0.51
Baringo 2,870 22,880 630,042,103 3,006 24,051 707,664,945 0.49
Uasin Gishu 1,705 28,502 736,659,366 1,795 24,208 599,865,893 0.41
Garissa 2,276 21,950 502,702,500 2,342 20,927 400,802,500 0.28
Nairobi 364 6,090 217,157,115 613 9,666 367,313,204 0.25
Kitui 5,798 27,012 347,105,040 4,435 22,792 287,560,488 0.20
Mombasa 259 2,988 79,507,455 503 4,176 136,944,855 0.09
Turkana 199 782 64,043,000 253 1,011 78,215,000 0.05
Samburu 164 1,310 46,240,000 212 1,612 67,030,000 0.05
Marsabit 162 588 21,739,000 158 608 27,240,375 0.02
Isiolo 50 559 9,160,000 92 899 25,169,000 0.02
Total 576,949 8,005,158 144,796,095,885 606,170 7,850,153 145,537,546,882 100.00

61
HORTICULTURAL CROPS DIRECTORATE
Nairobi Horticultural Centre next to JKIA
P.O BOX 42601 - 00100, NAIROBI
Telephone 020 - 2088469, 020-2131560
Email: [email protected]
Website: www.agricultureauthority.go.ke