Embed Size (px)
Citation preview
Validating ESeC using Round 1 of the European Social Survey
ESeC Validation Conference, Lisbon, January 2006
Eric Harrison & David Rose
ISER, University of Essex
Starting Point
• Early versions of ESeC drew on questions asked about employment relations in UK LFS used to validate NS-SEC
• Advantage – both NS-SEC and ESeC use same conceptual grounding (i.e. ‘EGP’)
• Disadvantage – time lapse (1996-97 to 2004)– Enlarged and heterogeneous European area
Three Definitions of Validity
• Criterion – does it measure what it purports to measure?
• Construct – does it predict the kinds of things it ought to predict?
• ‘Operational’ – does it work?
European Social Survey
• Round 1 used here (Round 2 now available, Round 3 in progress)
• 22 countries, 42,359 cases
• Most or all of the information needed to make an ESeC (i.e. 3 or 4 digit ISCO, supervision, establishment size)

The Treatment of Employment Status
• Self-employed, managers, supervisors, employees
• No problem with self-employed:– Exception Norway where self-employed have no
occupational information. Solution – small employers to class 4, large employers to class 1.
– Family workers (small N) treated as employees
• Supervision• Management
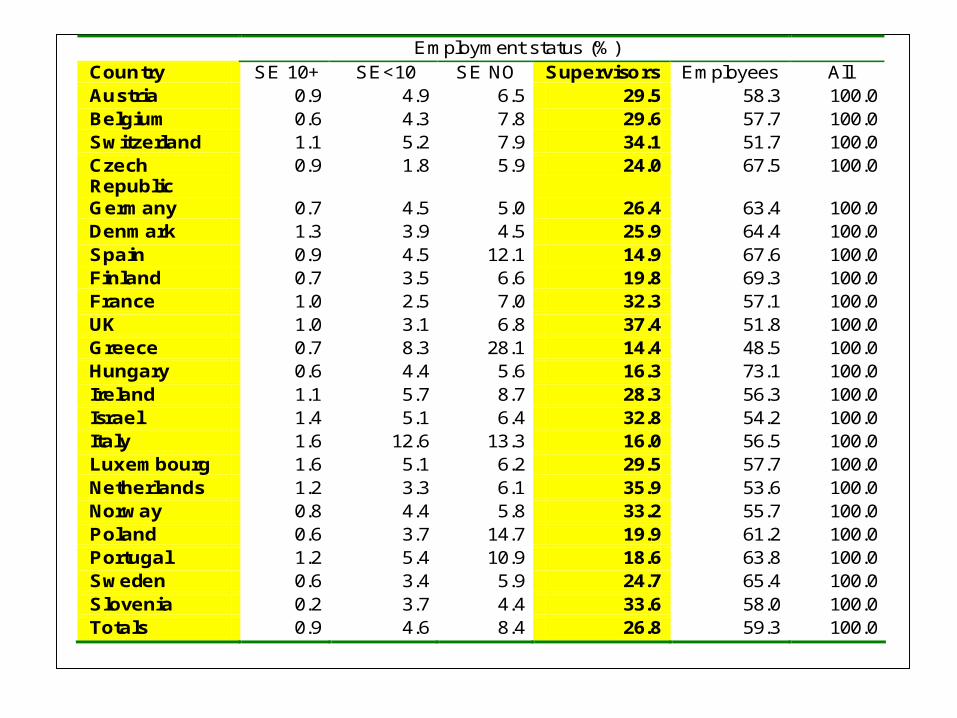
Employment status (%) Country SE 10+ SE<10 SE NO Supervisors Employees All Austria 0.9 4.9 6.5 29.5 58.3 100.0 Belgium 0.6 4.3 7.8 29.6 57.7 100.0 Switzerland 1.1 5.2 7.9 34.1 51.7 100.0 Czech Republic
0.9 1.8 5.9 24.0 67.5 100.0
Germany 0.7 4.5 5.0 26.4 63.4 100.0 Denmark 1.3 3.9 4.5 25.9 64.4 100.0 Spain 0.9 4.5 12.1 14.9 67.6 100.0 Finland 0.7 3.5 6.6 19.8 69.3 100.0 France 1.0 2.5 7.0 32.3 57.1 100.0 UK 1.0 3.1 6.8 37.4 51.8 100.0 Greece 0.7 8.3 28.1 14.4 48.5 100.0 Hungary 0.6 4.4 5.6 16.3 73.1 100.0 Ireland 1.1 5.7 8.7 28.3 56.3 100.0 Israel 1.4 5.1 6.4 32.8 54.2 100.0 Italy 1.6 12.6 13.3 16.0 56.5 100.0 Luxembourg 1.6 5.1 6.2 29.5 57.7 100.0 Netherlands 1.2 3.3 6.1 35.9 53.6 100.0 Norway 0.8 4.4 5.8 33.2 55.7 100.0 Poland 0.6 3.7 14.7 19.9 61.2 100.0 Portugal 1.2 5.4 10.9 18.6 63.8 100.0 Sweden 0.6 3.4 5.9 24.7 65.4 100.0 Slovenia 0.2 3.7 4.4 33.6 58.0 100.0 Totals 0.9 4.6 8.4 26.8 59.3 100.0
Does Size Matter?
• Potential contradictions between OUG and employment status variable
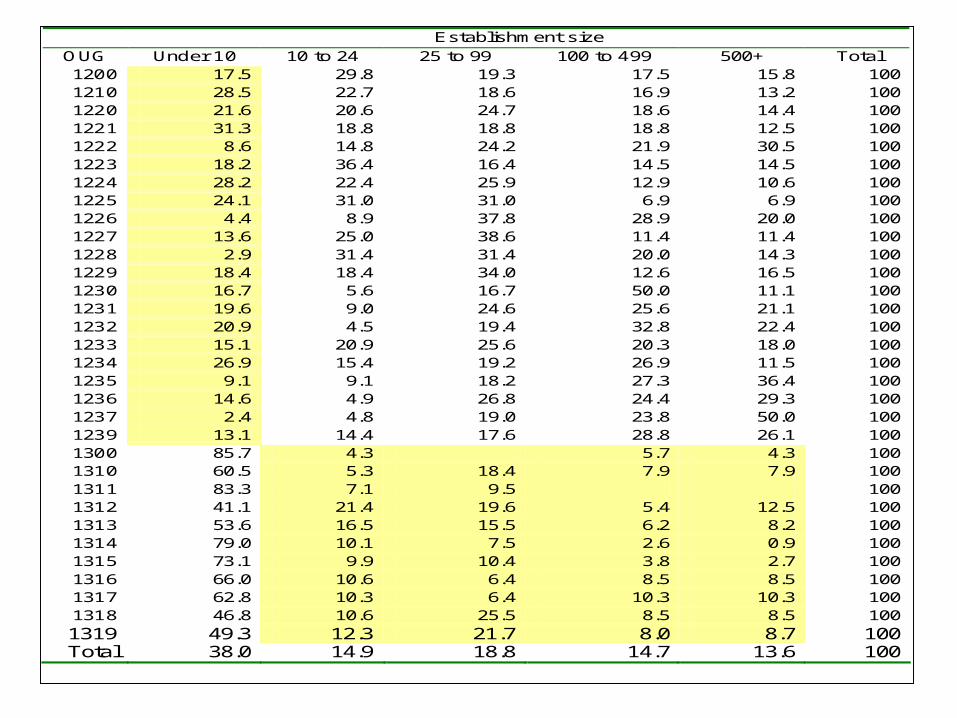
Establishment size OUG Under 10 10 to 24 25 to 99 100 to 499 500+ Total 1200 17.5 29.8 19.3 17.5 15.8 100 1210 28.5 22.7 18.6 16.9 13.2 100 1220 21.6 20.6 24.7 18.6 14.4 100 1221 31.3 18.8 18.8 18.8 12.5 100 1222 8.6 14.8 24.2 21.9 30.5 100 1223 18.2 36.4 16.4 14.5 14.5 100 1224 28.2 22.4 25.9 12.9 10.6 100 1225 24.1 31.0 31.0 6.9 6.9 100 1226 4.4 8.9 37.8 28.9 20.0 100 1227 13.6 25.0 38.6 11.4 11.4 100 1228 2.9 31.4 31.4 20.0 14.3 100 1229 18.4 18.4 34.0 12.6 16.5 100 1230 16.7 5.6 16.7 50.0 11.1 100 1231 19.6 9.0 24.6 25.6 21.1 100 1232 20.9 4.5 19.4 32.8 22.4 100 1233 15.1 20.9 25.6 20.3 18.0 100 1234 26.9 15.4 19.2 26.9 11.5 100 1235 9.1 9.1 18.2 27.3 36.4 100 1236 14.6 4.9 26.8 24.4 29.3 100 1237 2.4 4.8 19.0 23.8 50.0 100 1239 13.1 14.4 17.6 28.8 26.1 100 1300 85.7 4.3 5.7 4.3 100 1310 60.5 5.3 18.4 7.9 7.9 100 1311 83.3 7.1 9.5 100 1312 41.1 21.4 19.6 5.4 12.5 100 1313 53.6 16.5 15.5 6.2 8.2 100 1314 79.0 10.1 7.5 2.6 0.9 100 1315 73.1 9.9 10.4 3.8 2.7 100 1316 66.0 10.6 6.4 8.5 8.5 100 1317 62.8 10.3 6.4 10.3 10.3 100 1318 46.8 10.6 25.5 8.5 8.5 100 1319 49.3 12.3 21.7 8.0 8.7 100 Total 38.0 14.9 18.8 14.7 13.6 100
Does Size Matter?
• Potential contradictions between OUG and employment status variable
• Want to get impression of accuracy of size coding versus OUG
• So, ignored employment status and allocated ISCO grous 12 and 13 to their ‘simplified class’

Distribution of raw class data
Response Freq % 1 3840 9.07 2 8577 20.25 3 3749 8.85 4 2768 6.53 5 955 2.25 6 3779 8.92 7 3644 8.60 8 3513 8.29 9 6362 15.02
n/a 4219 9.96 refusal 77 0.18
Dk 34 0.08 no answer 842 1.99
Total 42359 100.00
0
5
10
15
20
25
%
1 2 3 4 5 6 7 8 9
class
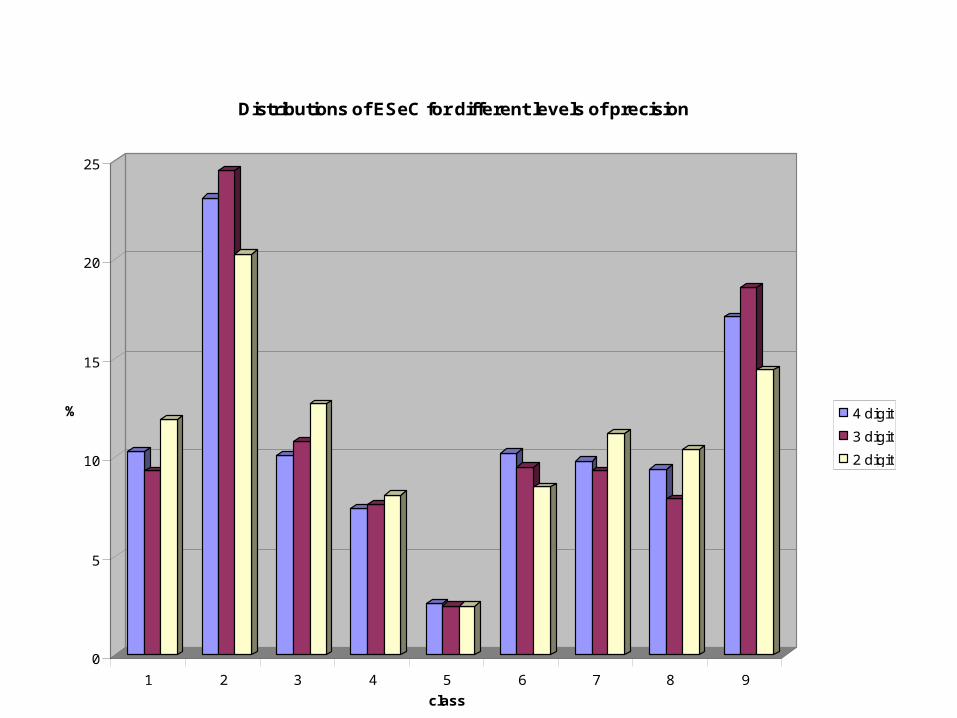
Distributions of ESeC for different levels of precision
4 digit
3 digit
2 digit
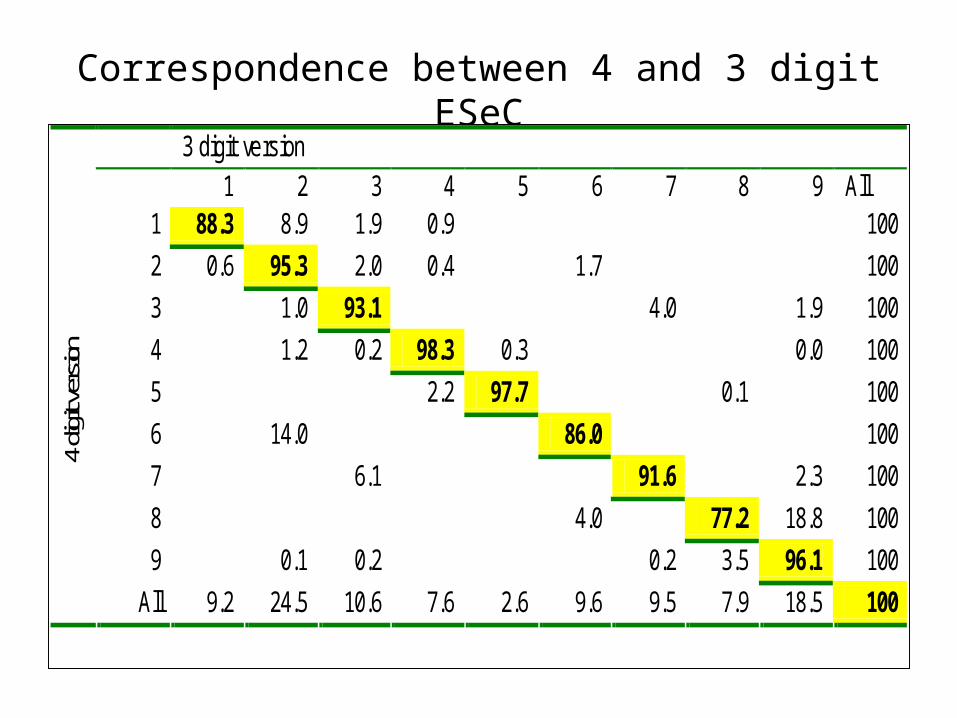
Correspondence between 4 and 3 digit ESeC
3 digit version 1 2 3 4 5 6 7 8 9 All
1 88.3 8.9 1.9 0.9 100
2 0.6 95.3 2.0 0.4 1.7 100
3 1.0 93.1 4.0 1.9 100
4 1.2 0.2 98.3 0.3 0.0 100
5 2.2 97.7 0.1 100
6 14.0 86.0 100
7 6.1 91.6 2.3 100
8 4.0 77.2 18.8 100
9 0.1 0.2 0.2 3.5 96.1 100
4 dig
it ve
rsion
All 9.2 24.5 10.6 7.6 2.6 9.6 9.5 7.9 18.5 100
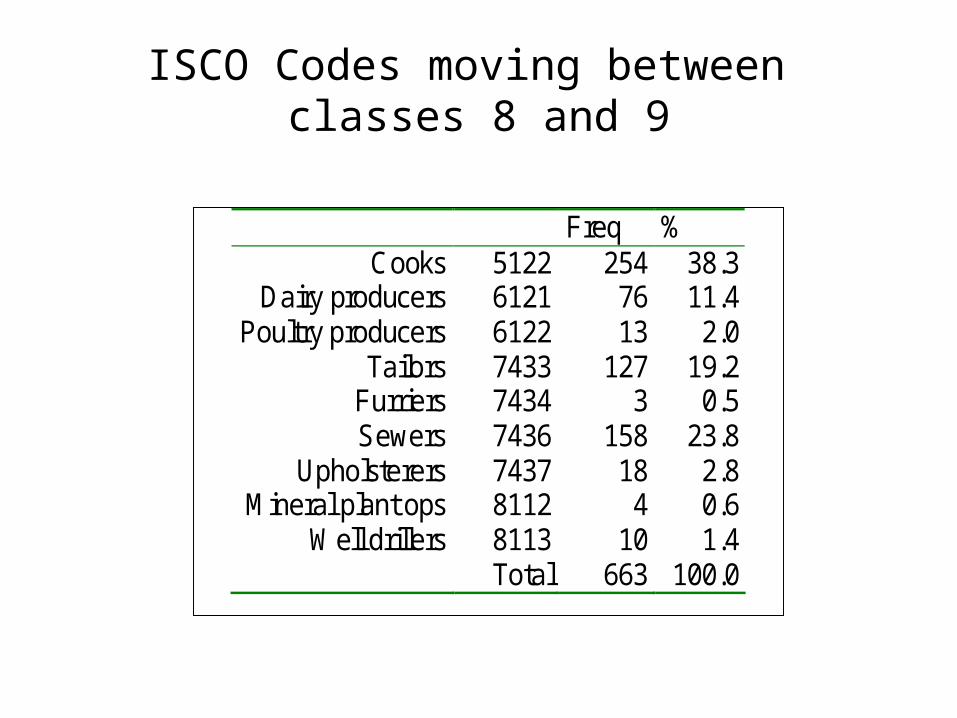
ISCO Codes moving between classes 8 and 9
Freq % Cooks 5122 254 38.3
Dairy producers 6121 76 11.4 Poultry producers 6122 13 2.0
Tailors 7433 127 19.2 Furriers 7434 3 0.5 Sewers 7436 158 23.8
Upholsterers 7437 18 2.8 Mineral plant ops 8112 4 0.6
Well drillers 8113 10 1.4 Total 663 100.0
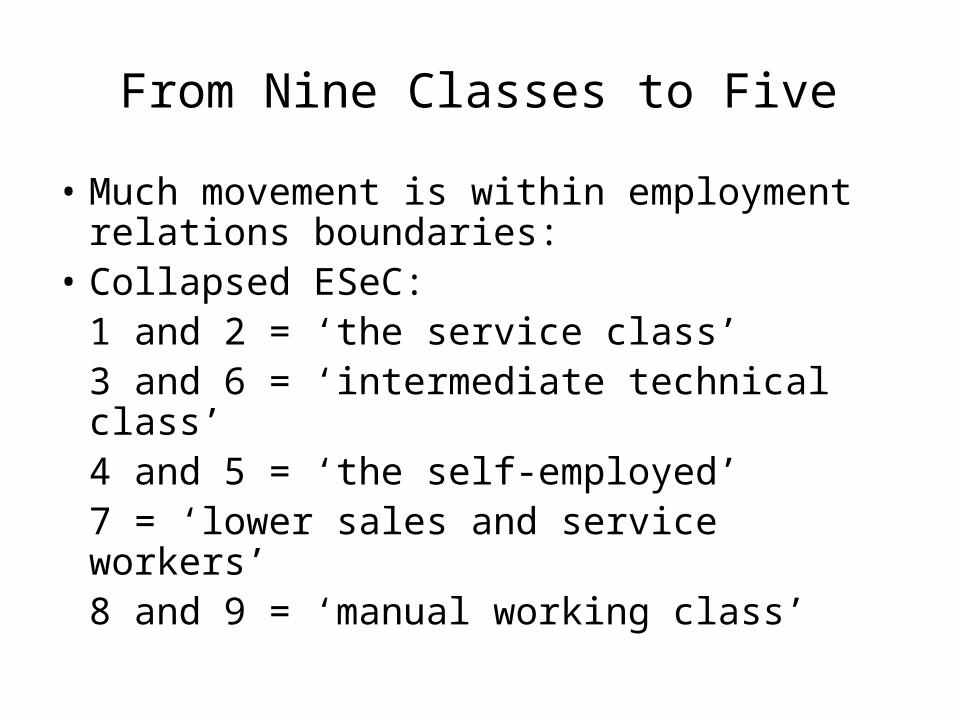
From Nine Classes to Five
• Much movement is within employment relations boundaries:
• Collapsed ESeC:1 and 2 = ‘the service class’3 and 6 = ‘intermediate technical class’4 and 5 = ‘the self-employed’7 = ‘lower sales and service workers’8 and 9 = ‘manual working class’
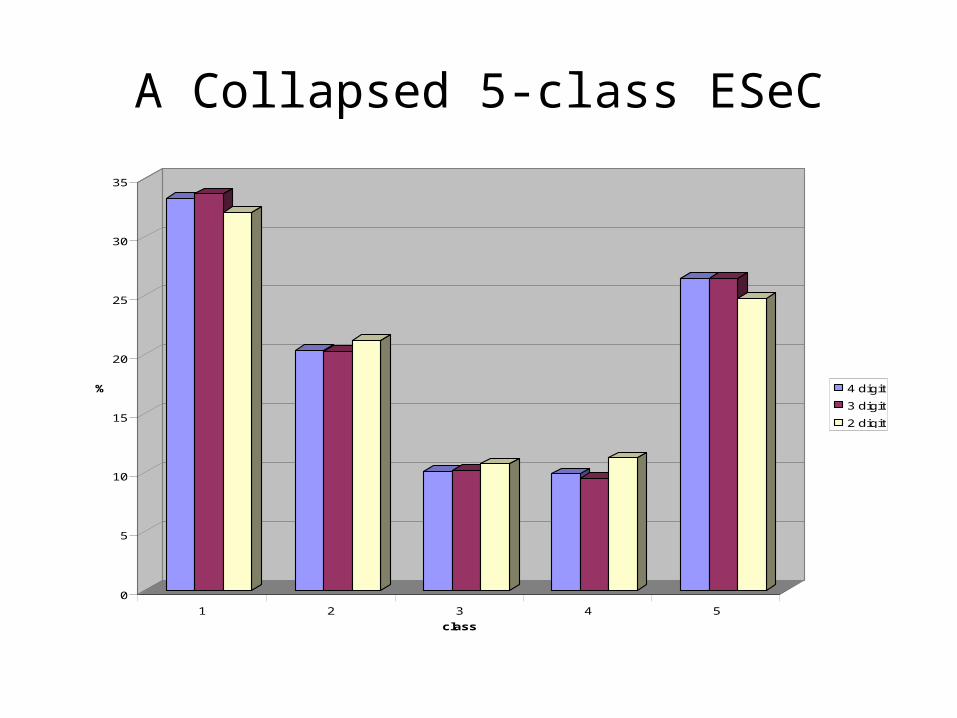
A Collapsed 5-class ESeC
0
5
10
15
20
25
30
35
%
1 2 3 4 5
class
4 digit
3 digit
2 digit

Employment Relations through Work Autonomy (difficulty of monitoring)
The ESS invited respondents to say• ‘how much the management at your work allows
you….• to be flexible in your working hours?• To decide how your own daily work is
organised?• To influence your environment?• To influence decisions about the general
direction of your work?• To change your work tasks if you wish to?
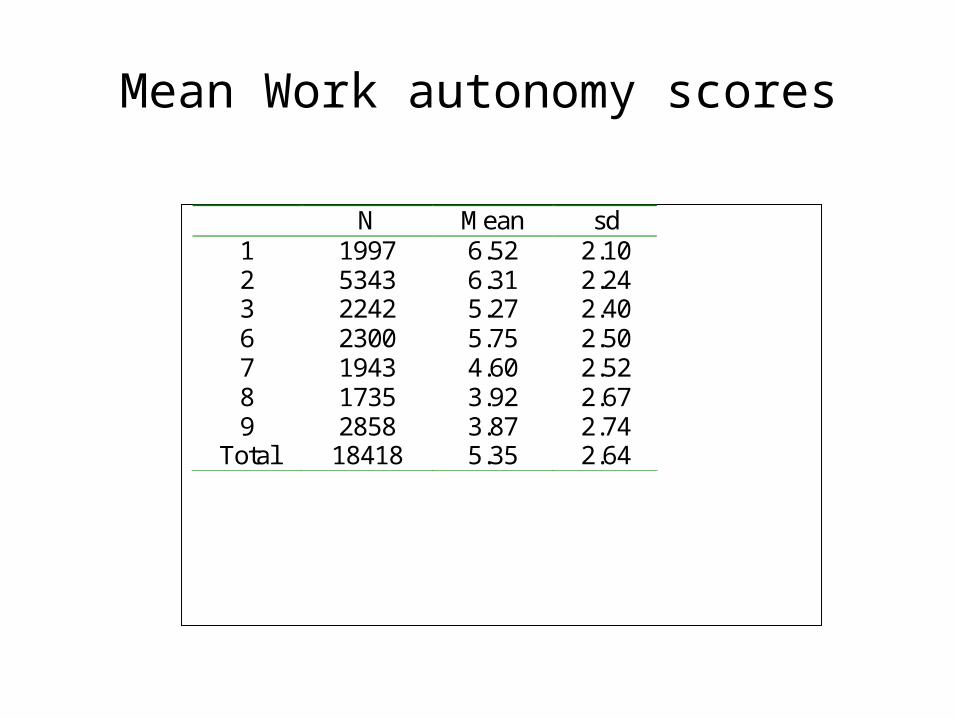
Mean Work autonomy scores
N Mean sd 1 1997 6.52 2.10 2 5343 6.31 2.24 3 2242 5.27 2.40 6 2300 5.75 2.50 7 1943 4.60 2.52 8 1735 3.92 2.67 9 2858 3.87 2.74
Total 18418 5.35 2.64
Effects of Size in Management groups
• Being in group 12 (corporate managers) increased work autonomy score by 0.5 points (statistically significant)
• Being in an ‘establishment’ of 10+ workers had a negative and non-significant effect
• At minor group level, only 123 (specialist managers) have significantly better outcomes than other groups

Distinguishing classes 8 and 9
• Literature on deskilling of ‘lower technical occupations’ through technology and working arrangements
• How wide a phenomenon: How deep?
• Analysis identifies candidate occupations within class 8 and calls them ‘class ten’
• Compare work autonomy scores for classes 8, 9 and 10.
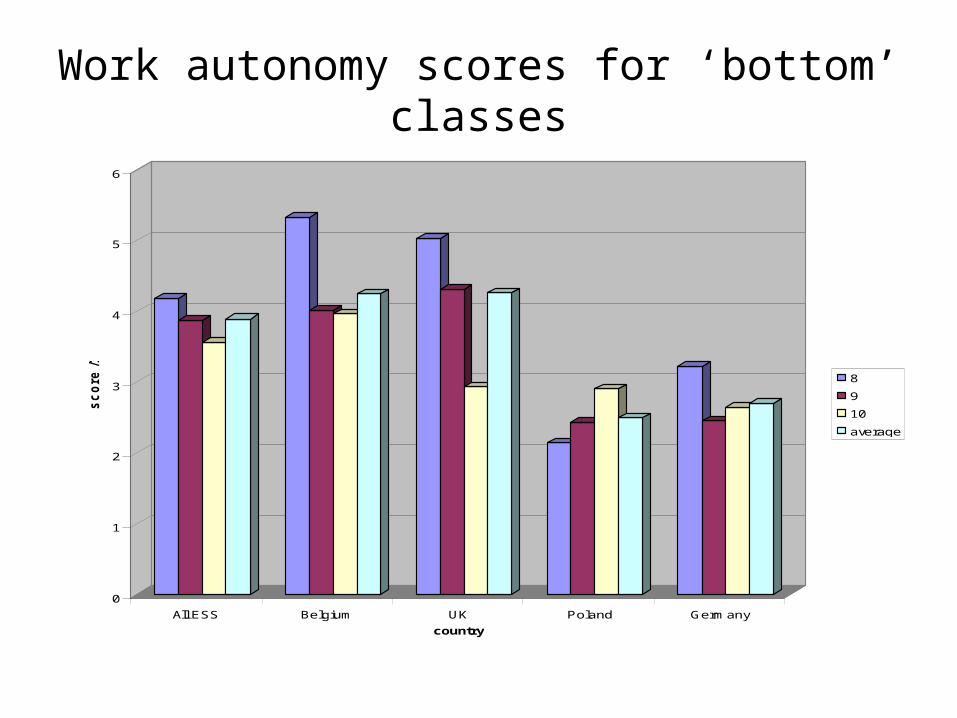
Work autonomy scores for ‘bottom’ classes
0
1
2
3
4
5
6
sc
ore
/1
0
All ESS Belgium UK Poland Germany
country
8
9
10
average

Poor Subjective Health
0
0.5
1
1.5
2
2.5
sc
ore
1-5
1 2 3 4 5 6 7 8 9
class

Next Steps
• Further investigation of ‘country types’ (see Dutch validation)
• Explore round 2 data from European Social Survey
• Assess utility of ESeC in other ISCO-based datasets (International Social Survey Programme)


![Wolfgang Iser [1]](https://img.pdfslide.net/doc/110x75/577d25601a28ab4e1e9ea68a/wolfgang-iser-1.jpg)