Embed Size (px)
Citation preview

Validation Methods
For Reflection Factor High Frequency
NADIA FEZAI, ABDESSATTAR BEN AMOR University of Carthage
Computer Laboratory for Industrial Systems (LISI) National Institute of Applied Sciences and Technology
INSAT Tunis, TUNISIA
[email protected] [email protected] Abstract: - Network analysis is the method by which manufacturers and designers measure the electrical
performance of components and circuits used in more complex systems. When these systems are transmitting signals with information content, we are most concerned with getting the signal from one point to another with minimum distortion and maximum efficiency. Vector network analysis is a method of accurately characterizing such components by measuring their effect on the amplitude and phase of swept-frequency and swept-power test signals. In the field of the measurement of S-parameters using a vector network analyzer, the pertinent question is how to calibrate this measuring device high frequency. In fact, calibration is defined by ISO/CEI 17025 “…set of operations that establish, under specified conditions, the relationship between values of quantities indicated by a measuring instrument or measuring system, or values represented by a material measure or a reference material, and the corresponding values realized by standards.”[1] Indeed, calibration is critical to making good VNA S-parameter measurements by given the matrix and complex nature of the measurand, the frequency range and the range of the potentially measured values. While the VNA is a highly-linear receiver and has sufficient spectral purity in its sources to make good measurements, calibration is not directly feasible then we use the notion of calibration, which is to automatically correct the measurement errors. This calibration then allows resetting the response of the instrument to a true predicted value calculated from the measured raw value and the error coefficients determined by the calibration. This correction made to the meter can then be seen as an improvement in its accuracy. So, the calibration of VNA is a validation method to insure the Traceability to SI according to the parameter reflection factor. The topic of this paper is to present a method of calibration of VNA "1- PORT" in order to quantify the terms of errors systematic and validate the primary method “compensated reflectometer” , enrich the park of calibration methods and to meet requirements of ISO / IEC 17025 (Part7.2.2 validation of methods) [1]. Key-Words: - SOLT; VNA; Reflection Factor; Terms of errors, reflectometer compensate, SI Received: June 13, 2018. Revised: December 11, 2019. Accepted: March 20, 2020. Published: April 2, 2020.
1 Introduction Network analysis is the means by which manufacturers measure electrical performance of the components and circuits used in more complex systems. When these systems are carrying signals with information content, we are most concerned with getting the signal from one point to another with maximum efficiency and minimum distortion. Indeed, the calibration "1-Port" by Vector network analysis is a method to characterize these components by measuring their effect on the amplitude and phase of swept-frequency and swept-power test signals, [2][3]. We will calculate, within this paper, the error terms systematic for this method "One Port" in order to
validate the primary method “Tuned reflectometer” and determinate the resulting curves corrected of the reflection coefficient S11 or Γ. 2 Tuned Reflectometer on coaxial The reflectometric method is the primary method for determining the reflection factor Γ .This method requires the use of a stubs Tuner with directional system. The measurement setup is shown in Fig.1, a detector constituted usually by bolometric mount is connected to the port 3.The tuner is inserted between the generator and the port 2 of coupler. These adjustments require the use of a sliding load and a sliding short.
WSEAS TRANSACTIONS on COMMUNICATIONS DOI: 10.37394/23204.2020.19.10 Nadia Fezai, Abdessattar Ben Amor
E-ISSN: 2224-2864 81 Volume 19, 2020

Fig. 1. : Measurement diagram for reflectometer compensated
With: A1: Stub Tuner 1; A2: Stub Tuner2; VM7: Attenuator and signal calibrator The measurement is taken by means of a directional coupler, the reflection produced by a sliding load. The wave reflected by this charge and getting in the side port of the coupler is added vectorially to that resulting from lack of directionality, and by moving the load which changes the phase but not the wave reflected module, these maximums and minimums of the incident power to the side port of the coupler correspond to the sum and difference of the two waves modules.
Fig. 2. Implementation of the Tuned reflectometer
on Coaxial
In fact, the measurement of "Γ" translates to a measurement of attenuation “A” read on the VM7 (Attenuator and signal Calibrator) placed at the port 3.
3 Basis of Incident and Reflected
Power Network analysis requires the measurement of incident, reflected, and transmitted waves that travel along transmission lines. Using optical wavelengths as an analogy, when light strikes a clear lens (the
incident energy), some of the light is reflected from the lens surface, but most of it continues through the lens (the transmitted energy). If the lens has mirrored surfaces, most of the light will be reflected and little or none will pass through it [3][4]. The principle is the same; however the wavelengths are different for RF and microwave signals. Then, Network analyzers justly measure the incident, reflected, and transmitted energy, e.g., the energy that is launched onto a transmission line, reflected back down the transmission line toward the source, and successfully transmitted to the terminating device under test(DUT) [7].
3.1 Fundamental Principles and
Characterization of Vector Network Analysis Now that we understand the fundamentals of electromagnetic waves, we must learn the common terms used for measuring them. Network analyzer terminology generally denotes measurements of the incident wave with the reference channel “R“. The reflected wave is measured with the “A” channel, and the transmitted wave is measured with the “B “channel, Fig.3. With the amplitude and phase information in these waves, it is possible to quantify the reflection and transmission characteristics of a DUT. Then, the reflection and transmission characteristics can be expressed as vector (magnitude and phase), scalar (magnitude only), or phase-only quantities. For example, return loss is a scalar measurement of reflection, while impedance is a vector reflection measurement. Ratioed measurements allow us to make reflection and transmission measurements that are independent of both absolute power and variations in source power versus frequency. Ratioed reflection is often shown as A/R and ratioed transmission as B/R, relating to the measurement channels in the instrument.
Fig. 3. High frequency device characterization
WSEAS TRANSACTIONS on COMMUNICATIONS DOI: 10.37394/23204.2020.19.10 Nadia Fezai, Abdessattar Ben Amor
E-ISSN: 2224-2864 82 Volume 19, 2020
In order to completely characterize an unknown linear two-port device, we must make measurements under various conditions and compute a set of parameters. These parameters can be used to completely describe the electrical behavior of our device (or network), even under source and load conditions other than when we made our measurements. Low-frequency device or network characterization is usually based on measurement of H, Y, and Z parameters. To do this, the total voltage and current at the input or output ports of a device or nodes of a network must be measured. Furthermore, measurements must be made with open-circuit and short-circuit conditions. A vector network analyzer (VNA) is a precision measuring tool that tests and measure electrical performance of high frequency components, in the radio frequency (RF), microwave, and millimeter-wave frequency bands.
Fig. 4. Principle of Vector Network Analysis
The principle of VNA is the same principle of primary method “compensate reflectometer”. Indeed, it composed for two reflectometer, Fig.4, (RF source and multiple measurement receivers). It is specifically designed to measure the forward and reverse reflection and transmission responses, or S-parameters, of RF components. S-parameters have both a magnitude and a phase component, and they identify the linear performance of the DUT. While VNAs can also be used for characterizing some non-linear behavior like amplifier gain compression or intermodulation distortion, S-parameters are the primary measurement. The network analyzer hardware is optimized for speed, yielding swept measurements that are must faster than those obtained from the use of an individual source and an individual receiver like a spectrum analyzer. Through calibration, VNAs provide the highest level of accuracy for
measuring RF components (uncertainty between 0.02 and 0.04 under the guide EURAMET) [17].
2.2 Measurement Errors of VNA Calibration of VNA serves to determine and calculate the terms of errors of measurement results. Some of the factors that contribute to measurement errors are repeatable and predictable over time and temperature and can be removed, while others are random and cannot be removed. The basis of network analyzer error correction is the measurement of known electrical standards, such as a through, open circuit, short circuit, and precision load impedance. The quantification of terms of errors influences the quality of data.
Fig. 5. Measurement before and after calibration of
VNA
Without error correction, measurements on a band pass filter show considerable loss and ripple. The smoother, error-corrected trace produced by a two port calibration subtracts the effects of systematic errors and better represents the actual performance of the device under test (DUT). This paper describes several type of calibration procedure, including the popular Short-Open-Load-Thru (SOLT) calibration technique. The effectiveness of this procedure will then be demonstrated in the measurement of high-frequency components such as filters. Calibrations will also be shown for those cases requiring coaxial adapters to connect the test equipment, DUT, and calibration standards [3]. 3 Sources and Types of Errors All measurement systems, including those employing network analyzers, can be resumed by three types of measurement errors:
• Systematic errors • Random errors • Drift errors
WSEAS TRANSACTIONS on COMMUNICATIONS DOI: 10.37394/23204.2020.19.10 Nadia Fezai, Abdessattar Ben Amor
E-ISSN: 2224-2864 83 Volume 19, 2020

3.1 Systematic errors These errors are caused by imperfections in the test setup and test equipment. If these errors do not vary over time, they can be identified through calibration and mathematically removed during the measurement process. Systematic errors encountered in network measurements are related to signal reflections, frequency response and signal leakage, [3]. There are six types of systematic errors: •Crosstalk and Directivity errors relating to signal leakage •Source and load impedance mismatches relating to reflections •Frequency response errors caused by reflection and transmission tracking within the test receivers, Fig.3, [6].
Fig. 6. Systematic Measurement Errors
Vector error correction is a method of removing systematic errors. This type of error correction requires a network analyzer capable of measuring phase as well as magnitude, and a set of calibration standards with known, precise electrical characteristics. Indeed, the vector error correction characterizes systematic error terms by measuring known calibration standards, storing these measurements within the analyzer’s memory, and using this data to calculate an error model which is then used to remove the effects of systematic errors for the measuring system. This calibration process accounts for all major sources of systematic errors and permits very accurate measurements. However, it requires more standards and more measurements than response calibration. The two main types of vector error correction are the 1-port and 2-port calibrations, and then in this paper we focus of 1-port to determinate the systematic error of measurement system.
3.2 Random errors
These Types of errors vary randomly as a function of time. Since they are not predictable, they cannot be removed by calibration. The main causes to random errors are instrument noise switch repeatability, and connector repeatability. When using network analyzers, noise errors can often be reduced by narrowing the IF (Intermediate Frequency) bandwidth, increasing source power and using trace averaging over multiple sweeps. 3.3 Drift errors
These errors arise when a test system’s performance changes after a calibration has been performed. They are primarily caused by temperature variation and can be removed by increasing the number of calibration. However, by constructing a test environment with stable ambient temperature, drift errors can generally be minimized, [2].
4 One-Port Calibration A one-port calibration can measure and remove three systematic error terms from reflection measurements, Fig.7.
Directivity e00 Source match e11, Reflection tracking e10 e01
Fig. 7. The Fluence Diagram of 1-port calibration
These three errors terms are derived from the fluence diagram which translate a general equation related ΓM and Γ which can be solved
WSEAS TRANSACTIONS on COMMUNICATIONS DOI: 10.37394/23204.2020.19.10 Nadia Fezai, Abdessattar Ben Amor
E-ISSN: 2224-2864 84 Volume 19, 2020

in terms of three simultaneous equations with three unknowns.
)1(111100 MEMe
)2(232200 MEMe
)3(33113300 MEM ee
To establish these equations, three known calibration standards must be measured, such as an open, a short, and a load (the load value is usually the same as the characteristic impedance of the test system, generally either 50 or 75 ohm). Solving the equations yields the systematic error terms and makes it possible to derive the DUT’s actual reflection S-parameters, [7][2].
Fig. 8. Operating Mode of Measurement of
reflection factor within VNA
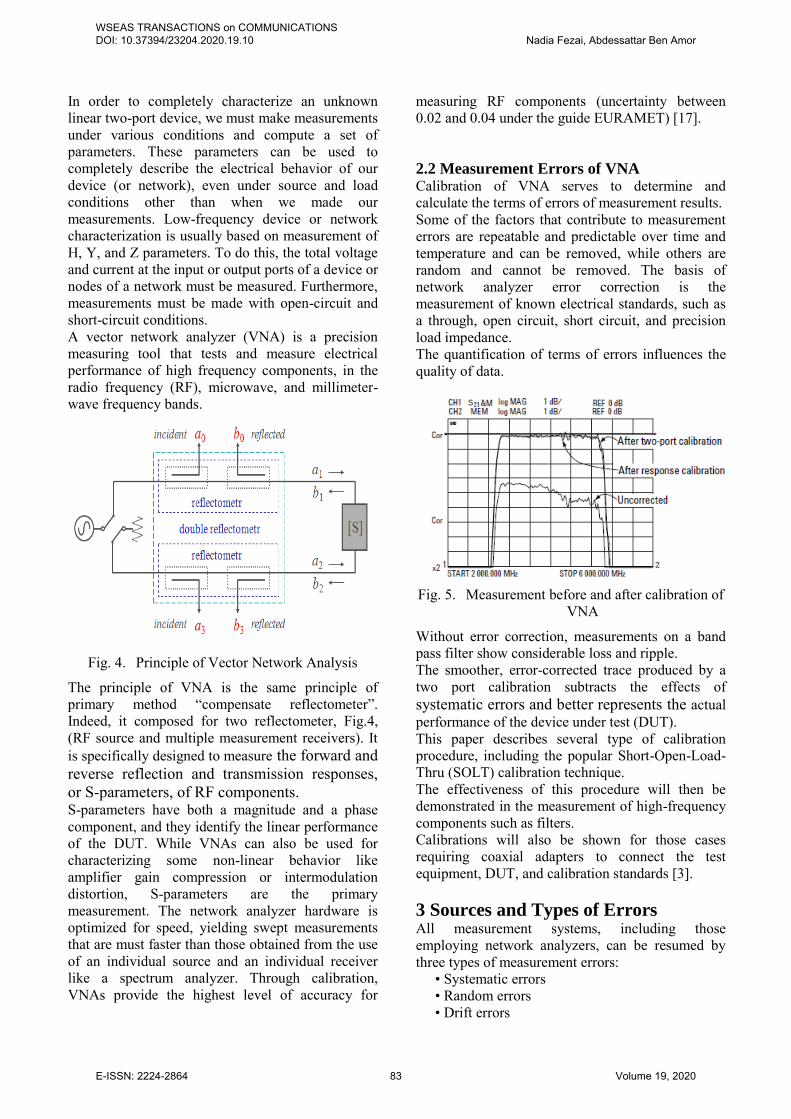
During the calibration « 1- Port », we used three standard loads (open, Short, load) and three attenuators 3dB, 6dB and 10dB. These attenuators have a known traceability. The first curve of measurement S11 after calibration « One Port » of the first attenuator 3dB is represented in the figure bellow in the frequency 3GHz:
Fig. 9. Value of S11 in the frequency
range[50MHz-9GHz]
By the figure.9, the value of Return Loss is excerpted at the desired frequency 3GHz.
Then, Return loss is a way to express the reflection coefficient in logarithmic terms (decibels).
Fig. 10. Value of Retun Loss at the frequency 3GHz
From the following figure.10, we extracted the value of value return loss and converted, within the equation (4), to reflection factor Γ or S11.
WSEAS TRANSACTIONS on COMMUNICATIONS DOI: 10.37394/23204.2020.19.10 Nadia Fezai, Abdessattar Ben Amor
E-ISSN: 2224-2864 85 Volume 19, 2020
)4(10 )20/RL(
Fig. 11. Value of GAMMA(Γ) for the frequency
3GHz of attenuator 3dB
According to figure.11 and Equation (1), the first value of reflection factor ΓM1is nearly (by around) 0.04. Next, the second attenuator is used and represented by the Fig.12:
Fig. 12. Value of Γ for the frequency 3GHz of second attenuator
10dB
From the following Fig.12, we extracted again the value of value return loss and converted, within the equation (4), to reflection factor Γ or S11.
Fig. 13. Value of Retun Loss at the frequency 3GHz
for each frequency
According of Fig.13, the value of Return Loss of the second attenuator 10dB is nearly -20.9dB. So, Return loss is the number of decibels that the reflected signal is below the incident signal.
Fig. 14. Value of GAMMA(Γ) for the frequency
3GHz of attenuator 6dB
By the figure.14, the second value of ΓM2is 0.09. After the third attenuator 20dB is measured by VNA, the measurement curve is followed in the figure in bellow:
Fig. 15. Measurement Result at the frequency 3GHz
of attenuator 20dB
The extraction of value of return loss is represented within the Fig.16
Fig. 16. Value of Return Loss for the frequency 3GHz of attenuator 10dB
The third value return loss (R.L) of attenuator 10dB at the frequency 3GHz is nearly to-30dB.
WSEAS TRANSACTIONS on COMMUNICATIONS DOI: 10.37394/23204.2020.19.10 Nadia Fezai, Abdessattar Ben Amor
E-ISSN: 2224-2864 86 Volume 19, 2020
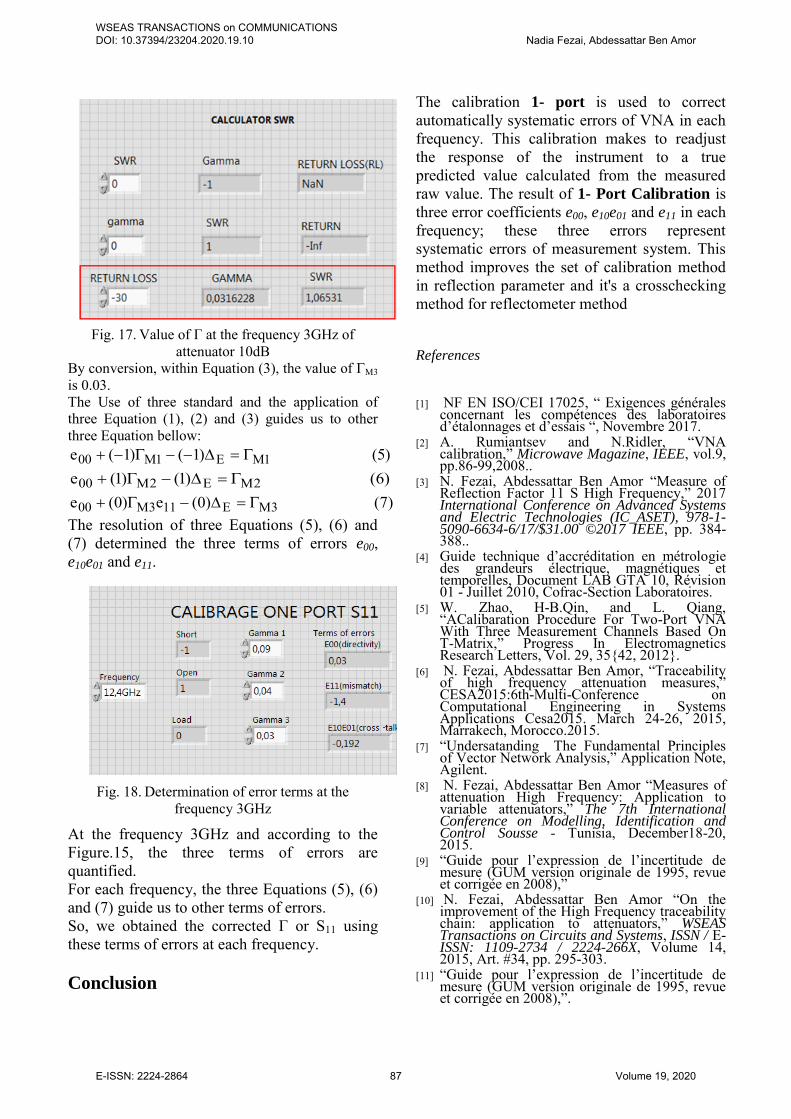
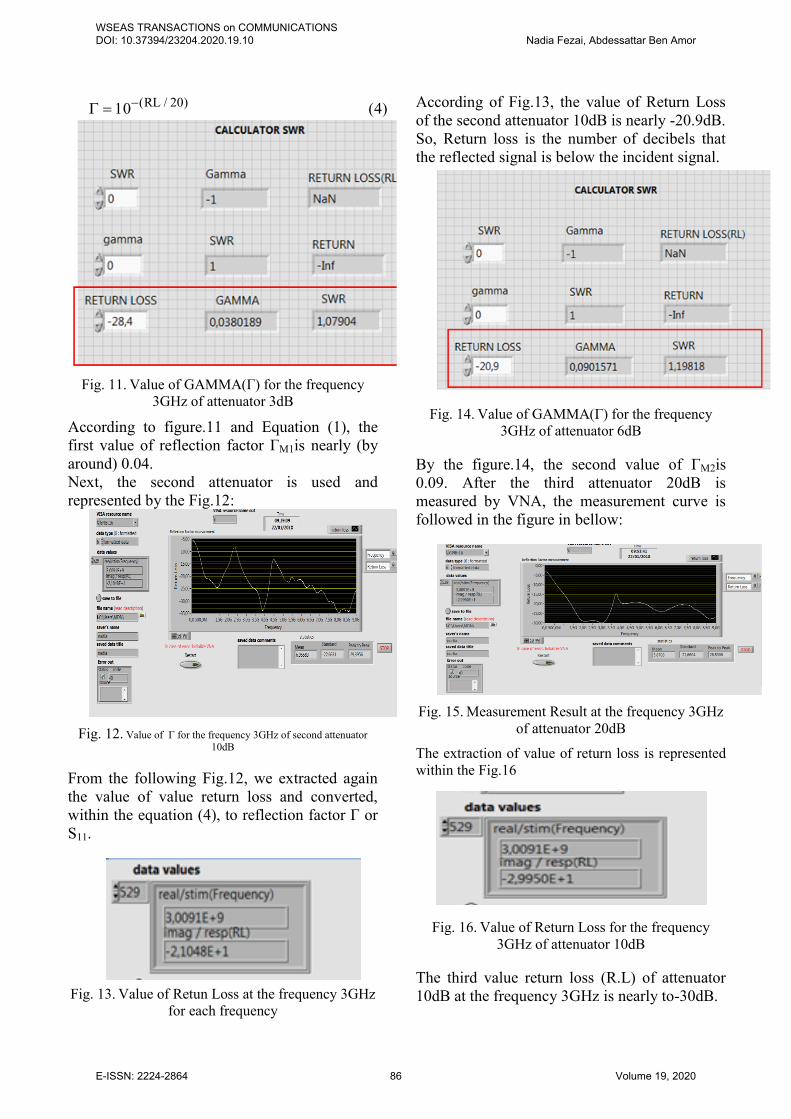
Fig. 17. Value of Γ at the frequency 3GHz of
attenuator 10dB By conversion, within Equation (3), the value of ΓM3 is 0.03. The Use of three standard and the application of three Equation (1), (2) and (3) guides us to other three Equation bellow:
)5()1()1(e 1ME1M00
)6()1()1(e 2ME2M00
)7()0(e)0(e 3ME113M00
The resolution of three Equations (5), (6) and (7) determined the three terms of errors e00, e10e01 and e11.
Fig. 18. Determination of error terms at the
frequency 3GHz
At the frequency 3GHz and according to the Figure.15, the three terms of errors are quantified. For each frequency, the three Equations (5), (6) and (7) guide us to other terms of errors. So, we obtained the corrected Γ or S11 using these terms of errors at each frequency. Conclusion
The calibration 1- port is used to correct automatically systematic errors of VNA in each frequency. This calibration makes to readjust the response of the instrument to a true predicted value calculated from the measured raw value. The result of 1- Port Calibration is three error coefficients e00, e10e01 and e11 in each frequency; these three errors represent systematic errors of measurement system. This method improves the set of calibration method in reflection parameter and it's a crosschecking method for reflectometer method
References
[1] NF EN ISO/CEI 17025, “ Exigences générales
concernant les compétences des laboratoires d’étalonnages et d’essais “, Novembre 2017.
[2] A. Rumiantsev and N.Ridler, “VNA calibration,” Microwave Magazine, IEEE, vol.9, pp.86-99,2008..
[3] N. Fezai, Abdessattar Ben Amor “Measure of Reflection Factor 11 S High Frequency,” 2017 International Conference on Advanced Systems and Electric Technologies (IC_ASET), 978-1-5090-6634-6/17/$31.00 ©2017 IEEE, pp. 384-388..
[4] Guide technique d’accréditation en métrologie des grandeurs électrique, magnétiques et temporelles, Document LAB GTA 10, Révision 01 - Juillet 2010, Cofrac-Section Laboratoires.
[5] W. Zhao, H-B.Qin, and L. Qiang, “ACalibaration Procedure For Two-Port VNA With Three Measurement Channels Based On T-Matrix,” Progress In Electromagnetics Research Letters, Vol. 29, 35{42, 2012}.
[6] N. Fezai, Abdessattar Ben Amor, “Traceability of high frequency attenuation measures,” CESA2015:6th-Multi-Conference on Computational Engineering in Systems Applications Cesa2015. March 24-26, 2015, Marrakech, Morocco.2015.
[7] “Undersatanding The Fundamental Principles of Vector Network Analysis,” Application Note, Agilent.
[8] N. Fezai, Abdessattar Ben Amor “Measures of attenuation High Frequency: Application to variable attenuators,” The 7th International Conference on Modelling, Identification and Control Sousse - Tunisia, December18-20, 2015.
[9] “Guide pour l’expression de l’incertitude de mesure (GUM version originale de 1995, revue et corrigée en 2008),”
[10] N. Fezai, Abdessattar Ben Amor “On the improvement of the High Frequency traceability chain: application to attenuators,” WSEAS Transactions on Circuits and Systems, ISSN / E-ISSN: 1109-2734 / 2224-266X, Volume 14, 2015, Art. #34, pp. 295-303.
[11] “Guide pour l’expression de l’incertitude de mesure (GUM version originale de 1995, revue et corrigée en 2008),”.
WSEAS TRANSACTIONS on COMMUNICATIONS DOI: 10.37394/23204.2020.19.10 Nadia Fezai, Abdessattar Ben Amor
E-ISSN: 2224-2864 87 Volume 19, 2020
[12] “A novel vector network analyzer,” IEEE Transactions on Microwave Theory and Techniques ( Volume: 46, Issue: 12, Dec 1998 ), pp.2520-2523.
[13] “An effective usage of vector network analyzer for microwave imaging,” IEEE Transactions on Microwave Theory and Techniques ( Volume: 53, Issue: 09,Sep 2005 ), pp.2884-2891.
[14] “Highly Integrated 4–32-GHz Two-Port Vector Network Analyzers for Instrumentation and Biomedical Applications,” IEEE Transactions on Microwave Theory and Techniques ( Volume: 65, Issue: 01,Jan2017 ), pp.229-2441.
[15] “A Multireflect-Thru Method of Vector Network Analyzer Calibration,” IEEE Transactions on Microwave Theory and Techniques ( Volume: 65, Issue: 03,March 2017 ), pp.905-915.
[16] EURAMET cg-12 Version 2.0 (03/2011) “Guidelines on the Evaluation of Vector Network Analysers (VNA), “
WSEAS TRANSACTIONS on COMMUNICATIONS DOI: 10.37394/23204.2020.19.10 Nadia Fezai, Abdessattar Ben Amor
E-ISSN: 2224-2864 88 Volume 19, 2020