Embed Size (px)
Citation preview

Validation of a Child Version of the Three-Factor Eating Questionnaire –
A Psychometric Tool for the Evaluation of Eating Behaviour
Jaime-lee Yabsley
A thesis submitted to the Faculty of Graduate and Postdoctoral Studies
In conformity with the partial fulfillment requirements for the Master of Science degree in
Human Kinetics
School of Human Kinetics, Faculty of Health Sciences
University of Ottawa
Ottawa, Ontario, Canada
(May 2018)
© Jaime-Lee Yabsley, Ottawa, Canada, 2018

ii
TABLE OF CONTENTS
TABLE OF CONTENTS ................................................................................................. ii
ABSTRACT ....................................................................................................................... v
LIST OF TABLES .......................................................................................................... vii
LIST OF APPENDICES ............................................................................................... viii
LIST OF ABBREVIATIONS ......................................................................................... ix
CONTRIBUTIONS.......................................................................................................... xi
ACKNOWLEDGEMENTS ........................................................................................... xii
PRELUDE TO THESIS ................................................................................................ xiv
CHAPTER 1 ...................................................................................................................... 1 Introduction ................................................................................................................... 1 Literature Review ......................................................................................................... 3
Principles of Eating Beheaviour ................................................................................. 3 Development of the Three-Factor Eating Questionnaire (TFEQ) ............................. 5 Utility of the TFEQ in Predicting Eating Behaviours ................................................ 7 Replication of the TFEQ Factor Structure ................................................................. 9 Psychometrically Improved Versions of the TFEQ .................................................. 12
TFEQ Revised 18-item ......................................................................................... 12 TFEQ Revised 21-item ......................................................................................... 14
Study of Eating Behaviour in Child and Adolscent Populations .............................. 15 Gap in the Current Research .................................................................................... 19
CHAPTER 2 .................................................................................................................... 21 Thesis Objectives ......................................................................................................... 21 Thesis Hypotheses ....................................................................................................... 23
CHAPTER 3 .................................................................................................................... 25 Methods ........................................................................................................................ 25
Participants ............................................................................................................... 25 Protocol..................................................................................................................... 26 Research Ethics Board Approval .............................................................................. 27 School Board Approval ............................................................................................. 27 Consent ..................................................................................................................... 27 Procedure .................................................................................................................. 28 Questionnaires .......................................................................................................... 29
The 21-item Child version of the Three-Factor Eating Questionnaire (TFEQ-R21 C)............................................................................................................................... 29

iii
The Power of Food Scale - Child Version ............................................................ 30 Leeds Food Preference Questionnaire .................................................................. 31
Anthropometric Measures ......................................................................................... 32 Weight ................................................................................................................... 32 Height .................................................................................................................... 32 Body Mass Index (BMI) ....................................................................................... 33
CHAPTER 4 .................................................................................................................... 34 Data Analysis and Results .......................................................................................... 34 Preliminary Data Analysis ......................................................................................... 34 Primary Data Analysis ............................................................................................... 35 Preliminary Analysis Results ..................................................................................... 38 Primary Analysis Results ........................................................................................... 39
Structure and internal consistency of the TFEQ-R21 C ........................................... 39 Table 1 .................................................................................................................. 39
Structure and internal consistency of the 20-item Child version of the Four-Factor Eating Questionnaire (FFEQ-R20 C) ....................................................................... 41
Table 2 .................................................................................................................. 42 Adapted three-factor model of the FFEQ-R21 C ...................................................... 45
Secondary Data Analysis ............................................................................................ 45 Relationship between the Power of Food Scale factors and anthropometrics ......... 45 Relationship between the FFEQ-R20 C and Power of Food Scale factors .............. 45 Relationship between FFEQ-R20 C and participant characteristics ....................... 46 Relationship between FFEQ-R20 C factors and anthropometric measures ............ 47 Relationship between food preferences and anthropometric measures ................... 47 Relationship between FFEQ-R20 C factors and food preferences ........................... 47 Relationships between taste preferences and anthropometric measures ................. 48 Relationships between FFEQ-R20 C factors and taste preferences ......................... 48
Secondary Analysis Results ........................................................................................ 49 Relationship between the Power of Food Scale factors and anthropometrics ......... 49 Relationship between Power of Food Scale factors and the FFEQ-R20 C .............. 49
Food available factor............................................................................................. 49 Food present factor ............................................................................................... 49 Food tasted factor .................................................................................................. 50 Table 3 .................................................................................................................. 51
Relationship between FFEQ-R20 C and participant characteristics ....................... 52 Table 4 .................................................................................................................. 52
Relationship between FFEQ-R20 C factors and anthropometric measures ............ 53 Table 5 .................................................................................................................. 53 Table 6 .................................................................................................................. 55
Relationship between food and taste preferences and anthropometric measures .... 57

iv
Relationship between FFEQ-R20 C factors and food and taste preferences ........... 57 High protein food preference ................................................................................ 58 High carbohydrate food preference ...................................................................... 58 High fat food preference ....................................................................................... 58 Low energy food preference ................................................................................. 59 High fat savoury preference .................................................................................. 59 High fat sweet preference ..................................................................................... 59 Low fat savoury preference .................................................................................. 59 Low fat sweet preference ...................................................................................... 59 Table 7 .................................................................................................................. 60
CHAPTER 5 .................................................................................................................... 62 Global Discussion ........................................................................................................ 62
Validity of the responses to the Child version of the Three-Factor Eating Questionnaire ............................................................................................................ 63
Validation and psychometric testing of the questionnaire scores ......................... 64 Recommendation for applicability of the questionnaire ....................................... 71 Relationship between FFEQ-R20 C factors ......................................................... 74
FFEQ-R20C Factors and Anthropometric, and Food and Taste Preferences ......... 76 Relationship between FFEQ-R20 C factors and participant characteristics ......... 76 Relationship between FFEQ-R20 C factors and anthropometric measures.......... 78 Relationship between FFEQ-R20 C factors and food and taste preferences ........ 84
Significance of the Study, and Clinical and Research Implications ......................... 88 Limitations and Future Directions............................................................................ 92
Conclusion ................................................................................................................... 97
CHAPTER 6 .................................................................................................................... 99 References .................................................................................................................... 99 Appendices ................................................................................................................. 123

v
ABSTRACT
Introduction: Currently, 1 in 7 children are classified as obese, which represents an obesity rate
two times higher than that of the last 25 years. Part of the solution to address the positive energy
balance underlying weight gain is to target the specific eating behaviours and factors that lead to
food intake. One widely used tool to measure eating behaviour is the Three-Factor Eating
Questionnaire (TFEQ).
Objective: The primary objective of this study was to validate scores of the 21-item Child
version of the Three-Factor Eating Questionnaire (TFEQ-R21 C), by examining validity
evidence and reliability of TFEQ-R21 C responses in a sample of Canadian children and
adolescents. The secondary aim was to examine the associations between the TFEQ-R21 C
factors and body mass index (BMI) z-scores and food/taste preferences.
Methods: The participants consisted of a sample of 158 children, 63 boys (mean age: 11.5 ± 1.6
years) and 95 girls (mean age: 11.9 ± 1.9 years), recruited from English schools in the Ottawa
area. To assess eating behaviour, participants filled out the TFEQ-R21 C, the Power of Food
Scale, and the Leeds Food Preference Questionnaire. Height and weight measurements were
taken using a stadiometer and a digital scale. An exploratory factor analysis with oblique rotation
and an item analysis were conducted to determine the factor structure and validity of the
questionnaire. A median split on Cognitive Restraint (CR), Internal Uncontrolled Eating (UE 1),
External Uncontrolled Eating (UE 2), and Emotional Eating (EE) was used to dichotomize
factor-based scores into high and low categories for each factor, to allow for group comparisons.
Bivariate correlations explored relationships between weight, BMI and BMI z-score, and food
and taste preference, by sex and age group. To determine if BMI, BMI z-scores, and food/taste
preferences were associated with factor scores of the TFEQ-R21 C, two-way ANOVAs were
conducted.
Results: The exploratory factor analysis replicated the Emotional Eating (EE) and Cognitive
Restraint (CR) scales of the original TFEQ-R21, whereas the global factor of Uncontrolled
Eating (UE) produced two subscales: Internal Uncontrolled Eating (UE 1) and External
Uncontrolled Eating (UE 2). Item 17 did not load onto any of the factors and was subsequently
removed. The four-factor model, with item 17 removed (FFEQ-R21 C: 20-item Child version
Four-Factor Eating Questionnaire), accounted for 41.2% of the common variance in the data and
showed good internal consistency (α= 0.81). The factors of UE 1 (r= 0.27, p<0.001), UE 2 (r=

vi
0.36, p<0.0001), and CR (r= 0.20, p= 0.04) correlated significantly with EE. Younger children
reported higher UE 1 scores [F(1,143)= 3.99, p=0.048, f2= 0.028] and CR scores [F(1,143)=
3.99, p= 0.001, f2= 0.089]. Boys who reported a high UE 1 scores had a significantly higher
weight [F(1,58)= 6.44, p=0.014, f2= 0.117 ] and BMI z-scores [F(1,58)= 4.45, p=0.039,
f2=0.083], compared to those who reported low UE 1 scores. Children with overweight or obesity
[F(1,143)= 2.75, p<0.001. f2= 0.035] reported higher EE scores, compared to children of normal
weight. Children with high UE 1 scores reported greater preference for high protein and fat
foods, and high fat savoury (HFSA) and high fat sweet (HFSW) foods, compared to those with
low UE 1 scores. Higher preference for high protein, fat, and carbohydrate foods, and HFSA,
HFSW, and low fat savoury foods (LFSA) foods was found in children with high UE 2 scores,
compared to those with low UR 2 scores. Children and adolescents with low CR scores reported
greater preference for high protein, carbohydrate, and fat foods, compared to those who reported
high CR scores.
Discussion: This study showed adequate reliability and validity evidence of the TFEQ-R21 C
scores, and that the questionnaire is best represented by a 20-item four-factor model in our
sample. The FFEQ-R21 C was able to identify relevant eating behaviour traits associated with
higher BMI z-scores and food preferences in both sexes and age groups, which were mainly in
accordance with previous findings in children and adolescents. These results support the utility
of the questionnaire for the assessment and identification of problematic eating behaviour and
food preferences in the Canadian pediatric population. Younger children reported higher
influence of the psychological constructs of eating behaviour (CR, UE 1, UE 2, and EE),
compared to older children. This study provides preliminary evidence that FFEQ-R20 is a
reliable and valid self-report tool to measure eating behaviour in children and adolescents to
characterize those at higher risk for excess weight. However, further research is needed to
examine the validity of the questionnaire in larger samples and in other geographical locations
across Canada, as well as the inclusion of extraneous variables such as parental eating behaviour,
socioeconomic status, and physical activity levels.

vii
LIST OF TABLES
Table 1. Rotated factor structure loading of the 21-item Child version of the Four-Factor Eating
Questionnaire (FFEQ-R21 C) with no restrictions or removed items.
Table 2. Rotated factor structure loading of the 20-item Child version of the Four-Factor Eating
Questionnaire (FFEQ-R20 C) with a four-factor restriction model.
Table 3. Pearson Product Moment correlation coefficients and significance values for the
relationship between FFEQ-R20 C factors and Power of Food Scale factors, by sex and age
groups.
Table 4. 20-item Child Version of the Four-Factor Eating Questionnaire (FFEQ-R20 C) mean
factor-based scores between age and sex groups.
Table 5. 20-item Child Version of the Four-Factor Eating Questionnaire (FFEQ-R20 C) mean
factor-based scores by weight classification.
Table 6. Anthropometric measurements and body weight categories by high and low Four-
Factor Eating Questionnaire (FFEQ-R20 C) factor-based scores.
Table 7. Mean food and taste preference scores (Leeds Food Preference Questionnaire) by high
and low Four-Factor Eating Questionnaire (FFEQ-R20 C) factor-based scores.
viii
LIST OF APPENDICES
Appendix 1. Parent Invitation Letter.
Appendix 2. Information Letter and Informed Consent Form.
Appendix 3. Assent Form.
Appendix 4. Participant Oral Debriefing Script.
Appendix 5 Parent Debriefing Letter.
Appendix 6. Questionnaires.
Appendix 7. CHEO’s Research Ethics Board Annual Approval.
Appendix 8. Ottawa-Carleton Research and Evaluation Advisory Committee Approval.
Appendix 9. University of Ottawa Research Ethics Board Approval.
Appendix 10. Supplementary Tables and Results

ix
LIST OF ABBREVIATIONS
AERA American Educational Research Association
ANCOVA Analysis of Covariance
ANOVA Analysis of Variance
APA American Psychological Association
BMI Body Mass Index
CHEO Children’s Hospital of Eastern Ontario
CR Cognitive Restraint
DEBQ Dutch Eating Behaviour Questionnaire
EE Emotional Eating
FA Food Available
FFEQ-R20 C 20-item Child version of the Four-Factor Eating Questionnaire
FP Food Present
FT Food Tasted
HALO Healthy Active Living and Obesity research group
HCP High Carbohydrate Preference
HFP High Fat Preference
HFSA High Fat Savoury
HFSW High Fat Sweet
HPP High Protein Preference
KMO Kaiser-Meyer-Olkin
LEP Low Energy Preference
LFPQ Leeds Food Preference Questionnaire
LFSA Low Fat Savoury
LFSW Low Fat Sweet
MSc. Master of Science
NCME National Council on Measurement Education
OCREAC Ottawa-Carleton Research and Evaluation Advisory Committee
PFS Power of Food Scale
TFEQ Three-Factor Eating Questionnaire

x
TFEQ-R18 18-item Three-Factor Eating Questionnaire
TFEQ-R21 21-item Three-Factor Eating Questionnaire
TFEQ-R21 C 21-item Child version of the Three-Factor Eating Questionnaire
UE Uncontrolled Eating
UE 1 Internal Uncontrolled Eating
UE 2 External Uncontrolled Eating
WHO World Health Organization

xi
CONTRIBUTIONS
The work contained in this thesis is my own; myself and my thesis supervisor Dr. Jean-
Philippe Chaput and co-supervisor Dr. Kristi Adamo, take full responsibility for the entirety of
its content. I recruited schools and participants, collected and analyzed the data, and I am writing
a manuscript. Ryan Featherstone, an undergraduate student at the time of data collection with the
Healthy Active Living and Obesity (HALO) research group at the Children’s Hospital of Eastern
Ontario Research Institute, also helped with data collection. This thesis is in a monograph
format. At the time of submission, I was also drafting a manuscript for publication.

xii
ACKNOWLEDGEMENTS
I am so happy and honoured to have had so many individuals support me throughout my
duration of my Master of Science (MSc.) degree. First, I would like to thank my supervisor, Dr.
Jean-Philippe Chaput for his continued support, enthusiasm, patience, and guidance throughout
my MSc. Dr. Chaput continually provided encouragement, critical feedback, and collaborative
problem-solving. Dr. Chaput always made himself available for guidance and support no matter
his workload and has always provided constructive, honest, and valuable feedback. I am also
very thankful to my co-supervisor, Dr. Kristi Adamo. She has provided critical feedback
throughout my thesis and provided continued support. Under Dr. Chaput’s and Dr. Adamo’s
supervision, I was given the opportunity to carry out my research project from start to finish,
which provided me with many new opportunities and I have learned a great deal; I have been
able to improve my writing skills and knowledge about research processes. I would also like to
thank Dr. Katie Gunnell, for her support, guidance, and expertise in factor analysis and statistics;
she was always there for support, to provide her expertise, to answer any questions, and guide
me through some of the complex areas of factor analysis.
I would also like to thank my thesis advisory committee members, Dr. Gary Goldfield
and Dr. Jennifer Brunet, for agreeing to be part of my committee and taking the time to review
my proposal and final thesis, and providing invaluable comments and feedback on the documents
and my presentation. With their comments and guidance, I was able to incorporate their feedback
into my final thesis and learn from their areas of expertise and extensive research backgrounds.
I would also like to acknowledge Dr. Eleanor Bryant for developing the protocol for the
multi-site study to validate a Child version of the 21-item Three-Factor Eating Questionnaire
(TFEQ-R21 C). I would like to thank Dr. Eleanor Bryant, Dr. Vicky Drapeau, and Dr. David

xiii
Thivel for their collaboration on the project for the Ottawa site; they continually provided
guidance, expert advice and constructive feedback on our findings. I would not have been able to
create this thesis and the subsequent manuscript without the guidance of Dr. Chaput, Dr. Adamo,
Dr. Gunnell, Dr. Brunet, Dr. Goldfield, Dr. Bryant, Dr. Drapeau, and Dr. Thivel.
I am also very grateful for the collaborative and supportive environment of the Healthy
Active Living and Obesity (HALO) research group, where I have had the opportunity to learn
from many professors and students. The ongoing encouragement and support I have received
from all students, staff, and professors at HALO has been essential throughout my MSc. degree.
I would also like to take the opportunity to acknowledge the support I have received from
my friends and family through my degree, and throughout my academics. My boyfriend, Nikesh
has also provided continued unconditional support and encouragement during my degree.
Finally, I would like the thank the schools of the Ottawa-Carleton District School Board
and their principals, students, and parents for their participation in the validation of the child
version of Three-Factor Eating Questionnaire. Without the enthusiasm of the school principals,
parents, and students this study would not be possible.

xiv
PRELUDE TO THESIS
In my thesis I have used the data I collected from Ottawa schools, for the multi-site study
to validate the TFEQ-R21 C. Ethics approval for the study was provided by the Children’s
Hospital of Eastern Ontario Research Ethics Board, the University of Ottawa Research Ethics
Board, and the Ottawa-Carleton Research and Evaluation Advisory Committee (OCREAC;
please see Appendix).
In Chapter 1 of the thesis, I provide a general introduction of the content followed by a
comprehensive literature review of the development, validation, and utility of the Three-Factor
Eating Questionnaire in measuring eating behaviours in adult populations and child/adolescent
populations. In Chapter 2 the research objectives and hypotheses are outlined. Chapter 3 contains
an outline of the methods. Chapter 4 contains the statistical analyses used, and the results of the
study. Chapter 5 contains the global discussion of the study, which includes a discussion of the
results presented in Chapter 4, within the context of current published literature, significance and
practical implications, limitations of the study, and areas for future research. Chapter 6 contains
the references and appendices cited in the thesis. The appendices include ethics approval
documents, copies of the information letters, consent and assent forms, and copies of the
questionnaires that were administered.

1
CHAPTER 1
Introduction
The percentage of Canadian children with overweight and obesity has increased
significantly over the past decade (1). Currently, 1 in 7 children between the ages of 2-17 are
classified as obese (2), which represents an obesity rate two times higher than that of the last 25
years (3). Pediatric overweight and obesity are currently one of the largest persistent public health
issues (4). Excess weight, in children and adolescents, is a risk factor for a variety of chronic
diseases, including hypertension, type 2 diabetes mellitus, cardiovascular disease, and certain
types of cancer (2). Overweight has also been found to be linked to emotional health issues, low
self-esteem (5), stigmatization (6), poor academic performance, and lower quality of life in
children and adolescents (4). Furthermore, obesity places a significant burden on the Canadian
health care system via direct and indirect costs associated with comorbidities (7). Although the
health and economic consequences of obesity are well established, obesity is a complex and
multi-factorial condition with no easy solutions for treatment or prevention (1).
The World Health Organization (WHO) stated that the dual cause of overweight and
obesity is increased intake of foods that are high in energy and an increase in physical inactivity
(8). The ecological model of obesity suggests that overweight and obesity in children and
adolescents are mediated by modifiable risk factors such as dietary intake and physical inactivity
(9). Dietary intake, eating behaviours, appetite, and physical inactivity in the pediatric population
are linked to the obesogenic environment that children and adolescents are currently living in;
this environment imposes factors that encourage overeating or increased energy intake in the
form of energy and sugar-dense foods, passive overconsumption (10; 11), and sedentary behaviour,
which in turn may lead to overweight or obesity (12). As eating behaviours are one factor

2
affecting weight gain, part of the solution to overcoming these rising rates of obesity is
understanding the link between eating behaviours, weight status, and outcomes. Specific eating
behaviours have been linked to weight gain in children and adolescents (13; 14; 15); however, the
ability to accurately and conveniently measure these traits towards food intake and eating
behaviours, especially in Canada, remains an important understudied research area.
One widely used tool to measure eating behaviour is the Three-Factor Eating
Questionnaire (TFEQ) developed by Stunkard and Messick (16). The TFEQ is a self-assessment
scale based on the Restraint Theory proposed by Polivy and colleagues (17), and the Latent
Obesity Theory proposed by Meyer and Pudel (18). The TFEQ measures eating behaviour in
response to social, environmental, and emotional factors. The TFEQ measures: 1) Dietary
Restraint (restriction of food intake to control weight), 2) Disinhibition (tendency to overeat
opportunistically), and 3) Hunger (responsiveness to internal hunger sensations) (16). The TFEQ
has been studied in a wide variety of adult samples, and evidence has been provided
demonstrating that eating behaviour is an important determinant of obesity and has implications
in weight loss interventions (16; 19; 20). It has been established that the factors of Disinhibition and
Restraint are highly associated with body weight and weight loss success (16; 19).
The TFEQ has recently been revised into a 21-item questionnaire (TFEQ-R21) utilizing
the same items as the original TFEQ, but assessing slightly different factors: 1) Restraint
(unchanged), 2) Uncontrolled Eating (eating in response to food palatability and likelihood of
overeating), and 3) Emotional Eating (eating in response to negative moods) (19). The
Uncontrolled Eating and Emotional Eating subscales of the TFEQ-R21 were shown to have
utility in predicting weight gain and weight loss success in obese and non-obese adult samples
(19). Emotional Eating was also found to be associated with overweight and obesity (19).

3
Despite the widespread research on the utility of the TFEQ in adult samples, in both
clinical and non-clinical settings (16; 20; 21; 22; 23; 24; 25; 26; 27; 28; 29; 30; 31; 32), and recent validity and
reliability evidence of TFEQ-R21 C responses in children and adolescents (13; 15), no research to
date has reported on the utility or validation of the instrument in child and/or adolescent
populations in Canada. Due to the utility of the TFEQ-R21 in adult populations, the development
and validation of a child version of the questionnaire may be useful in elucidating relationships
between eating behaviours and weight in the pediatric population. The development and
validation process of the questionniare is a necessary preliminary step in developing tailored
interventions, focusing on individual eating behaviours affecting weight, aimed at preventing and
managing obesity across diverse pediatric populations.
Literature Review
Principles of Eating Behaviour
Much research in the area of obesity has focused on the biochemical and physiological
factors that contribute to excess weight (33), but there is a need to consider the factors that affect
food intake, which in turn contribute to overweight and obesity in children and adolescents.
Obesity is the result of excess food intake and/or inadequate energy expenditure, otherwise
known as energy imbalance (33). Positive energy balance is often the result of lifestyle, dietary
intake, and food preferences (4) resulting from eating behaviours (16; 34) and appetitive
responsiveness (35). Eating behaviour is a complex and multi-faceted construct in which
physiological, psychological, social/cultural, and genetic factors all play a role in influencing

4
food intake (34). Part of the solution to address the positive energy balance underlying weight gain
is to target the specific eating behaviors and factors that lead to food intake.
A significant advancement in the understanding of eating behaviour, in relation to
obesity, was the concept of Restrained Eating (36; 37). Considered to be the underlying principle in
understanding eating behaviour, Restrained Eating is the habit of restricting food intake to
control weight (36). Herman and Mack (36) hypothesized that unconventional eating behaviours
resulted from a conflict between the desire to eat and the desire to restrict food intake to control
weight. The theory proposes that overweight can be the result of chronic dieting, which in turn
leads to overeating. The Restraint Scale, which evaluates eating behaviour in response to 3
different stimuli, i.e., preloads of food and alcohol, and dysphoric moods, was developed to
measure differences in eating behaviours (37). The scale was divided into two factors: Weight
History and Concern with Food and Dieting (37). Herman and colleagues (36; 37) studied normal
weight college-age women using the Restraint Scale and found that participants who scored high
on the Restraint Scale consumed more after the preloads of food than individuals who scored
lower when given a larger amount of preload of food (36). This suggests that there must be a
cognitive behavioural component to Restrained Eating (36). Herman and Mack (36) explained this
cognitive behavior component as ‘counter-regulation and it is hypothesized to be the result of
disinhibition. This idea of disinhibition was further explored using inherent disinhibitions of
alcohol and dysphoric moods, and it was found that both disinhibitions increased food intake in
restrained eaters, but not in unrestrained eaters (36).
Concurrently, Meyer and Pudel (18) developed the idea of latent obesity, which is the
concept that if individuals were once obese, they would exhibit the eating behaviours of obese
individuals due to their inability to control their food intake. Subsequently, to investigate this

5
idea of latent obesity, Meyer and Pudel (18) developed the Latent Obesity Questionnaire, a scale
to identify individuals who were of a normal weight but did not slow their rate of consumption
during a meal (18). Using the Latent Obesity Questionnaire, it was found that individuals without
obesity slowed their rate of eating as compared to individuals with obesity, except for the latent
obese individuals, who maintained a normal weight due to their ability to restrict food intake
despite their biological predisposition for obesity (18).
Further research indicated that there were several issues with the Restraint Scale and the
Latent Obesity Questionnaire (16; 18; 38; 39; 40; 41; 42). The Restraint Scale was unable to accurately
predict the eating behaviour of obese individuals and the construct validity of the instrument was
not confirmed, due to a confounding factor of weight fluctuation (38; 39; 40; 41; 42). In addition,
multiple studies were unable to validate the Latent Obesity Questionnaire, as it was unable to
identify individuals who were obese and simultaneously restrained their eating (16; 18). Although
there were several issues identified with the Restraint Scale and the Latent Obesity
Questionnaire, these tools became the basis for a more refined measure of Dietary Restraint: the
TFEQ (16).
Development of the Three-Factor Eating Questionnaire (TFEQ)
In obesity research, one of the most widely used questionnaires for the evaluation of
behavioural and cognitive factors of food intake is the TFEQ (16). The TFEQ is based on the
Restraint Theory proposed by Polivy and Herman (17), and the Latent Obesity Theory proposed
by Meyer and Pudel (18). Stunkard and Messick (16) noted that the Restraint Scale had inherent
flaws, but the concept in measuring restrained eating behaviour was robust. The issues identified

6
with the Restraint Scale and the Latent Obesity Questionnaire prompted the creation of the
TFEQ through exploratory factor analysis, using collated items from the two pre-existing
questionnaires and 17 newly created items (16). This collated questionnaire was administered to a
sample of individuals who expressed either restrained or unrestrained eating (16). The responses
from the initial 67-item questionnaire were factor analyzed and the devised factor structure was
used to develop and validate the 51-item version of the questionnaire (16). This process resulted
in the establishment of the three stable factors, known as the factor structure. These factors
include: 1) Restraint (restriction of food intake to control weight) (21 items), 2) Disinhibition
(tendency to overeat opportunistically) (16 items), and 3) Hunger (responsiveness to internal
hunger sensations) (14 items) (16). The new Hunger factor seemed to resolve the issues with the
additional weight fluctuation items that were identified by Drewnowski et al. (38) in the Restraint
Scale. These factors were replicated in several samples of free eaters and dieters (16).
Disinhibition was able to predict weight changes in individuals with depression, and both
Disinhibition and Restraint factors were highly associated with body weight and weight loss
success (16).
During the same time, the Dutch Eating Behaviour Questionnaire (DEBQ) (43) was also
developed to address the issues identified with the Restraint Scale (38; 39). Since the questionnaires
appeared to be similar in their concept of restrained eating, two reviews comparing the Restraint
Scale (37), the TFEQ (16), and the DEBQ (43) were conducted (44; 45). The DEBQ and TFEQ have
both reported high internal consistency of the restraint scales (16; 43); both questionnaires
accurately measure restriction of food intake (45), concluding that both measures offer a suitable
alternative to the Restraint Scale (44). However, Allison et al. (44) noted that the TFEQ
demonstrated better discriminant validity with respect to social desirability bias, as compared to

7
the Restraint Scale and the DEBQ. An important distinction between the DEBQ and the TFEQ is
the absence of questionnaire items addressing hunger in the DEBQ. The items were not included
in the DEBQ as they were argued to represent different ends of the spectrum for both Emotional
Eating and External Eating and researchers did not want the hunger items to influence the true
concepts measured by the factors (43). However, sensitivity to internally based hunger is an
important factor to differentiate eating in response to internal or external cues to determine the
appropriate interventions. Additionally, Ogden (46) noted that the restraint scale of the DEBQ
might not be unidimensional as originally hypothesized (43). Furthermore, the TFEQ has been
used in a wide-range of populations and interventions and has been adapted to many cultures and
languages.
The Utility of the TFEQ in Predicting Eating Behaviours
Since the development of the TFEQ (16), it has proven to be useful in the ability to predict
various aspects of eating behaviour. Firstly, associations between Body Mass Index (BMI) and
factors of the TFEQ have been found. Higher scores in either the Restraint (30; 47; 48; 49) or the
Disinhibition and Hunger subscales in the TFEQ (26; 48; 50) have been found to be associated with
higher BMI. It has been found that women generally have higher scores on the Restraint factor,
compared to men (49; 51; 52). Research has also demonstrated that individuals with obesity have
higher scores on the Disinhibition (28; 31; 51) and Hunger factors (28; 53). Numerous studies
examining the efficacy of weight loss interventions have also found that individuals who
experience an increase in Restraint scores and a decrease in Disinhibition scores have better
weight-loss success (53; 54; 55; 56).

8
The TFEQ has been used to assess eating behaviour in overweight and normal- weight
individuals (21; 28; 32; 57). Lindroos and colleagues (28) examined a group of Swedish women
categorized as obese and non-obese to explore the relationship between Dietary Restraint,
Disinhibition, and Hunger with food intake and obesity. They found that the scores of
Disinhibition and Hunger were higher in the obese sample, in comparison to the non-obese
sample, but restrained eating scores were not found to be significantly different between the
samples (28). Similar to the results of Stunkard and Messick’s (16) research, Lindroos and
colleagues (28) found that energy intake and Restrained Eating were negatively associated, while
energy intake, Disinhibition, and Hunger were positively associated in the sample of women
with obesity. These associations were not significant in the in those who did not have obesity,
demonstrating that the eating behaviours assessed by the TFEQ may not have as much of an
influential effect on excess weight (28). Another group of researchers looked at the effect of
negative moods on eating behaviour in a sample of college students; it was found that the only
factor of the TFEQ involved in eating in response to negative mood was Hunger; this research
represents a link between eating behaviour and emotions (58).
Subsequently, it was found that scores on the Hunger and Disinhibition scales of the
TFEQ predicted the extent to which obese and non-obese females sought help in order to control
their weight and eating behaviours, measured through the different ways they had tried to control
their weight, such as hiring a personal trainer, or taking weight loss supplements (21). Next,
Svendsen and colleagues (57) investigated the effect of orlistat on eating behaviour and binge
eating in a sample of men and women with obesity, in order to gain insight about the relationship
between eating behaviour and weight control behaviours. It was found that the most important
factors for losing excess weight were identified as the Restraint and Disinhibition eating factors

9
(57). Additionally, the relationship between impulsivity and eating behaviour in a sample of
women was studied (32). The results showed that women who scored higher on the Disinhibition
subscale exhibited more impulsive behaviour, suggesting that impulsive behaviour is related to
the likelihood of overeating or binge eating (32). This research outlines the utility of the TFEQ in
establishing links between certain behaviours and eating patterns.
Replication of the TFEQ Factor Structure
Much research has been conducted to validate and replicate the original factor structure
of the TFEQ: Restrained Eating, Disinhibition, and Hunger. Several studies (24; 59) have pointed
to different factor structures than outlined in the original TFEQ (16). Ganley (59) also conducted a
factor analysis of the TFEQ on a sample of women. The factor analysis replicated the Restraint
and Hunger factors of the original TFEQ (16) however, it was found that the factor of
Disinhibition resulted in two distinct factors of Emotional Eating and Weight Liability. In line
with Ganley (59), Hyland and colleagues (24) were able to replicate some aspects of the original
factor structure of the TFEQ in a sample of students engaged in a weight loss program. The
Restraint Factor was confirmed in this sample; however, the remainder of the items were
dichotomized in two factors: Emotional Eating and Food Interest (24). Although the Restraint
factor was replicated in the studies mentioned above (24; 59), Westenhoefer (31) found issues with
the Restraint subscale of the TFEQ when examining a group of female university students.
Participants who scored high on both the Restraint and Disinhibition subscale were more likely
to possess a more rigid type of restrained eating, while participants who scored high on the
Restraint subscale and low on the Disinhibition subscale exercised a more flexible type of
10
restrained eating (31). Westenhoefer (31) suggested that Restraint was not a uniform construct and
could be productively broken down into “flexible” and “rigid” types of control. Flexible control
was categorized by low disinhibition scores and low BMI values, and represents a more flexible
type of restraint behaviour, whereas Rigid control was categorized by high disinhibition scores
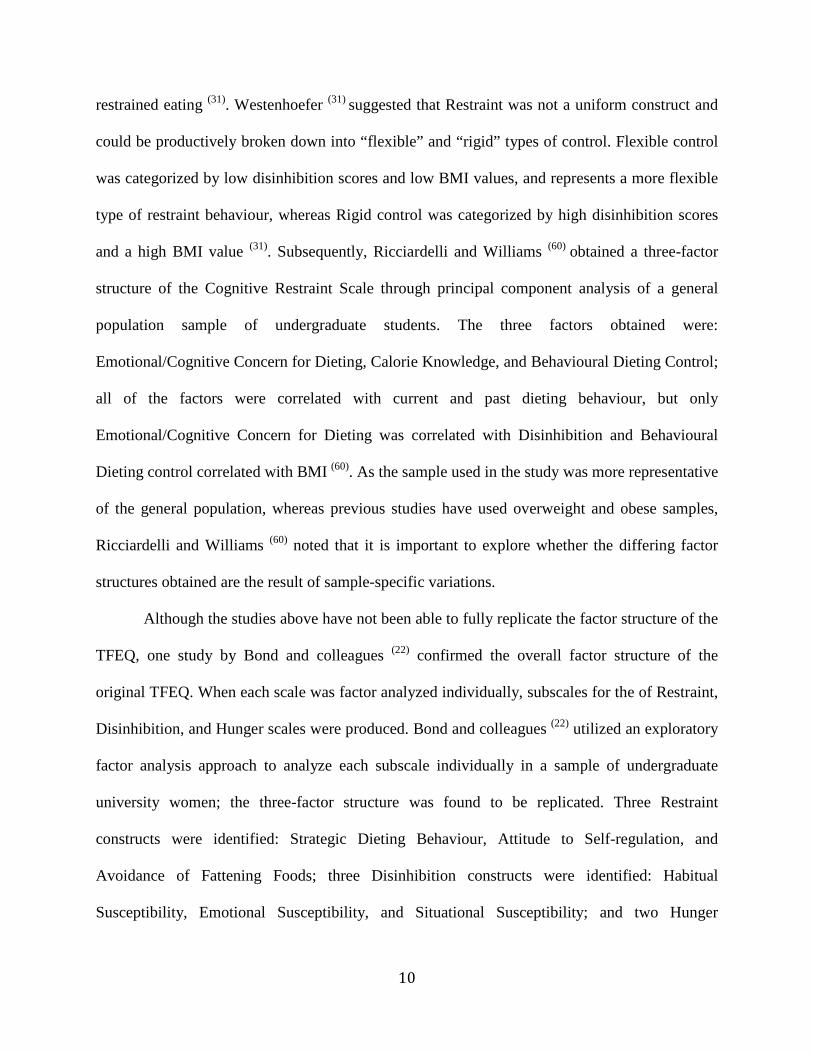
and a high BMI value (31). Subsequently, Ricciardelli and Williams (60) obtained a three-factor
structure of the Cognitive Restraint Scale through principal component analysis of a general
population sample of undergraduate students. The three factors obtained were:
Emotional/Cognitive Concern for Dieting, Calorie Knowledge, and Behavioural Dieting Control;
all of the factors were correlated with current and past dieting behaviour, but only
Emotional/Cognitive Concern for Dieting was correlated with Disinhibition and Behavioural
Dieting control correlated with BMI (60). As the sample used in the study was more representative
of the general population, whereas previous studies have used overweight and obese samples,
Ricciardelli and Williams (60) noted that it is important to explore whether the differing factor
structures obtained are the result of sample-specific variations.
Although the studies above have not been able to fully replicate the factor structure of the
TFEQ, one study by Bond and colleagues (22) confirmed the overall factor structure of the
original TFEQ. When each scale was factor analyzed individually, subscales for the of Restraint,
Disinhibition, and Hunger scales were produced. Bond and colleagues (22) utilized an exploratory
factor analysis approach to analyze each subscale individually in a sample of undergraduate
university women; the three-factor structure was found to be replicated. Three Restraint
constructs were identified: Strategic Dieting Behaviour, Attitude to Self-regulation, and
Avoidance of Fattening Foods; three Disinhibition constructs were identified: Habitual
Susceptibility, Emotional Susceptibility, and Situational Susceptibility; and two Hunger

11
constructs were identified: Internal Locus for Hunger and External Locus for Hunger. One
limitation of Bond and colleague’s (22) research was the failure to measure the applicability of the
TFEQ as a whole. These variances in factor structures produced through factor analysis may be a
result of different populations of focus, implying that the TFEQ needs to be carefully interpreted
when examining clinical versus non-clinical and adults versus child/adolescent samples.
Three subsequent studies were unable to replicate the factor structure observed in the
original TFEQ (20; 24; 61). Mazzeo and colleagues (61) investigated the factor structure and internal
validity of the TFEQ in a population of female adults, using a confirmatory factor analysis; the
three-factor structure of the Stunkard and Messick’s (16) version of the TFEQ did not fit their data
(61). Mazzeo and colleagues (61) also tested the fit of the four-factor model proposed by Ganley (59)
and the three-factor model proposed by Hyland et al. (24). Similar to Stunkard and Messick’s (16)
results, it was found that each item loaded onto one factor. The factor structure of the TFEQ (16)
did not fit the data (61), nor did the factor structure of the modified versions of the TFEQ (24; 59).
Mazzeo et al. (61) noted that more work needed to be done on the factor structure of the TFEQ to
be useful for the evaluation of eating behaviour in clinical settings. Similar to the results of
Ganley (59), Karlsson et al. (20) were unable to replicate the factor structure of the original TFEQ
(16) and identified an additional factor of eating behaviour, titled Emotional Eating.
Psychometrically improved versions of the questionnaire have been developed to address these
issues with the construct validity of the questionnaire (19; 20).

12
Psychometrically Improved Versions of the TFEQ
TFEQ Revised 18 item. Following the development of the 51-item TFEQ, Karlsson et
al. (20) set out to examine construct validity of the TFEQ within a sample of men and women
with obesity, as the TFEQ had yet to be tested on obese and non-obese populations. Karlsson et
al. (20) acknowledged that the Cognitive Restraint scale is applicable to different populations (16),
while the Disinhibition and Hunger scales may require further investigation and refinement.
Using data from participants with obesity, Karlsson et al. (20) were able to replicate the construct
validity of the Cognitive Restraint factor, but not the Hunger and Disinhibition factors. Since the
scaling analysis demonstrated that Disinhibition and Hunger measured the same concept of
Uncontrolled Eating, the items from the two factors were merged (six Hunger items and three
Disinhibition items) (20). The new Emotional Eating factor was found to be reproducible in
subgroups by sex, BMI, and age, based on a sample of 4377 male and female adults with obesity
(20). Based on the most valid items selected from the TFEQ with the highest item to scale
correlation, Karlsson et al. (20) created a revised 18-item TFEQ comprised of three factors, i.e.,
Cognitive Restraint, Uncontrolled Eating, and Emotional Eating. Karlsson et al. (20) noted that
this shortened version would be more applicable in clinical settings that require participants to
fill out multiple questionnaires.
Due to the potential utility of the TFEQ-R18 in a wide range of clinical settings, the
subsequent eating behaviour assessment tool became the subject of many studies to determine
the applicability to various populations. The TFEQ-R18 has been applied to Swedish, French,
Greek, and Spanish samples and has shown success in characterizing eating behaviours in obese
and non-obese samples (23; 62). De Lauzon and colleagues (23) explored the applicability and the
ability of the TFEQ-R18 to differentiate eating patterns among the general population, as

13
Karlsson et al. (23) validated the utility of the TFEQ-R18 in the obese populations uniquely. De
Lauzon et al. (23) found that the TFEQ-R18 was able to differentiate eating patterns in their
sample. Thereafter, Eflag and Linné (62), using the TFEQ-R18, set out to determine if there was
an association between mothers and their children regarding eating behaviour. The results
showed that a higher weight was associated to the factor of Emotional Eating in women, with a
strong link between women and children (female) emotional eating scores (62). In 2012,
Kavazidou and colleagues (63) adapted the TFEQ-R18 to the Greek population. Similarly, the
researchers found that the TFEQ-R18 was a valid measure of Cognitive Restraint, Uncontrolled
Eating, and Emotional Eating. Recently, a Spanish version of Karlsson et al.’s (20) TFEQ-R18
was developed to assess eating behaviours in a sample of Spanish adults; the factor analysis
replicated the original TFEQ-R18 and the internal consistency reliability was found to be high
(r=0.75-0.87) (64). It is clear that cultural differences exist between countries, which emphasizes
the importance of validating the tool for use in different cultures and countries.
Researchers have also investigated the relationship between food preference and eating
behaviour. Looking at a sample of obese and non-obese adults, it was found that participants
who scored higher on the factor of Cognitive Restraint consumed more carbohydrates, sucrose,
and fibre, in comparison to participants with lower Cognitive Restraint scores (65). Using the
TFEQ-R18, De Lauzon and colleagues (23) examined the relationship between food intake and
eating behaviours in both adults and adolescents. The results showed that adults who scored
higher on the Cognitive Restraint factor indicated eating more healthy foods, such as green
vegetables, and less unhealthy food such as French fries, and sugar and confectionary (23). It was
also found that those adults who scored higher on the Uncontrolled Eating factor indicated
consuming more energy dense foods such as fatty foods (23). Adolescents were seen to exhibit

14
results that were not consistent with the adult sample; adolescents with higher scores on the
Cognitive Restraint factor indicated eating fewer energy dense foods, as opposed to more healthy
foods (23). Although the results between adults and adolescents were found to be inconsistent,
these results demonstrate that the questionnaire can distinguish between different eating patterns
and behaviours.
TFEQ Revised 21-item. The TFEQ-R18 (20) was later studied in a sample of Swedish
young male twins, where three items were added to the Emotional Eating scale, to increase the
number of items in the scale and reduce floor and ceiling effects. The three-factor model with
21-items was demonstrated to be stable in the Swedish male sample (30). A revised, shortened
version of the TFEQ has been developed by Cappelleri et al. (19), which is a 21-item
questionnaire (30) utilizing the same items as the original TFEQ, but assessing slightly different
factors: 1) Restraint, which is the same as in the original TFEQ, 2) Uncontrolled Eating (eating
in response to food palatability and likelihood of overeating), and 3) Emotional Eating (eating in
response to negative moods). The TFEQ-R21 is composed of 20 questions measured on a four-
point Likert scale and one question on an eight-point numerical rating scale; the factor scores are
produced by calculating the mean score of the set of items in each factor (19). Cappelleri et al. (19)
evaluated the factor structure and reliability of the TFEQ-R21 in a clinical sample of patients
with and without obesity, as well as a non-clinical sample composed individuals with and
without obesity through a web-based survey. Cappelleri et al. (19) replicated the factor structure of
the TFEQ-R21. The Uncontrolled Eating and Emotional Eating subscales of the TFEQ-R21 were
shown to have utility in predicting weight gain and weight loss success in obese and non-obese

15
adult samples (19). Emotional Eating was also found to be associated with overweight and obesity
(19).
The development of a psychometrically robust and shortened version of the TFEQ by
Cappelleri et al. (19) prompted researchers to create different versions of the TFEQ-R21 to fit
diverse populations, highlighting its expansive clinical and non-clinical implications.
Researchers adapted the TFEQ-R21 (19) for the Brazilian population and analyzed the
psychometric properties of the questionnaire (29). In examining the factor scores of a sample of
undergraduate students in Brazil, the questionnaire was found to be psychometrically valid based
on appropriate discriminant and convergent validity and positive correlations observed between
BMI and the factors of Cognitive Restraint and Emotional Eating (29). Furthermore, three profiles
of individuals based on eating behaviour emerged, which offered insight about the clinical
treatment options specific to eating behaviours (29). The TFEQ-R21 was adapted for the Turkish
population by Karakus et al. (25) and was found to replicate the three factors of the 21-item TFEQ
(19); researchers concluded that the questionnaire was a valid tool for the assessment of eating
behaviour (25). The validity and reliability evidence supporting the adaptations of the TFEQ-R21
(19) demonstrate its potential utility in different populations.
Study of Eating Behaviours in Child and Adolescent Populations
The DEBQ developed by Van Strien et al. (43), as mentioned previously, has also been
adapted to a child version, a parent completed (DEBQ-P) (66) and a child self-completed version
(DEBQ-C) (67). Similar to the TFEQ, the DEBQ measures three aspects of eating behaviour:
Cognitive Restraint (same as the TFEQ), Emotional Eating (same as the TFEQ), and External

16
Eating (eating in response to external stimuli and cues) (43). A systematic review conducted by
Bryant and colleagues (68) reviewed eating behaviour questionnaires applicable for use in
children and adolescents. The review indicated that the 33-item DEBQ-P and 20-item DEBQ-C
have been validated in Dutch (67) and Spanish samples (69), and the DEBQ-P was additionally
validated in an Italian sample (70). It was noted that the DEBQ-C and DEBQ-P appear to be
adequate questionnaires in terms of validity and reliability (68), but many of these versions focus
on child eating behaviours from the parental point of view rather than the child. The DEBQ-C
and DEBQ-P mainly account for differences in weight status as a function of Emotional Eating
(71). The main distinction between the TFEQ-R21 C (19) and the DEBQ (66; 67) is the absence of the
hunger items in the questionnaire in the DEBQ.
Until recently, research on the utility of the TFEQ has focused on varied adult
populations (16; 19; 20; 22; 23; 25; 29; 30), including university students (22; 24; 31), participants of weight
loss interventions (21; 26; 27; 28; 32; 65), and adolescents (23; 62; 72). There has been much research on
the applicability of the TFEQ for use in adult populations; however, minimal research exists on
the utility of the TFEQ for the use in child and adolescent populations. Eflag & Linné (62)
touched very briefly on the use of the TFEQ-R18 in the adolescent population. After exploring
the relationship of eating behaviour between mothers and adolescents, it was found that higher
body weight in adolescents was associated with lower scores on the factor of Cognitive
Restraint. Furthermore, links between mother and adolescent eating behaviour could be seen in
the scores of the Emotional Eating Factor (62). Also using the TFEQ-R18, researchers examining
a sample of French adolescents found that the adolescents with obesity reported higher Cognitive
Restraint (CR) scores as a strategy to control their weight (72). Although Eflag and Linné (62) and
Megalakaki and colleagues (72) analyzed the scores of the TFEQ obtained by adolescents, the

17
limitation of this research lies in the assessment tool. The TFEQ-R18 (20) was developed using a
sample of individuals with obesity and the utility had yet to be tested on child or adolescent
populations; therefore, the findings must be interpreted cautiously and may not be generalizable.
Associations between eating behaviour scores and BMI, and food and taste preferences
have been found in adolescent samples, suggesting the utility of a Child version of the TFEQ-
R21 would be useful to predict problematic eating behaviour and food preferences that may lead
to weight gain. Associations between BMI and restrained eating (14; 23; 62; 72; 73; 74; 75; 76; 77),
emotional eating (69; 72; 78; 79), and uncontrolled eating (13; 72; 80), currently exist in the literature.
However, the questionnaires were not TFEQ versions that had been developed for adolescents.
A group of Spanish researchers (15) published a Spanish version of the TFEQ-R21 tailored
to children and adolescents and their subsequent analysis of the assessment tool. The TFEQ-R21
C Spanish version (15) assessed the same factors as the original TFEQ-R21 (19): 1) Cognitive
Restraint, 2) Emotional Eating, and 3) Uncontrolled Eating. Martin-Garcia and colleagues (15)
performed a confirmatory factor analysis and assessed the reliability of the Child Version of the
TFEQ-R21. Their findings supported the three-factor structure of the original TFEQ-R21 (19).
The internal consistency reliability (α= 0.73) of the Child version of the TFEQ-R21 was found to
be significantly high. Furthermore, a correlation between BMI and eating behaviours in children
was observed; children who scored low on all three subscales of the TFEQ-R21 C were found to
have lower BMI and weight, in comparison to those who scored high (15). Additionally, it was
found that children and adolescents with normal weight received lower scores on the CR and UE
factor, as compared to the overweight children and adolescents (15). In summary, the TFEQ-R21
C Spanish version was found to be valid in predicting eating behaviours and their relationships

18
with weight classifications in children and adolescents and proved to be a useful assessment tool
(15).
More recently, a child version of the TFEQ-R21 (CTFEQ-R21) has been developed by
Dr. Eleanor Bryant at the University of Bradford (13), which is an adapted version of the original
adult TFEQ-R21 (19), to measure the cognitive and behavioural nature of food intake. The
CTFEQ-R21 was developed using structured interviews with children and adolescents, to
determine the extent of their understanding of the items in the adult version of the questionnaire
(19). Based on the responses of the structured interviews, researchers developed the child version;
the specific language children used to restate the items was used to develop the items of the
CTFEQ-R21, making it more understandable to children (13). The results demonstrated that 93%
of children and adolescents understood the questionnaire (13). The CTFEQ-R21 assesses the same
factors as the original TFEQ-R21: 1) Cognitive Restraint, 2) Emotional Eating, and 3)
Uncontrolled Eating (19). Their findings supported the three-factor structure of the original
TFEQ-R21 after the removal of items 17, 18, 19, and 21 (13; 19). The 17-item version of
questionnaire (CTFEQ-R17) had good internal consistency reliability (α= 0.85) (13). Researchers
also explored the relationship between CTFEQ-R17 scores and weight, BMI, and food and taste
preferences. It was found that a higher CR score was associated with a higher weight and BMI,
and high UE and EE scores were associated with a preference for high fat savoury and sweet
foods, with the relationships being stronger in girls compared to boys. These results demonstrate
that the CTFEQ-R17, the adapted version of the adult questionnaire, applies to the child and
adolescent population and is a useful tool to measure eating behavior (13).
19
Gap in the Current Research
The TFEQ has been studied in a wide variety of adult samples (16; 20; 21; 22; 23; 24; 25; 26; 27; 28;
29; 30; 31; 32) however, no research to date has reported on the utility or validation of the instrument
in Canadian child and adolescent populations. Due to the utility of the TFEQ-R21 in adult
populations (19) and the recent validaty of a Child version of the TFEQ-R21 in the United
Kingdom and Spain (13; 15), the development and validation of a Canadian version of the
questionnaire is needed for pediatric populations. Using the TFEQ-R21 C (13), the goal of this
research project was to examine the score validity of the questionnaire for use in the Canadian
pediatric population concurrently with Dr. Bryant in the United Kingdom, with the overarching
goal of validating responses of the newly developed TFEQ-R21 C. Cappelleri and colleagues
have suggested that cultural differences in eating behaviour, factor structures, and the
understanding of questionnaire items exist (19). Therefore, this study was conducted concurrently
with Dr. Bryant in the United Kingdom to increase the external generalizability of the validation
results and validate responses to the questionnaire in Canadian children and adolescents, as
cultural factors may influence the results.
One of the primary causes of overweight and obesity is increased intake of foods that are
high in energy (8) and the ecological model of obesity suggests that dietary intake is one of the
primary modifiable risk factors (9). Since positive energy balance is often the result of dietary
intake and food preferences (4), which are influenced by eating behaviours (16; 34) and appetitive
responsiveness (35), it is important to look at the relationship between eating behaviours, BMI,
and food/taste preferences to gain a complete picture of eating behaviour. The TFEQ was
developed with the intention of predicting changes in weight (16; 19) and evidence of relationships
between BMI and eating behaviours in children and adolescents (13; 15; 16; 14; 23; 62; 69; 72; 73; 74; 75; 76;

20
77; 78; 79; 80) currently exist in the literature, demonstrating that the questionnaire may be a useful
tool to determine problematic eating behaviours and food preferences that may lead to weight
gain in children and adolescents. Given that specific eating behaviours have been linked to
weight gain in children and adolescents (13; 14; 15), a secondary objective of this thesis is to
examine the relationship between eating behaviour traits from the questionnaire and BMI to
determine if the questionnaire is providing useful information that may be used to predict excess
weight. Therefore, as a secondary objective, the intent of the present exploratory validation study
was to determine if relationships exist between eating behaviours and BMI.
Validation of scores for an English version of the TFEQ-R21C, specific to the Canadian
context, is important in identifying eating behaviours to aid in the development and evaluation of
interventions aimed at the early treatment and management of overweight and obesity in
pediatric populations. Studies have shown that obesity maintains a similar trend across the
lifespan (6), persists from childhood to adulthood (4), and that interventions tend to be more
effective in children (81). Validating the Child version of the TFEQ can allow researchers and
clinicians to more accurately assess and target problematic eating behaviours at younger ages
and modify behaviours before they persist into adulthood (81).
21
CHAPTER 2
Thesis Objectives
The overall objective of this thesis was to employ a methodology combining survey
methods, food preference tasks, and anthropometric measures to examine validity evidence and
reliability of the Child version of the TFEQ-R21 (TFEQ-R21 C) (13) responses, to determine if
the tool can be used to assess eating behaviour in the Canadian pediatric population.
The primary objective of this thesis was to analyze the psychometric properties and factor
structure of TFEQ-R21 C (13) responses in a sample of Canadian children and adolescents in the
Ottawa area, concurrently with the validation study conducted by Dr. Bryant in the United
Kingdom. More specifically, the study examined the validity and reliability evidence of TFEQ-
R21 C (19) responses by addressing the following objectives:
1. To determine the factor structure of the questionnaire data, using exploratory factor
analysis.
2. To determine if the reliability of the scores from the TFEQ-R21 C (13) and its factors are
adequate, through the examination of Cronbach alpha coefficients.
3. To examine validity evidence based on item-discriminant and convergent validity,
through the examination of inter-item correlations within factors, and corrected item-total
correlations.
4. To ascertain the convergent validity of the questionnaire by determining if relationships
exist between the previously validated Power of Food Scale (82) factors and the factors of
the TFEQ-R21 C (19).

22
Specific eating behaviours have been linked to weight gain (13; 14; 15) and food and taste
preferences (13) in children and adolescents; therefore, an important secondary objective is to
examine the relationship between the questionnaire and BMI to determine if the questionnaire is
providing useful information that may be used to predict excess weight. Due to the exploratory
nature of this study, cross-sectional relationships between BMI z-score and eating behaviours
measured by the TFEQ-R21 C were examined to determine convergent validity of the
questionnaire and to establish the relationship between the BMI and eating behaviours. In the
case that the primary objective was achieved, and the questionnaire was validated, there were 3
secondary objectives of this thesis, as an exploratory analysis. The study investigated the
relationships between domains of the TFEQ-R21 C (13), anthropometric measurements, and food
and taste preferences by addressing the following secondary objectives:
1. To determine food preferences (e.g., high in fat or carbohydrate) measured by the Leeds
Food Preference Questionnaire (83), of children and adolescents to explore whether eating
behaviour was associated with particular food preferences.
2. To determine taste preferences (e.g., high fat savoury taste preference) measured by the
Leeds Food Preference Questionnaire (83), of children and adolescents to explore whether
eating behaviour was associated with taste preferences.
3. To determine if weight, BMI, and BMI z-scores were associated with eating behaviour
profiles and/or food and taste preferences, to determine convergent validity of the
questionnaire.
23
Thesis Hypotheses
Although the literature surrounding the applicability of the TFEQ-R21 in child and
adolescent populations is currently lacking, it was hypothesized that the TFEQ-R21 C responses
would be valid and reliable in assessing eating behaviours in Canadian children and adolescents
(Ottawa area), based on the results of Bryant et al. (13) and Martin-Garcia et al. (15). More
specifically, based on the available evidence (13; 15), it was hypothesized that:
1. The factor structure of scores from Capelleri’s TFEQ-R21 (19) would be replicated for the
TFEQ-R 21 C (13) in the Canadian sample of children and adolescents from the Ottawa
area, but there was no hypothesized a priori number of subscales of the common factors.
2. The reliability of TFEQ-R21 C (13) scores and its factors would be adequate, with
Cronbach alpha values greater than α= 0.70.
3. The items would load significantly on only one factor, with a factor loading higher than
0.32 and that factors would be distinct.
4. The Power of Food Scale- Child version (82) factors and the TFEQ-R21 C (13) factors
would be correlated, supporting the convergent validity of the questionnaire. More
specifically, the TFEQ-R21 C factors of Uncontrolled Eating and Emotional Eating
would be positively associated with all three subscales (Food Available, Food Present,
and Food Tasted) of the Power of Food Scale- Child version (82).
If the primary objective was achieved and the TFEQ-R21 C was validated, it was hypothesized
that:
1. A higher score on the Uncontrolled Eating and Emotional Eating factors would be
associated with preference for high fat foods, and a higher score on the Uncontrolled

24
Eating factor would be associated with a preference for high protein and high
carbohydrate foods (13).
2. A higher score on the Uncontrolled Eating and Emotional Eating factors would be
associated with high-fat savoury and high-fat sweet taste preferences (13).
3. Patterns between eating behaviour profiles and child/adolescent weight classification
would emerge. It is further hypothesized that higher scores on the Cognitive Restraint
scale (13; 14; 15) and the Uncontrolled Eating factor (15) would be significantly associated
with higher body weight, BMI z-score, and an overweight/obesity weight classification,
supporting convergent validity of the questionnaire.

25
CHAPTER 3
Methods
Participants
The literature provides little guidance in terms of the appropriate sample size for
exploratory factor analysis, although some rules of thumb have been provided in the literature,
such as including a minimum sample size of 100 participants (84), 5 respondents per item (85), or
10-15 participants per item of the questionnaire (86). Based on the recommendations for factor
analysis sample size, and the possibility of attrition and missing data, the intent of the present
study was to recruit a sample of 150-200 children and adolescents. For the secondary objective
of the study, a mixed measures design to examine the correlations of factors and anthropometric
measures and differences between age and sex groups on the factors of the TFEQ-R21 C was
used. A sample of 180 children was considered sufficient to obtain a small effect size (0.25) with
a statistical power of 0.80 (87).
The principal inclusion criteria were that the participants, both male, and female, had to
be between the ages of 8 and 15 to participate and had to be fluent in English, as the
questionnaire is not currently offered in other languages. As the structured interviews used to
determine understanding of the questionnaire were conducted by Bryant and colleagues (13) in
children aged 8-15, this age range was used in this study to ensure the understanding of the
questionnaire. The age range was also chosen to allow for comparison with the study conducted
concurrently in the United Kingdom (13). The information letters and, consent and assent form
packages were sent to 11 English Public and English Catholic Schools in the Ottawa-Carleton
Catholic School Board and the Ottawa-Carleton District School Board, equating to
approximately 1,600 students. A sample of 176 children was recruited from 7 schools across

26
Ottawa. The final sample used for analysis was 158, as some students were absent during the
time of data collection. With the low response rate (~11%), our data was likely affected by non-
response bias (88). Parents and principals noted that low response rates were likely due to parental
concerns about having their child weighed at school and concern that it will encourage weight
teasing. Furthermore, in the case of the older students, teachers indicated that many of the
students did not bring the forms home for their parents to read. Additionally, many schools
declined to participate as they had already participated in research projects that year, or they did
not have enough staff to coordinate and manage the data collection in their school.
Protocol. English Public and English Catholic school boards in the Ottawa area were
contacted to determine their interest in taking part in this study. A first come, first serve approach
was utilized when recruiting participants (convenience sample). Researchers visited each
interested school, and testing dates and times were arranged. Information was sent home with the
children, to parents inviting their child to participate in the study (see Appendix 1) and informing
them of the study (see Appendix 2). The consent form clearly stated that participation in the
study was voluntary and the student would be allowed to decline participation at any point in the
process of the study. Furthermore, it was clearly stated that the study would not affect their
academic record. If the parent was interested in having their child participate in the study, they
completed a consent form detailing the methods, the benefits, risks, and impact of the study. The
completed and signed consent forms were sent back to the school with the students and collected
by the classroom teacher Study coordinators obtained and validated consent forms from schools
before the testing date. Ethical Considerations

27
Research Ethics Board Approval. The Research Ethics Board of the Children’s
Hospital of Eastern Ontario (CHEO; see Appendix 7) and the Research Ethics Board of the
University of Ottawa (see Appendix 9) granted approval for the TFEQ-R21 C validation study
which included the TFEQ-R21 C Questionnaire (13), the Power of Food Scale Questionnaire -
Child version (82), and the Leeds Food Preference Task data collection (83) (see Appendix 6).
School Board Approval. The Ottawa Carleton Research and Evaluation Advisory
Committee granted approval for the TFEQ-R21 C validation study to be conducted in the Ottawa
Carleton Catholic School Board and the Ottawa-Carleton District School Board for the 2016-
2017 academic year (Appendix 8).
Consent. Both parents and children were informed of the aims and procedures of the
study, as well as possible risks and benefits. There were no direct benefits to participants
identified; however, participants were told that that the study was aiming to contribute to finding
better solutions for children struggling with body weight issues. After being provided with full
details of the study at least one week before data collection, written informed consent was
obtained from the parent. Children gave their verbal assent and were assured that they could
withdraw consent at any point during the process. If a participant did not want to participate in
testing, despite their parent’s consent, they could opt-out of participating. A copy of the signed
consent form was provided to the parents of the participants after the testing session.

28
Procedure
Two researchers, trained in testing protocol by senior staff at the Healthy Active Living
and Obesity Research Group (HALO), CHEO Research Institute, carried out consent procedures
and data collection. Researchers were also certified in CPR and First Aid and possessed an up to
date police record check. Researchers arranged a time with the principal and teachers of each
participating school for data collection, at their convenience, as to minimize interference with
class routines. Testing was carried out at approximately the same time of day on each occasion
(between 9 am and 11 am, which is between the participant’s breakfast and lunch), to reduce the
effects of appetite on self-reported eating behaviors and food preferences. The study was
conducted on one single occasion in the classroom or gymnasium at their school. Students with
signed consent and assent forms, and verbal assent completed the questionnaires at their desks,
and the anthropometric measures were recorded by researchers in a private area, under the
supervision of the teacher. Children were informed of their choice to participate in each
assessment, to ensure ongoing informed consent (see Appendix 2). The data collection took
about 20-60 minutes, depending on the number of participants in each class. A teacher or
principal was present at all times during data collection. Participants were not asked to follow a
food restriction diet, nor asked if they were taking any medications that affect their eating
behaviour. Participants were asked to complete three questionnaires (see below), followed by the
collection of anthropometric data. Following the collection of the questionnaires and the
anthropometric data, participants received an oral debriefing of the study (Appendix 4). The
participants were also sent home with an envelope, containing a parent debriefing letter
(Appendix 5), and a copy of the signed consent form. The questionnaires and anthropometric
measures were assessed using the assessment tools described below.

29
Questionnaires
The participants were asked self-complete three short questionnaires on eating behaviour
and food preferences: (1) the 21-item TFEQ for Children (13), (2) the Power of Food Scale - Child
version (82), and (3) the Leeds Food Preference Task (83). Please see Appendix 6 for a copy of the
questionnaires. Hard copies of the questionnaires were administered to the class as a whole to
complete. Some participants sat individually with the researcher to complete the paper copy of
the questionnaire in a separate area, if they were having difficulties in reading or understanding
the content of the questionnaire. All participants received verbal and written instructions on how
to complete the questionnaires. The questionnaires took approximately 20-25 minutes to
complete. Children were permitted to ask for clarification at any time during the testing
procedure.
The Child version of the 21-item Three-Factor Eating Questionnaire (TFEQ-R21
C). The Child version of the TFEQ-R21 (TFEQ-R21 C) (13) is a 21-item questionnaire based on
the adult version of the questionnaire (19). The content validity of the TEFQ-R21C was pre-
determined by Cappelleri et al. (19) and through structured interviews with children and
adolescents (13). The TFEQ-R 21 C maintains the same number of questions (21 items) as the
original questionnaire (19), the 4-point Likert scale for answering items 1 through 20, and the 8-
point numerical response scale for item 21. The TFEQ-R21 C was designed to measure three
factors: 1) Cognitive Restraint (unchanged), 2) Uncontrolled Eating (i.e., eating in response to
food palatability and the likelihood of overeating), and 3) Emotional Eating (i.e., eating in
response to negative moods). The coding of the results was conducted in the manner proposed
by Cappelleri and colleagues (19). Responses on each item of the questionnaire were given a score

30
between 1 and 4, items 1-16 were reverse coded, and item 21 was coded as follows: 1-2 scores as
1, 3-4 scores as 2, 5-6 scores as 3, and 7-8 scores as 4. After items were coded, domain scores
were calculated, as a mean of all items within each domain; therefore, domain scores also ranged
from 1-4 (89). The CR domain contains six items, the UE domain contains six items, and the EE
domain contains six items. Higher scores in each domain are indicative of greater CR, UE, or
EE.
The Power of Food Scale (PFS) - Child Version. The Power of Food Scale - Child
version (C-PFS) is a 19-item questionnaire (82), adapted from the adult version of the
questionnaire, (90) which measures the psychological impact of living in food-abundant
environments as a measure of appetite in the absence of food intake. This questionnaire was
originally validated in adult samples with and without obesity and overweight (19; 90) and more
recently in children and adolescents (91), under the assumption that food is readily present in the
environment, as a method to distinguish hedonic hunger from homeostatic hunger. Three sub-
factors measuring responsiveness to the food environment are assessed: (1) food readily
available in the environment but not physically present (7 items); (2) food present but not tasted
(6 items); and (3) food when first tasted but not consumed (6 items). The items are assessed on a
5-point Likert scale anchored with “I don’t agree at all” on one end to “I strongly agree” on the
other end of the scale. Responses on each item of the questionnaire were given a score between 1
and 4. After the items were coded, domain scores were calculated as the mean of all items within
each domain, therefore domain scores ranged from 1-4. A higher score on the questionnaire is
indicative of greater responsiveness to food and feeling controlled by food (91). The C-PFS (82)
was used to determine convergent validity of the TFEQ-R21 C, as it measures similar aspects of
31
eating behaviour; UE and EE have been found to be positively associated with all three subscales
of the C-PFS (91).
Leeds Food Preference Questionnaire. Participants were asked to self-complete an
adapted paper-based version of the Leeds Food Preference Questionnaire, originally validated in
an adult population (LFPQ) (83), that has been demonstrated to be suitable for use in children (92).
The LFPQ measures the liking, wanting, and preference for certain foods that are categorized by
low and high fat and by sweet and savoury preferences (83). The food preferences identified by
the LFPQ predicts actual food intake; desire to consume sweet and high-fat type foods has been
shown to be linked to the susceptibility to overeat, which may, in turn, cause weight gain (83; 93;
94). Several studies have shown that differences in weight status in children are associated with
macronutrient intake, most notably of which is fat intake (95; 96; 97; 98). The LFPQ has been shown
to differentiate between weight status by food preference categories in children (92). The LFPQ
(83) consists of a list of 32 common unbranded United Kingdom foods; this version of the
questionnaire was modified to fit the Canadian context. The food items listed remained in the
same categories, but the language describing the items was modified to suit common Canadian
foods (i.e., potato chips, strawberries, cake, yoghurt). The questionnaire entails the participant
looking at a list of food items and being asked to note which foods they would like to consume at
that moment, by marking a check mark beside each food item on the questionnaire. Responses
were then coded as 1 for each item the participant indicated they would like to consume. The
responses were then summed into food preference scores for four categories: high protein (8 food
items), high fat (8 food items), high carbohydrate (8 food items), and low energy foods (8 food
items). Mean taste preference scores were also calculated by summing responses into taste
preference scores for four categories: low fast savoury foods (LFSA; 12 food items), low fat

32
sweet foods (LFSW; 5 food items), high fat savoury foods (HFSA; 8 food items), and high fat
sweet foods (HFSW; 7 food items).
Anthropometric Measurements
Once the questionnaires were completed, the researcher measured the participant’s height
and weight in a separate, private area. The participant remained fully clothed, with socks on.
Information about height and weight was not divulged to the child, to avoid issues related to
confidentiality. The collection of anthropometric data took about 2-5 minutes per participant.
Please see Appendix 6 for a copy of the anthropometric data collection form.
Weight. Weight was assessed using a digital scale (A&D Medical, Milpitas, California,
USA). The digital scale was faced toward the researcher and the participant was instructed to
stand on the scale without shoes, but with socks on, facing the wall, and weight was recorded
from the scale to the nearest 0.1 kg. Two weight measurements were taken, and a third
measurement was taken in the instance that the first two measurements were more than 0.5 kg
apart. The average of the two closest measures was recorded.
Height. Height was measured with a portable stadiometer (SECA, Hamburg, Germany)
placed on a flat, level surface. Participants were instructed to stand with heels against the
stadiometer platform, without shoes but with socks. The measurement was taken at peak
inspiration with the head in the Frankfort plane. Height was recorded to the nearest 0.1 cm (99).
Two measurements were taken, and a third measurement was taken in the instance that the first

33
two measurements were more than 0.5 cm apart. The average of the two closest measures was
recorded.
Body mass index (BMI). Weight measurements were used in conjunction with height, to
provide a measure of BMI. BMI is calculated as body weight in kilograms, divided by height in
meters squared (100). BMI is not only the most convenient and cost-effective measure (6), but
published research looking at the validity of the TFEQ mainly uses BMI as a measure of body fat
(100). BMI values were converted into BMI z-scores (standard deviation scores) (101) using the
World Health Organization (WHO) BMI-for-age growth charts reference-standard that accounts
for the child’s age and sex (102). WHO defines overweight and obesity in terms of standard
deviation for the WHO Growth Reference median. Children and adolescents whose BMI-for-age
was greater than 1 standard deviation above the WHO Growth Reference median were classified
as overweight, and greater than 2 standard deviations having obesity (102).

34
CHAPTER 4
Data Analysis and Results
Preliminary Data Analysis
Complete data collected from all participants in the English Public and English Catholic
schools were analyzed. All statistical analyses were completed using the IMB SPSS Statistics
(Version 24.0) (103). Descriptive analyses were conducted, including mean age, BMI, BMI z-
score, mean subscale scores, and percentage of participants in each body weight category. The
preliminary analysis involved the examination of missing data, outliers, and normality (87).
Questionnaire data were considered complete if all questions had been responded to;
anthropometric data were considered complete if both height and weight measurements were
taken successfully. Data were examined for missing values, multivariate, and univariate outliers,
and for violations to the assumptions for multivariate analysis through the procedures outlined by
Tabachnick and Fidell (87). Missing values were located using frequency distributions;
participants with incomplete questionnaire data were excluded from the analysis (n=11) (87; 104).
Univariate outliers were assessed using z-scores and frequency distributions, where a z-score
greater than 3.29 was considered a potential outlier (87). Mahalonobis distance was examined to
detect multivariate outliers, where the probability estimate for a case was considered p<0.001 for
the χ2 value (87). After the identification of univariate and multivariate outliers, outliers were
examined using case-by-case analysis to determine if they would be removed from the analyses.
If the outlier was the result of a measurement or input error, or the outlier represented an extreme
value, it was removed form the analyses. If the inclusion of the outlier produced similar results in
the analyses it was not removed from the data (87). Data was also inspected for violations to the
assumption of normality and linearity, by inspecting skewness and kurtosis values, where

35
absolute values greater than 2 indicated violations to the assumption of normality (87). Lastly,
data were examined for the absence of multicollinearity, where squared multiple correlations
between variables close to values >0.80, variance inflation factors >10, and tolerance values <0.2
indicated multicollinearity (87; 105).
Data used in the Analysis of Variance (ANOVA) and Analysis of Covariance
(ANCOVA) were also tested for assumptions of normality, linearity, absence of outliers, and
homogeneity of variance. Homogeneity of variance was assessed by Levene’s test, where p<0.05
indicated a violation of the homogeneity of variance between groups (86).
Primary Data Analysis
Validity evidence was examined using the validity theory and framework noted in the
Standards for Educational and Psychological Testing, developed by the American Educational
Research Association [AERA], the American Psychological Association [APA] and the National
Council on Measurement Education [NCME] (106). As suggested by the framework (106), first
evidence based on internal structure was examined, by determining the factor structure.
Secondly, evidence based on relationship to other variables, in this case, an external scale which
was the Power of Food Scale factors (82; 91).
Several studies (20; 22; 24; 31; 59; 60; 61) have pointed to different factor and sub-factor
structures than outlined in the original TFEQ (16), and different versions of the questionnaire have
been developed (16; 19; 20). Therefore, this study utilized exploratory factor analysis to examine the
underlying factor structure of the set of observed variables without imposing restrictions, which
allows for the identification of new constructs and sub-factors, since the questionnaire has not

36
yet been validated in Canadian children and adolescents (87). Studies examining the validity and
reliability evidence of the TFEQ have mainly used confirmatory factor analysis; however, this
technique restricts the number of factors that may account for the variance in the data, which can
lead to the neglect of additional factors or sub-factors and possible sample specific variation in
the data (87).
Before an exploratory factor analysis was carried out, the Kaiser-Meyer-Olkin (KMO)
measures of sampling adequacy and the Bartlett’s test of sphericity were performed to confirm if
the data were suitable for factor analysis (107). The data were considered suitable for factor
analysis if the KMO values were between 0.7 and 1.0, and if X2 was significant at p<0.05 (107).
An exploratory, maximum likelihood analysis was performed to determine the factor structure of
the TFEQ-R 21C. Based on previous research, demonstrating correlations between the eating
behaviour factors of the TFEQ-R21 (13; 15; 19) oblique rotation (direct oblimin) was used, to
account for the a priori hypothesized correlations between factors (89). Pattern coefficients were
used for interpretation, as oblique rotation was used (108). The initial number of factors to retain
was determined using a structured sequence of criteria: the eigenvalue-one criteria (eigenvalue >
1) (89), the number of factors identified by the scree plot test, (109) and proportion of variance
accounted for (>5%) (89). Once the above-mentioned criteria had outlined the number of factors
to retain, the interpretability criterion was considered the last and most important step in the
sequence in identifying the number of meaningful factors to retain in the final model (89). The
variables were also required to significantly load on the assigned factor; a loading of at least 0.32
was considered significant (87). Items could not cross-load onto two or more factors with values
of 0.50 or greater (87). To be considered a meaningful factor that was retained, at least 3 variables
(items) were required to load on the factor, the variables were required to share conceptual

37
meaning and measure the same concept, and the factor structure had to demonstrate a simple
structure (89). The TFEQ-R21 C (19) was used as the original initial conceptual model of the
exploratory factor analysis.
The obtained factor structure from the exploratory factor analysis was then examined to
obtain factor-based scores that could be used to examine relationships between factors and PFS
factors, and other variables in the secondary data analysis. Factor-based scores were calculated
as an estimate of a participant’s score on each obtained factor, as outlined in the methods section.
Factor-based scores (unit weighting) were chosen over regression weights as it allows
researchers a simple way to obtain factor scores as a sum or average (87) and are more stable
across different samples (110). To calculate factor-based scores, responses from items loading
onto each factor were summed and then the average of each factor was taken, to transform the
domain scores into continuous variables. Factor-based scores were then used in subsequent
analyses as dependent variables. Although the factor scores are measured at the ordinal Likert
scale, in the subsequent analyses the factor-based scores are treated as continuous variables (111).
Subsequently, an item analysis was carried out to confirm the internal consistency, item-
convergent validity, and item-discriminant validity of the TFEQ-R21 C. Internal consistency was
carried out by performing the Cronbach alpha test for each factor, as well as the questionnaire as
a whole; an alpha >0.70 was considered adequate (112; 113; 114). Item-convergent validity was tested
using Pearson Product Moment Correlations, examining inter-item correlations to determine if
the items on the same scale were measuring the underlying concept; inter-item correlations were
considered adequate if r>0.30 and r<0.70 (114). Inter-item correlations >0.80 may indicate
repetitive items (114; 115). Item- discriminant validity was considered supported if an item
correlated significantly higher with the scale assigned than with all other scales. Corrected item-

38
total correlations (item score is removed from the total score prior to correlation) were also
examined, using Pearson Product Moment Correlations, to test item-discriminant and convergent
validity. The correlations between factors should be <0.30 but should not exceed r=0.70 (114).
Preliminary Analysis Results
The participants who completed the questionnaires consisted of a sample of 158 children,
63 boys (mean age: 11.5 ± 1.6 years; mean BMI: 23.8± 4.5 kg/m2; mean BMI z-score: 0.22±
1.41) and 95 girls (mean age: mean age: 11.9± 1.9 years; mean BMI: 24.7± 6.5 kg/m2; mean
BMI z-score: 0.13± 1.20). Mean eating behaviour factor-based scores by age and sex are
presented in Table 4 and mean food and taste preference scores are presented by eating
behaviour factor-based scores in Table 7.
The properties of the TFEQ-21 C and PFS questionnaire data met the assumptions for
multivariate analysis, including normality, homoscedasticity, linearity, and absence of
multicollinearity. Potential univariate outliers were detected from all variables in the
questionnaire data (n=4) and from the regression scores calculated from the exploratory factor
analysis (n=2). Based on the case by case analysis, two univariate outliers were removed from
the analysis; the additional four potential univariate outliers were included in the analysis as the
z-scores were only slightly above the acceptable value of 3.29 (87), at 3.31. No multivariate
outliers were detected in the questionnaire data.
Data used in the ANOVA and ANCOVA met the assumptions for multivariate analysis,
of linearity, and homogeneity of variance. The assumptions of the absence of outliers and
normality were violated, but disregarded, as the central limit theory posits that with a large

39
sample, sampling distributions can be considered normal even when the scores on the individual
variables may not be, and the ANOVA can produce valid results (87).
Primary Analysis Results
Structure and internal consistency of the TFEQ-R21 C. The data met the assumptions
for exploratory factor analysis. The Kaiser-Meyer-Olkin measure of sampling adequacy index,
with a value of KMO = 0.778 and Barlett’s test of sphericity test with a value of χ2= 938.55
p<0.001 were significant, indicating that there was a sufficient proportion of variance within the
sample and items were sufficiently correlated for factor analysis. Table 1 presents the results
from the maximum likelihood, exploratory factor analysis, with oblique rotation (direct oblimin),
with no restrictions to the structure, using all items of the TFEQ-R21 C questionnaire. The test
produced 6 factors with Eigenvalues greater than 1; the 6 identified factors accounted for 48.4%
of the variance (see Table 1).
Table 1. Rotated factor structure loading of the 21-item Child version of the Three-Factor Eating
Questionnaire (TFEQ-R21 C) with no restrictions or removed items.
Questionnaire Items Factor 1
Factor 2
Factor 3
Factor 4
Factor 5
Factor 6
h2
1. I eat small portions of food to control my weight
-.067 .592 -.029 -.139 .182 .162 .461
2. I start to eat when I feel worried
.057 -.071 .141 -.118 .162 -.908 .999
3. Sometimes when I start eating, it seems I can’t stop
.601 .190 -.080 -.040 -.029 -.087 .378
4. When I am sad, I usually eat too much
-.029 .061 .788 .112 -.027 -.030 .558
5. I don’t eat some kinds of food because they can make me fat
.088 .672 -.005 .112 -.069 -.124 .458
6. When I am eating next to someone who is eating, I also
.042 .071 .019 -.384 .065 -.145 .237

40
feel like eating 7. When I feel angry, I need to eat
.210 .069 .345 -.027 .142 .005 .299
8. I often get so hungry that I feel like I could eat loads of food without getting full
.623 -.027 .088 -.144 -.052 .059 .544
9. When I am hungry, I feel like I have to eat all of the food on my plate in one go, without stopping
.558 -.006 .026 -.051 -.002 -.099 .368
10. When I feel lonely, I make myself feel better by eating
-.093 .063 .373 -.158 .384 -.040 .497
11. I eat less than I want at meal times to stop myself from putting on weight
.035 .678 .153 -.121 -.044 .131 .526
12. When I smell or see my favorite food, I find it hard to stop myself from eating it, even if I’ve just finished a meal
.106 -.061 -.056 -.716 .055 .079 .590
13. I am always hungry enough to eat at anytime
.516 -.164 .097 -.133 .044 .077 .460
14. If I feel nervous, I try to calm myself down by eating
-.002 .009 .035 .000 .973 -.116 .999
15. When I see something that looks delicious, I get so hungry that I have to eat it right away
.121 .027 -.022 -.733 -.015 -.050 .636
16. When I feel really upset, I want to eat
.082 -.082 .562 -.060 .096 -.079 .460
17. How often do you avoid eating or buying tempting foods?
-.238 .022 -.134 .189 -.008 .016 .202
18. How often would you eat less than you wanted to in a meal?
-.080 .329 .115 -.154 -.039 -.069 .178
19. Do you eat lots of food even when you are not hungry?
.368 .008 .083 -.050 .202 .193 .291
20. How often do you feel hungry?
.727 -.129 -.002 .050 -.008 .020 .531
21. What types of eater are you on a scale of 1 to 8? Where 1 means ‘I eat whatever I want, whenever I want’ and where 8 means ‘I am careful about what I eat to control my weight’
-.067 .604 -.149 .243 .155 -.042 .485
Explained variance 16.37 8.56 3.69 2.71 12.78 4.28 - Cumulative variance 16.37 24.93 28.62 31.33 44.11 48.38 - Note. An exploratory, maximum likelihood analysis, using oblique rotation (direct oblimin), was conducted to determine the factor structure of the TFEQ-R21 C, with all questionnaire items included and no factor restrictions. The data in the vertical factor columns are presented as factor

41
loadings for each questionnaire item (n= 21) on four identified factors, for boys and girls ages 8-15 years (n=145). The communality value (h2) for each item is presented horizontally in the last column. For all scales, higher scores are indicative of greater loading onto the identified factor, or greater communality of the item. For this table, bolded values were used to denote a significant factor loading. Abbreviations: TFEQ-R21 C, 21-item Child version of the three-factor eating questionnaire.
In an examination of the scree plot, 3-4 main factors were identified. The results, as
reported in Table 1, identified four common factors, with at least 3 items loading onto each of
these factors, accounting for 31.33 % of the total variance. Two unique factors were also
identified (Factors 5 and 6), accounting for 17.06 % of the total variance, but only one item from
the questionnaire loaded onto each of the identified factors. Items 2 and 14 loaded onto factors 5
and 6 respectively (see Table 1), but these were identified as unique factors. The analysis of
internal consistency revealed that the TFEQ-R21 C had a Cronbach α of 0.77, with Factor 3 (α=
0.78) and Factor 1 (α= 0.78) showing acceptable scores, while Factor 2 (α= 0.63) and Factor 4
(α= 0.69) showed questionable scores. Item 17 also loaded negatively and did not load
significantly on any of the factors.
The scree-plot identified the possibility of 3 or 4 main factors and the unrestricted
exploratory factor analysis identified four common factors with at least three items loading on
each. The results supported a four-factor questionnaire, with the need to remove item 17 from
the questionnaire, thereby suggesting a new structure for the questionnaire. Factors 5 and 6, as
well as item 17 were removed in further analysis, and the questionnaire was referred to as the 20-
item Child version of the Four-Factor Eating Questionnaire (FFEQ-R20 C).
Structure and Internal Consistency of the FFEQ-R20 C. The data met the
assumptions for exploratory factor analysis. The Kaiser-Meyer-Olkin measure of sampling

42
adequacy index (KMO= 0.77) and Barlett’s test of sphericity (X2= 905.55, p<0.001) were
significant, indicating that there was a sufficient proportion of variance within the sample and
items were sufficiently correlated for factor analysis. Table 2 presents the results from the
maximum likelihood, exploratory factor analysis with oblique rotation (direct oblimin), with a
four-factor restriction and item 17 removed from the TFEQ-R21 C questionnaire. The test
produced 4 factors, accounting for 41.2% of the variance. All items loaded significantly on one
factor only (see Table 2).
Table 2. Rotated factor structure loading of the 20-item Child version of the Four-Factor Eating
Questionnaire (FFEQ-R20 C) with a four-factor restriction model.
Questionnaire Items Factor 1 UE 1
Factor 2 CR
Factor 3 EE
Factor 4 UE 2
h2
1. I eat small portions of food to control my weight
-.061 .622 -.028 -.131 .430
2. I start to eat when I feel worried .030 -.037 -.517 -.003 .273 3. Sometimes when I start eating, it seems I can’t stop
.590 .179 .018 .020 .342
4. When I am sad, I usually eat too much .031 .020 -.591 .092 .328 5. I don’t eat some kinds of food because they can make me fat
.052 .634 .019 .103 .389
6. When I am eating next to someone who is eating, I also feel like eating
.017 .078 -.167 -.362 .235
7. When I feel angry, I need to eat .236 .062 -.403 .002 .294 8. I often get so hungry that I feel like I could eat loads of food without getting full
.647 -.034 -.020 -.145 .551
9. When I am hungry, I feel like I have to eat all of the food on my plate in one go, without stopping
.537 -.014 -.060 -.058 .352
10. When I feel lonely, I make myself feel better by eating
-.148 .048 -.736 -.117 .581
11. I eat less than I want at meal times to stop myself from putting on weight
.107 .692 .007 -.081 .499
12. When I smell or see my favorite food, I find it hard to stop myself from eating it, even if I’ve just finished a meal
.080 -.025 .060 -.821 .704

43
13. I am always hungry enough to eat at anytime
.530 -.156 -.075 -.131 .439
14. If I feel nervous, I try to calm myself down by eating
-.114 .088 -.678 -.067 .494
15. When I see something that looks delicious, I get so hungry that I have to eat it right away
.201 .065 -.059 -.578 .543
16. When I feel really upset, I want to eat .113 -.112 -.623 -.011 .437 18. How often would you eat less than you wanted to in a meal?
-.012 .355 -.034 -.105 .152
19. Do you eat lots of food even when you are not hungry?
.341 .016 -.159 -.073 .219
20. How often do you feel hungry? .737 -.124 .073 .016 .537 21. What types of eater are you on a scale of 1 to 8? Where 1 means ‘I eat whatever I want, whenever I want’ and where 8 means ‘I am careful about what I eat to control my weight’
-.136 .592 -.011 .236 .449
Explained variance 21.47 11.27 5.53 2.97 - Cumulative variance 21.47 32.74 38.27 41.24 - Note. An exploratory, maximum likelihood analysis, using oblique rotation (direct oblimin), was conducted to determine the factor structure of the TFEQ-R21 C; the model was restricted to four factors, with item 17 removed. The data in the vertical factor columns are presented as factor loadings for each questionnaire item (n= 20) on four identified factors, for boys and girls ages 8-15 years (n=145). The communality value (h2) for each item is presented horizontally in the last column. For all scales, higher scores are indicative of greater loading onto the identified factor, or greater communality of the item. For this table, bolded values were used to denote a significant factor loading. Abbreviations: FFEQ-R20 C, 20-item Child version of the three-factor eating questionnaire. As seen in Table 2, the factor of EE was retained as in the original TFEQ-R 21 (19), with
items 2, 4, 7, 10, 14, and 16 loading onto Factor 2. The original factor of CR (19) was also
retained, with items 1, 5, 11, 18, and 21 loading onto Factor 3, with the exception of item 17,
which was removed in the previous analysis. The original factor of UE (19) was also retained, but
items from the original UE factor divided into two factors in the data; Factor 1 (items 3, 8, 9, 13,
19, and 20) and Factor 4 (items 6, 12, 15) in Table 2. Therefore, Factor 1 was titled UE 1, with
items 3, 8, 9, 13, 19, and 20 loading onto the same factor and Factor 4 was titled UE 2, with

44
items 6, 12, and 15 loading onto the same factor. The items in both UE 1 and UE 2 were related
to uncontrolled eating, but UE 1 were conceptually related to cognition (i.e., thinking about
food), whereas the items in UE 2 were conceptually more related to senses (i.e., seeing or
smelling food). Supported by the Externality theory, UE 1 was termed Internal Uncontrolled
Eating, and UE 2 was termed External Uncontrolled Eating (116; 117).
The internal reliability analysis revealed that the FFEQ-R20 C had a Cronbach α of 0.81,
representing good internal consistency, with the factors of CR (α=0.71), EE (α=0.78) and UE 1
(α=0.78) showing similarly acceptable scores. However, the factor of UE 2 showed a lower,
questionable/acceptable level of internal consistency (α= 0.69). Items correlated most strongly
with their respective factors, supporting item-discriminant and convergent validity. The item
analysis revealed that all the factors had adequate to good inter-item correlations for CR (r=0.12-
0.50), EE (r=0.24-0.62), UE 1 (r=0.27-0.48), and UE 2 (r=0.30-0.57), showing that the items
within each scale correlated with one another. The corrected item-total correlation values were
good for all factors: CR (r=0.30-0.50), EE (r=0.43-0.60), UE 1 (r=0.41-0.63), and UE 2 (r=0.40-
0.61). Additionally, the strongest correlation of each item was found with the scale assigned,
meeting the criteria for item-discriminant validity (UE 1: r=0.58-0.78; UE 2: r=0.72-0.85 CR:
r=0.54-0.76; EE: r=0.62-0.76), which indicated that all 20 items correlated more strongly with
the factor they were associated with from the EFA. Furthermore, the correlations between factors
UE 1, EE and CR did not exceed 0.70 (r= -0.66-0.69), with the exception of factors UE 1 and UE
2 (r=0.58-0.92). The factor of UE 1 correlated significantly with UE 2 (r=0.52, p<0.001) and EE
(r=0.27, p<0.01). The factor of UE 2 correlated significantly with EE (r=0.36, p<0.001). The
factor of CR correlated significantly with EE (r=0.20, p<0.05).

45
The reliability analysis was also conducted as the original TFEQ-R21 C suggested (19),
where uncontrolled eating was considered a single factor (UE 1 and UE 2 merged to form UE
factor). The Cronbach alpha for the UE factor was considered good, with an α= 0.82.
Adapted three-factor model of the FFEQ-R21 C. The data can be fit into a three-factor
model to allow for comparison with the original TFEQ-R21 C (19) currently used to assess eating
behaviour in adults. The three-factor structure can be achieved by merging the items from the
previously mentioned UE 1 and UE 2 scales as the original questionnaire suggests (19), and
removing item 17, as it was previously identified to be problematic due to the negative non-
significant loading on all factors. Please refer to Table S1 in Appendix 10 for the adapted three-
factor model results.
Secondary Data analysis
Participants were dichotomized by age into two groups, 8-11 years and 12-15 years, to
allow for group comparisons between older and younger children, and with the results of the
validation study conducted in the United Kingdom (13).
Relationship between the Power of Food Scale factors and anthropometric
measures. Bivariate correlations explored relationships between the Power of Food Scale (PFS)
factors (food available, food present and food tasted) and weight, BMI, and BMI z-score, by sex
(boys and girls) and age group (8-11 years and 12-15 years).
Relationship between the Power of Food Scale factors of the FFEQ-R20 C factors.
Partial correlations, controlling for BMI z-score, were used to examine the relationship between

46
PFS factors and TFEQ-R21 C factors. Partial correlations controlling for age and BMI, and sex
and BMI, were used to examine the relationship between TFEQ-R21 C factors and PFS factors
by sex (boys and girls) and age group (8-11 years and 12-15 years) respectively, to determine
convergent validity.
Relationship between the FFEQ-R20 C and participant characteristics. Bivariate
correlations examined the relationship between age and the FFEQ-R20 C factors by sex. Before
conducing all ANOVA tests, Levene’s test of homogeneity was performed to determine if the
data were suitable for analysis, and outliers were assessed using boxplots. A two-way factorial
ANOVA was conducted to compare the main effects of age and sex (independent variables), and
the interaction effect between age and sex, on FFEQ-R20 C factor-based scores (dependent
variables). Age included two levels (8-11 years and 12-15 years), and sex included two levels
(boys and girls). A one-way factorial ANOVA was used to compare the main effect of weight
classification (independent variable) on FFEQ-R20 C factor-based scores (dependent variable);
weight classification included two levels (normal weight and overweight/obesity classification).
Partial correlations, controlling for age, were used to examine the relationships between FFEQ-
R20 C factors and anthropometric measures, including weight, BMI, and BMI z-score.
Correlations were classified as small (±0.1), medium (±0.3), and large (±0.5) (86).
Since there are no clinical cut-offs or ranges of eating behaviour scores, a median split on
CR, UE, and EE factor-based scores was used to dichotomize scores on each factor, to allow for
group comparisons. A median split was used to create eating behaviour groupings of: low and
high CR (median = 2.20) groups (LCR and HCR), low and high UE 1 (median = 2.00) groups

47
(LUE 1 and HUE 1), low and high UE 2 (median = 2.33) groups (LUE 2 and HUE 2), and low
and high EE (median = 1.5) groups (LEE and HEE).
Relationship between the FFEQ-R20 C factors and anthropometric measurements.
A two-way factorial ANCOVA, controlling for age, was used to analyze the main effect of sex
and eating behaviour median split factor-based groupings (independent variables) on
anthropometric measures of weight, BMI, and BMI z-score (dependent variables).
Relationship between food preferences and anthropometric measures. Bivariate
correlations explored relationships between weight, BMI, and BMI z-score and food preference
(high protein, high carbohydrate, high fat and low energy food preference), by sex (boys and
girls) and age group (8-11 years and 12-15 years).
Relationship between FFEQ-R20 C factors and food preferences. Partial correlations,
controlling for BMI z-score (which also controls for age and sex), were used to examine the
relationship between FFEQ-R20 C factors and food preferences. Partial correlations controlling
for age and BMI, and sex and BMI, were used to examine the relationship between FFEQ-R20 C
factors and food preferences by sex (boys and girls) and age group (8-11 years and 12-15 years)
respectively. Before conducting all ANCOVA tests, Levene’s test of homogeneity was
performed to determine if the data were suitable for analysis. A two-way factorial ANCOVA,
controlling for BMI z-score, was used to analyze the main effect of eating behaviour median split
factor-based scores (independent variables) on food preferences scores (dependent variables).

48
Relationship between taste preferences and anthropometric measurements. Bivariate
correlations explored relationships between weight, BMI, and BMI z-score and taste preference
(HFSA, HFSW, LFSA, and LFSW) by sex (boys and girls) and age group (8-11 years and 12-15
years).
Relationship between FFEQ-R21 C factors and taste preferences. Partial correlations,
controlling for BMI z-score (which also controls for age and sex), were used to examine the
relationship between the FFEQ-R20 C factors and taste preferences. Partial correlations
controlling for age and BMI, and sex and BMI, were used to examine the relationship between
FFEQ-R20 C factors and taste preferences by sex (boys and girls) and age group (8-11 years and
12-15 years), respectively. Before conducting all ANCOVA tests, Levene’s test of homogeneity
was performed to determine if the data were suitable for analysis. A two-way factorial
ANCOVA, controlling for BMI z-score, was used to analyze the main effect of eating behaviour
grouping factor-based scores (independent variables) on taste preferences (dependent variables).
After conducting all ANOVA and ANCOVAs, Cohen’s f2 based on the partial η2 was
used to determine the effect sizes, which allows for the interpretation of the practical and clinical
significance of the results (118). Effect sizes were interpreted based on Cohen’s (118) guidelines, in
which f2 ≥0.02 was considered a small effect size, f2≥0.15 was considered a medium effect size,
and f2≥0.35 was considered a large effect size (87).
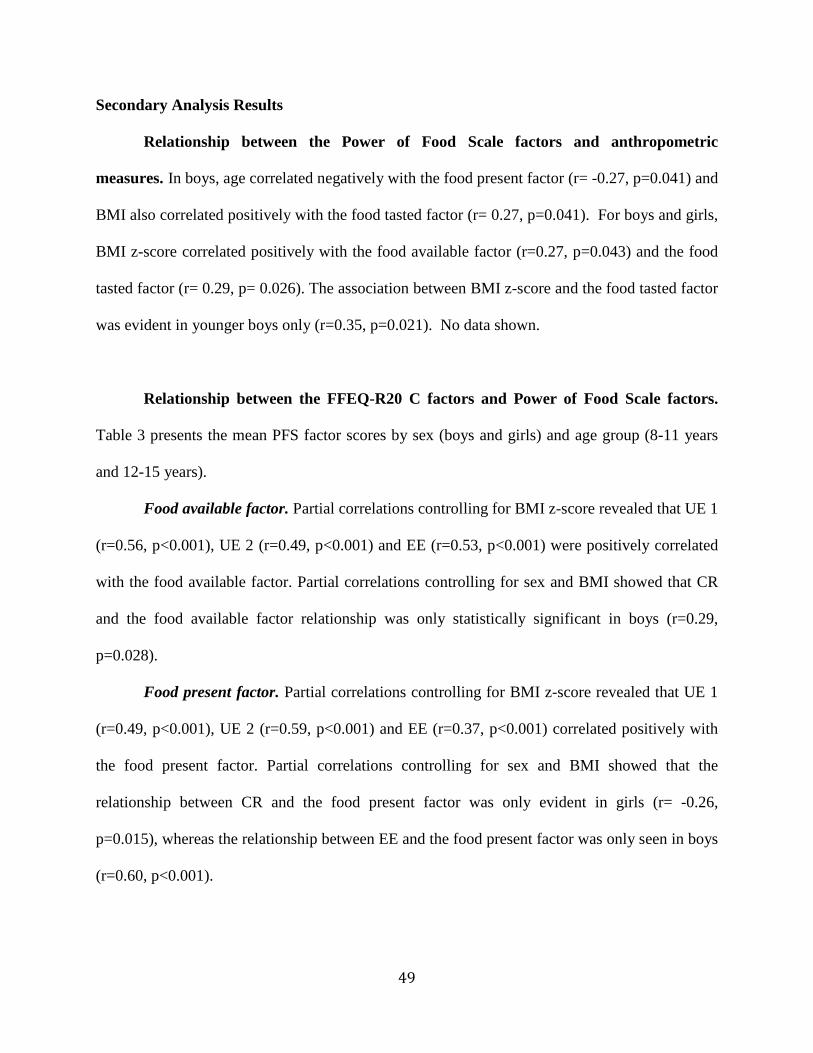
49
Secondary Analysis Results
Relationship between the Power of Food Scale factors and anthropometric
measures. In boys, age correlated negatively with the food present factor (r= -0.27, p=0.041) and
BMI also correlated positively with the food tasted factor (r= 0.27, p=0.041). For boys and girls,
BMI z-score correlated positively with the food available factor (r=0.27, p=0.043) and the food
tasted factor (r= 0.29, p= 0.026). The association between BMI z-score and the food tasted factor
was evident in younger boys only (r=0.35, p=0.021). No data shown.
Relationship between the FFEQ-R20 C factors and Power of Food Scale factors.
Table 3 presents the mean PFS factor scores by sex (boys and girls) and age group (8-11 years
and 12-15 years).
Food available factor. Partial correlations controlling for BMI z-score revealed that UE 1
(r=0.56, p<0.001), UE 2 (r=0.49, p<0.001) and EE (r=0.53, p<0.001) were positively correlated
with the food available factor. Partial correlations controlling for sex and BMI showed that CR
and the food available factor relationship was only statistically significant in boys (r=0.29,
p=0.028).
Food present factor. Partial correlations controlling for BMI z-score revealed that UE 1
(r=0.49, p<0.001), UE 2 (r=0.59, p<0.001) and EE (r=0.37, p<0.001) correlated positively with
the food present factor. Partial correlations controlling for sex and BMI showed that the
relationship between CR and the food present factor was only evident in girls (r= -0.26,
p=0.015), whereas the relationship between EE and the food present factor was only seen in boys
(r=0.60, p<0.001).

50
Food tasted. Partial correlations controlling for BMI z-score revealed that UE 1 (r=0.49,
p<0.001), UE 2 (r=0.52, p<0.001) and EE (r=0.31, p<0.001) were positively correlated with the
food tasted factor. Partial correlations controlling for sex and BMI showed that the relationship
between EE and the food present factor was only evident in boys (r=0.38, p<0.001).

51
Table 3. Pearson Product Moment correlations coefficients and significance values for the relationship between FFEQ-R20 C factors
and Power of Food Scale factors, by sex and age groups.
Note. Data are presented as Pearson Product Moment correlation coefficients, denoted by the symbol [r], and (significance), denoted by the symbol [p]. Partial Pearson Product moment correlations, controlling for BMI z-score, were used to determine the relationship between the FFEQ-R20 C and food and taste preferences (n=145). Partial correlations controlling for age and BMI, and sex and BMI, were used to examine the relationship between FFEQ-R20 C factors and food preferences by sex (boys and girls), and age group (8-11 years and 12-15 years), respectively. A higher correlation coefficient value denotes a greater linear relationship (negative or positive). Degrees of freedom: Boys= 54, Girls=83, 8-11 years= 82, 12-15 years= 55, Total= 143. Correlation coefficient was significant at the level of p<0.05. Correlation coefficients that were statistically significant are identified by this symbol [*] and bolded. Abbreviations: FFEQ-R20 C, 20-item Child Version of the Four-Factor Eating Questionnaire; CR, Cognitive Restraint; UE 1, Uncontrolled Eating 1; UE 1, Uncontrolled Eating 2; EE, Emotional Eating; HPP, High Protein Preference; HCP, High Carbohydrate Preference; HFP, High Fat Preference; LEP, Low Energy Preference; High Fat Savoury, HFSA; High Fat Sweet, HFSW; Low Fat Savoury, LFSA; Low Fat Sweet, LFSW.
CR UE 1 UE 2 EE Boys Girls
8-11 years
12-15
years
Total
Boys Girls
8-11 years
12-15 years
Total Boys Girls
8-11 years
12-15 years
Total Boys Girls
8-11 years
12-15 years
Total
Food Available
0.29* 0.028
-0.10 0.360
0.02 0.873
0.07 0.621
0.06 0.500
0.61* <0.001
0.52* <0.001
0.57* <0.001
0.53* <0.001
0.56* <0.001
0.54* <0.001
0.43* <0.001
0.50* <0.001
0.45* <0.001
0.49* <0.001
0.69* <0.001
0.43* <0.001
0.53* <0.001
0.51* <0.001
0.53* <0.001
Food Present
0.11 0.401
-0.26* 0.015
-0.18 0.105
-0.04 0.751
-0.12 0.158
0.54* <0.001
0.45* <0.001
0.54* <0.001
0.41* 0.002
0.49* <0.001
0.61* <0.001
0.55* <0.001
0.63* <0.001
0.41* <0.001
0.59* <0.001
0.60* <0.001
0.18 0.100
0.40* <0.001
0.34* <0.001
0.37* <0.001
Food Tasted
0.07 0.624
-0.20 0.061
-0.08 0.464
-0.16 0.226
-0.10 0.228
0.60* <0.001
0.40* <0.001
0.52* <0.001
0.40* 0.002
0.49* <0.001
0.62* <0.001
0.44* <0.001
0.60* <0.001
0.37* 0.005
0.52* <0.001
0.39* 0.002
0.22* 0.038
0.378** <0.001
0.17 0.202
0.31* <0.001

52
Relationship between FFEQ-R20 C and participant characteristics. Table 4 presents
the mean FFEQ-R20 C factor-based scores by age groups (8-11 years and 12-15 years) and sex
(boys and girls). For boys and girls, UE 1 and CR correlated negatively with age (r= -0.17,
p=0.04 and r= -0.31, p<0.001 respectively). The factor of UE 1 correlated negatively with age
for boys only (r= -0.33, p=0.012), whereas the factor of CR correlated negatively in boys and
girls (r=-0.28, p=0.03; r=-0.29, p=0.01, respectively). No significant correlations with age and
EE were found. The ANOVA revealed that younger children reported higher UE 1 scores
[F(1,143)= 3.99, p=0.048, f2= 0.028] and CR scores [F(1,143)= 3.99, p= 0.001, f2= 0.089] (see
Table 4). Mean factor scores of UE 2 and EE did not significantly differ between age groups.
Mean factor scores did not significantly differ between sex.
Table 4. 20-item Child Version of the Four-Factor Eating Questionnaire C (FFEQ-R20 C), mean
factor-based scores between age and sex groups.
8-11 years old 12-15 years old All age groups (8-15 years old)
Boys (n=42)
Girls (n=44)
Total (n= 86)
Boys (n=16)
Girls (n=43)
Total (n=59)
Boys (n=58)
Girls (n=87)
CR 2.37
(0.50)
2.18
(0.64)
2.27*
(0.59)
1.98
(0.47)
1.85
(0.53)
1.89*
(0.51)
2.26
(0.52)
2.02
(0.62)
UE 1 2.25
(0.73)
2.07
(0.64)
2.16*
(0.69)
1.88
(0.47)
2.01
(0.47)
1.97*
(0.47)
2.15
(0.68)
2.04
(0.56)
UE 2 2.53
(0.83)
2.56
(0.76)
2.55
(0.79)
2.19
(0.82)
2.53
(0.69)
2.44
(0.73)
2.44
(0.83)
2.54
(0.72)
EE 1.72
(0.54)
1.57
(0.52)
1.64
(0.54)
1.54
(0.61)
1.47
(0.43)
1.49
(0.48)
1.67
(0.56)
1.52
(0.48)
Note. Data are presented as mean factor-based scores (standard deviation). A two-way factorial analysis of variance was conducted to compare the main effects of age (8-11 years and 12-15 years old) and sex (boys and girls), on FFEQ-R20 scores (n=145). Means that were statistically significantly different between age groups (8-11 years and 12-15 years) are identified by this

53
symbol [*] and bolded. Abbreviations: FFEQ-R20 C, 20-item Child Version of the Four-Factor Eating Questionnaire; CR, Cognitive Restraint; UE 1, Uncontrolled Eating 1; UE 1, Uncontrolled Eating 2; EE, Emotional Eating. *Younger children have significantly higher UE 1 score compared to older children [F(1,143)= 3.99, p=0.048]. *Younger children have significantly higher CR score compared to older children [F(1,143)= 3.99, p= 0.001].
Relationship between and the FFEQ-R20 C and anthropometric measurements. For
boys and girls, UE 1 correlated positively with BMI z-scores (r= 0.17, p=0.01). Controlling for
age, no associations were found for CR, UE 1, UE 2, and EE with weight and BMI. Table 5
provides the mean FFEQ-R20 C factor-based scores by weight classification (normal weight and
overweight/obese), based on BMI z-scores. The ANOVA revealed that children with overweight
or obesity [F(1,143)= 2.75, p<0.001, f2= 0.035] reported higher EE scores. No significant
differences in UE 1, UE 2 or CR were found between children with normal weight and children
with overweight or obesity.
Table 5. 20-item Child Version of the Four-Factor Eating Questionnaire C (FFEQ-R20 C) mean
factor-based scores by weight classification.
Domain Score Normal weight classification1
(n= 134) Overweight/obesity classification1
(n=8) CR 2.11 (0.58) 2.40 (0.60)
UE 1 2.05 (0.58) 2.15 (0.67) UE 2 2.49 (0.78) 2.42 (0.46) EE 1.54 (0.47)* 2.15 (0.67)*
Note. Data are presented as mean factor-based scores (standard deviation). Weight classifications are based on World Health Organization BMI-for-age growth charts reference-standard (102), denoted by this symbol [1]. A one-way factorial ANOVA was used to compare the main effect of weight classification (normal weight and overweight/obesity) on factor-based scores. Means that were statistically significantly different between weight classifications (normal weight and overweight/obesity) are identified by this symbol [*] and bolded. Abbreviations: FFEQ-R20 C,

54
20-item Child Version of the Four-Factor Eating Questionnaire; CR, Cognitive Restraint; UE 1, Uncontrolled Eating 1; UE 1, Uncontrolled Eating 2; EE, Emotional Eating. *Children under the overweight/obesity classification reported significantly higher scores, compared to the children under the normal weight classification [F(1,143)= 2.75, p<0.001]. Table 6 presents the mean anthropometric measurements by high and low FFEQ-R20 C
factor-based scores. The ANCOVA revealed that boys who reported a HUE1 had a significantly
higher weight [F(1,58)= 6.44, p=0.014, f2= 0.117 ], BMI [F(1,58)= 5.77, p=0.020, f2=0.106], and
BMI z-score [F(1,58)= 4.45, p=0.039, f2=0.083], compared to boys that reported a LUE1. Age
was a significant covariate in the analysis of the difference between HUE1 and LUE1 scores and
weight in boys (p<0.001). No significant differences were found between sex on high and low
factor-based scores, and no significant differences were found within sex on high and low factor-
based scores of UE 2, CR, and EE.
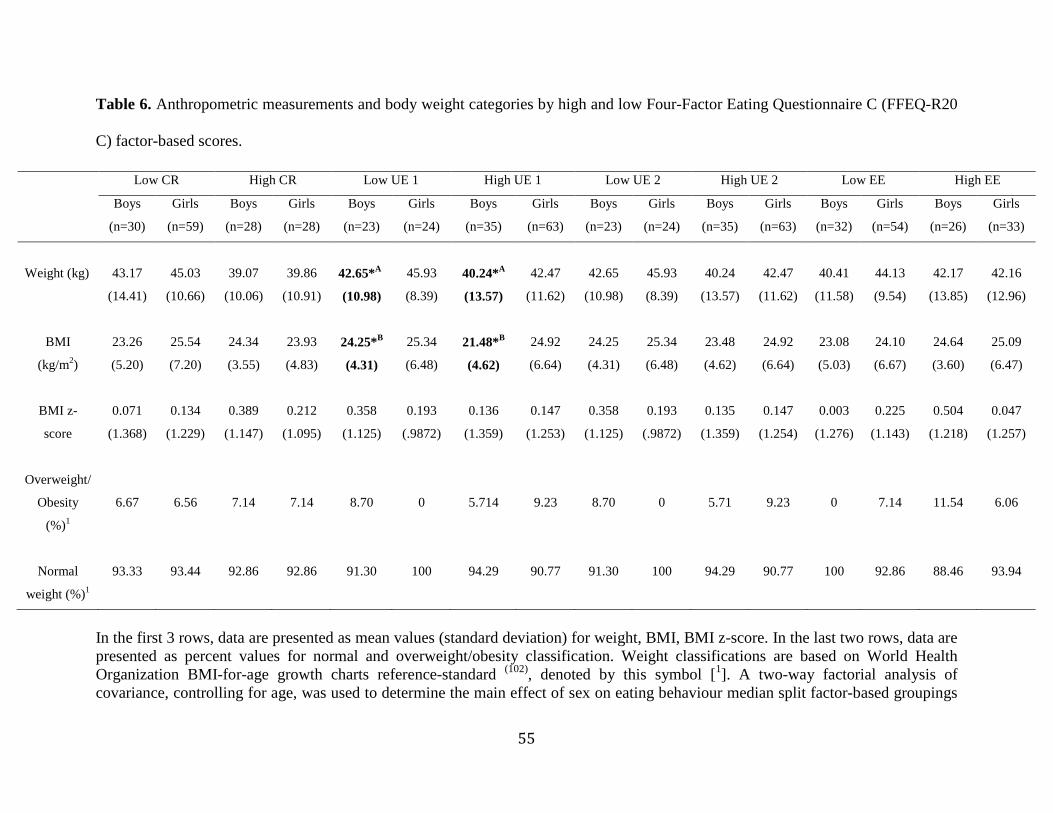
55
Table 6. Anthropometric measurements and body weight categories by high and low Four-Factor Eating Questionnaire C (FFEQ-R20
C) factor-based scores.
In the first 3 rows, data are presented as mean values (standard deviation) for weight, BMI, BMI z-score. In the last two rows, data are presented as percent values for normal and overweight/obesity classification. Weight classifications are based on World Health Organization BMI-for-age growth charts reference-standard (102), denoted by this symbol [1]. A two-way factorial analysis of covariance, controlling for age, was used to determine the main effect of sex on eating behaviour median split factor-based groupings
Low CR High CR Low UE 1 High UE 1 Low UE 2 High UE 2 Low EE High EE
Boys
(n=30)
Girls
(n=59)
Boys
(n=28)
Girls
(n=28)
Boys
(n=23)
Girls
(n=24)
Boys
(n=35)
Girls
(n=63)
Boys
(n=23)
Girls
(n=24)
Boys
(n=35)
Girls
(n=63)
Boys
(n=32)
Girls
(n=54)
Boys
(n=26)
Girls
(n=33)
Weight (kg)
43.17
(14.41)
45.03
(10.66)
39.07
(10.06)
39.86
(10.91)
42.65*A
(10.98)
45.93
(8.39)
40.24*A
(13.57)
42.47
(11.62)
42.65
(10.98)
45.93
(8.39)
40.24
(13.57)
42.47
(11.62)
40.41
(11.58)
44.13
(9.54)
42.17
(13.85)
42.16
(12.96)
BMI
(kg/m2)
23.26
(5.20)
25.54
(7.20)
24.34
(3.55)
23.93
(4.83)
24.25*B
(4.31)
25.34
(6.48)
21.48*B
(4.62)
24.92
(6.64)
24.25
(4.31)
25.34
(6.48)
23.48
(4.62)
24.92
(6.64)
23.08
(5.03)
24.10
(6.67)
24.64
(3.60)
25.09
(6.47)
BMI z-
score
0.071
(1.368)
0.134
(1.229)
0.389
(1.147)
0.212
(1.095)
0.358
(1.125)
0.193
(.9872)
0.136
(1.359)
0.147
(1.253)
0.358
(1.125)
0.193
(.9872)
0.135
(1.359)
0.147
(1.254)
0.003
(1.276)
0.225
(1.143)
0.504
(1.218)
0.047
(1.257)
Overweight/
Obesity
(%)1
6.67
6.56
7.14
7.14
8.70
0
5.714
9.23
8.70
0
5.71
9.23
0
7.14
11.54
6.06
Normal
weight (%)1
93.33 93.44 92.86 92.86 91.30 100 94.29 90.77 91.30 100 94.29 90.77 100 92.86 88.46 93.94

56
on anthropometric measures of weight, BMI, and BMI z-score. Means that were statistically significantly different between eating behaviour groups (Low and High factor-based scores) are identified by this symbol [*] and bolded. Abbreviations: FFEQ-R20 C, 20-item Child Version of the Four-Factor Eating Questionnaire; CR, Cognitive Restraint; UE 1, Uncontrolled Eating 1; UE 1, Uncontrolled Eating 2; EE, Emotional Eating; BMI, Body Mass Index. *ABoys, in the High UE 1 group had a significantly higher weight compared to the Low UE 1 group [F(1,58)= 6.44, p=0.014].*B Boys in the High UE 1 group had a significantly higher BMI compared to the Low UE 1 group [F(1,58)= 5.77, p=0.020].*CBoys in the High UE 1 group had a significantly higher BMI z-score compared to the Low UE 1 group [F(1,58)= 4.45, p=0.039].Age was a significant covariate in the analyses (p<0.001).

57
Relationship between food and taste preferences, and anthropometric
measurements. BMI correlated positively with high protein preference (r=0.21, p=0.011) and
high fat preference (r=0.18, p=0.028). The associations with high protein (r=0.28, p=0.030) and
high fat (r=0.32, p=0.014) were only significant for boys. In younger boys, weight correlated
positively with high fat preference (r=0.37, p=0.016), whereas BMI correlated positively with
high fat preference (r=0.36, p=0.020) and low energy preference (r=0.31, p=0.044). For younger
boys, BMI z-score correlated positively with high carbohydrate preference (r=0.36, p=0.030) and
high fat preference (r=0.43, p=0.004). For older boys, BMI correlated positively with high
protein preference (r=0.55, p=0.028) and BMI z-score correlated negatively with low energy
preference (r=-0.53, p=0.034). Data not shown.
BMI correlated positively with preference for HFSA foods (r=0.25, p=0.003) and LFSA
(r=0.16, p=0.049), for boys and girls. In younger children, weight correlated positively with
preference for LFSA foods (r=0.21, p=0.047) and LFSW foods (r=0.24, p=0.027). For younger
boys, BMI z-score correlated positively with LFSA (r=0.36, p=0.020). In older children, BMI
positively correlated with preference for HFSA foods (r=0.33, p=0.010). The association
between HFSA food preference and BMI was only significant in older girls (r=0.33, p=0.010).
No associations with age, weight, BMI, and BMI z-score were found for preferences for HFSW
foods. Data not shown.
Relationship between FFEQ-R20 C factors and food and taste preference. Table 7
presents the mean food and taste preference scores derived from the Leeds Food Preference
Questionnaire, by high and low FFEQ-R20 C factor-based scores. Please refer to Table S2 in
Appendix 10 for the Pearson Product Moment correlation coefficients and significance values of

58
the relationship between the FFEQ-R20 C, and food and taste preferences, by sex (boys and
girls) and age group (8-11 years and 12-15 years). Please refer to Table S 3inAppendix 10 for
mean food and taste preference scores by high and low FFEQ-R20 C factor-based scores for
boys and girls.
High protein food preference. The ANCOVA controlling for BMI z-score indicated that
the HUE 1 and HUE 2 groups reported a greater food preference for high protein compared to
the LUE 1 [F(1,147)= 10.14, p=0.002, f2= 0.071] and LUE 2 [F(1,147)= 11.38, p=0.001, f2=
0.079] groups. No differences were found between low and high factor-based scores of CR and
EE and preference for high protein foods (see Table 7).
High carbohydrate food preference. The ANCOVA, controlling for BMI z-score,
indicated that the HUE 2 group reported a greater food preference for high carbohydrate
compared to the LUE 2 group [F(1,147)= 15.77, p<0.001, f2=0.110], whereas the LCR group
reported a higher preference for high carbohydrate foods [F(1,147)= 7.98, p=0.005, f2= 0.056]
compared to the HCR group. No differences were found between low and high factor-based
scores of UE 1 and EE and preference for high carbohydrate foods (see Table 7).
High fat food preference. The ANCOVA, controlling for BMI z-score, indicated that the
HUE 1, HUE 2 and LCR groups reported a greater food preference for high fat foods compared
to the LUE 1 [F(1,147)= 9.50, p=0.002, f2= 0.063], LUE 2 [F(1,147)= 13.92, p<0.001, f2= 0.095]
and HCR [F(1,147)= 6.97, p=0.009, f2= 0.053] groups. BMI was a significant covariate in the
analysis of low and high UE 2 [F(1,147)= 4.35, p=0.039, f2= 0.030] and CR [F(1,147)= 7.60,
p=0.041, f2= 0.030]. No differences were found between low and high factor-based scores for
EE and preference for high fat foods (see Table 7).

59
Low energy food preference. The ANCOVA, controlling for BMI z-score, did not
indicate any significant correlations between high and low UE 1, UE 2, CR, and EE factor-based
scores and low energy food preference (see Table 7).
No differences were found between boys and girls of low and high factor median split
factor-based grouping on food preference.
High fat savoury preference. The ANCOVA, controlling for BMI z-score, indicated that
the HUE 1, HUE 2, and LCR groups reported a greater food preference for HFSA, compared to
the LUE 1 [F(1,147)= 10.61, p=0.001, f2= 0.074], LUE 2 [F(1,147)= 9.68, p=0.002, f2= 0.067 ],
and HCR [F(1,147)= 10.33, p=0.002, f2= 0.072] groups. No differences were found between low
and high factor-based scores for EE and preference for HFSA foods (see Table 7).
High fat sweet preference. The ANCOVA, controlling for BMI z-score, indicated the
HUE 1, HUE 2, and LCR groups reported a greater food preference for HFSW compared to the
LUE 1 [F(1,147)= 7.55, p=0.007, f2= 0.048], LUE 2 (0.38 ± 0.23) [F(1,147)= 14.58, p=0.000, f2=
0.107] and HCR [F(1,147)= 8.25, p=0.005, f2= 0.046] groups. No differences were found
between low and high factor-based scores of EE and preference for high-fat sweet foods (see
Table 7).
Low fat savoury preference. The ANCOVA, controlling for BMI z-score, indicated that
the HUE 2 group reported a greater food preference for LFSA foods compared to the LUE 2
group [F(1,147)= 5.67, p=0.019, f2= 0.039]. No differences were found between low and high
factor-based scores of UE 1, CR and EE and preference for LFSA (see Table 7).
Low fat sweet preference. No differences were found between boys and girls of low and
high factor median split factor-based grouping on taste preferences.

60
Table 7. Mean food and taste preference scores (Leeds Food Preference Questionnaire) by high and low Four-Factor Eating
Questionnaire C (FFEQ-R20 C) factor-based scores.
Note. Data are presented as mean food and taste scores (standard deviation) for boys and girls. A two-way factorial analysis of covariance, controlling for BMI z-score, was used to determine the main effect of sex and eating behavior median split factor-based grouping on food and taste preferences. No significant main effect or interaction effect of sex on food and taste preferences, therefore results are presented for the combined sample. Means that were statistically significantly different between eating behaviour groups
Low CR (n=89)
High CR (n=56)
Low UE 1 (n=47)
High UE 1 (n=98)
Low UE 2 (n=47)
High UE 2 (n=98)
Low EE (n=88)
High EE (n=57)
High Protein Preference
3.32 (2.17)
2.68 (2.00)
2.48*A
(1.93) 3.58*A
(2.16) 2.26*B (1.91)
2.48*B (2.12)
2.81 (2.13)
3.47 (2.06)
High Carbohydrate Preference
3.98*D
(1.88) 3.09*D
(1.92) 3.34
(1.82) 3.89
(2.00) 2.77*C
(1.88) 4.05*C
(1.83) 3.65
(1.92) 3.63
(1.97)
High Fat Preference
4.09*G
(2.05) 3.20*G
(2.01) 3.19*E
(2.02) 34.21*E
(2.02) 2.89*F
(1.90) 4.15*F
(2.04) 3.55
(2.08) 4.05
(2.05)
Low Energy Preference 4.69 (1.89)
4.61 (1.84)
4.84 (1.88)
4.51 (1.85)
4.57 (1.67)
4.70 (1.86)
4.65 (1.76)
4.68 (2.02)
High Fat Savoury Preference
0.47*J
(0.27) 0.33*J
(0.25) 0.34*H
(0.26) 0.49*H
(0.26) 0.32*I
(0.24) 0.47*I
(0.27) 0.39
(0.27) 0.47
(0.27)
High Fat Sweet Preference
0.53*M
(0.24) 0.43*M
(0.24) 0.43*K
(0.25) 0.54*K
(0.02) 0.38*L
(0.23) 0.54*L
(0.24) 0.48
(0.23) 0.52
(0.27)
Low Fat Savoury Preference
0.44 (0.22)
0.40 (0.22)
0.40 (0.21)
0.43 (0.24)
0.36*N
(0.21) 0.45*N
(0.22) 0.41
(0.21) 0.44
(0.22)
Low Fat Sweet Preference
0.64 (0.25)
0.66 (0.26)
0.66 (0.25)
0.64 (0.28)
0.62 (0.23)
0.66 (0.28)
0.67 (0.25)
0.62 (0.28)

61
(Low and High factor-based scores) are identified by this symbol [*] and bolded. Sex differences were Abbreviations: FFEQ-R20 C, 20-item Child Version of the Four-Factor Eating Questionnaire; CR, Cognitive Restraint; UE 1, Uncontrolled Eating 1; UE 1, Uncontrolled Eating 2; EE, Emotional Eating; High Fat Savoury, HFSA; High Fat Sweet, HFSW; Low Fat Savoury, LFSA; Low Fat Sweet, LFSW. *AThe high UE 1 group reported a significantly higher preference for high protein foods, compared to the Low UE 1 group [F(1,147)= 10.14, p=0.002] *BThe high UE 2 group reported significantly higher preference for high protein foods, compared to the Low UE 2 group [F(1,147)= 11.38, p=0.001] *CThe high UE 2 group reported significantly higher preference for high carbohydrate foods, compared to the Low UE 2 group [F(1,147)= 15.77, p<0.001] *DThe Low CR group reported significantly higher preference for high carbohydrate foods, compared to the High CR group [F(1,147)= 7.98, p=0.005] *EThe High UE 1 group reported significantly higher preference for high fat foods, compared to the Low UE 1 group [F(1,147)= 9.50, p=0.002] *FThe High UE 2 group reported significantly higher preference for high fat foods, compared to the Low UE 2 group [F(1,147)= 13.92, p<0.001] *GThe Low CR group reported significantly higher preference for high fat foods, compared to the High CR group [F(1,147)= 9.50, p=0.002] *HThe High UE 1 group reported significantly higher preference for HFSA foods, compared to the Low UE 1 group F(1,147)= 10.61, p=0.001] *IThe high UE 2 group reported significantly higher preference for HFSA foods, compared to the Low UE 2 group [F(1,147)= 6.68, p=0.002] *JThe Low CR group reported significantly higher preference for HFSA foods, compared to the High CR group [F(1,147)= 10.33, p=0.002] *KThe High UE 1 group reported significantly higher preference for HFSW foods, compared to the Low UE 1 group [F(1,147)= 7.55, p=0.007] *LThe High UE 2 group reported significantly higher preference for HFSW foods, compared to the Low UE 2 group [F(1,147)= 14.58, p=0.000 *MThe Low CR group reported significantly higher preference for HFSW, compared to the High CR group [F(1,147)= 8.25, p=0.005] *NThe High UE 2 group reported significantly higher preference for LFSA foods, compared to the Low UE 2 group BMI was a significant covariate (p=0.039- 0.041)
62
CHAPTER 5
Global Discussion
Pediatric obesity is currently one of the most persistent public health threats (4) and the
growing incidence of obesity in children and adolescents (1; 2) has shifted research toward a more
holistic approach to understanding factors that contribute to overweight and obesity. Dietary
intake is one of the modifiable factors contributing to obesity in the pediatric population, and
there is a need to understand the eating behaviours that drive children and adolescents to eat.
Childhood is a critical period for growth and development, making it a critical time for the
development and emergence of problematic eating behaviour, and in turn a critical time for
obesity intervention (81). The TFEQ is one of the most widely used measures of eating behaviour
in adults and more recently in children and adolescents, which highlights the importance of the
ongoing process of acquiring validity evidence in different samples. As prevention is the most
cost-effective and realistic way of dealing with obesity (81), it is important to have access to a tool
in which responses have been validated in children and adolescents, to easily identify eating
behaviour factors that may contribute to excess weight in children and adolescents. Research has
shown that overweight and obesity are easier to manage and may have a greater impact when
individuals are younger, as it is easier to motivate changes in family eating behaviours (81).
Validating the TFEQ responses in children and adolescents, and determining if cross-sectional
relationships exist between eating behaviour and BMI and food/taste preferences, is a
preliminary step towards the validation of a tool that researchers and clinicians can use to
evaluate individual eating behaviours to identify problematic eating behaviours early in
childhood. The validation of the responses is also a preliminary step towards a tool to measure
63
problematic eating behaviours to inform interventions to modify those eating behaviours and
problematic food preferences before they persist into adulthood (119).
Validity of the responses to the Child version of the Three-Factor Eating Questionnaire
Despite the widespread utility of the adult version of the TFEQ, minimal studies have
reported evidence on the validity of the TFEQ responses in children (13; 15). The present thesis
was the first to investigate the utility of a Child version of the TFEQ in a sample of Canadian
children and adolescents, which was carried out in concurrence with the validation study in the
United Kingdom by Dr. Bryant (13). The primary purpose of this thesis was to validate scores
from a child version of the TFEQ by examining the validity evidence (factor structure,
convergent, and discriminant) and reliability (internal consistency) of the TFEQ-R21 C in a
sample of Canadian children and adolescents. Although the literature surrounding the
applicability of the TFEQ for use in pediatric populations is currently lacking, it was
hypothesized that the factors of the original TFEQ-R21 would be replicated in the present sample
of Canadian children, the internal consistency reliability would be adequate, and questionnaire
items would load significantly onto only one factor of the three factors (13; 15). It was further
hypothesized that the of the Power of Food Scale- Child version (82) factors would be correlated
with the TFEQ-R21 C factors, supporting convergent validity. According to the results obtained
in the present study, the four-factor model of the questionnaire, identified in the exploratory
factor analysis, successfully assesses psychological eating behaviour traits in children and
adolescents and shows associations with body weight, BMI, and food and taste preferences.

64
Validation and psychometric testing of the questionnaire scores. The current study
addressed the lack of validation studies in the assessment of eating behaviours in children, using
a 21-item Child version of the TFEQ (13). This study provided initial validation evidence,
demonstrating that eating behaviour, as measured by the TFEQ-R20 C, is best categorized into
four factors representing: Cognitive Restraint (CR), Internal Uncontrolled Eating (UE 1),
External Uncontrolled Eating (UE 2), and Emotional Eating (EE). The exploratory factor
analysis allowed for the identification of a new construct of eating behaviour, which may not
have been evident with the use of confirmatory factor analysis, as the new factor was derived
from an a priori hypothesized factor.
Inconsistencies in the factor structure of TFEQ scores have also been observed in adult
populations. Research examining the validity of TFEQ responses in adults have found that the
factors of CR and Disinhibition are not unidimensional factors. The CR factor has been found to
divide into two (24; 31) and three subscales (22; 60), whereas Disinhibition was found to divide into
two (59) and three subscales (22), and Hunger into two subscales (22). Consistent with our finding of
the varying factor structure from the original questionnaire (19), research in the validation of
TFEQ scores for use in children has also shown different factor structures (13) than the original
TFEQ-R21 C (19). Inconsistent with our findings, Martin-Garcia and colleagues (15) found the
original three-factor structure was replicated in the sample of Spanish children and adolescents.
The differences in the factor structure across studies highlight the importance of validation
research to ensure data from the self-report measure of eating behaviours is valid, to ensure we
are obtaining meaningful results.
The four-factor model of the questionnaire (FFEQ-R20 C) accounted for 41.2% of the
variance in our sample, which represents a greater amount of variance than the study conducted

65
by Martin-Garcia et al. (15) (34.4 %) and a lower amount than accounted for by Bryant and
colleagues (13) (51.6 %). It is important to note that the study conducted by Bryant and colleagues
(13) used principal component analysis, whereas this study used exploratory factor analysis. This
difference in methodology may account for the higher factor loadings and greater amount of
variance observed in the study conducted by Bryant and colleagues (13). Components dervied
from principal component analysis account for total variance in the data and may provide
inflated variance values, whereas the common factors in factor analysis accounts for common
variance in the data (89; 107).
Although Bryant et al. (13) found that the factor of CR could be divided into two subscales
(containing all items of the original CR factor), researchers chose to maintain the original 3
factor structure of the questionnaire developed by Cappelleri et al. (19), based on the higher
Cronbach alpha value of the combined CR scale, as compared to the two CR subscales.
However, using the Cronbach alpha value to determine that the subscales are more accurate
representation than the combined scale is not necessarily the most methodologically sound
approach, as the Cronbach alpha value increases as a function of the number of items within the
scale (121; 122). Additionally, to maintain the three-factor model of the questionnaire, Bryant and
colleagues (13) suggested the items with low inter-item and item-total correlations be removed
from the questionnaire. The three-factor model found by Martin-Garcia et al. (15), and the chosen
three-factor model by Bryant et al. (13) was also considered in our sample, where the original UE
factor was maintained (using items from both UE subscales), which was the same procedure
utilized by Bryant et al. (13). The three-factor model in our sample accounted for less variance
(38.0%) as compared to the four-factor model (41.2%). The questionnaire (α=0.81) and factors
had adequate to good internal consistency in the three-factor and four-factor solutions, except for

66
the UE 2 factor in the four-factor model (α= 0.69); however, it fell just below the threshold of
α=0.70. Although the Cronbach alpha value is considered low for the UE 2 subscale, the internal
consistency may be underestimated when less than eight items are included in the scale (89; 121).
The internal consistency reliability in the FFEQ-R20 C matches that of the TFEQ-R21C assessed
by Bryant et al. (13) (α= 0.81) and possesses higher alpha value (α= 0.81) as compared to the
TFEQ-R21 C examined Martin-Garcia et al. (15) (α= 0.73). However, internal consistency can
vary between samples, therefore we cannot compare the reliability of the questionnaire in
children of different populations (89). Evidence of scale reliability and sub-scale reliability also
provides further support of the FFEQ-R20 C.
The four-factor model was considered appropriate for our sample, as it accounted for
more variance than the three-factor model, the Cronbach alpha values of the individual subscales
of UE were adequate, and the model was supported by theory (116; 117). Based on the results,
Factors 2 and 3 were titled Cognitive Restraint and Emotional Eating, respectively, as they were
replicated from the original TFEQ-R21 (19). Factor 1 was titled Internal Uncontrolled Eating (UE
1), with items 3, 8, 9, 13, 19, and 20 (e.g. ‘I am always hungry enough to eat at any time’)
loading onto the same factor, and Factor 4 was titled External Uncontrolled Eating (UE 2), with
items 6, 12, and 15 (e.g. ‘When I smell or see my favourite food, I find it hard to stop myself
from eating it, even if I’ve just finished a meal’) loading onto the same factor. Similar to the
division of UE into two factors found in our sample, Bond et al. (22) found the scale of Hunger
could be usefully divided into two constructs: Internal Locus of Hunger and External Locus of
Hunger. Interestingly, the original UE (19; 20) factor was derived from the Hunger and
Disinhibition factors (16) that contained items associated with extreme appetite and external eating
cues. In fact, Karlsson et al. (20) found that the most influential items in the UE factor were the

67
items relating to appetite in their sample of participants with obesity. Although these results
show that appetite is most prominent in individuals with obesity, the results also suggest that
items relating to external cues may be important in other populations, providing support for the
division of the UE factor.
A scale must be homogeneous for its scores and results to be interpretable and to provide
relevant and useful information. The original scale of UE was a heterogeneous construct, with
internal and external hunger cues contributing to the overall score. This also supports the
division of UE into two homogenous constructs. The items in UE 1 were conceptually related to
cognition, and internal hunger sensations (i.e., thinking about food or feeling hungry), whereas
the items in UE 2 were conceptually more related to senses and external food cues and stimuli
(i.e., seeing or smelling food). This division of the original Uncontrolled Eating scale (19) in this
sample is supported by Externality theory (116; 117). Based on the Externality theory, items
representing internal and external cues to eating should be separated into two different constructs
(116; 117). The new construct of External Uncontrolled Eating, in the context of the questionnaire,
refers to the response of external food cues such as seeing or smelling foods. The Externality
theory of obesity (116; 117) posits that external eating involves a decrease in internal signals to
hunger and satiety and an increase in cues to external eating, which can contribute to overweight
or obesity. This theory suggests that if Internal Uncontrolled Eating decreases and External
Uncontrolled Eating increases, the individual may be more susceptible to external eating cues
and less susceptible to internal hunger cues, and consequently increase their food intake (116; 117).
Interestingly, the items comprising the original UE factor of the TFEQ-R21 (19), were composed
of both Disinhibition and Hunger items of the original questionnaire (16), also providing further
support for the four-factor model obtained in this sample. In the original questionnaire, Hunger

68
represented the responsiveness to internal hunger sensations, whereas Disinhibition represented
the tendency to eat opportunistically based on external food cues, social settings, and emotions
(16). The current FFEQ-R20 C, which was supported by preliminary reliability and validity
evidence, includes items from the Hunger and Disinhibition factors that represent external
hunger cues and internal hunger cues.
Supporting the construct validity of the scale, the new UE 2 factor and the External
Eating factor of the DEBQ (66; 67) measure the same construct of external eating (116; 117). Although
from a theoretical standpoint the DEBQ and TFEQ differ (44; 45), with the addition of the new
factor of UE 2, there seems to be a considerable amount of overlap between the two
questionnaires. The main distinction between the two scales is the absence of hunger items in
the DEBQ (66; 67). However, Externality theory of obesity assumes that an increase in External
Eating results from a dysfunction or lack of regulation of internal satiety measures (116; 117). The
Externality theory suggests that there is an over-responsiveness to food cues and at the same time
a decreased responsivity to hunger and satiety signals (116; 117). Therefore, it is important to also
measure the sensitivity to internal hunger sensations as a construct, to understand if an increase
in weight is influenced by impaired internal satiety signals (123), increased responsiveness to
external food cues (66), or a combination of the two constructs. The division of the UE factor
allows for the identification of heterogeneous Uncontrolled Eating concepts, which may provide
a more targeted understanding on eating behaviour by distinguishing between internal and
external food cues that influence food intake. The ability to distinguish between internal and
external food cues may be useful if the questionnaire were to be used to evaluate eating
behaviour or develop interventions targeting problematic eating behaviours.

69
A main contribution of this research was the examination of the psychometric properties
of the responses to the existing TFEQ-R21 C in a sample of Canadian children and adolescents.
The item analysis revealed several weak loading items in our sample. Item 17, ‘How often do
you avoid eating or buying tempting food?’ was identified as an item that did not load in the full
unrestricted exploratory factor analysis and was subsequently removed from further analysis.
Item 17 has also been identified as a weak item with low loadings and communalities in adult
samples (19; 22; 23; 124) and children and adolescents (13; 15), supporting the decision to remove the
question from the questionnaire. Additionally, items 6 (‘When I am next to someone who is
eating, I also feel like eating’), 18 (‘How often do you eat less than you want in a meal?’), and 19
(‘Do you eat lots of food even when you are not hungry?’) loaded on factors UE 2, UE 1, and CR
respectively, but were identified as weak items with factor loadings <0.40. Similar to the weak
loading patterns observed in our study, Bryant and colleagues (13) found that items 17, 18, 19, and
21 had low inter-item and item-total correlations and suggested the items be removed from the
questionnaire, thus making it the TFEQ-R17 C (13). Furthermore, Martin-Garcia et al. (15) found
that items 17 and 18 (0.34; 0.29) had low loadings, whereas items 7 and 21 were identified as
having weaker loadings (0.41; 0.41). Although item 21 was not problematic in our sample, it
may be problematic as it is measured on an 8-point numerical rating scale, while all other
questions are measured on a 4-point Likert scale. Furthermore, items 17-21 are measured on
three different 4-point Likert scales including ‘Almost never - Almost always’, ‘Never - At least
once a week’, and ‘Only at meal times - Almost always’, and an 8-point numerical rating scales,
while items 1-16 are measured on the same 4-point Likert scale of ‘Totally true - Totally False’.
Items 17-20 are also measured on a reverse anchored Likert scale, which is inconsistent with
items 1-16. The differing scales and reversed anchors may contribute to the difficulty of the scale

70
for children. Different Likert response categories and items measuring frequency and attitudes
are used for items measuring the same construct, which may have impacted the responses and
provided the weak loading patterns observed in items 6, 17, 18, and 19 (125). As Cappelleri et al.
(19) suggested, items 17, 18, and 21 may be affected by cultural differences, explaining why they
are not problematic in European samples (20; 30; 62) but are problematic in North American samples
(19) and recommended they be removed from the scale. Additionally, item 6 of the questionnaire
measures two concepts of eating behaviour and therefore may not have been easily understood
by children; this item does not differentiate between feelings of hunger and external cues to
hunger (112). Although Bryant and colleagues (13) did examine the content validity of the
questionnaire in a sample of children, it may also be valuable to conduct structured interviews
with a sample of Canadian children and adolescents, as the understanding of the items may vary
culturally (19).
This variation and inconsistency of the types of stems and response anchors in the
questionnaire may contribute to the identified weak items. The weak loading items may be the
result of response set bias in the form of social desirability, in which the response is the result of
what the individual perceives as socially desirable or acceptable, rather than how they would
truthfully respond to the question (126; 127). Response style, such as the tendency to agree or
disagree with statements may also contribute to bias (127). Children may not have the attention
span to fully read and understand the question and response categories or have difficulty
understanding the stem or scale, and therefore may provide an inaccurate response (127). The
respondent also may not be able to distinguish the list of stems that have different response
categories or anchors, and incorrectly assume that all response scales are the same (125). To
mitigate response style bias in the TFEQ-R21 C, researchers included reversed Likert scale

71
anchors on certain items (19), but there is no general consensus in the literature as to the
effectiveness of this technique, especially in children (127). Implementing a 5-point Likert scale
with a neutral option should also be explored in this questionnaire, so the respondent is not
required to decide if they agree or disagree when they might not have an opinion on the item. A
neutral option may also provide valuable information, as children may not have an opinion on
certain stems. There is a debate in the literature as to the advantage or disadvantage of including
a neutral point or middle point on the Likert response scale. It is argued that the absence of the
neutral point may mitigate the non-response bias and social desirability response bias (128; 129),
while it is also argued that it can force the respondent to make a choice when they may, in fact,
be neutral (130). The absence of a neutral point may also result in more skewed data (130).
Therefore, it is important to explore the use of a 5-point Likert scale in this questionnaire. The
findings of the item analysis reveal the complexity of the study of eating behaviours; there is a
need to ensure that the way that items are worded, and the stems used to represent the choices are
reliable, to ensure that the identified aspect of eating behaviour is being measured.
Recommendation for applicability of the questionnaire. The current findings of this
thesis partially support research performed by Bryant et al. (13) and Martin-Garcia et al. (15) and
contribute to the current body of research on the assessment of eating behaviour in children and
adolescents. Based on the results of the exploratory factor analysis and the psychometric
analysis, it is reasonable to suggest that the 20 item four-factor model of the questionnaire best
represents the responses of our sample of children and adolescents from the Ottawa area.
However, the results may not be generalizable to all Canadian children. Further research is
required to cross-validate the four-factor model in a larger sample of Canadian children and

72
adolescents from different provinces across Canada. The four-factor model obtained in this study
may be a sample specific variation to the original three-factor structure of the questionnaire.
Research in adults (19) and children (13; 15) has shown sample specific variations in factor loadings
and structure. It is recommended that researchers conduct a psychometric analysis of items in
their sample before drawing any conclusions on the results of the questionnaire. Due to the
possible sample specific variation in the factor structure, it is important to first examine the
validity and reliability of the questionnaire scores (before removing items) for use in each sample
as a preliminary analysis, to determine if all items load accordingly on all four eating behaviour
factors.
The psychometric analysis of the questionniare in our sample and the examiniation of the
variation in factor models and identified weak items in the previous literature revealed that the
revision of the instrument may increase the validity and reliability of the measure. Previous
research examining validity evidence in adults have pointed to varying factor structures
including sub-scales of each factor (22; 24; 31; 60), and more recently in children and adolscents (13).
Item analyses conducted in our sample, as well as previous research have consistently identified
item 17 as a problematic item in adults (19; 22; 23; 124) and children and adolescents (13; 15). Similar to
our findings it has also been found that items 17, 18, 19, and 21 had low inter-item and item-total
correlations and suggested the items to be removed? in child and adolscent samples (13; 15). The
differences observed between factor structures and the numerous studies that have consistently
identified certain items as being weak loading items suggests that the questionniare be re-
examined as a whole and by each item. Although the questionnaire is conceptually sound based
on the theory of Restrained Eating (17; 36), Externality theory (116; 117) and the Psychosomatic
theory (137; 138) of eating behaviour and is measuring factors that have been shown to be important

73
determinants of food intake (19), revision of the items used to measure those constructs may be
necessary. It may be worthwhile to re-examine the items for use in children and adolescents, by
asking children and adolescents to verbalize their understanding of the questions and why they
are providing the answer they did (106). Examining the understanding of the items through
validity evidence based on response processes will allow for a greater understanding of
underlying issues contributing to the problematic items. It is also recommended to add at least
two more items to the External Uncontrolled Eating (UE 2) factor and removing problematic
(item 17) or low loading items (e.g., 6, 18, 20) may further enhance the usefulness of this
questionnaire for use in Canadian children and adolescents. As different response categories of
the Likert type scales, for items measuring the same construct may have contributed to the
difficulty in understanding the questionnaire, it is recommended that consistent response
categories and a neutral response category be explored in the re-examination of the
questionnaire.
The differences in the factor structure across studies highlight the importance of
validation research to ensure data from the self-report measure of eating behaviours is valid, to
ensure we are obtaining meaningful results. Although this thesis contributes to current validity
evidence for the assessment of eating behaviours in children and adolescents, more research is
needed to re-examine the questionnaire items and examine the four-factor model in a larger
sample of children and adolescents to build more generalizable findings across different
populations. Validity theory suggests that validation is a continuous process, in which ongoing
research is required to validate questionnaires (106) as current research on eating behaviour
evolves. Part of the ongoing research to validate the questionnaire may involve the re-
74
examination of questionnaire items to ensure construct validity and to increase understanding of
the items in children and adolescents.
Relationship between FFEQ-R20 C factors. The factors of UE 1, UE 2, and CR were
positively correlated with EE in our sample. Additionally, UE 1 and UE 2 were positively
correlated. This correlation is expected as the two factors of UE 1, and UE 2 are derived from the
same global factor of UE. Positive correlations found between UE and EE are also in line with
previous research using the TFEQ (13; 15; 23; 72) and the DEBQ (15; 69; 80). These results are also
supported by the Externality theory (116; 117), as an increase in EE, which is a form of
disinhibition, may cause a feeling of loss of control, which in turn can make an individual more
susceptible to external food cues. The positive relationship between UE 1, UE 2, and EE
demonstrates that emotionality and external food cues can operate together to elicit eating
behaviour, despite being independent constructs (67).
The association between CR and EE is consistent with one study using a sample of
adolescents (23), but inconsistent with more recent findings in a sample of children and
adolescents (13; 15). Our findings are supported by the Theory of Restrained Eating (17; 36); CR
implies that the cognitive processes of the individual override the internal physiological satiety
and hunger cues, allowing individuals to restrict their food intake. Emotions such as depression
and anxiety have been used as classical disinhibitors; although restrained eaters may be able to
maintain their food intake for some time, certain emotions such as depression and anxiety can
elicit eating behaviour, in turn, resulting in excess food intake (41). For disinhibition (in this case
emotions and dysphoric moods) to be compromised there must be prior restriction of food intake,
which explains the relationship between EE and CR.
75
Based on Externality theory (116; 117), the Theory of Restrained Eating (17; 36), and previous
research (13; 15), we should also expect to see CR negatively correlated with UE. Inconsistent with
our results, Martin-Garcia et al. (15) and Bryant et al. (13) found that UE correlated negatively with
CR. Based on the Externality theory (116; 117) and the Theory of Restrained Eating (17; 36), to lose
control over food intake, there must be prior CR. Therefore, it is expected that if CR decreases
then UE would increase due to the lack of restriction, which would increase an individual’s
susceptibility to external food cues and hunger sensations. The division of UE and the distinction
made between Internal Uncontrolled Eating (UE 1) and External Uncontrolled Eating (UE 2) in
our sample may explain the lack of correlation between CR and UE, as previous studies have
examined UE as a global factor. Even with the division of UE, based on the theories mentioned
above, we should expect that UE 1 would be negatively and UE 2 would be positively related to
CR, which was not supported in our sample. Although Bond et al. (22) found that Internal Locus
of Control was negatively associated with CR and Karlsson et al. (20) found that CR was
negatively associated with perceived hunger and loss of control over eating, our results suggest
that this loss of control over eating may not originate from CR.
The observed correlations between eating behaviour factors demonstrate that eating
behaviour is more complex than three distinct factors exerting an influence on eating behaviour;
these results demonstrate that eating behaviours are interrelated, and one behaviour may mediate
or moderate the other.

76
FFEQ-R20 C Factors and Anthropometrics, and Food and Taste Preferences
Since the primary objective of this thesis was achieved, the secondary purpose was
exploratory in nature, and aimed to determine if relationships between domains of the FFEQ-R20
C, anthropometric measures, and food and taste preferences existed, to aid in determining the
construct validity of the questionnaire. This exploratory analysis was conducted to determine if
the questionnaire is related to excess weight and food preferences, to determine if the
questionnaire may be used in future research to examine the utility of eating behaviours in
predicting excess weight. It was hypothesized that higher scores on the TFEQ-21 C factor of UE
would be associated with preference for high fat, carbohydrate, and protein foods and high-fat
savoury (HFSA) and high-fat foods, while higher scores on the EE factor would be associated
with preference for high-fat foods, and HFSA and high-fat sweet foods (HFSW). It was further
hypothesized that higher scores on the CR factor and the UE factor would be significantly
associated with higher body weight, BMI, and BMI z-score.
Relationship between FFEQ-R20 C factors and participant characteristics. Younger
children reported higher UE 1 and CR scores, compared to their older counterparts. The finding
that younger children reported higher UE 1 scores was supported by the findings of Bryant et al.
(13), whereas other research has indicated a null finding in mean factor scores between age groups
(69). The higher scores of UE 1 in younger children demonstrate that, the younger children in our
sample tend to eat more in relation to internal hunger and satiety signals and less in response to
external food cues, as compared to older children and may not have learned to control their
uncontrolled eating in response to feelings of hunger. This difference in UE 1 scores observed
between older and younger children and adolescents may be the result of changes related to

77
puberty in which the desire to lose weight increases (131) and adolescents may tend to restrict their
eating in response to satiety and hunger.
The finding of higher CR scores in younger children is not supported by previous
research (13; 69). This finding may be the result of adolescents underreporting restraint behaviours,
particularly girls (132). Mean factor scores of UE 2 and EE did not significantly differ between
age groups, which is supported by previous research (13; 16; 69). The lack of disparity between UE
2 and EE scores in younger and older children suggests that children and adolescents of all ages
engage in similar Emotional and External Uncontrolled Eating behaviours. The highest eating
behaviour scores were observed on the External Uncontrolled Eating (UE 2) factor, whereas the
lowest scores were observed on the Emotional Eating factor. These results are in line with other
research conducted (13; 15; 43) and suggests that children and adolescents show a natural response
of loss of appetite when emotional stressors such as anger, depression, and anxiety.
Consistent with the findings of Banos et al. (69), mean factor scores did not differ between
sexes in our sample. In contrast with our findings, sex differences between UE scores have been
observed, in that boys tend to have higher scores on the UE factor (13; 23) and the External Eating
factor of the DEBQ (78). It has also been found that girls tended to have higher CR and EE scores
compared to boys (23; 75; 78; 133), which was not supported in our sample. The present data indicate
that the questionnaire may be influenced by individual characteristic of age, but not sex. The
validity and reliability evidence of questionnaire responses suggest that the questionnaire was
better able to characterize differences in eating behaviours in younger children but also suggests
the possibility that additional measures are necessary to validate food intake and eating
behaviour in older children.

78
Relationship between the FFEQ-R20 C factors and anthropometric measures.
Individual differences in eating behaviour in children and adolescents may help to explain
differences in weight gain and overweight or obesity. The results provide preliminary validity
and reliability evidence demonstrating that the four-factor model best characterizes eating
behaviour in our sample of Canadian child and adolescent populations in the Ottawa area. The
results also provide preliminary evidence of relationships between eating behaviours and BMI z-
score and weight status. In our sample, the factor of UE 1 correlated positively with BMI z-
scores in boys and girls. Boys who reported higher UE 1 scores had significantly higher weight,
BMI, and BMI z-scores; however, no differences were found in girls. Furthermore, children who
were classified as having overweight or obesity, based on BMI z-scores, reported higher EE
scores.
Similar to previous findings, we found that children who were classified as having
overweight or obesity reported higher EE scores, compared to their normal weight counterparts.
Consistent with our results, higher EE scores have been found to be associated with higher BMI
values in French adolescents (72), Spanish children (69), specifically in female adolescents (78) and
have been found to be a predictor of BMI over time in children and adolescents (79). However,
many studies have not found any associations between EE and excess weight in children and
adolescents (13; 15; 134; 135). Higher emotional eating symptoms in 12-year-old girls have been
associated with higher emotional eating, indicating that EE does in fact measure emotional
responses to food (75; 133). As an explanation of how emotions are linked to overeating, Kaplan
and Kaplan (136) have suggested that individuals may overeat as it reduces fear, anxiety, and
stress.

79
Our findings regarding EE are accordant with the Psychosomatic theory of eating
behaviour, which posits that individuals with obesity exhibit greater food intake in response
negative affect, using food as a coping mechanism (137; 138). This is considered an atypical
reaction to dysphoric moods, as the normal response is a loss of appetite based on physiological
changes within the human body (136; 139). Therefore, emotional eating may be occurring in
children and adolescents who have developed a conditioned response of reward between
negative moods and food. This may be a result of food being used as a reward, comfort
mechanism, or a result of children not learning how to express their emotions in a healthy way
(140). Scores of EE have also been linked between mothers and daughters, implying that parental
behaviour has a significant influence on EE behaviour (62).
Contrary to previous research among children and adolescents (13; 15; 72; 134) and the
hypothesis of this research, we found no associations between CR and weight outcomes. The
high CR scores linked to BMI found in children and adolescents (15; 23; 62; 73; 74; 75; 77), especially in
girls (13; 47) are in contrast with our null findings. These findings have been explained in terms of
the Goal Conflict Theory (141), which states that restrained eaters have an internal conflict
between eating food for enjoyment and restricting food intake to control weight. In the current
obesogenic environment, the theory posits that individuals can only restrict their eating for a
certain amount of time, before they succumb to the goal of eating enjoyment due to the constant
presentation of palatable foods; this leads to a need for higher restriction in order to maintain
weight (141). The Restraint Theory then explains that chronic dieting becomes a vicious circle, as
dieting alternates with episodes of increased food intake and weight gain, which in turn causes
the individual to diet again (17; 36). It has also been found that CR is associated with better weight

80
regulation (52; 142), implying that while some individuals are unable to maintain CR, it can be an
effective weight management behaviour for some.
The differences observed in the literature suggest that the relationship between CR and
weight is complex and it may interact with other eating behaviours to manifest weight outcomes
(14). CR may interact with UE, as higher scores on UE are theoretically linked to CR; restraint
must be reduced for an individual to become susceptible to the internal and external food cues (17;
36). Impulsive personality traits (a form of loss of cognitive control) have also been found to be
positively associated with UE in children (143). Furthermore, constantly being surrounded by the
current obesogenic environment makes it more and more difficult to exercise CR especially
when stress and dysphoric moods act as disinhibitors; this may cause individuals with excess
weight to increase food intake in response to emotions (141). It was also found that the CR
subscale of Emotional Susceptibility (22) was positively correlated with BMI (14), which also
supports our above-mentioned findings that EE scores were significantly higher in children with
overweight or obesity. Based on the Goal Conflict Theory (141) and the findings of Gallant and
colleagues (14), CR may have been manifested in terms of the high EE scores observed in the
children with overweight or obesity in our sample. Additionally, in our sample the younger
children reported higher CR scores; this may lead to a reduction in metabolic rate in childhood,
therefore as less calories are required to maintain weight, it may later manifest as weight gain in
the absence of CR.
It has also been found that CR is related to BMI in early adolescence, but later did not
predict any changes in BMI (144), which also may explain our findings that CR was significantly
higher in younger children (age 8-11 years), compared to the older children (12-15 years). A
possible explanation of this lack of association found between CR and BMI is that although the

81
children (younger in particular) had higher scores of the CR factor, the actual restraining
behaviour may not have been restrictive enough to lead to a higher or lower BMI (145), or that the
effect of CR had already taken place earlier in childhood (144). The null finding of the relationship
between CR and weight outcomes, may also be the result of the opposite effects of the Flexible
and Rigid Control scales of the CR domain, as they represent two opposite ends of the spectrum
of CR (31). Interestingly, Cappelleri et al. (19) found weak associations between the TFEQ-R21 C
domains in both the overweight and normal weight samples in the validation of the
questionnaire. In support of this explanation, Gallant et al. (14) found that when the CR factor was
examined as a whole, there were no differences in BMI z-scores in children and adolescents, but
when the CR factor was divided into the Flexible and Rigid Control scales, BMI z-scores were
positively related to the Rigid Control scale of the CR factor. This suggests that the Flexible
Control Scale of the CR domain may exert a moderating effect on BMI, leading to the lack of
association between CR and excess weight observed in our sample. Furthermore, Snoek et al. (78)
found that BMI was more often a predictor of CR rather than CR predicting weight gain. It has
also been found that overweight was a risk factor for the development of dietary restraint at 5
years (43), 9 years (146) and after 6 years of age (75; 133). The fact that our sample consisted of a
small number of children and adolescents classified as having overweight/obesity (n=8), and no
differences between CR of normal weight and overweight/obesity were found, implies further
support of Snoek and colleagues’ theory (78) that excess weight predicts CR.
Our finding that boys with higher UE 1 scores had significantly higher weight, BMI, and
BMI z-scores is concordant with previous research (13; 72; 80). However, one study also found no
association between UE and BMI in adolescents (62). As higher UE scores have been found to be
associated with overweight/obesity in adults (76), it is possible that the association between UE

82
and BMI starts developing in adolescence and increases with age, which is supported by the
findings of Snoek and colleagues (144). Our results are in contrast to the results found by Martin-
Garcia et al. (15), as they found that a lower UE score was associated with a greater BMI. The
current results are also in contrast with findings that high External Eating scores (which is
similar to our UE 2 factor) were positively related to a lower BMI (69; 75; 80; 134; 135) and not related
to weight status.
The lack of relationship between UE 2 and weight outcomes may be the result of the
limited the number of items within the factor; there may not be a sufficient number of items to
accurately measure this construct of eating behaviour. The results show that UE 1 is related to
weight outcomes, where UE 2 is not, therefore these results further support the division of the
original UE factor (13; 19). Furthermore, Karlsson and colleagues (20) found that the most
influential items of the original UE factor were the items relating to internal hunger and appetite
in the sample with obesity, suggesting that individuals with excess weight are more influenced
by Internal Uncontrolled Eating, in comparison to normal weight individuals. The previous
relationships between UE and weight outcomes may be the result of the influence of the hunger
items and not necessarily the external food cues. Bruch (147) has also suggested that individuals
with obesity may not be able to distinguish between internal hunger sensations and other
sensations, which may stem from parents using food as reward instead of in response to internal
hunger sensations. This theory helps to bridge the gap between UE and EE, demonstrating that
they might influence BMI as a combination. Furthermore, Banos and colleagues (69) found that
the relationship between External Eating and EE together, explained the higher BMI values.
Therefore, it may be useful to examine an aggregate score between UE and EE, and its
relationship with BMI. Additionally, de Lauzon and colleagues (23) found that the relationship

83
between UE and BMI in adult samples was mediated by food preferences, in which high UE
scores were associated with an unhealthy diet. This finding was also replicated in our sample, in
that high UE 1 and UE 2 scores were associated with higher preference for high protein,
carbohydrate, and fat foods, and HFSA and HFSW foods. The food preferences associated with
higher UE 1 and UE 2 scores may indicate that UE has an indirect impact on weight.
Based on Restraint Theory (36; 37), it is reasonable to expect to find the highest CR and UE
scores in children with excess weight. However, Martin-Garcia et al. (15) found that children who
had the lowest UE scores had a higher body mass, which was not found in our sample. This is in
line with previous findings (69; 80; 134), which found a negative relationship between external
eating and weight. Food cues are related to food intake in children (148; 149), therefore it would
also be reasonable to expect that higher UE 2 scores would be associated with higher BMI
values. This difference might be explained by the fact that participants with overweight or
obesity may not have expressed their real responses to the questions and instead expressed the
responses they felt to be more socially desirable, such as eating in response to internal hunger
sensations (UE 1) instead of external food cues (UE 2) (150). In fact, Babio and colleagues (132)
found the girls underreported food intake and that adolescents that underreported their food
intake were actually the individuals with the higher BMI values. This may help to explain the
lack of association of UE 2 and CR with excess weight in our sample. Lastly, a convenience
sample of children and adolescents from schools across Ottawa was used in the present study;
children and adolescents were not selected based on their weight status therefore only a small
number of participants classified as having overweight or obesity (n=8) were found in our
sample. The small number of children with overweight and obesity may have precluded the
ability to detect differences between the groups.

84
Overall, the fact that there were minimal sex differences found after adjusting for BMI z-
score suggests that the questionnaire may be applicable to both boys and girls with the use of
BMI z-score as a covariate in the analyses. However, more research in this area should be
conducted to further examine sex differences using smaller age ranges, or age as a continuous
variable. The mean age of our sample was 11.5 and 11.9 years for boys and girls, respectively.
Therefore, the sex differences observed by Bryant and colleagues (13) may be the result of
changes related to puberty differences (131; 132) which may not have been evident in our sample as
it was mainly comprised of younger children. As these relationships were not evident in older
children, it may be necessary to validate the reporting of eating behaviours with parents, or with
actual dietary intake in older children. The fact that EE was found to be associated with excess
weight in our sample and the known relationship between parental eating behaviour and off-
spring eating behaviour (62; 140), warrants the exploration of the effects of parental eating
behaviour in a sample of Canadian parents and their offspring.
Relationship between the FFEQ-R20 C factors and food and taste preferences. Food
and taste preferences are an important determinants of food intake and eating behaviours in
children (151). Our results demonstrate that the FFEQ-R20 C was able to distinguish between
different food and taste preferences in our sample of children and adolescents. Age was found to
be negatively correlated with preference for low energy foods, and BMI correlated with high
protein and high fat food preference, and HFSA foods. Most of the correlations between factor
scores and food preferences were significant only in younger children (8-11 years). However,
our results show that food and taste preferences for the most part are similar across sex. Children
and adolescents with high UE 1 scores reported greater preference for high protein and fat, and
85
HFSA and HFSW foods. Greater preferences for high protein, fat, and carbohydrate foods, and
HFSA, HFSW, and LFSA foods were evident in children who were characterized by high UE 2
scores. Children and adolescents with low CR scores reported greater preference for high
protein, carbohydrate, and fat foods. Furthermore, in younger children, BMI correlated with
preference for HFSA foods, whereas weight correlated with LFSA foods in younger children.
Children who reported high UE 1 and high UE 2 scores reported greater preference for
high protein and fat, and HFSA and HFSW foods; this taste preference pattern associated with
high UE 1 and high UE 2 has also been observed in child and adolescent populations (13),
showing higher preference for high carbohydrate and fat, and HFSA and HFSW foods. The
results of our study are also consistent with findings in adult populations, where it was found that
high UE scores were related to the intake of more fatty and salty foods (23; 152). The main
food/taste preference linked to overeating in both girls and boys has also been identified as sweet
foods (153), which is also linked to high-fat foods, as sugar has been found to conceal the taste of
fat (154). This finding is also consistent with the Externality theory (116; 117), in that an increase in
sensitivity to external food cues can lead to overeating; in the current obesogenic environment
those external food cues (148; 149) are normally related to highly palatable foods, such as foods
high in fat, salt, and sugar (12; 155).
Furthermore, from the perspective of macronutrient composition, high fat and
carbohydrate foods have a higher energy density and have a low satiating ability, which can lead
to increased food intake, passive overconsumption, and higher susceptibility to internal hunger
and external food cues (156). In fact, Chambers and Yeomans (157) found that girls often overate as
a result of the low satiating effects of carbohydrates. Interestingly, it was found that those who
scored high on UE 1 subscale, which was found to be related to BMI in our sample, had a higher

86
preference for high protein foods, which have a high satiating ability (156). The consistency
between findings in adult samples and children and adolescents for UE suggests that these food
preferences may develop in childhood and persist into adulthood. Research has shown that
higher levels of the hunger hormone ghrelin have been associated with a higher preference for fat
(158), which explains the finding that high UE 1 scores were associated with high fat, HFSA, and
HFSW preferences. Furthermore, research has shown that higher levels of the satiety hormone
leptin have been associated with lower preference for high-fat foods (159). Since our results show
that high scores on UE 1 are related to high-fat preferences, this may suggest that the children
and adolescents in our sample may have an impairment of the normal satiety response to food,
possibly as a result of the higher UE 2 scores associated with high-fat preference. Moreover,
savoury foods have been found to have a greater modulating effect on food preferences and have
been associated with reduced liking and intake of HFSA foods (160). Since UE 1 and UE 2 scores
were highly associated with preference for HFSA and HFSW foods, it may be reasonable to
suggest that children and adolescents should reduce the consumption of HFSA over HFSW
foods.
External Eating has also been shown to be related to enhanced selection to food cues and
impulsivity, making individuals more susceptible to overeating (161). Since impulsivity is a type
of reduced cognitive control, CR, UE 1, and UE 2 may be interrelated constructs, supporting the
finding that similar food preferences related to UE 1, UE 2, CR scores. Our results showed that
low CR scores were related to preference for high fat and carbohydrate foods, and HFSA and
HFSW foods. Consistent with our results, a higher CR score has also been shown to be
negatively correlated with HFSW and HFSA foods in adults (23; 162; 163). Similar to our findings,
girls who reported higher CR scores, reported lower energy intake, which is contrary to findings

87
in adult samples which have shown that high CR scores are associated with healthier food
preferences (23). However, this finding is supported in adult weight loss samples (27). The
relationship between lower CR scores and preference for high-fat and carbohydrate foods, and
HFSA and HFSW foods in children suggest that CR persists from childhood to adulthood and
may be involved in mediating food intake of preferred foods. The variability of the relationship
between CR and food preferences may be the result of some individuals having a better ability to
maintain CR (27; 52; 142). The finding that BMI correlated with HFSA foods demonstrates that
foods high in fat and salt may be the most problematic in terms of excess weight. In fact, high
CR and decreased intake of high-fat foods have been shown to be an effective weight loss
approach in adults (52).
Contrary to our null findings in terms of EE, higher preference for high carbohydrate and
fat, and HFSA and HFSW foods has been found in children and adolescents with high EE scores,
particularly in girls (13). This finding has also been supported in adult samples, where greater
preference for high fat foods, and greater consumption of snack foods (164), especially in females
(23), and preference for fatty and salty foods (152; 164), were related to higher EE scores. As
previously discussed, UE and EE are concepts that are interrelated and may have an impact on
CR. Therefore, the preference for high fat and sweet foods observed in those with high UE may
be in fact related to EE, as sweet foods and high-fat foods are shown to relieve stress (often an
emotional cue for eating), by stimulating opioid release in the brain to protect the body from
stress (139; 165).
In the present study, we did not find any sex differences in food preferences in relation to
FFEQ-R20 C factors. Bryant and colleagues (13) reported that the relationship between high UE
and EE scores, and preference for high fat, carbohydrate, HFSA, and HFSW foods was greater in

88
girls. Although not statistically significant, boys reported higher preferences for protein and
HFSA, whereas girls reported a higher preference for high fat, carbohydrate, low energy foods,
HFSW, and LFSA foods. Consistent with our findings, it has been found that boys had a higher
protein preference and a higher preference for HFSW foods (13; 23; 166). Most of the correlations
between factor scores and food preferences were correlated significantly only in younger
children (8-11 years), and although not statistically significant, younger children reported a
greater preference for high fat, carbohydrate, protein, HFSA, HFSW, and LFSA foods.
Furthermore, in younger children, BMI correlated with preference for HFSA foods, whereas
weight correlated with LFSA foods in younger children. These results are consistent with
previous research, in which younger children were found to have higher preferences compared to
older children (166). Research has also shown that younger children tend to prefer tastes
associated with dietary fat, which helps to explain the findings that younger children had a higher
preference with HFSA and HFSW foods (167). Food preferences are also susceptible to change
with growth, maturation, and hormones; consequently preferences of adolescents may have
changed and developed since childhood (168).
Significance of the Study, and Clinical and Research Implications
This thesis is the first study to examine the utility and validity of a questionnaire to
measure eating behaviour in Canadian children and adolescents. The factor structure of
responses supports the utility of the FFEQ-R20 C for use in our sample of Canadian children and
adolescents as a valid measure to assess eating behaviour. Although the nature of this study was
exploratory, and the results are preliminary, the results of this thesis may have implications for

89
research and practice in the area of eating behaviours and food preferences in children and
adolescents. Following further validity and reliability evidence of the questionnaire responses in
a larger sample of Canadian children and adolescents, this questionnaire may be used in pediatric
populations to better understand how eating behaviour relates to an individual’s weight and can
aid in the development of future interventions. Addressing this knowledge gap contributes to the
current validity evidence and a better understanding of how eating behaviour and excess weight
differs between normal weight children and children with overweight/obese. The exploratory
analysis conducted in this thesis provides preliminary validity evidence of a tool to assess eating
behaviour in Canadian children and adolscents, which is an important preliminary step in
planning interventions to address the obesity epidemic in the pediatric population. The
knowledge gained from this study may contribute the current validity evidence informing
interventions and to help researchers and clinicians in evaluating the effects of interventions on
eating behaviours. Interventions based on problematic eating behaviours identified by the TFEQ
have been shown to be successful in children and adolescents (73). Obesity interventions focusing
on individual eating behaviour can target those behaviours associated with excess weight, as
measured by the FFEQ-R20 C.
Firstly, minimal sex differences were found in eating behaviours measured by the FFEQ-
R20 C, meaning that sex tailored interventions may not be necessary in targeting eating
behaviours in children and adolescents. However, future research is required to further examine
differences between boys and girls before drawing any conclusions based on the current data, as
the sample size used in the current study was small and consisted mainly of younger children.
Additionally, in our sample the younger children reported higher CR scores and most of the

90
correlations between factor scores and food preferences were significantly correlated in younger
children only (8-11 years).
Research shows that education regarding healthy choices coupled with eating behaviour
therapy is an effective mechanism to treat obesity (169). Based on the finding that EE was found to
be significantly higher in children with overweight or obesity, it is necessary for obesity
interventions targeting eating behaviour to educate children about healthy emotional coping
strategies and avoid using food as a reward. As CR may be linked to EE, it is also important to
design obesity interventions that educate about healthy eating behaviour and healthy food
choices. Given the association found between a higher UE 1 and UE 2 score and higher
preference for protein, carbs, fat, HFSW, and HFSA foods, it is essential that eating behaviour
interventions teach children how to recognize internal hunger sensations and minimize the
response to highly palatable foods in their environment. This would also implicate the parents as
well, as they need to be committed to reducing the availability and exposure to palatable foods.
Furthermore, our results show that high UE 1 and UE 2 scores are associated with higher
preference for high fat, sweet, and salty foods, which in turn was positively related to excess
weight, suggesting that higher levels of hunger and satiety hormones may be affecting food
intake, especially in boys. If this is the case, children with high UE 1 and UE 2 scores may
benefit from pharmacological interventions aimed at managing hormone levels with respect to
hunger and satiety (170). This pharmacological approach has been successful in adults (57) in
relation to specific eating behaviours measured by the TFEQ. Given the positive correlation
between BMI and protein and fat preference, reducing access to high protein and high-fat foods,
it may be effective to teach children how to make healthy food choices and eat in moderation,
without completely removing them from their diet (151).
91
Several studies have noted that parental involvement is a key component for the success
of weight loss interventions in adolescents, and especially in children (171; 172; 173). Research has
shown that factors controlled by parents can impact the weight status of children, such as the
type of food available, family food preference, and type and amount of food consumed at meals
(174; 175). Previous research examined the association between maternal eating behaviours and
their offspring and found that UE (176) and EE (62; 176) in girls was positively related to maternal
eating behaviour. Likewise, Gallant and colleagues (14) found that subscale scores of the CR
domain and the Disinhibition scores were positively associated with the BMI of their offspring.
However, both studies used adult versions of the questionnaire for both children and adults,
therefore the questionnaire may not have been easily understood by children. Following the
accumulation of more validity and reliability evidence of the questionnaire in larger samples of
Canadian children and adolescents, while taking into account extraneous variables, the
questionnaire may be a suitable tool for the comparison between parental and offspring eating
behaviours, as it contains the same items as the adult version of the questionnaire (TFEQ-R21 C)
(19). The comparison may provide a more thorough understanding of the eating behaviours and
patterns that are influenced by parental eating behaviours. To compare directly with the scores of
the adult version of the questionnaire, the three-factor model of the questionnaire presented in
Table 3 can be used in children and adolescents.
Moreover, as overweight and obesity is easier to manage at a younger age, it is important
to identify problematic eating behaviours early in childhood (81). The FFEQ-R20 C has the
potential to aid in the identification of eating behaviours that may become problematic and
contribute to excess weight. An important evidence-based treatment for childhood obesity is
Family Based Therapy (177), which considers the important influence of all family members on

92
healthy living and eating behaviours. The FFEQ-R20 C can be used as a tool to assess eating
behaviours and identify problematic eating in children and parents (19), to be targeted in Family
Based Therapy or to measure to the success of the interventions.
A first step in treating overweight and obesity is to create supportive environments for
children and adolescents to be able to talk about weight and make healthy food choices.
Although this study did not address any interventions, many of the participating school principals
and teachers used the opportunity of our research to discuss healthy eating behaviours in their
classrooms.
Limitations and Future Directions
While this thesis contributes to the current validity evidence of a questionnaire to assess
eating behaviours in relation to weight status in Canadian children and adolescents, it is
important to acknowledge the limitations of the study. Although our results support the utility of
the FFEQ-R20 C for use in our sample of Canadian children and adolescents in assessing eating
behaviour, the results may not be generalizable to all Canadian children. A limitation of this
study was that the small sample size used for the exploratory factor analysis, especially after the
removal of participants with missing data and outliers. Although many studies have used sample
sizes similar to ours for exploratory factor analyses (178), it would be beneficial for future research
to examine the four-factor model with a sample larger than 10-15 participants per item of the
questionnaire (86), after missing data and outliers are removed. The present study used a
convenience sample of children mainly enrolled in public schools. Therefore the external
generalizability of our findings may be mainly restricted to Canadian children from the Ottawa
93
area. Based on the fact that a convenience sample was used for the present study, we cannot rule
out sampling bias (179) and the possibility that the children with healthier eating behaviours may
have been more inclined to participate in the study. Additionally, individuals were not selected
based on weight status, thus this study may have lower power in the comparison between normal
weight and overweight children, as the number of participants with overweight or obesity was
small (n=8). The factorial validity of the responses to the new contextualized version of the
questionnaire, FFEQ-R20 C, and the relationships with BMI and food preferences should also be
examined in other Canadian samples.
Additionally, the division of the UE factor into two factors meant that the UE 2 scales
contained fewer items (n=3) compared to the other scales of the questionnaire, which is an
important limitation inherent to the questionnaire. Before examining the factorial validity of the
questionnaire, items representing eating in response to external food cues should be added to the
questionnaire to make the measure of External Uncontrolled Eating (UE 2) more robust.
Additional research is needed to determine if adding more items to the UE 2 subscale would
improve the subscale and questionnaire validity. In the current study, the measure was validated
using a sample consisting mainly of normal weight children and adolescents. The understanding
of eating behaviour depends on a valid, stable, and generalizable measure. Therefore, future
research should focus on examining the factorial validity of the new four-factor model of the
questionnaire in a larger sample of Canadian children and adolescents with differing ethnicity,
socioeconomic backgrounds, weight status and physical activity levels (180; 181).
One main limitation of the present cross-sectional validation study is that it does not
reveal changes in the questionnaire scores and changes in BMI over time, due to the lack of
longitudinal data or follow-up. This cross-sectional design of the study prevents the ability to

94
establish temporal of casual relationships between eating behaviour factors and excess weight.
Much research in this area mainly consists of cross-sectional data demonstrating relationships
between eating behaviour and weight; however, many studies have suggested that eating
behaviour scores are able to predict weight gain or weight loss. Snoek and colleagues (78) found
that BMI was more often a predictor of CR rather than CR predicting weight gain. It has also
been found that overweight was a risk factor for the development of dietary restraint at 5 years
(43), 9 years (146) and after 6 years of age (75; 133). As the primary intent of this study was to
examine the reliability and validity evidence of the questionnaire in Canadian children and
adolscents, the secondary objective was exploratory in nature; therefore, cross-sectional data
were used to examine relationships between eating behaviour and weight and food/taste
preferences. Therefore, before we can draw any conclusions regarding the ability of eating
behaviour scores to predict weight, future research should examine the longitudinal data on the
relationship between weight and eating behaviours. Accordingly, future research should focus on
determining the causation, using a longitudinal design, to determine whether eating behaviour
develops as a result of excess weight or if eating behaviour leads the development of excess
weight.
Additionally, all data were collected during school hours; eating behaviours may differ
based on environmental conditions. In their home environment children may have more access to
television which promotes the intake of unhealthy foods (148) or the influence of parental eating
behaviour (62; 140). Future research should examine if differences in eating behaviour and food
intake exist between school and home contexts. Food intake data was also conducted using self-
report measures of eating behaviour and may have been influenced by recall and reporting bias
(126; 129) and may not accurately reflect actual food intake. An important limitation of food

95
preference identification is the possibility of underreporting food preferences, as a review from
Asbeck et al. (182) found that CR was associated with underreporting of foods in adolescents. It is
also important to note that due to the self-report nature of the questionnaires, acquiescence and
social desirability may have influenced the results (126; 127). Furthermore, research has
demonstrated that statements about food such as in the TFEQ and the LFPQ, respondents may be
more inclined to agree with statements about hunger and food preferences when they are in fact
hungry (183; 184). Although we attempted to control the timing of the questionnaire so that it was
administered between breakfast and lunch, we did not control the food intake of the participants.
It may be beneficial for future research to examine actual food intake in a laboratory setting, to
ensure that food intake does, in fact, match self-report measures and ensure that food intake
accurately reflects food and taste preferences.
Although the data revealed that BMI z-scores did correlate with eating behaviour factors,
body composition and more direct measures of adiposity were not considered in this study.
Although the use of standardized BMI-for-age growth charts reduced the differences observed in
the amount of body fat in girls and boys as they grow, future research may want to examine other
adiposity measures and body composition using Dual-energy X-ray Absorptiometry (DXA) (185).
Martin-Garcia and colleagues (15) found that body fat was associated with eating behaviours in
Spanish children and adolescents. Although the use of BMI as a measure of adiposity may have
acted as a limitation, the majority of published research looking at the validity of the TFEQ uses
BMI as a measure (100). The use of BMI in this research will allow for researchers and clinicians
to make comparisons across different studies.
Another important limitation to note is that we did not collect data on ethnicity and
socioeconomic status, which may act as extraneous variables. Socioeconomic status is associated

96
with awareness of healthy eating and foods, and access to healthy foods, and specifically to the
consumption of high-fat foods (168; 186). The reason we did not account for the socioeconomic
status and ethnicity data was that the Research Ethics board for research in children at CHEO
does not allow for this information to be collected in cases like this. Another limitation is that the
study did not consider mental health issues that may affect eating behaviour, such as binge eating
disorder, anorexia, or bulimia. We also did not examine fitness level and physical activity, which
may also have influenced eating behaviour, as increased physical activity has been shown to help
regulate internal hunger sensations, reduce the hedonic component of overeating, and maintain a
healthier weight (180; 181).
97
Conclusion
In summary, this study demonstrated evidence of internal consistency reliability and
validity of scores for the TFEQ-R21 C, demonstrating that the questionnaire is best represented
by a 20-item four-factor model in our sample of Canadian children and adolescents in the Ottawa
area. We also provided evidence of relationships between FFEQ-R20 C factor scores and Power
of Food Scale factors, BMI z-scores, and food and taste preferences in children and adolescents.
However, the effect sizes were categorized as small. The FFEQ-R20 C was able to identify
relevant eating behaviour traits associated with higher BMI z-scores in both sexes and age
groups. In younger children, food and taste preferences were linked more strongly with the
psychological factors of the FFEQ-R20 C, whereas food and taste preferences in boys were
linked more strongly with anthropometric measures. This study provided initial validity and
reliability evidence that eating behaviours in Canadian children and adolescents in our sample
are best categorized by the FFEQ-R20 and it may be a useful self-report tool to measure eating
behaviour in Canadian children and adolescents. However, more evidence is needed to support
the four-factor model of the questionnaire before we can generalize the findings. Furthermore,
the psychometric analysis revealed that revision of the instrument might increase the validity and
reliability. Based on our analysis, it is recommended to add more items addressing External
Uncontrolled Eating, and re-examining the problematic items and low loading items to determine
why they are problematic, to enhance the usefulness of this questionnaire in children and
adolescents. It is also recommended that researchers conduct a psychometric analysis of the
questionnaire in their sample before drawing conclusions based on the results.
Furthermore, the fact that CR, UE (1 and 2), and EE are interrelated demonstrates the
complexity of human eating behaviours, and they may mediate or moderate each other. The

98
process of accumulating validity evidence is ongoing and more evidence is needed to support the
four-factor model of the questionnaire. Future research should first focus on re-examining
problematic questions, rewording stems, and using consistent response categories for items
measuring the same constructs. Furthermore, future research should focus on testing the four-
factor model of the TFEQ-R21 C (FFEQ-R20 C) in a larger sample of differing geographical
locations and considering the socioeconomic status and mental health issues. It is hoped that this
research will stimulate research efforts in this area with a long-term goal to find better solutions
to the obesity problem in the pediatric population.

99
CHAPTER 6
References
1. Corscadden, L., Taylor, A., Sebold, A., Maddocks, E., Pearson, C., & Harvey, J.
(2011). Obesity in Canada: A joint report from the Public Health Agency of Canada
and the Canadian Institute for Health Information. Public Health Agency of Canada.
2. Rao, D. P., Kropac, E., Do, M. T., Roberts, K. C., & Jayaraman, G. C. (2016).
Childhood overweight and obesity trends in Canada. Health Promotion and Chronic
Disease Prevention in Canada: Research, Policy and Practice, 36(9), 194.
3. Shields, M. (2006). Overweight and obesity among children and youth. Health
Reports, 17(3), 27.
4. Sahoo, K., Sahoo, B., Choudhury, A. K., Sofi, N. Y., Kumar, R., & Bhadoria, A. S.
(2015). Childhood obesity: causes and consequences. Journal of family medicine and
primary care, 4(2), 187.
5. Dietz, W. H. (1998). Health consequences of obesity in youth: childhood predictors of
adult disease. Pediatrics, 101(Supplement 2), 518-525.
6. Lobstein, T., Baur, L., & Uauy, R. (2004). Obesity in children and young people: a
crisis in public health. Obesity reviews, 5(s1), 4-85.
7. Singh, A. S., Mulder, C., Twisk, J. W., Van Mechelen, W., & Chinapaw, M. J. (2008).
Tracking of childhood overweight into adulthood: a systematic review of the
literature. Obesity reviews, 9(5), 474-488.
8. World Health Organization. (2018). Obesity and Overweight. Retreived from:
http://www.who.int/mediacentre/factsheets/fs311/en/
100
9. Davison, K. K., & Birch, L. L. (2001). Childhood overweight: a contextual model and
recommendations for future research. Obesity reviews, 2(3), 159-171.
10. Beaulieu, K., Hopkins, M., Blundell, J., & Finlayson, G. (2017). Impact of physical
activity level and dietary fat content on passive overconsumption of energy in non-
obese adults. International Journal of Behavioral Nutrition and Physical
Activity, 14(1), 14.
11. Blundell, J. E., & MacDiarmid, J. I. (1997). Fat as a risk factor for overconsumption:
satiation, satiety, and patterns of eating. Journal of the American Dietetic
Association, 97(7), S63-S69.
12. Swinburn, B., Egger, G., & Raza, F. (1999). Dissecting obesogenic environments: the
development and application of a framework for identifying and prioritizing
environmental interventions for obesity. Preventive medicine, 29(6), 563-570.
13. Bryant, E. J., Thivel, D., Chaput, J. P., Drapeau, V., Blundell, J. E., & King, N. A.
(2018). Development and validation of the Child Three-Factor Eating Questionnaire
(CTFEQr17). Public health nutrition, 1-10.
14. Gallant, A. R., Tremblay, A., Pérusse, L., Bouchard, C., Despres, J. P., & Drapeau, V.
(2010). The Three-Factor Eating Questionnaire and BMI in adolescents: results from
the Quebec family study. British Journal of Nutrition, 104(07), 1074-1079.
15. Martín-García, M., Vila-Maldonado, S., Rodríguez-Gómez, I., Faya, F. M., Plaza-
Carmona, M., Pastor-Vicedo, J. C., & Ara, I. (2016). The Spanish version of the Three
Factor Eating Questionnaire-R21 for children and adolescents (TFEQ-R21C):
Psychometric analysis and relationships with body composition and fitness
variables. Physiology & Behavior, 165, 350-357.

101
16. Stunkard, A. J., & Messick, S. (1985). The three-factor eating questionnaire to
measure dietary restraint, disinhibition and hunger. Journal of psychosomatic
research, 29(1), 71-83.
17. Polivy, J., & Herman, C. P. (1976). Effects of alcohol on eating behavior: influence of
mood and perceived intoxication. Journal of abnormal psychology, 85(6), 601.
18. Meyer, J. E., & Pudel, V. E. (1977). Experimental feeding in man: a behavioral
approach to obesity. Psychosomatic medicine, 39(3), 153-157.
19. Cappelleri, J. C., Bushmakin, A. G., Gerber, R. A., Leidy, N. K., Sexton, C. C., Lowe,
M. R., & Karlsson, J. (2009). Psychometric analysis of the Three-Factor Eating
Questionnaire-R21: results from a large diverse sample of obese and non-obese
participants. International Journal of Obesity, 33(6), 611-620.
20. Karlsson, J., Persson, L. O., Sjöström, L., & Sullivan, M. (2000). Psychometric
properties and factor structure of the Three-Factor Eating Questionnaire (TFEQ) in
obese men and women. Results from the Swedish Obese Subjects (SOS)
study. International Journal of Obesity & Related Metabolic Disorders, 24(12).
21. Annunziato, R. A., Lee, J. N., & Lowe, M. R. (2007). A comparison of weight-control
behaviors in African American and Caucasian women.
22. Bond, M. J., McDowell, A. J., & Wilkinson, J. Y. (2001). The measurement of dietary
restraint, disinhibition and hunger: an examination of the factor structure of the Three
Factor Eating Questionnaire (TFEQ). International Journal of Obesity & Related
Metabolic Disorders, 25(6).
23. de Lauzon, B., Romon, M., Deschamps, V., Lafay, L., Borys, J. M., Karlsson, J., &
Charles, M. A. (2004). The Three-Factor Eating Questionnaire-R18 is able to

102
distinguish among different eating patterns in a general population. The Journal of
nutrition, 134(9), 2372-2380.
24. Hyland, M. E., Irvine, S. H., Thacker, C., Dann, P. L., & Dennis, I. (1989).
Psychometric analysis of the Stunkard-Messick Eating Questionnaire (SMEQ) and
comparison with the Dutch Eating Behavior Questionnaire (DEBQ). Current
Psychology, 8(3), 228-233.
25. Karakuş, S. Ş., Yıldırım, H., & Büyüköztürk, Ş. (2016). Adaptation of three factor
eating questionnaire (TFEQ-R21) into Turkish culture: A validity and reliability
study. TAF Preventive Medicine Bulletin, 15(3), 229-237.
26. Bryant, E. J., Caudwell, P., Hopkins, M. E., King, N. A., & Blundell, J. E. (2012).
Psycho-markers of weight loss. The roles of TFEQ Disinhibition and Restraint in
exercise-induced weight management. Appetite, 58(1), 234-241.
27. Keränen, A. M., Strengell, K., Savolainen, M. J., & Laitinen, J. H. (2011). Effect of
weight loss intervention on the association between eating behaviour measured by
TFEQ-18 and dietary intake in adults. Appetite, 56(1), 156-162.
28. Lindroos, A. K., Lissner, L., Mathiassen, M. E., Karlsson, J., Sullivan, M., Bengtsson,
C., & Sjöström, L. (1997). Dietary intake in relation to restrained eating, disinhibition,
and hunger in obese and non-obese Swedish women. Obesity Research, 5(3), 175-182.
29. de Medeiros, A. C. Q., Yamamoto, M. E., Pedrosa, L. F. C., & Hutz, C. S. (2016). The
Brazilian version of the three-factor eating questionnaire-R21: psychometric
evaluation and scoring pattern. Eating and Weight Disorders-Studies on Anorexia,
Bulimia and Obesity, 1-7.
30. Tholin, S., Rasmussen, F., Tynelius, P., & Karlsson, J. (2005). Genetic and

103
environmental influences on eating behavior: the Swedish Young Male Twins
Study. The American journal of clinical nutrition, 81(3), 564-569.
31. Westenhoefer, J. (1991). Dietary restraint and disinhibition: is restraint a
homogeneous construct?. Appetite, 16(1), 45-55.
32. Yeomans, M. R., Leitch, M., & Mobini, S. (2008). Impulsivity is associated with the
disinhibition but not restraint factor from the Three Factor Eating
Questionnaire. Appetite, 50(2), 469-476.
33. Hill, A. J., Draper, E., & Stack, J. (1994). A weight on children's minds: body shape
dissatisfactions at 9-years old. International journal of obesity and related metabolic
disorders: journal of the International Association for the Study of Obesity, 18(6),
383-389.
34. Grimm, E. R., & Steinle, N. I. (2011). Genetics of eating behavior: established and
emerging concepts. Nutrition reviews, 69(1), 52-60.
35. Lowe, M. R., & Butryn, M. L. (2007). Hedonic hunger: a new dimension of
appetite?. Physiology & behavior, 91(4), 432-439.
36. Herman, C. P., & Mack, D. (1975). Restrained and unrestrained eating1. Journal of
personality, 43(4), 647-660.
37. Herman, C. P., & Polivy, J. (1975). Anxiety, restraint, and eating behavior. Journal of
abnormal psychology, 84(6), 666.
38. Drewnowski, A., Riskey, D., & Desor, J. A. (1982). Feeling fat yet unconcerned: Self-
reported overweight and the restraint scale. Appetite, 3(3), 273-279.
39. Blanchard, F. A., & Frost, R. O. (1983). Two factors of restraint: Concern for dieting
and weight fluctuation. Behaviour Research and Therapy, 21(3), 259-267.

104
40. Hibscher, J. A., & Herman, C. P. (1977). Obesity, dieting, and the expression of obese
characteristics. Journal of Comparative and Physiological Psychology, 91(2), 374.
41. Ruderman, A. J. (1986). Dietary restraint: A theoretical and empirical
review. Psychological Bulletin, 99(2), 247.
42. Wardle, J. (1986). The assessment of restrained eating. Behaviour Research and
Therapy, 24(2), 213-215.
43. Van Strien, T., Frijters, J. E., Bergers, G., & Defares, P. B. (1986). The Dutch Eating
Behavior Questionnaire (DEBQ) for assessment of restrained, emotional, and external
eating behavior. International journal of eating disorders, 5(2), 295-315.
44. Allison, D. B., Kalinsky, L. B., & Gorman, B. S. (1992). A comparison of the
psychometric properties of three measures of dietary restraint. Psychological
assessment, 4(3), 391.
45. Laessle, R. G., Tuschl, R. J., Kotthaus, B. C., & Prike, K. M. (1989). A comparison of
the validity of three scales for the assessment of dietary restraint. Journal of abnormal
psychology, 98(4), 504.
46. Ogden, J. (1993). The measurement of restraint: Confounding success and
failure?. International Journal of Eating Disorders, 13(1), 69-76.
47. Anglé, S., Engblom, J., Eriksson, T., Kautiainen, S., Saha, M. T., Lindfors, P., &
Rimpelä, A. (2009). Three factor eating questionnaire-R18 as a measure of cognitive
restraint, uncontrolled eating and emotional eating in a sample of young Finnish
females. International Journal of Behavioral Nutrition and Physical Activity, 6(1), 1.
48. Harden, C. J., Corfe, B. M., Richardson, J. C., Dettmar, P. W., & Paxman, J. R.
(2009). Body mass index and age affect Three-Factor Eating Questionnaire scores in

105
male subjects. Nutrition research, 29(6), 379-382.
49. Provencher, V., Drapeau, V., Tremblay, A., Després, J. P., & Lemieux, S. (2003).
Eating behaviors and indexes of body composition in men and women from the
Quebec family study. Obesity, 11(6), 783-792.
50. Löffler, A., Luck, T., Then, F. S., Sikorski, C., Kovacs, P., Böttcher, Y., & Engel, C.
(2015b). Eating behaviour in the general population: an analysis of the factor structure
of the German version of the Three-Factor-Eating-Questionnaire (TFEQ) and its
association with the body mass index. PloS one, 10(7), e0133977.
51. Carmody, T. P., Brunner, R. L., & St Jeor, S. T. (1995). Dietary helplessness and
disinhibition in weight cyclers and maintainers. International Journal of Eating
Disorders, 18(3), 247-256.
52. Drapeau, V., Provencher, V., Lemieux, S., Després, J. P., Bouchard, C., & Tremblay,
A. (2003). Do 6-y changes in eating behaviors predict changes in body weight?
Results from the Quebec Family Study. International Journal of Obesity, 27(7), 808.
53. Karlsson, J., Hallgren, P., Kral, J., Lindroos, A. K., Sjöström, L., & Sullivan, M.
(1994). Predictors and effects of long-term dieting on mental well-being and weight
loss in obese women. Appetite, 23(1), 15-26.
54. Clark, M. M., Marcus, B. H., Pera, V., & Niaura, R. S. (1994). Changes in eating
inventory scores following obesity treatment. International Journal of Eating
Disorders, 15(4), 401-405.
55. Foster, G. D., Wadden, T. A., Swain, R. M., Stunkard, A. J., Platte, P., & Vogt, R. A.
(1998). The Eating Inventory in obese women: clinical correlates and relationship to
weight loss. International journal of obesity, 22(8), 778.

106
56. Björvell, H., Aly, A., Langius, A., & Nordström, G. (1994). Indicators of changes in
weight and eating behaviour in severely obese patients treated in a nursing behavioural
program. International journal of obesity and related metabolic disorders: journal of
the International Association for the Study of Obesity, 18(8), 521-525.
57. Svendsen, M., Rissanen, A., Richelsen, B., Rössner, S., Hansson, F., & Tonstad, S.
(2008). Effect of Orlistat on Eating Behavior Among Participants in a 3‐year W eight
Maintenance Trial. Obesity, 16(2), 327-333.
58. Lowe, M. R., & Maycock, B. (1988). Restraint, disinhibition, hunger and negative
affect eating. Addictive Behaviors, 13(4), 369-377.
59. Ganley, R. M. (1988). Emotional eating and how it relates to dietary restraint,
disinhibition, and perceived hunger. International Journal of Eating Disorders, 7(5),
635-647.
60. Ricciardelli, L. A., & Williams, R. J. (1997). A two‐factor model of dietary
restraint. Journal of clinical psychology, 53(2), 123-131.
61. Mazzeo, S. E., Aggen, S. H., Anderson, C., Tozzi, F., & Bulik, C. M. (2003).
Investigating the structure of the eating inventory (three‐factor eating questionnaire):
A confirmatory approach. International Journal of Eating Disorders, 34(2), 255-264.
62. Elfhag, K., & Linné, Y. (2005). Gender differences in associations of eating pathology
between mothers and their adolescent offspring. Obesity research, 13(6), 1070-1076.
63. Kavazidou, E., Proios, M., Liolios, I., Doganis, G., Petrou, K., Tsatsoulis, A., &
Tsiligiroglou-Fachantidou, A. (2012). Structure validity of the three-factor eating
questionnaire-R18 in Greek population.
64. Jáuregui-Lobera, I., García-Cruz, P., Carbonero-Carreño, R., Magallares, A., & Ruiz-

107
Prieto, I. (2014). Psychometric properties of Spanish version of the Three-Factor
Eating Questionnaire-R18 (Tfeq-Sp) and its relationship with some eating-and body
image-related variables. Nutrients, 6(12), 5619-5635.
65. Keränen, A. M., Savolainen, M. J., Reponen, A. H., Kujari, M. L., Lindeman, S. M.,
Bloigu, R. S., & Laitinen, J. H. (2009). The effect of eating behavior on weight loss
and maintenance during a lifestyle intervention. Preventive medicine, 49(1), 32-38.
66. Braet, C., & Van Strien, T. (1997). Assessment of emotional, externally induced and
restrained eating behaviour in nine to twelve-year-old obese and non-obese
children. Behaviour research and therapy, 35(9), 863-873.
67. van Strien, T., & Oosterveld, P. (2008). The children's DEBQ for assessment of
restrained, emotional, and external eating in 7‐to 1 2‐year‐ old
children. International journal of eating disorders, 41(1), 72-81.
68. Bryant, M., Ashton, L., Brown, J., Jebb, S., Wright, J., Roberts, K., & Nixon, J.
(2014). Systematic review to identify and appraise outcome measures used to evaluate
childhood obesity treatment interventions (CoOR): evidence of purpose, application,
validity, reliability and sensitivity. Health Technology Assessment, 18(51).
69. Baños, R. M., Cebolla, A., Etchemendy, E., Felipe, S., Rasal, P., & Botella, C. (2011).
Validation of the Dutch Eating Behavior Questionnaire for Children (DEBQ-C) for
use with Spanish children. Nutricion hospitalaria, 26(4).
70. Caccialanza, R., Nicholls, D., Cena, H., Maccarini, L., Rezzani, C., Antonioli, L., &
Roggi, C. (2004). Validation of the Dutch Eating Behaviour Questionnaire parent
version (DEBQ-P) in the Italian population: a screening tool to detect differences in

108
eating behaviour among obese, overweight and normal-weight
preadolescents. European Journal of Clinical Nutrition, 58(9), 1217.
71. Bryant, E. J., King, N. A., & Blundell, J. E. (2008). Disinhibition: its effects on
appetite and weight regulation. Obesity reviews, 9(5), 409-419.
72. Megalakaki, O., Mouveaux, M., Hubin-Gayte, M., & Wypych, L. (2013). Body image
and cognitive restraint are risk factors for obesity in French adolescents. Eating and
Weight Disorders-Studies on Meyer, J. E., & Pudel, V. (1972). Experimental studies
on food-intake in obese and normal weight subjects. Journal of Psychosomatic
Research, 16(4), 305-308.
73. Halberstadt, J., van Strien, T., de Vet, E., Eekhout, I., Braet, C., & Seidell, J. C.
(2016). The association of eating styles with weight change after an intensive
combined lifestyle intervention for children and adolescents with severe
obesity. Appetite, 99, 82-90.
74. Ledoux, T., Watson, K., Baranowski, J., Tepper, B. J., & Baranowski, T. (2011).
Overeating styles and adiposity among multiethnic youth. Appetite, 56(1), 71-77.
75. Lluch, A., Herbeth, B., Mejean, L., & Siest, G. (2000). Dietary intakes, eating style
and overweight in the Stanislas Family Study. International journal of
Obesity, 24(11), 1493.
76. Munguía-Lizárraga, S., Bacardí-Gascón, M., Armendáriz-Anguiano, A., & Jiménez-
Cruz, A. (2015). Association of eating behaviors and BMI among elementary school
students from Mexico. Nutr Hosp, 31(6), 2775-2777.
109
77. Vogels, N., Posthumus, D. L., Mariman, E. C., Bouwman, F., Kester, A. D., Rump, P.,
... & Westerterp-Plantenga, M. S. (2006). Determinants of overweight in a cohort of
Dutch children–. The American journal of clinical nutrition, 84(4), 717-724.
78. Snoek, H. M., van Strien, T., Janssens, J. M., & Engels, R. C. (2008). Restrained
eating and BMI: A longitudinal study among adolescents. Health Psychology, 27(6),
753.
79. van Strien, T., Konttinen, H., Homberg, J. R., Engels, R. C., & Winkens, L. H. (2016).
Emotional eating as a mediator between depression and weight gain. Appetite, 100,
216-224.
80. Braet, C., Claus, L., Goossens, L., Moens, E., Van Vlierberghe, L., & Soetens, B.
(2008). Differences in eating style between overweight and normal-weight
youngsters. Journal of health psychology, 13(6), 733-743.
81. Summerbell, C. D., Ashton, V., Campbell, K. J., Edmunds, L., Kelly, S., & Waters, E.
(2003). Interventions for treating obesity in children. Cochrane Database Syst
Rev, 3(3), CD001872.
82. Lowe, M. (2006). Children’s Power of Food Scale. Philadelphia, PA: Drexel
University.
83. Finlayson, G., King, N., & Blundell, J. E. (2007). Is it possible to dissociate ‘liking’
and ‘wanting’ for foods in humans? A novel experimental procedure. Physiology &
behavior, 90(1), 36-42.
84. Ferguson, E., & Cox, T. (1993). Exploratory factor analysis: A users’
guide. International Journal of Selection and Assessment, 1(2), 84-94.

110
85. Bryman, A., & Cramer, D. (1997). Concepts and their measurement. Quantitative data
analysis, with SPSS for Windows.
86. Field, A. (2009). Discovering statistics using SPSS. Sage publications.
87. Tabachnick, B. G., & Fidell, L. S. (2007). Using multivariate statistics. Allyn &
Bacon/Pearson Education.
88. Fincham, J. E. (2008). Response rates and responsiveness for surveys, standards, and
the Journal. American journal of pharmaceutical education, 72(2), 43.
89. O'Rourke, N., Psych, R., & Hatcher, L. (2013). A step-by-step approach to using SAS
for factor analysis and structural equation modeling. Sas Institute.
90. Lowe, M. R., Butryn, M. L., Didie, E. R., Annunziato, R. A., Thomas, J. G., Crerand,
C. E., & Halford, J. (2009). The Power of Food Scale. A new measure of the
psychological influence of the food environment. Appetite, 53(1), 114-118.
91. Laurent, J. S. (2015). Psychometric properties for the Children's Power of Food Scale
in a diverse sample of pre-adolescent youth. Applied Nursing Research, 28(2), 127-
131.
92. Halford, J. C., Boyland, E. J., Cooper, G. D., Dovey, T. M., Smith, C. J., Williams, N.,
... & Blundell, J. E. (2008). Children's food preferences: effects of weight status, food
type, branding and television food advertisements (commercials). Pediatric
Obesity, 3(1), 31-38.
93. Dalton, M., & Finlayson, G. (2014). Psychobiological examination of liking and
wanting for fat and sweet taste in trait binge eating females. Physiology &
behavior, 136, 128-134.
94. Finlayson, G., Arlotti, A., Dalton, M., King, N., & Blundell, J. E. (2011). Implicit
111
wanting and explicit liking are markers for trait binge eating. A susceptible phenotype
for overeating. Appetite, 57(3), 722-728.
95. Gazzaniga, J. M., & Burns, T. L. (1993). Relationship between diet composition and
body fatness, with adjustment for resting energy expenditure and physical activity, in
preadolescent children. The American journal of clinical nutrition, 58(1), 21-28.
96. Maffeis, C., Pinelli, L., & Schutz, Y. (1996). Fat intake and adiposity in 8 to 11-year-
old obese children. International journal of obesity and related metabolic disorders:
journal of the International Association for the Study of Obesity, 20(2), 170-174.
97. Tucker, L. A., Seljaas, G. T., & Hager, R. L. (1997). Body fat percentage of children
varies according to their diet composition. Journal of the Academy of Nutrition and
Dietetics, 97(9), 981-986.
98. Guillaume, M., Lapidus, L., & Lambert, A. (1998). Obesity and nutrition in children.
The Belgian Luxembourg child study IV. European journal of clinical
nutrition, 52(5), 323.
99. Healthy Active Living and Obesity Research Group. (2013). Canadian assessment of
physical literacy - manual for test administration. Ottawa, ON: Healthy Active Living
and Obesity Research Group (HALO)
100. Himes, J. H. (2009). Challenges of accurately measuring and using BMI and other
indicators of obesity in children. Pediatrics, 124(Supplement 1), S3-S22.
101. Anderson, L. N., Carsley, S., Lebovic, G., Borkhoff, C. M., Maguire, J. L., Parkin, P.
C., & Birken, C. S. (2017). Misclassification of child body mass index from cut-points
defined by rounded percentiles instead of Z-scores. BMC research notes, 10(1), 639.

112
102. World Health Organization. (2007). Growth Reference 2-19 Years. Retreived from:
http://www.who.int/growthref/who2007_bmi_for_age/en/
103. IBM Corp. Released 2016. IBM SPSS Statistics for Windows, Version 24.0. Armonk,
NY: IBM Corp.
104. McNeish, D. (2017). Exploratory factor analysis with small samples and missing
data. Journal of personality assessment, 99(6), 637-652.
105. Bowerman, B. L., & O'connell, R. T. (1990). Linear statistical models: An applied
approach. Brooks/Cole.
106. American Educational Research Association, American Psychological Association, &
National Council on Measurement in Education. (1999). Standards for educational
and psychological testing. American Educational Research Association.
107. Gorsuch, R. L. (1997). Exploratory factor analysis: Its role in item analysis. Journal of
personality assessment, 68(3), 532-560.
108. Fabrigar, L. R., & Wegener, D. T. (2011). Exploratory factor analysis. Oxford
University Press.
109. Cattell, R. B. (1966). The scree test for the number of factors. Multivariate behavioral
research, 1(2), 245-276.
110. Grice, J. W., & Harris, R. J. (1998). A comparison of regression and loading weights
for the computation of factor scores. Multivariate Behavioral Research, 33(2), 221-
247.
111. Clason, D. L., & Dormody, T. J. (1994). Analyzing data measured by individual
Likert-type items. Journal of agricultural education, 35, 4.
113
112. Bowling, A. (1997). Data collection methods in quantitative research: questionnaires,
interviews and their response rates. Research methods in health: Investigating health
and health services, 257-272.
113. Cronbach, L. J. (1951). Coefficient alpha and the internal structure of
tests. psychometrika, 16(3), 297-334.
114. Kline, P. (2013). Handbook of psychological testing. Routledge.
115. Rattray, J., & Jones, M. C. (2007). Essential elements of questionnaire design and
development. Journal of clinical nursing, 16(2), 234-243.
116. Schachter, S. (1971). Emotion, obesity, and crime. New York, USA, Academic Press,
Inc.
117. Schachter, S., & Rodin, J. (1974). Obese humans and rats. Lawrence Erlbaum.
118. Cohen, J. (1988). Statistical power analysis for the behavioral sciences 2nd edn.
119. Ventura, A. K., & Worobey, J. (2013). Early influences on the development of food
preferences. Current Biology, 23(9), R401-R408.
120. Mitchell, T. B., Cushing, C. C., & Amaro, C. M. (2016). Psychometric properties of
the power of food scale in a community sample of preadolescents and
adolescents. Journal of Child and Family Studies, 25(9), 2733-2739.
121. McNeish D. (2017). Thanks coefficient alpha, we'll take it from here. Psychol.
Methods. [Epub ahead of print].
122. Streiner, D. L. (2003). Starting at the beginning: an introduction to coefficient alpha
and internal consistency. Journal of personality assessment, 80(1), 99-103.

114
123. Drapeau, V., Blundell, J., Gallant, A. R., Arguin, H., Després, J. P., Lamarche, B., &
Tremblay, A. (2013). Behavioural and metabolic characterisation of the low satiety
phenotype. Appetite, 70, 67-72.
124. de Lauzon-Guillain, B., Basdevant, A., Romon, M., Karlsson, J., Borys, J. M.,
Charles, M. A., & FLVS Study Group. (2006). Is restrained eating a risk factor for
weight gain in a general population?. The American journal of clinical
nutrition, 83(1), 132-138.
125. Van Sonderen, E., Sanderman, R., & Coyne, J. C. (2013). Ineffectiveness of reverse
wording of questionnaire items: Let’s learn from cows in the rain. PloS one, 8(7),
e68967.
126. Paulhus, D. L. (1991). Measurement and control of response bias.
127. Swain, S. D., Weathers, D., & Niedrich, R. W. (2008). Assessing three sources of
misresponse to reversed Likert items. Journal of Marketing Research, 45(1), 116-131.
128. Garland, R. (1991). The mid-point on a rating scale: Is it desirable. Marketing
bulletin, 2(1), 66-70.
129. Randall, D. M., & Fernandes, M. F. (1991). The social desirability response bias in
ethics research. Journal of business ethics, 10(11), 805-817.
130. Allen, I. E., & Seaman, C. A. (2007). Likert scales and data analyses. Quality
progress, 40(7), 64.
131. Halvarsson, K., Lunner, K., Westerberg, J., Anteson, F., & Sjödén, P. O. (2002). A
longitudinal study of the development of dieting among 7–17‐year‐ old Swedish
girls. International Journal of Eating Disorders, 31(1), 32-42.

115
132. Babio, N., Canals, J., Fernández-Ballart, J., & Arija, V. (2008). Non-clinical
adolescent girls at risk of eating disorder: under-reporters or restrained
eaters?. Nutrición hospitalaria, 23(1).
133. Forrester-Knauss, C., Perren, S., & Alsaker, F. D. (2012). Does body mass index in
childhood predict restraint eating in early adolescence?. Appetite, 59(3), 921-926.
134. Goldfield, G. S., Moore, C., Henderson, K., Buchholz, A., Obeid, N., & Flament, M.
F. (2010). Body dissatisfaction, dietary restraint, depression, and weight status in
adolescents. Journal of school health, 80(4), 186-192.
135. Snoek, H. M., Van Strien, T., Janssens, J. M., & Engels, R. C. (2007). Emotional,
external, restrained eating and overweight in Dutch adolescents. Scandinavian journal
of psychology, 48(1), 23-32.
136. Kaplan, H. I., & Kaplan, H. S. (1957). The psychosomatic concept of obesity. Journal
of Nervous and Mental Disease.
137. Macht, M., & Simons, G. (2011). Emotional eating. In Emotion regulation and well-
being (pp. 281-295). Springer, New York, NY.
138. Van Strien, T., & Ouwens, M. A. (2003). Counter regulation in female obese
emotional eaters: Schachter, Goldman, and Gordon's (1968) test of psychosomatic
theory revisited. Eating Behaviors, 3(4), 329-340.
139. Adam, T. C., & Epel, E. S. (2007). Stress, eating and the reward system. Physiology &
behavior, 91(4), 449-458.
140. Topham, G. L., Hubbs-Tait, L., Rutledge, J. M., Page, M. C., Kennedy, T. S., Shriver,
L. H., & Harrist, A. W. (2011). Parenting styles, parental response to child emotion,

116
and family emotional responsiveness are related to child emotional
eating. Appetite, 56(2), 261-264.
141. Stroebe, W., Van Koningsbruggen, G. M., Papies, E. K., & Aarts, H. (2013). Why
most dieters fail but some succeed: a goal conflict model of eating
behavior. Psychological review, 120(1), 110.
142. Graham, A. L., Gluck, M. E., Votruba, S. B., Krakoff, J., & Thearle, M. S. (2014).
Perseveration augments the effects of cognitive restraint on ad libitum food intake in
adults seeking weight loss. Appetite, 82, 78-84.
143. Thamotharan, S., Lange, K., Zale, E. L., Huffhines, L., & Fields, S. (2013). The role
of impulsivity in pediatric obesity and weight status: a meta-analytic review. Clinical
psychology review, 33(2), 253-262.
144. Snoek, H. M., Engels, R. C., Van Strien, T., & Otten, R. (2013). Emotional, external
and restrained eating behaviour and BMI trajectories in adolescence. Appetite, 67, 81-
87.
145. Stice, E., Agras, W. S., & Hammer, L. D. (1999). Risk factors for the emergence of
childhood eating disturbances: A five‐year prospective study. International Journal
of Eating Disorders, 25(4), 375-387.
146. Shunk, J. A., & Birch, L. L. (2004). Girls at risk for overweight at age 5 are at risk for
dietary restraint, disinhibited overeating, weight concerns, and greater weight gain
from 5 to 9 years. Journal of the American Dietetic Association, 104(7), 1120-1126.
147. Bruch, H. (1961). Transformation of oral impulses in eating disorders: A conceptual
approach. Psychiatric Quarterly, 35(3), 458-481.

117
148. Anschutz, D. J., Engels, R. C., & Van Strien, T. (2009). Side effects of television food
commercials on concurrent non-advertised sweet snack food intakes in young
children. The American journal of clinical nutrition, 89(5), 1328-1333.
149. Boyland, E. J., Harrold, J. A., Kirkham, T. C., Corker, C., Cuddy, J., Evans, D., &
Halford, J. C. (2011). Food commercials increase preference for energy-dense foods,
particularly in children who watch more television. Pediatrics, 128(1), e93-e100.
150. Friedman, M. A., & Brownell, K. D. (2002). Psychological consequences of
obesity. Eating disorders and obesity: A comprehensive handbook, 2, 393-398.
151. Fisher, J. O., & Birch, L. L. (1999). Restricting access to palatable foods affects
children's behavioral response, food selection, and intake–. The American journal of
clinical nutrition, 69(6), 1264-1272.
152. Lähteenmäki, L., & Tuorila, H. (1995). Three-factor eating questionnaire and the use
and liking of sweet and fat among dieters. Physiology & behavior, 57(1), 81-88.
153. Löffler, A., Luck, T., Then, F. S., Luppa, M., Sikorski, C., Kovacs, P., & Löffler, M.
(2015a). Age-and gender-specific norms for the German version of the Three-Factor
Eating-Questionnaire (TFEQ). Appetite, 91, 241-247.
154. Drewnowski, A., & Schwartz, M. (1990). Invisible fats: sensory assessment of
sugar/fat mixtures. Appetite, 14(3), 203-217.
155. Yeomans, M. R., Tovey, H. M., Tinley, E. M., & Haynes, C. J. (2004). Effects of
manipulated palatability on appetite depend on restraint and disinhibition scores from
the Three-Factor Eating Questionnaire. International journal of obesity, 28(1), 144.
118
156. Gerstein, D. E., Woodward-Lopez, G., Evans, A. E., Kelsey, K., & Drewnowski, A.
(2004). Clarifying concepts about macronutrients’ effects on satiation and
satiety. Journal of the American Dietetic Association, 104(7), 1151-1153.
157. Chambers, L., McCrickerd, K., & Yeomans, M. R. (2015). Optimising foods for
satiety. Trends in Food Science & Technology, 41(2), 149-160.
158. Akabayashi, A., Koenig, J. I., Watanabe, Y., Alexander, J. T., & Leibowitz, S. F.
(1994). Galanin-containing neurons in the paraventricular nucleus: a neurochemical
marker for fat ingestion and body weight gain. Proceedings of the National Academy
of Sciences, 91(22), 10375-10379.
159. Karhunen, L. J., Lappalainen, R. I., Haffner, S. M., Valve, R. H., Tuorila, H.,
Miettinen, H., & Uusitupa, M. I. J. (1998). Serum leptin, food intake and preferences
for sugar and fat in obese women. International journal of obesity, 22(8), 819.
160. Finlayson, G., Bordes, I., Griffioen-Roose, S., de Graaf, C., & Blundell, J. E. (2011).
Susceptibility to Overeating Affects the Impact of Savory or Sweet Drinks on
Satiation, Reward, and Food Intake in Non-obese Women–3. The Journal of
nutrition, 142(1), 125-130.
161. Brignell, C., Griffiths, T., Bradley, B. P., & Mogg, K. (2009). Attentional and
approach biases for pictorial food cues. Influence of external eating. Appetite, 52(2),
299-306.
162. Elfhag, K., & Erlanson-Albertsson, C. (2006). Sweet and fat taste preference in
obesity have different associations with personality and eating behavior. Physiology &
behavior, 88(1-2), 61-66.

119
163. Keskitalo, K., Tuorila, H., Spector, T. D., Cherkas, L. F., Knaapila, A., Kaprio, J., ...
& Perola, M. (2008). The Three-Factor Eating Questionnaire, body mass index, and
responses to sweet and salty fatty foods: a twin study of genetic and environmental
associations–. The American journal of clinical nutrition, 88(2), 263-271.
164. Camilleri, G. M., Méjean, C., Kesse-Guyot, E., Andreeva, V. A., Bellisle, F.,
Hercberg, S., & Péneau, S. (2014). The Associations between Emotional Eating and
Consumption of Energy-Dense Snack Foods Are Modified by Sex and Depressive
Symptomatology, 2. The Journal of nutrition, 144(8), 1264-1273.
165. Roberts, C. J., Campbell, I. C., & Troop, N. (2014). Increases in weight during chronic
stress are partially associated with a switch in food choice towards increased
carbohydrate and saturated fat intake. European Eating Disorders Review, 22(1), 77-
82.
166. Caine‐Bish, N. L., & Scheule, B. (2009). Gender Differences in Food Preferences of
School‐Aged Children and Adolescents. Journal of School Health, 79(11), 532-540.
167. Johnson, S. L., McPhee, L., & Birch, L. L. (1991). Conditioned preferences: young
children prefer flavors associated with high dietary fat. Physiology & behavior, 50(6),
1245-1251.
168. Drewnowski, A. (1997). Taste preferences and food intake. Annual review of
nutrition, 17(1), 237-253.
169. Golay, A., Hagon, I., Painot, D., Rouget, P., Allaz, A. F., Morel, Y., & Archinard, M.
(1997). Personalities and alimentary behaviors in obese patients. Patient education
and counseling, 31(2), 103-112.

120
170. Li, M., & Cheung, B. M. (2009). Pharmacotherapy for obesity. British journal of
clinical pharmacology, 68(6), 804-810.
171. Epstein, L. H. (1993). Methodological Issues and Ten‐Year Outcomes for Obese
Children. Annals of the New York Academy of Sciences, 699(1), 237-249.
172. Epstein, L. H., Valoski, A., Wing, R. R., & McCurley, J. (1990). Ten-year follow-up
of behavioral, family-based treatment for obese children. Jama, 264(19), 2519-2523.
173. Nuutinen, O., & Knip, M. (1992). Predictors of weight reduction in obese
children. European journal of clinical nutrition, 46(11), 785-794.
174. Budd, G. M., & Hayman, L. L. (2008). Addressing the childhood obesity crisis: A call
to action. MCN: The American Journal of Maternal/Child Nursing, 33(2), 111-118.)
175. Patrick, H., & Nicklas, T. A. (2005). A review of family and social determinants of
children’s eating patterns and diet quality. Journal of the American College of
Nutrition, 24(2), 83-92.
176. de Lauzon- Guillain, D., Romon, M., Musher‐Eizenman, D., Heude, B., Basdevant,
A., & Charles, M. A. (2009). Cognitive restraint, uncontrolled eating and emotional
eating: correlations between parent and adolescent. Maternal & child nutrition, 5(2),
171-178.
177. Epstein, L. H. (1996). Family-based behavioural intervention for obese
children. International journal of obesity and related metabolic disorders: journal of
the International Association for the Study of Obesity, 20, S14-21.
178. Costello, A. B., & Osborne, J. W. (2005). Best practices in exploratory factor analysis:
Four recommendations for getting the most from your analysis. Practical assessment,
research & evaluation, 10(7), 1-9.
121
179. Severson, H. H., & Ary, D. V. (1983). Sampling bias due to consent procedures with
adolescents. Addictive Behaviors, 8(4), 433-437.
180. Martins, C., Morgan, L., & Truby, H. (2008). A review of the effects of exercise on
appetite regulation: an obesity perspective. International journal of obesity, 32(9),
1337.
181. Wardle, J., Guthrie, C., Sanderson, S., Birch, L., & Plomin, R. (2001). Food and
activity preferences in children of lean and obese parents. International journal of
obesity, 25(7), 971.
182. Asbeck, I., Mast, M., Bierwag, A., Westenhöfer, J., Acheson, K. J., & Müller, M. J.
(2002). Severe underreporting of energy intake in normal weight subjects: use of an
appropriate standard and relation to restrained eating. Public health nutrition, 5(5),
683-690.
183. Cameron, J. D., & Doucet, É. (2011). Reinforcement and food hedonics: a look at how
energy deprivation impacts food reward. In Handbook of Behavior, Food and
Nutrition (pp. 2285-2305). Springer, New York, NY.
184. Yeomans, M. R., & McCrickerd, K. (2017). Acute hunger modifies responses on the
Three Factor Eating Questionnaire hunger and disinhibition, but not restraint,
scales. Appetite, 110, 1-5.
185. Taylor, R. W., Jones, I. E., Williams, S. M., & Goulding, A. (2000). Evaluation of
waist circumference, waist-to-hip ratio, and the conicity index as screening tools for
high trunk fat mass, as measured by dual-energy X-ray absorptiometry, in children
aged 3–19 y–. The American journal of clinical nutrition, 72(2), 490-495.

122
186. Perisse, J., Sizaret, F., & Francois, P. (1969). The effect of income on the structure of
the diet. FAO Nutrition Newsletter, 7(3), 1-9.

Appendix 1
Parent Invitation Letter
Validation of a child version of the 21-item Three-Factor Eating Questionnaire
Dear Parent or Guardian,
We are inviting you to participate in a research study that will soon take place at your child’s school.
This study has been reviewed and approved by the Ottawa-Carleton Research and Evaluation Advisory
Committee and by the CHEO Research Ethics Board. The purpose of the study is to validate a new
child questionnaire on eating behavior. You are being invited to join this study because it will greatly
help scientists working in health research with pediatric populations to understand eating behaviors that
influence weight in children. We will invite children in the Ottawa region from the Ottawa-Carleton
District School Board and Ottawa Catholic School Board, to participate in this study.
Today, we visited your child’s classroom to explain what the study is about and we distributed this
envelope to all students. If you agree that your child takes part in this research, you need to sign
the consent form, and your child needs to sign the assent form. Then, your child must return
those 2 signed documents to their teacher by (insert date).
During the course of the study, your child will be asked to fill out 3 short questionnaires on eating
behavior and food preference, in their classroom. Height and weight will also be measured. The 3
questionnaires and the measurements will take about 30 minutes to complete, and a teacher will be
present during all data collection.
We appreciate your consideration for participating in our research study. You will find a more detailed
description of the study in the consent form. Please, feel free to contact the principal investigator (Dr.
Jean-Philippe Chaput, for any issues or questions
that might arise at any time during the course of the study.
Sincerely,
Dr. Jean-Philippe Chaput
Research Scientist, Children’s Hospital of Eastern Ontario Research Institute
Assistant Professor of Pediatrics, University of Ottawa
Healthy Active Living and Obesity Research Group, CHEO
Parent Invitation Letter Version date: 3-Oct-2016 Page 1 of 1
123

Appendix 2
Information Letter and Informed Consent Form
Protocol Title: Validation of a child version of the 21-item Three-Factor Eating
Questionnaire
Investigator: Dr. Jean-Philippe Chaput
Address: Healthy Active Living and Obesity Research Group, CHEO, 401 Smyth Road,
Ottawa, ON K1H 8L1.
Telephone Number: (613) 737-7600 Ext. 3683 Fax: (613) 738-4800
For more simplicity, the word “you”, when used in this form, means “yourself” or “your
child”.
You are being invited to join in a research study about the validation of a new child
questionnaire on eating behaviour. You are being invited to join this study because it will greatly
help scientists working in health research with paediatric populations. Before agreeing to take
part in this study, it is important that you read and understand this document.
Taking part in this study is voluntary. You are free to withdraw from the study at any time
and there will be no penalty to you or your child.
Why is this study being done?
This study is being done because many children and adolescents have excess weight in Canada.
Part of the solution to overcoming this obesity epidemic is understanding the eating behaviours
which determine an individual’s response to the food environment, which then influences their
body weight. One widely used tool to measure eating behaviours is the Three-Factor Eating
Questionnaire. However, this questionnaire has only been used and validated in adult
populations. We have recently developed a child version of this questionnaire and now would
like to validate it so that scientists can use it for their research.
How many people will participate?
We are recruiting 200 participants between the age of 8 and 15 for this study. The study will be
conducted in one single occasion and will take less than 30 minutes.
Consent Form Version date: 3-Oct-2016 Page 1 of 3
124

The data produced from this study will be stored in a locked filing cabinet. Only
members of the research team will have access to the data. Following completion of the
research study the data will be kept for 7 years after the last publication of this study.
They will then be destroyed.
You will not be identified in any publication or presentation of this study. A
copy of the signed consent form will be provided to you.
Is the research team benefiting from the study?
The research team members are not benefiting personally, financially or in some other way
from this study.
What if I have questions?
If you have any questions concerning participation in this study, you can contact the principal
investigator, Dr. Jean-Philippe Chaput, at .
This study has been reviewed and approved by the CHEO Research Ethics Board and by the
Ottawa- Carleton Research and Evaluation Advisory and the principle of the school. The
CHEO Research Ethics Board is a committee of the hospital that includes individuals from
different professional backgrounds. The Board reviews all human research that takes place at
the hospital. Its goal is to ensure the protection of the rights and welfare of people participating
in research. The Board’s work is not intended to replace a parent or child’s judgment about
what decisions and choices are best for them. You may contact the Chair of the Research
Ethics Board, for information
regarding patient’s rights in research studies at 613-737-7600 Ext. 3272, although this person
cannot provide any health-related information about the study. You may also contact the
Protocol Officer for Ethics in Research at the University of Ottawa. They are located at 550
Cumberland Street, Room 154, Ottawa, ON, K1N 6N5, and can also be reached by phone (613-
562-5387) or email ([email protected]).
Consent Form Version date: 3-Oct-2016 Page 2 of 3
125
Consent form Signatures
By signing this consent form I agree that:
I am voluntarily agreeing to participate in this research study;
I understand the information within this consent form;
All of the risks and benefits of participation have been explained to me;
All of my questions have been answered;
I do not give up my legal rights by signing this form.
Active consent is being sought and the form does not need to be returned
should you decline
Signature of Parent or
Legal Gaurdian
Name of Parent or
Legal Gaurdian
Date
Signature of
Participant
Name of Participant Date
Signature of Person
Obtaining Informed
Consent
Name of Person
Obtaining Informed
Consent
Date
Consent Form Version date: 3-Oct-2016 Page 3 of 3
126

Appendix 3
Assent Form
Protocol Title: Validation of a child version of the 21-item Three-Factor EatingQuestionnaire
Investigator: Dr. Jean-Philippe ChaputAddress: Healthy Active Living and Obesity Research Group, CHEO, 401 Smyth
Road, Ottawa, ON K1H 8L1.
Telephone Number: Fax:
Why is this study being done?We would like to invite you to be part of a research study. Research is a way to test newideas to see if we can do things better.
This study is going to test a new child questionnaire about eating behaviour. Yourparticipation will greatly help scientists finding better solutions for health problems.
Who will take part?We are recruiting 200 participants between the age of 8 and 15 for this study. The studywill be conducted in one single occasion and will take less than 30 minutes.
What will happen during the study?You will be asked to fill out 3 short questionnaires on eating behaviour and foodpreference. We will also measure your height and weight. You will be asked to consentto this measurement and you can always say no even though your parents agreed. Wewill visit your school for this study.
Are there good things that can happen from this study?Sometimes good things can happen to people when they are in a study. These goodthings are called “benefits.” This study will help us find better solutions for childrenstruggling with body weight issues. That is a benefit. There are no other benefits that wethink will happen to you if you decide to join this study.
Consent Form Version date: 3-Oct-2016 Page 1 of 2
127

Are there bad things that can happen from this study?We do not think that anything bad would happen if you decide to join this study.
Is this private?We will keep your information private whether you decide to join this study or not.
Can I say no?You can choose to be a part of this study or not. You can also decide to stop being inthis study at any time once you start. Talk to your parents if you want to stop being inthe study, and they will tell the researchers. No one will be mad at you if you choose notto take part.
What if I have questions?Please ask us and we will do anything we can to answer your questions.
Assent form SignaturesIf you agree to participate in this research study, please sign the form. I understand theinformation that was explained to me and I can ask any question that I like about thestudy.
Signature ofParticipant
Name of Participant Date
Consent Form Version date: 3-Oct-2016 Page 2 of 2
128

Appendix 4
October 2016
Participant Oral Debriefing Script
Validation of a child version of the 21-item Three-Factor Eating Questionnaire
Thank you for your time and participation in our study.
I would like to take a few minutes to tell you about the purpose of this study. The goal of this study
was to test a new child questionnaire about eating behaviour. Your participation will help scientists
find better solutions for health problems in children and find better solutions for children struggling
with body weight issues.
We would like to remind you that we will keep all your information private. Also, your participation in
the study has no impact on your school results. All the data that you provided is stored safely at the
Children’s Hospital of Eastern Ontario (CHEO) and will remain confidential.
The study was approved by the CHEO Research Ethics Board, the Ottawa-Carleton Research and
Evaluation Advisory Committee and the school Principal.
If you have any questions, please ask us. If you have any further questions about the study after
we leave, please talk to your parents and they contact the researchers.
Your participation was greatly appreciated and will help to improve the health of children.
Thank you.
Sincerely,
Dr. Jean-Philippe Chaput
Research Scientist, Children’s Hospital of Eastern Ontario Research Institute
Assistant Professor of Pediatrics, University of Ottawa
Healthy Active Living and Obesity Research Group, CHEO
Participant Debriefing Form Version date: 3-Oct-2016 Page 1 of 1
129

Appendix 5
Parent Debriefing Letter
October 2016
Dear parent,
We would like to thank you for your time and participation in our study. Our study had 3
main objectives. First, we aimed to assess eating behavior traits of children and adolescents
using the child version of the Three Factor Eating questionnaire to identify any patterns in
eating behavior profiles, which will enable an understanding of the behavior traits that drive
individuals to eat. Second, through the Leeds Food Preference task we aimed to determine
food preferences of children and adolescents to explore whether eating behavior traits are
associated with particular food preferences. Lastly, we aimed to determine if any
anthropometric measurements are associated with eating behavior profiles or food
preferences mentioned in the objectives above.
This study was conducted because many children and adolescents have excess weight in
Canada. In Canada, approximately 1 in 4 children are classified as overweight or obese. Part
of the solution to overcoming this obesity epidemic is understanding the eating behaviors
which determine an individual’s response to the food environment, which in turn influences
their body weight. The Three Factor Eating Questionnaire has shown utility in predicting
weight gain and weight loss in adult samples. We hope that the results of this study will be
helpful for scientists working with pediatric populations.
We would like to remind you that your child’s participation in the study has no impact on
his/her school results. All the data that you and your child provided is stored safely at the
Children’s Hospital of Eastern Ontario (CHEO) and will remain confidential.
The study was approved by the CHEO Research Ethics Board, the Ottawa-Carleton Research
and Evaluation Advisory Committee and the school Principal. If you have ethical concerns
related to the study, you can contact the Chair of the CHEO Research Ethics Board at 613-
737-7600 (ext. 3272).
Parent Debriefing Form Version date: 3-Oct-2016 Page 1 of 2
130

If you have any further questions about the study, please contact the principal investigator,
Dr. Jean-Philippe Chaput,
Sincerely,
Dr. Jean-Philippe Chaput
Research Scientist, Children’s Hospital of Eastern Ontario Research Institute
Assistant Professor of Pediatrics, University of Ottawa
Healthy Active Living and Obesity Research Group, CHEO
401 Smyth Road, Ottawa, ON K1H 8L1
Parent Debriefing Form Version date: 3-Oct-2016 Page 2 of 2
131

Appendix 6
Questionnaires
The 21-item Three-Factor Eating Questionnaire for Children (TFEQ-R21C)
1. I eat small portions of food
to help control my weight
Totally
true
Mostly true Mostly false Totally
false
2. I start to eat when I feel worried Totally
true
Mostly true Mostly false Totally
false
3. Sometimes when I start eating, it
seems I can’t stop
Totally
true
Mostly true Mostly false Totally
false
4. When I am sad, I usually eat too
much
Totally
true
Mostly true Mostly false Totally
false
5. I don’t eat some kinds of food
because they can make me fat
Totally
true
Mostly true Mostly false Totally
false
6. When I am next to someone who is
eating, I also feel like eating
Totally
true
Mostly true Mostly false Totally
false
7. When I feel angry, I need to eat Totally
true
Mostly true Mostly false Totally
false
8. I often get so hungry that I feel like I
could eat loads of food without
getting full
Totally
true
Mostly true Mostly false Totally
false
9. When I am hungry, I feel like to I
have to eat all of the food on my
plate in one go, without stopping
Totally
true
Mostly true Mostly false Totally
false
10. When I feel lonely, I make myself
feel better by eating
Totally
true
Mostly true Mostly false Totally
false
11. I eat less than I want at meal
times to stop myself putting on
weight
Totally
true
Mostly true Mostly false Totally
false
12. When I smell or see my favourite
food, I find it hard to stop myself
from eating it, even if I’ve just
finished a meal
Totally true
Mostly true Mostly false Totally false
13. I’m always hungry enough to eat
at any time
Totally
true
Mostly true Mostly false Totally
false
Quality Control Staff Initials: _________________Date: ______ / ________ /
Data Entry Staff Initials: _____________________Date: ______ / ________ /
Page 1 of 2
Participant ID: TFEQ – Technician Initials:
Date: Time:
132

401 Smyth Road, Ottawa, ON K1H 8L1 Telephone: (613) 737-7600 Ext. 3683|
Email: [email protected]
Quality Control Staff Initials: _________________Date: ______ / ________ /
Data Entry Staff Initials: _____________________Date: ______ / ________ /
Page 2 of 2
14. If I feel nervous, I try to calmmyself down by eating
Totallytrue
Mostly true Mostly false Totallyfalse
15. When I see something thatlooks delicious, I get so hungrythat I have to eat it right away
Totallytrue
Mostly true Mostly false Totallyfalse
16. When I feel really upset, I wantto eat
Totallytrue
Mostly true Mostly false Totallyfalse
17. How often do you avoideating or buying temptingfood?
Almostnever
Sometimes Usually Almostalways
18. How often would you eat lessthan you wanted to in ameal?
Almostnever
Sometimes Usually Almostalways
19. Do you eat lots of food evenwhen you are not hungry?
Never Not very often Sometimes At leastonce aweek
20. How often do you feel hungry? Only atmealtimes
Sometimesbetweenmeals
Oftenbetweenmeals
Almostalways
21. What type of eater are you ona scale of 1 to 8? Where 1means ‘I eat whatever I want,
whenever I want it’ and where
8 means ‘I am careful about
what I eat to control myweight’.
1 2 3 4 5 6 7 8
Participant ID: TFEQ – Technician Initials:
Date: Time:
133

401 Smyth Road, Ottawa, ON K1H 8L1 Telephone: (613) 737-7600 Ext. 3683|
Email: [email protected]
Children’s Power of Food Scale (C-PFS)
Quality Control Staff Initials: _________________Date: ______ / ________ /
Data Entry Staff Initials: _____________________Date: ______ / ________ /
Page 1 of 2
Read each sentence below. Check the box to
the right to tell us how much you agree with
the sentence.
I don’t
agree
at all
I agree
a little
I agree
somewhat
I strongly
agree
1. I think about food even when I’m not truly
hungry.
I don’t
agree
at all
I agree
a little
I agree
somewhat
I strongly
agree
2. When I’m near delicious foods but I have to
wait to eat them, it is very difficult for me to
wait.
I don’t
agree
at all
I agree
a little
I agree
somewhat
I strongly
agree
3. I get more pleasure from eating than I do from
almost anything else.
I don’t
agree
at all
I agree
a little
I agree
somewhat
I strongly
agree
4. If I see or smell a food I like, I get a very strong
desire to have some.
I don’t
agree
at all
I agree
a little
I agree
somewhat
I strongly
agree
5. When I’m around a fattening food I love, it’s
hard to stop myself from at least tasting it.
I don’t
agree
at all
I agree
a little
I agree
somewhat
I strongly
agree
6. I often think about what foods I might eat later
in the day.
I don’t
agree
at all
I agree
a little
I agree
somewhat
I strongly
agree
7. When I taste a favourite food, I feel great
pleasure.
I don’t
agree
at all
I agree
a little
I agree
somewhat
I strongly
agree
8. When I know a delicious food is available, I
keep thinking about having some.
I don’t
agree
at all
I agree
a little
I agree
somewhat
I strongly
agree
9. I love the taste of certain foods so much that
I can’t avoid eating them even if they’re bad for
me.
I don’t
agree
at all
I agree
a little
I agree
somewhat
I strongly
agree
10. When I see delicious foods in advertisements or
commercials, it makes me want to eat.
I don’t
agree
at all
I agree
a little
I agree
somewhat
I strongly
agree
Participant ID: TFEQ – Technician Initials:
Date: Time:
134

Questionnaires
Quality Control Staff Initials: _________________Date: ______ / ________ /
Data Entry Staff Initials: _____________________Date: ______ / ________ /
Page 2 of 2
11. I feel like food controls meinstead of me controlling myfood choices.
I don’t agreeat all
I agreea little
I agreesomewhat
I stronglyagree
12. Just before I taste a favouritefood, I get very excited.
I don’t agreeat all
I agreea little
I agreesomewhat
I stronglyagree
13. When I eat delicious food Ifocus a lot on how good it tastes.
I don’t agreeat all
I agreea little
I agreesomewhat
I stronglyagree
14. Sometimes, when I’m doingeveryday activities, I get an urge toeat “out of the blue” (for no goodreason).
I don’t agreeat all
I agreea little
I agreesomewhat
I stronglyagree
15. I think I enjoy eating a lot morethan most other kids.
I don’t agreeat all
I agreea little
I agreesomewhat
I stronglyagree
16. Hearing someone describe agreat meal makes me really want tohave something to eat.
I don’t agreeat all
I agreea little
I agreesomewhat
I stronglyagree
17. It seems like I have food on mymind a lot.
I don’t agreeat all
I agreea little
I agreesomewhat
I stronglyagree
18. It’s very important to me that thefoods I eat are as delicious aspossible.
I don’t agreeat all
I agreea little
I agreesomewhat
I stronglyagree
19. Before I eat a favourite food mymouth waters.
I don’t agreeat all
I agreea little
I agreesomewhat
I stronglyagree
Participant ID: TFEQ – Technician Initials:
Date: Time:
135

401 Smyth Road, Ottawa, ON K1H 8L1 Telephone: (613) 737-7600 Ext. 3683|
Leeds Food Preference Questionnaire
Examine each individual item in turn to make your assessment. If you would like to eat it at
this moment place a tick in the box next to it. If not, go on to the next. Consider each item
independently from the others. Do not spend a long time on any item.
Non-Branded Food Items
A grilled chicken breast
A scone
A large chocolate bar (any flavour)
A medium sized peach
A baked potato with butter
A small dish of fried vegetables
A medium size grilled fish fillet
2 average size tomatoes
A grilled porkchop
A small slice of cheesecake
A small green salad
White or whole wheat bun
2 slices of smoked meat
4 small cookies
A medium size corn dog (pogo)
A dish of fresh strawberries
Quality Control Staff Initials: _________________Date: ______ / ________ /
Data Entry Staff Initials: _____________________Date: ______ / ________ /
Page 1 of 2
Participant ID: TFEQ – Technician Initials:
Date: Time:
136

401 Smyth Road, Ottawa, ON K1H 8L1 Telephone: (613) 737-7600 Ext. 3683|
Non-Branded Food Items
Half a cup of tuna from a can
2 pickles
A small slice of cake
2 pieces of bacon
2 pancakes
A medium sized dish of baked beans
A small container of plain yoghurt
1.5 small package of potato chips (any flavor)
A dish of shrimp
A dish of canned fruit salad
A wedge of cheddar cheese
A small grilled piece of steak
2 sticks of celery
A cream filled donut
A medium size bowl of rice
A small slice of melon
Quality Control Staff Initials: _________________Date: ______ / ________ /
Data Entry Staff Initials: _____________________Date: ______ / ________ /
Page 2 of 2
Participant ID: TFEQ – Technician Initials:
Date: Time:
137

01 Smyth Road, Ottawa, ON K1H 8L1 Telephone: (613) 737-7600 Ext. 3683|
Anthropometry Form
Date of birth _______ / _________/ _______________________ Age _____ years
D A Y M O N T H Y E A R
Sex
Male
Female
Standing Height
1. ________________cm
2. ________________cm
3. ________________cm
Weight
4. ________________kg
5. ________________kg
6. ________________kg
Participant ID: TFEQ – Technician Initials:
Date: Time:
138

Appendix 7
139
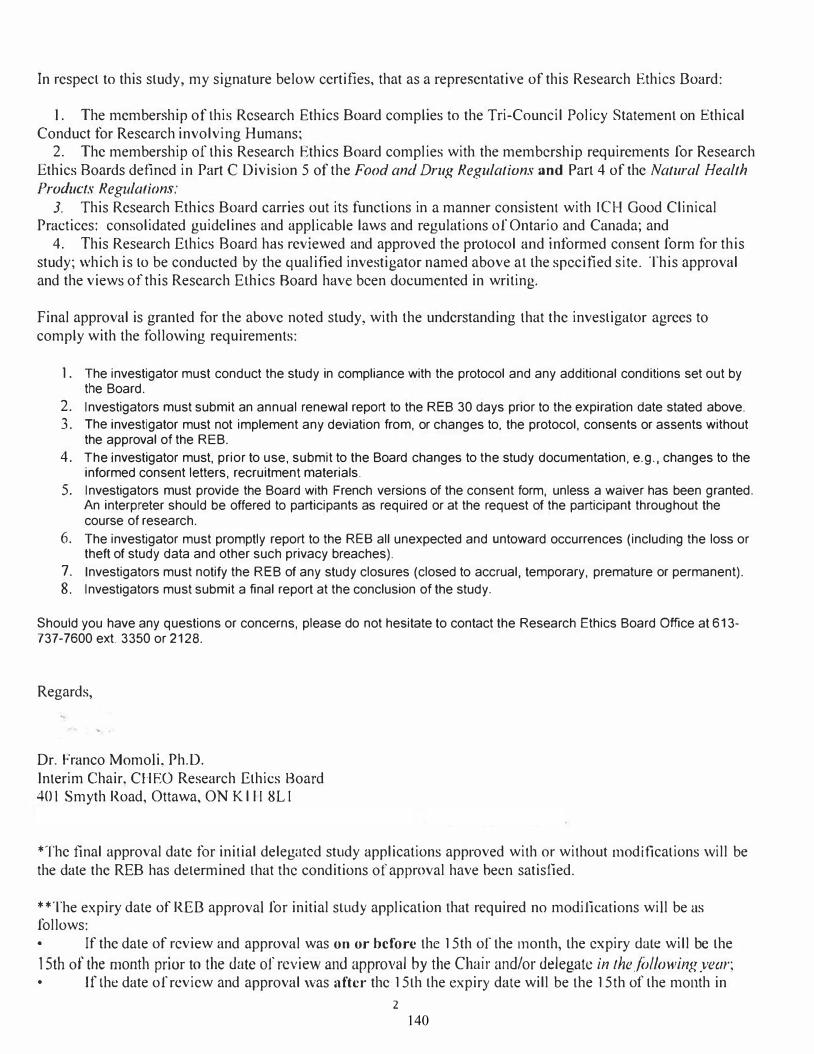
In respect to this study, my signature below certifies, that as a representative of this Research Ethics Board:
I . The membership of this Research Ethics Board complies to the Tri-Council Policy Statement on Ethical Conduct for Research involving Humans;
2. The membership of this Research Ethics Board complies with the membership requirements for ResearchEthics Boards defined in Part C Division 5 of the Food and Drug Regulations and Part 4 of the Natural Health Products Regulations:
J. This Research Ethics Board carries out its functions in a manner consistent with ICH Good ClinicalPractices: consolidated guidelines and applicable laws and regulations of Ontario and Canada; and
4. This Research Ethics Board has reviewed and approved the protocol and informed consent form for thisstudy; which is to be conducted by the qualified investigator named above at the specified site. This approval and the views of this Research Ethics Hoard have been documented in writing.
Final approval is granted for the above noted study, with the understanding that the investigator agrees to comply with the following requirements:
1. The investigator must conduct the study in compliance with the protocol and any additional conditions set out bythe Board.
2. Investigators must submit an annual renewal report to the REB 30 days prior to the expiration date stated above.
3. The investigator must not implement any deviation from, or changes to. the protocol, consents or assents withoutthe approval of the REB.
4. The investigator must, prior to use, submit to the Board changes to the study documentation, e.g., changes to theinformed consent letters, recruitment materials.
5. Investigators must provide the Board with French versions of the consent form, unless a waiver has been granted.An interpreter should be offered to participants as required or at the request of the participant throughout thecourse of research.
6. The investigator must promptly report to the RES all unexpected and untoward occurrences (including the loss ortheft of study data and other such privacy breaches).
7. Investigators must notify the REB of any study closures (closed to accrual, temporary, premature or permanent).
8. Investigators must submit a final report at the conclusion of the study.
Should you have any questions or concerns, please do not hesitate to contact the Research Ethics Board Office at 613-737-7600 ext. 3350 or 2128.
Regards,
Dr. Franco Momoli, Ph.D. Interim Chair. CHEO Research Ethics Hoard 401 Smyth Road, Ottawa, ON Kl 11 8LI
*The final approval date for initial delegated study applications approved with or without modifications will bethe date the REB has determined that the conditions of approval have been satisfied.
**The expiry date of REB approval for initial study application that required no modifications will be as follows: • ff the date of review and approval was on or before the 15th of the month, the expiry dale will be the15th of the month prior to the date of review and approval by the Chair and/or delegate in the./i>llowing year;• If the date of review and approval was after the 15th the expiry dale will be the 15th of the month in
2
140

which the date of review and approval by the REB in the j(Jl!owing year.
The expiry date of REB approval for initial study applications that require modifications will be as follows: • If the initial feedback was sent on or before the 15th of the month, the expiry date will be the 15th ofthe month prior to the date the letter of REB feedback is issued to the investigator(s) in I he following year;• If the initial feedback was sent after the 15th the expiry date wi II be the 15th of the month in which thefeedback was sent in the following year.
3
141

Appendix 8
142

Appendix 10
Adapted three-factor model of the Child version of the Four-Factor Eating Questionnaire.
The data can be fit into a three-factor model to allow for comparison with the original TFEQ-R21
C (19) currently used to assess eating behaviour in adults. The three-factor structure can be achieved
by merging the items from the previously mentioned UE 1 and UE 2 scales as the original
questionnaire suggests (19), and removing item 17, as it was previously identified to be problematic
due to the negative non-significant loading on all factors. The UE 2 scale also had a low internal
reliability (α= 0.69). This version of the questionnaire would be titled the Child Version of the 20-
item Three-Factor Eating Questionnaire (TFEQ-R20 C).
The data met the assumptions for exploratory factor analysis. The Kaiser-Meyer-Olkin
measure of sampling adequacy index (KMO= 0.76) and Barlett’s test of sphericity (X2= 749.45
p<0.001) were significant, indicating that there was a sufficient proportion of variance within the
sample and the items were sufficiently correlated for factor analysis. Table S1 presents the results
from the maximum likelihood, exploratory factor analysis with oblique (direct oblimin) rotation,
with a three-factor restriction and item 17 removed from the TFEQ-R21 C questionnaire. The test
produced 3 factors, accounting for 38.02 % of the variance. All items with the exception of item 6
loaded significantly on only one factor.
Table S1. Rotated factor structure loading of the 20-item Child version of the Three-Factor Eating
Questionnaire (TFEQ-R20 C) with a three-factor restriction model.
Questionnaire Items Factor 1 Factor 2 Factor 3 h2
1. I eat small portions of food to control my weight .008 .643 -.056 .435
2. I start to eat when I feel worried .024 -.052 -.519 .269
3. Sometimes when I start eating, it seems I can’t stop .570 .158 .076 .309
4. When I am sad, I usually eat too much -.030 .014 -.553 .298
143
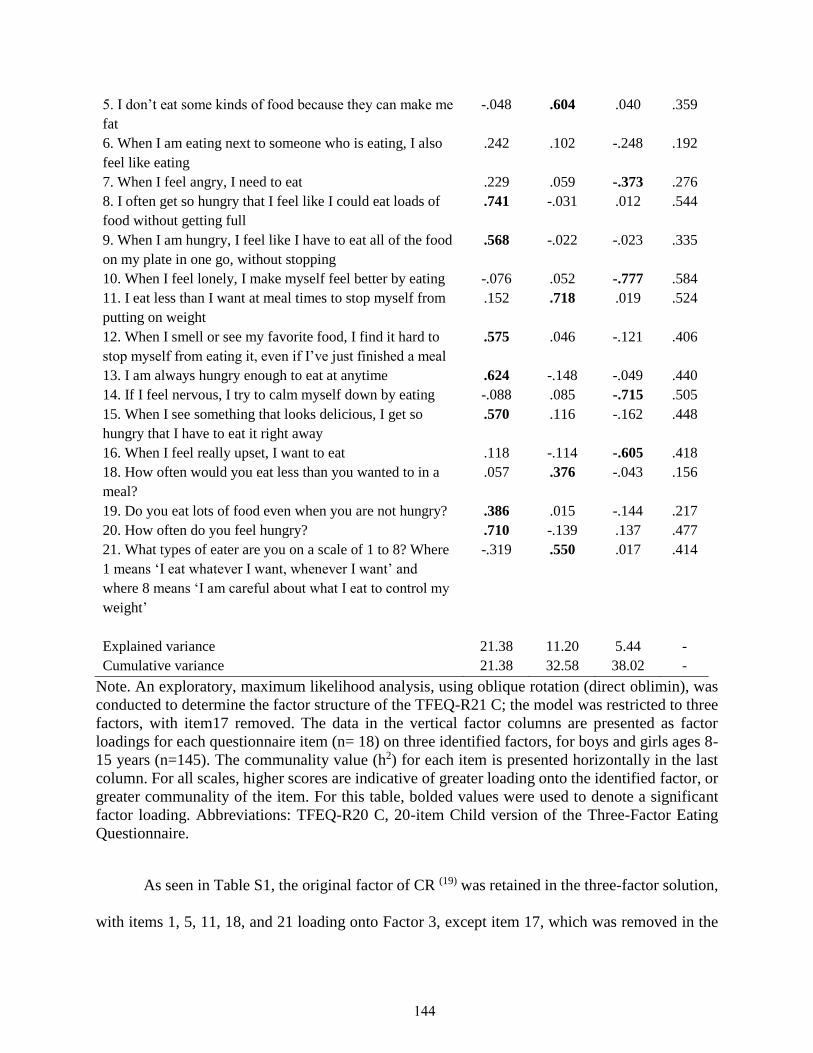
5. I don’t eat some kinds of food because they can make me
fat
-.048 .604 .040 .359
6. When I am eating next to someone who is eating, I also
feel like eating
.242 .102 -.248 .192
7. When I feel angry, I need to eat .229 .059 -.373 .276
8. I often get so hungry that I feel like I could eat loads of
food without getting full
.741 -.031 .012 .544
9. When I am hungry, I feel like I have to eat all of the food
on my plate in one go, without stopping
.568 -.022 -.023 .335
10. When I feel lonely, I make myself feel better by eating -.076 .052 -.777 .584
11. I eat less than I want at meal times to stop myself from
putting on weight
.152 .718 .019 .524
12. When I smell or see my favorite food, I find it hard to
stop myself from eating it, even if I’ve just finished a meal
.575 .046 -.121 .406
13. I am always hungry enough to eat at anytime .624 -.148 -.049 .440
14. If I feel nervous, I try to calm myself down by eating -.088 .085 -.715 .505
15. When I see something that looks delicious, I get so
hungry that I have to eat it right away
.570 .116 -.162 .448
16. When I feel really upset, I want to eat .118 -.114 -.605 .418
18. How often would you eat less than you wanted to in a
meal?
.057 .376 -.043 .156
19. Do you eat lots of food even when you are not hungry? .386 .015 -.144 .217
20. How often do you feel hungry? .710 -.139 .137 .477
21. What types of eater are you on a scale of 1 to 8? Where
1 means ‘I eat whatever I want, whenever I want’ and
where 8 means ‘I am careful about what I eat to control my
weight’
-.319 .550 .017 .414
Explained variance 21.38 11.20 5.44 -
Cumulative variance 21.38 32.58 38.02 -
Note. An exploratory, maximum likelihood analysis, using oblique rotation (direct oblimin), was
conducted to determine the factor structure of the TFEQ-R21 C; the model was restricted to three
factors, with item17 removed. The data in the vertical factor columns are presented as factor
loadings for each questionnaire item (n= 18) on three identified factors, for boys and girls ages 8-
15 years (n=145). The communality value (h2) for each item is presented horizontally in the last
column. For all scales, higher scores are indicative of greater loading onto the identified factor, or
greater communality of the item. For this table, bolded values were used to denote a significant
factor loading. Abbreviations: TFEQ-R20 C, 20-item Child version of the Three-Factor Eating
Questionnaire.
As seen in Table S1, the original factor of CR (19) was retained in the three-factor solution,
with items 1, 5, 11, 18, and 21 loading onto Factor 3, except item 17, which was removed in the
144

previous analysis. The original factor of UE (19) was also retained, with items 3, 8, 9, 12, 13, 15,
19, and 20 loading on Factor 1, with the exception of item 6, which is recommended to be removed
in further analysis. The factor of EE was retained as in the original TFEQ-R 21 (19), with items 2,
4, 7, 10, 14, and 16 loading onto Factor 2.
The item analysis also revealed that all the factors had adequate to good inter-item
correlations for CR (r=0.12-0.50) and EE (r=0.24-0.62), showing that the items within each scale
correlated with one another. The factor of UE showed good inter-item correlations (r=0.23-0.57),
with the exception of item 6, which did not correlate well with the other items (r=0.04-0.40). The
corrected item-total correlations were good (CR (r=0.30-0.50), EE (r=0.43-0.60), and UE (r=0.33-
0.64)), with items correlating most strongly with their respective factors, supporting item-
discriminant and convergent validity. The item-total correlations indicated that all 20 items
correlated more strongly with the scores for the construct with which they were associated.
Furthermore, the correlations between factors 1, 2 and 3 did not exceed 0.70 (r= -0.66-0.69), with
the exception of factors 1 and 4 (r=0.58-0.92). Additionally, the strongest correlation of each item
was found with the scale assigned, meeting the criteria for item-discriminant validity (UE: r=0.57–
0.69; CR: r=0.55–0.72; EE: r=0.59–0.76).
Overall, the 20-item, four-factor model of the questionnaire (FFEQ-R20 C) accounted for
41.2% of the variance in the data, had a good internal reliability (α=0.81), and the division of UE
into UE 1 and UE 2 was conceptually sound based on theory (116; 117); therefore, this model was
considered for further analysis. All subsequent analyses were conducted using the FFEQ-R20
model of the questionnaire.
145

Relationship between FFEQ-R20 C factors, and food and taste preferences
Table S2 presents the Pearson Product Moment correlation coefficients and significance values of
the relationship between the FFEQ-R20 C, and food and taste preferences, by sex (boys and girls)
and age group (8-11 years and 12-15 years).
High protein food preference. Partial correlations controlling for BMI z-score showed that
UE 1 (r=0.28, p=0.001) and UE 2 (r=0.28, p=0.001) were positively related to preference for high
protein foods, whereas CR (r=-0.19, p= 0.022) was negatively related to preference for high protein
foods, for boys and girls. Partial correlations controlling for sex and BMI showed that the
relationship between UE 1, UE 2, and CR, with preference for high protein foods was only
significant in younger children (see Table S2). No significant correlations between EE and high
protein preference were found.
High carbohydrate food preference. Partial correlations controlling for BMI z-score
showed that UE 2 was positively related to preference for high carbohydrate foods (r=0.24,
p=0.003) and CR was negatively related to preference for high carbohydrate foods (r= -0.27,
p=0.001), in boys and girls. Partial correlations controlling for sex and BMI showed that the
relationship between UE 2 and preference for high carbohydrate foods was only significant for
younger children, whereas the relationship between CR and preference for high carbohydrate foods
was only found to be significant in older children. No significant correlations between EE and high
carbohydrate preference were found (see Table S2).
High fat food preference. Partial correlations controlling for BMI z-score showed that UE
1 (r=0.33, p<0.001) and UE 2 (r=0.26, p= 0.002) were positively related to preference for high-fat
foods, whereas CR was negatively related to preference for high-fat foods (r= -0.29, p<0.001), in
boys and girls. A relationship between UE 2 and preference for high-fat foods was only found in
146

boys, whereas a relationship between CR and preference for high-fat foods was only found in girls.
The relationship between UE 2 and preference for high-fat foods was only found to be significant
in younger children (r=0.29, p= 0.006). No significant correlations between EE and high-fat
preference were found (see Table S2).
Low energy food preference. Partial correlations controlling for sex and BMI showed that
the relationship between CR and preference for low energy foods was only significant for older
children (r= -0.28, p=0.037). No significant correlations between UE 1, UE 2, CR and preference
for low energy foods were found (see Table S2).
High fat savoury preference. Partial correlations controlling for BMI z-score revealed that
UE 1 (r=0.31, p<0.001) and UE 2 (r=0.25, p=0.003) were positively related to preference for
HFSA foods, whereas CR (r= -0.29, p<0.001) was negatively related to preference for HFSA
foods, in boys and girls. No significant correlations were observed between EE and preference for
HFSA foods (see Table S2).
High fat sweet preference. Partial correlations controlling for BMI z-score showed that
UE 1 (r=0.25, p=0.001) and UE 2 (r=0.25, p=0.002) were positively related to preference for
HFSW foods, and CR (r= -0.24, p=0.003) was negatively related to preference for HFSW foods.
Partial correlations controlling for sex and BMI showed that the relationship between UE 1, UE 2
and preference for HFSW foods was only significant in boys. A negative relationship between CR
and preference for HFSW foods was found only in girls. A relationship between the domains of
UE 2 and EE, and preference for HFSW food was only found to be significant in younger children
(see Table S2).
Low fat savoury preference. Partial correlations controlling for BMI z-score showed no
relationship between FFEQ-R20 C and preference for LFSA foods. Partial correlations controlling
147

for sex and BMI revealed a relationship between CR and preference for LFSA foods in girls only
(r= -0.23, p=0.030). Partial correlations controlling for sex and BMI showed that the relationship
between CR and preference for LFSA foods was only significant in older children. A relationship
between UE 2 and preference for LFSA foods was observed in younger children. No significant
correlations between EE and LFSA preference were found (see Table S2).
Low fat sweet preference. Partial correlations controlling for sex and BMI revealed a
positive relationship between CR and preference for LFSW foods (r=0.24, p=0.027) in younger
children. No significant correlations between UE 1, UE 2 and EE and preference for LFSW foods
were found (see Table S2).
148

Table S2. Pearson Product Moment correlations coefficients and significance values for the relationship between Four-Factor Eating
Questionnaire C (FFEQ-R20 C) and food and taste preferences, by sex and age groups.
Note. Data are presented as Pearson Product Moment correlation coefficients, denoted by the symbol [r], and significance, denoted by
the symbol [p]. Partial Pearson Product moment correlations, controlling for BMI z-score, were used to determine the relationship
between the FFEQ-R20 C and food and taste preferences (n=145); denoted by Total in the table. Partial correlations controlling for age
and BMI, and sex and BMI, were used to examine the relationship between the FFEQ-R20 C factors and food preferences by sex (boys
CR UE 1 UE 2 EE
Boys Girls 8-11
years
12-15
years
Total Boys Girls 8-11
years
12-15
years
Total Boys Girls 8-11
years
12-15
years
Total Boys Girls 8-11
years
12-15
years
Total
HPP
r
p
-0.87
0.524
-0.26*
0.016
-0.25*
0.023
-0.10
0.476
-0.19*
0.022
0.34*
0.011
0.25*
0.019
0.32*
0.003
0.16
0.232
0.28*
0.001
0.39*
0.003
0.29*
0.006
0.37*
<0.001
0.25
0.058
0.28*
0.001
0.25
0.062
0.06
0.567
0.14
0.204
0.17
0.215
0.13
0.109
HCP
r
p
0.35*
0.007
-0.40*
0.016
-0.21
0.057
0.38*
0.006
-0.27*
0.001
0.16
0.231
0.19
0.076
0.17
0.109
0.15
0.268
0.15
0.073
0.36
0.007
0.17
0.109
0.38*
<0.001
0.07
0.609
0.24*
0.003
0.13
0.346
-0.01
0.962
0.19
0.086
-0.15
0.261
0.02
0.827
HFP
r
p
-0.60
0.662
-0.45*
<0.001
-0.28*
0.009
-0.34*
0.009
-0.29*
<0.001
0.34*
0.011
0.31*
0.004
0.30*
0.005
0.38*
0.004
0.33*
<0.001
0.39*
0.003
0.17
0.123
0.29*
0.006
0.22
0.099
0.26*
0.002
0.22
0.102
0.02
0.843
0.19
0.080
-0.02
0.890
0.11
0.198
LEP
r
p
0.15
0.262
-0.04
0.699
0.18
0.107
-0.28*
0.037
-0.02
0.818
0.03
0.822
-0.09
0.397
-0.01
0.933
-0.13
0.335
-0.56
0.501
0.15
0.262
0.01
0.949
-0.01
0.951
0.02
0.863
-0.22
0.794
-0.05
0.732
-0.01
0.949
0.02
0.893
-0.11
0.400
-0.47
0.575
HFSA
r
p
-0.41*
<0.001
-0.41**
<0.001
-0.33*
0.002
-0.30*
0.026
-0.29*
<0.001
0.28*
0.008
0.31*
<0.001
0.30*
0.005
0.27*
0.042
0.31*
<0.001
0.25*
0.019
0.25**
0.019
0.31*
0.004
0.25*
0.060
0.25*
0.003
0.19
0.162
0.02
0.876
0.11
0.301
0.04
0.749
0.09
0.276
HFSW
r
p
-0.11
0.421
-0.37**
<0.001
-0.24*
0.027
-0.30*
0.025
-0.24*
0.003
0.38*
0.004
0.17
0.111
0.27*
0.013
0.29*
0.028
0.25*
0.001
0.50*
<0.001
0.04
0.739
0.28*
0.010
0.21
0.113
0.25*
0.002
0.23
0.095
0.02
0.888
0.25*
0.023
-0.05
0.718
0.11
0.192
LFSA
r
p
0.17
0.205
-0.23*
0.030
-0.32
0.773
-0.28*
0.034
-0.16
0.057
0.19
0.151
0.13
0.215
0.19
0.087
0.04
0.782
0.11
0.188
0.21
0.124
0.15
0.179
0.27*
0.011
-0.001
0.997
0.14
0.097
0.19
0.169
0.03
0.807
0.16
0.154
-0.03
0.829
0.05
0.570
LFSW
r
p
0.16
0.233
0.08
0.456
0.24*
0.027
-0.17
0.195
0.07
0.436
0.05
0.707
-0.12
0.270
-0.03
0.811
-0.12
0.195
-0.06
0.459
0.09
0.508
0.001
0.996
0.03
0.806
0.06
0.647
0.02
0.844
0.01
0.948
-0.06
0.560
-0.011
0.917
-0.07
0.586
-0.05
0.569
140140140
149

and girls), and age group (8-11 years and 12-15 years) respectively. A higher correlation coefficient value denotes a greater linear
relationship (negative or positive). Degrees of freedom: Boys= 54, Girls=83, 8-11 years= 82, 12-15 years= 55, Total= 143. Correlation
coefficient was significant at the level of p<0.05. Correlation coefficients that were statistically significant are identified by this symbol
[*]. Abbreviations: FFEQ-R20 C, 20-item Child Version of the Four-Factor Eating Questionnaire; CR, Cognitive Restraint; UE 1,
Uncontrolled Eating 1; UE 1, Uncontrolled Eating 2; EE, Emotional Eating; HPP, High Protein Preference; HCP, High Carbohydrate
Preference; HFP, High Fat Preference; LEP, Low Energy Preference; High Fat Savoury, HFSA; High Fat Sweet, HFSW; Low Fat
Savoury, LFSA; Low Fat Sweet, LFSW.
150
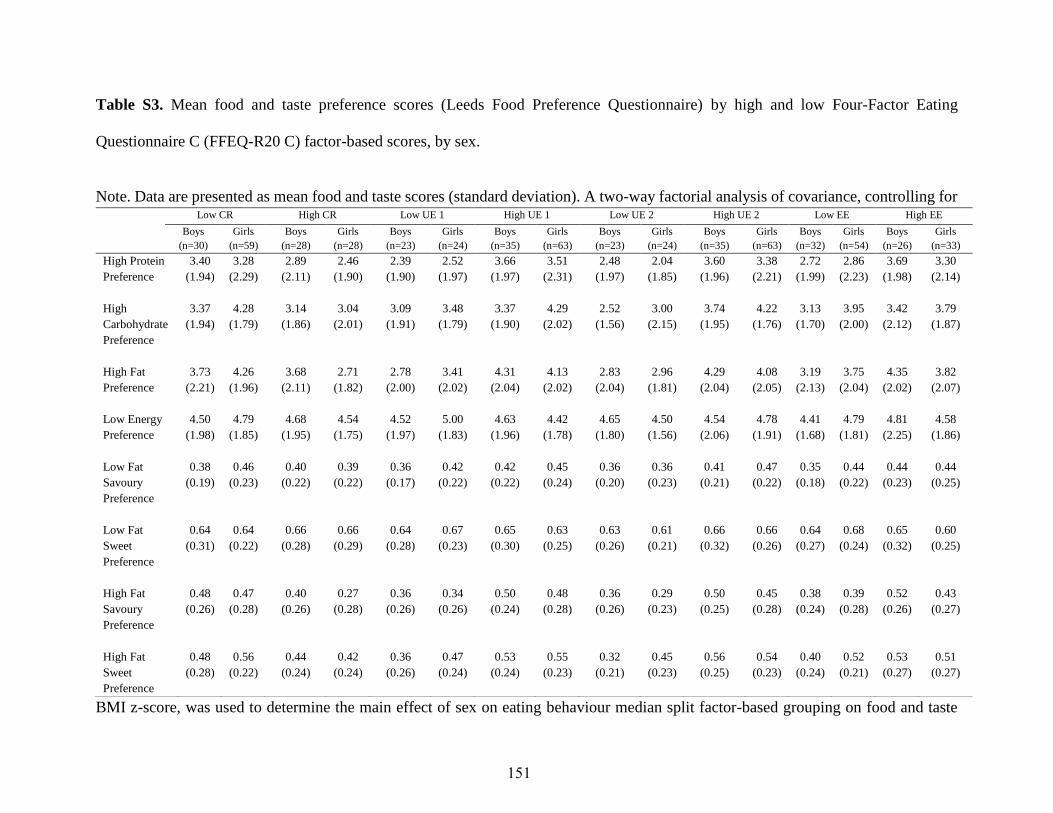
Table S3. Mean food and taste preference scores (Leeds Food Preference Questionnaire) by high and low Four-Factor Eating
Questionnaire C (FFEQ-R20 C) factor-based scores, by sex.
Note. Data are presented as mean food and taste scores (standard deviation). A two-way factorial analysis of covariance, controlling for
BMI z-score, was used to determine the main effect of sex on eating behaviour median split factor-based grouping on food and taste
Low CR High CR Low UE 1 High UE 1 Low UE 2 High UE 2 Low EE High EE
Boys
(n=30)
Girls
(n=59)
Boys
(n=28)
Girls
(n=28)
Boys
(n=23)
Girls
(n=24)
Boys
(n=35)
Girls
(n=63)
Boys
(n=23)
Girls
(n=24)
Boys
(n=35)
Girls
(n=63)
Boys
(n=32)
Girls
(n=54)
Boys
(n=26)
Girls
(n=33)
High Protein
Preference
3.40
(1.94)
3.28
(2.29)
2.89
(2.11)
2.46
(1.90)
2.39
(1.90)
2.52
(1.97)
3.66
(1.97)
3.51
(2.31)
2.48
(1.97)
2.04
(1.85)
3.60
(1.96)
3.38
(2.21)
2.72
(1.99)
2.86
(2.23)
3.69
(1.98)
3.30
(2.14)
High
Carbohydrate
Preference
3.37
(1.94)
4.28
(1.79)
3.14
(1.86)
3.04
(2.01)
3.09
(1.91)
3.48
(1.79)
3.37
(1.90)
4.29
(2.02)
2.52
(1.56)
3.00
(2.15)
3.74
(1.95)
4.22
(1.76)
3.13
(1.70)
3.95
(2.00)
3.42
(2.12)
3.79
(1.87)
High Fat
Preference
3.73
(2.21)
4.26
(1.96)
3.68
(2.11)
2.71
(1.82)
2.78
(2.00)
3.41
(2.02)
4.31
(2.04)
4.13
(2.02)
2.83
(2.04)
2.96
(1.81)
4.29
(2.04)
4.08
(2.05)
3.19
(2.13)
3.75
(2.04)
4.35
(2.02)
3.82
(2.07)
Low Energy
Preference
4.50
(1.98)
4.79
(1.85)
4.68
(1.95)
4.54
(1.75)
4.52
(1.97)
5.00
(1.83)
4.63
(1.96)
4.42
(1.78)
4.65
(1.80)
4.50
(1.56)
4.54
(2.06)
4.78
(1.91)
4.41
(1.68)
4.79
(1.81)
4.81
(2.25)
4.58
(1.86)
Low Fat
Savoury
Preference
0.38
(0.19)
0.46
(0.23)
0.40
(0.22)
0.39
(0.22)
0.36
(0.17)
0.42
(0.22)
0.42
(0.22)
0.45
(0.24)
0.36
(0.20)
0.36
(0.23)
0.41
(0.21)
0.47
(0.22)
0.35
(0.18)
0.44
(0.22)
0.44
(0.23)
0.44
(0.25)
Low Fat
Sweet
Preference
0.64
(0.31)
0.64
(0.22)
0.66
(0.28)
0.66
(0.29)
0.64
(0.28)
0.67
(0.23)
0.65
(0.30)
0.63
(0.25)
0.63
(0.26)
0.61
(0.21)
0.66
(0.32)
0.66
(0.26)
0.64
(0.27)
0.68
(0.24)
0.65
(0.32)
0.60
(0.25)
High Fat
Savoury
Preference
0.48
(0.26)
0.47
(0.28)
0.40
(0.26)
0.27
(0.28)
0.36
(0.26)
0.34
(0.26)
0.50
(0.24)
0.48
(0.28)
0.36
(0.26)
0.29
(0.23)
0.50
(0.25)
0.45
(0.28)
0.38
(0.24)
0.39
(0.28)
0.52
(0.26)
0.43
(0.27)
High Fat
Sweet
Preference
0.48
(0.28)
0.56
(0.22)
0.44
(0.24)
0.42
(0.24)
0.36
(0.26)
0.47
(0.24)
0.53
(0.24)
0.55
(0.23)
0.32
(0.21)
0.45
(0.23)
0.56
(0.25)
0.54
(0.23)
0.40
(0.24)
0.52
(0.21)
0.53
(0.27)
0.51
(0.27)
151

preferences. Abbreviations: FFEQ-R20 C, 20-item Child Version of the Four-Factor Eating Questionnaire; CR, Cognitive Restraint; UE
1, Uncontrolled Eating 1; UE 1, Uncontrolled Eating 2; EE, Emotional Eating. No differences were found between boys and girls of
low and high factor median split factor-based grouping on food and taste preferences.
152