Embed Size (px)
Citation preview
Nutrition, Metabolism & Cardiovascular Diseases (2015) 25, 771e779
Available online at www.sciencedirect.com
Nutrition, Metabolism & Cardiovascular Diseases
journal homepage: www.e lsev ie r .com/ locate/nmcd
Validation of diet and urinary excretion derived estimates of sodiumexcretion against 24-h urine excretion in a worksite sample
C. Kelly*, F. Geaney, A.P. Fitzgerald, G.M. Browne, I.J. PerryDepartment of Epidemiology and Public Health, University College Cork, Ireland
Received 23 December 2014; received in revised form 29 April 2015; accepted 30 April 2015Available online 10 May 2015
KEYWORDSDietary sodium;Urinary sodium;24-h dietary recall;24-h urine collection;Spot urine
* Corresponding author. DepartmentHealth, University College Cork, 4th FloWestern Road, Cork, Ireland. Tel.: þ353
E-mail addresses: [email protected] (C. [email protected] (A.P. Fitzgerald), [email protected] (I.J. Perry).
http://dx.doi.org/10.1016/j.numecd.2015.04.0100939-4753/ª 2015 Elsevier B.V. All rights rese
Abstract Background and aims: To validate diet and urinary excretion derived estimates of so-dium intake against those derived from 24-h urine collections in an Irish manufacturing work-place sample.Methods and results: We have compared daily sodium (Na) excretion from PABA validated 24-h urine collections with estimated daily sodium excretion derived from the following methods:a standard Food Frequency Questionnaire (FFQ), a modified 24-h dietary recall method, arith-metic extrapolations from morning and evening spot urine samples, predicted sodium excretionfrommorning and evening spot urine samples using Tanaka’s, Kawasaki’s and the INTERSALT for-mula. All were assessed using mean differences (SD), BlandeAltman plots, correlation coeffi-cients and ROC Area under the Curve (AUC) for a cut off of �100 mmol of Na/day. The FoodChoice at Work study recruited 802 participants aged 18e64 years, 50 of whom formed the vali-dation sample. The mean measured 24-h urinary sodium (gold standard) was 138 mmol/day(8.1 g salt). At the group level, mean differences were small for both dietary methods and forthe arithmetic extrapolations from morning urine samples. The Tanaka, Kawasaki and INTERSALTmethods provided biased estimates of 24-h urinary sodium. R2 values for all methods rangedfrom 0.1 to 0.48 and AUC findings from 0.57 to 0.76.Conclusion: Neither dietary nor spot urine sample methods provide adequate validity in the esti-mation of 24-h urinary sodium at the individual level. However, group mean errors from dietarymethods are small and random and compare favourably with those from spot urine samples inthis population.ª 2015 Elsevier B.V. All rights reserved.
Introduction
Hypertension is a leading cause of ‘death, stroke,myocardial infarction, congestive heart failure and chronicrenal impairment’ and affects 1 billion people worldwide
of Epidemiology and Publicor, Western Gateway Building,(0)21 4205530.ly), [email protected] (F. Geaney),[email protected] (G.M. Browne),
rved.
[1]. Observational and experimental research has providedsubstantial evidence that excess dietary salt intake is acasual factor for hypertension [2]. Irish and UK authoritieshave set an upper limit for recommended salt intake of 6 gper day while the World Health Organisation (WHO)recommend an upper limit of 5 g per day [3]. Globally, newevidence suggests that the average level of sodium con-sumption is 3.95 g per day of sodium (approx. 10 g salt)which is almost double the WHO recommendation [4].There is a compelling need to develop valid and reliablemeasures of sodium intake that are feasible for use in thestudy of associations between sodium intake and health
772 C. Kelly et al.
outcomes and in on-going surveillance population studiesof sodium intake.
Current measurements of dietary and urinary sodiumare fraught with methodological difficulties [5]. Dietarymethods tend to underestimate sodium consumption dueto under-reporting of discretionary sources of salt (addedat the table, or during cooking) [6]. The 24-h urinecollection method which is considered the ‘gold standard’is burdensome and potentially limited by under-collection[7]. Several methods have also been used to predict 24-h urinary sodium from spot urine samples, includingarithmetic extrapolation [8] the INTERSALT formula [9]and the application of predictive formulae based on spotsodium to creatinine ratios as a means of controlling forurinary concentration, including those of Tanaka [10] andKawasaki [11]. While the latter spot urine methods may beadequate for population level monitoring where the focusis on estimation of mean sodium intake at the group level,their use in analytical epidemiological research, as inrecent studies suggesting potential harms from low in-takes of dietary sodium [11,12], remains controversial.
The primary aim of this study was to validate a modi-fied 24-h dietary recall method for sodium intakes whichused specific verbal prompts for discretionary salt con-sumption and portion size against the gold standard para-aminobenzoic acid (PABA) validated 24-h urine collections.We also validated a number of other methods for esti-mation of 24-h sodium excretion: a standard FFQ, arith-metic extrapolations from morning and evening spot urinesamples, predicted sodium excretion from morning andevening spot urine samples using Tanaka’s formula,Kawasaki’s formula and the INTERSALT formula.
Methods
Study design
Cross sectional baseline data were obtained from a largeclustered controlled trial, the Food Choice at Work (FCW)study which is described elsewhere [14]. Four multina-tional manufacturing workplaces participated in this trial.
Study subjects
Participants were aged 18e64 years. Any full time, per-manent employee who consumed one daily meal in theworkplace canteen was eligible for the study. The FCWstudy population comprised of 802 participants and fromthis 50 participants provided a complete 24-h urinecollection for the validation study.
Data collection
All participants were asked to complete a health, lifestyleand food questionnaire, a physical assessment, a FFQ, a 24-h dietary recall, spot urine samples and/or a single 24-h urine collection. Participants who did not were excludedfrom the analysis. Questionnaires were self-completed byparticipants electronically or in hard-copy format. Physical
assessments and 24-h dietary recalls were conducted bytrained research assistants. All data was collected duringemployees working hours.
Health, lifestyle and food questionnaire
Socio-demographic indicators included gender, age,ethnicity, education, marital status and work life (job po-sition and usual working hours).
Physical assessment
All participants underwent a comprehensive physicalassessment where body mass index (BMI), midway-waistcircumference and resting blood pressure were measuredby trained research assistants as per the detailed guide-lines outlined in the Standard Operating Procedures (SOP)manual [15].
Dietary information
FFQ
The FFQ was an adapted version of the European Pro-spective Investigation of Cancer (EPIC) FFQ [16]. It wasvalidated for use in the Irish population [17e19]. Theaverage frequency of consumption of each food item overthe previous year was recorded by participants. The FFQwas designed to assess extensively the whole diet andincluded 150 food items arranged into the main foodgroups.
The food frequency data was analysed using a specif-ically designed computer program called FFQ Software,Version 2.0, developed by Juzer Lotya of the NationalNutrition Surveillance Centre, School of Public Health andPopulation Science, University College Dublin. The pro-gram converted the dietary information provided to foodquantities and subsequently to food nutrient values, basedon data from the Food Standards Agency [20] and McCanceand Widdowson’s Food Composition Tables [21].
24-h dietary recall
The 24-h dietary recall method was a modified version ofthe validated UK 24-h dietary recall method [22]. Twodietary recalls were collected within one week to examineon and off duty work dietary patterns. The 3-step methodoutlined specifically what the participant had to eat anddrink in the previous 24-h period.
1. Quick list: participants were asked to report everythingthat they had to eat or drink the day before theirappointment (midnight to midnight).
2. The nutritionist or research assistant collected detailedinformation on items named in the quick list (con-sumption time, place of consumption, brand andrecipe), foods likely to be eaten in combination (milk incoffee) and the quantity consumed and any leftovers orsecond helpings.
Dietary patterns and lipoprotein subclasses 773
3. Recall review: participants had an opportunity to pro-vide additional information or to refer to foodsforgotten in the quick list.
Additional modifications to this method included spe-cific prompts for discretionary salt consumption (at thetable and while cooking); information on accurate esti-mations of portion size, eating times, food brands and la-bels. All recalls were conducted by trained researchassistants’ and lasted approximately 20 minutes. Eachfood, drink and portion size was coded according to the24-h coding instructions based on the validated UKmethod. Food and nutrient analysis was calculated usingNetWISP4ª (Weighed Intake Software Program; TinuvielSoftware, Warrington, UK) [23,24]. The 24-h dietary recallcorresponded to the same time period as the 24-h urinecollection.
Urinary derived estimates
Spot urine samples
Each participant provided one sample the evening beforeand morning of their on-duty or off-duty dietary recall.The urine samples were taken approximately 12 h aparte.g. 8pme8am either on the evening and morning beforethe 24-h urine collection commenced or on the oppositeappointment to the 24-h urine collection. Urinary elec-trolyte levels were measured using standard reagents andmethods by the biochemistry laboratory of the MercyUniversity Hospital Cork. To estimate total sodium excre-tion in the spot urines, the sodium content was convertedto mmol per day. To estimate mmol of sodium, we usedgender specific PABA validated 24-h mean urinary volumeestimations derived from a larger but similar work basedpopulation [25].
The INTERSALT formula, Tanaka’s and Kawasaki’sequations were used to estimate 24-h urinary sodium. Thefollowing equations were used:
INTERSALT formula [9]:
Men : 23�f25:46þ ½0:46� spot Naðmmol=LÞ��½2:75� spot Cr ðmmol=LÞ� � ½0:13� spot K ðmmol=LÞ�þ½4:10� BMIðkg=m2Þ� þ ½0:26� ageðyÞ�g
Women : 23�f5:07þ ½0:34� spot Na ðmmol=LÞ��½2:16� spot Cr ðmmol=LÞ� � ½0:09� spot K ðmmol=LÞ�þ½2:39� BMIðkg=m2Þ� þ ½2:35� ageðyÞ� � ½0:03� age2 ðyÞ�
Tanaka’s equation [10]:
21:98 � XNa0:392whereXNa Z SUNa=SUCr � PRCr
SUNA Z Na concentration (mEq/L) in the spot urineSUCr Z creatinine concentration (mg/dl) in the spot urine
Predicted creatinine (PRCr) assumes that 24-h urinarycreatinine excretion can be estimated approximately onthe basis of age, weight and height at the population level.
The predicted creatinine formula as stated by Tanaka wasas follows (10):
�2:04 � age þ 14:89 � weightðkgÞ þ 16:14
� heightðcmÞ � 2244:45:
Kawasaki’s equation for sodium [11]:
16:3�O½Spot Na=Spot Cr� � predicted 24�h urinary Cr;where predicted Cr ðmg=dayÞ for women is : �4:72 �age ðyearsÞ þ 8:58 � weight ðkgÞ þ 5:09
� heightðcmÞ � 74:5; and for men is : �12:63� age ðyearsÞ þ 15:12 � weight ðkgÞ þ 7:39� height ðcmÞ � 79:9:
Single 24-h urine collection
A standard verbal and written explanation of the 24-h urine collection process was provided to all participantsprior to participation. Eighty nine participants completed asingle 24-h urine collection. However, 6 did not completethe FFQ and/or HLFQ and 6 did not wish to take the PABAtablets. Three 80 mg doses of PABA (a biologically inertsubstance rapidly excreted in urine) were administered toall participants in tablet form the day of urine collection tovalidate the completeness of the sample. Each participantwas provided with 2 three litre storage containers and one500 ml storage container in a strong opaque carrier bag.Participants were asked to outline whether or not they hadaccidentally missed a urine collection.
Once 24-h urine collections were returned, the collec-tions were weighed and urinary electrolyte levels weremeasured in the biochemistry laboratory of the MercyUniversity Hospital Cork. Urine samples were stored at�20 C once aliquoted. PABA analysis was conducted at theMedical Research Council Human Nutrition Research Lab-oratory in Cambridge, United Kingdom. The samples weretransferred frozen. A colorimetric microplate method wasused to assay the PABA samples. Results were reported as apercentage of the PABA dose excreted.
A complete urine sample was assumed when between70% and 103% of the PABA ingested dose appeared in theurine. Those containing <70% are interpreted as ‘incom-plete’ and >103% are interpreted as ‘over’. In this study, 50participants had >70e102% PABA excretion and detectablesodium in the sample.
Statistical analysis
Data was recorded manually and entered electronicallyinto SPSS prior to statistical analysis. Data manipulationand statistical analyses were conducted using SPSS Version21 and p < 0.05 was considered significant. Unweightedmean (SD), median and 95% CI values were reported foreach method. Certain outliers with very high sodium andpotassium intakes did remain in the data and analysis ofvariance (ANOVA) was then used to compare meannutrient intakes. Outliers were excluded based on z scoresfor kilocalories, <�3.3 and >3.3.
774 C. Kelly et al.
BlandeAltman plots were generated to validate theagreement between the measured 24-h urinary sodium(gold standard) and each of the reported methods. Thedifference between the gold standard and each alternativemethod was calculated and plotted against the mean ofthe two measurements. Overall, 95% limits of agreementwere calculated as the mean difference �1.96 SD, whereSD is the standard deviation of the differences in pairedmeasurements. Agreement between methods was alsoexamined by Pearson’s correlation coefficients and byreceiver operating characteristic (ROC) area under thecurve with a cut -off point of �100 mmol/l for sodium.These levels were chosen as it is the upper tolerable limitfor sodium intake in Ireland and the UK.
Ethics
Ethical approval was granted by the Clinical ResearchEthics Committee of the Cork Teaching Hospitals in theRepublic of Ireland May 2012 and amended in March 2013.All participants provided written informed consent.
Results
The characteristics of the FCW and validation samplepopulation are summarised in Table 1. Majority of
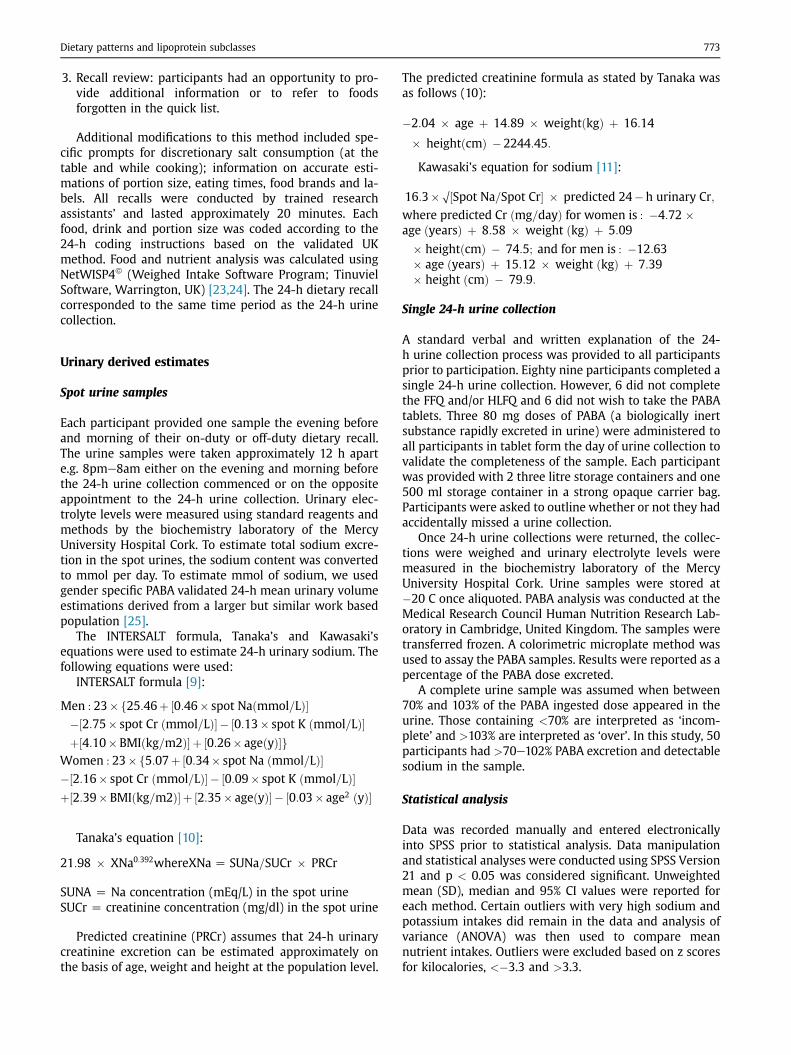
Table 1 Baseline characteristics of the Validation sample population (n Z
Total(n Z 50)N (%)
Men(n Z 32)N (%)
Women(n Z 18)N (%)
Age18e39 years 32 (64) 23 (72) 9 (50)40e64years 18 (36) 9 (28) 9 (50)Mean 37.7 37.9 37.3EducationLeaving Cert or less 4 (8) 3 (9) 1 (6)Certificate/diploma 16 (32) 8 (25) 8 (44)Primary/Degree 17 (34) 14 (44) 3 (17)Post Graduate 13 (26) 7 (22) 6 (33)Job position/ManagerManager 5 (10) 4 (13) 1 (6)Supervisor 4 (8) 0 4 (22)Not a manager/not
a supervisor41 (82) 28 (88) 13 (72)
BMI statusNormal weight 15 (30) 7 (22) 8 (44)Overweight 29 (58) 21 (66) 8 (44)Obese 6 (12) 4 (13) 2 (11)Mean 26.4 26.9 25.5HypertensiveYes 6 (12) 5 (16) 1 (6)No 44 (88) 27 (84) 17 (94)Creatinine: Mean
(SD) median15 (5)15 18 (3)17 12 (5)10
Blood pressureSystolic: Mean
(SD) median120 (16)119 124 (14)121 112 (17)109
Diastolic: Mean(SD) median
73 (9)72 74 (8)74 70 (9)68
*Significant gender differences P < 0.05.
participants were aged 18e39 years (60%), male (60%) andhad a tertiary education (50.7%). Overweight and obesitylevels were higher among males (54.3% and 22.3%) incomparison to females (36.9% and 19.6%). More men (22%)than women (7.3%) were classified as hypertensive. Over-all, there were no significant differences between the 2groups with the exception of those in the validationsample group having a higher level of education(p Z 0.013) and a lower level of diastolic hypertension(p Z 0.003).
Estimations of dietary and urinary sodium for the FCWand validation sample population are presented in Table 2.In the FCW population, mean estimated sodium intake washigher in males than in females for all methods. The meanmeasured 24-h urinary sodium in the validation was138 mmol/day (8.1 g), virtually identical to that estimatedfrom the 24-h dietary recall (134 mmol/day), the arith-metic extrapolations from morning spot urine samples(136 mmol/day) and the INTERSALT formula from eveningspot samples (132 mmol/day). Group mean estimates frommorning spot samples were closer than evening samplesto the 24-h estimates of urinary sodium. However forsome methods, notably the Kawasaki method bothmorning and evening samples overestimated sodiumexcretion relative to the measured 24-h urinary sodium.
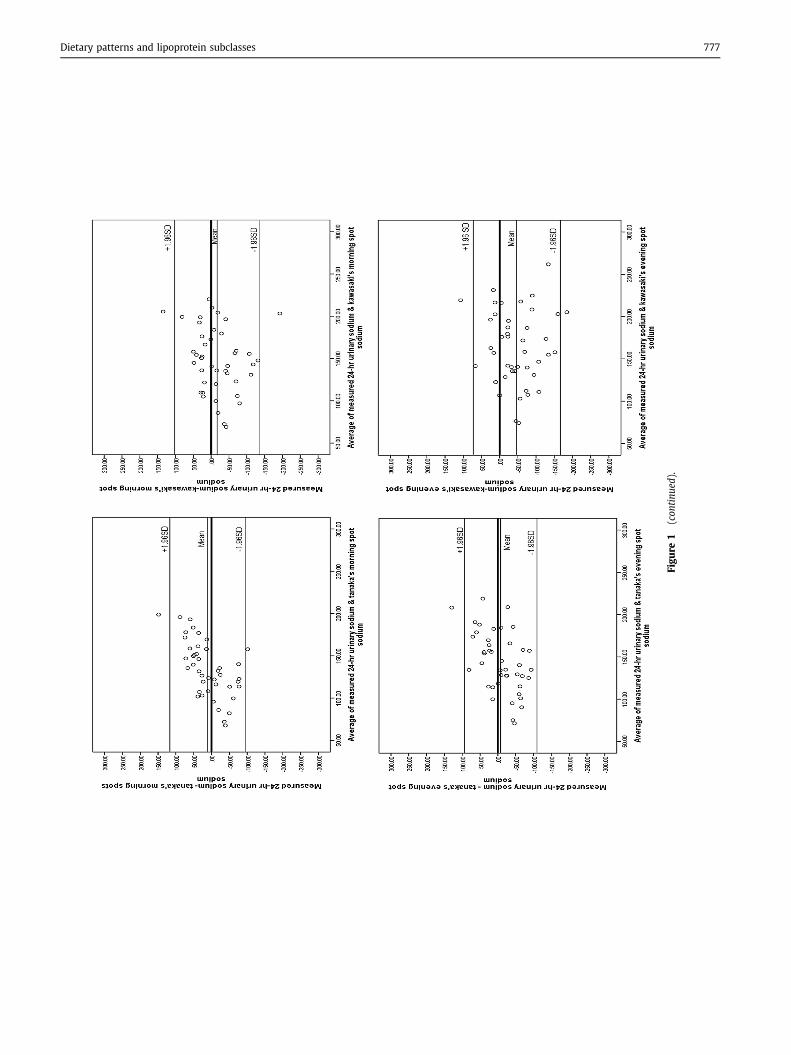
BlandeAltman analysis is shown in Fig. 1. The degree ofbias (i.e. mean difference between measured and
50) and the overall FCW sample population (n Z 802).
p-value Total(n Z 802)N (%)
Men(n Z 556)N (%)
Women(n Z 246)N (%)
p-value*
0.122 478 (60) 335 (60) 143 (58) 0.572324 (40) 221 (40) 103 (42)38.7 38.8 38.4
0.200 181 (23) 100 (18) 81 (33) 0.000*214 (27) 143 (26) 71 (29)241 (30) 192 (35) 49 (20)166 (21) 121 (22) 45 (18)
0.018 86 (11) 73 (13) 13 (5) 0.001*84 (11) 63 (11) 21 (9)632 (79) 420 (76) 212 (86)
0.239 236 (29) 130 (23) 106 (43) 0.000*393 (49) 302 (54) 91 (37)172 (22) 124 (22) 48 (20)27.2 27.6 26.3
0.293 110 (14) 96 (17) 14 (6) 0.000*692 (86) 460 (83) 232 (94)
121 (15)120 125 (13)123 112 (15)110
75 (10)75 76 (9)76 72 (10)71
Table 2 Validation and FCW sample population-sodium intake (mmol/day) based on dietary and urinary methods e mean (sd).
Validation study population FCW study population
Method Total(n Z 50)d
Men(n Z 32)
Women(n Z 18)
Total(n Z 793)d
Men(n Z 550)
Women(n Z 243)
24 h urine PABA validateda 138 (53) 147 (46) 121 (61) e e e
FFQb 129 (50) 126 (56) 133 (39) 132 (53) 135 (53) 128 (53)24 h dietary recallb 134 (65) 147 (67) 111 (55) 132 (76) 141 (82) 112 (56)Arithmetic extrapolations morning spotc 136 (72) 145 (83) 124 (1) 167 (82) 180 (84) 141 (73)Arithmetic extrapolations evening spotc 168(820 191 (890) 137 (0) 186 (108) 201 (109) 150 (93)Tanaka’s prediction morning spot 24 h estimate 129 (27) 134 (26) 122 (27) 135 (31) 136 (29) 133 (34)Tanaka’s prediction evening spot 24 h estimate 147 (32) 148 (33) 122 (27) 157 (32) 159 (32) 154 (33)Kawasaki’s prediction morning spot 24 h estimate 157 (45) 174 (42) 134 (38) 198 (64) 218 (59) 152 (48)Kawasaki’s prediction evening spot 24 h estimate 187 (53) 199 (57) 169 (42) 239 (72) 264 (67) 184 (49)Intersalt prediction morning spot 24 h estimate 125 (28) 141 (23) 103 (19) 135 (33) 146 (31) 111 (23)Intersalt prediction evening spot 24 h estimate 132 (30) 148 (26) 110 (19) 145 (35) 158 (33) 118 (24)a Gold standard method.b All dietary assessments have been normalised from mg Na to mmol of sodium/day.c Based on single specimen averaged for 24 h collection g/day.d Slight variation to total numbers for different methods.
Dietary patterns and lipoprotein subclasses 775
estimated mean sodium) at the group level was small forboth dietary methods and for some but not all of the urinederived methods ranging from 3.8 to �47 mmol sodium.The Kawasaki evening spot prediction had the largest de-gree of bias (�47 mmol sodium). The Tanaka predictionand INTERSALT prediction tended to underestimate 24-hvalues at low excretion levels and over estimate athigher levels.
Table 3 presents the findings on the performance ofdietary and spot urine derived measures of 24-h sodiumexcretion versus measured 24-h urinary sodium asassessed by mean difference on BlandeAltman analysis,correlation coefficients and ROC Area under the Curvevalues. The performance of all methods was relatively poorwith R2 values ranging from 0.07 to 0.48 and AUC valuesranging from 0.56 to 0.76.
Discussion
The findings suggest that at the individual level neitherdietary methods nor spot urine samples provide adequateaccuracy in the assessment of 24-h urinary sodium relativeto the gold standard of measured 24-h urinary sodium.However group mean errors from both dietary methods(FFQ and modified 24-h dietary recall, a novel method thatcan be completed in under 20 minutes) were small andrandom and compare favourably with those from spoturine samples in this population.
The findings are consistent with an emerging consensusthat spot urinary sodium is a poor predictor of 24-h excretion in individuals but may provide adequatemean estimates for population level monitoring [7,26].Particularly, there was no evidence that the use of theTanaka [10] and Kawasaki [11] predictive formulae in-creases the accuracy of estimates of 24-h urinary sodiumrelative to simple arithmetic extrapolation or the dietarymethods. Data on the Tanaka formula which under-estimated 24-h values at low excretion levels and
overestimated values at higher levels are consistent withthe findings from Ji and colleagues who carried out avalidation study of spot versus 24-h urine samples inmulti-ethnic populations in Britain and Italy [8]. It is alsonoteworthy that in the latter study, the validity of spoturine estimates varied between men and women and indifferent ethnic groups. The extent to which the Kawasakipredictive formula overestimates measured 24-h urinarysodium raises concern about the appropriateness of usingthis formula in analytical epidemiological research [12,13].
Several different formulae have been suggested to es-timate spot urinary sodium over 24-h. In this study theINTERSALT formula provided the least bias informationregarding mean sodium intake when compared to theTanaka and Kawasaki formula. This finding is consistentwith the findings from Cogswell and colleagues who car-ried out a validation study of predictive equations for 24-h urinary sodium excretion in adults aged 18e64 years [9].
The findings from this study suggest that specific di-etary intake methods can usefully estimate mean sodiumintakes at the population level. This is consistent withreports from the USDA Automated Multiple Pass MethodValidation study which uses a 24-h dietary recall method[27]. The latter study reported that sodium intake wasunderestimated by less than 9% in comparison to the so-dium biomarker and the authors suggest that dietaryintake methods are an acceptable measure at the popu-lation/group level for estimating sodium intakes. Failure tocapture discretionary salt or salt added during cooking orat the table is a major factor in the underestimation ofdaily sodium intake [23]. However, one of the uniquefeatures of the 24-h dietary recall method used in thisstudy is the use of prompts for discretionary salt and thecareful questioning by trained research assistantsregarding actual portion size consumed, eating times andfood labels.
Strengths of the study include that all workplaces hadsimilar characteristics as they were all manufacturingworkplaces with similar shift patterns and work schedules.
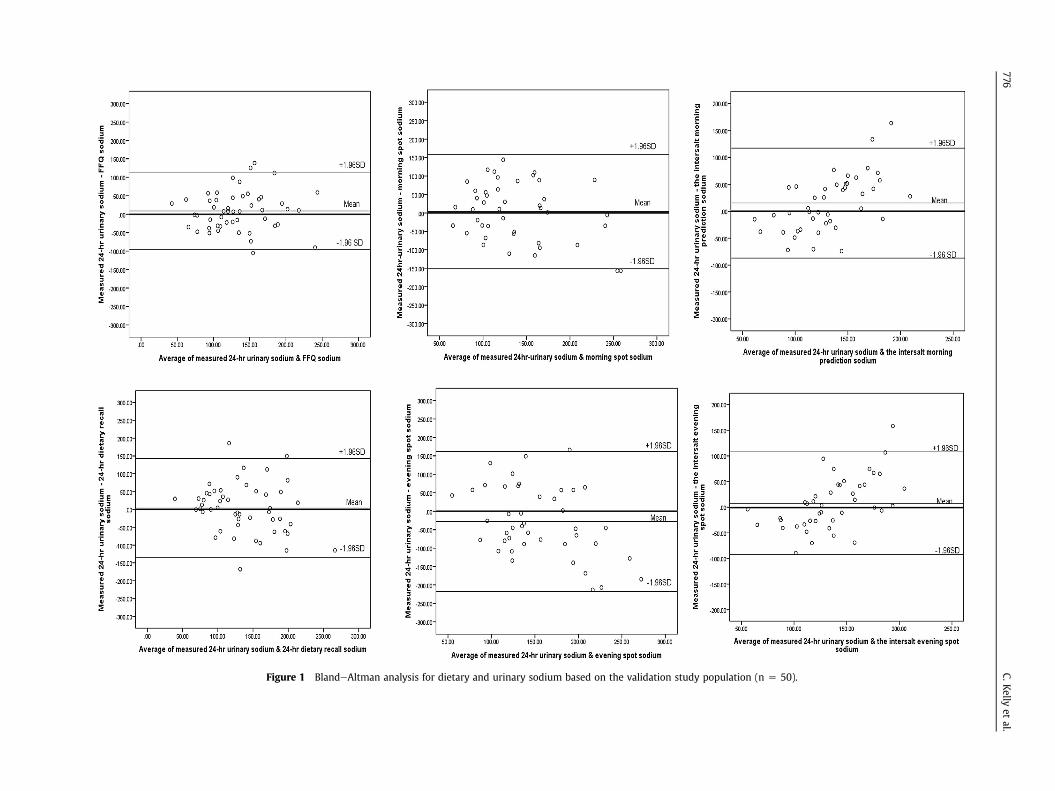
Figure 1 BlandeAltman analysis for dietary and urinary sodium based on the validation study population (n Z 50).
776C.K
ellyet
al.
Figu
re1
(con
tinu
ed).
Dietary patterns and lipoprotein subclasses 777
Table 3 Performance of dietary and spot urine derived measures of 24-h sodium excretion versus measured 24-h urinary sodium as assessed bymean difference on BlandeAltman analysis, correlation coefficients and ROC Area under the Curve values based on the validation study pop-ulation (n Z 50).
Method Mean difference(SD)
95% CI on meandifference
95% limitsof agreement
R2 p-value AUC 95% CI
FFQ 9.1 (52.4) �5.7, 24 �95.7, 113.9 0.48 0.000 0.76 0.6, 0.924-h dietary recall 3.8 (69.4) �15, 23 �135, 142.6 0.32 0.023 0.71 0.5, 0.8Arithmetic extrapolations morning spot 3.8 (77.4) �20, 27 �151, 158.6 0.28 0.075 0.57 0.4, 0.7Arithmetic extrapolations evening spot �28.3 (94.7) �57, 10 �217.7, 161.1 0.07 0.066 0.56 0.4, 0.7Tanaka’s prediction morning spot 24 h estimate 10.9 (54) �5, 27 �94.9, 116.7 0.24 0.114 0.60 0.4, 0.8Tanaka’s prediction evening spot 24 h estimate �7.8 (52) �23, 8 �109.7, 94.1 0.35 0.022 0.64 0.4, 0.8Kawaski’s prediction morning spot 24 h estimate �17.1 (61) �36, 1.1, �136.3, 102.5 0.24 0.122 0.63 0.4, 0.8Kawaski’s prediction evening spot 24 h estimate �47.0 (61) �65, �28 �166.6, 72.6 0.34 0.025 0.68 0.5, 0.9Intersalt prediction morning spot 24 h estimate 15.1 (52) �0.8, 31 �74, 163.6 0.32 0.033 0.70 0.5, 0.8Intersalt prediction evening spot 24 h estimate 7.8 (51) �7.9, 24 �89, 158 0.36 0.019 0.71 0.5, 0.9
778 C. Kelly et al.
Employees that participated in the validation study hadcomparable demographics and health status characteris-tics when compared to the overall FCW study population.This is one of the few studies to compare both diet andspot urine estimates of 24-h sodium in the samepopulation.
Limitations associated with this study include the smallsample size of the validation population (n Z 50). It mayalso be objected that the generalisability of the findings islimited by the fact that the participants are a non-representative group of healthy employees in a work-place setting where dietary exposures are relatively stable.This may have contributed to the relative accuracy of thedietary recall methods versus the spot urine sample esti-mates in this setting. However as there is no acceptedalternative to a 24-h urine collection suitable for use in allsettings, the findings highlight the need, in specific set-tings such as the workplace, to compare and calibratemethods of estimating 24-h sodium excretion against 24-h collections. The findings also suggest that in some set-tings, dietary methods, in addition to providing valuableinformation on the sources of dietary sodium, may alsoprovide estimates of 24-h intake of adequate accuracy atthe group level.
Conclusion
Although the 24-h urine collection is burdensome for usein large scale studies it remains the gold standard for workaddressing the impact of sodium intake on health out-comes. The present study demonstrated that neither di-etary nor urinary methods based on morning or eveningspot samples provide adequate validity in the estimationof dietary sodium intake at the individual level. Howeverthe dietary methods and some of the urinary methods maybe applied at the population level for estimations of meandietary sodium intake.
Contributions of authors
CK was responsible primarily for the final content of thepaper. CK, FG, GB, IJP worked on the study design and co-wrote the final manuscript. CK, FG, TF, GB, were
responsible for data analysis and interpretation of results.All authors approved the final version of the paper forpublication.
Declarations of interest
The authors declare that there are no conflicts of interest.
Funding sources
This work is supported by the HRB Centre for Health & DietResearch grant (HRC2007/13) funded by the Irish HealthResearch Board and by the Department of Agriculture,Fisheries and Food. Student bursaries have been awardedfrom the Irish Heart Foundation.
Acknowledgements
The authors extend their sincere thanks to all participatingmanufacturing workplaces.
References
[1] Mente A, O’Donnell MJ, Rangarajan S, McQueen MJ, Poirier P,Wielgosz A, et al. Association of urinary sodium and potassiumexcretion with blood pressure. N. Engl J Med 2014;371:7.
[2] He FJ, Li J, MacGregor GA. Effect of longer term modest saltreduction on blood pressure: Cochrane systematic review andmeta-analysis of randomised trials. Br Med J 2013;346:f1325.
[3] Sacks FM, Svetkey LP, Vollmer WM, Appel LJ, Bray GA, Harsha D,et al. Effects on blood pressure of reduced dietary sodium and theDietary Approaches to Stop Hypertension (DASH) diet. DASH-Sodium Collaborative Research Group. N Engl J Med 2001;344:3e10.
[4] Mozaffarian D, Fahimi S, Singh GM, Micha R, Khatibzadeh S,Engrell RE, et al. Global Burden of Diseases Nutrition and ChronicDiseases Expert Group (NUTRICODE). Global sodium consumptionand death from cardiovascular causes. N Engl J Med 2014;371:624e34.
[5] Charlton KE, Steyn K, Levitt N, Jonathan D, Zulu J, Nel JH. Devel-opment and validation of a short questionnaire to assess sodiumintake. Public Health Nutr 2007;11(1):83e94.
[6] Reinivuo H, Valsta LM, Laatikainen T, Tuomilehto J, Pietinen P.Sodium in the Finnish diet: II trends in dietary sodium intake andcomparison between intake and 24 h excretion of sodium. Eur JClin Nutr 2006;60:1160e7.
[7] McLean MR. Measuring population sodium intake: a review ofmethods. Nutrients 2014;6:4651e62.
Dietary patterns and lipoprotein subclasses 779
[8] Ji C, Miller MA, Venezia A, Strazzullo P, Cappuccio FP. Comparisonsof spot vs 24-h urine samples for estimating population saltintake: validation study in two independent samples of adults inBritain and Italy. Nutrition. Metabolism Cardiovasc Dis 2014;24:140e7.
[9] Cogswell ME, Wang C-Y, Chen T-C, Pfeiffer CM, Elliott P,Gillespie CD, et al. Validity of predicitve equations for 24-h urinarysodium excretion in adults aged 18e39 y. Am J Clin Nutr 2013;98:1502e13.
[10] Tanaka T, Okamura T, Miura K, Kadowaki T, Ueshima H,Nakagawa H, et al. A simple method to estimate populational 24-hurinary sodium and potassium excretion using a casual urinespecimen. J Hum Hypertens 2002;16:97e103.
[11] Kawasaki T, Itoh K, Uezonok K, Sasaki H. A simple method forestimating 24 H urinary sodium and potassium excretion fromsecond morning voiding urine specimen in adults. Clin Exp Phar-macol Physiol 1993;20:7e14.
[12] O’Donnell MJ, Yusuf S, Mente A, Gao P, Mann JF, Teo K, et al. Uri-nary sodium and potassium excretion and risk of cardiovascularevents. JAMA 2011;306:2229e38.
[13] O’Donnell M, Mente A, Rangarajan S, McQueen MJ, Wang X, Liu L,et al. Urinary sodium and potassium excretion, mortality, andcardiovascular events. N. Engl J Med 2014;371:612e23.
[14] Geaney F, Harrington J, Fitzgerald AP, Perry IJ. The impact of aworkplace catering intiative on dietary intakes of salt and othernutrients: a pilot study. Public Health Nutr 2011;14(8):1345e9.
[15] Geaney F, Di Marrazzo JS, Kelly C, Harrington JM, Perry IJ. Foodchoice at work SOP. Department of Epidemiology and PublicHealth, University College Cork; 2013.
[16] Ocke MC, Bueno-de-Mesquita HB, Goddijn HE, Jansen A, Pols MA,van Staveren WA, et al. The dutch epic food frequency question-naire. I. Description of the questionnaire, and relative validity andreproducibility for food groups. Int J Epidemiol 1997;26(Suppl. 1):S37e48.
[17] Friel S, Kelleher C, Noal G, Harrington J. Social diversity of Irishadults nutritional intake. Eur J Clin Nutr 2003;57:865e75.
[18] Harrington J. Validation of a food frequency questionnaire as a toolfor assessing nutrient intake. Minor thesis as part of MA in healthpromotion. Galway: National University of Ireland; 1997.
[19] Kelleher C, Friel S, Nolan G, Forbes B. Effect of social variation onthe Irish diet. Proc Nutr Soc 2002;61:527e36.
[20] Food Standards Agency Food Portion Sizes. 3rd ed. 2002 [LondonHMSO].
[21] McCance RA, Widdowson EM. The composition of foods. 5th ed.1997 [London HMSO].
[22] Nelson M, Ehrens B, Bates B, Church S, Boshier T. Low income dietand nutrition survery. The Stationery Office London; 2007. http://www.food.gov.uk/multimedia/pdfs/lidnsvol02.
[23] Chan W, Brown J, Buss DH. Miscellaneous foods. Fourth supple-ment to McCance & Widdowson’s the composition of foods. 5thed. Cambridge and London: The Royal Society of Chemistry andtheMinistry of Agriculture Fisheries and Food; 1994.
[24] Chan W, Brown J, Lee SJ, Buss DH. Meat, poultry and game. Fifthsupplement of McCance & Widdowson’s the composition of foods.5th ed. Cambridge and London: The Royal Society of Chemistryand Ministry of Agriculture Fisheries and Food; 1995.
[25] Perry IJ, Browne G, Loughrey M, Harrington J, Lutomski J,Fitzgerald AP. Dietary salt intake and related risk factors in theIrish population. 2010. A report for safefood Ireland. ISBN 978-1-905767-14-4.
[26] Ji C, Sykes L, Paul C, Dary O, Legetic B, Campbell NR, et al. Sys-tematic review of studies comparing 24-hour and spot urinecollections for estimating population salt intake. Rev Panam SaludPublica 2012;32(4):307e15.
[27] Rhodes DG, Murayi T, Clemens JC, Baer DJ, Sebastian RS,Moshfegh AJ. The USDA automated multiple-pass method accu-rately assesses population sodium intakes. Am J Clin Nutr 2013;97:958e64.


![URINARY EXCRETION OF ALBUMIN - nephro-necker.org · urinary excretion of albumin ... tojo and endou [12], ... 105, 1353-1361 2000. renal albumin handling in megalin knock out mice](https://img.pdfslide.net/doc/110x75/5c4a0c7693f3c317653c31ff/urinary-excretion-of-albumin-nephro-urinary-excretion-of-albumin-tojo.jpg)