Embed Size (px)
Citation preview
19th International Emission Inventory Conference. Emission Inventories - Informing Emerging Issues. San Antonio, TX . Sep 27-30 2010. "Emission Inventories - Informing Emerging Issues"
1g g g
Validation of the COPERT road emission inventory model with real-use data
P. Dilara(P), V. FrancoEuropean Commission Joint Research Centre -Transport and Air Quality Unit
M. Kousoulidou, L. Ntziachristos, S. Geivanidis, Z. SamarasLaboratory of Applied Thermodynamics - Aristotle University of Thessaloniki
19th International Emission Inventory Conference. Emission Inventories - Informing Emerging Issues. San Antonio, TX . Sep 27-30 2010. "Emission Inventories - Informing Emerging Issues"
2g g g
INDEX
• Introduction
• Experimental setup
• Data analysis
• Results
• Discussion
• Conclusions
19th International Emission Inventory Conference. Emission Inventories - Informing Emerging Issues. San Antonio, TX . Sep 27-30 2010. "Emission Inventories - Informing Emerging Issues"
3g g g
INTRODUCTION. Key Research Questions
• How much does a modern vehicle emit under realistic driving gconditions (i.e. outside regulated test cycles)?
Portable Emissions Measurement System (PEMS) campaign to gather in-use real-world datain-use, real-world data
• Can real-world measurement data be used for emission factor development / validation?development / validation?
Development of engine pollutant and FC maps from PEMS data
Feed them into Vehicle Simulation toolsFeed them into Vehicle Simulation tools
Simulation of experimental routes and production of new EFs
Direct comparison of PEMS data to EFs from model used in pnational inventory compilations (COPERT)
19th International Emission Inventory Conference. Emission Inventories - Informing Emerging Issues. San Antonio, TX . Sep 27-30 2010. "Emission Inventories - Informing Emerging Issues"
4g g g
EXPERIMENTAL SETUP• PEMS measurement campaign
Stock Euro 5 Diesel PC
Three predefined routes• Rural + Highway (135 km length, ∼ 65 kph average speed)• Rural + Urban (61 km, ∼ 35 kph)• Rural + Uphill (65 km, ∼ 40 kph)
Second-by-second log• Tailpipe concentration of exhaust gasses : O2, HC, CO, CO2 (NDIR) and NOx
(electrochemical cell) • Exhaust flowmeter• GPS and vehicle-mounted weather station data• ECU data: vehicle speed engine rpm intake air mass flow coolant temperature• ECU data: vehicle speed, engine rpm, intake air mass flow, coolant temperature…
19th International Emission Inventory Conference. Emission Inventories - Informing Emerging Issues. San Antonio, TX . Sep 27-30 2010. "Emission Inventories - Informing Emerging Issues"
5g g g
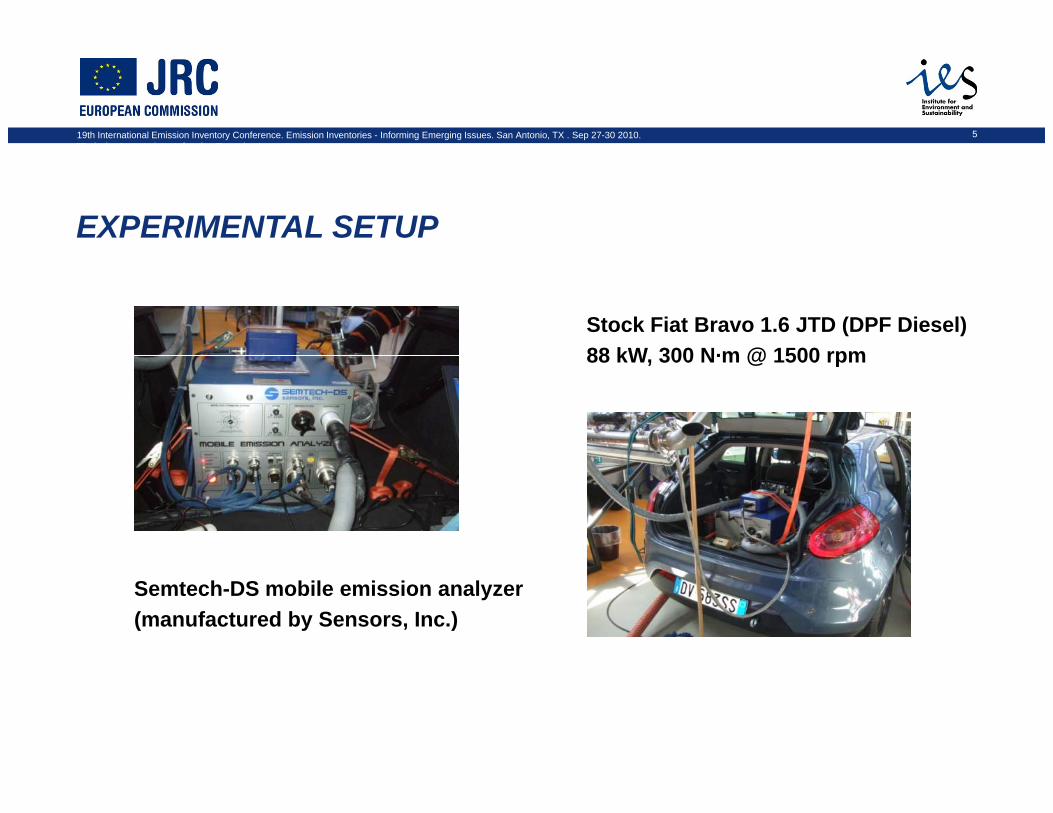
EXPERIMENTAL SETUP
Stock Fiat Bravo 1.6 JTD (DPF Diesel)88 kW 300 N·m @ 1500 rpm88 kW, 300 N·m @ 1500 rpm
Semtech-DS mobile emission analyzer(manufactured by Sensors, Inc.)
19th International Emission Inventory Conference. Emission Inventories - Informing Emerging Issues. San Antonio, TX . Sep 27-30 2010. "Emission Inventories - Informing Emerging Issues"
6g g g
DATA ANALYSIS. Models
COPERT (LAT Th l iki)• COPERT (LAT Thessaloniki)
Calculates emissions from all major pollutants, incl. exhaust and diffuse sources (evaporation, tyre and break wear), based on mean-speed emission factors
Covers all major vehicle cats. (241 individual types/technologies)
A li d f ti l l i t i th h t EApplied for national-scale inventories throughout Europe
http://lat.eng.auth.gr/copert/
• ADVISOR (US Dpt. of Energy)
Matlab/Simulink Analysis package for advanced vehicle modeling. Used to predict the fuel consumption and emissions of test vehicleUsed to predict the fuel consumption and emissions of test vehicle
19th International Emission Inventory Conference. Emission Inventories - Informing Emerging Issues. San Antonio, TX . Sep 27-30 2010. "Emission Inventories - Informing Emerging Issues"
7g g g
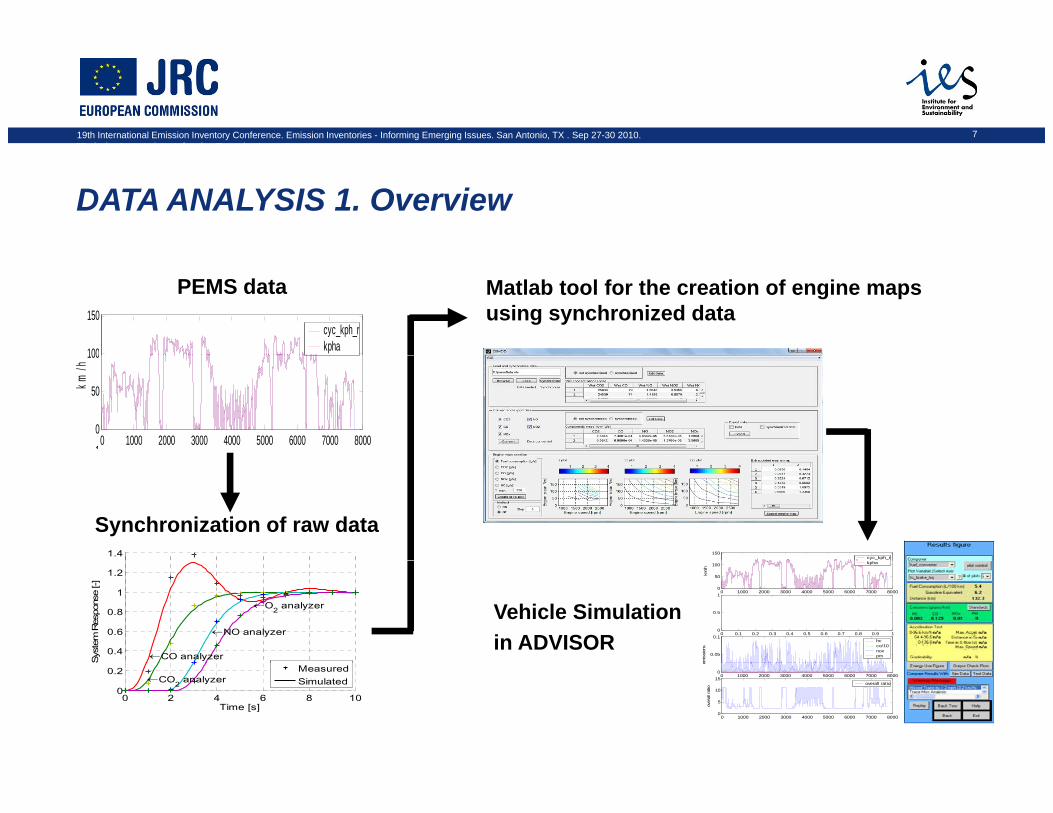
DATA ANALYSIS 1. Overview
100
150cyc_kph_rkpha
PEMS data Matlab tool for the creation of engine maps using synchronized data
0 1000 2000 3000 4000 5000 6000 7000 80000
50
100
km/h
1
1.4
Synchronization of raw data150
cyc_kph_r
0.4
0.6
0.8
1
1.2
Syst
em R
espo
nse
[-]
←CO analyzer
←NO analyzer
←O2 analyzer Vehicle Simulationin ADVISOR
0 1000 2000 3000 4000 5000 6000 7000 80000
50
100
km/h
kpha
0 0.1 0.2 0.3 0.4 0.5 0.6 0.7 0.8 0.9 10
0.5
1
0.05
0.1
emis
sion
s
hc co/10nox pm
0 2 4 6 8 100
0.2
Time [s]
←CO2 analyzerMeasuredSimulated
0 1000 2000 3000 4000 5000 6000 7000 80000
e
0 1000 2000 3000 4000 5000 6000 7000 80000
5
10
15
over
all r
atio
overall ratio

19th International Emission Inventory Conference. Emission Inventories - Informing Emerging Issues. San Antonio, TX . Sep 27-30 2010. "Emission Inventories - Informing Emerging Issues"
8g g g
DATA ANALYSIS 1. Preprocessing
S h i ti f PEMS d t• Synchronization of raw PEMS data
Model to perform a back correction of the analyzer’s signal to correct for time lag and response
Highly transient modes are filtered out
Geivanidis & Samaras, Meas. Sci. Technol. 19, 2008
19th International Emission Inventory Conference. Emission Inventories - Informing Emerging Issues. San Antonio, TX . Sep 27-30 2010. "Emission Inventories - Informing Emerging Issues"
9g g g
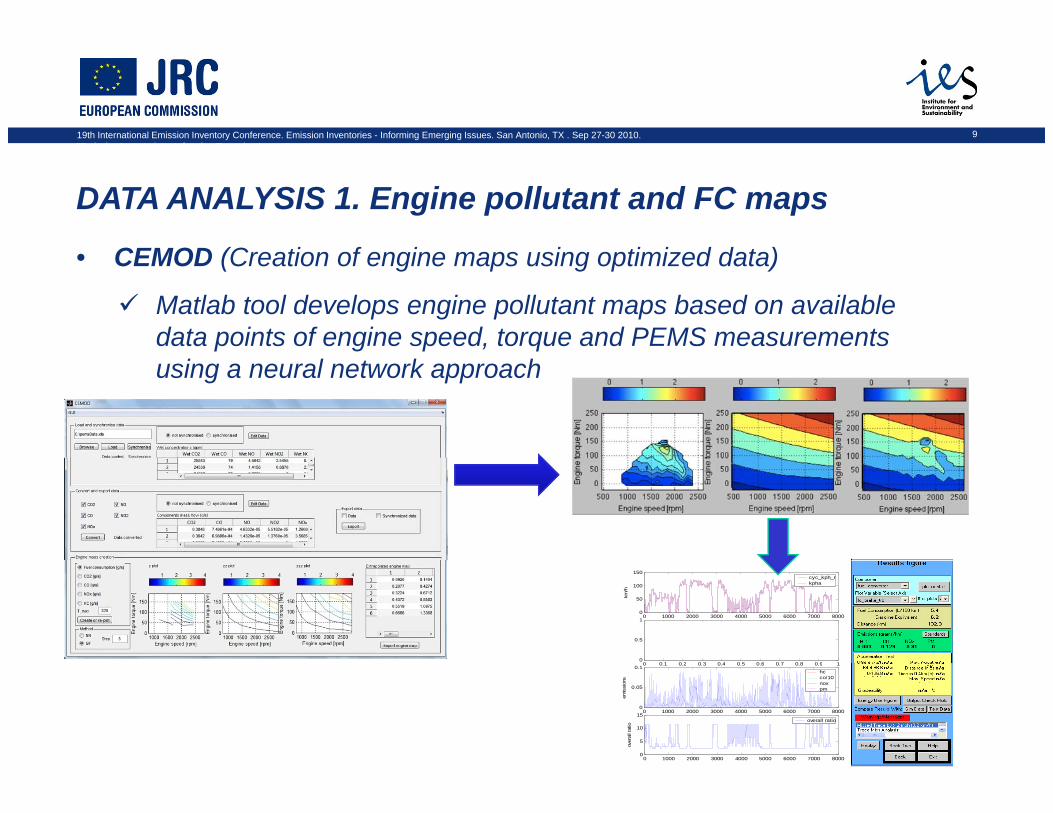
DATA ANALYSIS 1. Engine pollutant and FC maps
CEMOD (Creation of engine maps using optimized data)• CEMOD (Creation of engine maps using optimized data)
Matlab tool develops engine pollutant maps based on available data points of engine speed, torque and PEMS measurements using a neural network approach
0 1000 2000 3000 4000 5000 6000 7000 80000
50
100
150
km/h
cyc_kph_rkpha
0 0 1 0 2 0 3 0 4 0 5 0 6 0 7 0 8 0 9 10
0.5
1
0 0.1 0.2 0.3 0.4 0.5 0.6 0.7 0.8 0.9 1
0 1000 2000 3000 4000 5000 6000 7000 80000
0.05
0.1
emis
sion
s
hc co/10nox pm
0 1000 2000 3000 4000 5000 6000 7000 80000
5
10
15
over
all r
atio
overall ratio
19th International Emission Inventory Conference. Emission Inventories - Informing Emerging Issues. San Antonio, TX . Sep 27-30 2010. "Emission Inventories - Informing Emerging Issues"
10g g g
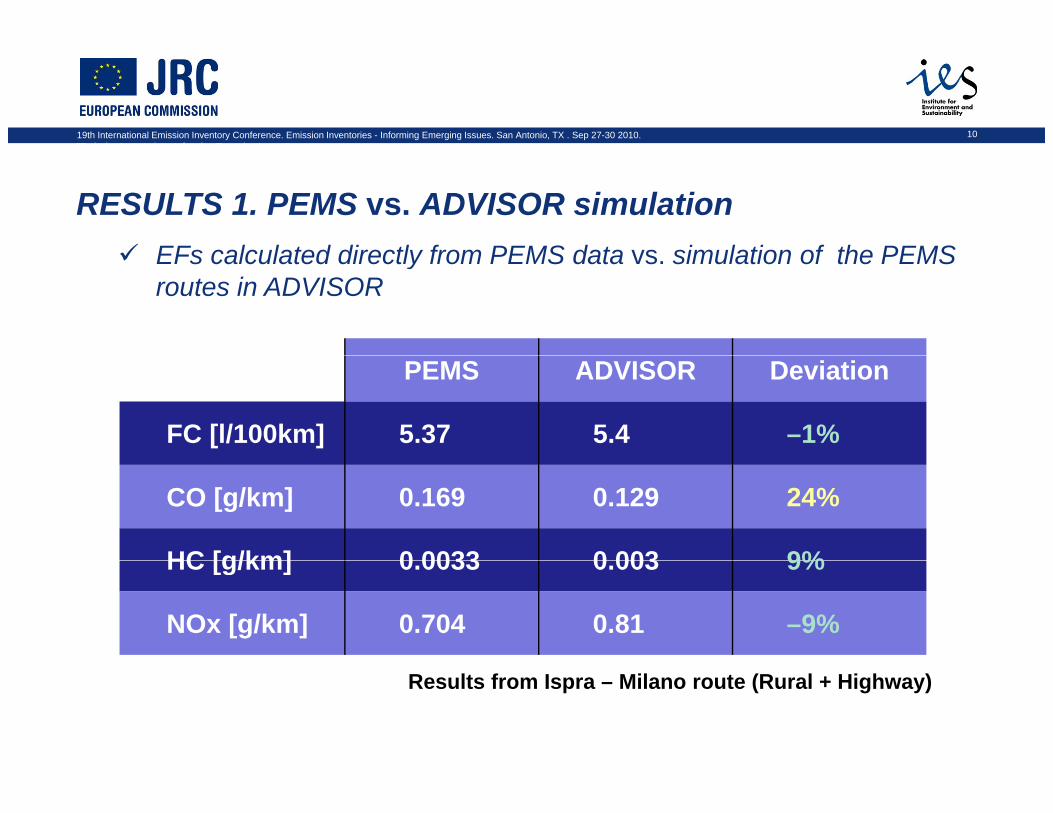
RESULTS 1. PEMS vs. ADVISOR simulationEFs calculated directly from PEMS data vs simulation of the PEMSEFs calculated directly from PEMS data vs. simulation of the PEMS routes in ADVISOR
PEMS ADVISOR Deviation
FC [l/100km] 5.37 5.4 –1%
CO [g/km] 0.169 0.129 24%
HC [g/km] 0 0033 0 003 9%HC [g/km] 0.0033 0.003 9%
NOx [g/km] 0.704 0.81 –9%
Results from Ispra – Milano route (Rural + Highway)
19th International Emission Inventory Conference. Emission Inventories - Informing Emerging Issues. San Antonio, TX . Sep 27-30 2010. "Emission Inventories - Informing Emerging Issues"
11g g g
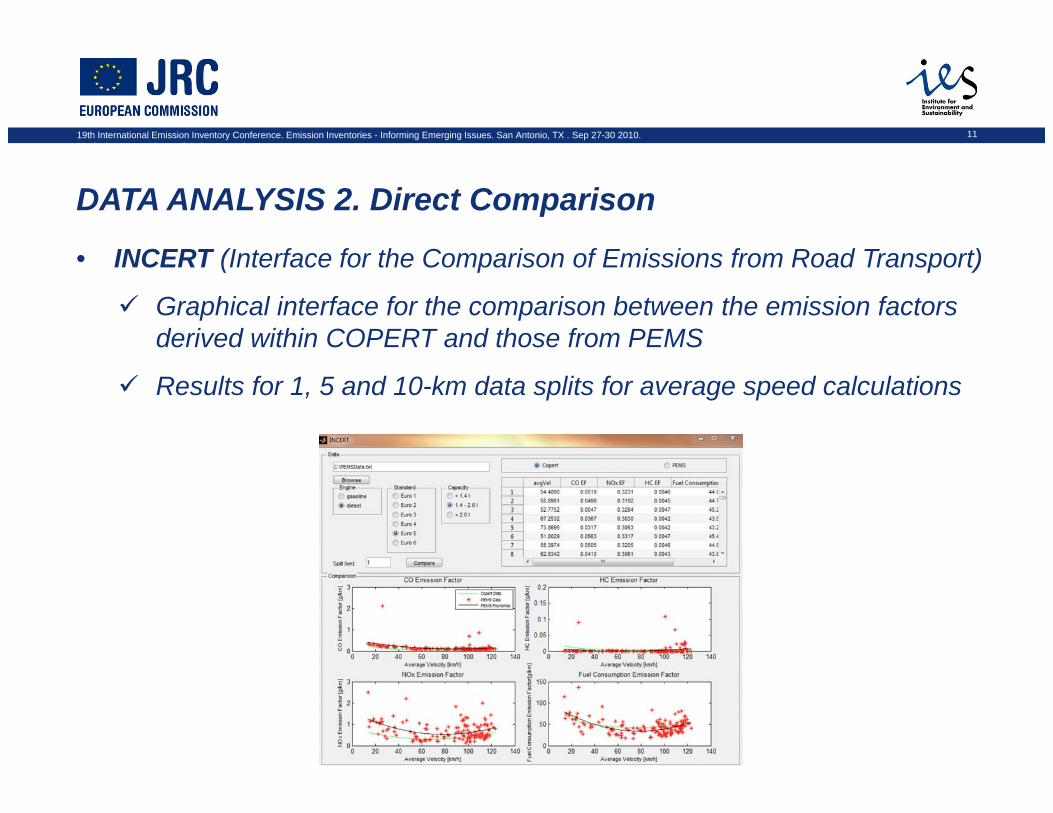
DATA ANALYSIS 2. Direct Comparison
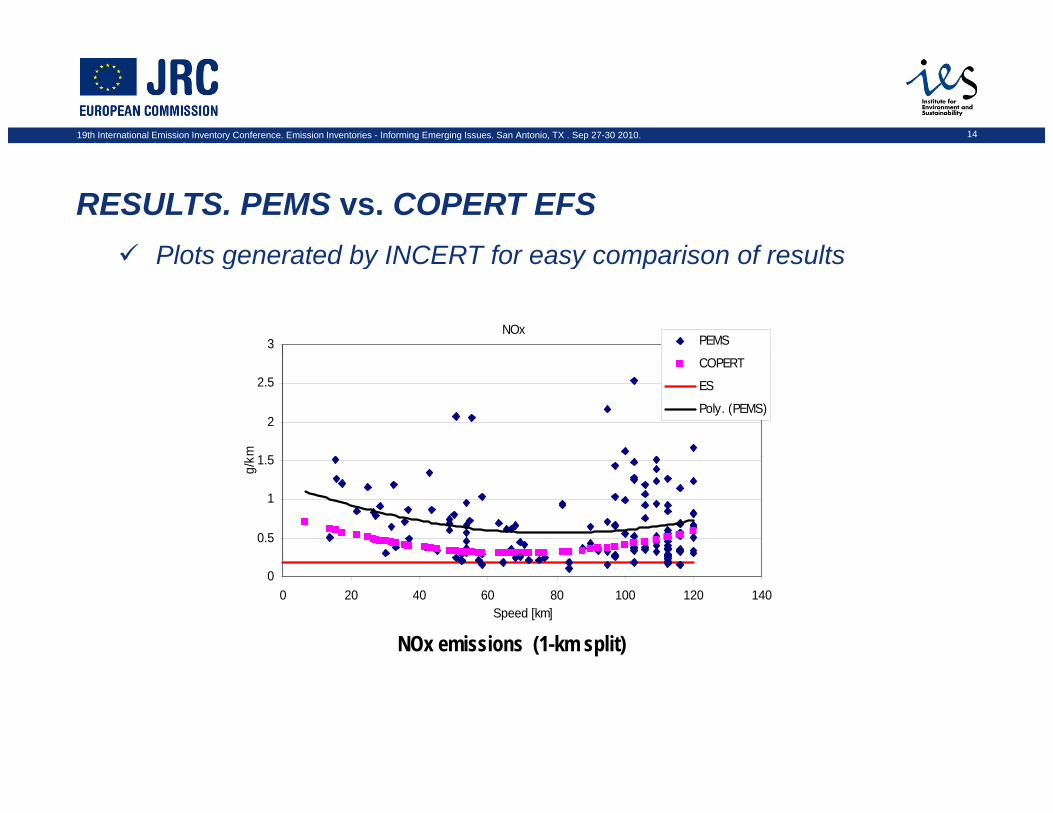
INCERT (I t f f th C i f E i i f R d T t)• INCERT (Interface for the Comparison of Emissions from Road Transport)
Graphical interface for the comparison between the emission factors derived within COPERT and those from PEMS
Results for 1, 5 and 10-km data splits for average speed calculations
19th International Emission Inventory Conference. Emission Inventories - Informing Emerging Issues. San Antonio, TX . Sep 27-30 2010. "Emission Inventories - Informing Emerging Issues"
12g g g
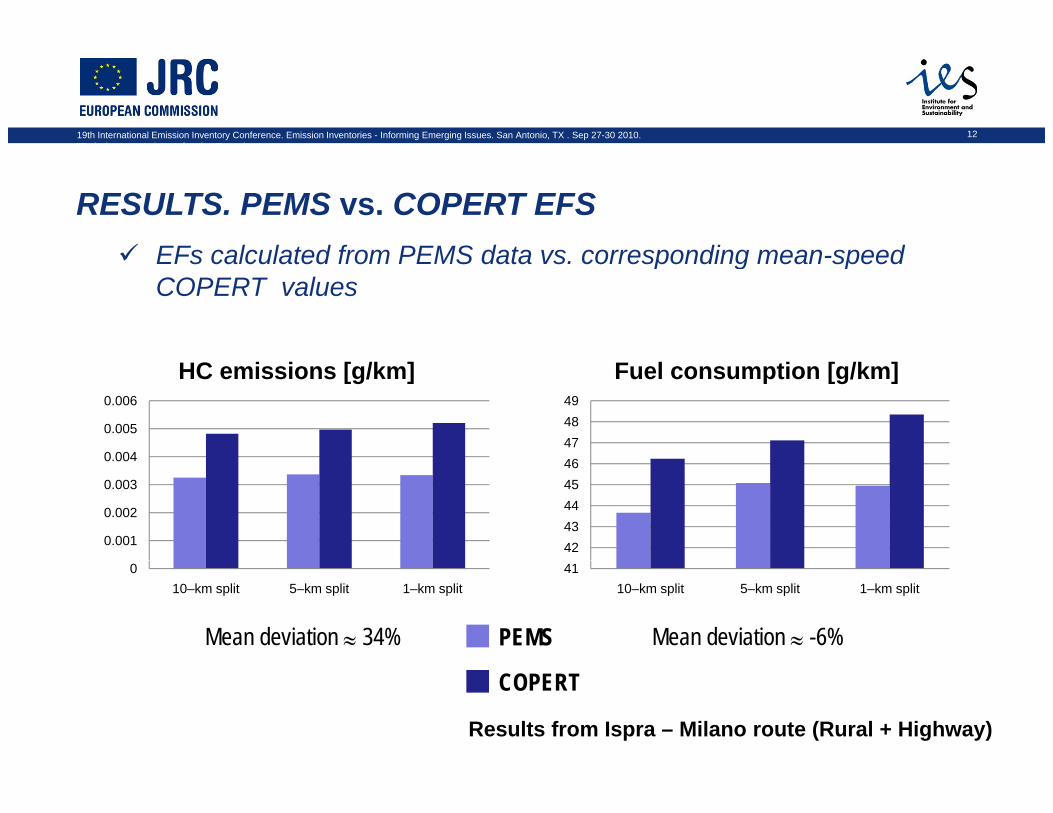
RESULTS. PEMS vs. COPERT EFSEFs calculated from PEMS data vs corresponding mean speedEFs calculated from PEMS data vs. corresponding mean-speed COPERT values
0 004
0.005
0.006
HC emissions [g/km]
474849
Fuel consumption [g/km]
0.001
0.002
0.003
0.004
4243444546
010–km split 5–km split 1–km split
4110–km split 5–km split 1–km split
PEMSMean deviation ≈ 34% Mean deviation ≈ -6%
COPERT
Results from Ispra – Milano route (Rural + Highway)
19th International Emission Inventory Conference. Emission Inventories - Informing Emerging Issues. San Antonio, TX . Sep 27-30 2010. "Emission Inventories - Informing Emerging Issues"
13g g g
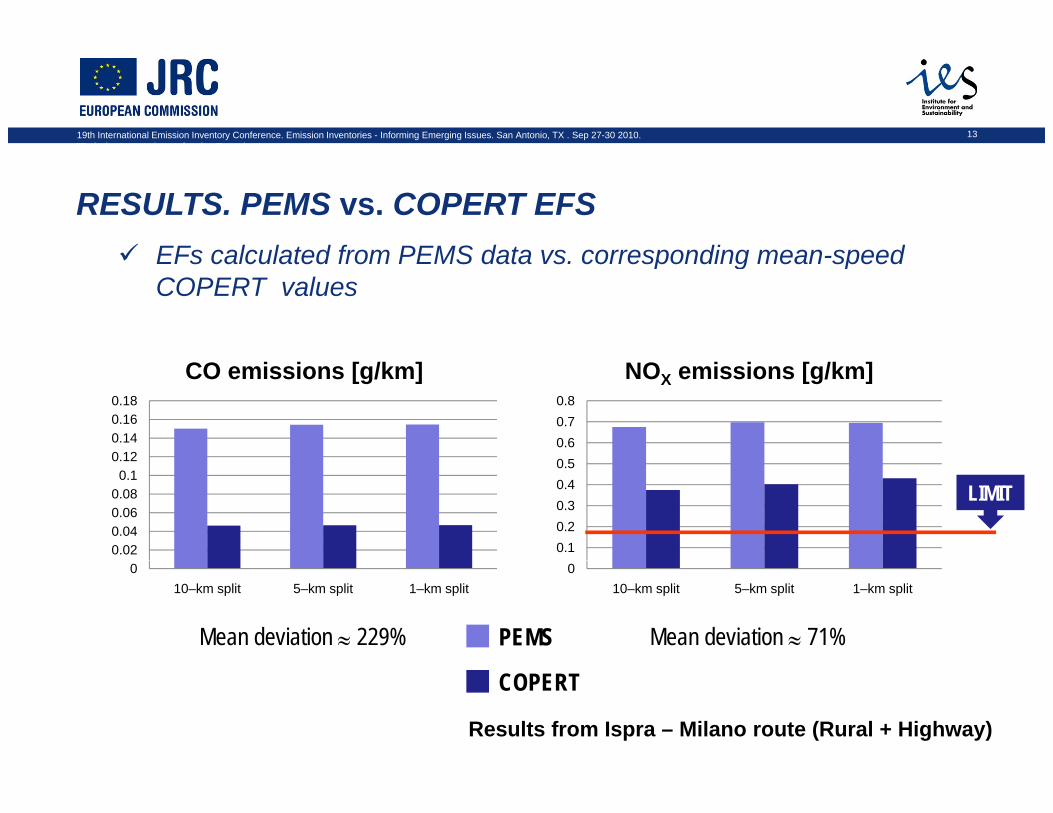
RESULTS. PEMS vs. COPERT EFSEFs calculated from PEMS data vs corresponding mean speedEFs calculated from PEMS data vs. corresponding mean-speed COPERT values
0 120.140.160.18
CO emissions [g/km]
0.60.70.8
NOX emissions [g/km]
0.020.040.060.08
0.10.12
0.10.20.30.40.5
LIMIT
010–km split 5–km split 1–km split
010–km split 5–km split 1–km split
PEMSMean deviation ≈ 229% Mean deviation ≈ 71%
COPERT
Results from Ispra – Milano route (Rural + Highway)
19th International Emission Inventory Conference. Emission Inventories - Informing Emerging Issues. San Antonio, TX . Sep 27-30 2010. "Emission Inventories - Informing Emerging Issues"
14g g g
RESULTS. PEMS vs. COPERT EFSPlots generated by INCERT for easy comparison of resultsPlots generated by INCERT for easy comparison of results
NOx3 PEMS
1 5
2
2.5
km
COPERT
ES
Poly. (PEMS)
0.5
1
1.5
g/k
00 20 40 60 80 100 120 140
Speed [km]
NOx emissions (1-km split)
19th International Emission Inventory Conference. Emission Inventories - Informing Emerging Issues. San Antonio, TX . Sep 27-30 2010. "Emission Inventories - Informing Emerging Issues"
15g g g
DISCUSSION. PEMS vs. COPERT EFs• Distance splits have little influence upon results• Distance splits have little influence upon results
• CO emissions: COPERT and PEMS EFs present similar trends. PEMS values up to 200% higher than COPERT, yet well below emission limits
• HC emissions remain generally low.
• Fuel consumption lower compared to the COPERT values. Modern low engine capacity Diesel vehicles not fully covered by modelengine capacity Diesel vehicles not fully covered by model.
• NOX emissions approx. 60% higher than COPERT values. This increase may be attributed to real-world (higher load) operation. Both COPERT and PEMS values lie above current emission limits
19th International Emission Inventory Conference. Emission Inventories - Informing Emerging Issues. San Antonio, TX . Sep 27-30 2010. "Emission Inventories - Informing Emerging Issues"
16g g g
CONCLUSIONS 1• Good agreement between PEMS data and ADVISOR results (esp FC)• Good agreement between PEMS data and ADVISOR results (esp. FC).
Vehicle simulation with the use of real-life data is a promising approach for the production of Emission Factors, by simulating any cycle/condition neededneeded
• Other more advanced and updated vehicle simulation models should be tested in the future like CRUISE, AUTONOMIE (ex-PSAT), ( )
19th International Emission Inventory Conference. Emission Inventories - Informing Emerging Issues. San Antonio, TX . Sep 27-30 2010. "Emission Inventories - Informing Emerging Issues"
17g g g
CONCLUSIONS 2• Good agreement between PEMS derived and COPERT EF values In the• Good agreement between PEMS –derived and COPERT EF values. In the
case of NOX, both values are well above the applicable emission limit (up to 3.8 times higher; PEMS results are worse than corresponding Euro 1 EF!)EF!)
• PEMS flags the issue of excessive NOX emissions of modern diesel vehicles when driven outside regulated test cycles
19th International Emission Inventory Conference. Emission Inventories - Informing Emerging Issues. San Antonio, TX . Sep 27-30 2010. "Emission Inventories - Informing Emerging Issues"
18g g g
GENERAL CONCLUSIONS• PEMS can characterize the emissions of regulated pollutants of light duty• PEMS can characterize the emissions of regulated pollutants of light–duty
vehicles over a full range of real-world driving states: idling, cruising, uphill & downhill roads. Still not as accurate or comprehensive as testing in permanent labspermanent labs
• PEMS measurement campaigns in Europe to date cover only a small number of vehicles; insufficient for the derivation of technology–specific EFs, ; gy p ,best used for validating existing EFs or making relative comparisons

19th International Emission Inventory Conference. Emission Inventories - Informing Emerging Issues. San Antonio, TX . Sep 27-30 2010. "Emission Inventories - Informing Emerging Issues"
19g g g
Thank you for your attentionC t t i t dil @jContact: [email protected]