Embed Size (px)
Citation preview
VALIDATION OF THE STANDARDIZED F IELD SOBRIETY TEST
BATTERY AT BACS BELOW 0.10 PERCENT
FINAL REPORT
Submitted to:U.S. DEPARTMENT OF TRANSPORTATION
NATIONAL HIGHWAY TRAFFIC SAFETY ADMINISTRATION
Jack StusterMarcelline Burns
August 1998
ANACAPA SCIENCES, INC.P.O. Box 519
Santa Barbara, California 93102

--ii--
[Blank Page]
Technical Report Documentation Page
--i i i--
1. Report No. 2. Government Accession No. 3. Recipient’s Catalog No.
DOT HS ?
4. Title and Subtitle 5. Report Date
Validation of the Standardized Field Sobriety Test Battery at August 1998BACs Below 0.10 Percent
7. Author(s) 6. Performing Organization Code: n/aJack W. Stuster, PhD, CPE, and Marcelline Burns, PhD 8. Performing Organization Report No. n/a
9. Performing Organization Name and Address 10. Work Unit No. (TRAIS)Anacapa Sciences, Inc.P.O. Box 519 11. Contract or Grant No.Santa Barbara, CA 93102 DTNH22-95-C-05192
12. Sponsoring Agency Name and Address 13. Type of Report and Period CoveredNational Highway Traffic Safety Administration Final Report400 Seventh Street, SWWashington, D.C. 20590
15. Supplemental Notes 14. Sponsoring Agency CodeJames F. Frank, PhD was the Contracting Officer’s TechnicalRepresenative (COTR) for this project.
16. Abstract
This study evaluated the accuracy of the Standardized Field Sobriety Test (SFST) Battery to assist officers inmaking arrest decisions for DWI at blood alcohol concentrations (BACs) below 0.10 percent. NHTSA’s SFST batterywas validated at 0.10 percent BAC in 1981. The trend to reduce statutory DWI limits to 0.08 percent BAC promptedthis research project.
The research was composed of several project tasks, including planning, site-selection, training, data entry, anddata analysis, in addition to the actual conduct of a major field study. The City of San Diego, California, was selectedas the site. Seven officers of the San Diego Police Department’s alcohol enforcement unit were trained in theadministration and modified scoring of NHTSA’s SFST battery (i.e., Horizontal Gaze Nystagmus-HGN, Walk and Turn,and One Leg Stand). SFST scoring was adjusted: the observation of four HGN clues indicated a BAC ≥0.08 percent(rather than four clues indicating a BAC ≥0.10 percent), and the observation of two HGN clues indicated a BAC≥0.04 percent. During routine patrols, the participating officers followed study procedures in administering SFSTsand completing a data collection form for each test administered. The officers’ final step in each case was theadministration of an evidentiary breath alcohol test.
Data analysis found the SFSTs to be extremely accurate in discriminating between BACs above and below 0.08percent. The mean estimated and measured BACs of the 297 motorists tested were 0.117 and 0.122, respectively;the difference between the means (0.005 percent BAC) is very small and operationally irrelevant. Further, analysesfound the HGN test to be the most predictive of the three components of the SFST battery (r=0.65), however ahigher correlation was obtained when the results of all three tests were combined (r=0.69).
Decision analyses found that officers’ estimates of whether a motorist’s BAC was above or below 0.08 or 0.04percent were extremely accurate. Estimates at the 0.08 level were accurate in 91 percent of the cases, or as high as94 percent if explanations for some of the false positives are accepted. Officers’ estimates of whether a motorist’sBAC was above 0.04 percent but lower than 0.08 percent were accurate in 94 percent of the decisions to arrest andin 80 percent of cases overall. Also, the officers and prosecutors who were interviewed about the SFSTs found thetest battery to be acceptable for field use to establish probable cause for DWI arrest.
The results of this study provide clear evidence of the validity of the Standardized Field Sobriety Test Battery todiscriminate at 0.08 percent BAC, using a slightly modified scoring procedure. Further, study results stronglysuggest that the SFSTs also accurately discriminate at 0.04 percent BAC.
17. Key Words 18. Distribution StatementDWI, DUI, detection, field sobriety, performance tests,alcohol, law enforcement, highway safety
19. Security Classif. (of this report) 20. Security Classif. (of this page) 21. No. of Pages 22. PriceUnclassified Unclassified

-- iv --
[Blank Page]
Final ReportValidation of the SFST Battery at BACs Below 0.10 Percent
-- v --
EXECUTIVE SUMMARY
This report documents the research activities and presents the results of astudy conducted for the National Highway Traffic Safety Administration (NHTSA)to evaluate the accuracy of the Standardized Field Sobriety Test (SFST) Battery toassist officers in making arrest decisions and to discriminate blood alcoholconcentrations (BACs) below 0.10 percent. NHTSA’s SFST battery was validated at0.10 percent BAC in 1981. The trend to reduce statutory DWI limits to 0.08 percentBAC prompted this research project.
DESCRIPTION OF THE RESEARCHThe research was composed of several project tasks, including planning, site-
selection, training, data entry, and data analysis, in addition to the actual conduct ofa major field study. The City of San Diego, California, was selected as the site of thefield study. Seven officers of the San Diego Police Department’s alcohol enforcementunit were trained in the administration and modified scoring of NHTSA’s SFSTbattery (i.e., Horizontal Gaze Nystagmus, Walk and Turn, and One Leg Stand). SFSTscoring was changed slightly: the observation of four horizontal gaze nystagmus(HGN) clues indicated a BAC ≥0.08 percent (rather than four clues indicating a BAC≥0.10 percent), and the observation of two HGN clues indicated a BAC ≥0.04 percent.During routine patrols, the participating officers followed study procedures inadministering SFSTs and completing a data collection form for each testadministered during the study period. The officers’ final step in each case was theadministration of an evidentiary breath alcohol test.
RESULTSThe participating officers completed a total of 298 data collection forms; only
one case was eliminated from analysis because the motorist refused all forms ofBAC testing. Data analysis found the SFSTs to be extremely accurate indiscriminating between BACs above and below 0.08 percent. The mean estimatedand measured BACs of the 297 motorists tested were 0.117 and 0.122, respectively;the difference between the means (0.005 percent BAC) is very small andoperationally irrelevant. Further, analyses found the HGN test to be the mostpredictive of the three components of the SFST battery (r=0.65), however a highercorrelation was obtained when the results of all three tests were combined (r=0.69).
The results of decision analyses provide clear indication of SFST accuracy.Decision analyses found that officers’ estimates of whether a motorist’s BAC wasabove or below 0.08 or 0.04 percent were extremely accurate. Estimates at the 0.08level were accurate in 91 percent of the cases, or as high as 94 percent if explanationsfor some of the false positives are accepted. Officers’ estimates of whether amotorist’s BAC was above 0.04 but under 0.08 were accurate in 94 percent of thedecisions to arrest and in 80 percent of the relevant cases, overall.
Final ReportValidation of the SFST Battery at BACs Below 0.10 Percent
-- vi --
Finally, the officers and prosecutors who were interviewed about the SFSTsfound the test battery to be fully acceptable for field use to establish probable causefor DWI arrest.
IMPLICATIONSThe results of this study provide clear evidence of the validity of the
Standardized Field Sobriety Test Battery to discriminate above or below 0.08 percentBAC, using a slightly modified scoring procedure. Further, study results stronglysuggest that the SFSTs also accurately discriminate above or below 0.04 percent BAC.
Final ReportValidation of the SFST Battery at BACs Below 0.10 Percent
-- vii --
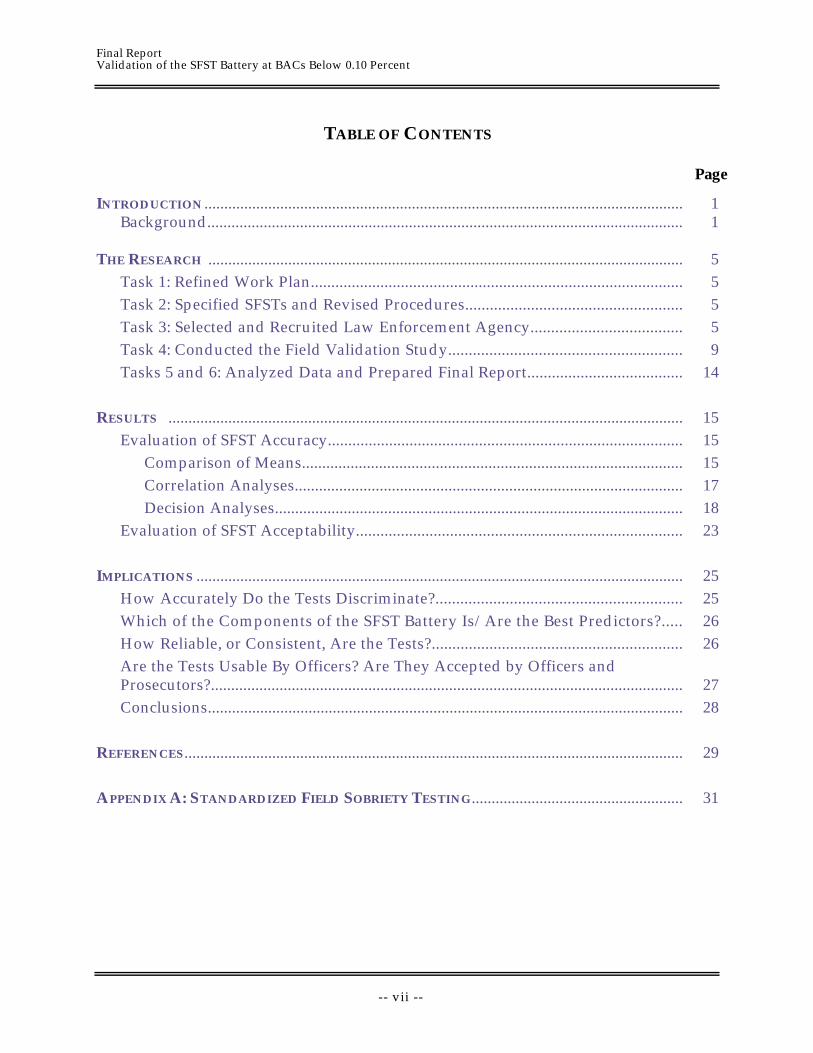
TABLE OF CONTENTS
Page
INTRODUCTION ........................................................................................................................ 1Background...................................................................................................................... 1
THE R ESEARCH ....................................................................................................................... 5
Task 1: Refined Work Plan........................................................................................... 5
Task 2: Specified SFSTs and Revised Procedures..................................................... 5
Task 3: Selected and Recruited Law Enforcement Agency..................................... 5
Task 4: Conducted the Field Validation Study......................................................... 9
Tasks 5 and 6: Analyzed Data and Prepared Final Report...................................... 14
R ESULTS ................................................................................................................................. 15
Evaluation of SFST Accuracy....................................................................................... 15
Comparison of Means.............................................................................................. 15
Correlation Analyses................................................................................................ 17
Decision Analyses..................................................................................................... 18
Evaluation of SFST Acceptability................................................................................ 23
IMPLICATIONS .......................................................................................................................... 25
How Accurately Do the Tests Discriminate?............................................................ 25
Which of the Components of the SFST Battery Is/Are the Best Predictors?..... 26
How Reliable, or Consistent, Are the Tests?............................................................. 26
Are the Tests Usable By Officers? Are They Accepted by Officers and Prosecutors?..................................................................................................................... 27
Conclusions...................................................................................................................... 28
R EFERENCES............................................................................................................................. 29
A PPENDIX A: S TANDARDIZED FIELD SOBRIETY TESTING..................................................... 31
Final ReportValidation of the SFST Battery at BACs Below 0.10 Percent
-- viii --
LIST OF TABLES
Table Page
1 COMPONENTS OF THE F IELD EXPERIMENT PLAN......................................................... 9
2 ESTIMATED AND M EASURED BAC BY A GE CATEGORY ............................................ 15
3 ESTIMATED AND M EASURED BAC BY GENDER ......................................................... 16
4 ESTIMATED AND M EASURED BAC BY DISPOSITION, A GE CATEGORY, AND GENDER 16
5 CORRELATIONS OF SFST SCORES TO ESTIMATED AND M EASURED BAC.................. 17
6 S UMMARY OF F ALSE POSITIVES .................................................................................. 19
7 S UMMARY OF F ALSE N EGATIVES ............................................................................... 20
FIGURES
Figure Page
1 Fatality rates per million miles traveled in the U.S....................................... 2
2 Sequence of major project tasks.......................................................................... 5
3 Data collection form used in the validation study......................................... 12
4 Decision matrix at 0.08 percent BAC.................................................................. 18
5 Decision matrices at 0.08 percent BAC for each component test................. 21
6 Venn diagram of 188 cases ≥ 0.08 percent BAC................................................ 22
7 Decision matrix at 0.04 percent BAC.................................................................. 23
Final ReportValidation of the SFST Battery at BACs Below 0.10 Percent
-- ix --
ACKNOWLEDGMENTS
The National Highway Traffic Safety Administration and Anacapa Sciences,Inc., are grateful to the managers and officers of the San Diego Police Department fortheir cooperation during the performance of this research project. Special thanks toOfficer Doug English, project liaison, and Sergeant Bill Snyder, supervisor of theTraffic Division’s alcohol-enforcement unit.

Final ReportValidation of the SFST Battery at BACs Below 0.10 Percent
-- x --
Final ReportValidation of the SFST Battery at BACs Below 0.10 Percent
-- 1 --
INTRODUCTION
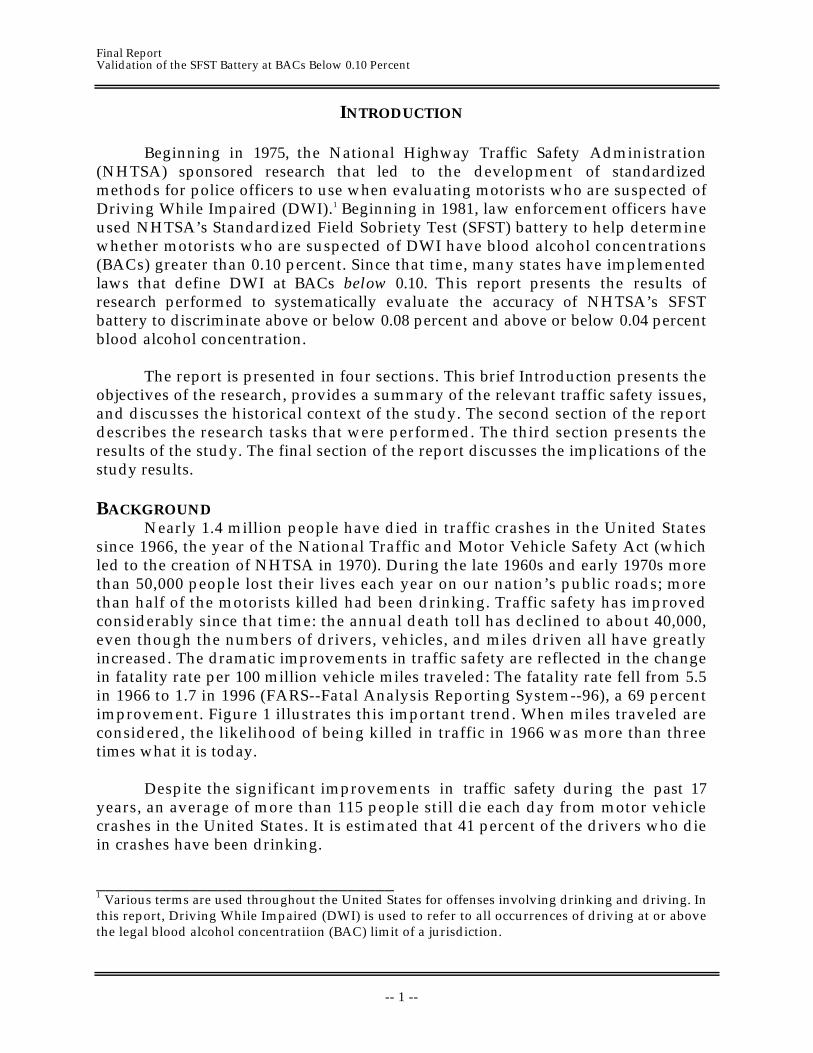
Beginning in 1975, the National Highway Traffic Safety Administration(NHTSA) sponsored research that led to the development of standardizedmethods for police officers to use when evaluating motorists who are suspected ofDriving While Impaired (DWI).1 Beginning in 1981, law enforcement officers haveused NHTSA’s Standardized Field Sobriety Test (SFST) battery to help determinewhether motorists who are suspected of DWI have blood alcohol concentrations(BACs) greater than 0.10 percent. Since that time, many states have implementedlaws that define DWI at BACs below 0.10. This report presents the results ofresearch performed to systematically evaluate the accuracy of NHTSA’s SFSTbattery to discriminate above or below 0.08 percent and above or below 0.04 percentblood alcohol concentration.
The report is presented in four sections. This brief Introduction presents theobjectives of the research, provides a summary of the relevant traffic safety issues,and discusses the historical context of the study. The second section of the reportdescribes the research tasks that were performed. The third section presents theresults of the study. The final section of the report discusses the implications of thestudy results.
BACKGROUNDNearly 1.4 million people have died in traffic crashes in the United States
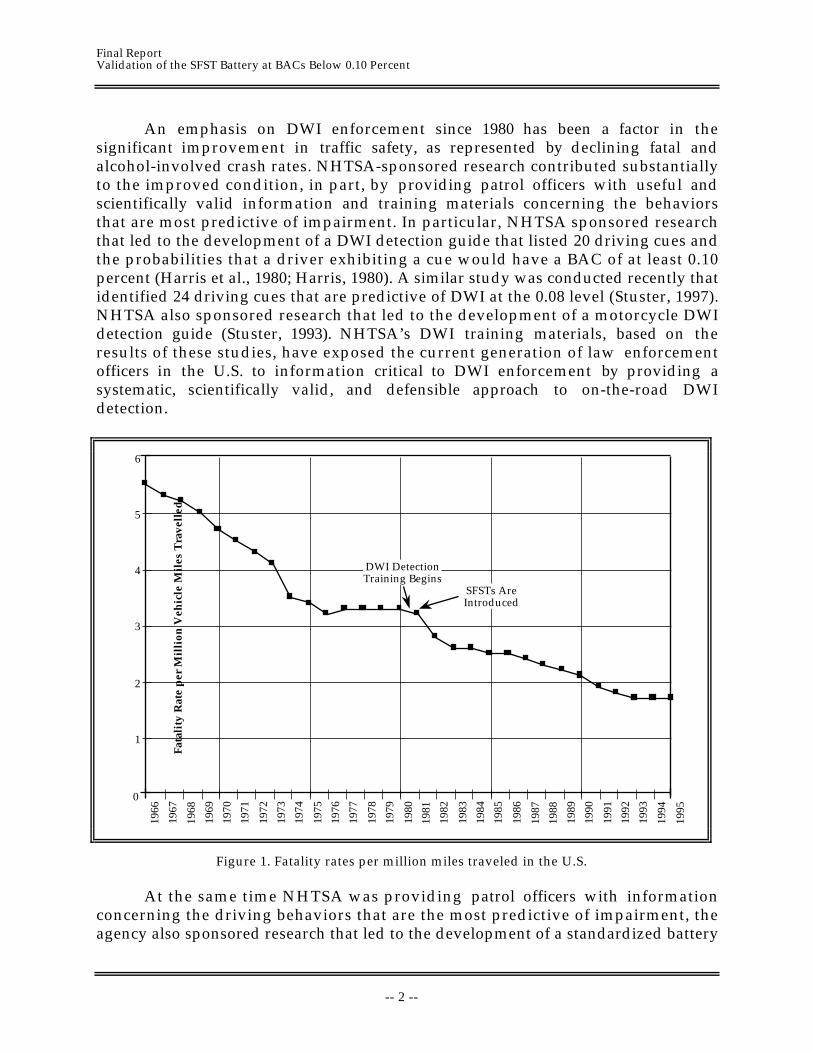
since 1966, the year of the National Traffic and Motor Vehicle Safety Act (whichled to the creation of NHTSA in 1970). During the late 1960s and early 1970s morethan 50,000 people lost their lives each year on our nation’s public roads; morethan half of the motorists killed had been drinking. Traffic safety has improvedconsiderably since that time: the annual death toll has declined to about 40,000,even though the numbers of drivers, vehicles, and miles driven all have greatlyincreased. The dramatic improvements in traffic safety are reflected in the changein fatality rate per 100 million vehicle miles traveled: The fatality rate fell from 5.5in 1966 to 1.7 in 1996 (FARS--Fatal Analysis Reporting System--96), a 69 percentimprovement. Figure 1 illustrates this important trend. When miles traveled areconsidered, the likelihood of being killed in traffic in 1966 was more than threetimes what it is today.
Despite the significant improvements in traffic safety during the past 17years, an average of more than 115 people still die each day from motor vehiclecrashes in the United States. It is estimated that 41 percent of the drivers who diein crashes have been drinking.
________________________________1 Various terms are used throughout the United States for offenses involving drinking and driving. Inthis report, Driving While Impaired (DWI) is used to refer to all occurrences of driving at or abovethe legal blood alcohol concentratiion (BAC) limit of a jurisdiction.
Final ReportValidation of the SFST Battery at BACs Below 0.10 Percent
-- 2 --
An emphasis on DWI enforcement since 1980 has been a factor in thesignificant improvement in traffic safety, as represented by declining fatal andalcohol-involved crash rates. NHTSA-sponsored research contributed substantiallyto the improved condition, in part, by providing patrol officers with useful andscientifically valid information and training materials concerning the behaviorsthat are most predictive of impairment. In particular, NHTSA sponsored researchthat led to the development of a DWI detection guide that listed 20 driving cues andthe probabilities that a driver exhibiting a cue would have a BAC of at least 0.10percent (Harris et al., 1980; Harris, 1980). A similar study was conducted recently thatidentified 24 driving cues that are predictive of DWI at the 0.08 level (Stuster, 1997).NHTSA also sponsored research that led to the development of a motorcycle DWIdetection guide (Stuster, 1993). NHTSA’s DWI training materials, based on theresults of these studies, have exposed the current generation of law enforcementofficers in the U.S. to information critical to DWI enforcement by providing asystematic, scientifically valid, and defensible approach to on-the-road DWIdetection.
0
1
2
3
4
5
6
1966
1967
1968
1969
1970
1971
1972
1973
1974
1975
1976
1977
1978
1979
1980
1981
1982
1983
1984
1985
1986
1987
1988
1989
1990
1991
1992
1993
1994
1995
Fat
alit
y R
ate
per
Mil
lio
n V
ehic
le M
iles
Tra
vel
led
DWI DetectionTraining Begins
SFSTs AreIntroduced
Figure 1. Fatality rates per million miles traveled in the U.S.
At the same time NHTSA was providing patrol officers with informationconcerning the driving behaviors that are the most predictive of impairment, theagency also sponsored research that led to the development of a standardized battery
Final ReportValidation of the SFST Battery at BACs Below 0.10 Percent
-- 3 --
of tests for officers to administer to assess driver impairment after an enforcementstop has been made. Drs. Marcelline Burns and Herbert Moskowitz conductedlaboratory evaluations of several of the tests that were most frequently-used by lawenforcement officers at the time (Burns and Moskowitz, 1977). In addition to avariety of customary roadside tests (e.g., finger-to-nose, maze tracing, backwardcounting), the researchers evaluated measures of an autonomic reaction to centralnervous system depressants, known as horizontal gaze nystagmus. Horizontal gazenystagmus (HGN) is an involuntary jerking of the eye that occurs naturally as theeyes gaze to the side. Aschan (1958) described studies that linked various forms ofnystagmus to BAC, and Wilkinson, Kime, and Purnell (1974) reported consistentchanges in horizontal gaze nystagmus with increasing doses of alcohol. At the timeBurns and Moskowitz were conducting their seminal research for NHTSA,horizontal gaze nystagmus recently had been found to reliably predict BACs in astudy conducted in Finland (Pentilla, Tenhu, and Kataja, 1974). Further, Lehti (1976)had just calculated a strong correlation between BAC and the onset of nystagmus.
All of the field sobriety tests evaluated by Burns and Moskowitz were foundto be sensitive to BAC in varying degrees, at least under laboratory conditions. Inaddition, all of the tests showed a consistent increase in correlations with increasingBACs. Statistical analyses found the horizontal gaze nystagmus test to be the mostpredictive of the individual measures. However, the combined scores of three of thetests (One-Leg Stand, Walk-and-Turn, and Horizontal Gaze Nystagmus) provided aslightly higher correlation than the horizontal gaze nystagmus test by itself. Thecombined score correctly discriminated between BACs below or above 0.10 in 83percent of the subjects tested in the original study (Burns and Moskowitz, 1977).
NHTSA immediately sponsored a subsequent study to standardize the testadministration and scoring procedures and conduct further laboratory and fieldevaluations of the new battery of three tests. The researchers found that policeofficers tended to increase their arrest rates and were more effective in estimatingthe BACs of stopped drivers after they had been trained in the administration andscoring of the Standardized Field Sobriety Test battery. The results of this importantstudy were documented in meticulous detail in the technical report, Developmentand Field Test of Psychophysical Tests for DWI Arrest (Tharp, Burns, andMoskowitz, 1981). That report has been cited throughout the U.S. to establish thescientific validity of the SFST battery and to support officers’ testimony in court.NHTSA’s SFST battery is described in Appendix A.
During the past 16 years, NHTSA’s SFSTs largely have replaced theunvalidated performance tests of unknown merit that once were the patrol officer’sonly tools in helping to make post-stop DWI arrest decisions. Regional and localpreferences for other performance tests still exist, even though some of the testshave not been validated. Despite regional differences in what tests are used to assistofficers in making DWI arrest decisions, NHTSA’s SFSTs presently are used in all 50states. NHTSA’s SFSTs have become the standard pre-arrest procedures forevaluating DWI in most law enforcement agencies.
Final ReportValidation of the SFST Battery at BACs Below 0.10 Percent
-- 4 --
The horizontal gaze nystagmus (HGN) test is considered by many lawenforcement officers to be a foolproof technique (sometimes called a “silver bullet”)that provides indisputable evidence of alcohol in a motorist’s system. The normalvariation in human physical and cognitive capabilities, and the effects of alcoholtolerance, result in uncertainties when arrest decisions are made exclusively on thebasis of performance tests. These uncertainties have resulted in large proportions ofDWI suspects being released rather than detained and transported to anotherlocation for evidentiary chemical testing. This is important because experienceddrinkers often can perform physical and cognitive tests acceptably, with a BACgreater than 0.10 percent. However, most experienced drinkers cannot conceal thephysiological effects of alcohol from an officer skilled in HGN administration. Thisis because horizontal gaze nystagmus is an involuntary reaction over which anindividual has absolutely no control.
Final ReportValidation of the SFST Battery at BACs Below 0.10 Percent
-- 5 --
THE RESEARCH
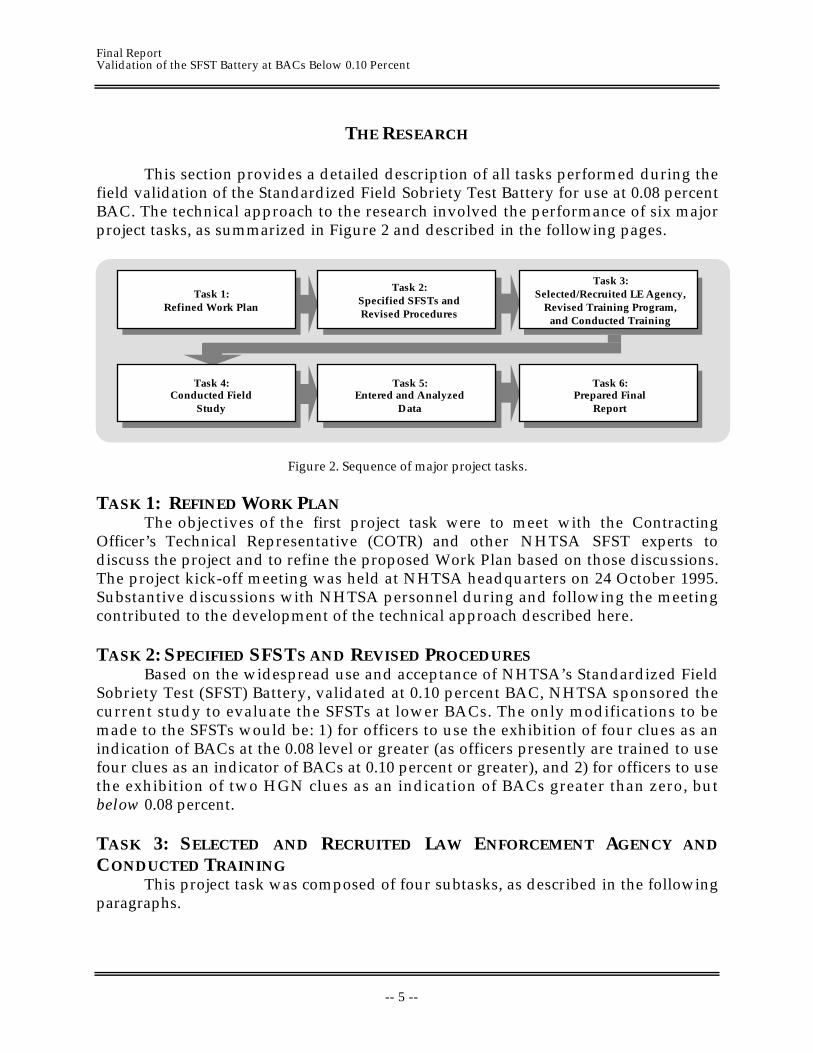
This section provides a detailed description of all tasks performed during thefield validation of the Standardized Field Sobriety Test Battery for use at 0.08 percentBAC. The technical approach to the research involved the performance of six majorproject tasks, as summarized in Figure 2 and described in the following pages.
Task 1:Refined Work Plan
Task 2:Specified SFSTs andRevised Procedures
Task 5:Entered and Analyzed
Data
Task 6:Prepared Final
Report
Task 3:Selected/Recruited LE Agency,
Revised Training Program,and Conducted Training
Task 4:Conducted Field
Study
Figure 2. Sequence of major project tasks.
TASK 1: REFINED WORK PLANThe objectives of the first project task were to meet with the Contracting
Officer’s Technical Representative (COTR) and other NHTSA SFST experts todiscuss the project and to refine the proposed Work Plan based on those discussions.The project kick-off meeting was held at NHTSA headquarters on 24 October 1995.Substantive discussions with NHTSA personnel during and following the meetingcontributed to the development of the technical approach described here.
TASK 2: SPECIFIED SFSTS AND REVISED PROCEDURESBased on the widespread use and acceptance of NHTSA’s Standardized Field
Sobriety Test (SFST) Battery, validated at 0.10 percent BAC, NHTSA sponsored thecurrent study to evaluate the SFSTs at lower BACs. The only modifications to bemade to the SFSTs would be: 1) for officers to use the exhibition of four clues as anindication of BACs at the 0.08 level or greater (as officers presently are trained to usefour clues as an indicator of BACs at 0.10 percent or greater), and 2) for officers to usethe exhibition of two HGN clues as an indication of BACs greater than zero, butbelow 0.08 percent.
TASK 3: SELECTED AND RECRUITED LAW ENFORCEMENT AGENCY AND
CONDUCTED TRAININGThis project task was composed of four subtasks, as described in the following
paragraphs.
Final ReportValidation of the SFST Battery at BACs Below 0.10 Percent
-- 6 --
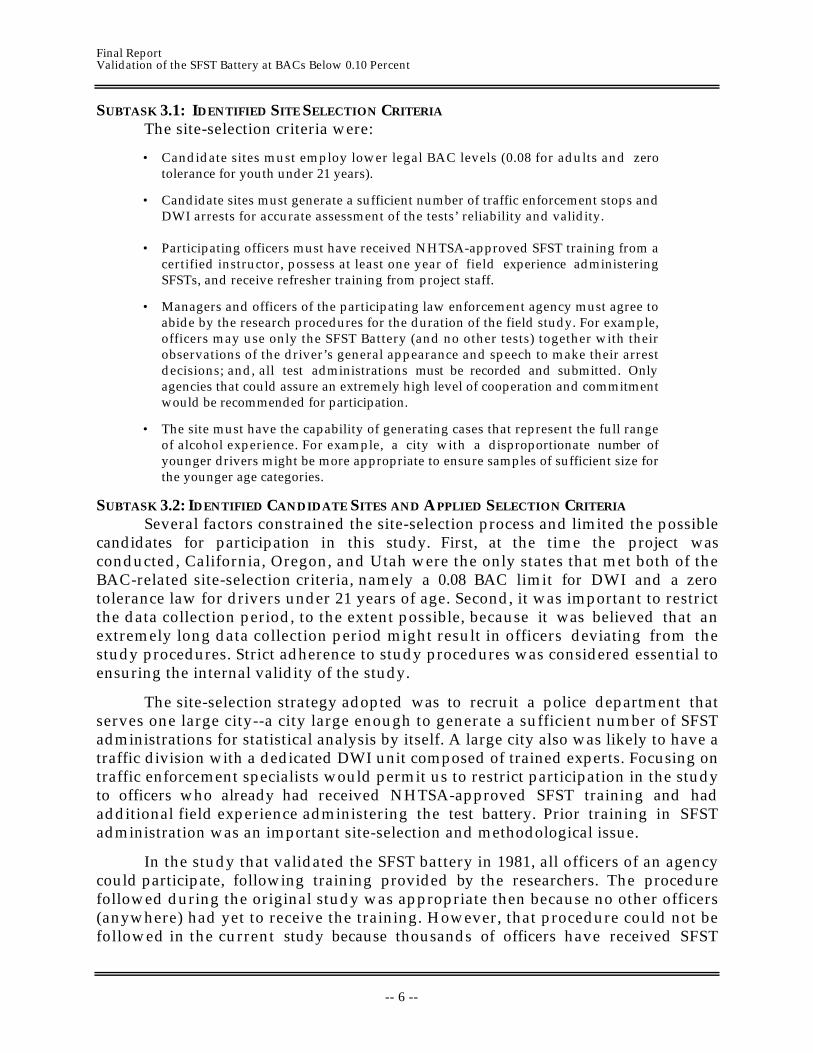
SUBTASK 3.1: IDENTIFIED SITE SELECTION CRITERIA
The site-selection criteria were:
• Candidate sites must employ lower legal BAC levels (0.08 for adults and zerotolerance for youth under 21 years).
• Candidate sites must generate a sufficient number of traffic enforcement stops andDWI arrests for accurate assessment of the tests’ reliability and validity.
• Participating officers must have received NHTSA-approved SFST training from acertified instructor, possess at least one year of field experience administeringSFSTs, and receive refresher training from project staff.
• Managers and officers of the participating law enforcement agency must agree toabide by the research procedures for the duration of the field study. For example,officers may use only the SFST Battery (and no other tests) together with theirobservations of the driver’s general appearance and speech to make their arrestdecisions; and, all test administrations must be recorded and submitted. Onlyagencies that could assure an extremely high level of cooperation and commitmentwould be recommended for participation.
• The site must have the capability of generating cases that represent the full rangeof alcohol experience. For example, a city with a disproportionate number ofyounger drivers might be more appropriate to ensure samples of sufficient size forthe younger age categories.
SUBTASK 3.2: IDENTIFIED CANDIDATE SITES AND APPLIED SELECTION CRITERIA
Several factors constrained the site-selection process and limited the possiblecandidates for participation in this study. First, at the time the project wasconducted, California, Oregon, and Utah were the only states that met both of theBAC-related site-selection criteria, namely a 0.08 BAC limit for DWI and a zerotolerance law for drivers under 21 years of age. Second, it was important to restrictthe data collection period, to the extent possible, because it was believed that anextremely long data collection period might result in officers deviating from thestudy procedures. Strict adherence to study procedures was considered essential toensuring the internal validity of the study.
The site-selection strategy adopted was to recruit a police department thatserves one large city--a city large enough to generate a sufficient number of SFSTadministrations for statistical analysis by itself. A large city also was likely to have atraffic division with a dedicated DWI unit composed of trained experts. Focusing ontraffic enforcement specialists would permit us to restrict participation in the studyto officers who already had received NHTSA-approved SFST training and hadadditional field experience administering the test battery. Prior training in SFSTadministration was an important site-selection and methodological issue.
In the study that validated the SFST battery in 1981, all officers of an agencycould participate, following training provided by the researchers. The procedurefollowed during the original study was appropriate then because no other officers(anywhere) had yet to receive the training. However, that procedure could not befollowed in the current study because thousands of officers have received SFST
Final ReportValidation of the SFST Battery at BACs Below 0.10 Percent
-- 7 --
training since 1981. Only trained and experienced test administrators could bepermitted to participate in the current study to avoid confounding study resultswith the effects of substantially different officer skill and experience levels in SFSTadministration and scoring. Officers who are formally trained and experienced inSFST administration tend to be concentrated in traffic enforcement and special DWIunits.
This site-selection strategy was judged to provide the best approach to achievethe objectives of the current study, and the City of San Diego, California, wasidentified as the leading candidate community when the site-selection criteria wereapplied. The San Diego Police Department serves a resident population of morethan one million, with a much larger service population attributable to tourism andseveral local military installations. The manner in which the San Diego PoliceDepartment satisfied the site-selection criteria is outlined below.
Number of SFST AdministrationsThe San Diego Police Department maintains a traffic division composed of 50
officers, including ten officers and a sergeant who form the alcohol enforcementunit. The alcohol enforcement unit deploys four or five officers on each night,Wednesday through Sunday. The time necessary to complete the associatedpaperwork usually limits each officer to a maximum of two DWI arrests each night.This results in about 130 arrests by officers of the special unit during a four weekperiod. The other members of the traffic division, combined, make an additional 130DWI arrests each month. San Diego Police Department officers do not hesitate toarrest drivers for BACs below 0.08 percent if they exhibit any evidence ofimpairment, even though low-BAC arrests usually are not prosecuted by the localdistrict attorney.
Demographic ConsiderationsThe Work Plan discussed the importance of selecting a site that offers cases
for analysis that represent the full range of driver ages and BACs of interest. It wasbelieved that a younger, rather than an older, driver population would result inmore cases of zero tolerance violations and more SFST administrations overall. Inthis regard, San Diego and the surrounding area is home to four major US Navybases and both the Navy and Marine Corps training centers. The area also is hometo three major universities and several smaller colleges and technical schools.
Willingness to ParticipateNaturally, formal approval by senior managers is required before any law
enforcement agency can participate in a traffic safety study. Further, a manager’spersonal interest in a study that results in command emphasis concerningparticipation greatly contributes to the success of a project because of the quasi-military organizational structure of law enforcement agencies. That is, if managersbelieve participation to be of value to an agency they will direct their officers tofollow the study procedures. In this regard, the commanding officer and othersenior managers of the San Diego Police Department expressed their considerableinterest in the study and directed their personnel to cooperate with the study team.
Final ReportValidation of the SFST Battery at BACs Below 0.10 Percent
-- 8 --
Command emphasis is an important component to ensure adherence tostudy procedures, but it is not sufficient; the participating officers also must becommitted to the study. The willingness of a law enforcement agency to participatein a traffic safety study also can be measured, although subjectively, by the attitudesof field officers when discussing the general and specific issues involved in thestudy. The officers of the San Diego Police Department with whom we spoke aboutthe field validation expressed genuine interest in the study and eagerness to beselected for participation.
Finally, the requirement for an agency to modify its established procedures toaccommodate special study procedures usually is somewhat negotiable in a trafficsafety study, but deviations from established study procedures were not negotiablein this field validation. It was explained that police managers and all participatingofficers must agree to abide by the study procedures to ensure the internal validity ofstudy results. This was an area for concern to the project team because the San DiegoPolice Department’s established DWI procedures included administering three fieldsobriety tests in addition to the three NHTSA SFSTs. A firm study requirement wasthat no other tests be administered to subjects because they might influence anofficer’s BAC estimates; that is, all officer-estimates of BAC must be basedexclusively on results of the NHTSA SFST battery using the slightly modifiedscoring system. In this regard, San Diego police managers inquired with their districtattorney and DWI supervisors, those who might object to the restriction, and foundno opposition. In fact, it was mentioned that restricting sobriety testing to the threeSFSTs would help streamline the procedures for everyone.
Prior SFST TrainingAll members of the San Diego Police Department’s special alcohol-enforce-
ment unit previously had received SFST training that was administered accordingto NHTSA-approved procedures and curriculum by certified DWI instructors.Although approximately half of the other members of the Traffic Division also hadreceived SFST training, it was determined that the alcohol-enforcement unit wouldgenerate a sufficient number of SFST administrations for statistical analysis. All ofthe participating officers would receive a four-hour refresher training course priorto beginning the field study.
SUBTASK 3.3: RECRUITED LAW ENFORCEMENT AGENCY TO PARTICIPATE IN THE STUDY
NHTSA reviewed the site recommendations and approved San Diego as thesite for the field study. Further discussions were held with managers and officers ofthe San Diego Police Department and a Memorandum of Agreement was signedthat specified all study procedures and requirements.
SUBTASK 3.4: DEVELOPED SFST TRAINING PROGRAM
The experimental requirement that all participating officers be both trainedand experienced in SFST administration eliminated the need to develop a specialtraining program for this study. It was considered essential that the existing,NHTSA-approved SFST training program remain the training standard for the fieldevaluation. Because all participating officers already had received NHTSA-approved
Final ReportValidation of the SFST Battery at BACs Below 0.10 Percent
-- 9 --
SFST training, only a refresher program would be required. A four-hour refresher-training program was developed, based on the (October 1995) NHTSA curriculum.The purposes of the refresher training were to instruct the officers concerning themodified scoring system and obtain confirmation that all participants wereadministering and scoring the SFST battery correctly before beginning the fieldstudy.
TASK 4: CONDUCTED THE FIELD VALIDATION STUDYSystematic evaluation of the SFSTs to assist officers in making arrest
decisions at BACs below 0.10 percent, under field conditions, was the ultimateobjective of this research. Although existing tests were the subject of the evaluation,the reasons for conducting the field study were the same as if the tests previouslyhad not been validated. First, it was necessary to determine the accuracy of themodifications to test scoring, compared to actual BAC levels measured throughother means. For cases in which the driver was arrested for DWI, correspondencewould be assessed between scored performance on the SFSTs and BAC, asdetermined by breath test (blood and urine tests were discouraged but used ifsubjects refused to comply with breath testing). For cases in which a subject wasadministered SFSTs but then released on the basis of low estimated BAC, hand-heldbreath testing devices were used to establish actual BAC. The second purpose of theevaluation was to identify problems with test application in the field, which mightinclude test administration, scoring procedures, or other factors that might affect theuse of the tests by law enforcement personnel. Third, the courts’ acceptance ofevidence gathered using the slightly revised scoring procedures in the fieldevaluation would be assessed.
SUBTASK 4.1: PREPARED FIELD EXPERIMENT PLAN
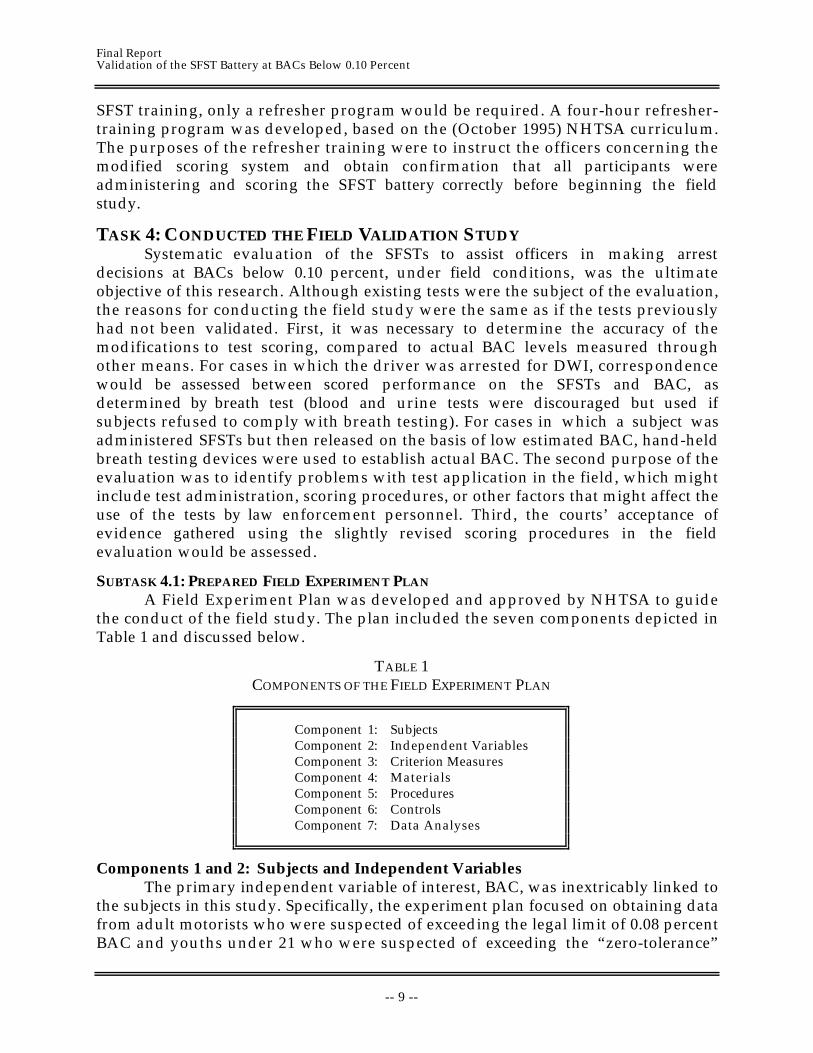
A Field Experiment Plan was developed and approved by NHTSA to guidethe conduct of the field study. The plan included the seven components depicted inTable 1 and discussed below.
TABLE 1COMPONENTS OF THE FIELD EXPERIMENT PLAN
Component 1: SubjectsComponent 2: Independent VariablesComponent 3: Criterion MeasuresComponent 4: MaterialsComponent 5: ProceduresComponent 6: ControlsComponent 7: Data Analyses
Components 1 and 2: Subjects and Independent VariablesThe primary independent variable of interest, BAC, was inextricably linked to
the subjects in this study. Specifically, the experiment plan focused on obtaining datafrom adult motorists who were suspected of exceeding the legal limit of 0.08 percentBAC and youths under 21 who were suspected of exceeding the “zero-tolerance”
Final ReportValidation of the SFST Battery at BACs Below 0.10 Percent
-- 10 --
legal limit of 0.00. The accuracy of the SFSTs to discriminate at 0.08 and 0.04 percentBAC could not be assessed without data from individuals who had BACs over andunder these values. Therefore, it was important to obtain BAC estimates fromindividuals who had both passed and failed the standardized field sobriety tests.
Component 3: Criterion MeasuresThe only appropriate criterion measure to assess the accuracy of SFSTs is
BAC. Measures of impairment are irrelevant because performance of the SFSTsmust be correlated with BAC level, rather than driving performance. BAC providesan objective and reliable measure that states have recognized as presumptiveand/or per se evidence of impairment, depending on the statute. To obtain thesecriterion measures, it was determined that all drivers who were administered theSFST Battery must be tested for BAC, regardless of the results of the SFSTs. In otherwords, it would be essential to test the individuals who were judged to have BACsbelow the relevant statutory level and who subsequently would be released.Participating officers were instructed concerning the importance of obtaining BACdata for all subjects, in order to calculate the accuracy of the tests.
All police officers participating in the study were equipped with NHTSA-approved, portable breath testing devices to assess the BACs of all drivers who wereadministered the SFSTs, including those who were released without arrest. Further,arrested subjects were tested both in the field with a portable device and at thebooking site. The use of passive alcohol sensors (PAS) during the study was notpermitted.
Component 4: MaterialsOnly the existing SFSTs were to be administered, which require no
equipment. A pen, pencil, or small flash light frequently are used by officers as astimulus or target for the HGN test, but a finger can be used with equal effectiveness.
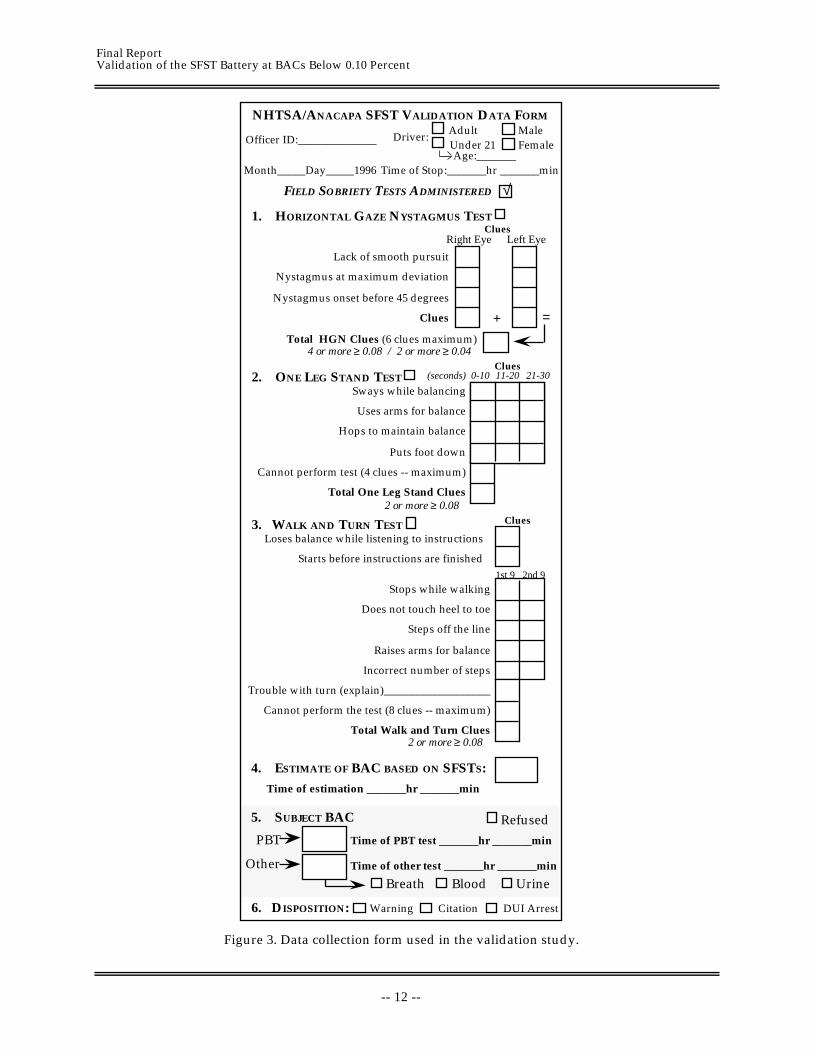
The data collection form used in the study is presented as Figure 3. The datacollection form was extremely important in this study for several reasons. As is thecase in most field studies, the form must be as simple to complete as possible tominimize the workload of participating officers. In the present case, it also wasimportant for the form to be designed to guide the officer in the administration ofthe SFSTs, to facilitate standardization and systematic scoring of the tests. Inaddition, the form designed for this study had to both encourage and provideassurances that officers had followed the study procedures. Most important, it wasessential that officers would conduct a breath test and record actual subject BAC asthe final step of the process; that is, actual BACs were to be entered on the form onlyafter BAC estimates based on SFST performance had been recorded. Hand-heldbreath testing devices with digital displays were used for this purpose.
Component 5: ProceduresThe sixth component of the field experiment plan was the specification of
procedures to be used for administering the tests and obtaining independentmeasures of BAC. The procedures to be followed by participating officers were listed
Final ReportValidation of the SFST Battery at BACs Below 0.10 Percent
-- 11 --
as a series of six numbered steps on the data collection form that was used in thefield study. The study procedures were to be followed whenever a participatingofficer suspected an adult driver of being alcohol impaired or a youth under 21 ofhaving a BAC greater than zero. In practice, officers administered the SFSTs to allmotorists who exhibited any objective behavior or other cue associated with havingconsumed alcohol, even if impairment was not evident. A breath, blood, or urinetest was administered to all motorists who performed the SFSTs, but only after theofficer had made an arrest/no arrest decision based on the officer’s scoring of thedriver’s SFST performance, and recorded a BAC estimate. The data collection formstructured the procedure by presenting all officer actions as a series of numberedsteps. Requiring officers to record the time of BAC estimates and BAC tests ensuredthat officers’ estimates were not influenced by the results of the chemical tests.Completed data collection forms were sent to Anacapa Sciences on a weekly basis fordata entry.
In some states, such as California, officers have the right to administer abreath test to a driver who has exhibited any objective sign of alcohol-consumption.Compliance is mandatory if the officer can articulate a reasonable suspicion of themotorist having consumed alcohol (such as the odor of an alcoholic beverage).SFSTs were administered only to drivers who exhibited some objective DWI cue,thus, no problems were experienced in obtaining BAC data, even from subjectswhose SFST performance was acceptable. The field breath test was conducted as thefinal step after the SFST procedure was completed, which is the de facto procedurefollowed by most officers who are equipped with field breath testing devices.
To further ensure compliance with study procedures, the participating lawenforcement officers signed a statement affirming that they would abide by theestablished study procedures. In addition, project staff monitored the data collectioneffort, periodically riding along with participating officers to ensure that studyprocedures were being followed.
Component 6: ControlsExtraneous variables that could affect the outcome of the study must be
controlled to the extent possible. The controls that were implemented to ensure thevalidity of study results have been discussed in this section, including systematicprocedures and the use of only trained and experienced officers.
Component 7: Data AnalysesThe data analysis plan was designed to answer the following research
questions.
• How accurately do the tests discriminate between subjects who are above or below0.08 and 0.04 percent BACs?
• Which of the components of the SFST battery is/are the best predictor(s) of BAC?
• How reliable, or consistent, are the tests?
• Are the tests usable by police officers? Are they readily accepted by officers andprosecutors?
Final ReportValidation of the SFST Battery at BACs Below 0.10 Percent
-- 12 --
NHTSA/ANACAPA SFST VALIDATION DATA FORM
FIELD SOBRIETY TESTS ADMINISTERED
Officer ID:______________
Month_____Day_____1996
6. DISPOSITION: Warning DUI ArrestCitation
4. ESTIMATE OF BAC BASED ON SFSTS:
Time of estimation _______hr _______min
5. SUBJECT BAC Refused
BloodBreath Urine
PBT Time of PBT test _______hr _______min
√
Driver:AdultUnder 21
MaleFemale
2 or more ≥ 0.08
Stops while walking
Does not touch heel to toe
Steps off the line
Raises arms for balance
Incorrect number of steps
Trouble with turn (explain)___________________
Cannot perform the test (8 clues -- maximum)
Total Walk and Turn Clues
3. WALK AND TURN TEST Clues
1st 9 2nd 9
Loses balance while listening to instructions
Starts before instructions are finished
Sways while balancing
Uses arms for balance
Hops to maintain balance
Puts foot down
Cannot perform test (4 clues -- maximum)
Total One Leg Stand Clues2 or more ≥ 0.08
Clues0-10 21-3011-20(seconds)2. ONE LEG STAND TEST
4 or more ≥ 0.08 / 2 or more ≥ 0.04Total HGN Clues (6 clues maximum)
Lack of smooth pursuit
Nystagmus at maximum deviation
Nystagmus onset before 45 degrees
Clues
1. HORIZONTAL GAZE NYSTAGMUS TEST
Right Eye Left Eye
+ =
Clues
Age:_______Time of Stop:_______hr _______min
Other Time of other test _______hr _______min
Figure 3. Data collection form used in the validation study.
Final ReportValidation of the SFST Battery at BACs Below 0.10 Percent
-- 13 --
SUBTASK 4.2. TRAINED OFFICERS IN THE USE OF THE SFSTS
Dr. Marcelline Burns, one of the investigators who developed the SFSTbattery, developed and conducted the refresher training for the participatingofficers. Dr. Burns’ research and training experience in this field ensured thatofficers received effective and credible refresher instruction. Dr. Burns was assistedin the training session by the project director and NHTSA COTR.
SUBTASK 4.3. IMPLEMENTED EXPERIMENTAL DESIGN AND COLLECTED DATA
Implementation of the experiment design began immediately following thecompletion of officer refresher training on 23 May 1996 and continued through 9November. Specific study procedures were:
• Only officers who were members of the San Diego Police Department’s alcohol-enforcement unit and who received NHTSA-approved SFST training participateddirectly in the study. Dr. Marcelline Burns provided brief “refresher” training to allparticipating officers to ensure a consistent and systematic approach to SFSTadministration during the study.
• Upon commencement of the study period, participating officers used only the SFSTBattery (i.e., Horizontal Gaze Nystagmus, Walk and Turn, One Leg Stand) togetherwith their observations of a driver’s general appearance and speech, to establishinferences about a subject for whom there was reasonable suspicion of driving whileimpaired. In other words, no tests other than the three SFSTs were performed.
• Participating officers performed the administration steps in the sequence specified onthe data collection form; that is, they,
1. Administered the Horizontal Gaze Nystagmus test and recorded results.
2. Administered the One Leg Stand test and recorded results.
3. Administered the Walk and Turn test and recorded results.
4. Used the scoring systems that were printed on the data collection form (bycounting test “clues”) to estimate the subject’s BAC. Recorded their estimate ofthe subject’s BAC based on SFST performance, together with their observations ofthe subject’s general appearance and speech. Also, they recorded the time whentheir estimate was made.
5. Checked the box that indicated the disposition of the stop: Warning, Citation, orArrest.
6. Recorded the subject’s BAC obtained from a field breath test; or, checked theappropriate box for other tests or responses. Blood and urine test results wereprovided later; every effort was made to obtain a breath test result for al lsubjects. Recorded the time when the BAC test was performed.
• Obtained a BAC for all subjects who were administered SFSTs as the final step in thetest administration procedure. BACs were obtained for all subjects tested includingthose subjects who officers estimated, on the basis of SFST results, to have BACsbelow the legal limit.
• Participating officers completed and submited a data collection form for each subjecttested during the study period; that is, all administrations of the SFST battery by
Final ReportValidation of the SFST Battery at BACs Below 0.10 Percent
-- 14 --
participating officers were recorded on a data collection form and submitted foranalysis.
• All completed data collection forms were sent to Anacapa Sciences, Inc., for dataentry and analysis.
SUBTASK 4.4 CONDUCTED COURT AND POLICE INTERVIEWS
The final data collection task was the conduct of open-ended interviews withparticipating police officers and prosecutors who were exposed to the new SFSTsduring DWI cases. The purposes of the interviews were to determine if the testswere acceptable to the officers for use in the field and to the prosecutors for use oftest results in court.
TASKS 5 AND 6: ANALYZED DATA AND PREPARED FINAL REPORTAll data collection forms were returned to Anacapa Sciences, Inc., sequentially
numbered, and the contents entered into a computerized data base. Data analyseswere performed by the project director and Dr. Marcelline Burns. The results ofthose analyses are presented in the following section of this report.
Final ReportValidation of the SFST Battery at BACs Below 0.10 Percent
-- 15 --
RESULTS
This study was conducted to evaluate the accuracy of NHTSA’s StandardizedField Sobriety Test Battery in assisting officers to make arrest decisions at BACsabove and below 0.08 percent under field conditions. A secondary objective of thestudy was to evaluate the possibility that the test battery also could be used to assistofficers in making arrest decisions at BACs lower than 0.08 percent.
The seven participating officers from the San Diego Police Department’salcohol-enforcement unit completed a total of 298 data collection forms during thestudy period; only one case was eliminated from analysis because the subject refusedto submit to any form of BAC testing. Officer compliance with study procedures andmotivation to participate in the study remained high throughout the data collectionperiod.
EVALUATION OF SFST ACCURACYThree methods were used to evaluate the accuracy of the SFST battery to
discriminate at the BACs of interest: comparison of means, correlation analyses, anddecision analyses.
COMPARISON OF MEANS
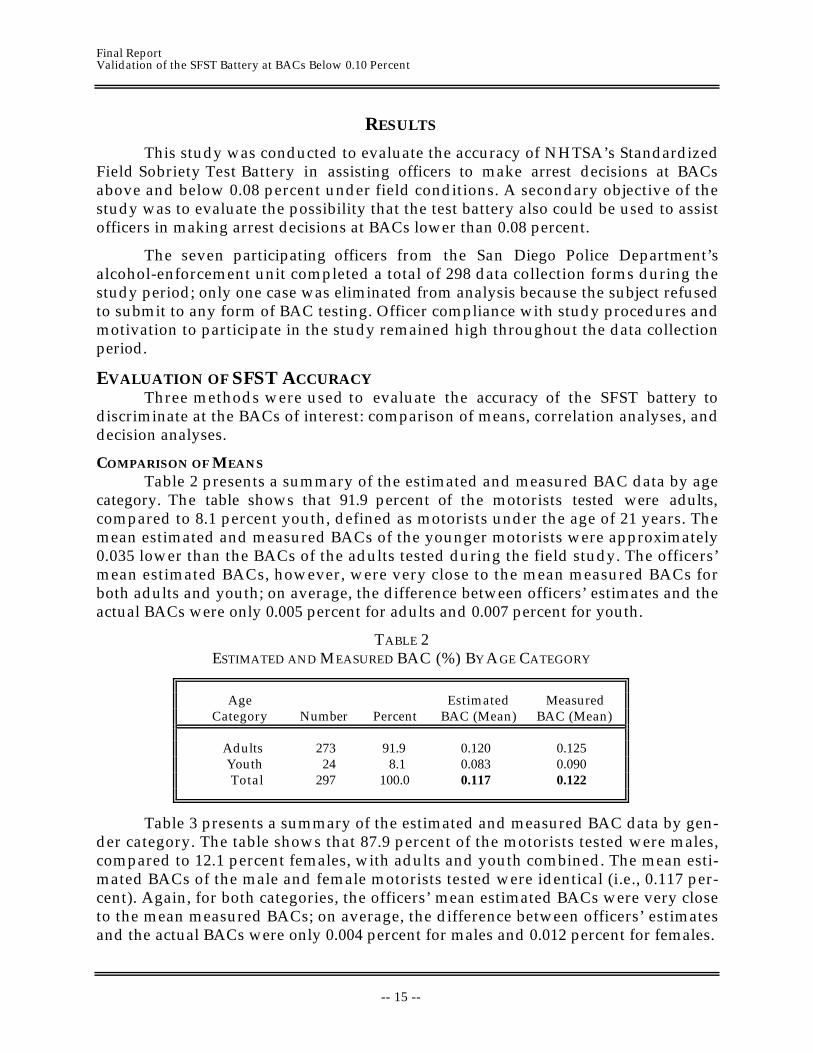
Table 2 presents a summary of the estimated and measured BAC data by agecategory. The table shows that 91.9 percent of the motorists tested were adults,compared to 8.1 percent youth, defined as motorists under the age of 21 years. Themean estimated and measured BACs of the younger motorists were approximately0.035 lower than the BACs of the adults tested during the field study. The officers’mean estimated BACs, however, were very close to the mean measured BACs forboth adults and youth; on average, the difference between officers’ estimates and theactual BACs were only 0.005 percent for adults and 0.007 percent for youth.
TABLE 2ESTIMATED AND MEASURED BAC (%) BY AGE CATEGORY
Age Estimated MeasuredCategory Number Percent BAC (Mean) BAC (Mean)
Adults 273 91.9 0.120 0.125Youth 24 8.1 0.083 0.090Total 297 100.0 0.117 0.122
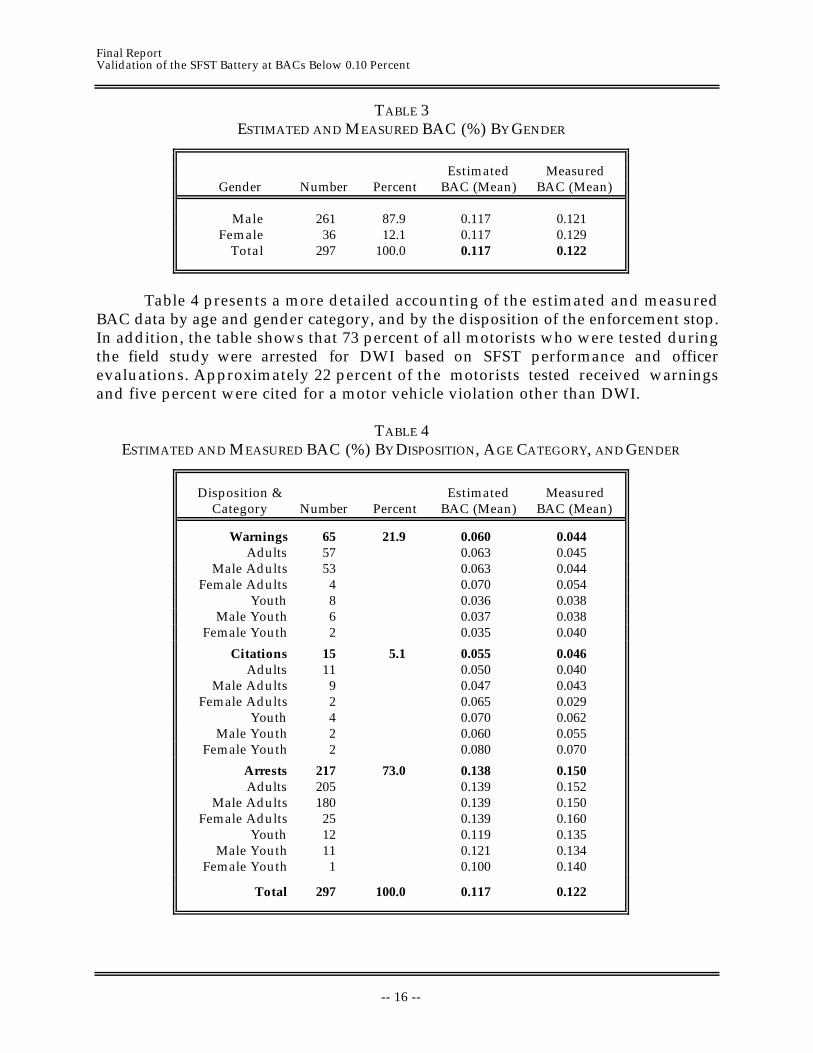
Table 3 presents a summary of the estimated and measured BAC data by gen-der category. The table shows that 87.9 percent of the motorists tested were males,compared to 12.1 percent females, with adults and youth combined. The mean esti-mated BACs of the male and female motorists tested were identical (i.e., 0.117 per-cent). Again, for both categories, the officers’ mean estimated BACs were very closeto the mean measured BACs; on average, the difference between officers’ estimatesand the actual BACs were only 0.004 percent for males and 0.012 percent for females.
Final ReportValidation of the SFST Battery at BACs Below 0.10 Percent
-- 16 --
TABLE 3ESTIMATED AND MEASURED BAC (%) BY GENDER
Estimated MeasuredGender Number Percent BAC (Mean) BAC (Mean)
Male 261 87.9 0.117 0.121Female 36 12.1 0.117 0.129
Total 297 100.0 0.117 0.122
Table 4 presents a more detailed accounting of the estimated and measuredBAC data by age and gender category, and by the disposition of the enforcement stop.In addition, the table shows that 73 percent of all motorists who were tested duringthe field study were arrested for DWI based on SFST performance and officerevaluations. Approximately 22 percent of the motorists tested received warningsand five percent were cited for a motor vehicle violation other than DWI.
TABLE 4ESTIMATED AND MEASURED BAC (%) BY DISPOSITION, AGE CATEGORY, AND GENDER
Disposition & Estimated MeasuredCategory Number Percent BAC (Mean) BAC (Mean)
Warnings 65 21.9 0.060 0.044Adults 57 0.063 0.045
Male Adults 53 0.063 0.044Female Adults 4 0.070 0.054
Youth 8 0.036 0.038Male Youth 6 0.037 0.038
Female Youth 2 0.035 0.040
Citations 15 5.1 0.055 0.046Adults 11 0.050 0.040
Male Adults 9 0.047 0.043Female Adults 2 0.065 0.029
Youth 4 0.070 0.062Male Youth 2 0.060 0.055
Female Youth 2 0.080 0.070
Arrests 217 73.0 0.138 0.150Adults 205 0.139 0.152
Male Adults 180 0.139 0.150Female Adults 25 0.139 0.160
Youth 12 0.119 0.135Male Youth 11 0.121 0.134
Female Youth 1 0.100 0.140
Total 297 100.0 0.117 0.122
Final ReportValidation of the SFST Battery at BACs Below 0.10 Percent
-- 17 --
The data presented in Table 4 also show that officers tended to slightly over-estimate the BACs of motorists who had lower BACs, and slightly under-estimateBACs at the higher levels. Overall, however, officers’ estimates were extremelyaccurate. Based on SFST results and officers’ observations, the officers’ meanestimated BAC of the 297 motorists was 0.117 percent, compared to the meanmeasured BAC of 0.122. Although statistically significant, the difference of 0.005percent BAC is a trivial and operationally irrelevant under-estimate of actual BACsthat is within the margin of error of sophisticated evidentiary testing equipment.
CORRELATION ANALYSES
The accuracy of the SFSTs was further evaluated by conducting a series ofcorrelation analyses to identify the degree to which officers’ individual estimates ofBAC corresponded with subjects’ actual, or measured, BAC. A correlation coefficientis a statistic, usually represented as r, that expresses the relatedness of two variables,that is, the degree to which the variables co-vary. In this case, the two variables werean officer’s estimate and the subject’s actual BAC. The Pearson product-momentcorrelation method was used to calculate the relationship between these variables;cases with complete SFST results (n=261) were used in this analysis.
If officers had predicted the precise BACs of all subjects (to three decimalpoints), the correlation coefficient would be +1.00; the correlation coefficient wouldbe zero if there were no relationship between the estimated and actual BACs. Forpredictive measures, especially those administered under field conditions, acorrelation of 0.65 to 0.70 is considered to be very high.
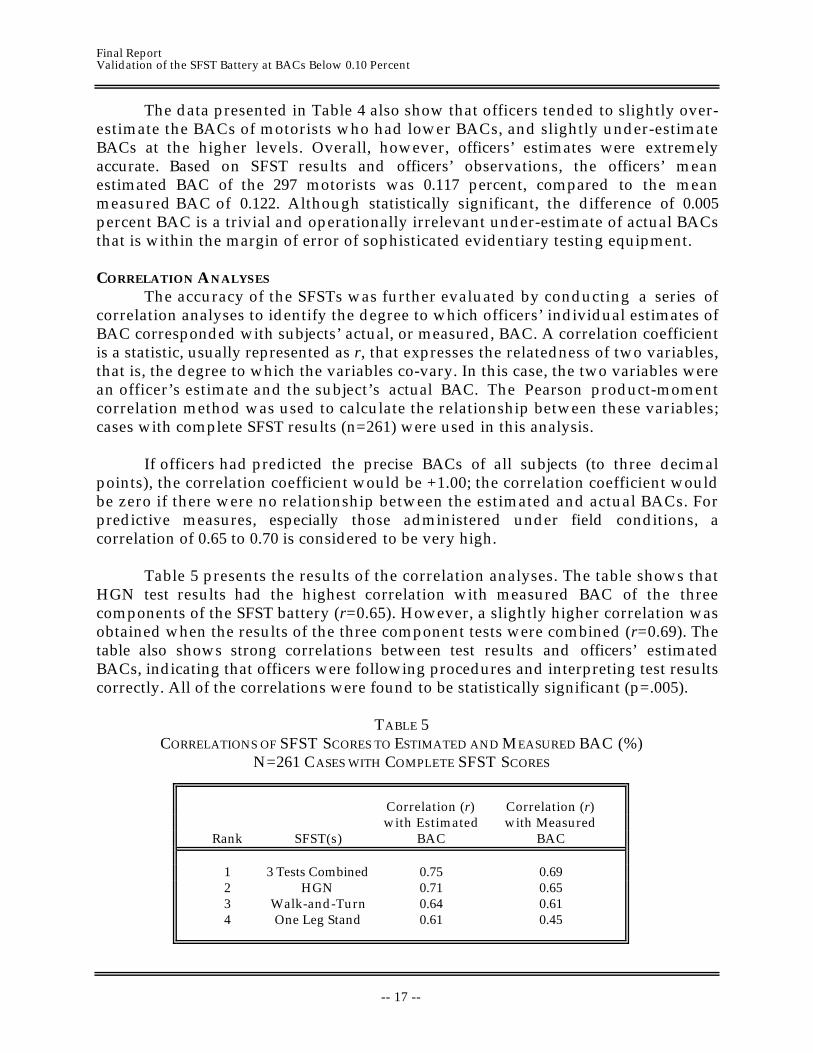
Table 5 presents the results of the correlation analyses. The table shows thatHGN test results had the highest correlation with measured BAC of the threecomponents of the SFST battery (r=0.65). However, a slightly higher correlation wasobtained when the results of the three component tests were combined (r=0.69). Thetable also shows strong correlations between test results and officers’ estimatedBACs, indicating that officers were following procedures and interpreting test resultscorrectly. All of the correlations were found to be statistically significant (p=.005).
TABLE 5CORRELATIONS OF SFST SCORES TO ESTIMATED AND MEASURED BAC (%)
N=261 CASES WITH COMPLETE SFST SCORES
Correlation (r) Correlation (r)with Estimated with Measured
Rank SFST(s) BAC BAC
1 3 Tests Combined 0.75 0.692 HGN 0.71 0.653 Walk-and-Turn 0.64 0.614 One Leg Stand 0.61 0.45
Final ReportValidation of the SFST Battery at BACs Below 0.10 Percent
-- 18 --
DECISION ANALYSES
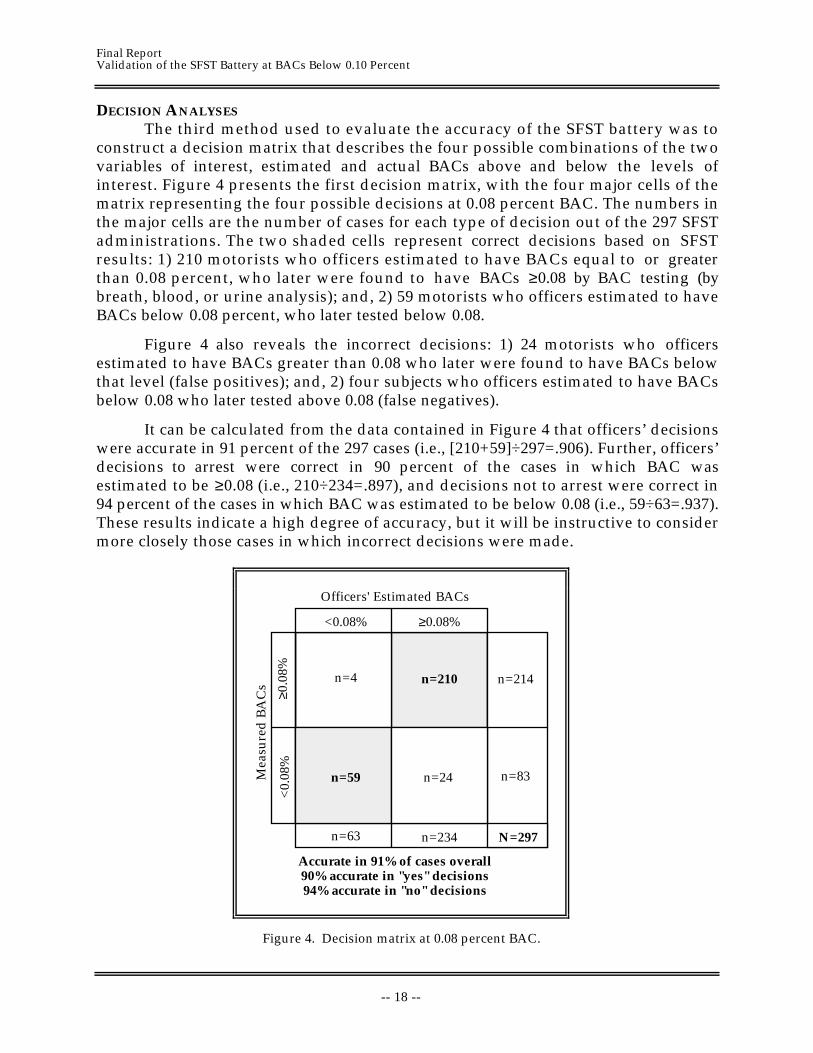
The third method used to evaluate the accuracy of the SFST battery was toconstruct a decision matrix that describes the four possible combinations of the twovariables of interest, estimated and actual BACs above and below the levels ofinterest. Figure 4 presents the first decision matrix, with the four major cells of thematrix representing the four possible decisions at 0.08 percent BAC. The numbers inthe major cells are the number of cases for each type of decision out of the 297 SFSTadministrations. The two shaded cells represent correct decisions based on SFSTresults: 1) 210 motorists who officers estimated to have BACs equal to or greaterthan 0.08 percent, who later were found to have BACs ≥0.08 by BAC testing (bybreath, blood, or urine analysis); and, 2) 59 motorists who officers estimated to haveBACs below 0.08 percent, who later tested below 0.08.
Figure 4 also reveals the incorrect decisions: 1) 24 motorists who officersestimated to have BACs greater than 0.08 who later were found to have BACs belowthat level (false positives); and, 2) four subjects who officers estimated to have BACsbelow 0.08 who later tested above 0.08 (false negatives).
It can be calculated from the data contained in Figure 4 that officers’ decisionswere accurate in 91 percent of the 297 cases (i.e., [210+59]÷297=.906). Further, officers’decisions to arrest were correct in 90 percent of the cases in which BAC wasestimated to be ≥0.08 (i.e., 210÷234=.897), and decisions not to arrest were correct in94 percent of the cases in which BAC was estimated to be below 0.08 (i.e., 59÷63=.937).These results indicate a high degree of accuracy, but it will be instructive to considermore closely those cases in which incorrect decisions were made.
Officers' Estimated BACs
Mea
sure
d B
AC
s
≥0.08%<0.08%
≥0.0
8%<
0.08
%
n=210n=4
n=59
n=234n=63
n=214
n=83
N=297
Accurate in 91% of cases overall90% accurate in "yes" decisions94% accurate in "no" decisions
n=24
Figure 4. Decision matrix at 0.08 percent BAC.
Final ReportValidation of the SFST Battery at BACs Below 0.10 Percent
-- 19 --
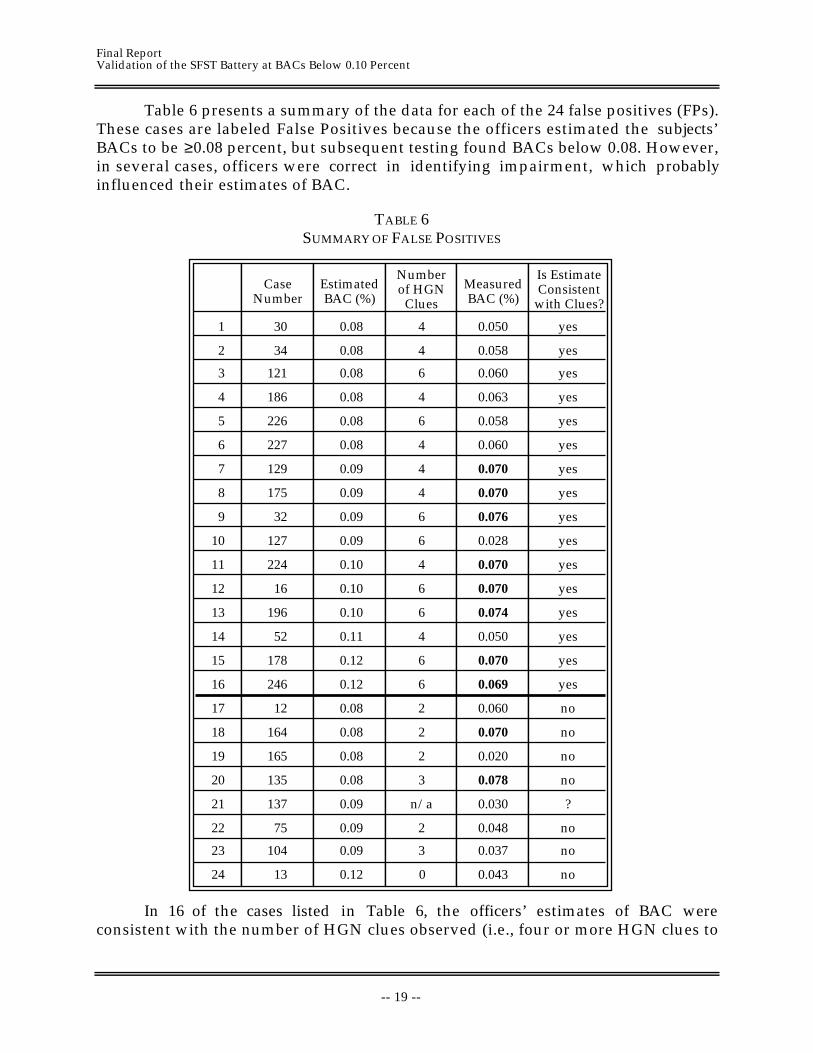
Table 6 presents a summary of the data for each of the 24 false positives (FPs).These cases are labeled False Positives because the officers estimated the subjects’BACs to be ≥0.08 percent, but subsequent testing found BACs below 0.08. However,in several cases, officers were correct in identifying impairment, which probablyinfluenced their estimates of BAC.
TABLE 6SUMMARY OF FALSE POSITIVES
1
2
3
4
5
6
7
8
9
10
11
12
13
14
15
16
17
18
19
20
21
22
23
24
30
34
121
186
226
227
129
175
224
32
127
16
196
52
178
246
137
12
164
165
75
104
13
135
4
4
0.08
0.08
0.08
0.08
0.08
0.08
0.09
0.09
0.09
0.09
0.10
0.10
0.10
0.11
0.12
0.12
0.09
0.08
0.08
0.08
0.08
0.09
0.09
0.12
6
4
6
4
4
4
4
6
6
6
6
4
6
6
2
n/a
2
2
2
3
0
3
0.050
0.058
0.060
0.063
0.058
0.060
0.070
0.070
0.076
0.070
0.028
0.070
0.074
0.050
0.070
0.069
0.030
0.060
0.070
0.020
0.078
0.048
0.037
0.043
yes
yes
yes
yes
yes
yes
yes
yes
yes
yes
yes
yes
yes
yes
yes
yes
no
no
no
no
no
no
no
?
CaseNumber
EstimatedBAC (%)
Numberof HGN
Clues
MeasuredBAC (%)
Is EstimateConsistent
with Clues?
In 16 of the cases listed in Table 6, the officers’ estimates of BAC wereconsistent with the number of HGN clues observed (i.e., four or more HGN clues to
Final ReportValidation of the SFST Battery at BACs Below 0.10 Percent
-- 20 --
support an estimate ≥0.08), however, the motorists subsequently were found to haveactual BACs below 0.08 percent. In seven of the cases, the officers’ estimated BACswere inconsistent with the number of HGN clues observed. It is important to notethat six of the 24 false positives had measured BACs of 0.07 percent, and three hadBACs greater than 0.07 but less than 0.08 (i.e., 0.074, 0.076, and 0.078). All nine ofthese BACs are within the margin of error of the testing devices. Further, CaseNumber 16 was a juvenile (0.069), which rendered the difference between estimatedand measured BACs irrelevant in a zero tolerance jurisdiction; that is, it was acorrect arrest decision despite the BAC estimate. In addition, two of the subjects withmeasured BACs of 0.07 were arrested for DWI, because the officers’ believed thatthey were too impaired to be permitted to drive. Finally, Case Number 30, with anestimated BAC of 0.08 and a measured BAC of 0.05 percent, was found to be apsychiatric patient, which helped to explain her erratic behavior, poor SFSTperformance, and apparent impairment.
Although the proportions of correct decisions presented in Figure 4 reflect ahigh degree of accuracy, the accuracy of officers’ decisions is even better if some ofthe borderline cases are accepted. An accuracy rate of 94 percent for all officerdecisions based on SFST results was calculated by including as correct decisions Case16 (the youth with a 0.069 percent BAC) and the nine false positives with BACsbetween 0.07 and 0.08, discussed in the previous paragraph.
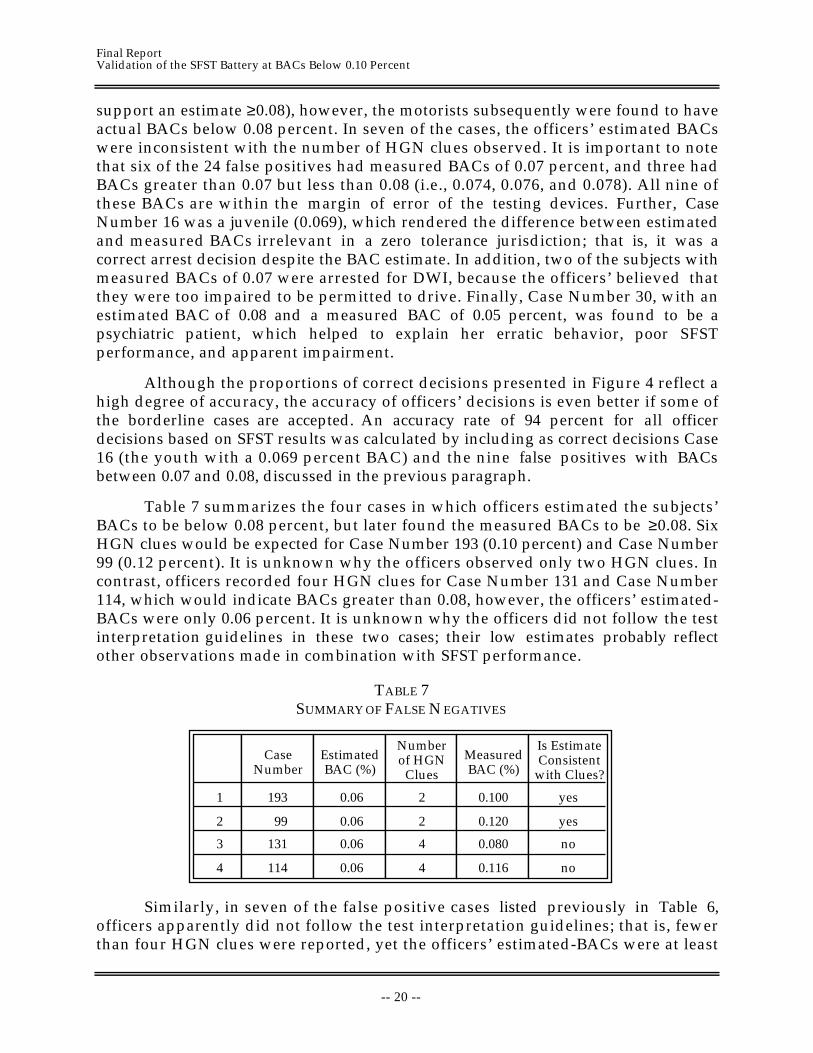
Table 7 summarizes the four cases in which officers estimated the subjects’BACs to be below 0.08 percent, but later found the measured BACs to be ≥0.08. SixHGN clues would be expected for Case Number 193 (0.10 percent) and Case Number99 (0.12 percent). It is unknown why the officers observed only two HGN clues. Incontrast, officers recorded four HGN clues for Case Number 131 and Case Number114, which would indicate BACs greater than 0.08, however, the officers’ estimated-BACs were only 0.06 percent. It is unknown why the officers did not follow the testinterpretation guidelines in these two cases; their low estimates probably reflectother observations made in combination with SFST performance.
TABLE 7SUMMARY OF FALSE NEGATIVES
1
2
3
4
193
99
131
114
2
2
0.06
0.06
0.06
0.06
4
4
0.100
0.120
0.080
0.116
yes
yes
no
no
CaseNumber
EstimatedBAC (%)
Numberof HGN
Clues
MeasuredBAC (%)
Is EstimateConsistent
with Clues?
Similarly, in seven of the false positive cases listed previously in Table 6,officers apparently did not follow the test interpretation guidelines; that is, fewerthan four HGN clues were reported, yet the officers’ estimated-BACs were at least
Final ReportValidation of the SFST Battery at BACs Below 0.10 Percent
-- 21 --
0.08 percent. It is possible that other factors influenced the officers’ estimates. Forexample, the subjects might have appeared to be more impaired than indicated byHGN results as a consequence of prescription or recreational drugs taken in additionto alcohol.
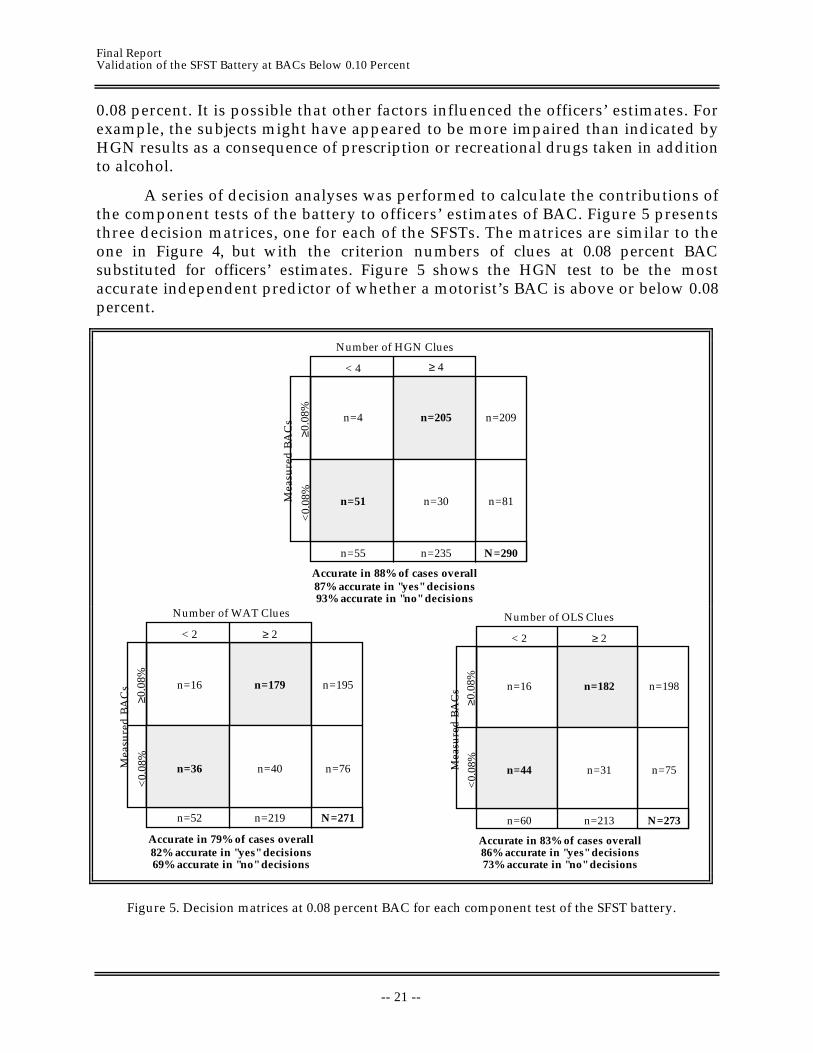
A series of decision analyses was performed to calculate the contributions ofthe component tests of the battery to officers’ estimates of BAC. Figure 5 presentsthree decision matrices, one for each of the SFSTs. The matrices are similar to theone in Figure 4, but with the criterion numbers of clues at 0.08 percent BACsubstituted for officers’ estimates. Figure 5 shows the HGN test to be the mostaccurate independent predictor of whether a motorist’s BAC is above or below 0.08percent.
Number of HGN Clues
Mea
sure
d B
AC
s
≥ 4< 4
≥0.0
8% n=4
n=51
n=235n=55
n=209
n=81
N=290
Accurate in 88% of cases overall87% accurate in "yes" decisions93% accurate in "no" decisions
<0.
08%
n=205
n=30
Number of WAT Clues
Mea
sure
d B
AC
s
≥ 2< 2
≥0.0
8% n=179n=16
n=36
n=219n=52
n=195
n=76
N=271
Accurate in 79% of cases overall82% accurate in "yes" decisions69% accurate in "no" decisions
<0.
08%
n=40
Accurate in 83% of cases overall86% accurate in "yes" decisions73% accurate in "no" decisions
Number of OLS Clues
Mea
sure
d B
AC
s
< 2
≥0.0
8% n=16
n=44
n=213n=60
n=198
n=75
N=273
<0.
08%
≥ 2
n=182
n=31
Figure 5. Decision matrices at 0.08 percent BAC for each component test of the SFST battery.
Final ReportValidation of the SFST Battery at BACs Below 0.10 Percent
-- 22 --
Further analyses were performed to explore methods for combining theresults of the three component tests. Only the 261 cases that included test results forall three component tests could be used in this analysis. Of those cases, 73 werefound to have BACs below 0.08 percent and 188 cases had measured BACs ≥0.08percent. In 162 of the 188 cases (86 percent), all three component SFSTs wereunanimous in their predictions.
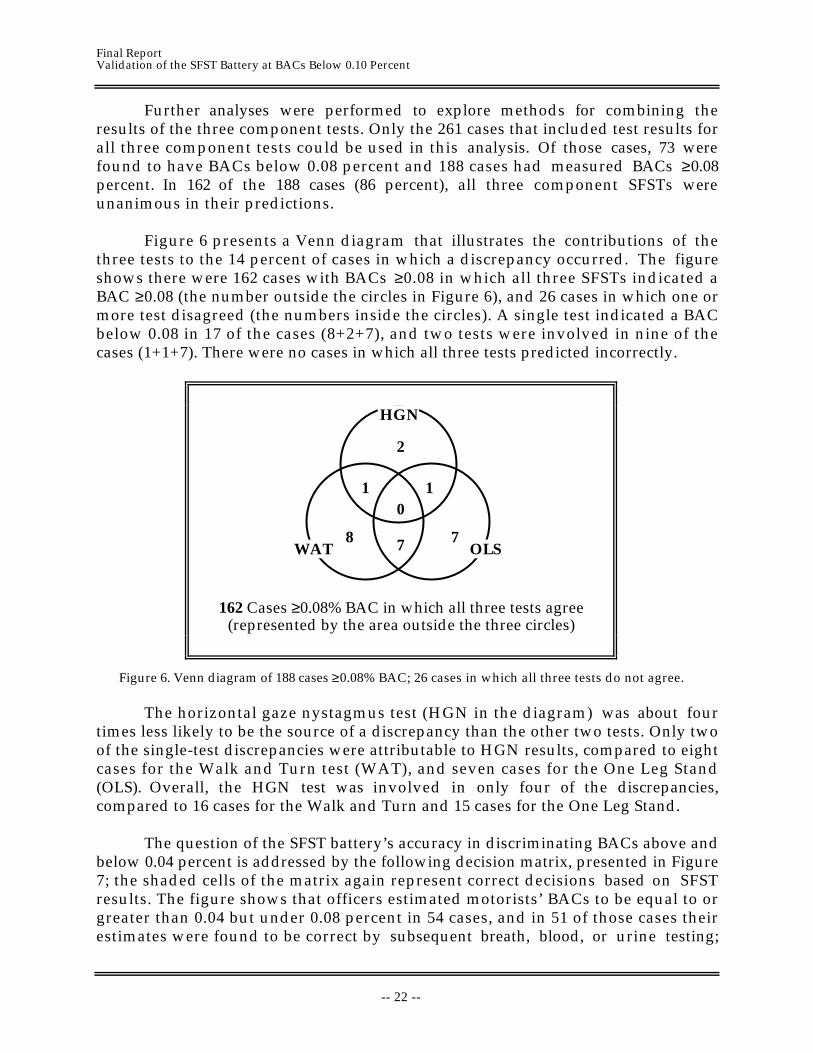
Figure 6 presents a Venn diagram that illustrates the contributions of thethree tests to the 14 percent of cases in which a discrepancy occurred. The figureshows there were 162 cases with BACs ≥0.08 in which all three SFSTs indicated aBAC ≥0.08 (the number outside the circles in Figure 6), and 26 cases in which one ormore test disagreed (the numbers inside the circles). A single test indicated a BACbelow 0.08 in 17 of the cases (8+2+7), and two tests were involved in nine of thecases (1+1+7). There were no cases in which all three tests predicted incorrectly.
HGN
WAT OLS
2
10
1
8 7 7
162 Cases ≥0.08% BAC in which all three tests agree(represented by the area outside the three circles)
Figure 6. Venn diagram of 188 cases ≥0.08% BAC; 26 cases in which all three tests do not agree.
The horizontal gaze nystagmus test (HGN in the diagram) was about fourtimes less likely to be the source of a discrepancy than the other two tests. Only twoof the single-test discrepancies were attributable to HGN results, compared to eightcases for the Walk and Turn test (WAT), and seven cases for the One Leg Stand(OLS). Overall, the HGN test was involved in only four of the discrepancies,compared to 16 cases for the Walk and Turn and 15 cases for the One Leg Stand.
The question of the SFST battery’s accuracy in discriminating BACs above andbelow 0.04 percent is addressed by the following decision matrix, presented in Figure7; the shaded cells of the matrix again represent correct decisions based on SFSTresults. The figure shows that officers estimated motorists’ BACs to be equal to orgreater than 0.04 but under 0.08 percent in 54 cases, and in 51 of those cases theirestimates were found to be correct by subsequent breath, blood, or urine testing;
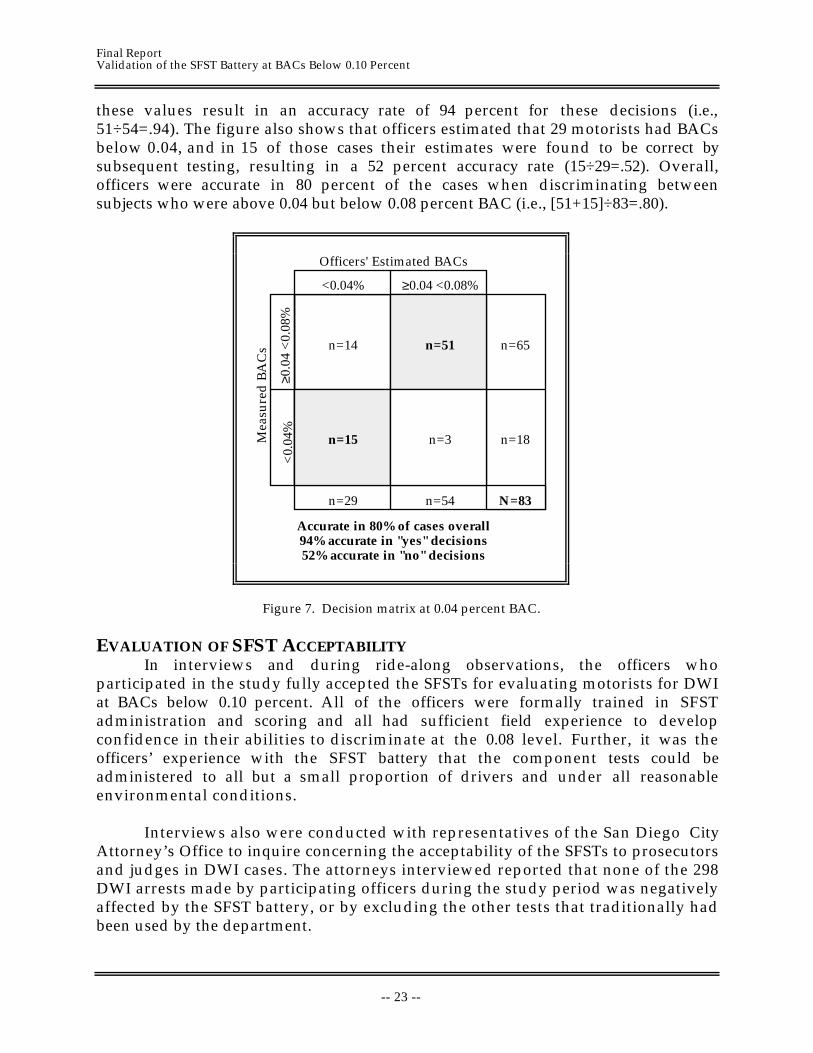
Final ReportValidation of the SFST Battery at BACs Below 0.10 Percent
-- 23 --
these values result in an accuracy rate of 94 percent for these decisions (i.e.,51÷54=.94). The figure also shows that officers estimated that 29 motorists had BACsbelow 0.04, and in 15 of those cases their estimates were found to be correct bysubsequent testing, resulting in a 52 percent accuracy rate (15÷29=.52). Overall,officers were accurate in 80 percent of the cases when discriminating betweensubjects who were above 0.04 but below 0.08 percent BAC (i.e., [51+15]÷83=.80).
Officers' Estimated BACsM
easu
red
BA
Cs
≥0.04 <0.08%<0.04%
n=14
n=15
n=54n=29
n=65
n=18
N=83
Accurate in 80% of cases overall94% accurate in "yes" decisions52% accurate in "no" decisions
<0.
04%
≥0.0
4 <
0.08
%
n=51
n=3
Figure 7. Decision matrix at 0.04 percent BAC.
EVALUATION OF SFST ACCEPTABILITYIn interviews and during ride-along observations, the officers who
participated in the study fully accepted the SFSTs for evaluating motorists for DWIat BACs below 0.10 percent. All of the officers were formally trained in SFSTadministration and scoring and all had sufficient field experience to developconfidence in their abilities to discriminate at the 0.08 level. Further, it was theofficers’ experience with the SFST battery that the component tests could beadministered to all but a small proportion of drivers and under all reasonableenvironmental conditions.
Interviews also were conducted with representatives of the San Diego CityAttorney’s Office to inquire concerning the acceptability of the SFSTs to prosecutorsand judges in DWI cases. The attorneys interviewed reported that none of the 298DWI arrests made by participating officers during the study period was negativelyaffected by the SFST battery, or by excluding the other tests that traditionally hadbeen used by the department.
Final ReportValidation of the SFST Battery at BACs Below 0.10 Percent
-- 24 --
The attorneys further explained that as prosecutors they normally prefer asmuch evidence as possible, and in a DWI case more tests usually generate moreevidence they can use. However, it has been their recent experience that a test usedby another local law enforcement agency has negatively affected cases they haveprosecuted. Defense attorneys have been unsuccessful in their challenges ofNHTSA’s SFST battery, but they have successfully challenged the validity of theother test because it has not been evaluated in a systematic and scientific manner.Prosecutors who were interviewed suggested that the optimum situation would befor all law enforcement agencies to restrict their field sobriety evaluations to thesame standardized battery of three tests.
Final ReportValidation of the SFST Battery at BACs Below 0.10 Percent
-- 25 --
IMPLICATIONS
The research documented in this report found that NHTSA’s StandardizedField Sobriety Test Battery accurately and reliably assists officers in making DWIarrest decisions at 0.08 percent BAC. The study also found that the SFSTs can be usedto assist officers in making arrest decisions at 0.04 percent BAC by using two HGNclues as the criterion rather than four clues, which is the criterion for a 0.08 percentor above BAC determination. The primary implication of the study results is thatthe SFST battery is a valid method for making roadside DWI decisions at 0.08 and0.04 percent BAC. Specific implications of the study results are presented in thefollowing paragraphs in response to the research questions listed previously.
HOW ACCURATELY DO THE TESTS DISCRIMINATE BETWEEN SUBJECTS WHO
ARE ABOVE OR BELOW 0.08 AND 0.04 PERCENT BACS?This study found NHTSA’s SFST battery to be an accurate method for
discriminating motorists’ BACs above and below 0.08 percent and above and below0.04 percent, when the tests are conducted by trained officers, as summarized below.
COMPARISON OF MEANS
The mean estimated BAC of the 297 motorists included in the study was 0.117percent, compared to the mean measured BAC of 0.122. The difference of 0.005percent BAC (i.e., five one-thousandths of a percent BAC) is very small andoperationally irrelevant. The accuracy of officers’ estimates during this study, inlarge measure, confirms the anecdotal accounts and observations of officers in thefield that suggest remarkable abilities to predict a motorists’ BAC on the basis ofSFST results.
CORRELATION ANALYSES
Correlation analyses found the HGN test to be very predictive of measuredBACs (r=0.65). A higher correlation was obtained when the results of the threecomponent tests were combined (r=0.69). All of the correlations are statisticallysignificant, meaningful, and in the rank order expected from previous SFSTresearch.
DECISION ANALYSES
Decision analyses found that officers’ estimates of whether a motorist’s BACwas above or below 0.08 or 0.04 percent were extremely accurate. Estimates at orabove the 0.08 level were accurate in 91 percent of the cases, or as high as 94 percentif explanations for ten of the false positives are accepted. Estimates at or above the0.04 level (but below 0.08) were accurate in 94 percent of the relevant cases. It isimportant to note that officers’ decisions not to arrest were more accurate at 0.08than at 0.04 (94 percent compared to 52 percent).
Although the relatively small number of low BACs in the data base (n=83)might constrain confidence in the SFSTs at the 0.04 level, the data strongly suggest
Final ReportValidation of the SFST Battery at BACs Below 0.10 Percent
-- 26 --
operational utility to accurately discriminate above or below 0.04 percent BAC.Further, these results are consistent with the results of a recent study conducted toevaluate the SFST battery for use by officers in Colorado.
Colorado has a two-tier statute that permits officers to arrest motorists fordriving under the influence (DUI) if found to have a BAC ≥ 0.10 percent, and for alesser offense, driving while ability impaired (DWAI), if found to have a BAC ≥0.05but below 0.099 percent. Of the 234 drivers tested during the Colorado study forwhom BACs were known, 93 percent of the officers’ decisions to arrest at the 0.05percent criterion were correct, and 64 percent of the decisions to release were correct.Overall in the Colorado study, 86 percent of the officers’ decisions at the 0.05 levelwere correct, based on SFST results (Burns and Anderson, 1995; Anderson andBurns, 1997).
WHICH OF THE COMPONENTS OF THE SFST BATTERY IS/ARE THE BEST
PREDICTOR(S) OF BAC?The horizontal gaze nystagmus test was found to be the most predictive of the
three component tests, but correlations with measured BACs were higher when theresults of all three tests were combined, as reported earlier. The implications of thisstudy result are that all components of the SFST battery should be administeredwhen possible or practical. However, the data indicate that the HGN test alone canprovide valid indications to support officers’ arrest decisions at both 0.08 and 0.04percent BAC.
HOW RELIABLE, OR CONSISTENT, ARE THE TESTS?Reliability is a measurement concept that represents the consistency with
which a test measures a type of performance or behavior. In the current context, areliable field sobriety test provides consistent results when administered to the sameindividual by two different officers, under nearly identical conditions. This type of“inter-rater” reliability was impossible to measure directly during this study, due tothe constraints imposed by field conditions. In particular, it would have beenunrealistic to subject motorists to the SFST battery twice, or to require that officersoperate in pairs during their patrols.
Evidence of SFST reliability can be found in the results of the previouslaboratory studies, in which the constraints on repeated measure were eliminated bythe use of paid subjects and officers. Tharp, Burns, and Moskowitz (1981) foundrelatively high inter-rater reliability for BAC estimates based on SFST results (r=.72).The researchers also found that inter-rater reliability increased in subsequentsessions (r=.80), indicating the important role of training and experience inachieving accuracy, reliability, and overall proficiency.
In addition, correlation coefficients, in general, are measures of reliability. Forthis reason, the correlations between estimated and actual BACs obtained during thefield study (r=.69) indicate a high degree of reliability for tests designed to beadministered at roadside.
Final ReportValidation of the SFST Battery at BACs Below 0.10 Percent
-- 27 --
ARE THE TESTS USABLE BY POLICE OFFICERS UNDER A VARIETY OF ROADSIDE
CONDITIONS? ARE THEY READILY ACCEPTED BY OFFICERS AND PROSECUTORS?All of the officers who participated in this study were members of the San
Diego Police Department’s alcohol enforcement unit, all had previously receivedNHTSA-approved training in DWI detection and SFST administration, and all hadat least three years of experience in the Traffic Division before joining the specialunit. Prior to beginning the field study, the officers demonstrated competence in theadministration of the component tests and interpretation of test results.Participation was limited to members of the alcohol-enforcement unit of a singlelaw enforcement agency. These experience and training requirements wereimposed, to control variables, to the extent possible, that might affect study results.
As a consequence of the selection criteria, all participating officers wereproficient in the use of the SFST battery. The officers reported that they use theirSFST skills daily in their work, and their experience has made them confident in theability of the test battery to discriminate at 0.08 percent BAC, and at lower levels.Further, officers reported that the tests can be administered in all reasonableenvironmental conditions. In short, the officers who participated in this studyconsider the SFST battery to be extremely useful, in fact, essential tools for theperformance of their professional duties.
The prosecutors interviewed during the study reported that the SFST batteryhas been acceptable to them and the courts because it was developed and validatedin a systematic and scientific manner. They suggested that all law enforcementagencies should limit officers to use of the SFST battery in performance evaluationsof DWI because other tests usually lack credibility in court. No problems wereexperienced in any of the 298 cases resulting from the field study, indicating theSFSTs to be fully acceptable to the courts in establishing probable cause to arrest amotorist for DWI.
NOTE ABOUT THE ACCEPTABILITY OF THE HGN TEST
Many law enforcement officers from across the United States have reportedtheir sincere appreciation to NHTSA for developing the SFST battery, and inparticular, the horizontal gaze nystagmus test. However, some officers haveexpressed frustration about the resistance of some courts to accept HGN results,despite the clear and unequivocal support of scientific research and field experience.It is likely that this remaining resistance to the horizontal gaze nystagmus test isattributable to a misunderstanding concerning the purpose of a field sobriety test,and can be explained by reference to “face validity,” a term used in the behavioralsciences to describe one component of a measure’s acceptability.
Many individuals, including some judges, believe that the purpose of a fieldsobriety test is to measure driving impairment. For this reason, they tend to expecttests to possess “face validity,” that is, tests that appear to be related to actual drivingtasks. Tests of physical and cognitive abilities, such as balance, reaction time, andinformation processing, have face validity, to varying degrees, based on the
Final ReportValidation of the SFST Battery at BACs Below 0.10 Percent
-- 28 --
involvement of these abilities in driving tasks; that is, the tests seem to be relevant“on the face of it.” Horizontal gaze nystagmus lacks face validity because it does notappear to be linked to the requirements of driving a motor vehicle. The reasoning iscorrect, but it is based on the incorrect assumption that field sobriety tests aredesigned to measure driving impairment.
Driving a motor vehicle is a very complex activity that involves a widevariety of tasks and operator capabilities. It is unlikely that complex humanperformance, such as that required to safely drive an automobile, can be measured atroadside. The constraints imposed by roadside testing conditions were recognized bythe developers of NHTSA’s SFST battery. As a consequence, they pursued thedevelopment of tests that would provide statistically valid and reliable indicationsof a driver’s BAC, rather than indications of driving impairment. The link betweenBAC and driving impairment is a separate issue, involving entirely differentresearch methods. Those methods have found driving to be impaired at BACs aslow as 0.02 percent, with a sharp increase in impairment at about 0.07 percent(Moskowitz and Robinson, 1988; Stuster, 1997). Thus, SFST results help officers tomake accurate DWI arrest decisions even though SFSTs do not directly measuredriving impairment.
Horizontal gaze nystagmus is the most accurate diagnostic of BAC available toofficers in the field. HGN’s apparent lack of face validity to driving tasks isirrelevant because the objective of the test is to discriminate between drivers aboveand below the statutory BAC limit, not to measure driving impairment.Throughout the United States, DWI laws permit arrest decisions to be made on thebasis of the statutory BAC limit, irrespective of a specific motorist’s degree ofimpairment. Motorists also can be arrested at BACs below the statutory limit if theirdriving performance is demonstrably impaired by alcohol or other drugs.
CONCLUSIONSThe results of this study provide clear evidence of the validity of the
Standardized Field Sobriety Test Battery to discriminate above or below 0.08 percentBAC. Further, study results strongly suggest that the SFSTs also accuratelydiscriminate above or below 0.04 percent BAC.
Finally, in addition to establishing the validity of the SFST battery, this studyhas found the tests to be acceptable, indeed welcomed, by law enforcement officersand DWI prosecutors.
Final ReportValidation of the SFST Battery at BACs Below 0.10 Percent
-- 29 --
REFERENCES
Anderson, E.W. and Burns, M. (1997). Standardized Field Sobriety Tests: A FieldStudy. Proceedings of the 14th International Conference on Alcohol, Drugsand Traffic Safety Volume 2, 635-639.
Aschan, G. (1958). Different types of alcohol nystagmus. Acta Otolaryngology,Supplement 140, 69-78.
Burns, M. and Anderson, E.W. (1995). A Colorado Validation Study of theStandardized Field Sobriety Test (SFST) Battery. Colorado Department ofTransportation.
Burns, M. and Moskowitz, H. (1977). Psychophysical Tests for DWI Arrest. U.S.Department of Transportation, National Highway Traffic SafetyAdministration Final Report DOT-HS-5-01242, Washington, D.C.
Harris, D.H., Dick, R.A., Casey, S.M.,and Jarosz, C.J. (1980). The Visual Detection ofDriving While Intoxicated. U.S. Department of Transportation, NationalHighway Traffic Safety Administration Final Report DOT-HS-7-1538.
Harris, D.H. (1980). Visual detection of driving while intoxicated. Human Factors,22(6), 725-732.
Lehti, H.M.J. (1976). The effects of blood alcohol concentration on the onset of gazenystagmus. Blutalkohol , Vol. 13, 411-414.
Moskowitz, H., and Robinson, C.D. (1988). Effects of Low Doses of Alcohol onDriving-Related Skills: A Review of the Evidence. U.S. Department ofTransportation, National Highway Traffic Safety Administration, DOT-HS-807-280, Washington, D.C.
Pentilla, A., Tenhu, M., and Kataja, M. (1971). Clinical Examination For IntoxicationIn Cases of Suspected Drunken Driving. Statistical and Research Bureau ofTALJA. Iso Roobertinkatu 20, Helsinki, Finland.
Stuster, J.W. (1997). The Detection of DWI at BACs Below 0.10. U.S. Department ofTransportation, National Highway Traffic Safety Administration Final Report(in press).
Stuster, J.W. (1993). The Detection of DWI Motorcyclists. U.S. Department ofTransportation, National Highway Traffic Safety Administration Final ReportDOT-HS-807-839.

Final ReportValidation of the SFST Battery at BACs Below 0.10 Percent
-- 30 --
Tharp, V., Burns, M., and Moskowitz, H. (1981). Development and Field Test ofPsychophysical Tests for DWI Arrest. U.S. Department of Transportation,National Highway Traffic Safety Administration Final Report DOT-HS-805-864, Washington, D.C.
Wilkinson, I.M.S., Kime, R., and Purnell, M. (1974). Alcohol and human eyemovement. Brain, 97, 785-792.
Final ReportValidation of the SFST Battery at BACs Below 0.10 Percent
-- 31 --
APPENDIX A
STANDARDIZED FIELD SOBRIETY TESTING
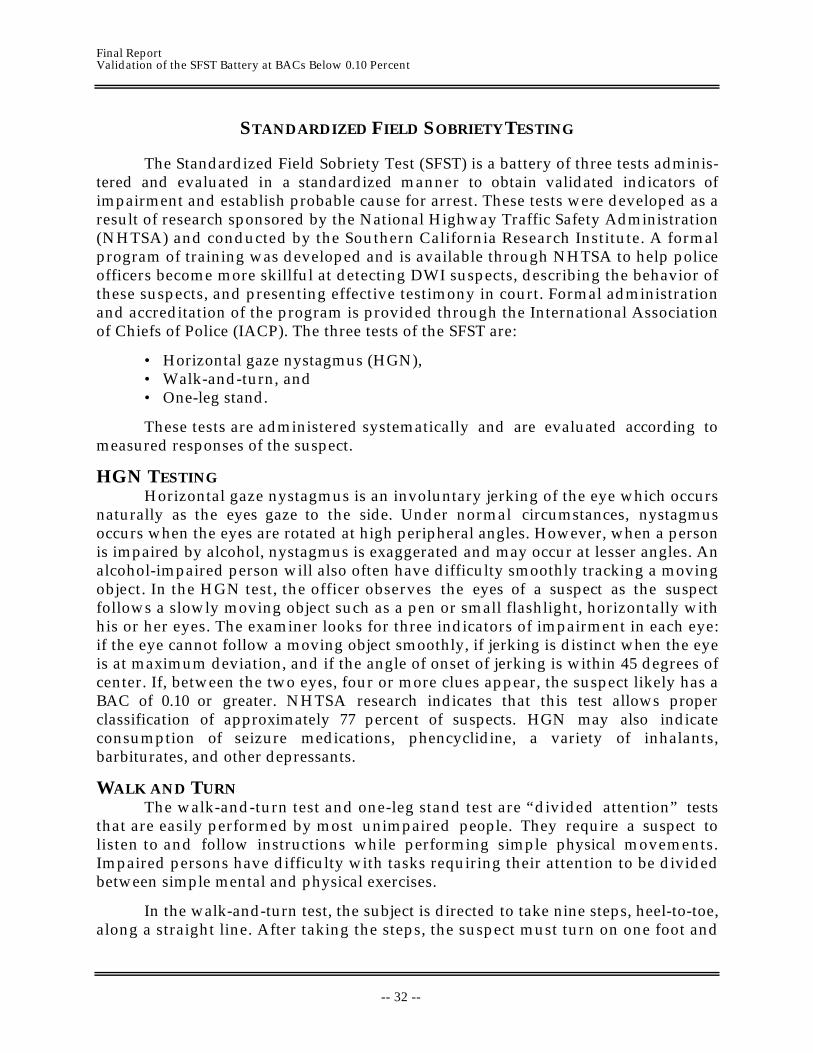
Final ReportValidation of the SFST Battery at BACs Below 0.10 Percent
-- 32 --
STANDARDIZED FIELD SOBRIETY TESTING
The Standardized Field Sobriety Test (SFST) is a battery of three tests adminis-tered and evaluated in a standardized manner to obtain validated indicators ofimpairment and establish probable cause for arrest. These tests were developed as aresult of research sponsored by the National Highway Traffic Safety Administration(NHTSA) and conducted by the Southern California Research Institute. A formalprogram of training was developed and is available through NHTSA to help policeofficers become more skillful at detecting DWI suspects, describing the behavior ofthese suspects, and presenting effective testimony in court. Formal administrationand accreditation of the program is provided through the International Associationof Chiefs of Police (IACP). The three tests of the SFST are:
• Horizontal gaze nystagmus (HGN),• Walk-and-turn, and• One-leg stand.
These tests are administered systematically and are evaluated according tomeasured responses of the suspect.
HGN TESTINGHorizontal gaze nystagmus is an involuntary jerking of the eye which occurs
naturally as the eyes gaze to the side. Under normal circumstances, nystagmusoccurs when the eyes are rotated at high peripheral angles. However, when a personis impaired by alcohol, nystagmus is exaggerated and may occur at lesser angles. Analcohol-impaired person will also often have difficulty smoothly tracking a movingobject. In the HGN test, the officer observes the eyes of a suspect as the suspectfollows a slowly moving object such as a pen or small flashlight, horizontally withhis or her eyes. The examiner looks for three indicators of impairment in each eye:if the eye cannot follow a moving object smoothly, if jerking is distinct when the eyeis at maximum deviation, and if the angle of onset of jerking is within 45 degrees ofcenter. If, between the two eyes, four or more clues appear, the suspect likely has aBAC of 0.10 or greater. NHTSA research indicates that this test allows properclassification of approximately 77 percent of suspects. HGN may also indicateconsumption of seizure medications, phencyclidine, a variety of inhalants,barbiturates, and other depressants.
WALK AND TURNThe walk-and-turn test and one-leg stand test are “divided attention” tests
that are easily performed by most unimpaired people. They require a suspect tolisten to and follow instructions while performing simple physical movements.Impaired persons have difficulty with tasks requiring their attention to be dividedbetween simple mental and physical exercises.
In the walk-and-turn test, the subject is directed to take nine steps, heel-to-toe,along a straight line. After taking the steps, the suspect must turn on one foot and
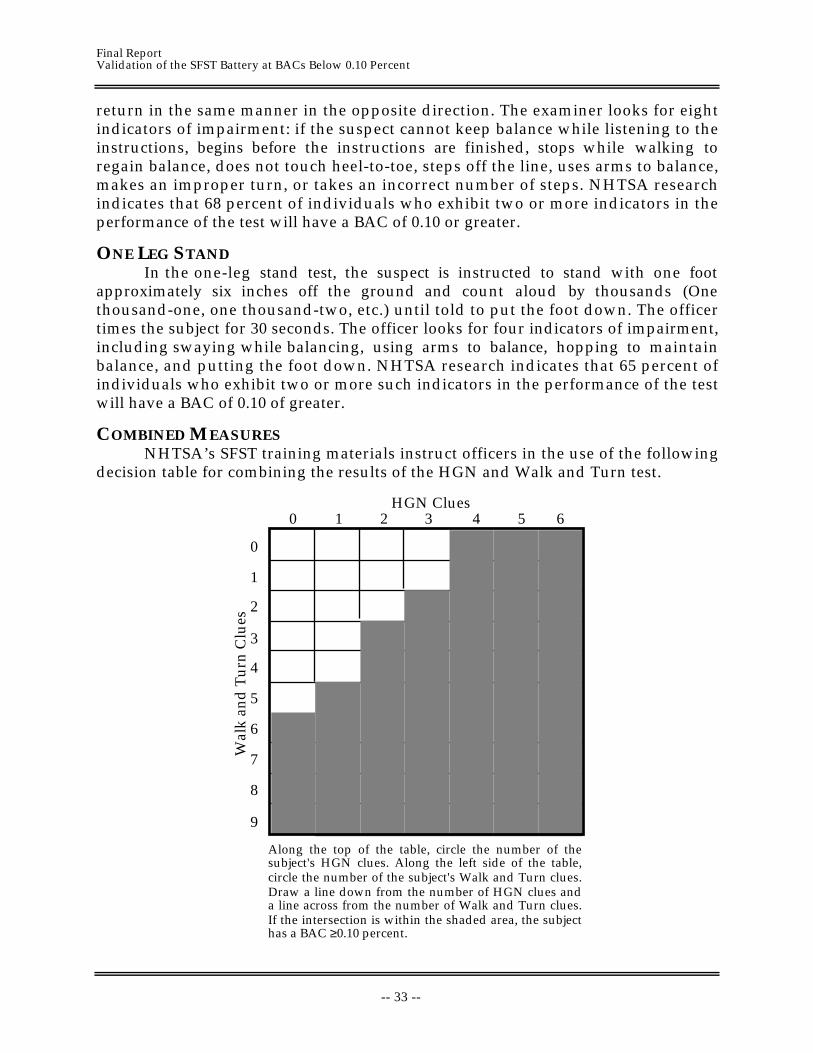
Final ReportValidation of the SFST Battery at BACs Below 0.10 Percent
-- 33 --
return in the same manner in the opposite direction. The examiner looks for eightindicators of impairment: if the suspect cannot keep balance while listening to theinstructions, begins before the instructions are finished, stops while walking toregain balance, does not touch heel-to-toe, steps off the line, uses arms to balance,makes an improper turn, or takes an incorrect number of steps. NHTSA researchindicates that 68 percent of individuals who exhibit two or more indicators in theperformance of the test will have a BAC of 0.10 or greater.
ONE LEG STANDIn the one-leg stand test, the suspect is instructed to stand with one foot
approximately six inches off the ground and count aloud by thousands (Onethousand-one, one thousand-two, etc.) until told to put the foot down. The officertimes the subject for 30 seconds. The officer looks for four indicators of impairment,including swaying while balancing, using arms to balance, hopping to maintainbalance, and putting the foot down. NHTSA research indicates that 65 percent ofindividuals who exhibit two or more such indicators in the performance of the testwill have a BAC of 0.10 of greater.
COMBINED MEASURESNHTSA’s SFST training materials instruct officers in the use of the following
decision table for combining the results of the HGN and Walk and Turn test.
1
2
3
4
5
6
7
8
9
0
1 2 3 4 5 60
Wal
k a
nd
Tu
rn C
lues
HGN Clues
Along the top of the table, circle the number of the subject's HGN clues. Along the left side of the table, circle the number of the subject's Walk and Turn clues. Draw a line down from the number of HGN clues and a line across from the number of Walk and Turn clues. If the intersection is within the shaded area, the subject has a BAC ≥0.10 percent.


![[This page is intentionally left blank]€¦ · The Standardized Field Sobriety Testing (SFST) training curriculum collectively, prepares police officers and other qualified persons](https://img.pdfslide.net/doc/110x75/5f3ef1f9ae53ec00e969a15a/this-page-is-intentionally-left-blank-the-standardized-field-sobriety-testing.jpg)