Embed Size (px)
Citation preview
148
J.Agromet 23 (2):148-168,2009
VALIDATION TECHNIQUE FOR SIMPLE OPERATIONAL USE (INDRAMAYU, SUMEDANG, AND MAJALENGKA DISTRICTS CASE OF 2003)
Teknik Validasi Untuk Penggunaan Operasi Sederhana
(Kasus Kabupaten Indramayu, Sumedang, dan Majalengka Tahun 2003)
Yunus S. Swarinoto
Senior Researcher on Climatology Indonesian Meteorological Climatological and Geophysical Agency (BMKG)
Jl. Angkasa I/ 2 Kemayoran, Jakarta 10720 email : [email protected].
ABSTRACT
The model output of rainfall total prediction has to be validated before being applied to the operational use. After understanding the accuracy of this rainfall total prediction output, one has to make decision whether applying it in the field or not. This depends upon the value of accuracy as well. Validation technique for simple operational use can be made by applying Pearson’s correlation coefficient (r), Root Mean Square Error (RMSE), and spatial rainfall defferentiation values (∆RR). The Wavelet Transformation Technique (WTT) for providing rainfall total prediction output of rainy and transition seasons 2003 had been applied to the domain of interest Indramayu, Sumedang, and Majalengka districts. Results show that during January 2003 (rainy season respectively) r = 0.65 with RMSE = 296 mm and 75.39% spatial disagreement area; but within April 2003 (transition season respectively) r = 0.49 with RMSE = 152 mm and 43.55% spatial disagreement area. Topography condition has play a role to the rainfall deferenciation values, especially for Lee-ward location. This is described by higher differentiation values of rainfall total prediction after reaching the top of elevation above mean sea level.
Keywords: model output, prediction, rainfall total, RMSE, WTT
INTRODUCTION
Rainfall total prediction using miscellaneous models are commonly used in operational
purposes. These models can be based on statistical approach, dynamical approach, or even both
statistical and dynamical approaches at once (Swarinoto 2001). Each approach has its
advantages and disadvantages of output quality. This is depending upon the purposes of
prediction goals. Somehow ones are very difficult to compare the results taken from each model
output. Factually, models are usually developed in order to reduce the complexity of systems. A
system is an organized array of individual elements and parts forming as a unit. Consequently,
models are pointing out of ‘a small-scale or miniature representation of something’ (Webster
1990). Using a model means to simplify the system. Factually, a system has complex variables
and parameters. Here, models will use mathematical equations as necessary.
Penyerahan naskah : 22 Oktober 2009 Diterima untuk diterbitkan : 26 November 2009
149
Validation Technique for Simple Operational Use
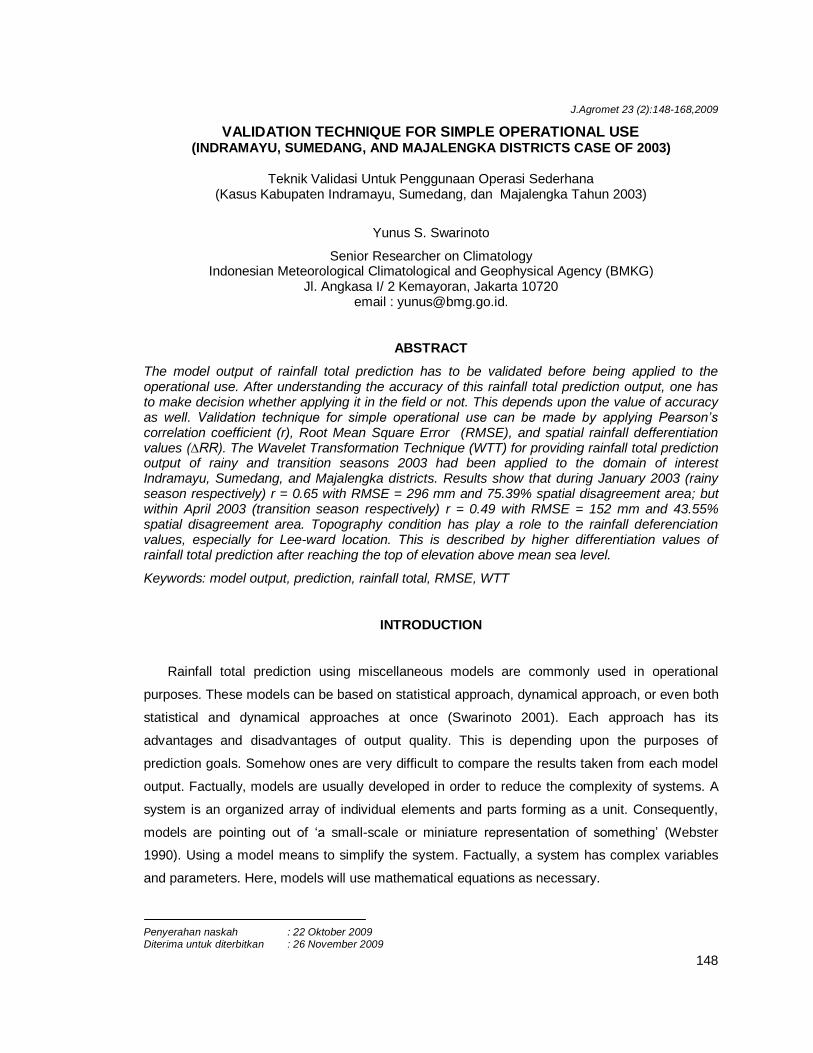
Commonly, models are run and based on the using of machines or computers to process the
data. The use of machines to provide rainfall prediction is meant to help human to compute
miscellaneous climate parameters in a fast manner. In this case, human has limitation to compute
huge data in order to provide a longer time of rainfall prediction. According to the experiment,
machines have a better capability to provide longer period of prediction comparing to the human
capability (Figure 1).
As usual, models are based on applying mathematical equations. In order to make easier
computation procedure, there are often used some assumptions in these mathematical
equations. This condition will imply to the results of prediction output. It is no doubt that some
errors will occur in the models output. In simply way, ones will meet errors in every results of
rainfall total prediction. The important thing is how to evaluate the models results by investigating
the model output in a simple way. This is the goal from this presented paper.
Figure 1 The capability of machines in numerical weather prediction comparing to
human capability (Lee 2006).
For operational use, it is very important to utilize an easy way to evaluate the result of rainfall
total prediction. Because operational purposes need a rapid way to know the result of evaluation.
This condition has relationship with the application of models in operational use. If the models
have no accuracy enough, so consequently that these models will not be used in operational
usage for providing rainfall total prediction. Because the prediction output will have a lot of risks to
be applied in the field.
150
Yunus S. Swarinoto
Step of Prediction
Data
Training
Period
Prediction
Calibration
Accuracy
Operational
BMKG
Method
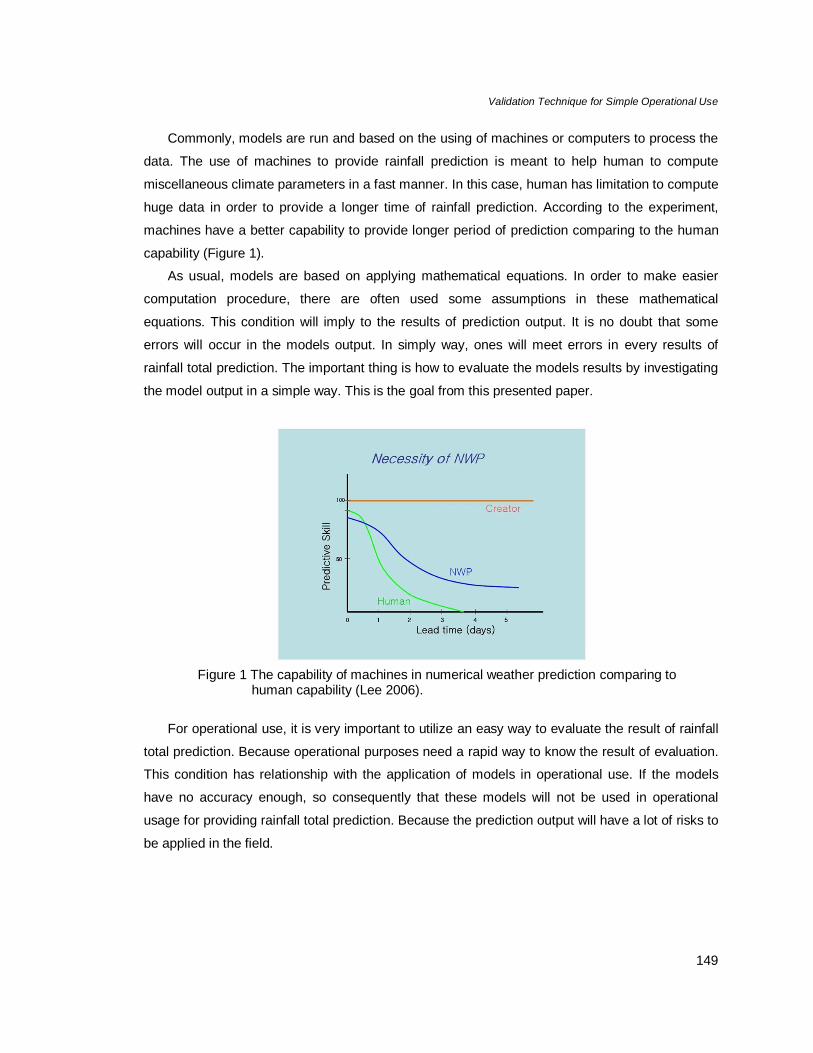
Figure 2 The flow of steps to provide prediction for operational use.
In order to offer the rainfall total prediction (models) outputs, one has to pay attention to the
flow of steps to provide prediction especially for operational use chart (Figure 3). The steps can
be described as follow:
(1) Starting from the data availability, the quality of data should be paid attention well. No missing
data is preferred for data processing. If there is any missing data, one will fulfill firstly before
entering into data processing step. Miscellaneous ways are able to be used to insert or replace
missing data values. Having long enough data series such 20 years data, are also necessary in
order to get realistic results closed to the field condition.
(2) Method of approaching is necessary to be designated in line with the goal of data processing.
Here, one is able to choose whether statistical, dynamical, or both statistical and dynamical
approaches at once.
(3) Based on data processing, the rainfall total prediction outputs can be catered. One should pay
attention to these outputs. Because of using the model output as simplified of the complex
systems, these ouputs consider having errors or biases.
(4) Evaluation process of rainfall total model outputs have to be examined. This step is done in
order to understand the level of accuracy from rainfall total model outputs. In this step, errors or
biases from the rainfall total model outputs can be computed.
(5) Based on step (4), the level of errors or biases coming from the rainfall total prediction outputs
can be computed. These information will be used to decide the possibility of rainfall total model
outputs to be applied in the fields. If there is still weak in accuracy of the rainfall total prediction
outputs, one will take the models to the step of (4).
(6) Rainfall total prediction or model outputs which have a appropriate level of errors or biases,
can be applied for operational use. But the step of (4) should continuously be done in order to
maintain the quality of prediction outputs.
151
Validation Technique for Simple Operational Use
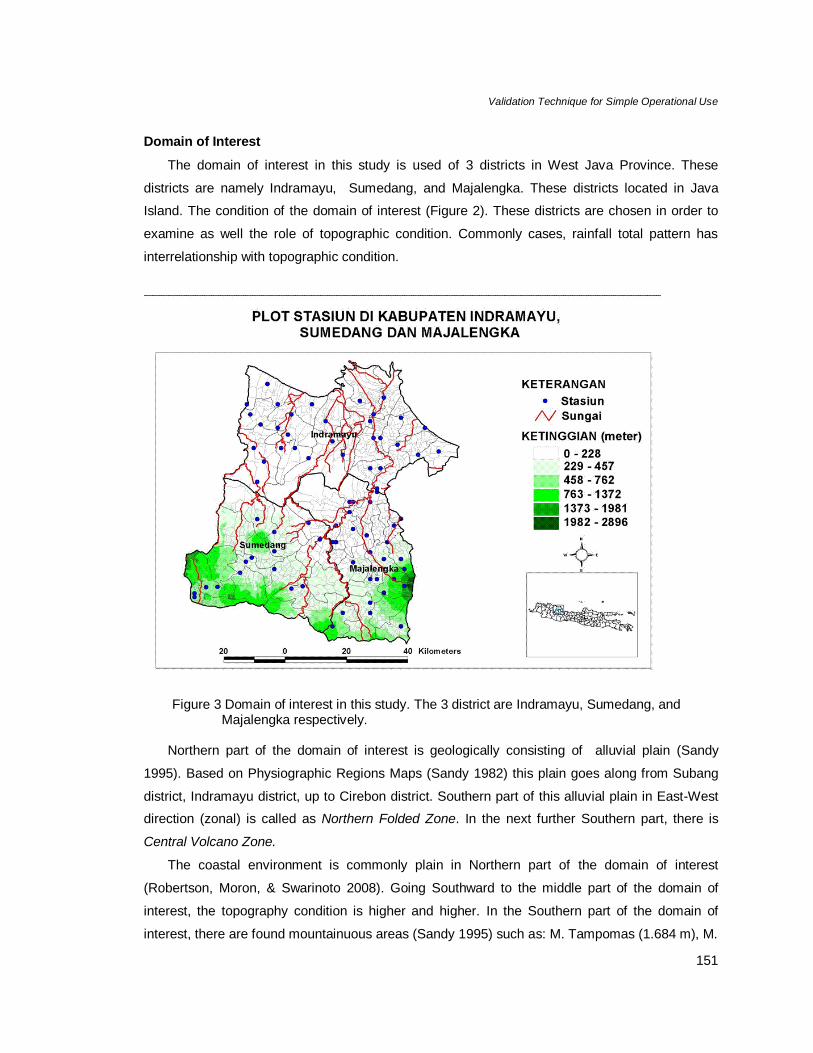
Domain of Interest
The domain of interest in this study is used of 3 districts in West Java Province. These
districts are namely Indramayu, Sumedang, and Majalengka. These districts located in Java
Island. The condition of the domain of interest (Figure 2). These districts are chosen in order to
examine as well the role of topographic condition. Commonly cases, rainfall total pattern has
interrelationship with topographic condition.
Figure 3 Domain of interest in this study. The 3 district are Indramayu, Sumedang, and Majalengka respectively.
Northern part of the domain of interest is geologically consisting of alluvial plain (Sandy
1995). Based on Physiographic Regions Maps (Sandy 1982) this plain goes along from Subang
district, Indramayu district, up to Cirebon district. Southern part of this alluvial plain in East-West
direction (zonal) is called as Northern Folded Zone. In the next further Southern part, there is
Central Volcano Zone.
The coastal environment is commonly plain in Northern part of the domain of interest
(Robertson, Moron, & Swarinoto 2008). Going Southward to the middle part of the domain of
interest, the topography condition is higher and higher. In the Southern part of the domain of
interest, there are found mountainuous areas (Sandy 1995) such as: M. Tampomas (1.684 m), M.
152
Yunus S. Swarinoto
Bukittunggul (2.203), M. Cakrabuana (1.721 m), and M. Ciremai (3.078 m). Based on the Digital
Elevation Model (DEM) maps using the scale of 1:25.000, topography in Northern part of West
Java Province including the domain of interest has a range of 1 meter up to more than 2.500
meter above mean sea level.
METODOLOGY
Climate Condition of the Domain of Interest
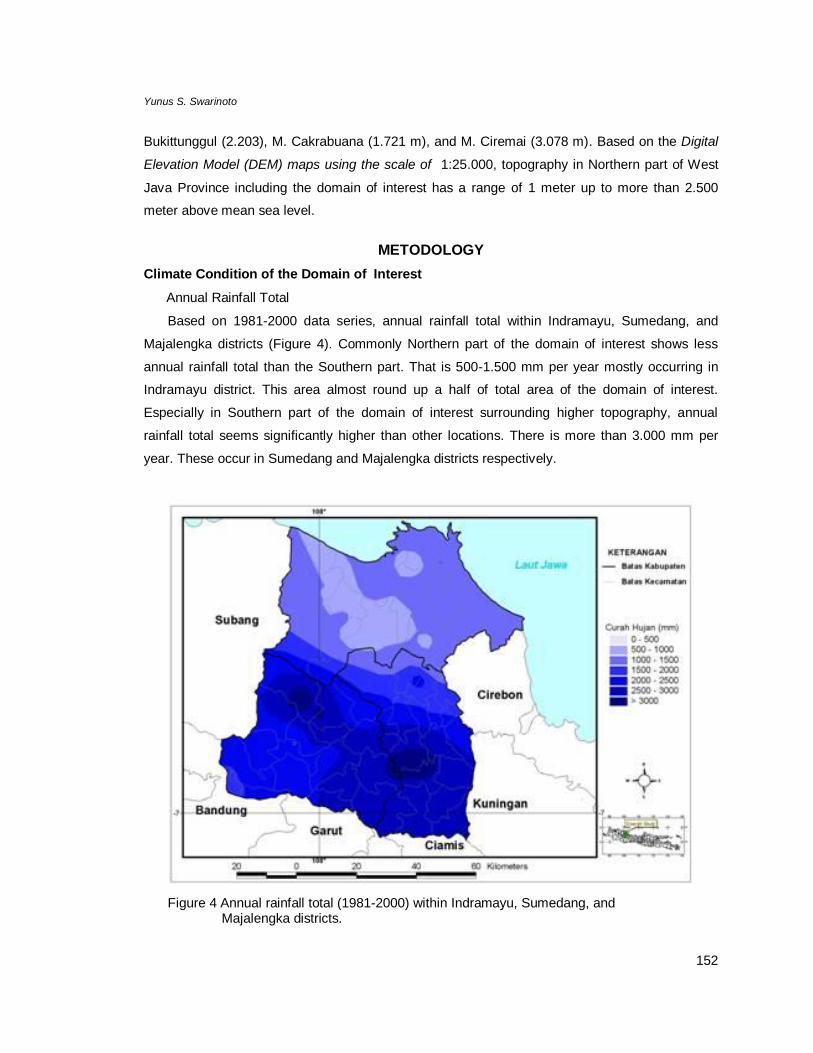
Annual Rainfall Total
Based on 1981-2000 data series, annual rainfall total within Indramayu, Sumedang, and
Majalengka districts (Figure 4). Commonly Northern part of the domain of interest shows less
annual rainfall total than the Southern part. That is 500-1.500 mm per year mostly occurring in
Indramayu district. This area almost round up a half of total area of the domain of interest.
Especially in Southern part of the domain of interest surrounding higher topography, annual
rainfall total seems significantly higher than other locations. There is more than 3.000 mm per
year. These occur in Sumedang and Majalengka districts respectively.
Figure 4 Annual rainfall total (1981-2000) within Indramayu, Sumedang, and
Majalengka districts.
153
Validation Technique for Simple Operational Use
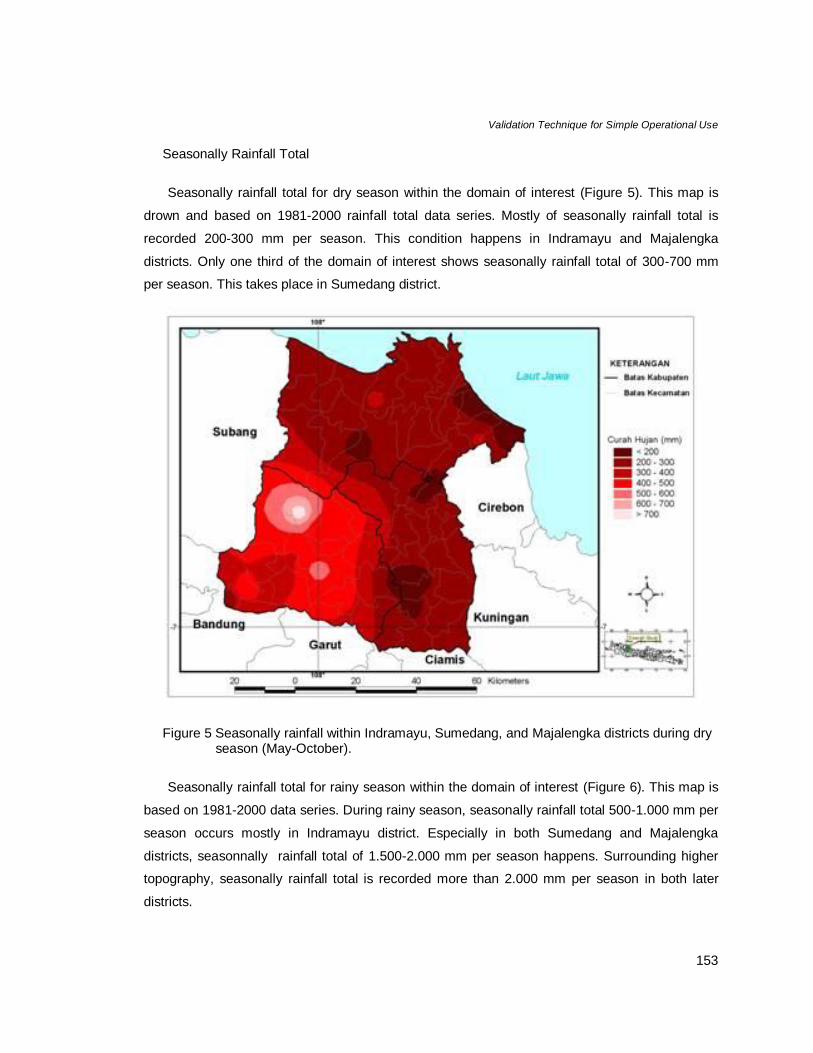
Seasonally Rainfall Total
Seasonally rainfall total for dry season within the domain of interest (Figure 5). This map is
drown and based on 1981-2000 rainfall total data series. Mostly of seasonally rainfall total is
recorded 200-300 mm per season. This condition happens in Indramayu and Majalengka
districts. Only one third of the domain of interest shows seasonally rainfall total of 300-700 mm
per season. This takes place in Sumedang district.
Figure 5 Seasonally rainfall within Indramayu, Sumedang, and Majalengka districts during dry
season (May-October).
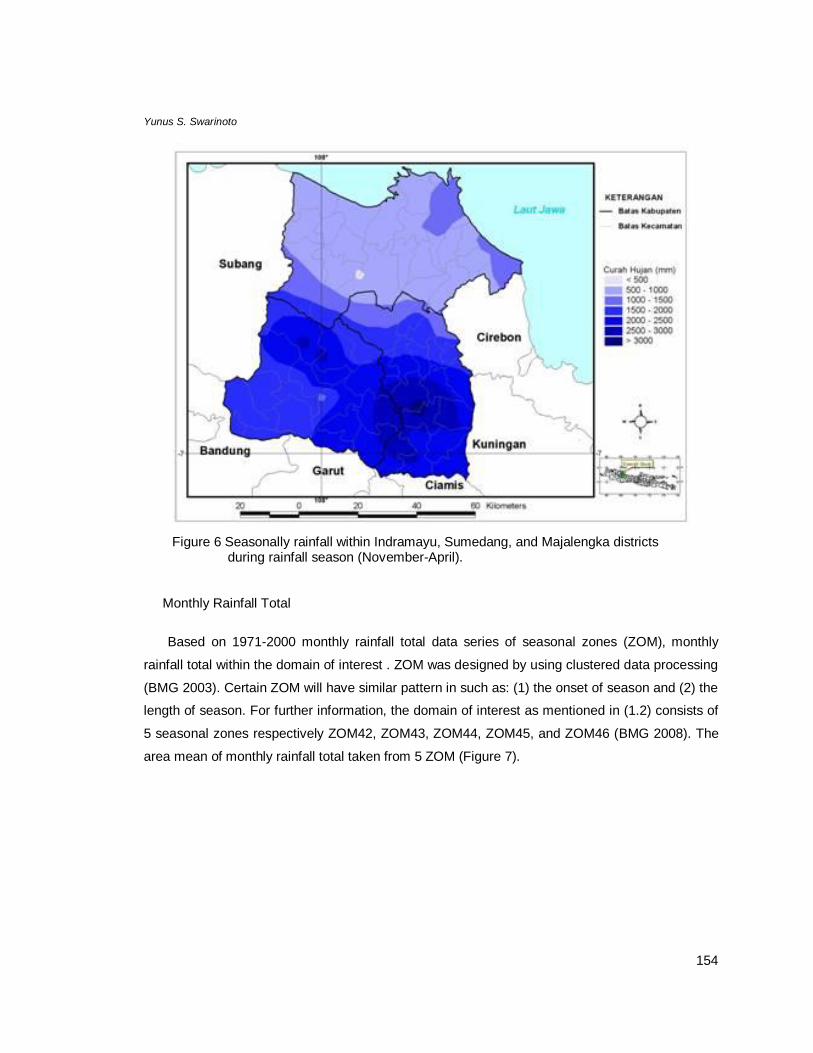
Seasonally rainfall total for rainy season within the domain of interest (Figure 6). This map is
based on 1981-2000 data series. During rainy season, seasonally rainfall total 500-1.000 mm per
season occurs mostly in Indramayu district. Especially in both Sumedang and Majalengka
districts, seasonnally rainfall total of 1.500-2.000 mm per season happens. Surrounding higher
topography, seasonally rainfall total is recorded more than 2.000 mm per season in both later
districts.
154
Yunus S. Swarinoto
Figure 6 Seasonally rainfall within Indramayu, Sumedang, and Majalengka districts
during rainfall season (November-April).
Monthly Rainfall Total
Based on 1971-2000 monthly rainfall total data series of seasonal zones (ZOM), monthly
rainfall total within the domain of interest . ZOM was designed by using clustered data processing
(BMG 2003). Certain ZOM will have similar pattern in such as: (1) the onset of season and (2) the
length of season. For further information, the domain of interest as mentioned in (1.2) consists of
5 seasonal zones respectively ZOM42, ZOM43, ZOM44, ZOM45, and ZOM46 (BMG 2008). The
area mean of monthly rainfall total taken from 5 ZOM (Figure 7).
155
Validation Technique for Simple Operational Use
Pcrp Mean 1971-2000
0
50
100
150
200
250
300
350
400
1 2 3 4 5 6 7 8 9 10 11 12
Months
Rain
fall
To
ral
(mm
)
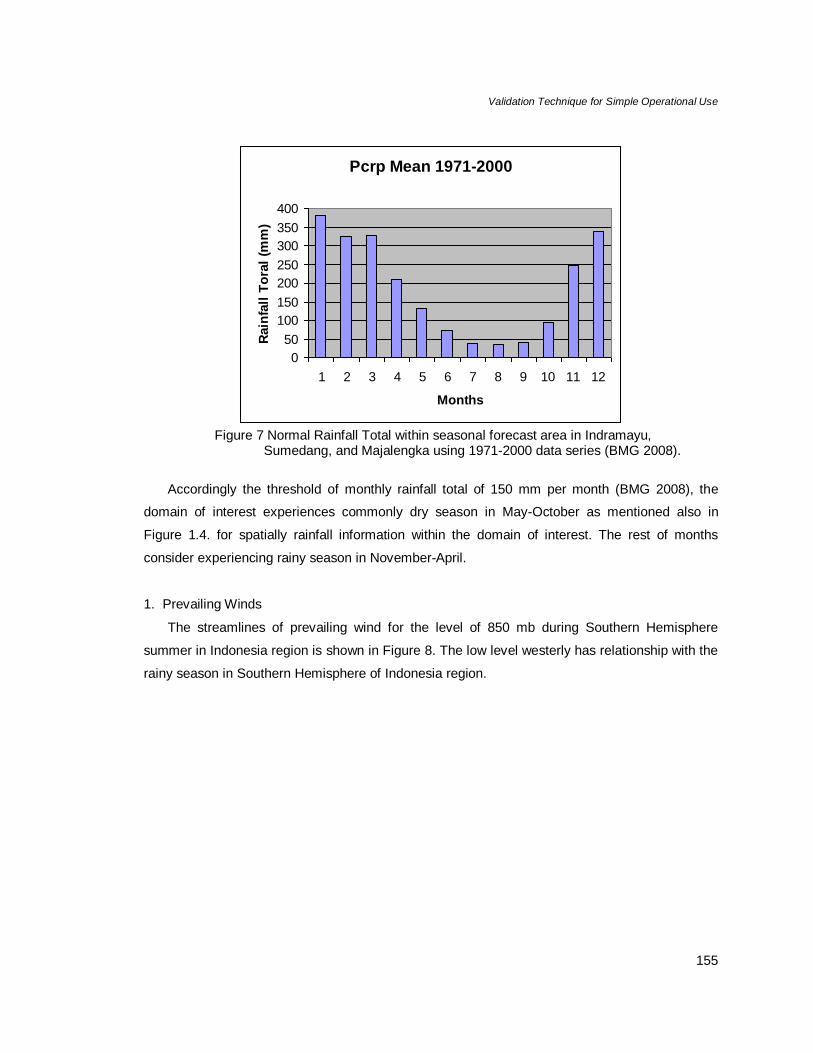
Figure 7 Normal Rainfall Total within seasonal forecast area in Indramayu,
Sumedang, and Majalengka using 1971-2000 data series (BMG 2008).
Accordingly the threshold of monthly rainfall total of 150 mm per month (BMG 2008), the
domain of interest experiences commonly dry season in May-October as mentioned also in
Figure 1.4. for spatially rainfall information within the domain of interest. The rest of months
consider experiencing rainy season in November-April.
1. Prevailing Winds
The streamlines of prevailing wind for the level of 850 mb during Southern Hemisphere
summer in Indonesia region is shown in Figure 8. The low level westerly has relationship with the
rainy season in Southern Hemisphere of Indonesia region.
156
Yunus S. Swarinoto
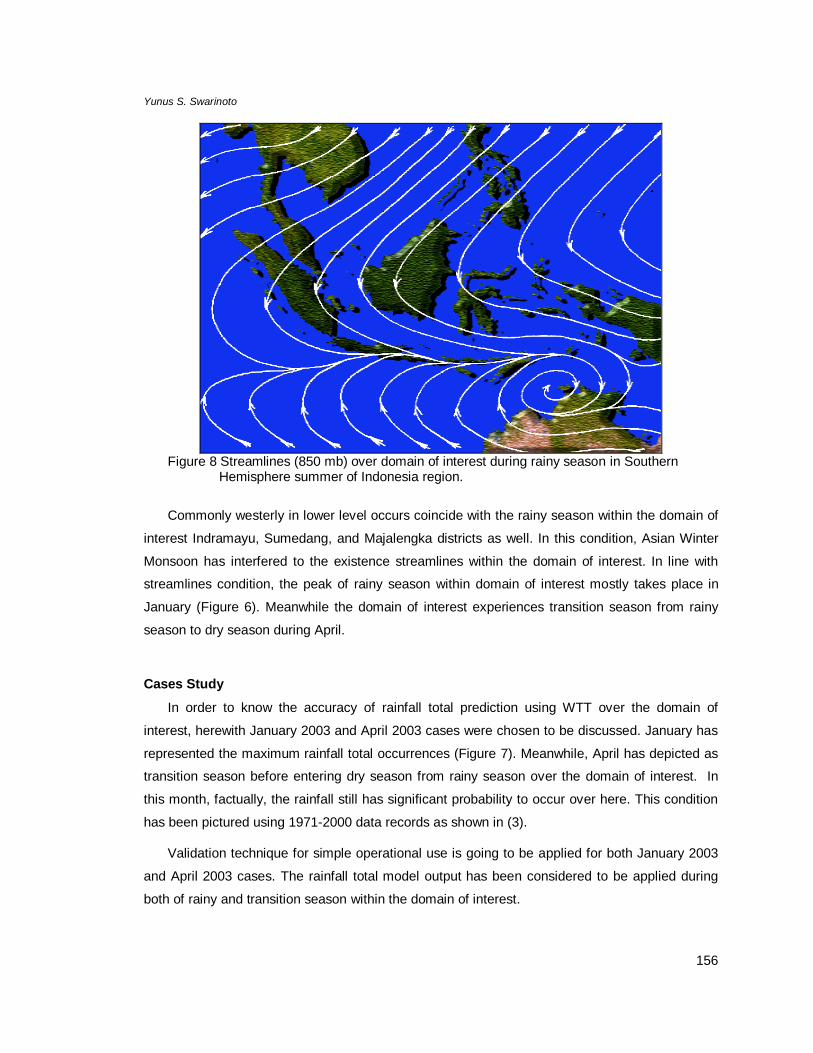
Figure 8 Streamlines (850 mb) over domain of interest during rainy season in Southern
Hemisphere summer of Indonesia region.
Commonly westerly in lower level occurs coincide with the rainy season within the domain of
interest Indramayu, Sumedang, and Majalengka districts as well. In this condition, Asian Winter
Monsoon has interfered to the existence streamlines within the domain of interest. In line with
streamlines condition, the peak of rainy season within domain of interest mostly takes place in
January (Figure 6). Meanwhile the domain of interest experiences transition season from rainy
season to dry season during April.
Cases Study
In order to know the accuracy of rainfall total prediction using WTT over the domain of
interest, herewith January 2003 and April 2003 cases were chosen to be discussed. January has
represented the maximum rainfall total occurrences (Figure 7). Meanwhile, April has depicted as
transition season before entering dry season from rainy season over the domain of interest. In
this month, factually, the rainfall still has significant probability to occur over here. This condition
has been pictured using 1971-2000 data records as shown in (3).
Validation technique for simple operational use is going to be applied for both January 2003
and April 2003 cases. The rainfall total model output has been considered to be applied during
both of rainy and transition season within the domain of interest.
157
Validation Technique for Simple Operational Use
DATA
Monthly rainfall total data taken from 3 districts namely Indramayu, Sumedang, and
Majalengka are used in data processing. These data as mentioned above are taken from 36
rainfall stations from Indramayu district, 12 rainfall stations from Sumedang district, and 12 rainfall
stations as well from Majalengka district. Firstly, the data records are in the format of daily rainfall
total. This format should be arranged into monthly rainfall total format.
The series of data are used from 1981-2002 to be computed for training period purposes.
This means that the process of models calibration is being taken during this certain period. Then,
the year of 2003 will be used for rainfall prediction case of Indramayu, Sumedang, and
Majalengka districts. The process of validation will be taken place in this year. The cases of study
will be January 2003 for representing rainfall season case and April 2003 for the first transition
season case in the domain of interest.
METHODS
Method of Prediction
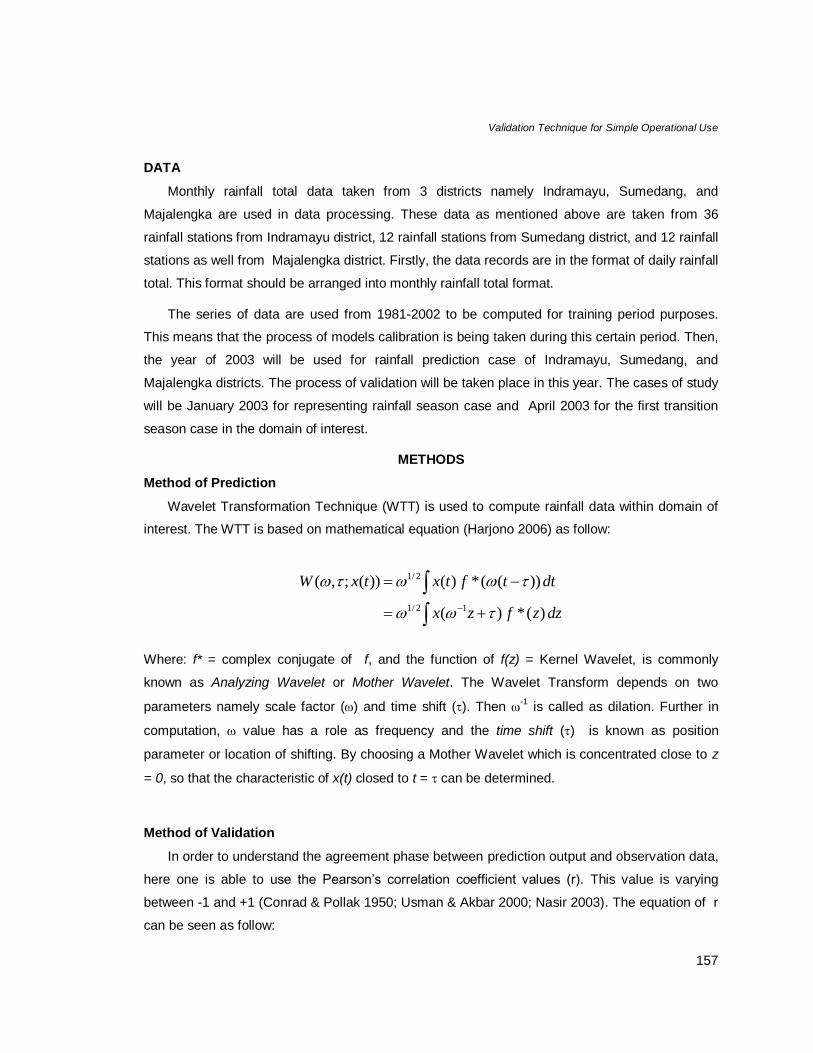
Wavelet Transformation Technique (WTT) is used to compute rainfall data within domain of
interest. The WTT is based on mathematical equation (Harjono 2006) as follow:
dzzfzx
dttftxtxW
)(*)(
))((*)())(;,(
12/1
2/1
Where: f* = complex conjugate of f, and the function of f(z) = Kernel Wavelet, is commonly
known as Analyzing Wavelet or Mother Wavelet. The Wavelet Transform depends on two
parameters namely scale factor () and time shift (). Then -1
is called as dilation. Further in
computation, value has a role as frequency and the time shift () is known as position
parameter or location of shifting. By choosing a Mother Wavelet which is concentrated close to z
= 0, so that the characteristic of x(t) closed to t = can be determined.
Method of Validation
In order to understand the agreement phase between prediction output and observation data,
here one is able to use the Pearson’s correlation coefficient values (r). This value is varying
between -1 and +1 (Conrad & Pollak 1950; Usman & Akbar 2000; Nasir 2003). The equation of r
can be seen as follow:
158
Yunus S. Swarinoto
nn
n
yx
xy
yxr
1
2
1
2
1),(
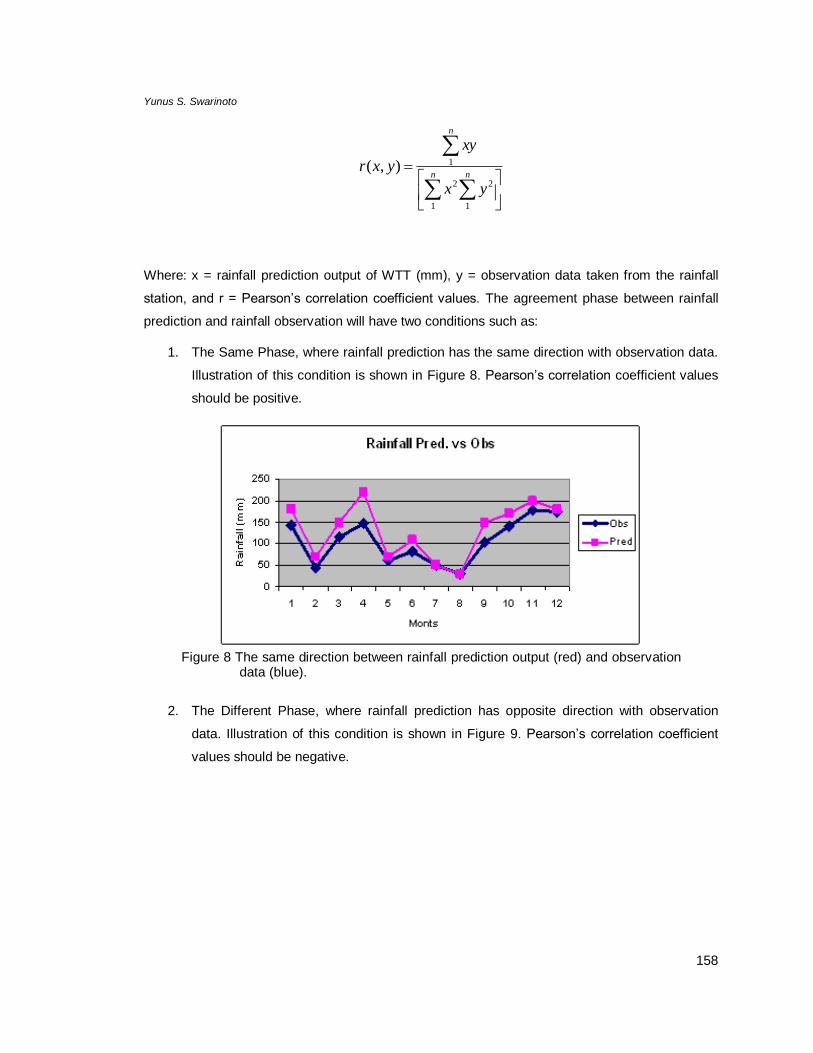
Where: x = rainfall prediction output of WTT (mm), y = observation data taken from the rainfall
station, and r = Pearson’s correlation coefficient values. The agreement phase between rainfall
prediction and rainfall observation will have two conditions such as:
1. The Same Phase, where rainfall prediction has the same direction with observation data.
Illustration of this condition is shown in Figure 8. Pearson’s correlation coefficient values
should be positive.
Figure 8 The same direction between rainfall prediction output (red) and observation
data (blue).
2. The Different Phase, where rainfall prediction has opposite direction with observation
data. Illustration of this condition is shown in Figure 9. Pearson’s correlation coefficient
values should be negative.
159
Validation Technique for Simple Operational Use
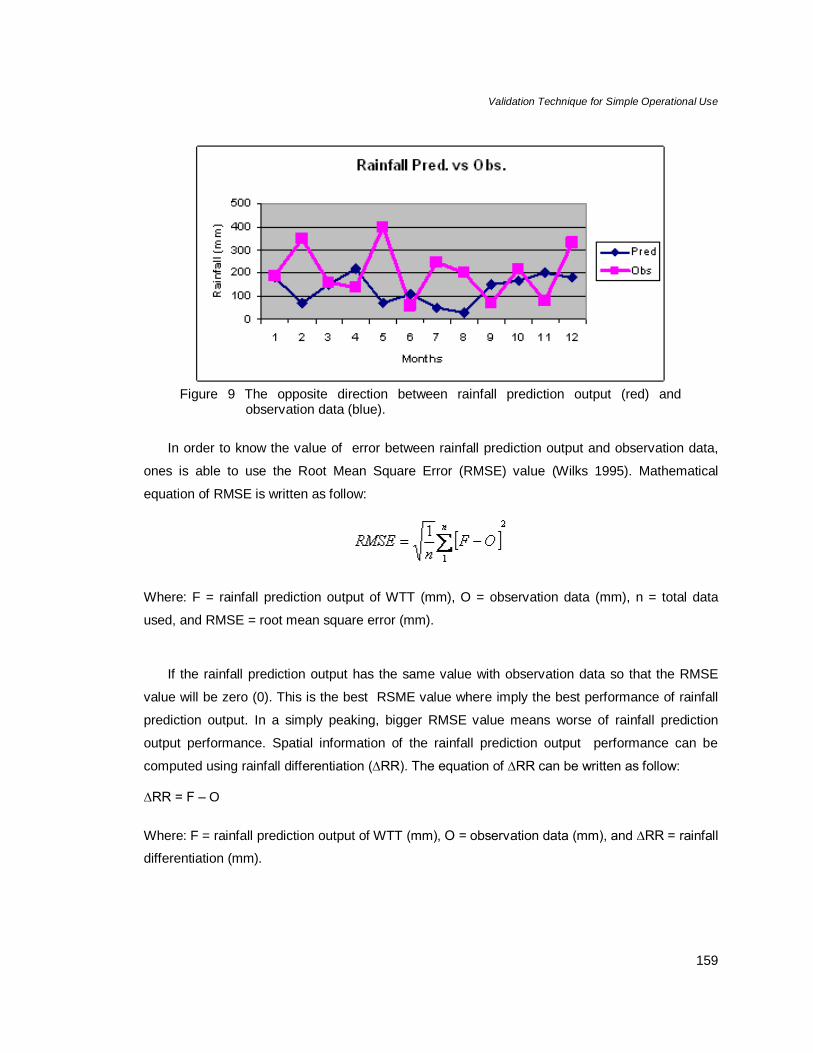
Figure 9 The opposite direction between rainfall prediction output (red) and
observation data (blue).
In order to know the value of error between rainfall prediction output and observation data,
ones is able to use the Root Mean Square Error (RMSE) value (Wilks 1995). Mathematical
equation of RMSE is written as follow:
Where: F = rainfall prediction output of WTT (mm), O = observation data (mm), n = total data
used, and RMSE = root mean square error (mm).
If the rainfall prediction output has the same value with observation data so that the RMSE
value will be zero (0). This is the best RSME value where imply the best performance of rainfall
prediction output. In a simply peaking, bigger RMSE value means worse of rainfall prediction
output performance. Spatial information of the rainfall prediction output performance can be
computed using rainfall differentiation (∆RR). The equation of ∆RR can be written as follow:
∆RR = F – O
Where: F = rainfall prediction output of WTT (mm), O = observation data (mm), and ∆RR = rainfall
differentiation (mm).

160
Yunus S. Swarinoto
∆RR value should be computed for every station data. Then, ∆RR value has been plotted
spatially using Geo-graphical Information System (GIS) software (Prahasta 2005a). Intersection
Mode in overlay processing is used in this case for providing spatial information (Prahasta
2005b). Mathematical equation for this condition is written as follow:
∆RR = File(Pred) ∩ File(Obs)
Where: F = rainfall prediction output of WTT (mm), O = observation data (mm), and ∆RR = spatial
rainfall differentiation (mm) as overlay product of intersection mode.
RESULTS AND DISCUSSION
January 2003 Case
Results of rainfall total prediction output using WTT within domain of interest in January 2003
(Figure 10). Northern part of the domain of interest shows rainfall total of 100-200 mm per month
and Southern part ones shows more than 200 mm per month. Commonly during rainy season,
Northern part of domain of interest shows less rainfall total than Southern part. This rainfall
prediction condition is relied on the topography. Southern part of domain of interest has relatively
higher topography than northern part.
161
Validation Technique for Simple Operational Use
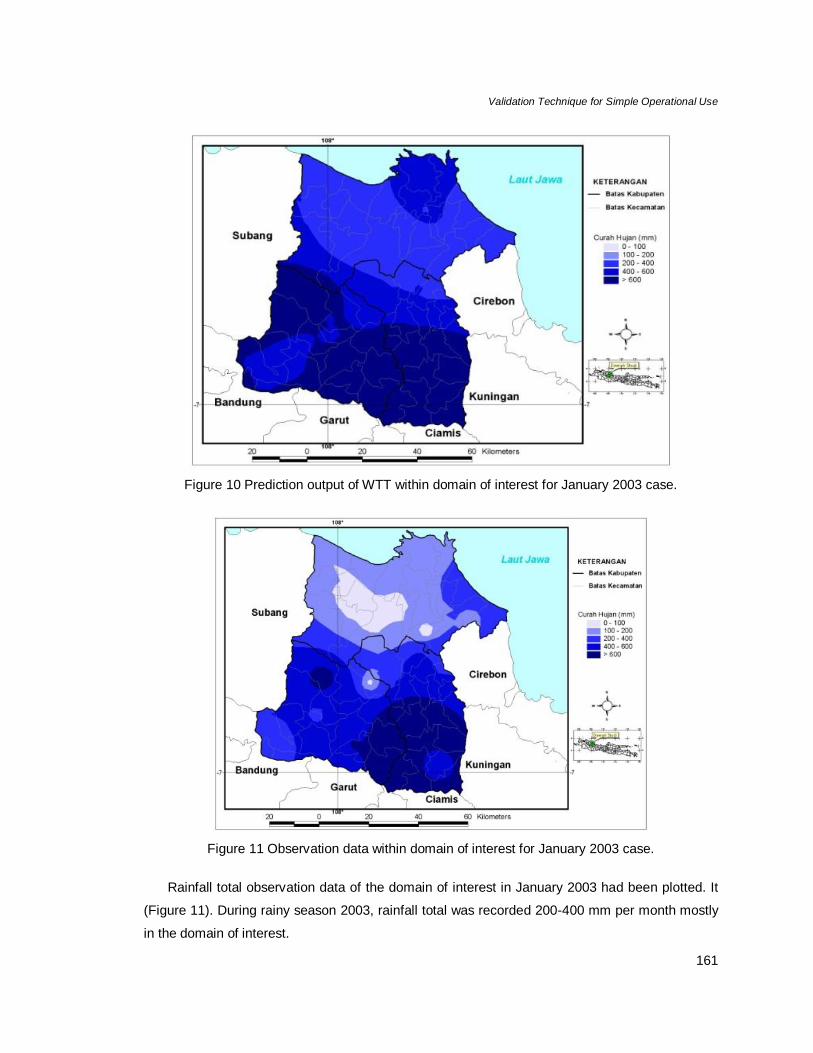
Figure 10 Prediction output of WTT within domain of interest for January 2003 case.
Figure 11 Observation data within domain of interest for January 2003 case.
Rainfall total observation data of the domain of interest in January 2003 had been plotted. It
(Figure 11). During rainy season 2003, rainfall total was recorded 200-400 mm per month mostly
in the domain of interest.
162
Yunus S. Swarinoto
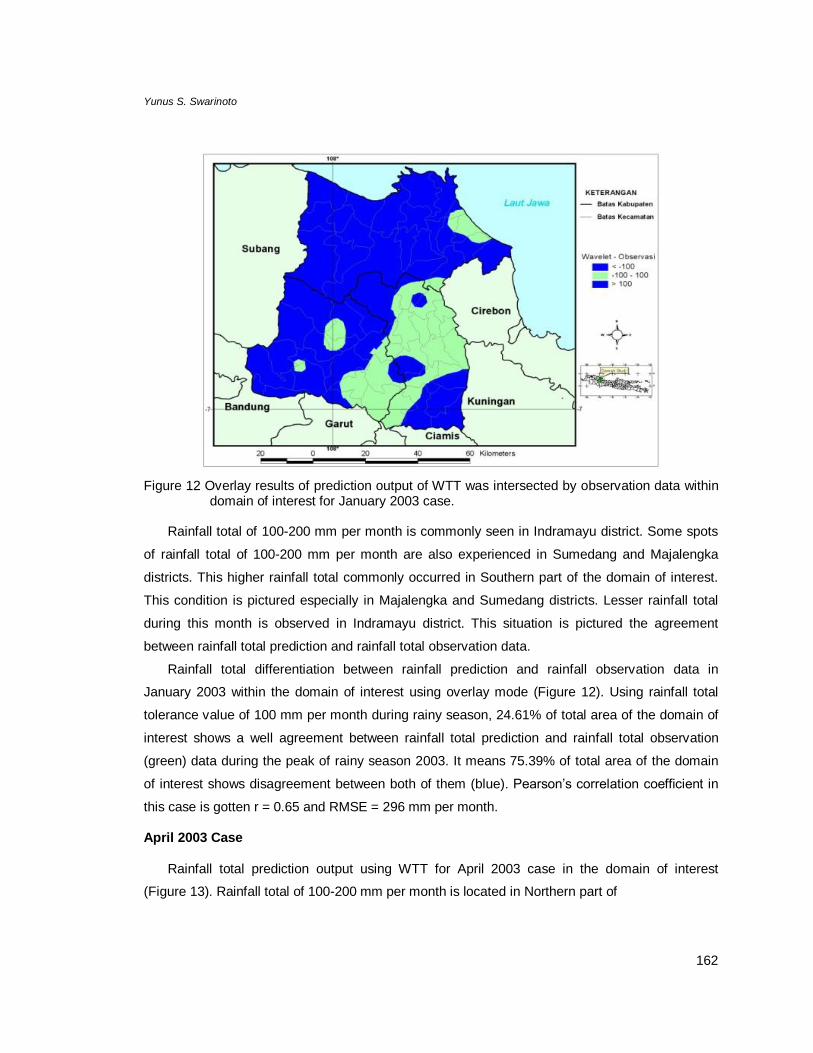
Figure 12 Overlay results of prediction output of WTT was intersected by observation data within
domain of interest for January 2003 case.
Rainfall total of 100-200 mm per month is commonly seen in Indramayu district. Some spots
of rainfall total of 100-200 mm per month are also experienced in Sumedang and Majalengka
districts. This higher rainfall total commonly occurred in Southern part of the domain of interest.
This condition is pictured especially in Majalengka and Sumedang districts. Lesser rainfall total
during this month is observed in Indramayu district. This situation is pictured the agreement
between rainfall total prediction and rainfall total observation data.
Rainfall total differentiation between rainfall prediction and rainfall observation data in
January 2003 within the domain of interest using overlay mode (Figure 12). Using rainfall total
tolerance value of 100 mm per month during rainy season, 24.61% of total area of the domain of
interest shows a well agreement between rainfall total prediction and rainfall total observation
(green) data during the peak of rainy season 2003. It means 75.39% of total area of the domain
of interest shows disagreement between both of them (blue). Pearson’s correlation coefficient in
this case is gotten r = 0.65 and RMSE = 296 mm per month.
April 2003 Case
Rainfall total prediction output using WTT for April 2003 case in the domain of interest
(Figure 13). Rainfall total of 100-200 mm per month is located in Northern part of
163
Validation Technique for Simple Operational Use
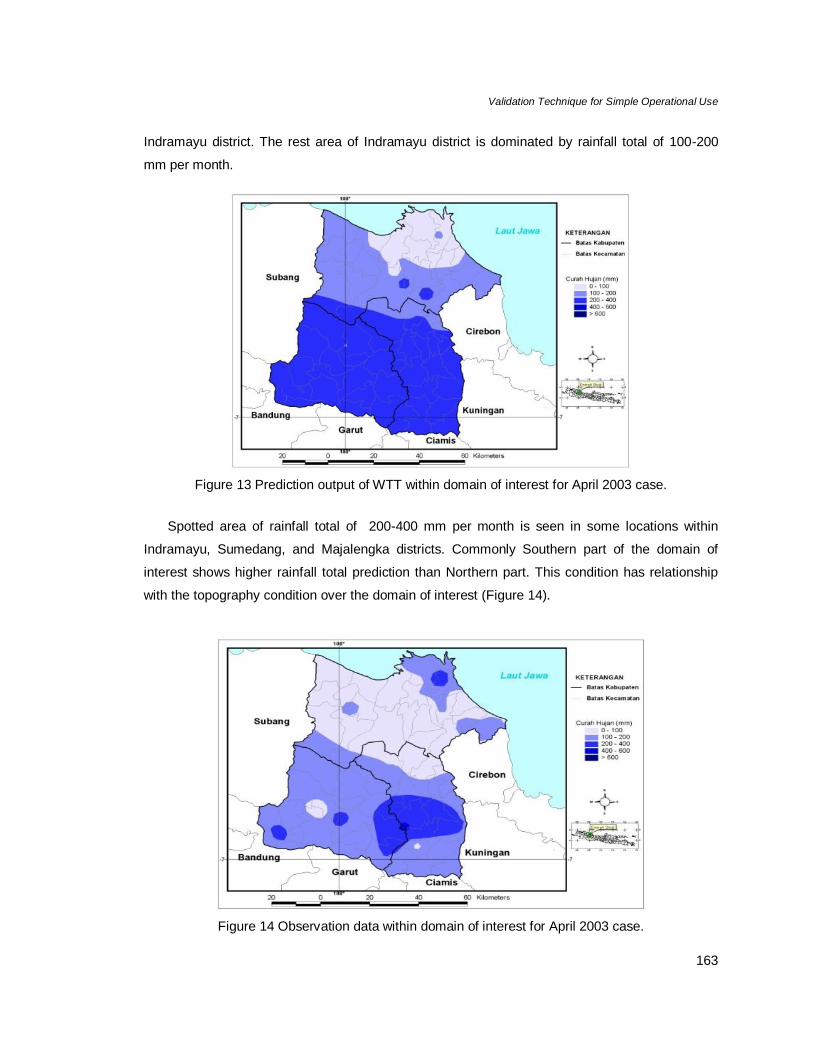
Indramayu district. The rest area of Indramayu district is dominated by rainfall total of 100-200
mm per month.
Figure 13 Prediction output of WTT within domain of interest for April 2003 case.
Spotted area of rainfall total of 200-400 mm per month is seen in some locations within
Indramayu, Sumedang, and Majalengka districts. Commonly Southern part of the domain of
interest shows higher rainfall total prediction than Northern part. This condition has relationship
with the topography condition over the domain of interest (Figure 14).
Figure 14 Observation data within domain of interest for April 2003 case.
164
Yunus S. Swarinoto
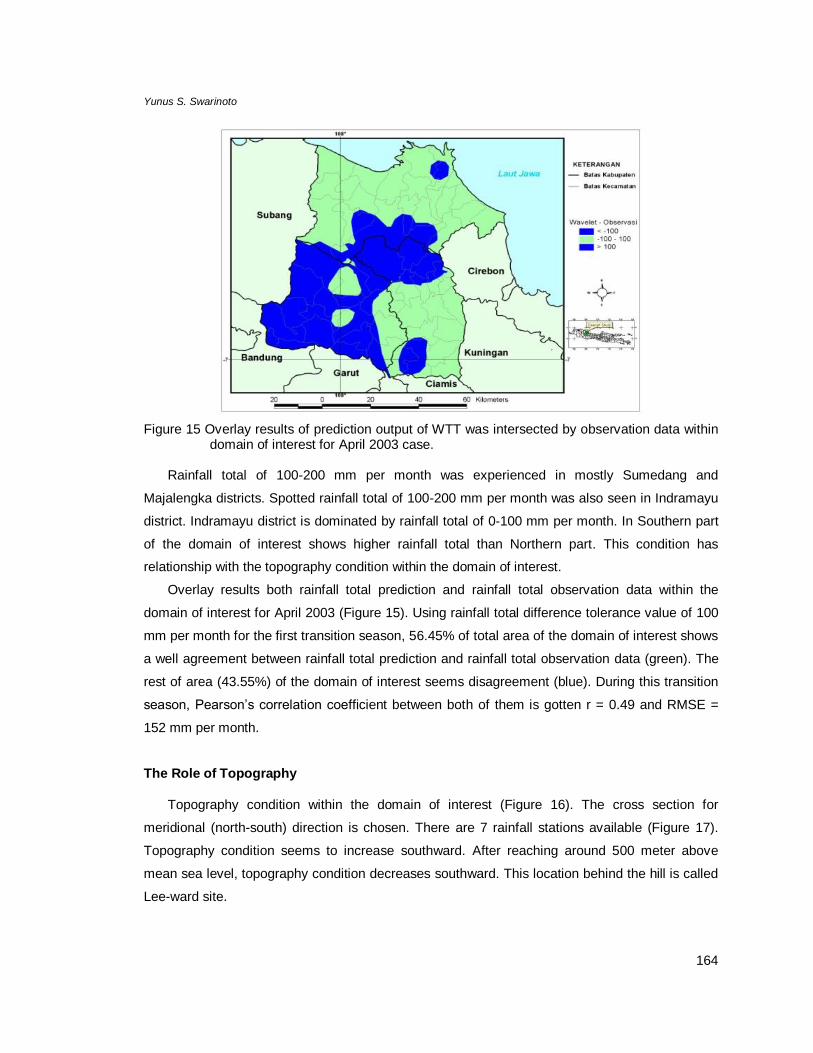
Figure 15 Overlay results of prediction output of WTT was intersected by observation data within
domain of interest for April 2003 case.
Rainfall total of 100-200 mm per month was experienced in mostly Sumedang and
Majalengka districts. Spotted rainfall total of 100-200 mm per month was also seen in Indramayu
district. Indramayu district is dominated by rainfall total of 0-100 mm per month. In Southern part
of the domain of interest shows higher rainfall total than Northern part. This condition has
relationship with the topography condition within the domain of interest.
Overlay results both rainfall total prediction and rainfall total observation data within the
domain of interest for April 2003 (Figure 15). Using rainfall total difference tolerance value of 100
mm per month for the first transition season, 56.45% of total area of the domain of interest shows
a well agreement between rainfall total prediction and rainfall total observation data (green). The
rest of area (43.55%) of the domain of interest seems disagreement (blue). During this transition
season, Pearson’s correlation coefficient between both of them is gotten r = 0.49 and RMSE =
152 mm per month.
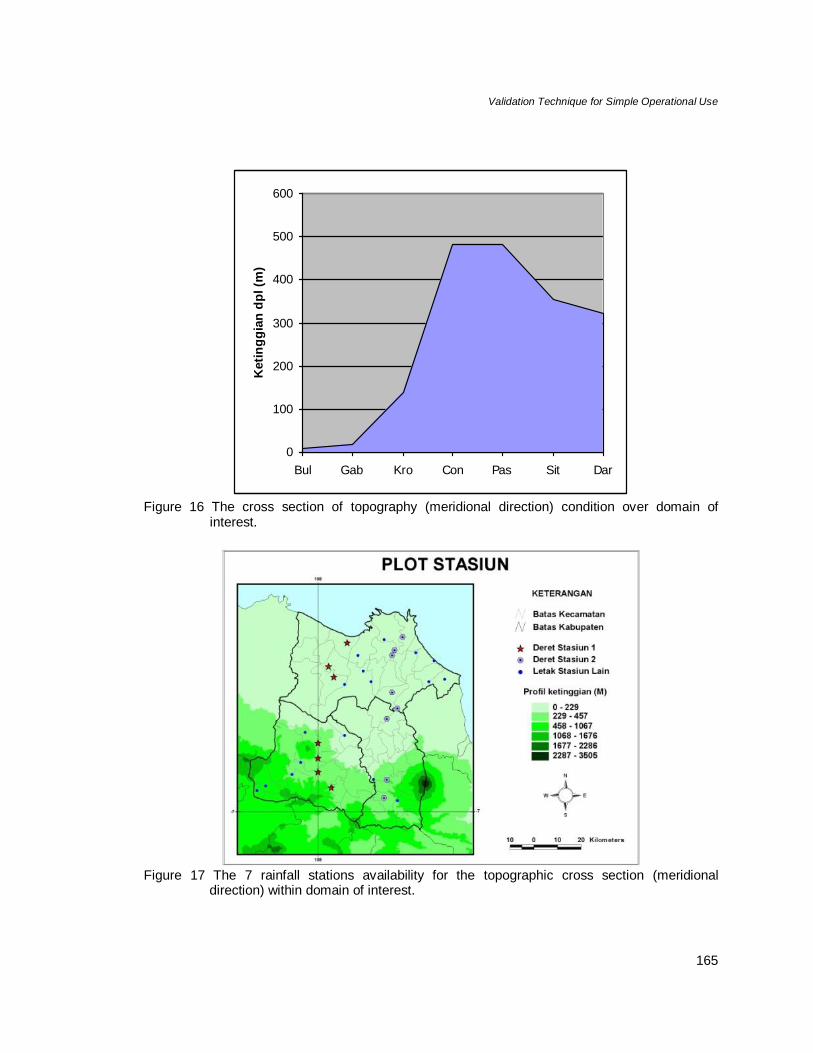
The Role of Topography
Topography condition within the domain of interest (Figure 16). The cross section for
meridional (north-south) direction is chosen. There are 7 rainfall stations available (Figure 17).
Topography condition seems to increase southward. After reaching around 500 meter above
mean sea level, topography condition decreases southward. This location behind the hill is called
Lee-ward site.
165
Validation Technique for Simple Operational Use
0
100
200
300
400
500
600
Bul Gab Kro Con Pas Sit Dar
Keti
ng
gia
n d
pl (m
)
Figure 16 The cross section of topography (meridional direction) condition over domain of
interest.
Figure 17 The 7 rainfall stations availability for the topographic cross section (meridional
direction) within domain of interest.
166
Yunus S. Swarinoto
Meridional Barat Wilayah Daerah Studi
-200
-100
0
100
200
300
400
500
600
700
6.2 6.4 6.6 6.8 7
Lintang
Wa
ve
-Ob
s (
mm
)
Jan
Apr
Jul
Okt
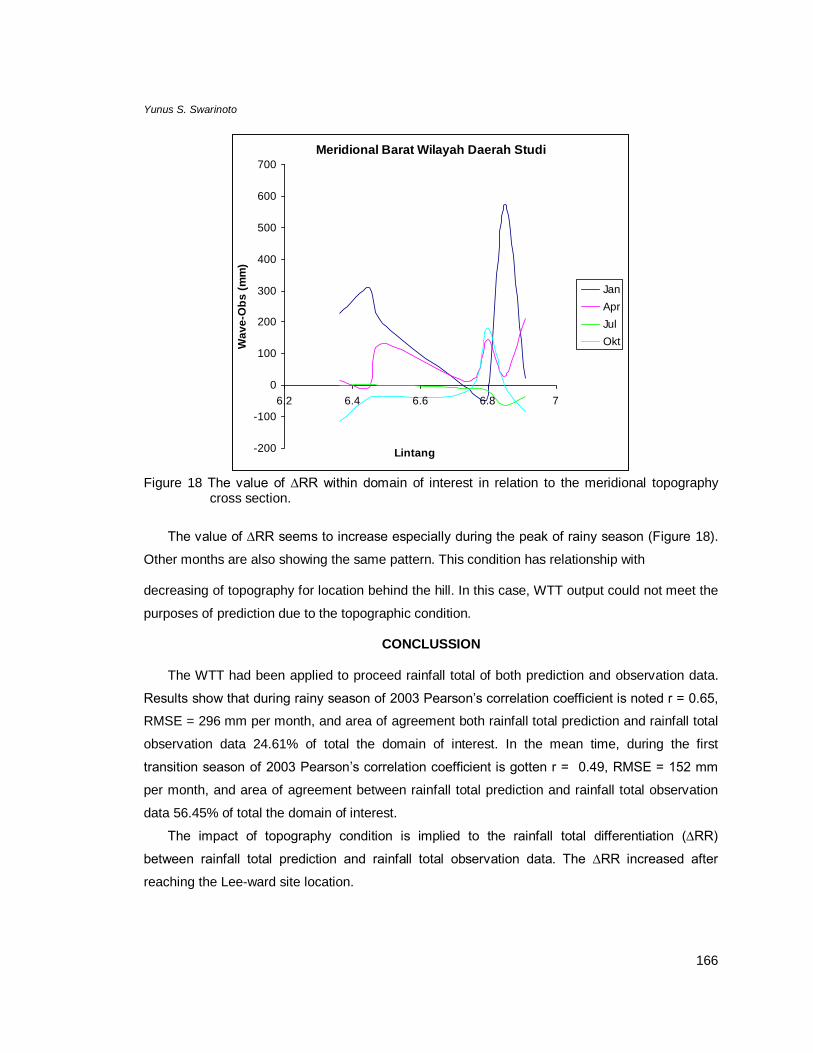
Figure 18 The value of ∆RR within domain of interest in relation to the meridional topography
cross section.
The value of ∆RR seems to increase especially during the peak of rainy season (Figure 18).
Other months are also showing the same pattern. This condition has relationship with
decreasing of topography for location behind the hill. In this case, WTT output could not meet the
purposes of prediction due to the topographic condition.
CONCLUSSION
The WTT had been applied to proceed rainfall total of both prediction and observation data.
Results show that during rainy season of 2003 Pearson’s correlation coefficient is noted r = 0.65,
RMSE = 296 mm per month, and area of agreement both rainfall total prediction and rainfall total
observation data 24.61% of total the domain of interest. In the mean time, during the first
transition season of 2003 Pearson’s correlation coefficient is gotten r = 0.49, RMSE = 152 mm
per month, and area of agreement between rainfall total prediction and rainfall total observation
data 56.45% of total the domain of interest.
The impact of topography condition is implied to the rainfall total differentiation (∆RR)
between rainfall total prediction and rainfall total observation data. The ∆RR increased after
reaching the Lee-ward site location.
167
Validation Technique for Simple Operational Use
ACKNOWLEDGEMENT
The writer thanks to the Research Development Center of Indonesian Meteorological
Climatological and Geophysical Agency (BMKG) for the permission of using WTT tool in data
processing that are used in this paper.
REFERENCES
[BMG] Badan Meteorologi dan Geofisika. 2003. Prakiraan Musim Untuk Pertanian Di Kabupaten Indramayu. Laporan Penelitian TA 2003, PUSAT SISDATIN Klimatologi dan Kualitas Udara, BMG, Jakarta.
[BMG] Badan Meteorologi dan Geofisika. 2008. Prakiraan Musim Hujan 2008/2009 di Indonesia. Badan Meteorologi dan Geofisika, Jakarta, 92 hal.
Conrad V & Pollak LW. 1950. Methods in Climatology. Harvard University Press, Cambridge, 458 hal.
Harijono SWB. 2006. Development and Validation of Climate Model Based on Wavelet Transformation. Proceeding of the International Workshop on Agrometeorology, BMG Jakarta, ISBN 979-15549-1-9, hal. 196-200.
Lee HS. 2006. Numerical Weather Prediction. ASEAN-ROK Cooperation Training Workshop for the Use of Numerical Weather Prediction Product, Seoul, South Korea, 31-61 pp.
Nazir M. 2003. Metode Penelitian. Penerbit PT Ghalia Indonesia, Jakarta, 544 hal.
Prahasta E. 2005a. Sistem Informasi Geografis. Konsep-Konsep Dasar. Penerbit Informatika, Bandung, 334 hal.
Prahasta E. 2005b. Sistem Informasi Geografis. Tutorial ArcView. Penerbit Informatika, Bandung, 456 hal.
Robertson AW, Moron V, & Swarinoto YS. 2008. Seasonal predictability of daily rainfall statistics over Indramayu district, Indonesia. Int. J. Climatol. 29: 1449-1462 (2009). Published online in Wiley InterScience (www.interscience. wiley.com).
Sandy IM. 1982. A Preliminary an Ocean. Nature 401: 360-363. Statistical Investigation on the Rainfall of Java. Disertasi Doktor, 129 pp. Un-published.
Sandy IM. 1995. Atlas Republik Indonesia. Penerbit PT Indograf Bakti dan Jurusan Geografi FMIPA-UI, Depok.
168
Yunus S. Swarinoto
Swarinoto YS. 2001. Downscaling of Wind and Precipitation Over Indonesia dalam Report of Intensive Course on Dynamical Downscaling of Seasonal to Interannual Climate Prediction, Ward, M.N. & L., Sun (Ed.), The International Research Institute for Climate Prediction, Palisades, NY, hal. 85 – 101.
Usman H. & Akbar PS. 2000. Pengantar Statistik. Penerbit Bumi Aksara, Jakarta, 323 hal.
Webster M. 1990. Webster’s Ninth New Collegiate Dictionary. Merriam-Webster Inc., USA, 1564 hal.
Wilks DS. 1995. Statistical Methods in the Atmospheric Sciences. Academic Press Inc., San Diego, CA, 467 hal.