Embed Size (px)
Citation preview

Louisiana State UniversityLSU Digital Commons
LSU Doctoral Dissertations Graduate School
2010
Value-added processing of rice and rice by-productsRebecca C. SchrammLouisiana State University and Agricultural and Mechanical College
Follow this and additional works at: https://digitalcommons.lsu.edu/gradschool_dissertations
Part of the Engineering Science and Materials Commons
This Dissertation is brought to you for free and open access by the Graduate School at LSU Digital Commons. It has been accepted for inclusion inLSU Doctoral Dissertations by an authorized graduate school editor of LSU Digital Commons. For more information, please [email protected].
Recommended CitationSchramm, Rebecca C., "Value-added processing of rice and rice by-products" (2010). LSU Doctoral Dissertations. 1576.https://digitalcommons.lsu.edu/gradschool_dissertations/1576

VALUE-ADDED PROCESSING OF
RICE AND RICE BY-PRODUCTS
A Dissertation
Submitted to the Graduate Faculty of the
Louisiana State University and
Agricultural and Mechanical College
in partial fulfillment of the
requirements for the degree of
Doctor of Philosophy
in
The Interdepartmental Program in Engineering Science
by
Rebecca C. Schramm
B.S., Louisiana State University, 2004
M.S., Louisiana State University, 2006
May 2010

ii
ACKNOWLEDGMENTS
The presented research was supported by funding from the Louisiana Rice Research
Board and the Louisiana Board of Regents, by the use of equipment at the Rice Research Station
at Crowley and the Food Science Department at Louisiana State University, and by the
assistance of many members of the Biological and Agricultural Department and the College of
Engineering. Thank you for your support and assistance. To Nicole Walker, Akanksha Kanitkar,
and Beatrice Terigar, for all their help over the last several years, and to Sungjoon Jang and
Jimmy Xu for their assistance with HPLC, I express a very special thank you. Thank you to C.
Rush, the developer of the purple rice line investigated, for his contributions of insight and
knowledge. To my committee, Cristina Sabliov, Steve Hall, Jim Wandersee, and Jeff Gillespie,
thank you for sharing your time and talents. To my major professor, Marybeth Lima, thank you
for your support in this endeavor. To my family and friends, thank you for your support. A
special thank you goes to my husband, Mike, and our dear friend, Riki Reid. I would like to
dedicate this work to my father, Frank Canfield, who never doubted that I could do anything if I
worked for it.

iii
TABLE OF CONTENTS
ACKNOWLEDGMENTS .............................................................................................................. ii
ABSTRACT…. .............................................................................................................................. vi
CHAPTER 1. BACKGROUND AND JUSTIFICATION ............................................................. 1 1.1 Introduction ........................................................................................................................... 1
1.2 References ............................................................................................................................. 6
CHAPTER 2. MULTI-SCALE EVALUATION AND CORRELATION OF MILLED RICE
QUALITY FOR CLEARFIELD 161...................................................................... 8 2.1 Introduction ........................................................................................................................... 8 2.2 Materials and Methods .......................................................................................................... 9
2.2.1 Sample Preparation ...................................................................................................... 10 2.2.2 Processing .................................................................................................................... 11
2.2.3 Measurements .............................................................................................................. 14 2.2.4 Statistical Analysis ....................................................................................................... 14
2.3 Results ................................................................................................................................. 15
2.4 Conclusions ......................................................................................................................... 20
2.5 References ........................................................................................................................... 21
CHAPTER 3. PILOT SCALE MILL CHARACTERIZATION OF JAZZMAN: FIRST US
BRED AND RELEASED LONG GRAIN AROMATIC RICE VARIETY ........ 23 3.1 Introduction ......................................................................................................................... 23 3.2 Materials and Methods ........................................................................................................ 25
3.2.1 Sample Preparation ...................................................................................................... 25 3.2.2 Processing .................................................................................................................... 26
3.2.3 Measurements .............................................................................................................. 26 3.2.4 Statistical Analysis ....................................................................................................... 28
3.3 Results ................................................................................................................................. 28
3.3.1 Bran Removed and Milling Quality ............................................................................. 28 3.3.2 Bran Results ................................................................................................................. 28 3.3.3 Head Rice Recovery and Milling Yield ....................................................................... 29 3.3.4 Quantification of Visual Appearance ........................................................................... 32
3.3.5 Optimal Milling Performance ...................................................................................... 33 3.4 Conclusions ......................................................................................................................... 35 3.5 References ........................................................................................................................... 35
CHAPTER 4. LAB SCALE CHARACTERIZATION OF A PURPLE RICE VARIETY:
EXAMINATION OF MILLING QUALITY AND DETERMINATION OF
ANTHOCYANIN AND OIL CONCENTRATIONS ACROSS THE BRAN
LAYER ................................................................................................................. 37 4.1 Introduction ......................................................................................................................... 37 4.2 Materials and Methods ........................................................................................................ 40
4.2.1 Sample Preparation ...................................................................................................... 40

iv
4.2.2 Processing .................................................................................................................... 40 4.2.3 Measurements .............................................................................................................. 40 4.2.4 Statistical Analysis ....................................................................................................... 42
4.3 Results ................................................................................................................................. 43
4.3.1 Milling Quality ............................................................................................................. 43 4.3.2 Anthocyanin Concentration ......................................................................................... 44 4.3.3 Oil Concentration ......................................................................................................... 47
4.4 Conclusions ......................................................................................................................... 48 4.5 References ........................................................................................................................... 49
CHAPTER 5. PILOT SCALE RICE MILL EVALUATION OF OIL CONCENTRATION
ACROSS THE BRAN LAYER OF COCODRIE, CLEARFIELD 161, AND
JAZZMAN WITH CORRELATION OF NEAR-INFRARED MEASUREMENT
AND HEXANE-EXTRACTION.......................................................................... 52 5.1 Introduction ......................................................................................................................... 52
5.2 Materials and Methods ........................................................................................................ 54 5.2.1 Sample Preparation ...................................................................................................... 54
5.2.2 Processing .................................................................................................................... 54 5.2.3 Measurements .............................................................................................................. 55 5.2.4 Statistical Analysis ....................................................................................................... 56
5.3 Results ................................................................................................................................. 56
5.3.1 Oil Concentration by Variety ....................................................................................... 56 5.3.2 Oil Concentration by Bran Division ............................................................................ 57 5.3.3 Regression Models for Milled Rice NIT Values and Measured Bran
Oil Concentration ......................................................................................................... 59 5.4 Conclusions ......................................................................................................................... 62
5.5 References ........................................................................................................................... 63
CHAPTER 6. CONCLUSIONS AND RECOMMENDATIONS FOR ADDITIONAL
RESEARCH .......................................................................................................... 65 6.1 Conclusions: Scientific ....................................................................................................... 65
6.2 Conclusions: Economic Impact .......................................................................................... 67 6.2.1 Broken Kernels ............................................................................................................ 67 6.2.2 Specialty Varieties ....................................................................................................... 67 6.2.3 Rice Bran Oil ............................................................................................................... 68
6.3 Recommendations ............................................................................................................... 68 6.4 References ........................................................................................................................... 69
BIBLIOGRAPHY ......................................................................................................................... 70
APPENDIX A: MULTI-SCALE DATA FOR CLEARFIELD 161 ............................................. 75
APPENDIX B: PILOT SCALE DATA FOR JAZZMAN ........................................................... 76
APPENDIX C: ANTHOCYANIN CONCENTRATION DATA BY HPLC PEAK ................... 77

v
APPENDIX D: NEAR INFARED MEASUREMENTS BY VARIETY ..................................... 78
VITA………… ............................................................................................................................. 79

vi
ABSTRACT
World competition has encouraged United States rice farmers and rice mills to be
efficient in farming and production practices. Efforts to augment economic competitiveness
include development of new varieties, improvements in milling practices, and identification of
uses for rice products and by-products. The research detailed in this dissertation adds to the body
of knowledge in milling practices and identification of uses for rice bran. To improve the
prediction of milled rice quality at industrial scale, correlations for milling quality among
laboratory, pilot, and industrial scale mills were identified for Clearfield 161. Final industrial
product whiteness was ten points higher than for polished rice at medium and high pilot scale
settings. Jazzman, the first US-bred jasmine-type rice variety, was released by the LSU AgCenter
Rice Research Station in 2009 to compete for a share of the aromatic rice market. Pilot scale
evaluation of Jazzman’s milling quality supported lab scale evaluation and provided additional
data for milling optimization. With milling yields from 86 to 93%, Jazzman presented as a high-
yield, good-milling aromatic long grain rice variety. A purple rice variety (line number MCR02-
1576) was assessed for milling quality, and its bran for oil and anthocyanin concentration.
Results showed a low milling recovery (<50%); low whiteness (<15%) values indicated pigment
remained in the kernel. Anthocyanin concentration increased linearly across the entire bran layer.
Oil concentration increased linearly across the inner bran layer with a mean of 22 percent.
Processing the inner bran layer would maximize anthocyanin and oil recovery. As rice bran oil is
a potential renewable energy source, the oil concentration across the bran layer of Jazzman,
Clearfield 161, and Cocodrie were determined with hexane extraction and near infrared
technology (NIT). Clearfield 161 had total oil concentration 1.83 times that of Jazzman and 2.11
times that of Cocodrie. Predictions of oil content across the bran layer were made from NIT

vii
measurements and compared to hexane extraction results. Collectively this research indicates
that value-added processing of rice and rice bran which optimizes milling yields and recovery of
high-value components from the bran layer would favorably impact economic competiveness.

1
CHAPTER 1. BACKGROUND AND JUSTIFICATION
1.1 Introduction
World competition has impacted the rice producing states in the United States; USA rice
production accounts for approximately two percent of total global rice production and exceeded
640 million metric tons in 2007 (1, 2). Despite increased rice yield per acre of nearly 1134
kilograms (2500 pounds) over the last few decades (3), exports of rice from the United States
have declined, showing a drop of over forty-three percent between 2004 and February 2009 (4).
A thirteen percent decline is forecast for 2009 exports over 2008 exports, which will impact
several regions of the country (5), as California, Missouri, Arkansas, Texas, Mississippi, and
Louisiana are the six major rice producing states in the United States (3).
This competition forces United States rice farmers and rice mills to be efficient in
farming and production practices. Efforts to augment competitiveness have included
development of new varieties, implementation of new farming techniques, improvements in
milling practices, and identification of uses for products and by-products. This research focused
on enhancing rice quality by improving processing (milling), and on identifying alternative uses
for rice bran, a by-product of the rice milling process.
Rice quality is characterized by standard parameters including milling recovery, head rice
recovery, milling yield, degree of milling (DOM), transparency, and whiteness. Visual quality is
quantified using industry measurements of whiteness, transparency, and degree of milling (6),
which relate to the amount of bran removed and visual appearance of rice kernels. Milling yield
refers to the weight of unbroken milled rice in ratio to the weight of milled rice. Head rice
recovery measures whole kernel milled rice in ratio to the weight of rough rice processed (7).
Millers use both milling yield and head rice recovery to evaluate overall rice kernel quality. The

2
United States Standards for Brown Rice for Processing (USDA) define a broken kernel as a
kernel of rice that is less than three-fourths of a kernel for yield determination (8). DOM is a
measure of the amount of the bran layer and germ removed by milling or processing (9). The
amount of bran removed from shelled rice is a measure of the quality of the milled rice. To
achieve a well-milled sample, the Standards Committee of the American Association of Cereal
Chemists (2000) suggests a goal of a twelve percent weight reduction in the difference between
shelled rice and milled rice weights during the milling process (10). Whiteness and transparency
are measurements of physical rice kernel appearance (11).
Laboratory scale evaluation has traditionally provided milling quality information on new
rice variety releases and in most cases has successfully predicted industrial scale performance
(9). Different scale rice mills vary by capacity, processing format, and the number of milling
chambers or breaks employed in the milling process. A McGill mill, a laboratory scale mill often
used in testing, operates in batch format by removing bran from shelled rice in one chamber.
LSU’s pilot scale mill uses a stacked milling unit, with an abrasion chamber over a friction
chamber, and continuous processing. Commercial mills operate in a continuous process using
three or four milling units, referred to as milling breaks. Each break uses abrasion or friction to
remove the bran layer (12). Milling studies at laboratory scale use samples of 125-150 grams to
evaluate milling performance. The pilot scale mill uses a larger sample (11.5 kg) than the
laboratory scale mill and a smaller sample than that required per test at industrial scale (900 kg)
(9). Pilot scale milling provides a similar operating process to industrial scale, and when coupled
with the smaller sample size required, makes testing at the pilot scale mill more logistically
manageable and economically feasible for study (9).

3
Incidences of inaccuracy in predicting milling performance at industrial scale from
laboratory scale testing have occurred (9,13). Pilot scale milling evaluation of Cocodrie
addressed the problems encountered in scaling between laboratory and industrial scale for
Cocodrie (9). The results of an optimization study conducted at the pilot scale provided useful
information on the milling characteristics of Cocodrie which improved industrial scale milling of
this variety (9). The success of this study to improve industrial scale milling performance led to
this study’s evaluation of Jazzman, a new rice variety released in 2009, and inspired questions
about the predictive potential for milling characteristics of rice varieties among laboratory, pilot,
and industrial scale mills.
The LSU AgCenter Crowley Rice Research Station has released 42 rice varieties which
have enhanced rice crop value over its 100 year history (14). The development of a new rice
variety progresses in a series of steps from small seed samples appropriate for laboratory scale
testing to supplies large enough for release as seed stock (15). The US demand for jasmine-type
rice has increased over the last decade (16); most of this demand is currently met with imports.
Jasmine 85, an aromatic rice variety developed by the International Rice Research Institute, was
released in Texas and has been grown on limited acreage in the southern United States. Jasmine
85 failed to meet consumer expectations due to gray coloring in the kernels and inferior aroma
(16). In 1992, the LSU AgCenter Rice Research Station specialty rice breeding program was
formed to develop aromatic rice varieties suitable for growing in Louisiana with the goal of
competing for the aromatic rice niche market in the United States. Jazzman, the first US-bred
jasmine-type rice was released by the LSU AgCenter Rice Research Station in 2009 (17), and is
a long grain aromatic rice variety developed from a cross between an Arkansas variety, Ahrent,
and an unreleased aromatic Chinese rice line 96a-8 (17). Jazzman exhibited good milling yield

4
and good milling quality in early laboratory scale screening tests (17). Jazzman has the potential
to compete for a share of the aromatic rice market in the United States (17).
Line number MCR02-1576, a purple rice variety, was developed at the LSU AgCenter
Rice Research Station in 1998 from a cross between Cypress and Hitan Kitan (C98-992) (2).
Cypress, a long grain variety, was developed at the Rice Research Station in 1993; Hitan Kitan, a
traditional purple variety, originated in Sri Lanka (2). The rice station provided a sample of line
number MCR02-1576 for assessment of milling quality characteristics and evaluation of
potential value-adding phytochemicals within the bran layer. Rice bran contains an array of
health enhancing phytochemicals (7, 8).
Rice bran contains high quality oil and protein; cholesterol-lowering waxes; anti-tumor
compounds like rice bran saccharide; antioxidants, including vitamin E and oryzanol; and in
pigmented varieties, anthocyanins (9). Natural organic chromophores, such as anthocyanins, are
used as pigments in electrical components, paints, optics, textiles (10), and foods (11).
Anthocyanins exhibit antioxidant and anti-carcinogenic activities, hold promise as natural
colorants, and show potential for photovoltaic applications. Anthocyanins have been used in
cereal products as natural pigments and for their health benefits (10). Natural anthocyanins,
extracted with acidified ethanol from several varieties of flowers, have found use as electron
transfer compounds in dye-sensitive solar cells (9). Plant source anthocyanins are safer than rare
metal oxides often used in solar cells, readily available from local sources, and easily extracted
with inexpensive solvents (9).
Another component of interest in rice bran is oil. Rice bran contains oil in concentrations
ranging from 10 to 23 percent by weight (12). Antioxidants, such as vitamin E and oryzanol,
found in rice bran oil may help slow the onset of diabetes and Alzheimer’s disease (13), and

5
appear to play a role in prevention of heart disease and multiple types of cancer (14). With
increasing world demand for energy, plant sources of oil have been investigated as alternative
energy sources. Rice bran oil, a renewable plant source of oil, has been investigated as stock
material for biodiesel (18). Biodiesel has been made from rice bran oil by a variety of methods
that have employed basic and acidic catalysts (15), metallic catalysts (16), and a biological
catalyst, lipase (17). Kanitkar et al. (18) explored microwave-assisted extraction of rice bran oil
and its effects on yield and oil properties. With methods of oil extraction and conversion of rice
bran oil to biodiesel under study (15, 16, 17, 18), the identification of high oil varieties of rice
and determination of the location of the highest concentration of oil in the bran layer would
provide avenues to increase oil recovery.
Optimization of the feedstock for the conversion of rice bran oil to biodiesel provides a
strategy for improving the economics of the conversion process. The identification of high oil
concentration varieties of rice and determination of the location of the highest concentration of
oil in the bran layer would provide avenues to increase oil recovery using a value-added
processing approach. With oil concentration in the rice bran layer characteristically varying from
10 to 23 percent by weight (19), the identification of high oil content rice variety improves the
potential for oil recovery by a ratio of 2.3 based on these literature values. Several methods for
determination of oil concentration in grains or grain products or by-products have been reported
in the literature. Traditionally, hexane has been used to extract oil from rice bran with the oil
concentration reported as a weight percent of oil recovered to bran processed. Another approach
to determining oil concentration in grains employs the use of near infrared technology (20). The
identification of high oil concentration fractions of the bran layer could further increase the
percentage of oil contained in a specific amount of bran material, and therefore the potential for

6
oil recovery. Rice varieties, with a high oil concentration in their bran layers, have potential as a
renewable, plant source for oil, usable in nutritional, pharmaceutical, or a number of industrial
applications.
1.2 References
1.1. International Rice Research Institute. World Rice Statistics (WRS): Rice statistics by
country. [Online]
http://beta.irri.org/solutions/index.php?option=com_content&task=view&id=250.
1.2. —. Rice around the world. [Online] http://www.irri.org/science/cnyinfo/index2.asp.
1.3. United States Department of Agriculture. National Agricultural Statistics Service: Quick
statistics on rice. [Online] [Cited: March 19, 2009.] ] United States Department of
Ahttp://nass.usda.gov:8080/QuickStats/index2.jsp#footnotes.
1.4. USDA. U.S. Export Sales Foreign Agricultural Service: Table 6, U.S. commercial rice
exports (last updated 10 February 2009). [Online] [Cited: March 19, 2009.]
http://www.ers.usda.gov/Briefing/Rice/Data/RICETABLE6.xls.
1.5. Childs N. U.S. 2008/09 All-Rice Export Forecast (RCS-09c) p.7. USDA Economic Research
Service. [Online] [Cited: March 12, 2009.] http://ers.usda.gov.
1.6. Singh R, Singh U, Khush G. Aromatic Rice. New Delhi : Oxford & IBH Pub, 2000.
1.7. IRRI International Rice Research Institute. Cereal Knowledge Banks. Quality
characteristics of milled rice. [Online] [Cited: September 29, 2009.]
http://www.knowledgebank.irri.org/riceQuality/default.htm#Qly01.htm.
1.8. USDA. Brown Rice Standards. [Online] [Cited: December 2009]
http://archive.gipsa.usda.gov/reference-library/standards/ricestandards-brown_rice.pdf
1.9. Hua N, Bengtson R, Schramm R, Patel T, Walker T, Lima, M. Optimization of yield and
quality parameters for the cocodrie rice variety as a function of harvest time. Applied
Engineering in Agriculture. 2006, Vol. 22, 1, pp. 95-99.
1.10. Bautista R, Siebenmorgen T. Evaluation of laboratory mills for milling small samples of
rice. Applied Engineering in Agriculture. 2002, Vol. 18, 5, pp. 577-583.
1.11. International Rice Research Institute. Rice Quality Traning Manual. IRRI. [Online]
[Cited: December 9, 2009.]
http://www.knowledgebank.irri.org/millingprocess/index.php/rice-quality-mainmenu-
281/quality-characteristics-of-milled-rice-mainmenu-283

7
1.12. Chen H, Siebenmorgen T, Griffin K. Quality characteristics of long-grain rice milled in
two commercial. Cereal Chemistry. 1998, Vol. 75, 4, pp. 560-565.
1.13. Graves A, Seibenmorgan T, Saleh M. A Comparative Study Between the McGill #2
Laboratory Mill and Commercial Milling Systems. Cereal Chemistry. 2009, Vol. 86, 4,
pp. 470-476.
1.14. Linscombe S. Rice research station starts second century. Louisiana Agriculture. 2009,
Vol. 52, 3, pp. 6-8.
1.15. —. Developing new varieties of rice. Louisiana Agriculture. 2009, Vol. 52, 3, pp. 8-12.
1.16. Sha X. Breeding for improved jasmine type rice lines. Rice Research Station News. 2008,
Vol. 5, 2, pp. 1-2.
1.17. Linscombe S. Jazzman: A new jasmine type rice variety. Louisiana Agriculture. 2009,
Vol. 52, 3, p. 13.
1.18. United States Department of Energy. Biomass Program. [Online]
http://www1.eere.energy.gov/biomass/biomass_basics_faqs.html#bioenergy.
1.19. Sparks D, Hernandez R, Zappi M, Blackwell D, Fleming T. Extraction of rice bran oil
using supercritical carbon dioxide and propane. JAOCS. 2006, Vol. 83, 10, pp. 885-891.
1.20. Infratec ™ 1241 Grain Analyzer. Foss Analytical, Denmark. [Online] http://www.foss.dk/.

8
CHAPTER 2. MULTI-SCALE EVALUATION AND
CORRELATION OF MILLED RICE QUALITY FOR
CLEARFIELD 161
2.1 Introduction
Laboratory scale rice quality measurements have traditionally been utilized for predicting
industrial scale mill performance. Research at industrial scale would require large amounts of
rice, which is not available during variety development. Lab scale testing has provided a quick
and easy method of predicting milled rice quality from a small sample of rice. Industrial scale
mills have been slow to utilize the results from research conducted at laboratory scale as little
evidence correlating different scale mills exists (1)
Laboratory scale mills operate as a batch process using friction milling; pilot and
industrial scale mills operate as a continuous process using both abrasion and friction milling (1).
Laboratory scale testing has usually successfully predicted performance of a rice variety at
industrial scale; however, incidences of inaccuracy in predicting performance have occurred (2)
(1). For example, we conducted an optimization study at pilot scale to address the problems
encountered in scaling between laboratory and industrial scale for Cocodrie (2). Our results
provided useful information on the milling characteristics of Cocodrie for industrial scale milling
of this variety (2). This example of the pilot scale mill’s potential for resolving issues inspired
questions about the predictive potential for milling characteristics of rice varieties among
laboratory, pilot, and industrial scale mills.
Rice quality is characterized by standard parameters including milling recovery, head rice
recovery, milling yield, degree of milling (DOM), transparency, and whiteness. Milling recovery
and head rice recovery are measurements based on the amount of rough rice processed, for total
milled rice and unbroken rice kernels, respectively (3). Milling yield is determined by dividing

9
the weight of unbroken milled rice kernels by the total amount of rice milled (3). The United
States Standards for Brown Rice for Processing (USDA) define a broken kernel as a kernel of
rice that is less than three-fourths of a kernel for yield determination (4). With consumption of
rice largely as milled rice, milling yield determines the value of the rice crop (5). The value of
head rice is approximately twice that of broken kernels on an equal weight basis (5). DOM is a
measure of the amount of the bran layer and germ removed by milling or processing (2). The
amount of bran removed from shelled rice is a measure of the quality of the milled rice. To
achieve a well-milled sample, the Standards Committee of the American Association of Cereal
Chemists (2000) suggests a goal of a twelve percent weight reduction in the difference between
shelled rice and milled rice weights during the milling process (6). Whiteness and transparency
are measurements of physical rice kernel appearance (7).
Because of the economic impact of milled rice quality, this study sought to determine
correlations for rice quality parameters among the different scales of rice mill. Milling one
variety of rice at laboratory, pilot, and industrial scale would provide information for correlating
quality measures among different rice mill scales. Specific study objectives were:
1. To measure rice quality parameters of milling yield, bran removal, whiteness,
transparency, and DOM for a single rice variety, Clearfield 161, at laboratory,
pilot, and industrial scale, and
2. To identify potential predictive correlations among laboratory, pilot, and
industrial scale rice mills.
2.2 Materials and Methods
Clearfield 161 rough rice for laboratory and pilot scale milling was provided by the LSU
AgCenter’s Rice Research Station. Industrial scale Clearfield 161 samples were obtained
courtesy of a mill in southwest Louisiana. Samples were collected from all three mill scales at
pre-selected times, settings, or locations.
10
Clearfield 161 was processed with nine treatments or sets of milling procedures.
Treatments were defined by mill scale and mode of process control (or evaluation). Three
treatments per mill scale were conducted in triplicate for settings corresponding to low, medium,
and high levels of bran removed. Laboratory scale milling durations of L10, L25, and L40 (8),
and pilot scale mill settings of 3, 5 and 9 (2) represent low, medium, and high levels of bran
removed in respective order. At industrial scale, break 1, break 2, and break 3 represent the
locations of low, medium, and high levels of bran removed (9). Table 2.1 presents treatment
descriptions, numbed 1 to 9. Using Table 2.1, select a treatment number from 1 to 9, and move
left to identify the milling scale, right to identify the time, setting, or location, and up to locate
the category of bran removed as low, medium, or high. Treatment 4, 5, 6, and 9 results represent
pilot and industrial scale milled rice products which were further processed by water polishing
the rice kernels. Pilot scale treatments 4, 5, and 6 received the same amount of water polishing,
and after polishing were labeled PP4, PP5, and PP6. The result of water polishing the milled rice
product from treatment 9 was the industrial scale final polished rice product (IFP). Sample
preparation, process steps, and process details by mill scale are detailed in the following
paragraphs.
2.2.1 Sample Preparation
The Clearfield 161 rough rice remained in cold storage (0°C) until required for
experimentation, and was removed from the freezer twenty-four hours before shelling to permit
the rice to reach ambient temperature (29°C) prior to milling. Industrial scale samples were also
milled at ambient temperature (28-29°C). The rough rice supplied for laboratory and pilot scale
milling had been cleared of foreign material prior to delivery to the researcher, and at industrial
scale, dockage was conducted prior to milling.

11
Table 2.1. Treatment descriptions, treatments are numbered 1 to 9
Mill Scale
Level (amount) of Bran Removed
Mode
Low Medium High
Laboratory
1 10
Milling
Duration
(seconds)
2 25
3 40
Pilot
4 3
Operational
Setting 5 5
6 9
Industrial
7 Break 1
Bran
Removal
Location
8 Break 2
9 Break 3
2.2.2 Processing
Figure 2.1 presents the process steps for the three mill scales. Process steps for all three
scales of rice mill are similar, but are performed by different methods or with different
equipment. The first step, dockage, eliminates foreign material from the rough rice prior to
shelling. Pieces of metal or stones are often found in the rough rice after harvesting and pose a
risk of damage to shelling or husking equipment, which operates by passing the rough rice
between a set of rollers. For all three mill scales, after dockage, rice is husked, and then milled.
Following milling, rice is water polished and color-sorted at pilot and industrial scale. For
laboratory and pilot scale mills broken kernels of rice are removed using a sorter table. At
industrial scale, shaker tables and sieves are used to remove broken kernels of rice.

12
Figure 2.1. Chart of three mill scales and process steps; lines connect equipment in
continuous milling process
Laboratory
Husker
Pilot Industrial
Husker
Milling Break
3
Milling Break
2
Milling Break
1
Water Polisher
Dockage
Water Polisher
Stacked
Milling
Unit
Remove bran by
abrasion or
friction
Mil
l
Optical color
sorter
Dockage Dockage
Husker
Remove broken
kernels
By
Hand
Shaker
Table
Remove debris
Remove
off-color
kernels
Remove husks
Remove traces
of bran or color
by water
polishing
Optical color
sorter
Shaker and
sieve
equipment
Process Step
Shaker
Table
The Rice Milling Process Presented by Scale
_______________
Rice Mill Scale

13
2.2.2.1 Lab Scale
Rough rice was shelled (McGill, Model MS1, Grainman Machinery Co., Miami, Florida)
and milled (McGill, Model 2, Brookshire, Texas) at time settings of 10, 25, and 40 seconds. One
hundred and twenty five gram samples of shelled rice were milled; and, milled rice samples
weighed and processed to remove broken kernels of rice. Broken kernels of rice were removed
with a shaker table (Model 61-115-60, Grainman Machinery Co., Miami, Florida) using two
sorter trays of sizes 10 (0.10 inch diameter indentations) and 12 (0.083 inch diameter
indentations) at the top and bottom positions of the shaker table, respectively. Milled rice
samples were weighed before and after processing with the shaker table to provide data to
calculate milling yields.
2.2.2.2 Pilot Scale
Rough rice was processed with a pilot scale mill (Satake Engineering, Co., Tokyo, Japan)
plant, which consisted of a shelling unit (Model GPS300A, Satake Engineering, Co., Tokyo,
Japan), a milling unit (Model VAF10AM, Satake Engineering, Co., Tokyo, Japan), a water
polisher (Model BA3AW, Satake Engineering, Co., Tokyo, Japan), and a color-sorter (Model
GS3AA, Satake Engineering, Co., Tokyo, Japan). Rough rice samples of 11.5 kilograms were
processed at pilot scale operational mill settings of 3, 5, and 9, which were selected to span the
range of pilot scale settings of 0 to 10. Weights for shelled, milled, and polished rice were
measured. Samples of milled and polished rice were processed with a shaker table (Model 61-
115-60, Grainman Machinery Co., Miami, Florida) to remove broken kernels of rice.
2.2.2.3 Industrial Scale
Rough rice was processed at a commercial mill in southwest Louisiana. After dockage,
the industrial scale mill consisted of a shelling unit (Model (HU10FTC2-1, Satake Engineering,
14
Co., Tokyo, Japan); a series of three or four milling units, known as milling breaks, (Buhler
Vertical Millers, DSR-D62422, abrasive and friction units, Plymouth, MN); a unit to remove
broken rice kernels (Model 3 UW 1FLDW, Carter-Day Company, Minneapolis, MN); a
polishing unit (Buhler High Poly, no model number, Plymouth, MN); and a color sorting unit
(Alpha Scan, Model SMII200, Satake Engineering, Co., Tokyo, Japan). Milled rice samples were
collected from each milling break, and a polished rice sample was collected at process end.
Samples of milled and polished rice were processed with a shaker table (Model 61-115-60,
Grainman Machinery Co., Miami, Florida) to remove broken kernels of rice.
2.2.3 Measurements
Milled rice samples were weighed before and after processing with the shaker table to
provide data to calculate milling yields. Milling yield was calculated and reported as a
percentage of the weight ratio of whole kernel milled rice to total milled rice (3). For each
replicate at laboratory and pilot scale, the fraction of bran removed per mill setting was
determined from weight ratio of the difference in shelled and milled rice to the weight of shelled
rice. At industrial scale, percent bran removal had been set at each milling break by the mill
operator (9). Degree of Milling (DOM), whiteness, and transparency readings were made using a
Satake Milling Meter (Model MM1-D, Tokyo, Japan), an optical device using refraction or
transmission of light for measurement of these parameters. DOM, whiteness, and transparency
values were measured in triplicate for milled and polished rice samples; means were reported (2).
2.2.4 Statistical Analysis
Table 2.2 presents the experimental design. The experiment was randomized and
performed in triplicate for the nine selected treatments. Statistical analysis was performed with
ANOVA, and Tukey mean comparisons. Predictive potential was assessed at a 5% significance

15
level (10). Table 2.3 presents treatments by treatment number and corresponding label. A capital
letter indicated mill scale and a number indicated the control mode for each treatment.
Table 2.2. Experimental Design
Milled Rice Milled and Polished Rice* Treatment
Number Milling Yield
Percent Bran Removed
Whiteness Transparency Degree
of Milling
1 ——— ——— ——— ——— ——— 2 ——— ——— ——— ——— ——— 3 ——— ——— ——— ——— ——— 4 ——— ——— ——— ——— ——— 5 ——— ——— ——— ——— ——— 6 ——— ——— ——— ——— ——— 7 ——— ——— ——— ——— ——— 8 ——— ——— ——— ——— ——— 9 ——— ——— ——— ——— ———
Note: Dashes represent replicates * Three replicates for milled; three for polished
Table 2.3. Treatment number, treatment label
Treatment
Number 1 2 3 4 5 6 7 8 9
Treatment
Label L10 L25 L40 P3 P5 P9 B1 B2 B3
Letters represent mill scale: L for laboratory scale, P for pilot scale, B for industrial scale
Numbers represent mode: seconds for laboratory scale, setting for pilot scale, milling break
for industrial scale
2.3 Results
For laboratory, pilot, and industrial scale, Table 2.4 presents results for milling yield and
the percent of bran removed for milled rice, and displays whiteness, transparency, and DOM
results for milled and polished rice. Blank spaces indicate when data was not collectable for the
particular scale of rice mill. Values are indicated to plus or minus one standard deviation.
A lowercase letter ‘a’ indicates information provided by rice miller at the request of the
researcher.

16
Table 2. 4. Mean values for milled rice milling yield, bran removed; milled and polished rice whiteness, transparency, and
DOM
Treatment Number
Milled Rice Polished Rice
Milling Yield (%) % Bran Removed Whiteness Transparency DOM Whiteness Transparency DOM
1 90.7 ± 0.2 7.8 ± 0.2 59.7 ± 0.3 2.7± 0.1 184.5 ± 0.7
2 92.5 ± 1.9 12.6 ± 2.6 69.7 ± 0.8 3.3± 0.0 199.0 ± 0.0
3 93.1 ± 0.7 14.9 ± 1.4 73.4 ± 1.5 3.7± 0.2 199.0 ± 0.0
4 93.7 ± 1.7 13.8 ± 0.7 70.2 ± 1.3 3.4± 0.1 199.0 ± 0.0 65.6 ± 3.2 3.2 ± 0.2 199.0 ± 0.0
5 90.3 ± 1.5 15.5 ± 1.8 71.5 ± 1.0 3.5 ± 0.2 199.0 ± 0.0 70.8 ± 3.1 3.4 ± 0.1 199.0 ± 0.0
6 89.5 ± 0.6 15.6 ± 1.0 71.8 ± 1.0 3.4 ± 0.3 199.0 ± 0.0 71.1 ± 1.5 3.5 ± 0.1 198.0 ± 1.7
7 85.8 ± 1.4 5.6a 57.2 ± 0.9 0.8 ± 0.1 164.5 ± 2.1
8 87.6 ± 0.4 10.6a 59.8 ± 0.6 1.1 ± 0.1 180.5 ± 0.7
9 88.5 ± 1.2 12.5a 65.7 ± 0.0 1.6 ± 0.0 199.0 ± 0.0 80.5 ± 1.7 2.7 ± 0.0 199.0 ± 0.0
Lower case superscript a indicates value provided by miller; blank spaces no data collectable at scale; treatment 4 two data points

17
Milled Rice
The Standards Committee of the American Association of Cereal Chemists (2000)
suggests, for a well-milled sample, a weight reduction of twelve percent between shelled rice and
milled rice sample weights (6). From the results of the three mill scales, a weight percent
reduction of thirteen percent occurred with treatments 2, 4, and 9. Tukey mean comparisons
indicated no statistical difference existed among these points which correspond to a laboratory
scale milling duration of 25 seconds (L25), the pilot scale mill setting 3 (P3), and industrial
scale milling break 3 (B3), respectively. Table 2.5 presents the weight percent bran removed
results with plus or minus one standard deviation indicated for L25, P3, and B3.
Table 2.5. Milled rice correlated numerical values with ± one standard deviation indicated
Treatment
Number
2 4 9
Label
L25 P3 B3
Mill
Scale Laboratory Pilot Industrial
Mode 25 3 B3
Quality
Parameter
Bran Removed
12.6 ± 2.6 13.8 ± 0.7 12.5a
Whiteness 69.7 ± 0.8 70.2 ±1.3 65.7 ± 0.1
Transparency
3.3 ± 0.0 3.4 ± 0.0 1.6 ± 0.0
Lower case a indicates value determined by mill operator
Siebenmorgen et al. (2006) milled different rice cultivars to the same DOM with a
McGill No. 2 to compare additional milling characteristics (11) and found that different milling

18
durations were required to obtain the same DOM. Milling duration corresponds to the amount of
bran removed from the rice kernel (3). This study used the weight percent of bran removed as the
basis to compare additional milling characteristics (8). Employing percent bran removed as the
basis resulted in the selection of treatments 2, 4, and 9 or L25, P3, and B3, respectively, as the
points for comparison for whiteness and transparency of milled rice. No statistical difference was
seen for whiteness or transparency values for L25, P3, and B3. Milled rice transparency values
for treatments 2 and 4 were not significantly different, while treatment 9 was different than 2 and
4. Laboratory (L25) and pilot (P3) scale milled rice transparency values were not significantly
different, but the industrial (B3) scale transparency value differed from laboratory and pilot scale
measurements.
Milling yield determines the value of a rice crop, with the value of head rice
approximately twice that of broken kernels on an equal weight basis (5). Mean milling yield
(head milled over total milled) was 90 for all treatments, which compares well to Cypress,
Cheniere, and Cocodrie values of 91, 87, and 88 percent, respectively (12). Statistical analysis of
milling yield results for the nine selected treatments found no difference among treatments 1, 5,
6, 8, or 9. Table 2.6 presents milling yield results for these treatments, or by label, L10, P5, P9,
B2 and B3, respectively. L10 represented the lowest level of bran removal at laboratory scale;
P5 and B2 represented a medium level of bran removal; P9 represented the highest level of bran
removal at pilot scale, and B3 was the last milling break before water polishing at industrial
scale.
A study, comparing two commercial scale mills, one with a single break, and the second,
a multi-break system, found lower milling yields with the single break system as bran removal
(DOM) increased which probably resulted from differences in friction and abrasive milling (13).

19
Table 2.6. Numerical values ± one standard deviation for milling yield
Treatment
Number
1 5 6 8 9
Label
L10 P5 P9 B2 B3
Mill
Scale Laboratory Pilot Pilot Industrial Industrial
Mode 10 5 9 Break 2 Break 3
Quality
Parameter
Milling
Yield
90.7 ± 0.2 90.3 ± 1.5 89.5 ± 0.6 87.6 ± 0.4 88.5 ± 1.2
We found a similar pattern of friction milling producing less kernel breakage than the
combination of friction and abrasive milling. Our laboratory scale mill would correspond to the
single break mill where friction milling dominates. Our pilot scale mill and the industrial scale
mill would correspond to the multi-break mill with friction and abrasion milling occurring in a
stacked milling unit or a series of milling breaks, respectively (13). Our results found higher
milling yields at laboratory scale than at pilot or industrial scale with L10, exhibiting higher
milling yields than P5 and P9, or B2 and B3.
Polished Rice
Pilot scale and industrial scale mills employ a water polishing step to remove traces of
bran or color from the rice kernels. Table 2.7 presents our results for polished rice at pilot and
industrial scale. Polished rice results are limited to whiteness, transparency and degree of milling
for pilot and industrial scale. Yield values could not be determined for industrial scale as the
weight of rice before and after each process step was not obtainable. Pilot scale polished rice
DOM measurements for the three tested settings showed no difference with polished industrial
rice. Final product industrial scale transparency of 2.7 was lower than polished rice pilot scale

20
values. Industrial scale polished rice whiteness differed from pilot scale whiteness measurements;
pilot scale values did not statistically differ among settings. A ten point difference existed
between PP5 or PP9, and the final industrial scale product. The whiteness value for polished rice
at both PP5 and PP9 was 71; and whiteness for polished rice at industrial scale was 81. The
whiteness value at the highest pilot scale mill setting of 9, even after water polishing, was 10
points lower than for the polished product at industrial scale.
Table 2.7. Polished Rice whiteness, transparency, DOM ± one standard deviation
Treatment
Number
4 5 6 9
Label
(after polishing)
PP3 PP5 PP9 IFP
Mill
Scale Pilot Pilot Pilot Industrial
Mode 3 5 9 Final
Product
Quality
Parameter
Whiteness 65.6 ± 3.2 70.8 ± 3.1 71.1 ± 1.5 80.5 ± 1.7
Transparency
3.2 ± 0.2 3.4 ± 0.1 3.5 ± 0.1 2.7 ± 0.0
DOM
199.0 ± 0.0 199.0 ± 0.0 198.0 ± 1.7 199.0 ± 0.0
2.4 Conclusions
Predictive comparisons for milling quality among the three different mill scales were
identified. Bran removal results were used to select correlation points for other tested parameters.
A bran removal of 13 percent occurred at a 25 second laboratory milling duration (L25), a pilot
scale setting of 3 (P3), and at industrial milling break 3 (B3). The laboratory milling duration of

21
25 seconds indicated a medium level of bran removal; the pilot scale setting of 3 represented a
low level of bran removal; and industrial milling break 3 indicated a high level of bran removal.
Milled rice whiteness values correlated well across scales at L25, P3, and B3. Milling yield
correlated at a lab scale setting of 10, a pilot scale setting of 5 or 9, and at industrial scale milling
breaks 2 or 3. The whiteness value for the final industrial scale product was ten points higher
than the whiteness value at pilot scale settings of 5 or 9.
2.5 References
2.1. Graves A, Seibenmorgan T, Saleh M. A Comparative Study Between the McGill #2
Laboratory Mill and Commercial Milling Systems. Cereal Chemistry. 2009, Vol. 86, 4,
pp. 470-476.
2.2. Hua N, Bengtson R, Schramm R, Patel T, Walker T, Lima, M. Optimization of yield and
quality parameters for the cocodrie rice variety as a function of harvest time. Applied
Engineering in Agriculture. 2006, Vol. 22, 1, pp. 95-99.
2.3. IRRI International Rice Research Institute. Cereal Knowledge Banks. Quality
characteristics of milled rice. [Online] [Cited: September 29, 2009.]
http://www.knowledgebank.irri.org/riceQuality/default.htm#Qly01.htm.
2.4. USDA. Brown Rice Standards. [Online] [Cited: December 2009]
http://archive.gipsa.usda.gov/reference-library/standards/ricestandards-brown_rice.pdf
2.5. Sha X, Linscombe S, Groth D. Field Evaluation of Imidazolinone-Tolerant Clearfield Rice
(Oryza sativa L.) at Nine Louisiana Locations. Crop Science. 2007, Vol. 47, pp. 1178-
1185.
2.6. Bautista R, Siebenmorgen T. Evaluation of laboratory mills for milling small samples of
rice. Applied Engineering in Agriculture. 2002, Vol. 18, 5, pp. 577-583.
2.7. International Rice Research Institute. Rice Quality Traning Manual. IRRI. [Online]
[Cited: December 9, 2009.]
www.knowledgebank.irri.org/.../Rice%20Quality%20Reference%20Manual.doc.
2.8. Schramm R, Abadie A, Hua N, Xu Z, Lima M. Fractionation of the rice bran layer and
quantification of vitamin E,oryzanol, protein, and rice bran saccharide. Journal of
Biological Engineering. 2007, Vol. 1, 9.
2.9. Richard, R. Milling manager : Personal Communication, 2009.

22
2.10. XLSTAT-Pro. Statistical software. 2009. http://wwwxlstatcom/en/home/.
2.11. Siebenmorgen T, Matsler A, Earp C. Milling Characteristics of Rice Cultivars and
Hybrids. Cereal Chemistry. 2006, Vol. 83, 2, pp. 169-172.
2.12. Linscombe S, Sha X, Bearb,K, Groth D, White L, Dunand R. Registration of ‘Cheniere’
Rice. Crop Science. 2006, Vol. 46, pp. 1814-1815.
2.13. Chen H, Siebenmorgan T, Griffin K. Quality Characteristics of long-grain rice milled in
two commercial systems. Cereal Chemistry. 1998, Vol. 75, 4, pp. 560-565.

23
CHAPTER 3. PILOT SCALE MILL CHARACTERIZATION OF
JAZZMAN: FIRST US BRED AND RELEASED LONG GRAIN
AROMATIC RICE VARIETY
3.1 Introduction
The LSU AgCenter Crowley Rice Research Station has released 42 rice varieties over its
100 year history (1). The development of a new rice variety progresses in a series of steps from
small seed samples appropriate for laboratory scale testing to supplies large enough for release as
seed stock (2). The US demand for jasmine-type rice has increased over the last decade (3). Most
of this demand is being currently met by imports. Jasmine 85, an aromatic rice variety developed
by the International Rice Research Institute, was released in Texas and has been grown on
limited acreage in the southern United States. Jasmine 85 failed to meet consumer expectations
due to gray coloring in the kernels and inferior aroma (3). In 1992, the LSU AgCenter Rice
Research Station specialty rice breeding program was formed to develop aromatic rice varieties
suitable for growing in Louisiana with the goal of competing for the aromatic rice niche market
in the United States. Jazzman, the first US-bred jasmine-type rice was released by the LSU
AgCenter Rice Research Station in 2009 (4).
Jazzman is a long grain aromatic rice variety that was developed from a cross between an
Arkansas variety, Ahrent, and an unreleased aromatic Chinese rice line 96a-8 (4). It compares to
Cypress in plant height and days to maturity with less susceptibility to blast and sheath blight
than Cheniere (4). Jazzman averaged 7803 kilograms per hectare in yield trails over five years in
five states, which compares favorably with two non-aromatic long grain varieties, Cypress and
Cheniere (4). Cypress and Cheniere had mean yield values of 7841 kilograms per hectare and
8903 kilograms per hectare, respectively (5). Jazzman exhibited good milling yield and good
milling quality in early laboratory scale screening tests (4). Head rice recovery (weight ratio of

24
head milled to rough rice processed) for Jazzman was 63.6 percent, which falls in the range of
the values for Cheniere (63.1) and Cypress (64.3) (5). Initial release documentation, the source
for the information on Cypress, Cheniere, and Jazzman, did not include values for DOM,
whiteness, and transparency (4; 5). Because these values are important quality indicators, we
measured them at the pilot scale.
Laboratory scale evaluation has traditionally provided milling quality information on new
rice variety releases, and in most cases, successfully predicted industrial scale performance (6).
Different scale rice mills vary by capacity, processing format, and the number of milling
chambers or breaks employed in the milling process. The standard laboratory mill used in
testing, a McGill mill, operates in batch format by removing bran from shelled rice in one
chamber. Our pilot scale mill uses a stacked milling unit, with an abrasion chamber over a
friction chamber, and continuous processing. Commercial mills operate in a continuous process
using three or four milling units, referred to as milling breaks. Each break uses abrasion or
friction to remove the bran layer (7). Milling studies at laboratory scale use samples of 125-150
grams to evaluate milling performance. The pilot scale mill uses a larger sample (11.5 kg) than
the laboratory scale mill and a smaller sample than that required per test at industrial scale (900
kg) (6). Pilot scale milling provides a similar operating process to industrial scale, and when
coupled with the smaller sample size required, makes testing at the pilot scale mill more
logistically manageable and economically feasible for study (6). Milling quality assessment for
laboratory, pilot, and industrial scale includes evaluation of grain appearance, and measurement
of milling yield and head rice recovery. Visual quality is quantified using industry measurements
of whiteness, transparency, and degree of milling (8), which relate to the amount of bran
removed and visual appearance of rice kernels. Milling yield refers to the weight of unbroken

25
milled rice in ratio to the weight of milled rice; head rice recovery measures whole kernel milled
rice in ratio to the weight of rough rice processed (9). Millers use both milling yield and head
rice recovery to evaluate overall rice kernel quality.
In a pilot scale study milling Cocodrie, Hua et al. (2006) examined processing parameters
of milling recovery, wholeness, transparency, whiteness, and degree of milling (DOM) as a
function of roll gap size in husking, feed volume or flow rate during milling, and water velocity
during polishing. Hua et al. (2006) determined that flow rate was the only significant
(controlling) parameter (6). Optimal mill settings for milling of Cocodrie at pilot scale were
determined, and utilized to improve milling quality at the industrial scale (6).
Processing Jazzman at different flow rates provided additional information on the
variety’s milling characteristics. This characterization of Jazzman could help ensure success at
industrial scale. Specific study objectives were:
1. To measure the percent of bran removed at selected pilot scale mill operational
settings,
2. To determine values for quality assessments (head rice recovery, whiteness,
transparency, and degree of milling) at selected pilot scale mill operational
settings, and
3. To identify the optimal range of mill settings for Jazzman.
3.2 Materials and Methods
3.2.1 Sample Preparation
Jazzman provided by the LSU AgCenter Rice Research Station was stored in a freezer
(0°C) until the day before processing. A period of 24 hours allowed the rice to achieve ambient
temperature (29°C) before milling. Enough rice was removed from the freezer for testing to be
conducted in triplicate.

26
3.2.2 Processing
Rice was processed using a pilot scale milling plant (Satake Engineering Co. Tokyo,
Japan) which operates as a continuous process and consists of a husker (Model GPS300A), a mill
(Model VAF10AM), a wet polisher (Model BA3AW), and a color sorter (Model GS3AA).
Rough rice samples of 11.5 kilograms were processed at three selected pilot scale operational
settings. Milled and polished rice samples were collected. Milled rice refers to rice processed
with the milling or whitening unit (Model VAF10AM). Polished rice has been further processed
with the water polisher (Model BA3AW).
3.2.3 Measurements
3.2.3.1 Flow Rate
Flow rates were determined at the milling unit by weighing a volume of milled rice that
was collected for a recorded time. From triplicate measurements, mean flow rates were reported
in kilograms per hour for pilot scale mill settings of 3, 5, and 9. The settings selected (3, 5, and
9) correspond to low, medium, and high flow rates used by Hua et al. (2006) in an optimization
study of Cocodrie. Figure 3.1 presents the relationship for milled rice between pilot scale mill
setting and flow rate in kilograms per hour. The flow rate increased with increasing pilot scale
mill setting from 124 to 806 kilograms per hour and exhibited a linear relationship with mill
setting. The flow rate of milled rice approximately doubled in value between successive pilot
scale mill settings.
3.2.3.2 Bran Removed and Milling Quality
Nine rough rice samples of 11.5 kilograms were shelled and milled with weight measured
after each process step. Figure 3.2 shows the sample collection process. Shelled rice samples of
125 grams and 2.5 kilograms were collected from each replicate processed. The 2.5 kilogram

27
sample was further processed through the water polisher and reweighed. From the polished rice,
samples of 125 grams were collected. A shaker table (Model 61-115-60, Grainman Machinery
Co., Miami, Florida) was used to remove broken kernels of rice from the 125 gram milled and
polished rice samples using trays of sizes 10 (0.10 inch diameter indentations) and 12 (0.083
inch diameter indentations) at the top and bottom positions of the shaker table, respectively.
Figure 3.1. Regression flow rate and pilot scale setting; Setting 9 two data points
Figure 3.2. Chart of sample collection
Milling yield was reported as a weight percentage of milled (or polished) rice to the
shelled rice processed (9). Head rice recovery was determined as a weight percent of unbroken
kernels to the weight of the rough rice sample processed for milled and polished rice (9). The
124
344
806
y = 113.9x - 220.94R² = 0.99990
200
400
600
800
1000
0 3 6 9
Flow Rates (kg / hr)
Pilot Scale Setting
Correlation of Flow Rates and Pilot Scale Settings
Rough rice
11.5 kg
125 gram milled rice sample 2.5 kg milled rice sample
Shaker
Table
(Removing
broken
kernels)
Water
Polishing
Head rice recovered
Shelling
And
Milling
125 gram milled rice sample
Process Step
(Action)
Sample

28
amount of bran removed for each mill setting was determined from the difference between the
weights of shelled and milled rice. Bran removal was reported as a percentage based on the
weight ratio of bran removed to the weight of shelled rice processed. During milling, whiteness,
transparency, and degree of milling were measured for milled and polished rice samples in
triplicate with a Satake milling meter (model MM-1D, Tokyo, Japan) (6); the mean of the three
readings was reported. Based on milling quality results, the best operational conditions were
determined.
3.2.4 Statistical Analysis
Experiments were completely randomized. Three replicates were performed for tested
pilot scale settings. Statistical analysis at a 5 percent significance level was performed with
ANOVA and Tukey mean comparisons using XLSTAT-Pro (2009) (10).
3.3 Results
3.3.1 Bran Removed and Milling Quality
Figure 3.3 displays bran removal and milling quality results for milled and polished rice
by operational setting. The amount of bran removed by milling was reported for milled rice; the
total amount of bran removed by milling and polishing was reported under the polished rice
category. Table 3.1 presents numerical values with one standard deviation indicated for bran
removed, head rice recovery, DOM, whiteness and transparency.
3.3.2 Bran Results
The percent of bran removed at a selected mill setting, the degree of milling (DOM), and
whiteness values increase with increasing flow rates for milled rice. No difference in the mean
amount of bran removed was observed between successive mill settings for milled rice,
indicating that bran is easily removed from the kernel for this variety. The percent of bran

29
removed ranged from 12 to 14 for milled rice, and from 14 to 16 for polished rice. Water
polishing removed 3.4, 1.0, and 0.6 percent bran at mill settings of 3, 5, and 9, respectively. The
Standards Committee of the American Association of Cereal Chemists in 2000 recommended a
twelve percent reduction in weight between shelled rice and milled rice samples for a well milled
sample (11). With all samples meeting well milled standards, the goal becomes to maximize
whole kernels while increasing whiteness.
3.3.3 Head Rice Recovery and Milling Yield
Jazzman milling yield and head rice recovery compare well to non-aromatic and aromatic
long grain rice varieties. Head rice recovery decreases with increasing flow rate for milled and
polished Jazzman due to the increase in friction milling at higher flow rates. The mean head rice
recovery for milled rice on a rough rice basis was 70.9; the mean head rice recovery for polished
rice on a rough rice basis was 70.8. No significant difference existed between mean values for
milled and polished head rice recovery. Laboratory scale evaluation found a head rice recovery
of 63.6 percent for Jazzman (4). Jazzman’s head rice recovery (4) compares well with head rice
recovery values of Cypress and Cheniere, which are considered good milling varieties of rice
with head rice recovery values of 64.3 and 63.4, respectively (5). Jazzman’s mean pilot scale
head rice recovery value of 71 was higher than the laboratory measurement of 63.6 due to
process differences. Laboratory scale mills operate in a batch format with all milling
accomplished in one step; pilot scale mills operate by removing bran in a series of steps (7).
Chen et al. (1998) found more rice was broken in a single break system than a multiple break
system for any DOM level (7). They observed progressively decreasing head rice recovery with
increasing DOM for the single break system, but for the multiple-break milling mill, most of the
broken kernels were seen early in milling (7).

30
Figure 3.3. Jazzman milled and polished rice bran and milling quality measurements; means ± one standard deviation
0
10
20
30
40
50
60
70
80
90
100
Bra
n R
emo
ved
(%
)
Hea
d R
ice
Rec
ove
ry (
%)
Deg
ree
of
Mill
ing
Wh
iten
ess
Tran
spar
ency
Bra
n R
emo
ved
(%
)
Hea
d R
ice
Rec
ove
ry (
%)
Deg
ree
of
Mill
ing
Wh
iten
ess
Tran
spar
ency
Bra
n R
emo
ved
(%
)
Hea
d R
ice
Rec
ove
ry (
%)
Deg
ree
of
Mill
ing
Wh
iten
ess
Tran
spar
ency
Bra
n R
emo
ved
(%
)
Hea
d R
ice
Rec
ove
ry (
%)
Deg
ree
of
Mill
ing
Wh
iten
ess
Tran
spar
ency
Bra
n R
emo
ved
(%
)
Hea
d R
ice
Rec
ove
ry (
%)
Deg
ree
of
Mill
ing
Wh
iten
ess
Tran
spar
ency
Bra
n R
emo
ved
(%
)
Hea
d R
ice
Rec
ove
ry (
%)
Deg
ree
of
Mill
ing
Wh
iten
ess
Tran
spar
ency
3 5 9 3 5 9
Milled Polished
Jazzman Milling Quality Measurements

31
Table 3.1. Summary or rice quality measurements with one standard deviation indicated
Rice Quality
Measurements
Pilot Scale Setting
3 5 9
Bran
Removed
(%)
Milled Rice 12.2 ± 2.0a 13.0 ± 3.1a 13.6 ± 2.9a
Polished Rice 3.4 ± 1.0a 1.0 ± 0.3b 0.6 ± 0.5b
Head Rice
Recovery
(%)
Milled Rice 74 ± 0.5a 72 ± 1.4a 66 ± 1.2b
Polished Rice 73 ± 1.6a 70 ± 3.3a 69 ± 0.0b
Degree of Milling
(DOM)
Milled Rice 73 ± 4.9a* 80 ± 3.0a 86 ± 2.1b
Polished Rice 87 ± 7.8j* 88 ± 5.3j 90 ± 4.0j
Whiteness Milled Rice 33.5 ± 0.8a* 35.6 ± 0.7a 37.0 ± 0.4b
Polished Rice 37.4 ± 1.5a* 37.1 ± 1.1a 38.0 ± 1.1a
Transparency Milled Rice 3.7 ± 0.2a* 3.5 ± 0.1a 3.4 ± 0.1b
Polished Rice 3.2 ± 0.2a 3.6 ± 0.2a 3.4 ± 0.2a
The same lower case letter across a row indicates no statistical difference; (*) indicates one less data point

32
Mean milling yield (head milled over total milled) was 90 percent for Jazzman. Jazzman
values compared well to the non-aromatic, long-grain varieties Cypress, Cheniere, and Cocodrie
with milling yields of 91, 87, and 88 percent respectively (5). Islam et al. (2003) studied milling
quality of two Bangladesh long grain aromatic varieties using thirty kilogram rough rice samples
(pilot scale) (12). Milling yields for the two tested aromatic varieties were 90.4 and 84.1 percent
with head rice recovery measured as 60.2 and 60.1, respectively (12). Jazzman’s milling yield of
90 was in the range for the two Bangladesh aromatic varieties, and Jazzman’s head rice recovery
of 71 exceeded the Bangladesh varieties head rice recoveries.
3.3.4 Quantification of Visual Appearance
Measurements for DOM, whiteness, and transparency indicate the appearance quality of
rice kernels. Literature review found few references including DOM, whiteness, or transparency
values. A laboratory scale study of medium rice determined mean whiteness values of 41.5 to
45.7, dependent on rice variety and environmental conditions (13). Our study found whiteness
values of 35 for milled and 37 for polished rice. The few points of difference in whiteness values
observed between studies were accounted for by the level of processing, by measurement of
different rice varieties, by differences in rough rice quality, or by a difference in milling scale.
Milled and polished rice DOM values for our study were 80 and 88, respectively. DOM and
whiteness values increased with flow rate; transparency values exhibited little change with flow
rate. Tukey comparisons of mean values for DOM and whiteness found differences between
milled and polished rice values. The polished rice DOM of 88 falls within the range of DOM
values expected at commercial scale. Commercial mills expect a DOM in the range of 85 to 95
(14). Transparency values ranged less than 0.4 percent and exhibited no significant differences.
33
3.3.5 Optimal Milling Performance
Figure 3.4 presents milled rice DOM and head rice recovery as a function of mill setting.
The final decision of operational flow rate affects the head rice recovery and kernel appearance.
At laboratory scale, head rice recovery and DOM exist in an inverse relationship (14). Our
findings at pilot scale display the same general pattern of higher DOM with lower head rice
recovery. Increasing flow rate increases the amount of bran removed and the number of broken
kernels, establishing an inverse relationship which must be considered when selecting an
operational range for flow rate.
Industrial scale rice millers apply information from multiple steps, or breaks, along the
milling process to optimize the milling process by balancing increasing broken rice kernels with
increasing DOM and whiteness (6). For milled rice, Jazzman exhibited minimal differences in
head rice recovery and DOM between flow rates. Head rice recovery for pilot mill setting 9 was
lower than for settings 3 or 5. Head rice recovery values at 3 and 5 exhibited no statistical
difference. Milled rice DOM values exhibited no difference between 5 and 9. Combining
statistical analysis, setting 5 optimizes head rice recovery and DOM. Milled rice at setting 5 has
head rice recovery of 72 and a DOM of 80. The head rice recovery exceeded values for Cypress
and Cheniere with head rice recoveries of 64 and 63, respectively. Although the DOM value for
milled rice at setting 5 fails to meet industry expectations for DOM of 85 to 95 (14), after water
polishing, the DOM at setting 5 was 88, meeting commercial expectations. Head rice recovery
was 69, also acceptable at commercial level. In summary, milling at pilot scale setting 5, which
correlated to a medium flow rate for the pilot scale mill, optimized head rice recovery and DOM
for the long grain aromatic rice variety, Jazzman.

34
Figure 3.4. Milled rice DOM, head rice recovery; means ± one standard deviation; rounded-rectangle indicates optimal

35
3.4 Conclusions
Jazzman yields and milling quality were comparable to two commercially
successful non-aromatic varieties grown in the same geographic area and to two long
grain aromatic varieties grown in Bangladesh (12). Flow rates and pilot scale settings
selected followed a linear relationship with the rate of flow approximately doubling
between successive mill settings. DOM and whiteness increased with flow rate increase;
head rice recovery decreased with flow rate increase. The small amount of additional
bran removed by water polishing resulted in whiteness values exhibiting no differences
between mill settings for polished rice. Water polishing had minimal effect on head rice
recovery, but improved the degree of milling of the final product from 80 for milled rice
to 88 for polished. After water polishing, the DOM at setting 5 was 88, meeting
commercial expectations; head rice recovery was 69, acceptable at commercial level.
Jazzman presented as a high yield, good milling aromatic rice variety. Pilot scale rice
milling indicated that Jazzman is a commercially viable rice variety.
3.5 References
3.1. Linscombe, S. Rice research station starts second century. Louisiana Agriculture.
2009, Vol. 52, 3, pp. 6-8.
3.2. —. Developing new varieties of rice. Louisiana Agriculture. 2009, Vol. 52, 3, pp. 8-
12.
3.3. Sha, X. Breeding for improved jasmine type rice lines. Rice Research Station News.
2008, Vol. 5, 2, pp. 1-2.
3.4. Linscombe, S. Jazzman: A new jasmine type rice variety. Louisiana Agriculture.
2009, Vol. 52, 3, p. 13.
3.5. Linscombe S, Sha X, Bearb,K, Groth D, White L, Dunand R. Registration of
‘Cheniere’ Rice. Crop Science. 2006, Vol. 46, pp. 1814-1815.

36
3.6. Hua N, Bengtson R, Schramm R, Patel T, Walker T, Lima, M. Optimization of
yield and quality parameters for the cocodrie rice variety as a function of harvest
time. Applied Engineering in Agriculture. 2006, Vol. 22, 1, pp. 95-99.
3.7. Chen H, Siebenmorgen T, Griffin K. Quality characteristics of long-grain rice
milled in two commercial. Cereal Chemistry. 1998, Vol. 75, 4, pp. 560-565.
3.8. Singh R, Singh U, Khush G. Aromatic Rice. New Delhi : Oxford & IBH Pub, 2000.
3.9. IRRI International Rice Research Institute. Cereal Knowledge Banks. Quality
characteristics of milled rice. [Online] [Cited: September 29, 2009.]
http://www.knowledgebank.irri.org/riceQuality/default.htm#Qly01.htm.
3.10. XLSTAT-Pro. Statistical software. 2009. http://wwwxlstatcom/en/home/.
3.11. Bautista R, Siebenmorgen T. Evaluation of laboratory mills for milling small
samples of rice. Applied Engineering in Agriculture. 2002, Vol. 18, 5, pp. 577-
583.
3.12. Islam S, Ghani A, Islam S, Rahman A. Effect of drying and temperature on the
milling quality of long grain aromatic paddy processing in Bangladesh. Pakistan
Journal of Biological Sciences. 2003, Vol. 6, 19, pp. 1675-1680.
3.13. Pan et al. Pan Z, Thompson J, Amaratunga K, Anderson T, Zheng X. Effect of
cooling methods and milling procedures on the appraisal of rice milling quality.
Transactions of the ASABE. 2005, Vol. 48, 5, pp. 1865-1871.
3.14. Reid J, Siebenmorgen T, Mauromoustakos A. Factors affecting the slope of head
rice yield vs. degree of milling. Cereal Chemistry. 1998, Vol. 75, 5, pp. 738-741.

37
CHAPTER 4. LAB SCALE CHARACTERIZATION OF A
PURPLE RICE VARIETY: EXAMINATION OF MILLING
QUALITY AND DETERMINATION OF ANTHOCYANIN AND
OIL CONCENTRATIONS ACROSS THE BRAN LAYER
4.1 Introduction
The LSU AgCenter Crowley Rice Research Station has developed 42 rice varieties which
have enhanced rice crop value over its 100 year history (1). Varieties exhibiting desired traits are
selected and bred to enhance these traits; the quality of milled rice samples from test varieties
impacts this selection process (1). The development of a new rice variety progresses in a series
of steps from small seed samples appropriate for laboratory scale testing to supplies large enough
for release as seed stock (1). From the Rice Research Station, we were provided with 20
kilograms of this variety for assessment of milling quality characteristics and evaluation of
potential value-adding phytochemicals within the bran layer. Line number MCR02-1576 was
obtained from a 1998 cross between Cypress and Hitan Kitan (C98-992) (2). Cypress, a long
grain variety, was developed at the Rice Research Station in 1993; Hitan Kitan, a traditional
purple variety, originated in Sri Lanka (2).
Milling quality refers to physical characteristics of the rice kernel and is characterized by
determining degree of milling (DOM), whiteness, transparency, and milling recovery at specific
mill settings. DOM, whiteness, and transparency indicate the quality of the milled rice kernels in
terms of visual appearance. Milling recovery indicates quality in terms of whole rice kernels
(head rice) produced from milling; head rice milling recovery was measured as the weight
percent of the head rice over the rough rice processed. DOM, whiteness, and milling recovery
measurements for non-pigmented rice varieties have been reported in the literature.
Commercially for non-pigmented varieties, DOM values are expected to range between 85 and

38
95 (3). Pan et al. (4) measured mean whiteness values ranging from 42.3 to 43.8, dependent on
rough rice quality. The head milling recovery rate for two non-pigmented, good-milling rice
varieties, measured near 64 percent. Cypress, the non-pigmented parent variety of the purple rice
under study, measured 63.8 (5), and Cheniere, another LSU AgCenter variety release, had a head
rice recovery of 63.6 percent (5). One article addressing pigmented rice milling quality was
located in the literature. Patindol et al. (2005) measured head rice recovery values for 16 red rice
samples; results varied between states and within states for red rice samples tested; head milling
recovery values ranged from 51.3 to 64.3 weight percent based on rough rice (6). Five of the
samples tested had purple-black hulls with all but one variety displaying head milling recovery
less than 60 percent (6). The purple-black hulled varieties had whiter milled rice than other tested
varieties, except the two cultivated varieties (6). DOM, whiteness, and transparency values were
not reported.
Rice bran contains an array of health enhancing phytochemicals (7, 8). Rice bran contains
high quality oil and protein; cholesterol-lowering waxes; anti-tumor compounds like rice bran
saccharide; and antioxidants, including vitamin E and oryzanol; and in pigmented varieties,
anthocyanins (9). Natural organic chromophores, such as anthocyanins, are used as pigments in
electrical components, paints, optics, textiles (10), and foods (11). Anthocyanins exhibit
antioxidant and anti-carcinogenic activities, hold promise as natural colorants, and show
potential for photovoltaic applications. Anthocyanins have been used in cereal products as
natural pigments and for their health benefits (10). Natural anthocyanins, extracted with ethanol
from several varieties of flowers, have found use as electron transfer compounds in dye-sensitive
solar cells (9). Plant source anthocyanins are safer than rare metal oxides often used in solar
cells, readily available from local sources, and easily extracted with inexpensive solvents (9).

39
Rice bran contains oil in concentrations ranging from 10 to 23 percent by weight (12).
Antioxidants, such as vitamin E and oryzanol, found in rice bran oil may help slow the onset of
diabetes and Alzheimer’s disease (13), and appear to play a role in prevention of heart disease
and multiple types of cancer (14). With increasing world demand for energy, plant sources of oil
have been investigated as alternative energy sources. Biodiesel has been made from rice bran oil
by a variety of methods that have employed basic and acidic catalysts (15), metallic catalysts
(16), and a biological catalyst, lipase (17). Kanitkar et al. (18) explored microwave-assisted
extraction of rice bran oil and its effects on yield and oil properties. With methods of oil
extraction and conversion of rice bran oil to biodiesel known (15, 16, 17, 18), the identification
of high oil varieties of rice and determination of the location of the highest concentration of oil in
the bran layer would provide avenues to increase oil recovery.
Value-added processing of rice bran to increase the recovery of anthocyanins or oil
potentially impacts human health, energy concerns, and environmental issues. Processing the
bran layer into divisions permits the use of the separate fractions for recovery of the high-value
component of interest. This selective approach optimizes the process of extraction by using the
fraction of bran containing a higher concentration of the high-value component while reducing
the total amount of bran requiring processing (19).
The objectives of our study were:
1. To determine milling quality parameters of line number MCR02-1576 at lab scale,
2. To measure degree of milling, whiteness, and transparency measurements with a
milling meter,
3. To determine the anthocyanin concentration gradient across the bran layer of line
number MCR02-1576, and
4. To determine the oil concentration across the bran layer of line number MCR02-
1576.

40
4.2 Materials and Methods
4.2.1 Sample Preparation
Rough rice was supplied by the LSU Agricultural Center (Louisiana Rice Research
Station, Crowley, LA) and stored at 0°C until testing. Before processing, rice was removed from
cold storage and allowed 24 hours to equilibrate to the ambient temperature of the milling
laboratory (29°C). Mean moisture by weight measured 14.2 percent for rough rice samples
tested.
4.2.2 Processing
Rough rice samples required several processing steps to obtain a bran sample at
laboratory scale. The first step involved removing the outer husk layer with a McGill Sheller
(Model MS1, Grainman, Florida). After the shelling step, shelled rice samples of 125 grams were
milled with a McGill mill (Model No. 2, Brookshire, Texas) at time settings of 10, 25, 40, 45,
55, and 65 seconds. Broken kernels were removed from the milled rice sample with a shaker
table (Model 61-115-60, Grainman Machinery Co., Miami, Florida) using two sorter trays of
sizes 10 and 12 at the top and bottom positions of the shaker table, respectively. Materials
produced from replicate runs at each processing step were collected and weighed. Bran from
each replicate was collected and stored (-18°C) until extraction and determination of anthocyanin
and oil concentrations. Samples of milled rice materials were assessed for quality.
4.2.3 Measurements
4.2.3.1 Milling Quality Assessment
Milling quality was assessed at operational time settings of 10, 25, and 40 seconds by
determining values for DOM, whiteness, transparency, milling recovery, and the amount of bran
removed at each setting. These settings were selected because they correspond to low, medium,

41
and high bran removal rates from previous research (20). DOM, whiteness, and transparency
were measured with a milling meter (Model MM-1D, Satake Engineering Co., Tokyo, Japan).
Milling recovery, a milling quality measure reported in percent, was defined as the weight of
whole unbroken milled kernels divided by the weight of the rough rice processed (21). The
amount of bran removed for each milling length was reported as a weight fraction determined
from the bran removed divided by the shelled rice processed.
4.2.3.2 Anthocyanin and Oil Extractions and Concentration Evaluation
Oil and anthocyanin concentrations across the bran layer were determined for bran
samples collected at 10, 25, 40, 45, 55, and 65 seconds. Before anthocyanin extraction, lipids
were removed from the bran samples using a two-solvent extraction process (22). Our method
was adapted from Jang and Xu (23), who used hexane to extract lipids and methanol to extract
anthocyanins. We used ethanol instead of methanol as the anthocyanin extraction solvent based
on its polarity index (24), GRAS status (25), and industry guidelines (26). Half-gram samples of
rice bran were placed in test tubes with 3 milliliters of hexane and incubated at 60°C for 30
minutes in a water bath. After incubation, the test tubes were centrifuged (1500 rpm, 5 minutes),
the solvent decanted, and saved for oil concentration determination. The remaining hexane was
evaporated from the bran residue prior to the addition of 3 milliliters of ethanol (22). After
incubation for 30 minutes in a water bath at 60°C, the solvent portion was used to determine
anthocyanin concentration with high pressure liquid chromatography. The hexane was
evaporated from the decanted solution and the remaining oil weighed. Oil concentration was
reported as a weight fraction of oil extracted to bran processed.
HPLC analysis was conducted with a system comprised of a Supelco (Bellefonte, PA)
Discovery C18 column (inside diameter 3mm, length 25 cm), a Waters 2690 separation module,
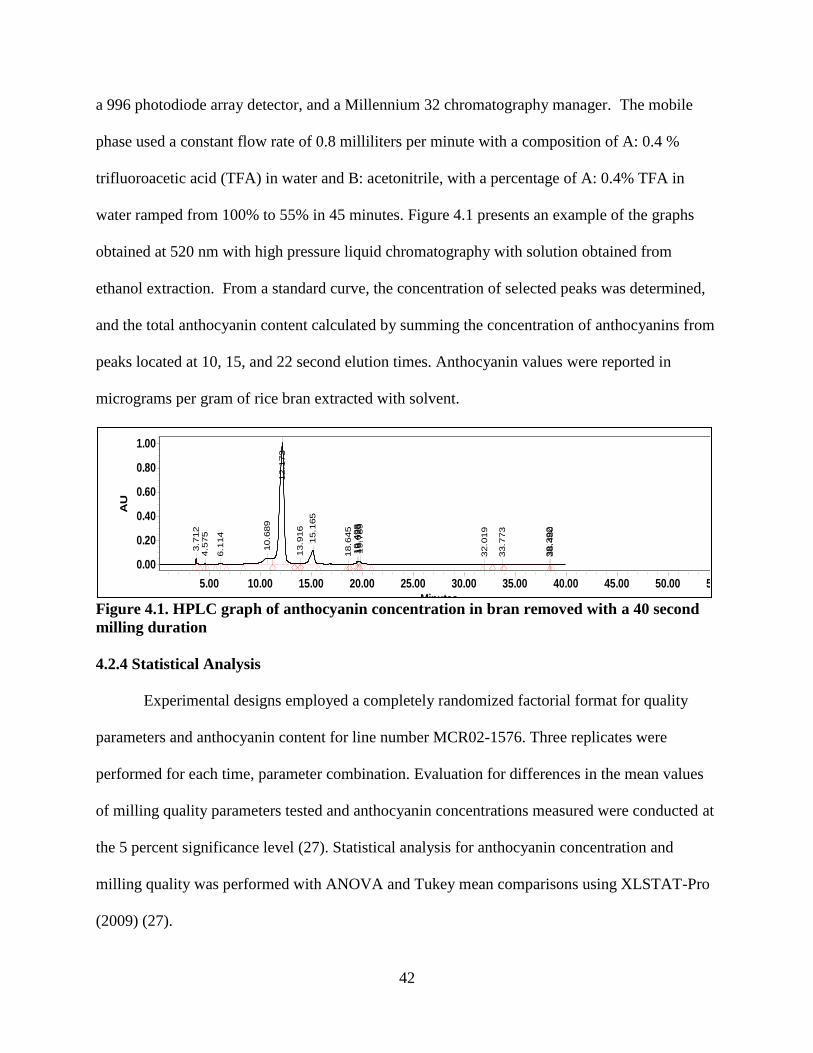
42
a 996 photodiode array detector, and a Millennium 32 chromatography manager. The mobile
phase used a constant flow rate of 0.8 milliliters per minute with a composition of A: 0.4 %
trifluoroacetic acid (TFA) in water and B: acetonitrile, with a percentage of A: 0.4% TFA in
water ramped from 100% to 55% in 45 minutes. Figure 4.1 presents an example of the graphs
obtained at 520 nm with high pressure liquid chromatography with solution obtained from
ethanol extraction. From a standard curve, the concentration of selected peaks was determined,
and the total anthocyanin content calculated by summing the concentration of anthocyanins from
peaks located at 10, 15, and 22 second elution times. Anthocyanin values were reported in
micrograms per gram of rice bran extracted with solvent.
Figure 4.1. HPLC graph of anthocyanin concentration in bran removed with a 40 second
milling duration
4.2.4 Statistical Analysis
Experimental designs employed a completely randomized factorial format for quality
parameters and anthocyanin content for line number MCR02-1576. Three replicates were
performed for each time, parameter combination. Evaluation for differences in the mean values
of milling quality parameters tested and anthocyanin concentrations measured were conducted at
the 5 percent significance level (27). Statistical analysis for anthocyanin concentration and
milling quality was performed with ANOVA and Tukey mean comparisons using XLSTAT-Pro
(2009) (27).
AU
0.00
0.20
0.40
0.60
0.80
1.00
Minutes
5.00 10.00 15.00 20.00 25.00 30.00 35.00 40.00 45.00 50.00 55.00
3.7
12
4.5
75
6.1
14
10.6
89
12.1
73
13.9
16
15.1
65
18.6
45
19.4
98
19.6
23
19.7
89
32.0
19
33.7
73
38.3
92
38.4
80

43
4.3 Results
4.3.1 Milling Quality
Milling quality assessment data are presented in Figure 4.2. Milling recovery decreased
with increasing milling time, indicating that a longer milling time resulted in a higher level of
broken kernels. Milling recovery was less than fifty percent on a rough rice weight basis for all
times tested. In a study including red rice varieties, milling recovery values ranged from
approximately fifty-one percent to sixty-three percent depending on the variety (5). Our head
milling recovery was on the low end of values measured for red rice varieties and nearly 15
percentage points below the non-pigmented parent variety. The non-pigmented parent variety,
Cypress, has been considered a good-milling variety by industrial scale mills with a head rice
recovery of 63.8 percent (6). Milling recovery is dependent on a number of factors, including
geographical, harvest, and milling conditions. These influencing factors could be manipulated to
increase milling recovery, but the low milling recovery of this rice line, less than fifty percent,
probably precludes further development unless other factors such as value-added processing
make further development of the variety economically feasible.
Figure 4.2. Milling recovery, percent bran removed, transparency, and whiteness; means ±
one standard deviation indicated
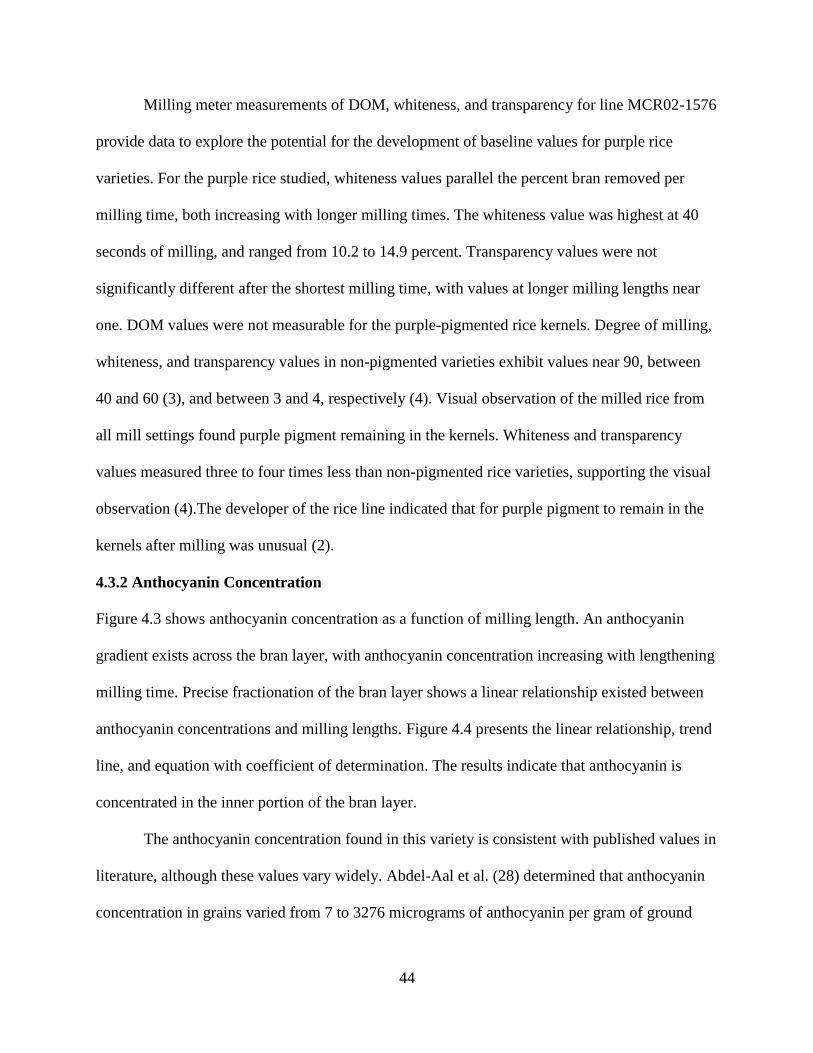
44
Milling meter measurements of DOM, whiteness, and transparency for line MCR02-1576
provide data to explore the potential for the development of baseline values for purple rice
varieties. For the purple rice studied, whiteness values parallel the percent bran removed per
milling time, both increasing with longer milling times. The whiteness value was highest at 40
seconds of milling, and ranged from 10.2 to 14.9 percent. Transparency values were not
significantly different after the shortest milling time, with values at longer milling lengths near
one. DOM values were not measurable for the purple-pigmented rice kernels. Degree of milling,
whiteness, and transparency values in non-pigmented varieties exhibit values near 90, between
40 and 60 (3), and between 3 and 4, respectively (4). Visual observation of the milled rice from
all mill settings found purple pigment remaining in the kernels. Whiteness and transparency
values measured three to four times less than non-pigmented rice varieties, supporting the visual
observation (4).The developer of the rice line indicated that for purple pigment to remain in the
kernels after milling was unusual (2).
4.3.2 Anthocyanin Concentration
Figure 4.3 shows anthocyanin concentration as a function of milling length. An anthocyanin
gradient exists across the bran layer, with anthocyanin concentration increasing with lengthening
milling time. Precise fractionation of the bran layer shows a linear relationship existed between
anthocyanin concentrations and milling lengths. Figure 4.4 presents the linear relationship, trend
line, and equation with coefficient of determination. The results indicate that anthocyanin is
concentrated in the inner portion of the bran layer.
The anthocyanin concentration found in this variety is consistent with published values in
literature, although these values vary widely. Abdel-Aal et al. (28) determined that anthocyanin
concentration in grains varied from 7 to 3276 micrograms of anthocyanin per gram of ground

45
cereal material. Ichikawa et al. (29) identified that blueberries have 11 anthocyanins while purple
rice has predominately one, cyanidin 3-O-beta-D-glucoside (Cy 3-Glc) (29). Nam et al. found
four rice varieties in a study of 21 pigmented rice varieties that displayed strong antioxidant
activity (22). When extracts from the bran of pigmented rice varieties were compared to extracts
from non-pigmented varieties, the extracts from pigmented varieties exhibited higher activity in
chemical and mammalian cell studies examining anti-oxidative, anti-tumor, and anti-
carcinogenic potential (30).
Figure 4.3. Anthocyanin concentration; means ± one standard deviation
Figure 4.4. Regression of mean anthocyanin concentration and milling length

46
Jang and Xu (23) recently characterized anthocyanin content in a different purple rice
variety; these investigators created outer and inner bran layers by milling with a McGill mill at
milling length to 40 seconds, and between 40 and 60 seconds. Their findings showed
anthocyanin concentration in the inner bran layer to be eight times that of the outer bran layer,
with inner and outer concentrations of 29.0 ± 0.9 and 3.5 ± 0.4 mg/g, respectively (23). Dividing
our results into two layers by data collected from milling lengths to 40 seconds and after 40
seconds, results in inner and outer bran layers with anthocyanin concentrations of 2.0 ± 0.2 and
1.3 ± 0.2 milligrams per gram of rice bran. The anthocyanin concentration measured in the inner
bran layer of our variety was significantly higher (1.6 times) than that measured in the outer bran
layer. Literature illustrated the great variability of anthocyanin concentration in grains and fruit
sources.
At 1970 micrograms per gram of rice bran, our finding for mean anthocyanin
concentration in the inner bran layer was within the range of reported anthocyanin concentrations
in the literature. Our inner bran anthocyanin concentration was near the mid-range for cereal (28)
and within the range for huckleberries (31). Despite a difference in total anthocyanin
concentration, our results followed the same trend as Jang and Xu (23), with the higher
anthocyanin concentration located in the inner portion of the bran layer. The more precise
fractionation of the rice bran layer employed in our study revealed a linear relationship across the
bran layer. Extraction methods employed to obtain anthocyanins should focus on using the inner
bran layer as raw material. The differences observed in anthocyanin concentration across the
bran layer and between rice varieties indicated a great opportunity to increase anthocyanin
concentration through a rice breeding program.

47
4.3.3 Oil Concentration
Figure 4.5 presents oil concentrations across the bran layer and indicates the two
divisions of the bran layer. No significant difference for oil concentration existed between
successive milling durations for the outer portion of the bran layer. The inner bran layer
contained 22 percent oil, approximately twice the mean oil concentration present in the outer
bran layer. The inner bran oil concentration compared well with the oil concentration from non-
pigmented rice varieties which generally ranges from 18 to 23 percent by weight (7). Figure 4.6
presents data on the inner portion of the bran layer. Oil concentration increased with milling
duration. A linear relationship existed for oil concentration across the inner bran layer and
milling length. Significant differences existed for oil concentration between successive milling
lengths. With rice bran oil, a renewable plant source of oil, currently receiving increased
attention as a potential stock material for biodiesel (18; 32), the identification of high oil varieties
of rice and identification of the location of the highest concentration of oil in the bran layer
would facilitate increased oil recovery through value-added processing.
Figure 4.5. Oil concentration presented by milling duration with the inner and outer
portions of the bran layer indicated; means ± one standard deviation

48
Figure 4.6. Oil concentration across the inner bran layer; means ± one standard deviation
4.4 Conclusions
The whole kernel milling recovery of line number MCR02-1576 was less than fifty
percent, approximately 15 points below Cypress, the non-pigmented parent variety. The inherent
purple color of the kernel affected the optical method employed to measure whiteness,
transparency, and DOM. Whiteness and transparency values were reported to provide a baseline
for pigmented varieties. DOM values were not measurable by milling meter. Mean anthocyanin
concentration within the purple rice bran layer was within the ranges seen in published literature
for grains and fruits. Anthocyanin concentration displayed a linear relationship with the length of
milling. A significantly higher concentration of anthocyanin exists in the inner portion of the
rice bran layer. Mean oil concentration was determined to be in the range for non-pigmented
rice bran oil concentration values. Oil concentration increased linearly across the inner bran
layer. The inner bran layer has approximately two times the oil concentration as the outer bran
layer. Potential exists for value-added processing by the collection of the inner portion of the rice
y = 0.0639x + 0.1031R² = 0.9947
0.00
0.05
0.10
0.15
0.20
0.25
0.30
0.35
45 55 65
Weight Fraction Oil(g / g of rice bran)
Time (seconds)
Inner Bran Layer Purple RiceOil Concentration

49
bran layer of this variety for extraction of anthocyanins and oil. Screening purple rice varieties to
identify those that possess high anthocyanin content in their bran layers would further optimize
value-added processing viability.
4.5 References
4.1. Linscombe, S. Developing new varieties of rice. Louisiana Agriculture. 2009, 52, 8-12.
4.2. Rush, C. Purple rice developer. Personnel Communication. October 2009.
3. Reid, J.; Siebenmorgen ,T.; Mauromoustakos, A. Factors affecting the slope of head rice
yield vs. degree of milling. Cereal Chemistry. 1998, 75, 738-741.
4.4. Pan, Z.; Thompson, J.; Amaratunga, K.; Anderson, T.; Zheng, X. Effect of cooling
methods and milling procedures on the appraisal of rice milling quality. Transactions of
the ASABE. 2005, 48, 1865-1871.
4.5. Linscombe, S.; Sha, X.; Bearb, K, Groth, D.; White, L.; Dunand, R. Registration of
‘Cheniere’ Rice. Crop Science. 2006, 46, 1814-1815.
4.6. Patindol, J.; Flowers, A.; Kuo, M.; Wang, Y.; Gealy, D. Comparison of physicochemical
properties and starch structure of red rice and cultivated rice. J. Agric. Food Chem. 2005,
54, 2712-2718.
4.7. Qureshi, A.; Mo H.; Packer, L.; Peterson, D. Isolation and identification of novel
tocotrienols from rice bran with hypocholesterolemic antioxidant and antitumor
properties. Journal of Agricultural and Food Chemistry. 2000, 48, 3130-3140.
4.8. Rogers, E.; Rice, S.; Nicolosi, R.; Carpenter, D.; McClelland, C.; Romanczyk, L.
Identification and quantization of γ-oryzanol components and simultaneous assessment of
tocols in rice bran oil. Journal of the American Oil Chemists’ Society. 1993, 70, 301-307.
4.9. Fernando, J.; Senadeera, G. Natural anthocyanins as photosensitizes for dye-sensitized
solar devices. Current Science. 2008, 95, 663-666.
4.10. Camire, M.; Chaovanalkit, A.; Dougherty, M.; Briggs J. Blueberry and grape
anthocyanins as breakfast cereal colorants. Journal of Food Science. DOI:
10.1111/j.1365-2621.2002.tb11425.x.
4.11. Arunkumar, E.; Forbes, C.; Smith, B. Improving the properties of organic dyes by
molecular encapsulation. Eur. J. Org. Chem. 2005, 4051-4059.

50
4.12. Sparks, D.; Hernandez, R.; Zappi, M.; Blackwell, D.; Fleming, T. Extraction of rice
bran oil using supercritical carbon dioxide and propane. JAOCS. 2006, 83, 885-891.
4.13. Stoner, G.; Wang, L.; Casto B. Laboratory and clinical studies of cancer
chemoprevention by antioxidants in berries. Carcinogenesis. 2008, 29, 1665-1674.
4.14. Lazze, M.; Savio, M.; Pizzala, R.; Cazzallini, O.; Perucca, P.; Scovassi, A.; Stivala, L.;
Bianchi L. Anthocyanins induce cell cycle perturbations and apoptosis in different
human cell lines. Carcinogenesis. 2004, 25, 1427-1433.
4.15. Gupta, P.; Kumar, R.; Panesar, B.; Thapar V. Parametric studies on biodiesel prepared
from rice bran oil. Agricultural Engineering International: the CIGR Ejournal. 2007, 9.
Manuscript EE 06 007.
4.16. Einloft, S.; Magahães, T.; Donato, A.; Dullius, J.; Ligabue R. Biodiesel from rice bran
oil: Transesterification by tin compounds. Energy and Fuels. 2008, 22, 671-674.
4.17. Lai, C.; Zullaikah, S.; Vali, S.; Ju Y. Lipase-catalyzed production of biodiesel from rice
bran oil. J. of Chemical Technology & Biotechnology. 2005, 83, 331-337.
4.18. Kanitkar, A.; Sabliov, C.; Balasubramanian, S.; Lima, M.; Boldor, D. Microwave-
assisted extraction (MAE) of soybeans and rice bran oil: Yield and quality
characterization. Transaction of the ASABE. (in review).
4.19. Schramm, R.; Abadie, A.; Hua, N.; Xu, Z.; Lima, M. Fractionation of the rice bran layer
and quantification of vitamin E,oryzanol, protein, and rice bran saccharide. Journal of
Biological Engineering. 2007, 1, 9.
4.20. Hua, N.; Bengtson, R.; Schramm, R.; Patel, T.; Walker, T.; Lima, M. Optimization of
yield and quality parameters for the cocodrie rice variety as a function of harvest time.
Applied Engineering in Agriculture. 2006, 22, 1, 95-99.
4.21. IRRI International Rice Research Institute. Cereal Knowledge Banks. Quality
characteristics of milled rice. [Online] [Cited: September 29, 2009.]
http://www.knowledgebank.irri.org/riceQuality/default.htm#Qly01.htm.
4.22. Nam, S.; Choi, S.; Kang, M.; Koh, H.; Kozukue, N.; Friedman, M. Antioxidative
activities of bran extracts from twenty one pigmented rice cultivars. Food Chemistry.
2006, 94, 613-620.
4.23. Jang, S.; Xu, Z. Lipophilic and hydrophilic antioxidants and their antioxidant activities in
purple rice bran. J. Agric. Food Chem. 2009, 57, 858–862.
4.24. Seidel, V. Selection of an Extraction Method and Solvent. [ed.] Latif Z, Gray A Sarker S.
Natural Products Isolation. 2. Totowa : Humana Press, 2005, 2, 35-36.

51
4.25. Title 21: Food and Drugs: Part 184—direct food substances affirmed as generally
recognized as safe, Subpart B—listing of specific substances affirmed as GRAS. §
184.1293. Ethyl alcohol. s.l. : Electronic Code of Federal Regulations. .
http://ecfr.gpoaccess.gov/cgi/t/text/text-
idx?c=ecfr&sid=89d634b67d2ab0f8b60f1c9512223022&rgn=div8&view=text&node=21
:3.0.1.1.14.2.1.71&idno=21.
4.26. United States Food and Drug Administration. Guidance for Industry: Q3C Tables and
Lists. [Online] [Cited: October 2, 2009.]
http://www.fda.gov/downloads/RegulatoryInformation/Guidances/ucm128282.pdf.
4.27. XLSTAT-Pro. Statistical software. 2009. http://wwwxlstatcom/en/home/.
4.28. Abdel-Aal, E.; Young, J.; Rabalski, I. Anthocyanin composition in black, blue, pink,
purple, and red cereal grains. J. Agric. Food Chem. 2006, 54, 4696-4704.
4.29. Ichikawa, H.; Ichiyanagi, T.; Xu, B.; Yoshii, Y.; Nakajima, M.; Konishi, T.
Antioxidant activity of anthocyanin extract from purple black rice. J Med Food. 2001, 4,
211-218.
4.30. Nam, S.; Choi, S.; Kang, M.; Kozukue, N.; Friedman, M. Antioxidative, antimutagenic,
and anticarcinogenic activities of rice bran extracts in chemical tests and in cell cultures.
Journal of Agriculture and Food Chemistry. 2005, 53, 516-822.
4.31. Lee, J.; Finn, C.; Wrolstad, R. Anthocyanin pigament and and total phenolic content of
three Vaccinium species native to the Pacific Northwest of North America. HortScience.
2004, 39, 956-964.
4.32. United States Department of Energy. Biomass Program. [Online]
http://www1.eere.energy.gov/biomass/biomass_basics_faqs.html#bioenergy.
4.33. Wu, X.; Beecher, G.; Holden, J.; Haytowitz, D.; Gebhardt, S.; Prior R. Concentrations
of anthocyanins in common foods in the United States and estimation of normal
consumption. J. Agric. Food Chem. 2006, 54, 4069-4075.
4.34. United States Department of Energy. Report Number: DOE/EIA-0383(2009). Tables 1
and 17. Total Energy Supply and Disposition Summary. [Online] December 2008.
http://www.eia.doe.gov/oiaf/forecasting.html.
4.35. Rashid, U.; Anwar, F.; Ansari, T.; Arif, M.; Ahmad M. Optimization of alkaline
transesterification of rice bran oil for biodiesel production using responce surface
methodology. J Chem Technol Biotechnol. 2009, 84, 1364-1370.

52
CHAPTER 5. PILOT SCALE RICE MILL EVALUATION OF OIL
CONCENTRATION ACROSS THE BRAN LAYER OF
COCODRIE, CLEARFIELD 161, AND JAZZMAN WITH
CORRELATION OF NEAR-INFRARED MEASUREMENT AND
HEXANE-EXTRACTION
5.1 Introduction
With increasing world energy consumption, plant sources of oil have been investigated as
alternative energy sources. The United States Department of Energy projects a four percent
increase between 2007 and 2030 in the contribution from biomass to total energy supply (1).
Rice bran, an agricultural waste product from rice milling, conforms to the United States
Department of Energy’s definition of biomass, which can include waste from agricultural or
forest production, waste from cities or industries, or crops grown for energy use (2).
Rice bran oil, a renewable plant source of oil, has been investigated as stock material for
biodiesel (2). Oil extracted from rice bran has been converted to biodiesel by a variety of
methods including basic (3) and acidic catalyzation (4), lipase-catalyzation (5), and
transesterification by tin compounds (6). One strategy for improving process economics for
converting rice bran oil to biodiesel is optimization of the feedstock for this procedure. The
identification of high oil concentration varieties of rice and determination of the location of the
highest concentration of oil in the bran layer would provide avenues to increase oil recovery
using a value-added processing approach. With oil concentration in the rice bran layer
characteristically varying from 10 to 23 percent by weight (7), the identification of high oil
content rice variety improves the potential for oil recovery by a ratio of 2.3 based on these
literature values.

53
A number of different oil extraction methods have been reported in the literature.
Kanitkar et al. (2009) explored microwave-assisted extraction of rice bran oil and its effects on
oil yield and oil properties (8). Hu et al. (1996) used hexane to extract vitamin E and oryzanol
(9); Lakkakula et al. (2003) used ohmic heating with hexane extraction to study rice bran oil
(10). Proctor et al. (1994) determined that a simple, ambient temperature method to measure oil
concentration obtained results that are within one percent of more complicated methods (13, 11).
These investigators found a ninety-three percent recovery of good quality rice bran oil was
achieved with a 10 minute, ambient temperature extraction process (11). In contrast, the
extraction method using boiling hexane required 20 minutes of heating to achieve a ninety-two
percent recovery, and an additional 40 minutes to obtain an additional one percent recovery (11).
Another method for determining oil concentration in grains employs the use of near
infrared transmittance technology, abbreviated NIT (12). Measurement of oil concentration by
NIT is an established method for soybeans and corn and has received approval from the United
States Department of Agriculture’s Grain Inspection, Packers, and Stockyards Association
(GIPSA) (12). Rice mills are beginning to use NIT analysis to measure oil concentration
because of its rapid measurement, and with calibration, reproducible with limited training of
personnel (12).
The identification of high oil content in a variety of rice or the identification of high oil
concentration in a portion of the bran layer increases the potential for oil recovery. Three rice
varieties, Cocodrie, Clearfield 161, and Jazzman, grown in the southeastern United States were
selected for oil concentration evaluation. Cocodrie and Clearfield 161 are established rice
varieties in Louisiana. Cocodrie, a long grain high yield variety, was developed and released by
the LSU AgCenter in 1998 (13), and accounted for 22.4% of long grain rice acreage planted in

54
Louisiana in 2008 (14). Clearfield 161, a long grain variety resistant to imidazolinone herbicides,
was developed by the LSU AgCenter in conjunction with BASF and released in 2002 (15).
Clearfield 161, good-milling, high-yield variety, was planted on 26.3% of Louisiana’s 2008 long
grain rice acreage (14). Jazzman, a high-yield, good-milling long grain variety, was developed
by the LSU AgCenter, and released in 2009 as the rice station’s first aromatic jasmine-type rice
(16). Jazzman has the potential to compete for a share of the aromatic rice market in the United
States (16). The identification of one of the tested varieties with a high oil concentration across
the entire bran layer of a rice variety or high oil concentration in a portion of the bran layer
would enhance the economic viability of that variety.
Specific study objectives were:
1. To determine total oil concentration in the bran layer of Jazzman, Clearfield 161,
and Cocodrie,
2. To determine oil concentration gradient across the bran layer for Jazzman,
Clearfield 161, and Cocodrie, and
3. To correlate NIT measurements and hexane extraction concentrations.
5.2 Materials and Methods
5.2.1 Sample Preparation
Jazzman, Clearfield 161, and Cocodrie were supplied by the LSU Agricultural Center
(Louisiana Rice Research Station, Crowley, LA), and remained in cold storage (0°C) until
testing. Before processing, rice was removed from cold storage and allowed 24 hours to reach
ambient temperature (29°C).
5.2.2 Processing
Samples of 11.5 kilograms were processed in triplicate with a pilot scale Satake (Tokyo,
Japan) milling plant at operational settings of 3, 5, and 9 for Jazzman, Clearfield 161 and

55
Cocodrie. After rough rice was husked (Model GPS300A), shelled rice was milled or whitened
(Model VAF10AM). Processing at three operational mill settings created divisions across the
bran layer. Three divisions allowed for a more detailed analysis of oil concentration across the
bran layer. The settings selected (3, 5, and 9) correspond to low, medium, and high flow rates
used by Hua et al. (2006) in an optimization study of Cocodrie (13).
5.2.3 Measurements
Shelled rice, milled rice, and bran samples were collected from tested settings. The
amount of bran removed for each mill setting was determined from the difference between the
weights of shelled and milled rice, and was reported as a weight percentage of bran removed to
shelled rice processed. Bran oil concentration was determined as a weight fraction of oil
extracted with hexane to the amount of bran processed. Milled rice oil concentration was
measured with NIT.
5.2.3.1 Hexane Extraction
For bran samples collected at pilot scale mill settings of 3, 5, and 9, rice bran oil was
extracted using the method detailed in Proctor et al. (11). A brief description of this method
includes the following steps: one gram of rice bran was combined with 10 milliliters of hexane
and stirred for a period of 10 minutes. Samples were centrifuged and decanted, and then the
solvent was evaporated from the extracted oil. The weight of the oil was measured, and results
were reported as a weight fraction of oil recovered to bran processed.
5.2.3.2 Near Infrared Transmittance (NIT) Analysis
The oil concentration of milled rice samples from pilot scale settings of 3, 5, and 9 were
measured with an Infratec ™ 1241 Grain Analyzer (Foss Analytical, Denmark) (12). The NIT
analyzer separated the sample into 10 sub-samples, measured transmittance, and reported the

56
mean transmittance value (12). Because NIT analysis is an indirect measurement technique, NIT
results must be correlated to measured values. Calibration between transmittance measurements
and an established evaluation method can be approached by using a least squares regression (12).
Regression models were developed to predict bran oil concentrations from milled rice NIT
measurements.
5.2.4 Statistical Analysis
Table 5.1 presents the experimental design. Triplicate measurements were made for near
infrared analysis and hexane extractions of oil from rice bran samples. Statistical analysis using
Tukey mean comparisons were conducted with XLSTAT-Pro (2009) (17) at a 5 percent
significance level.
Table 5.1. Experiment design, dashes indicate replicates
Pilot Scale Mill Setting
Oil Concentration
Hexane Extraction of
Oil from Sample of Bran
Removed at Mill Setting
NIT Measurement of
Oil Concentration in Milled Rice
Collected from Mill Setting
3 — — — — — —
5 — — — — — —
9 — — — — — —
5.3 Results
5.3.1 Oil Concentration by Variety
Mean hexane extraction measurements are presented as a weight fraction of oil obtained
to bran processed. Statistical analysis of hexane extraction results found Clearfield 161’s oil
concentration to be higher than Cocodrie or Jazzman. Hexane extraction results in ascending
order were Cocodrie, Jazzman, and Clearfield 161. Hexane results ranged from 0.15 to 0.32
weight fraction of oil; Clearfield 161 contained 2.11 times the oil concentration found in

57
Cocodrie and 1.83 times Jazzman’s oil concentration. In previous pilot scale research, the total
oil concentration measured by hexane extraction for Cocodrie was 0.186 ± 0.008 as a weight
fraction (18) of oil obtained to rice bran extracted. Our current study found a concentration ratio
of 0.151 ± 0.018. This difference was possibly due to variation from different geographic
planting locations or from the use of different hexane based extraction methods. The earlier
study employed a heated-hexane method with two extractions (18), while this study used a rapid,
10 minute, ambient temperature method with one extraction. The rapid single extraction method
typically achieved a 93 percent recovery after 10 minutes, and a boiling single extraction method
achieved a 93 percent recovery after 80 minutes (11). Using a 93% recovery and two extractions
per bran sample, an oil recovery of 99.5 % could be predicted for the two extraction method. At
99.5 % recovery, the 0.186 weight fraction of oil recovered from two extractions represented a
total oil weight fraction of 0.187. For the current study with a 93% oil recovery, the total oil
weight fraction was 0.162. Our current study results were 87 percent of the previous two solvent
study results using less solvent and time. The oil concentration of Clearfield 161 at a weight
fraction of 0.318 is higher than values reported in the literature typically varying between 0.10
and 0.23 (7). Thus, this variety has great potential as a feedstock for biodiesel production.
5.3.2 Oil Concentration by Bran Division
Figures 5.1, 5.2, and 5.3 present oil concentrations by rice variety and by pilot scale mill
setting. Bran oil concentrations determined by HPLC after hexane extraction were graphed with
corresponding values for the weight percentage of bran removed for tested pilot scale settings.
The results for Jazzman, Cocodrie, and Clearfield 161 were presented with one standard
deviation indicated.

58
Oil concentration measured by hexane extraction decreased with increasing pilot scale
mill setting. Between operational mill settings, Clearfield 161 and Cocodrie exhibited no
statistical differences for oil concentration determined by hexane extraction; however, Jazzman
exhibited a difference in oil concentration between mill setting 3 and the two remaining mill
settings. Our current oil concentration results found decreasing oil concentration with increasing
pilot scale mill setting. This is consistent with previous research results for Cocodrie, Cypress,
and Cheniere (18).
Figure 5.1. Jazzman bran oil concentration with ± one standard deviation
Figure 5.2. Cocodrie bran oil concentration with ± one standard deviation
10
12
14
16
18
20
0.00
0.10
0.20
0.30
0.40
3 5 9
Percent Bran
Removed
Oil Weight Fraction
Jazzman Bran Oil Concentration
Jazzman Measured Oil Jazzman Bran Removed
10
12
14
16
18
20
0.00
0.10
0.20
0.30
0.40
3 5 9
Percent Bran
Removed
Oil Weight Fraction
Cocodrie Bran Oil Concentration
Cocodrie Measured Oil Cocodrie Bran Removed

59
Figure 5.3. Clearfield bran oil concentration with ± one standard deviation
5.3.3 Regression Models for Milled Rice NIT Values and Measured Bran Oil Concentration
From each run of the pilot scale mill, samples of milled rice and bran were collected. NIT
measurements were made for the milled rice sample collected; and the oil concentration of the
associated bran material determined. To predict bran oil concentration from milled rice NIT
measurements, a least squares regression model was developed for tested rice varieties. Figure
5.4 presents the regression models formulated between NIT milled rice values and measured
bran oil concentrations.
Table 5.2 presents NIT measurements for milled rice samples collected at pilot scale
settings of 3, 5, and 9 and the associated predicted rice bran oil concentrations. Predicted oil
values were determined from milled rice NIR and the regression model developed for each rice
variety. Predicted oil concentrations trended lower with increasing pilot scale mill setting for
tested rice varieties.
Milled rice NIT values were used to predict bran oil concentrations which were compared
to measured oil concentrations. Figure 5.5, Figure 5.6, and Figure 5.7 present by variety and pilot
scale mill setting the differences between mean measured and mean predicted bran oil
concentrations. Predicted oil concentrations were within two percent of the measured values.
10
12
14
16
18
20
0.00
0.10
0.20
0.30
0.40
3 5 9
Percent Bran
Removed
OilWeight Fraction
Clearfield 161 Bran Oil Concentration
Clearfield 161 Measured Oil Clearfield 161 Bran Removed

60
Figure 5.4. Regression models milled rice NIR and measured bran oil concentration
Table 5.2. Jazzman, Cocodrie, and Clearfield 161 milled rice NIT measurements and
associated bran oil concentration
Rice
Variety
Pilot Scale
Setting NIT
Oil Concentration
Bran Predicted Oil
Jazzman
3 1.020 ± 0.19 0.197 ± 0.00 0.196 ± 0.02
5 0.792 ± 0.06 0.167 ± 0.02 0.167 ± 0.01
9 0.727 ± 0.10 0.159 ± 0.00 0.159 ± 0.01
Cocodrie
3 1.387 ± 0.11 0.163 ± 0.01 0.166 ± 0.01
5 1.188 ± 0.37 0.159 ± 0.04 0.154 ± 0.02
9 0.799 ± 0.13 0.130 ± 0.03 0.132 ± 0.01
Clearfield
161
3 0.819 ± 0.02 0.333 ± 0.01 0.334 ± 0.01
5 0.755 ± 0.00 0.324 ± 0.02 0.316 ± 0.00
9 0.742 ± 0.01 0.306 ± 0.01 0.313 ± 0.00
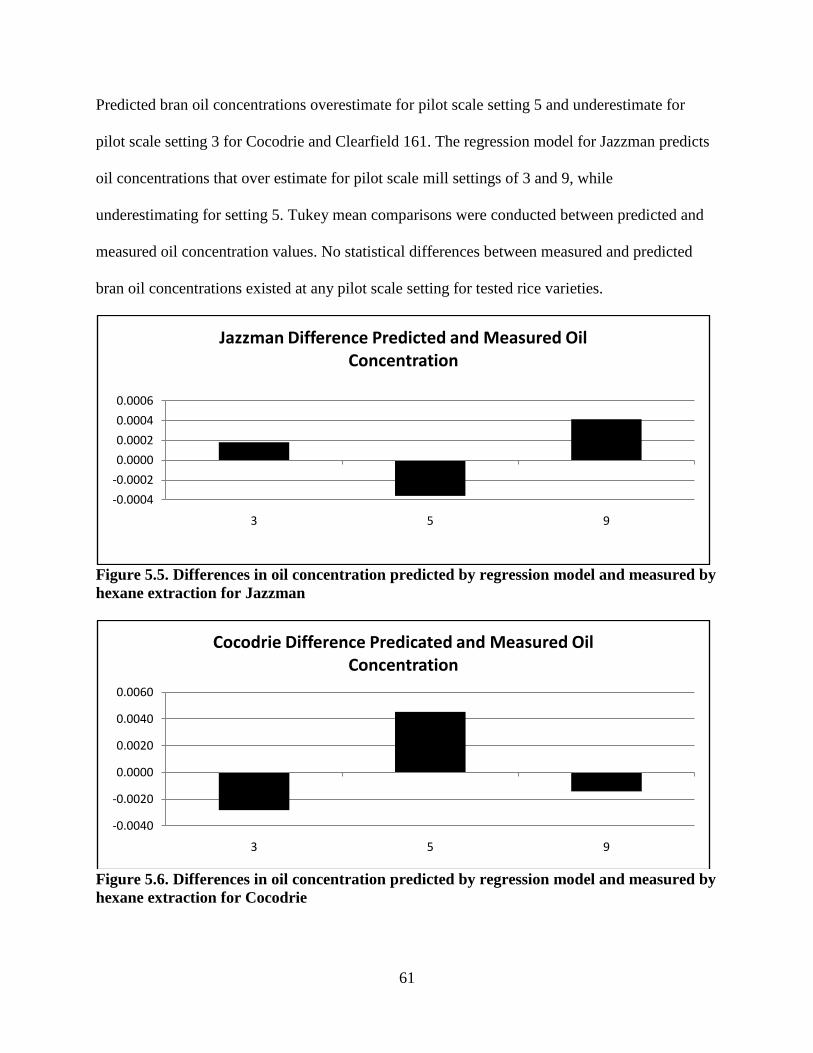
61
Predicted bran oil concentrations overestimate for pilot scale setting 5 and underestimate for
pilot scale setting 3 for Cocodrie and Clearfield 161. The regression model for Jazzman predicts
oil concentrations that over estimate for pilot scale mill settings of 3 and 9, while
underestimating for setting 5. Tukey mean comparisons were conducted between predicted and
measured oil concentration values. No statistical differences between measured and predicted
bran oil concentrations existed at any pilot scale setting for tested rice varieties.
Figure 5.5. Differences in oil concentration predicted by regression model and measured by
hexane extraction for Jazzman
Figure 5.6. Differences in oil concentration predicted by regression model and measured by
hexane extraction for Cocodrie
-0.0004
-0.0002
0.0000
0.0002
0.0004
0.0006
3 5 9
Jazzman Difference Predicted and Measured Oil Concentration
-0.0040
-0.0020
0.0000
0.0020
0.0040
0.0060
3 5 9
Cocodrie Difference Predicated and Measured Oil Concentration

62
Figure 5.7. Differences in oil concentration predicted by regression model and measured
by hexane extraction for Clearfield 161
5.4 Conclusions
Hexane extraction results found that Clearfield 161 had significantly higher total oil
content than Jazzman or Cocodrie, 1.83 and 2.11 times, respectively. Within variety, Clearfield
161 and Cocodrie showed no difference in oil concentration across the bran layer for hexane
extraction. Milled rice NIT measurements and regression models were used to predict the oil
concentration within the bran layer. Regression models were developed for each rice variety
tested. Predicted oil concentrations were within two percent of the measured values. Predicted
bran oil concentrations overestimate for pilot scale setting 5 and underestimate for pilot scale
setting 3 for Cocodrie and Clearfield 161. The regression model for Jazzman predicts oil
concentrations that over estimate for pilot scale mill settings of 3 and 9, while underestimating
for setting 5. A predictive model provides information useful to rice farmers who produce rice
and to rice millers who process rice to commercial expectation or specified customer request.
Rice varieties, with high oil content in their bran, have potential as a renewable, plant source for
oil, and are usable in nutritional, pharmaceutical, or industrial applications.
-0.0150
-0.0100
-0.0050
0.0000
0.0050
0.0100
3 5 9
Clearfield 161 Difference Predicted and Measured Oil Concentraion

63
5.5 References
5.1. United States Department of Energy. Report Number: DOE/EIA-0383(2009). Tables 1
and 17. Total Energy Supply and Disposition Summary. [Online] December 2008.
http://www.eia.doe.gov/oiaf/forecasting.html.
5.2. —. Biomass Program. [Online]
http://www1.eere.energy.gov/biomass/biomass_basics_faqs.html#bioenergy.
5.3. Rashid U, Anwar F, Ansari T, Arif M, Ahmad M. Optimization of alkaline
transesterification of rice bran oil for biodiesel production using responce surface
methodology. J Chem Technol Biotechnol. 2009, 84, pp. 1364-1370.
5.4. Gupta P, Kumar R, Panesar B, Thapar V. Parametric studies on biodiesel prepared from
rice bran oil. Agricultural Engineering International: the CIGR Ejournal. 2007, Vol. 9.
Manuscript EE 06 007.
5.5. Lai C, Zullaikah S, Vali S, Ju Y. Lipase-catalyzed production of biodiesel from rice bran
oil. J. of Chemical Technology & Biotechnology. 2005, Vol. 83, 3, pp. 331-337.
5.6. Einloft S, Magahães T, Donato A, Dullius J, Ligabue R. Biodiesel from rice bran oil:
Transesterification by tin compounds. Energy and Fuels. 2008, 22, pp. 671-674.
5.7. Sparks D, Hernandez R, Zappi M, Blackwell D, Fleming T. Extraction of rice bran oil
using supercritical carbon dioxide and propane. JAOCS. 2006, Vol. 83, 10, pp. 885-891.
5.8. Microwave-assisted extraction (MAE) of soybeans and rice bran oil: Yield and quality
characterization. Kanitkar, A, et al. s.l. : Transaction of the ASABE. (in review).
5.9. Hu W, Wells J, Shin T, Godber S. Comparison of isopropanol and hexane for extraction of
vitamin E and oryzanols from stabilized rice bran. J Amer Oil Chem Soc. 1996, Vol. 73,
12, pp. 1653-1656.
5.10. Lakkakula N, Lima M, Walker T. Rice bran stabilization and rice bran oil extraction
using ohmic heating. Bioresource Technology. 2003, Vol. 92, pp. 157-161.
5.11. Proctor A, Jackson V, Scott M, Clark P. Rapid equilibrium extraction of rice bran oil at
ambient temperature. JAOCS. 1994, Vol. 71, 11, pp. 1295-1296.
5.12. Infratec ™ 1241 Grain Analyzer. Foss Analytical, Denmark. [Online] http://www.foss.dk/.
5.13. Hua N, Bengtson R, Schramm R, Patel T, Walker T, Lima, M. Optimization of yield
and quality parameters for the cocodrie rice variety as a function of harvest time. Applied
Engineering in Agriculture. 2006, Vol. 22, 1, pp. 95-99.

64
5.14. LSU AgCenter. Rice Statistics. 2007 LOUISIANA RICE ACREAGE BY VARIETY
SURVEY. [Online] [Cited: January 13, 2010.]
http://www.lsuagcenter.com/NR/rdonlyres/AE44FE25-3BFE-4E02-A9BE-
9D7E54F73BEB/41744/2007LongGrain.pdf.
5.15. Sha X, Linscombe S, Groth D. Field Evaluation of Imidazolinone-Tolerant Clearfi eld
Rice (Oryza sativa L.) at Nine Louisiana Locations. Crop Science. 2007, Vol. 47, pp.
1178-1185.
5.16. Linscombe, S. Jazzman: A new jasmine type rice variety. Louisiana Agriculture. 2009,
Vol. 52, 3, p. 13.
5.17. XLSTAT-Pro. Statistical software. 2009. http://wwwxlstatcom/en/home/.
5.18. Hua N, Bengtson R, Xu Z, Schramm R, Lima M. Milling characterization and bran
fractionation of Cypress, Cocodrie, and Cheniere rice varieties. Bioresource Technology.
(in review).

65
CHAPTER 6. CONCLUSIONS AND RECOMMENDATIONS FOR
ADDITIONAL RESEARCH
Value-added processing of rice and rice bran is important to optimize milled rice quality
and to increase the recovery of oil and phytochemicals from the bran layer. Optimizing the
milling process increases milling yields resulting in higher economic return. Processing the bran
layer into divisions permits the use of separate fractions for recovery of high-value components
of interest. Recovery of high-value components while reducing the total amount of bran
requiring processing impacts the economics of the extraction process by reducing material
handling and processing costs.
6.1 Conclusions: Scientific
Clearfield 161 was milled at laboratory, pilot, and industrial scales. For each mill scale,
rice quality was determined for Clearfield 161. Predictive comparisons for milling quality among
the three different mill scales were identified. Improved correlation of rice quality parameters
across the mill scales increases the information available for process optimization, thus
impacting milling yield and economic return for this and potentially other rice varieties being
developed.
Aromatic and purple rice varieties fill a niche in the rice specialty market. Information
about these new varieties is important because they have the potential to expand the domestic
market for specialty rice by capturing a part of the import market to the United States. Pilot scale
evaluation of Jazzman, a recently released aromatic, long-grain rice variety, characterized this
new variety while providing information for optimization of the milling process. Jazzman
presented as a high yield, good milling aromatic rice variety, with yields and milling quality
comparable to two commercially successful non-aromatic varieties grown in the same area and
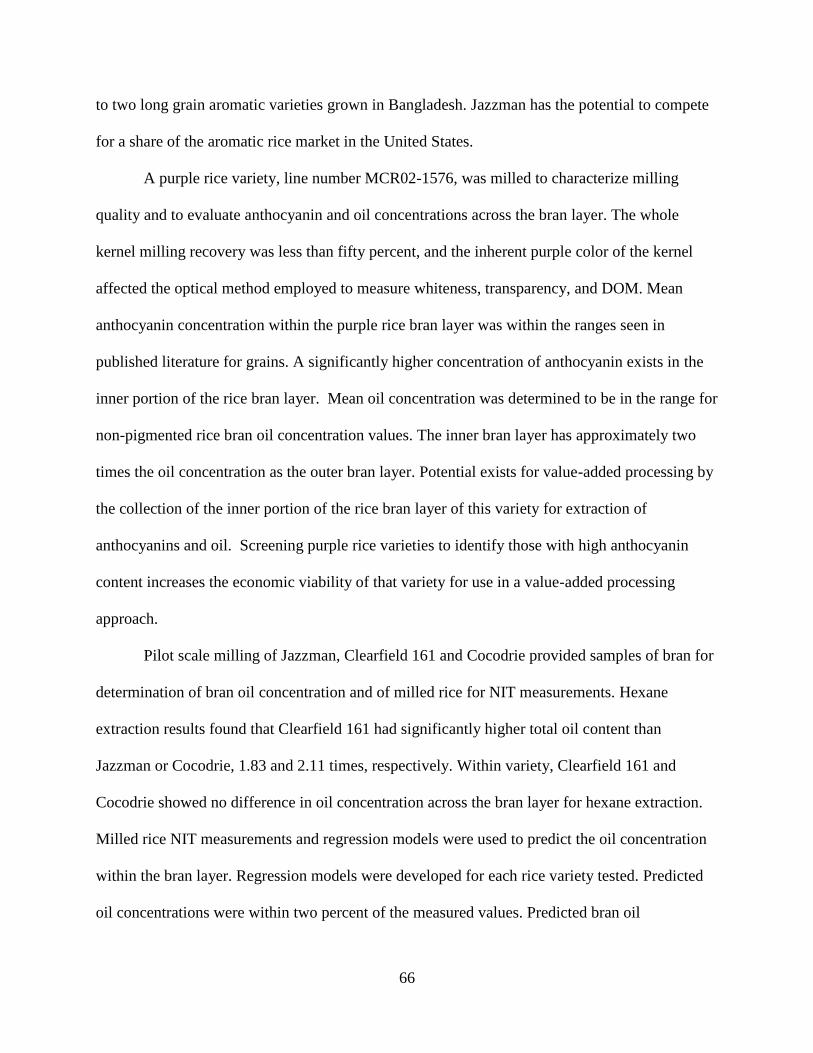
66
to two long grain aromatic varieties grown in Bangladesh. Jazzman has the potential to compete
for a share of the aromatic rice market in the United States.
A purple rice variety, line number MCR02-1576, was milled to characterize milling
quality and to evaluate anthocyanin and oil concentrations across the bran layer. The whole
kernel milling recovery was less than fifty percent, and the inherent purple color of the kernel
affected the optical method employed to measure whiteness, transparency, and DOM. Mean
anthocyanin concentration within the purple rice bran layer was within the ranges seen in
published literature for grains. A significantly higher concentration of anthocyanin exists in the
inner portion of the rice bran layer. Mean oil concentration was determined to be in the range for
non-pigmented rice bran oil concentration values. The inner bran layer has approximately two
times the oil concentration as the outer bran layer. Potential exists for value-added processing by
the collection of the inner portion of the rice bran layer of this variety for extraction of
anthocyanins and oil. Screening purple rice varieties to identify those with high anthocyanin
content increases the economic viability of that variety for use in a value-added processing
approach.
Pilot scale milling of Jazzman, Clearfield 161 and Cocodrie provided samples of bran for
determination of bran oil concentration and of milled rice for NIT measurements. Hexane
extraction results found that Clearfield 161 had significantly higher total oil content than
Jazzman or Cocodrie, 1.83 and 2.11 times, respectively. Within variety, Clearfield 161 and
Cocodrie showed no difference in oil concentration across the bran layer for hexane extraction.
Milled rice NIT measurements and regression models were used to predict the oil concentration
within the bran layer. Regression models were developed for each rice variety tested. Predicted
oil concentrations were within two percent of the measured values. Predicted bran oil

67
concentrations overestimate for pilot scale setting 5 and underestimate for pilot scale setting 3 for
Cocodrie and Clearfield 161. The regression model for Jazzman predicts oil concentrations that
over estimate for pilot scale mill settings of 3 and 9, while underestimating for setting 5. A
predictive model provides information useful to rice farmers who produce rice and to rice millers
who process rice to commercial expectation or specified customer request. Rice varieties with
high oil content in their bran have potential as a renewable, plant source for oil, and are usable in
nutritional, pharmaceutical, or industrial applications.
6.2 Conclusions: Economic Impact
6.2.1 Broken Kernels
Reducing the percentage of broken kernels increases the economic performance of a rice
variety. The benchmark for the global rice market is the price for Thai 100% B 2nd
Grade which
had a mean value of 587 U.S. dollars per metric ton (metric ton) for 2009 (1). The mean value
for rice with broken kernels at five percent by weight was 555 U.S. dollars per metric ton for
2009 (1). Using global market prices per metric ton and the U.S. long grain rice production for
2009 as a basis for illustrating economic impact, a nearly 38 million dollar loss would have
occurred for long grain U.S. rice production in 2009 with an increase in broken kernels of only
five percent by weight (1, 2). At 25 percent broken kernels, the price per metric ton was 127 U.S.
dollars per metric ton which would have represented an 836 million U.S. dollar decrease in value
from the benchmark. These examples illustrate that optimization of the milling process to reduce
the occurrence of broken rice kernels could have a positive economic impact.
6.2.2 Specialty Varieties
Specialty varieties bring a higher price per metric ton on the global market. Thai fragrant
(100%) sold for 954 U.S. dollars per metric ton and Pak Basmatic Ordinary sold for 937 U.S.

68
dollars per metric ton in 2009 (1). With Thai 100% B 2nd
Grade selling for 587 U.S. dollars per
metric ton, the value of aromatic rice exceeded this benchmark for non-aromatic rice by over 300
U.S. dollars per metric ton in 2009 (1). The newly released rice variety, Jazzman, has the
potential to replace a portion of the approximately 350 thousand metric tons of aromatic rice
imported to the United States (1). If Jazzman captured a third of the aromatic rice import market,
it would represent an increase in value of 35 million U.S. dollars over non-aromatic rice at 2009
per metric ton rice prices (1).
6.2.3 Rice Bran Oil
Biodiesel refineries recently built in the southern United States range in capacity from
151 to 397 liters per year (3). An estimated 87 million liters of biodiesel could be produced from
the amount of rice bran milled from the U.S. long grain rice production of 2009. This production
estimate was based on rice bran containing 20% oil by weight, a 90% recovery of oil by solvent
extraction, a 60% conversion of rice bran oil to biodiesel, and a mean biodiesel density of 0.88
g/ml (4). Eighty-seven million liters indicates that rice bran could provide approximately 20% of
the yearly feed stock requirement for the larger refinery and over half for the smaller refinery.
Approximately thirty-three million liters of biodiesel could be produced from the amount of bran
removed from Louisiana’s 2009 long grain rice production which represented 8 and 19 percent
of the feed stock requirements for the two refineries (5).
6.3 Recommendations
Value-added processing of rice and rice bran positively impacted economic worth.
Decreasing broken kernels and optimizing milling for new varieties increased the value of milled
rice produced. Processing the bran layer into divisions permitted the use of separate fractions for

69
recovery of high-value components impacting the economics of the extraction process by
reducing material handling and processing costs. This research suggested future research areas.
To enhance predication of milling performance, different types of rice including short grain,
medium grain, aromatic varieties, and additional long grain varieties could be milled at
laboratory, pilot, and industrial scale. Since Jazzman is a new aromatic rice variety release,
future bran studies might characterize the aromatic compounds present by identifying,
quantifying, and assessing their concentration across the bran layer. DOM and whiteness values
possess potential as predictive measures for acceptability of aroma and final product quality for
aromatic rice varieties. Future work with the purple rice line studied could focus on increasing
milling recovery and investigating the purple pigment remaining in the kernel to explore if the
remaining anthocyanin concentration reaches levels viable for health benefits. Further testing
with hexane extractions and NIT measurements could lead to better predictive models for
determining bran oil concentration.
6.4 References
6.1. USDA. ERS/USDA Briefing Room. Rice Statistics, Table 2 and Table 25.. [Online] [Cited:
March 10, 2010.] http://ers.usda.gov/Briefing/Rice/data.htm.
6.2. ORNL. Bioenergy Conversions. [Online] June 12, 2003. [Cited: March 10, 2010.]
http://bioenergy.ornl.gov/papers/misc/energy_conv.html (2 of 4) [6/12/2003.
6.3. US Department of Energy. EERE. [Online] [Cited: March 10, 2010.]
http://search.nrel.gov/query.html?st=11&charset=utf-
8&style=eere&col=eren&qc=eren&qp=url%3Aeere.energy.gov/states/&qt=biodiesel+and+states
6.4. FAO. The FAO Rice Price Update - January 2010. [Online] [Cited: March 10, 2010.]
http://www.fao.org/es/esc/en/15/70/highlight_533.html.
6.5. USDA. ERS/USDA Rice Outlook. Figure 3. [Online] [Cited: March 12, 2010.]
http://usda.mannlib.cornell.edu/usda/current/RCS/RCS-03-11-2010.pdf.

70
BIBLIOGRAPHY
Abdel-Aal, E.; Young, J.; Rabalski, I. Anthocyanin composition in black, blue, pink, purple,
and red cereal grains. J. Agric. Food Chem. 2006, 54, 4696-4704.
Arunkumar, E.; Forbes, C.; Smith, B. Improving the properties of organic dyes by molecular
encapsulation. Eur. J. Org. Chem. 2005, 4051-4059.
Bautista R, Siebenmorgen T. Evaluation of laboratory mills for milling small samples of rice.
Applied Engineering in Agriculture. 2002, Vol. 18, 5, pp. 577-583.
Camire, M.; Chaovanalkit, A.; Dougherty, M.; Briggs J. Blueberry and grape anthocyanins as
breakfast cereal colorants. Journal of Food Science. DOI: 10.1111/j.1365-
2621.2002.tb11425.x.
Chen, H; Siebenmorgen, T; Griffin, K. Quality characteristics of long-grain rice milled in two
commercial. Cereal Chemistry. 1998, Vol. 75, 4, pp. 560-565.
Einloft, S; Magahães, T; Donato, A; Dullius, J; Ligabue R. Biodiesel from rice bran oil:
Transesterification by tin compounds. Energy and Fuels. 2008, 22, 671-674.
FAO. The FAO Rice Price Update - January 2010. [Online] [Cited: March 10, 2010.]
http://www.fao.org/es/esc/en/15/70/highlight_533.html.
Fernando, J; Senadeera, G. Natural anthocyanins as photosensitizes for dye-sensitized solar
devices. Current Science. 2008, 95, 663-666.
Graves, A; Seibenmorgan, T; Saleh, M. A Comparative Study Between the McGill #2
Laboratory Mill and Commercial Milling Systems. Cereal Chemistry. 2009, Vol. 86, 4,
pp. 470-476.
Gupta, P; Kumar, R; Panesar, B; Thapar V. Parametric studies on biodiesel prepared from
rice bran oil. Agricultural Engineering International: the CIGR Ejournal. 2007, 9.
Manuscript EE 06 007.
Hu, W; Wells, J; Shin, T; Godber, S. Comparison of isopropanol and hexane for extraction of
vitamin E and oryzanols from stabilized rice bran. J Amer Oil Chem Soc. 1996, Vol. 73,
12, pp. 1653-1656.
Hua, N; Bengtson, R; Schramm, R; Patel, T; Walker, T; Lima, M. Optimization of yield and
quality parameters for the cocodrie rice variety as a function of harvest time. Applied
Engineering in Agriculture. 2006, Vol. 22, 1, pp. 95-99.
Hua, N; Bengtson, R; Xu, Z; Schramm, R; Lima, M. Milling characterization and bran
fractionation of Cypress, Cocodrie, and Cheniere rice varieties. Bioresource Technology.
(in review).
Ichikawa, H.; Ichiyanagi, T.; Xu, B.; Yoshii, Y.; Nakajima, M.; Konishi, T. Antioxidant
activity of anthocyanin extract from purple black rice. J Med Food. 2001, 4, 211-218.

71
Infratec ™ 1241 Grain Analyzer. Foss Analytical, Denmark. [Online] http://www.foss.dk/.
International Rice Research Institute. Rice around the world. [Online]
http://www.irri.org/science/cnyinfo/index2.asp.
International Rice Research Institute. Rice Quality Traning Manual. IRRI. [Online] [Cited:
December 9, 2009.]
www.knowledgebank.irri.org/.../Rice%20Quality%20Reference%20Manual.doc.
International Rice Research Institute. World Rice Statistics (WRS): Rice statistics by country.
[Online]
http://beta.irri.org/solutions/index.php?option=com_content&task=view&id=250.
IRRI International Rice Research Institute. Cereal Knowledge Banks. Quality characteristics
of milled rice. [Online] [Cited: September 29, 2009.]
http://www.knowledgebank.irri.org/riceQuality/default.htm#Qly01.htm.
Islam, S; Ghani, A; Islam, S; Rahman, A. Effect of drying and temperature on the milling
quality of long grain aromatic paddy processing in Bangladesh. Pakistan Journal of
Biological Sciences. 2003, Vol. 6, 19, pp. 1675-1680.
Jang, S.; Xu, Z. Lipophilic and hydrophilic antioxidants and their antioxidant activities in purple
rice bran. J. Agric. Food Chem. 2009, 57, 858–862.
Kanitkar, A.; Sabliov, C.; Balasubramanian, S.; Lima, M.; Boldor, D. Microwave-assisted
extraction (MAE) of soybeans and rice bran oil: Yield and quality characterization.
Transaction of the ASABE. (in review).
Lai, C; Zullaikah, S; Vali, S; Ju, Y. Lipase-catalyzed production of biodiesel from rice bran
oil. J. of Chemical Technology & Biotechnology. 2005, Vol. 83, 3, pp. 331-337.
Lakkakula, N; Lima, M; Walker, T. Rice bran stabilization and rice bran oil extraction using
ohmic heating. Bioresource Technology. 2003, Vol. 92, pp. 157-161.
Lazze, M.; Savio, M.; Pizzala, R.; Cazzallini, O.; Perucca, P.; Scovassi, A.; Stivala, L.;
Bianchi L. Anthocyanins induce cell cycle perturbations and apoptosis in different
human cell lines. Carcinogenesis. 2004, 25, 1427-1433.
Lee, J.; Finn, C.; Wrolstad, R. Anthocyanin pigament and and total phenolic content of three
Vaccinium species native to the Pacific Northwest of North America. HortScience. 2004,
39, 956-964.
Linscombe, S. Developing new varieties of rice. Louisiana Agriculture. 2009, 52, 8-12.
Linscombe, S. Jazzman: A new jasmine type rice variety. Louisiana Agriculture. 2009, Vol. 52,
3, p. 13.
Linscombe, S. Rice research station starts second century. Louisiana Agriculture. 2009, Vol. 52,
3, pp. 6-8.

72
Linscombe, S.; Sha, X.; Bearb, K, Groth, D.; White, L.; Dunand, R. Registration of
‘Cheniere’ Rice. Crop Science. 2006, 46, 1814-1815.
LSU AgCenter. Rice Statistics. 2007 LOUISIANA RICE ACREAGE BY VARIETY SURVEY.
[Online] [Cited: January 13, 2010.]
http://www.lsuagcenter.com/NR/rdonlyres/AE44FE25-3BFE-4E02-A9BE-
9D7E54F73BEB/41744/2007LongGrain.pdf.
Childs, N. U.S. 2008/09 All-Rice Export Forecast (RCS-09c) p.7. USDA Economic Research
Service. [Online] [Cited: March 12, 2009.] http://ers.usda.gov.
Nam, S.; Choi, S.; Kang, M.; Koh, H.; Kozukue, N.; Friedman, M. Antioxidative activities of
bran extracts from twenty one pigmented rice cultivars. Food Chemistry. 2006, 94, 613-
620.
Nam, S.; Choi, S.; Kang, M.; Kozukue, N.; Friedman, M. Antioxidative, antimutagenic, and
anticarcinogenic activities of rice bran extracts in chemical tests and in cell cultures.
Journal of Agriculture and Food Chemistry. 2005, 53, 516-822.
ORNL. Bioenergy Conversions. [Online] June 12, 2003. [Cited: March 10, 2010.]
http://bioenergy.ornl.gov/papers/misc/energy_conv.html (2 of 4) [6/12/2003].
Pan, Z.; Thompson, J.; Amaratunga, K.; Anderson, T.; Zheng, X. Effect of cooling methods
and milling procedures on the appraisal of rice milling quality. Transactions of the
ASABE. 2005, 48, 1865-1871.
Patindol, J.; Flowers, A.; Kuo, M.; Wang, Y.; Gealy, D. Comparison of physicochemical
properties and starch structure of red rice and cultivated rice. J. Agric. Food Chem. 2005,
54, 2712-2718.
Proctor, A; Jackson, V; Scott, M; Clark, P. Rapid equilibrium extraction of rice bran oil at
ambient temperature. JAOCS. 1994, Vol. 71, 11, pp. 1295-1296.
Qureshi, A.; Mo H.; Packer, L.; Peterson, D. Isolation and identification of novel tocotrienols
from rice bran with hypocholesterolemic antioxidant and antitumor properties. Journal of
Agricultural and Food Chemistry. 2000, 48, 3130-3140.
Richard, R. Milling manager : Personal Communication, 2009.
Rashid, U.; Anwar, F.; Ansari, T.; Arif, M.; Ahmad M. Optimization of alkaline
transesterification of rice bran oil for biodiesel production using responce surface
methodology. J Chem Technol Biotechnol. 2009, 84, 1364-1370.
Reid, J.; Siebenmorgen ,T.; Mauromoustakos, A. Factors affecting the slope of head rice yield
vs. degree of milling. Cereal Chemistry. 1998, 75, 738-741.
Rogers, E.; Rice, S.; Nicolosi, R.; Carpenter, D.; McClelland, C.; Romanczyk, L. Identification and quantization of γ-oryzanol components and simultaneous assessment of
tocols in rice bran oil. Journal of the American Oil Chemists’ Society. 1993, 70, 301-307.

73
Rush, C. Purple rice developer. Personnel Communication. October 2009.
Schramm, R.; Abadie, A.; Hua, N.; Xu, Z.; Lima, M. Fractionation of the rice bran layer and
quantification of vitamin E,oryzanol, protein, and rice bran saccharide. Journal of
Biological Engineering. 2007, 1, 9.
Seidel, V. Selection of an Extraction Method and Solvent. [ed.] Latif Z, Gray A Sarker S.
Natural Products Isolation. 2. Totowa : Humana Press, 2005, 2, 35-36.
Sha, X; Linscombe, S; Groth, D. Field Evaluation of Imidazolinone-Tolerant Clearfi eld Rice
(Oryza sativa L.) at Nine Louisiana Locations. Crop Science. 2007, Vol. 47, pp. 1178-
1185.
Sha, X. Breeding for improved jasmine type rice lines. Rice Research Station News. 2008, Vol.
5, 2, pp. 1-2.
Siebenmorgen, T; Matsler, A; Earp, C. Milling Characteristics of Rice Cultivars and Hybrids.
Cereal Chemistry. 2006, Vol. 83, 2, pp. 169-172.
Singh, R; Singh, U; Khush, G. Aromatic Rice. New Delhi : Oxford & IBH Pub, 2000.
Sparks, D.; Hernandez, R.; Zappi, M.; Blackwell, D.; Fleming, T. Extraction of rice bran oil
using supercritical carbon dioxide and propane. JAOCS. 2006, 83, 885-891.
Stoner, G.; Wang, L.; Casto B. Laboratory and clinical studies of cancer chemoprevention by
antioxidants in berries. Carcinogenesis. 2008, 29, 1665-1674.
Title 21: Food and Drugs: Part 184—direct food substances affirmed as generally
recognized as safe, Subpart B—listing of specific substances affirmed as GRAS. §
184.1293. Ethyl alcohol. s.l. : Electronic Code of Federal Regulations. .
http://ecfr.gpoaccess.gov/cgi/t/text/text-
idx?c=ecfr&sid=89d634b67d2ab0f8b60f1c9512223022&rgn=div8&view=text&node=21
:3.0.1.1.14.2.1.71&idno=21.
United States Department of Agriculture. National Agricultural Statistics Service: Quick
statistics on rice. [Online] [Cited: March 19, 2009.] ] United States Department of
Ahttp://nass.usda.gov:8080/QuickStats/index2.jsp#footnotes.
United States Department of Energy. Biomass Program. [Online]
http://www1.eere.energy.gov/biomass/biomass_basics_faqs.html#bioenergy.
United States Department of Energy. EERE. [Online] [Cited: March 10, 2010.]
http://search.nrel.gov/query.html?st=11&charset=utf-
8&style=eere&col=eren&qc=eren&qp=url%3Aeere.energy.gov/states/&qt=biodiesel+an
d+states

74
United States Department of Energy. Report Number: DOE/EIA-0383(2009). Tables 1 and 17.
Total Energy Supply and Disposition Summary. [Online] December 2008.
http://www.eia.doe.gov/oiaf/forecasting.html.
United States Food and Drug Administration. Guidance for Industry: Q3C Tables and Lists.
[Online] [Cited: October 2, 2009.]
http://www.fda.gov/downloads/RegulatoryInformation/Guidances/ucm128282.pdf.
USDA. Brown Rice Standards. [Online] [Cited: December 2009]
http://archive.gipsa.usda.gov/reference-library/standards/ricestandards-brown_rice.pdf
USDA. ERS/USDA Rice Outlook. Figure 3. [Online] [Cited: March 12, 2010.]
http://usda.mannlib.cornell.edu/usda/current/RCS/RCS-03-11-2010.pdf.
USDA. ERS/USDA Briefing Room. Rice Statistics, Table 2. [Online] [Cited: March 10, 2010.]
http://ers.usda.gov/Briefing/Rice/data.htm.
USDA. U.S. Export Sales Foreign Agricultural Service: Table 6, U.S. commercial rice exports
(last updated 10 February 2009). [Online] [Cited: March 19, 2009.]
http://www.ers.usda.gov/Briefing/Rice/Data/RICETABLE6.xls.
Wu, X; Beecher, G; Holden, J; Haytowitz, D; Gebhardt, S; Prior R. Concentrations of
anthocyanins in common foods in the United States and estimation of normal
consumption. J. Agric. Food Chem. 2006, 54, 4069-4075.
XLSTAT-Pro. Statistical software. 2009. http://wwwxlstatcom/en/home/.

75
APPENDIX A: MULTI-SCALE DATA FOR CLEARFIELD 161
Clearfield 161 for Laboratory, Pilot, and Industrial Scale
Mill
Scale
Operational
Control
Setting
Milling
Yield (%)
Bran
Removed
(%)
Whiteness Transparency
Degree
Of
Milling
Lab 10 91.0 7.5 59.9 2.8 185
Lab 10 90.7 7.9 59.4 2.55 181
Lab 10 90.5 7.9 59.8 2.77 184
Lab 25 94.7 15.5 60.8 2.58 188
Lab 25 91.3 10.4 69.1 3.27 199
Lab 25 91.5 12.0 70.2 3.32 199
Lab 40 92.7 16.5 74.9 3.69 199
Lab 40 92.7 14.4 73.4 3.47 199
Lab 40 94.0 13.8 72 3.82 199
Pilot 3 92.5 14.2 69.2 3.44 199
Pilot 3 94.9 13.3 71.1 3.33 199
Pilot 3 89.6 14.2 56 2.41 164
Pilot 5 92.0 14.5 70.8 3.58 199
Pilot 5 89.1 17.6 71 3.65 199
Pilot 5 89.9 14.3 72.6 3.35 199
Pilot 9 89.1 15.4 71.6 3.35 199
Pilot 9 90.1 16.6 70.9 3.15 199
Pilot 9 89.3 14.7 72.8 3.69 199
Industrial Break 1 87.4
58.1 0.84 171
Industrial Break 1 85.4
57 0.89 166
Industrial Break 1 84.8
56.4 0.62 163
Industrial Break 2 87.6
50.2 1.10 180
Industrial Break 2 88.1
59.3 1.16 176
Industrial Break 2 87.2
60.2 0.90 181
Industrial Break 3 87.3
69.4 1.68 199
Industrial Break 3 88.5
65.7 1.61 199
Industrial Break 3 89.7
65.7 1.65 199

76
APPENDIX B: PILOT SCALE DATA FOR JAZZMAN
Flow Rate
(kgs/sec)
Flow Rate
(kgs/hr)Bran
Time
(sec)
Weight
with
container
Weight
(kgs)
(kgs)
w/bucketkgs DOM W T
(kgs)
w/bucketkgs DOM W T (kgs)
7 0.635 3 7.01 0.315 0.270 0.039 139 13.185 12.550 11.890 11.255 49 29.7 2.74 1.295
3 0.635 3 9.08 0.320 0.275 0.030 109 11.525 10.890 9.970 9.335 76 34.1 3.82 1.555
5 0.740 3 7.75 0.310 0.265 0.034 123 12.075 11.335 10.720 9.980 69 32.9 3.55 1.355
9 0.605 5 2.94 0.315 0.270 0.092 331 12.580 11.975 11.285 10.680 83 36.3 3.43 1.295
1 0.740 5 3.21 0.360 0.315 0.098 353 11.420 10.680 9.650 8.910 77 34.9 3.46 1.770
4 0.625 5 3.25 0.360 0.315 0.097 349 11.700 11.075 10.405 9.780 80 35.5 3.58 1.295
8 0.630 9 1.31 0.345 0.300 0.229 824 11.585 10.955 10.280 9.650 87 37.2 3.36 1.305
6 0.605 9 1.35 0.340 0.295 0.219 787 13.195 12.590 11.675 11.070 88 37.3 3.43 1.520
2 0.740 9 2.24 0.390 0.345 0.154 554 11.135 10.395 9.375 8.635 84 36.5 3.53 1.760
0 20.7 0.87
Pilot Scale Mill Data Collection Sheet
Variety: New Jasmine Variety
RunTare weight
(kg)
Mill
Setting
Milled Rice
Flow Rate (kgs / sec)Shelled Rice Milled Rice

77
APPENDIX C: ANTHOCYANIN CONCENTRATION DATA BY HPLC PEAK
Total
Time
Settingarea ug of a. in 25 µl
ug of a. in 3 ml or
in 0.5 gram rice
bran
area ug of a. in 25 µl
ug of a. in 3 ml or
in 0.50 gram rice
bran
area ug of a. in 25 µl
ug of a. in 3 ml or
in 0.5 gram rice
bran
ug of a. in 3 ml or
in 1 gram rice bran
1 10 2060320 0.343 41.206 21957695 3.660 439.154 2284076 0.381 45.682 1052.084
4 10 1937617 0.323 38.752 19265878 3.211 385.318 2298148 0.383 45.963 940.066
6 10 2206224 0.368 44.124 22487315 3.748 449.746 2318652 0.386 46.373 1080.488
2 25 3048759 0.508 60.975 30074219 5.012 601.484 3309418 0.552 66.188 1457.296
5 25 2498107 0.416 49.962 24566951 4.094 491.339 2656134 0.443 53.123 1188.848
7 25 1884406 0.314 37.688 26918170 4.486 538.363 2807552 0.468 56.151 1264.405
3 40 2986683 0.498 59.734 30347953 5.058 606.959 3218983 0.536 64.380 1462.145
8 40 3433872 0.572 68.677 30036977 5.006 600.740 3165211 0.528 63.304 1465.442
9 40 2803399 0.467 56.068 25734487 4.289 514.690 2787913 0.465 55.758 1253.032
Data Collection Sheet
Run Anthocyanin Concentration
Peak 3Peak 2Peak 1

78
APPENDIX D: NEAR INFARED MEASUREMENTS BY
VARIETY
NIT Measurement Milled Rice
Pilot Scale Setting
Jazzman Cocodrie Clearfield 161
3 1.216 1.275 0.805
3 0.833 1.384 0.972
3 1.011 1.503 0.833
5 0.849 1.320 0.752
5 0.722 0.770 0.758
5 0.805 1.473 0.744
9 0.804 0.859 0.752
9 0.759 0.885 0.731
9 0.617 0.654 0.706

79
VITA
Rebecca C. Schramm was born in Baton Rouge, Louisiana, in August of 1960. After many years
supporting her husband, Michael, in his career as a United States naval officer, she attended
Louisiana State University and completed a Bachelor of Science in Biological Engineering in
2004 and a Master of Science in Biological and Agricultural Engineering in 2006. With the
assistance of a Board of Regents Fellowship, she will receive a Doctor of Philosophy in
engineering sciences at Louisiana State University in May of 2010.