Embed Size (px)
Citation preview
1 | P a g e
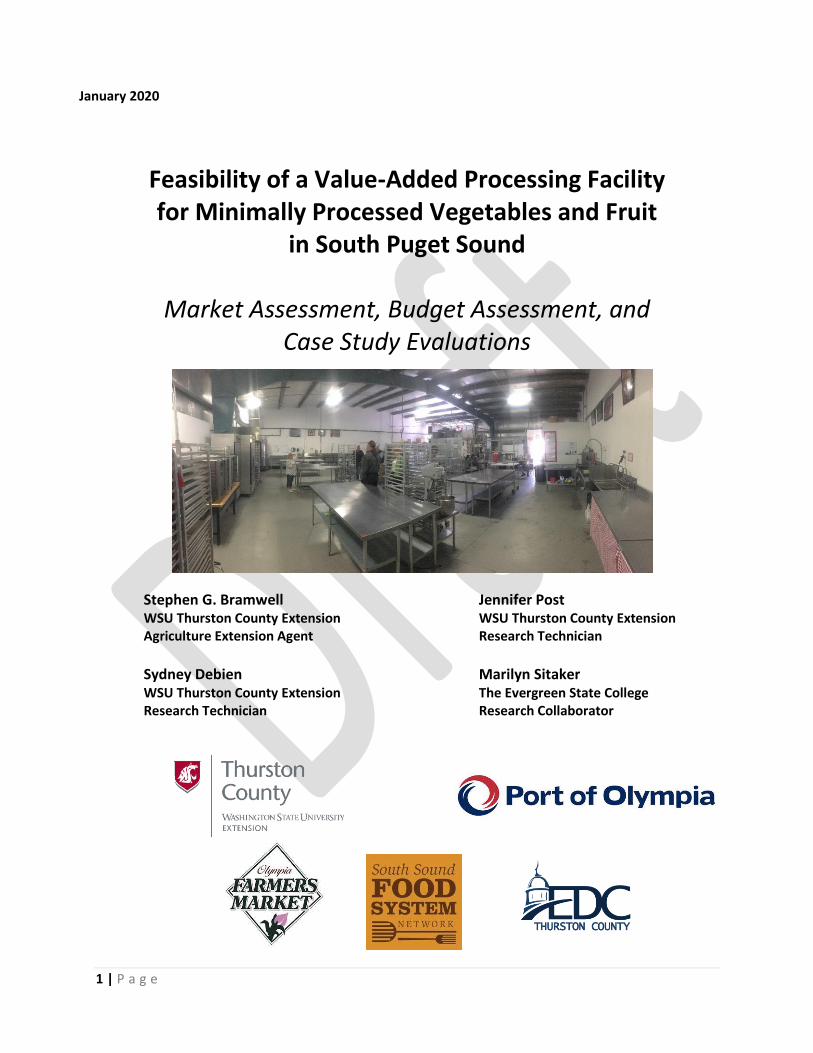
Feasibility of a Value-Added Processing Facility for Minimally Processed Vegetables and Fruit
in South Puget Sound
Market Assessment, Budget Assessment, and Case Study Evaluations
Stephen G. Bramwell Jennifer Post WSU Thurston County Extension WSU Thurston County Extension Agriculture Extension Agent Research Technician
Sydney Debien Marilyn Sitaker WSU Thurston County Extension The Evergreen State College Research Technician Research Collaborator
January 2020
2 | P a g e
Table of Contents Section I. Introduction to a Proposed Community Processing Facility 3 Section II. Key Findings of the Budget Work Section III. Market Opportunity for Value-Added Products Section IV. Enterprise Budget Tool for Minimally Processed Vegetables Section V. Case Studies of Four Processing Facilities Section VI. Food Processing Facility Case Studies
3 | P a g e
Section I. Introduction to a Proposed Community Processing Facility Processing Facility Concept The intent of this feasibility study was to evaluate the economic viability of a food processing facility for vegetables and fruit grown in South Puget Sound, and Western Washington more generally. This facility would focus on minimally processed vegetable and fruit products available both raw and frozen. Minimal processing refers to processes that improve convenience for the end-user without altering the fundamental nature and nutritional value of the product, including peeling, slicing, cutting, dicing, and chopping. This feasibility assessment focused on non-chilled products, but was intended to be augmented with capacity to blanch and chill to produce frozen minimally processed vegetables and fruit. Facility Scale – Proposed Capacity and Pilot Start-Up Data in this report is oriented towards a start-up processing facility capable of producing a mid-scale volume of minimally processed vegetables and fruit in the range of 1,000 lbs per day. Most of the equipment selection, start-up budget, enterprise budgets and profit-loss analyses are oriented to this daily run capacity. However, a short corollary analysis is envisioned that provides guidance to establish a minimally-financed start-up operation ($28,500) using several general-use, lower cost pieces of equipment (Table 6). This is intended to support a pilot-scale processing operation purchasing product from one farm and selling on average 250-1,000 lbs of minimally processed product per week to one pilot buyer. Intent of this Information Most immediately, this information is intended to inform development of a pilot processing effort in South Puget Sound. More generally, information contained in this report is intended to find use locally and more broadly, by communities interested in establishing community processing facilities. Information and resources compiled in this report includes:
1. Interests in establishing community food processing facilities 2. Examples of local market data collection regarding value-added processed products, including
for direct and institutional sales (actual markets assessed are in South Puget Sound) 3. Inventory, capacity, and cost estimates of common equipment used in a processing facility 4. Planning tools for evaluating crop seasonality, processing times, and processing costs 5. Enterprise and profit-loss budgeting tools for a processing kitchen focused on minimally
processed vegetables 6. Information on facility layout from existing facilities, and preliminary design for a facility for
minimally processed vegetables 7. Insights from visits to existing processing facilities
Project Scope This work consisted of the following:
• Market assessment of 13 institutional buyers in South Puget Sound that may constitute a market for value-added and/or minimally processed vegetable and fruit products
• A farmers’ market shopper assessment at the Olympia Farmers’ Market evaluating interest in value-added produce sold directly to farm customers (through their own label or a collective label) at the farmers’ market
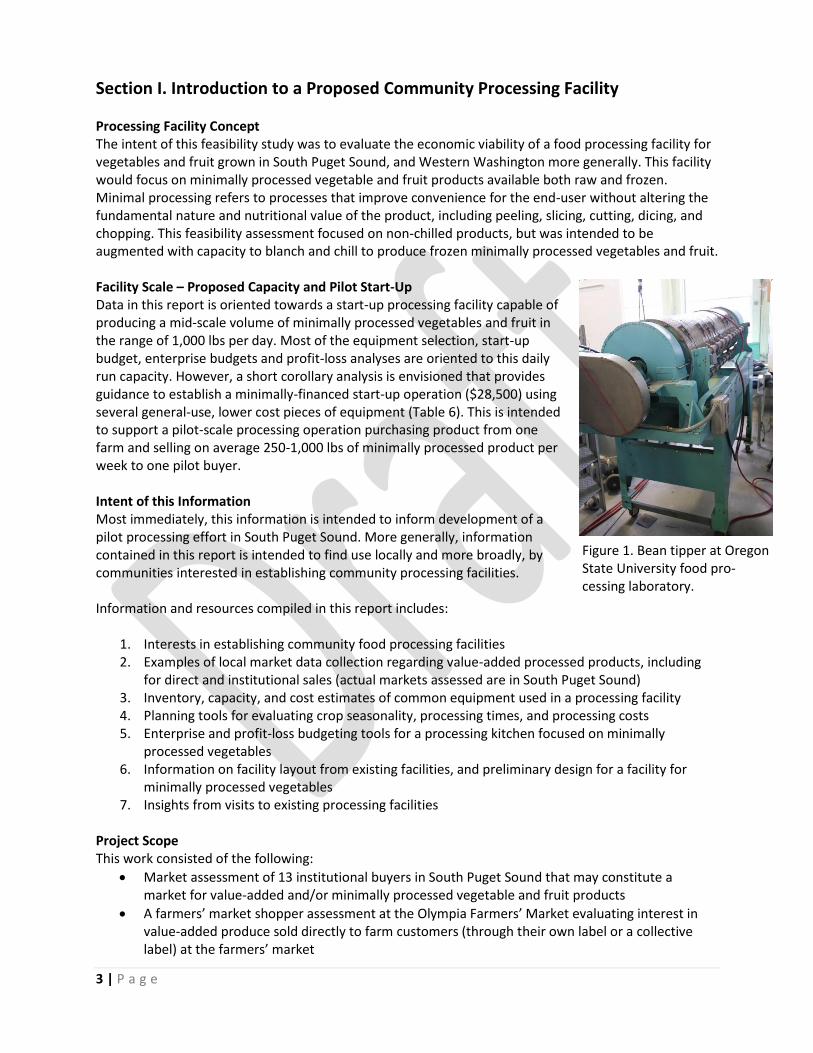
Figure 1. Bean tipper at Oregon State University food pro-cessing laboratory.
4 | P a g e
• An evaluation of Community Supported Agriculture (CSA) customers regarding their interest in purchase of winter CSA shares that include value-added farm products
• Four case studies of processing facilities, including the Western Massachusetts Food Processing Center (Greenfield, MA), the Meals on Wheels People program (Portland, OR), From the Farm (Mt. Vernon, WA), and Community Harvest (Fort Wayne, IN).
• A community workshop gathering on interest in a community processing facility, disseminating survey results, and sharing information on processing kitchen regulations with the Washington State Department of Agriculture Food Safety Program, and Thurston County Public Health
• An economic analysis evaluating the financial feasibility of producing minimally processed vegetables for institutional, restaurant and retail sale, with an initial focus on institutional sales
• A Food Processing Facility User Survey to evaluate interest in renting processing space at a community kitchen
Facility Ownership and Operation Ownership and operations of a processing facility is envisioned to take one of several forms, described below. Location of a facility would be determined by the entity operating. In the short-term, this assessment assumes the facility is co-located to
1. Co-located with an existing facility such as a centralized meals kitchen operated by Senior Services for South Sound, and operated by SSSS
2. Co-located with an existing facility, and operated by a Community Development Corporation
3. Co-located at Owned and operated by a for-profit venture.
Minimally Processed Versus Individually Quick-Frozen (IQF) Products? The vision at the outset of this effort was to evaluate the feasibility of a frozen IQF facility. Over the course of several site visits, and development of various enterprise budget tools, it became clear that IQF processing requires a very high level of investment considering infrastructure needs. Purchased equipment, site infrastructure, estimated rental equipment (liquid nitrogen coolant tank), coolant cost, and added space requirements indicated that IQF would not be a recommended initial processing capacity for a community to experiment with. Consequently, the focus of this report narrowed to minimal processing of vegetables for sale to institutional buyers, with the rationale that such an enterprise could be operational in 2020 or 2021. The potential and usefulness of quick-freezing processing capacity in South Puget Sound remains high. As such, addition of blanching and chilling capacity, whether IQF or a simpler processing approach (such as racked steam ovens) is proposed as a Phase II addition to the processing capacity described here. Further research and analysis will be needed to understand the pricing/investment requirements to augment minimally processed vegetables with capacity to chill product. Even without IQF capabilities, this facility represents a new market opportunity to growers by connecting them with institutional buyers that are willing to pay for local and certified-organic, ready to eat, minimally processed vegetables. Finding the right institutional buyer will be important, one that can utilize the product on a just-in-time basis.
5 | P a g e
Section II: Key Findings of the Budget Work This financial analysis evaluated the profitability of a processing facility for minimally processed vegeta-bles. The scenarios described provide insight on the profitability of minimal processing as an enterprise within a fixed set of assumptions. Read this way, these results can be considered final conclusions, so to speak, on profitability as described below. On the other hand, this study and included budgeting tool is a “working model”. The findings are provi-sional insofar as we’ve looked at a finite number of options. The budgeting tool itself (which is an Excel workbook) can be used to test other assumptions and scenarios in search for a profitable and practical pattern that fits the team of growers, processors and buyers involved in the community. Read this way, additional conclusions could be drawn that we may not have considered. General Comments The general conclusion from this work is that a profitable enterprise is possible. However, profitability requires the right combination of processing crops, grower pricing, and institutional pricing, not surpris-ingly. With purchase pricing being a significant cost, it would be critical for an envisioned enterprise to pin-point the ideal price for growers (balancing a fair price and success of the processing facility). On the other hand, the ideal customer for this enterprise is an institution that enjoys some pricing flexi-bility, embraces the value in organic, locally-processed crops, and as a result is willing to pay more. This will not be feasible for most institutional buyers, and indeed perhaps no more than 20-25% fall into this category (as discussed in the Institutional Buyer Survey key findings section (p. ). Overall Findings The largest costs to the enterprise were raw goods and start-up equipment costs. Pricing had a greater impact on profitability than public investment but public funds could bridge the gap to profitability. No volume of processing improved the outlook if the sales price is too low and the purchase of raw product too high. The “low” average price estimated in this study for purchasing wholesale vegetables from farmers was $1.12/lb, and the mid-high average was $1.49/lb (as represented by local Food Co-op pricing and a local food Distributor). The “low” institutional purchase price defined in this study for minimally processed vegetables was $2.00/lb (based on the high end of the spectrum among purchase prices by institutional buyers), while the high price was defined as $2.50/lb. Not surprisingly, a higher price to institutions was needed/required if considering the higher prices to growers. Crop combinations were generally more profitable that focused on carrots, summer and winter squash than broccoli and green beans. Particularly promising was finding crops that could be processed on the same set of equipment as carrots, such as beets, potatoes, turnips, rutabaga. Crop wastage 5-20% and may be an opportunity for improved profitability through decreased waste, or for another enterprise like vegetable broth. Profitability findings Generally, a profitable enterprise was possible with the right combination of processing crops, grower pricing, and institutional pricing.
6 | P a g e
High purchase price and low sales price scenarios were dramatically unprofitable. Public investment at the level considered in this study did not improve the outlook of these most unprofitable scenarios. However, public investment and low purchase pricing typically resulted in positive P/L balances in at least some scenarios in each of the overall analysis situations illustrated in Column 4 in Tables 10, 11 and 12 (these tables examine, respectively, crop selections that focus on either profitability, perceived buyer preferences, or new market opportunities). Specifically:
1. P/L of most profitable crops (Table 10) with low pricing and public investment range from $22,00 to $34,000 per year
2. P/L of processing scenarios that included greater crop diversity (Table 11) range from $2,400 to $9,200
3. P/L of the only profitable processing scenario oriented towards providing new product/market opportunity (Table 12, changed from 13), was $12,500
Because low purchase prices to farmers is not recommended as a viable strategy to widely support the farming population, a second analysis was included in each section (Table groupings 10, 11 and 12) that compared purchase and sales price variations to find a pricing sweet spot that could work for both par-ties. Generally, pricing is expected to stretch buyers, or sellers to some degree.
1. Mid-range purchase prices are profitable along with mid-range sales prices for the more profitable crops (Table 10b, Column Z and Row C)
2. Mid-range purchase prices are barely unprofitable paired with mid-range sales prices for the less profitable crops, indicating a gap that needs bridging by public financing (Table 12b, Column Z and Row C…so long as ‘mid’ range is defined for this)
3. Mid-range purchase prices are unprofitable to profitable paired with mid-to-high range sales prices for the crop selection that may provide new market opportunities for growers
Generally, public support would enable the achievement of profitability in scenarios most likely to be widely supported: those that provide mid-range purchase prices to growers, that provide mid-range sales prices to buyers, and that provide a diversity of product availability in a way that provides more production options for farmers, and purchase options for buyers. Guidance on the Feasibility Study Approach Crop selection Crop selection and seasonality was the primary starting point for developing a processing facility opera-tional plan. This is presented in Table 1. Both grower and buyer preferences guided crop selection, and crops were considered that are 1) potentially scalability in the field, and in this sense were not labor in-tensive (or could be mechanized somewhat readily within limitations of grower capitalization), 2) profit-able on a per acre basis, and 3) demand by buyers. A range of crops were desired to achieve a year-round processing schedule, and so included those easily stored for processing later, and those in need of immediate process. Inclusion of winter squash, as a storable item is representative of these priorities: it is storable, in de-mand, and scalable. It is encouraging that this is a crop processed by other facilities, such as Mission Mountain in Ronan, MT and Pioneer Valley Vegetables at the Western Mass Food processing center in Greenfield, MA (Case study 1). Seasonality
7 | P a g e
It should be noted that the timeframes for processing seasonality (Table 1) could be extended via season extension and even crop succession to some extent. However, timeframes were selected conservatively for this study to establish a basic seasonal processing plan. Processing Volume/Scale A rough processing target was established of 1,000 lbs per day. Extrapolated across the year this would represent approximately 100 tons of produce. While this would be an impressive win for a new small-scale community processing facility, it is important to keep in mind that this could be grown on approxi-mately ten acres (Table 2).
This scale was selected because it exceeded an amount that could be considered “token” processing of several hundred pounds here and there. Yet the scale also stayed within a lim-ited (1,000 per day and ~100 tons per year) that would allow establishment of this enterprise within an existing processing kitchen, and not require renovation of a new large warehouse purpose-designed for processing. It was perceived that this would be cost-prohibitive for a new and relatively untested vision in the region. Not coincidentally, this scale is comparable to Pioneer Valley Vegetables in Greenfield, MA, established three years ago, which has steadily have grown to processing 250,000 lbs veg-etables per year with IQF processing line. This pattern pro-vides a decent template for comparable goals for this facility.
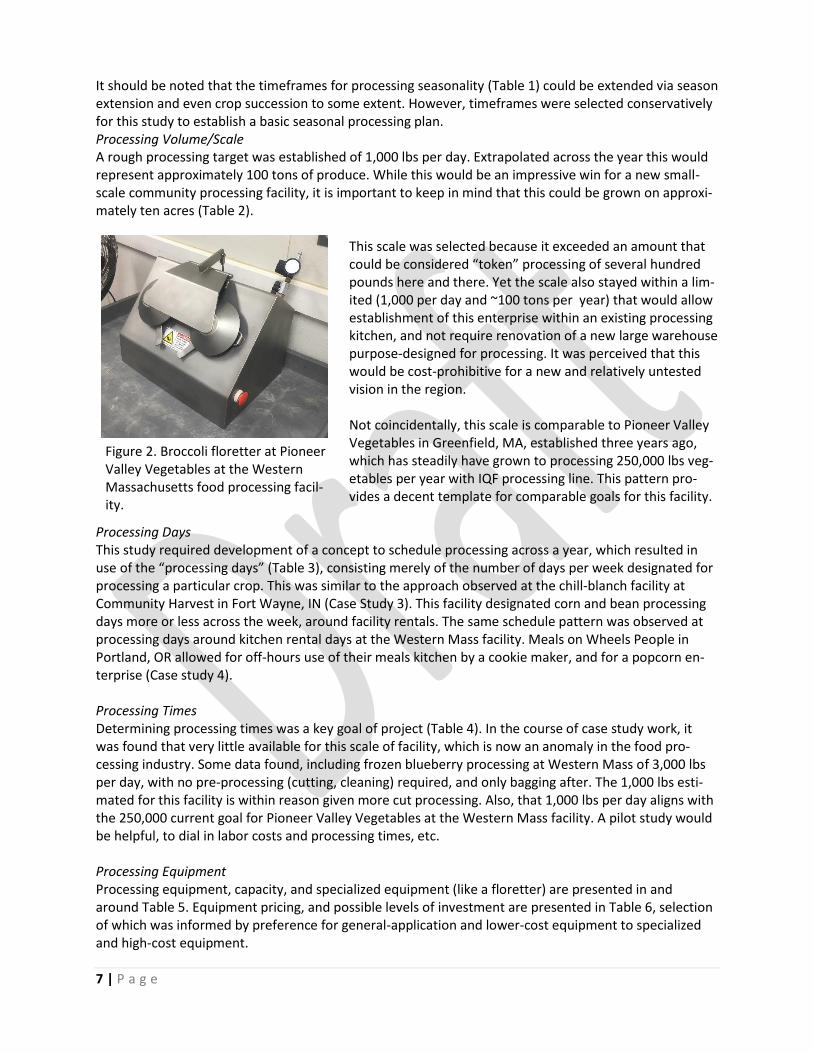
Processing Days This study required development of a concept to schedule processing across a year, which resulted in use of the “processing days” (Table 3), consisting merely of the number of days per week designated for processing a particular crop. This was similar to the approach observed at the chill-blanch facility at Community Harvest in Fort Wayne, IN (Case Study 3). This facility designated corn and bean processing days more or less across the week, around facility rentals. The same schedule pattern was observed at processing days around kitchen rental days at the Western Mass facility. Meals on Wheels People in Portland, OR allowed for off-hours use of their meals kitchen by a cookie maker, and for a popcorn en-terprise (Case study 4). Processing Times Determining processing times was a key goal of project (Table 4). In the course of case study work, it was found that very little available for this scale of facility, which is now an anomaly in the food pro-cessing industry. Some data found, including frozen blueberry processing at Western Mass of 3,000 lbs per day, with no pre-processing (cutting, cleaning) required, and only bagging after. The 1,000 lbs esti-mated for this facility is within reason given more cut processing. Also, that 1,000 lbs per day aligns with the 250,000 current goal for Pioneer Valley Vegetables at the Western Mass facility. A pilot study would be helpful, to dial in labor costs and processing times, etc. Processing Equipment Processing equipment, capacity, and specialized equipment (like a floretter) are presented in and around Table 5. Equipment pricing, and possible levels of investment are presented in Table 6, selection of which was informed by preference for general-application and lower-cost equipment to specialized and high-cost equipment.
Figure 2. Broccoli floretter at Pioneer Valley Vegetables at the Western Massachusetts food processing facil-ity.
8 | P a g e
Additional Notes on Processing Equipment
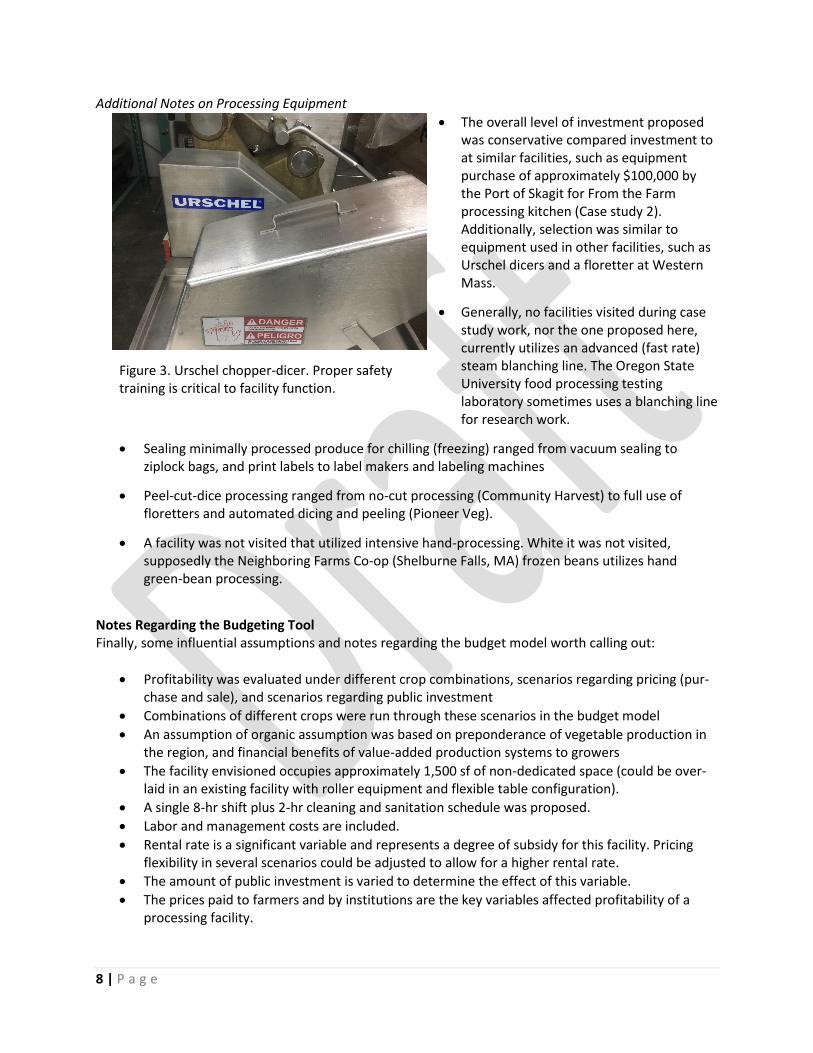
• The overall level of investment proposed was conservative compared investment to at similar facilities, such as equipment purchase of approximately $100,000 by the Port of Skagit for From the Farm processing kitchen (Case study 2). Additionally, selection was similar to equipment used in other facilities, such as Urschel dicers and a floretter at Western Mass.
• Generally, no facilities visited during case study work, nor the one proposed here, currently utilizes an advanced (fast rate) steam blanching line. The Oregon State University food processing testing laboratory sometimes uses a blanching line for research work.
• Sealing minimally processed produce for chilling (freezing) ranged from vacuum sealing to ziplock bags, and print labels to label makers and labeling machines
• Peel-cut-dice processing ranged from no-cut processing (Community Harvest) to full use of floretters and automated dicing and peeling (Pioneer Veg).
• A facility was not visited that utilized intensive hand-processing. White it was not visited, supposedly the Neighboring Farms Co-op (Shelburne Falls, MA) frozen beans utilizes hand green-bean processing.
Notes Regarding the Budgeting Tool Finally, some influential assumptions and notes regarding the budget model worth calling out:
• Profitability was evaluated under different crop combinations, scenarios regarding pricing (pur-chase and sale), and scenarios regarding public investment
• Combinations of different crops were run through these scenarios in the budget model
• An assumption of organic assumption was based on preponderance of vegetable production in the region, and financial benefits of value-added production systems to growers
• The facility envisioned occupies approximately 1,500 sf of non-dedicated space (could be over-laid in an existing facility with roller equipment and flexible table configuration).
• A single 8-hr shift plus 2-hr cleaning and sanitation schedule was proposed.
• Labor and management costs are included.
• Rental rate is a significant variable and represents a degree of subsidy for this facility. Pricing flexibility in several scenarios could be adjusted to allow for a higher rental rate.
• The amount of public investment is varied to determine the effect of this variable.
• The prices paid to farmers and by institutions are the key variables affected profitability of a processing facility.
Figure 3. Urschel chopper-dicer. Proper safety training is critical to facility function.
9 | P a g e
Section II. Market Opportunity for Value-Added Products This market assessment sought to address market expansion needs identified by farmers by evaluating the potential of value-added market opportunities for fruit and vegetable producers through development of a facility for processing organic, locally-grown, and origin-identified fruits and vegetables. This analysis evaluated:
1. Current customers of produce box subscription programs (CSA subscribers), 2. Farmers’ market customers, and 3. Buyers at regional institutions such as schools, hospitals, and correctional facilities.
These three consumer types were targeted because they potentially represented three different price ranges, and different purchasing volumes. See appendix I for interview and survey questions. Preparation of the survey tools was assisted by an advisory panel of six farmers who provided input on data collection objectives and question content and structure. Technical services were provided by the WSU Division of Governmental Studies and Services, which reviewed survey questions and design to ensure validity, and utilized social exchange theory to develop survey language. Each survey was reviewed by the WSU Institutional Review Board and determined to be exempt human subjects research.
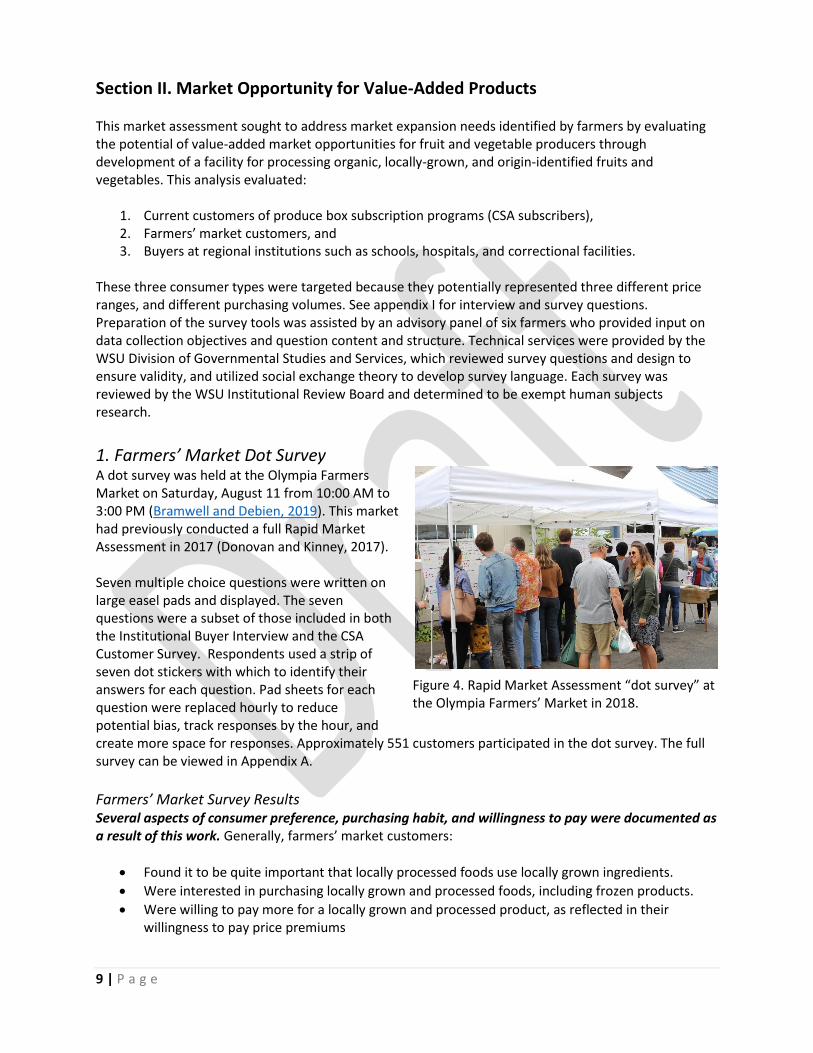
1. Farmers’ Market Dot Survey A dot survey was held at the Olympia Farmers Market on Saturday, August 11 from 10:00 AM to 3:00 PM (Bramwell and Debien, 2019). This market had previously conducted a full Rapid Market Assessment in 2017 (Donovan and Kinney, 2017). Seven multiple choice questions were written on large easel pads and displayed. The seven questions were a subset of those included in both the Institutional Buyer Interview and the CSA Customer Survey. Respondents used a strip of seven dot stickers with which to identify their answers for each question. Pad sheets for each question were replaced hourly to reduce potential bias, track responses by the hour, and create more space for responses. Approximately 551 customers participated in the dot survey. The full survey can be viewed in Appendix A.
Farmers’ Market Survey Results Several aspects of consumer preference, purchasing habit, and willingness to pay were documented as a result of this work. Generally, farmers’ market customers:
• Found it to be quite important that locally processed foods use locally grown ingredients.
• Were interested in purchasing locally grown and processed foods, including frozen products.
• Were willing to pay more for a locally grown and processed product, as reflected in their willingness to pay price premiums
Figure 4. Rapid Market Assessment “dot survey” at the Olympia Farmers’ Market in 2018.
10 | P a g e
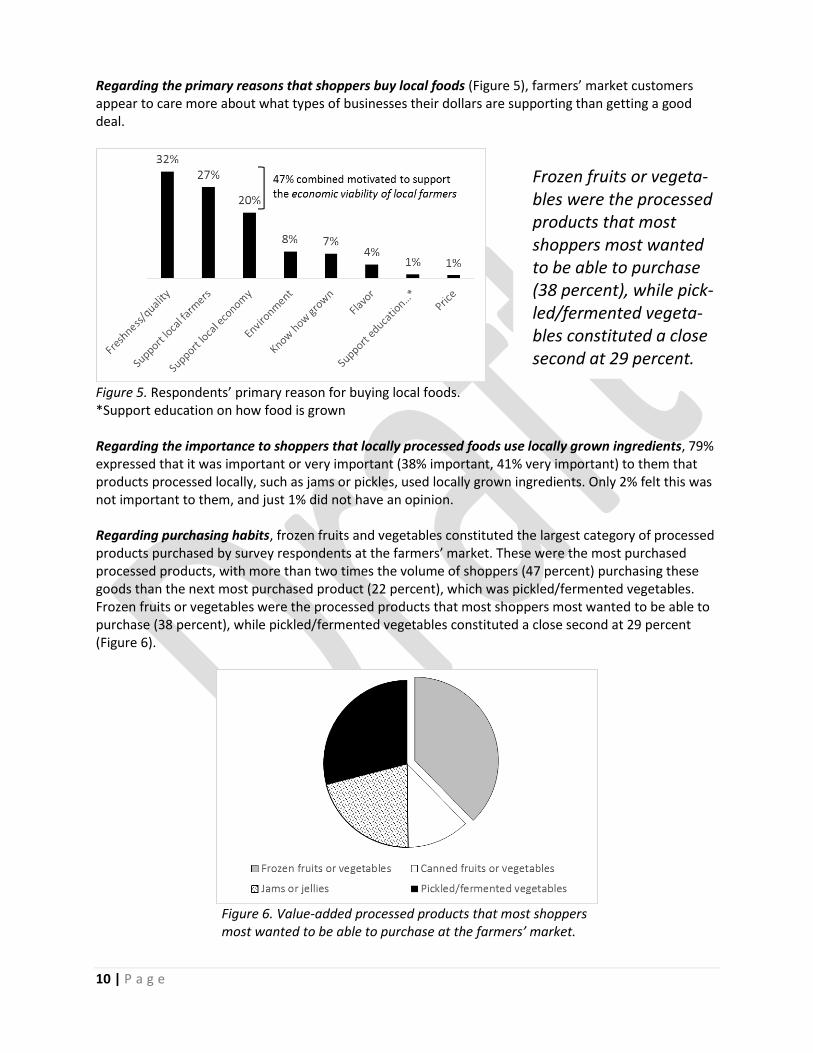
Regarding the primary reasons that shoppers buy local foods (Figure 5), farmers’ market customers appear to care more about what types of businesses their dollars are supporting than getting a good deal.
Figure 5. Respondents’ primary reason for buying local foods. *Support education on how food is grown Regarding the importance to shoppers that locally processed foods use locally grown ingredients, 79% expressed that it was important or very important (38% important, 41% very important) to them that products processed locally, such as jams or pickles, used locally grown ingredients. Only 2% felt this was not important to them, and just 1% did not have an opinion. Regarding purchasing habits, frozen fruits and vegetables constituted the largest category of processed products purchased by survey respondents at the farmers’ market. These were the most purchased processed products, with more than two times the volume of shoppers (47 percent) purchasing these goods than the next most purchased product (22 percent), which was pickled/fermented vegetables. Frozen fruits or vegetables were the processed products that most shoppers most wanted to be able to purchase (38 percent), while pickled/fermented vegetables constituted a close second at 29 percent (Figure 6).
Figure 6. Value-added processed products that most shoppers most wanted to be able to purchase at the farmers’ market.
Frozen fruits or vegeta-bles were the processed products that most shoppers most wanted to be able to purchase (38 percent), while pick-led/fermented vegeta-bles constituted a close second at 29 percent.
11 | P a g e
Regarding purchase preferences, frozen stir-fry veggie mix was the local frozen product shoppers would most like to buy, with 31% of respondents selecting this product (Table 1). Frozen blueberries were second (22%), followed by strawberries, raspberries and other products. Apparently, there is greater interest in the local frozen products that are typically more expensive for consumers and may have a larger profit margin for growers.
Table 1. Frozen product that farmers’ market shoppers would most like to buy*
*It was noted on the flip chart that, “All products are locally grown and locally processed”
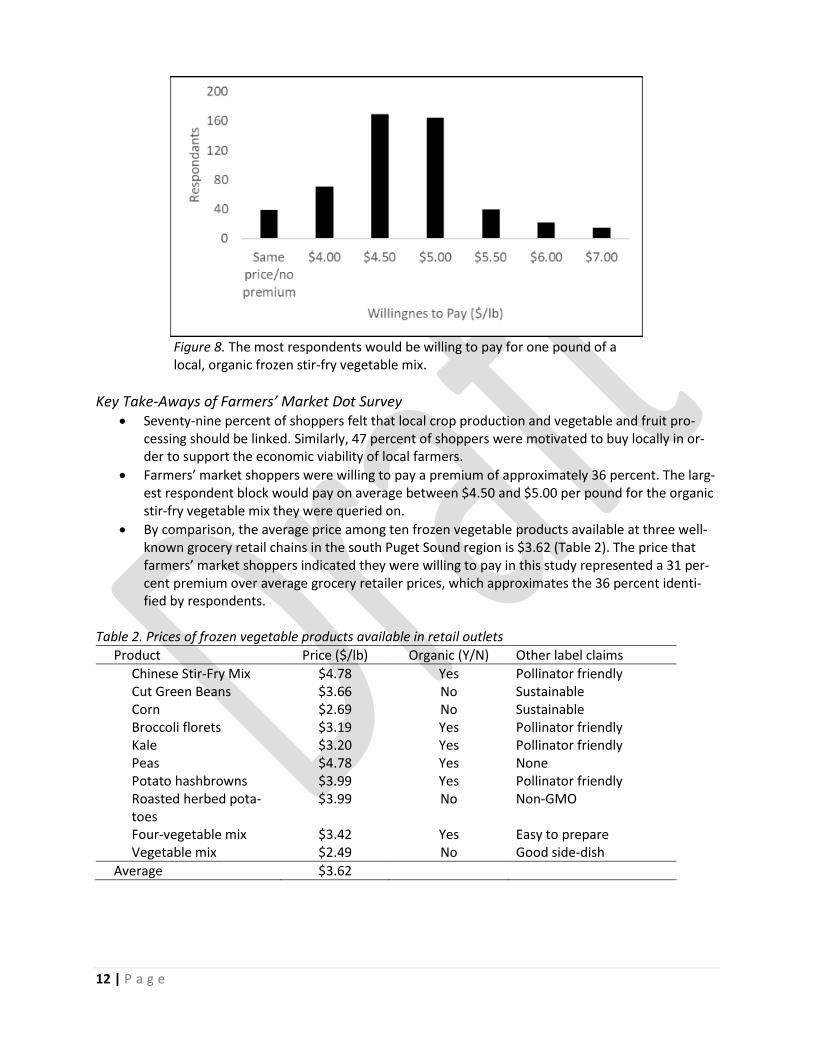
Willingness to pay was evaluated by determining the most shoppers would pay for locally grown and processed frozen stir-fry veggies if non-local sitr-fry veggies cost $3.50/lb at the supermarket. The structure of this question was based on a study investigating meat and poultry purchasing at Oregon farmers markets (Gwin and Lev, 2011). This question was asked in place of the Van Westendorp pricing questions included in the institutional buyer and CSA customer surveys. A similar question was also included in the CSA survey to compare the types of premiums these two customer bases were willing to pay. Ninety-three percent of respondents were willing to pay a premium for a local, organic frozen stir-fry veggie mix. Thirty-two percent would pay a dollar more per pound, 32% would pay $1.50 more, and 15% would pay $2.00 or more (8% would pay $2.00, 4% would pay $2.50, 3% would pay $3.50 more; Figure 8). Broadly, 32% were willing to pay a 29% premium, 32% were willing to pay a 43% premium, and a substantial combined block (64%) of shoppers identified this price range of $4.50 to $5.00 per lb as their comfortable “willingness to pay” for a locally grown and locally processed frozen organic vegetable mix.
Frozen vegetable or fruit product Percentage of shoppers (%)
Stir-fry veggie mix Blueberries Strawberries Peas Raspberries Broccoli Green beans Carrots
31 22 12 11 10 8 5 2
A substantial com-bined block (64%) of shoppers identified this price range of $4.50 to $5.00 per pound as their com-fortable “willingness to pay” for a locally grown and locally processed frozen or-ganic vegetable mix.
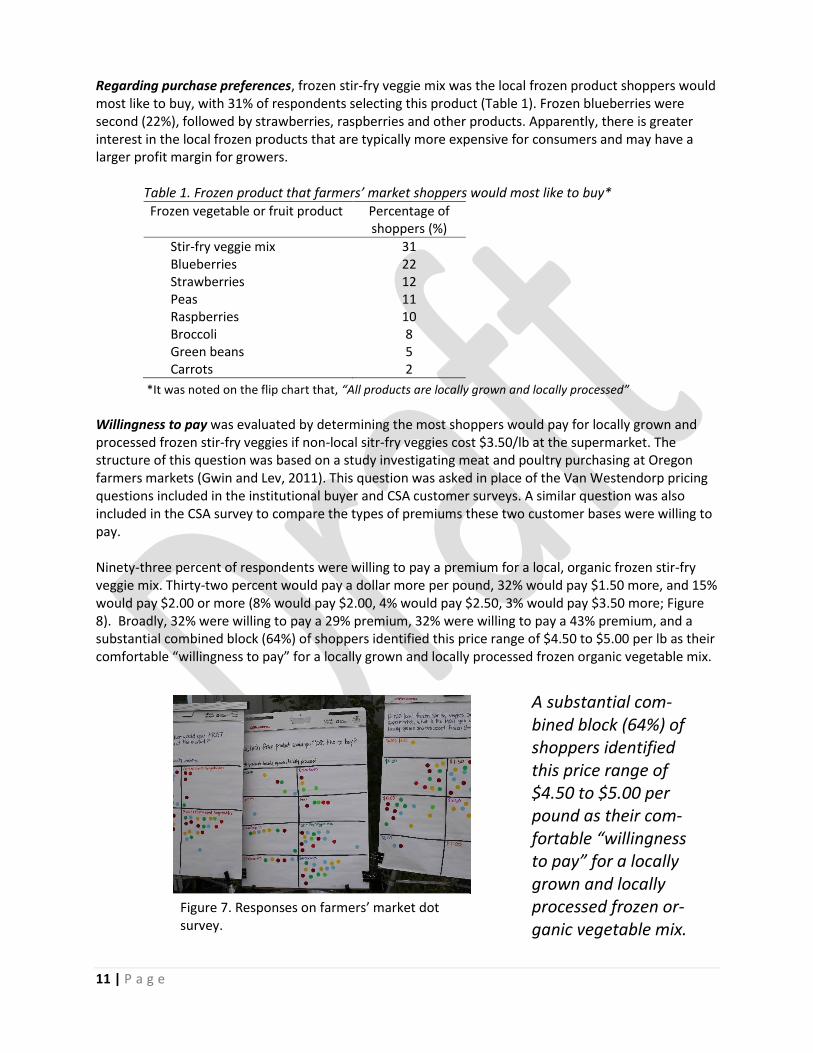
Figure 7. Responses on farmers’ market dot survey.
12 | P a g e
Figure 8. The most respondents would be willing to pay for one pound of a local, organic frozen stir-fry vegetable mix.
Key Take-Aways of Farmers’ Market Dot Survey • Seventy-nine percent of shoppers felt that local crop production and vegetable and fruit pro-
cessing should be linked. Similarly, 47 percent of shoppers were motivated to buy locally in or-der to support the economic viability of local farmers.
• Farmers’ market shoppers were willing to pay a premium of approximately 36 percent. The larg-est respondent block would pay on average between $4.50 and $5.00 per pound for the organic stir-fry vegetable mix they were queried on.
• By comparison, the average price among ten frozen vegetable products available at three well-known grocery retail chains in the south Puget Sound region is $3.62 (Table 2). The price that farmers’ market shoppers indicated they were willing to pay in this study represented a 31 per-cent premium over average grocery retailer prices, which approximates the 36 percent identi-fied by respondents.
Table 2. Prices of frozen vegetable products available in retail outlets
Product Price ($/lb) Organic (Y/N) Other label claims
Chinese Stir-Fry Mix $4.78 Yes Pollinator friendly Cut Green Beans $3.66 No Sustainable Corn $2.69 No Sustainable Broccoli florets $3.19 Yes Pollinator friendly Kale $3.20 Yes Pollinator friendly Peas $4.78 Yes None Potato hashbrowns $3.99 Yes Pollinator friendly Roasted herbed pota-toes
$3.99 No Non-GMO
Four-vegetable mix $3.42 Yes Easy to prepare Vegetable mix $2.49 No Good side-dish
Average $3.62
13 | P a g e
2. CSA Subscriber Survey
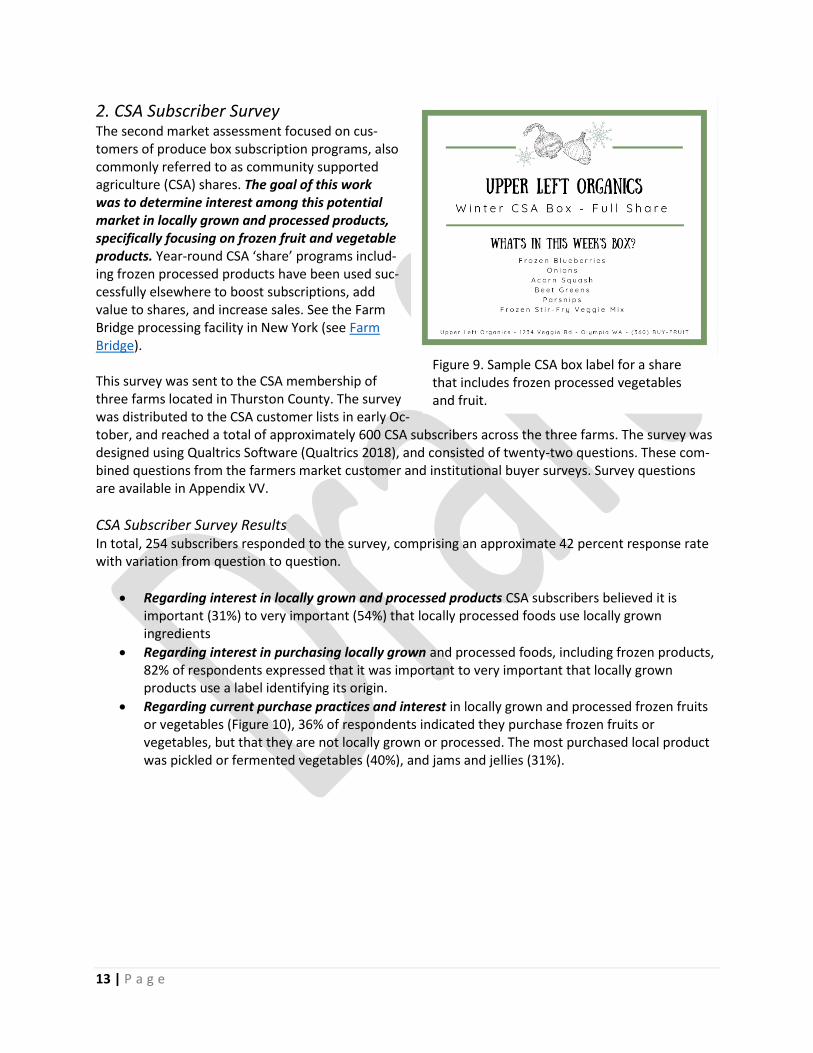
The second market assessment focused on cus-tomers of produce box subscription programs, also commonly referred to as community supported agriculture (CSA) shares. The goal of this work was to determine interest among this potential market in locally grown and processed products, specifically focusing on frozen fruit and vegetable products. Year-round CSA ‘share’ programs includ-ing frozen processed products have been used suc-cessfully elsewhere to boost subscriptions, add value to shares, and increase sales. See the Farm Bridge processing facility in New York (see Farm Bridge). This survey was sent to the CSA membership of three farms located in Thurston County. The survey was distributed to the CSA customer lists in early Oc-tober, and reached a total of approximately 600 CSA subscribers across the three farms. The survey was designed using Qualtrics Software (Qualtrics 2018), and consisted of twenty-two questions. These com-bined questions from the farmers market customer and institutional buyer surveys. Survey questions are available in Appendix VV.
CSA Subscriber Survey Results In total, 254 subscribers responded to the survey, comprising an approximate 42 percent response rate with variation from question to question.
• Regarding interest in locally grown and processed products CSA subscribers believed it is important (31%) to very important (54%) that locally processed foods use locally grown ingredients
• Regarding interest in purchasing locally grown and processed foods, including frozen products, 82% of respondents expressed that it was important to very important that locally grown products use a label identifying its origin.
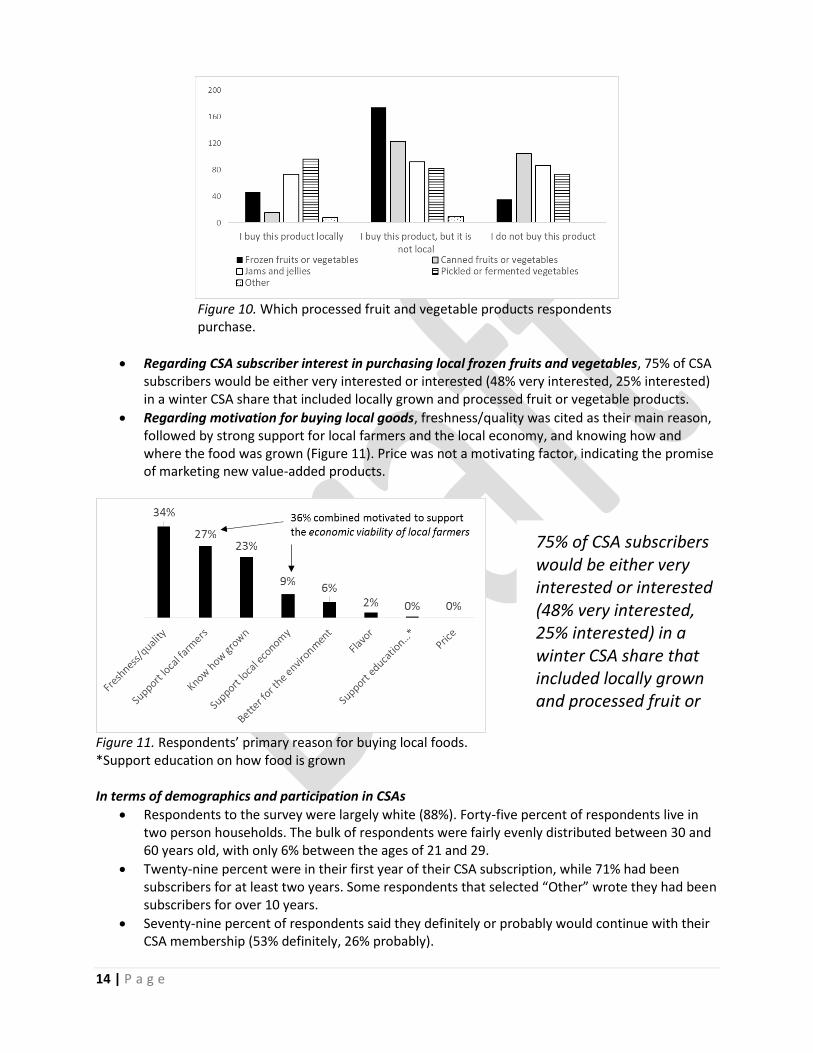
• Regarding current purchase practices and interest in locally grown and processed frozen fruits or vegetables (Figure 10), 36% of respondents indicated they purchase frozen fruits or vegetables, but that they are not locally grown or processed. The most purchased local product was pickled or fermented vegetables (40%), and jams and jellies (31%).
Figure 9. Sample CSA box label for a share that includes frozen processed vegetables and fruit.
14 | P a g e
Figure 10. Which processed fruit and vegetable products respondents purchase.
• Regarding CSA subscriber interest in purchasing local frozen fruits and vegetables, 75% of CSA subscribers would be either very interested or interested (48% very interested, 25% interested) in a winter CSA share that included locally grown and processed fruit or vegetable products.
• Regarding motivation for buying local goods, freshness/quality was cited as their main reason, followed by strong support for local farmers and the local economy, and knowing how and where the food was grown (Figure 11). Price was not a motivating factor, indicating the promise of marketing new value-added products.
Figure 11. Respondents’ primary reason for buying local foods. *Support education on how food is grown In terms of demographics and participation in CSAs
• Respondents to the survey were largely white (88%). Forty-five percent of respondents live in two person households. The bulk of respondents were fairly evenly distributed between 30 and 60 years old, with only 6% between the ages of 21 and 29.
• Twenty-nine percent were in their first year of their CSA subscription, while 71% had been subscribers for at least two years. Some respondents that selected “Other” wrote they had been subscribers for over 10 years.
• Seventy-nine percent of respondents said they definitely or probably would continue with their CSA membership (53% definitely, 26% probably).
75% of CSA subscribers would be either very interested or interested (48% very interested, 25% interested) in a winter CSA share that included locally grown and processed fruit or vegetable products.
15 | P a g e
In general, demographic information wasn’t particularly surprising, but created a useful base for future market research (for comparison with other CSA subscribers, and with other potential customer bases such as at retail outlets). With respect to willingness to pay
• CSA subscribers were overall willing to pay more for a locally grown and processed product, which aligned with their values (Figure 12). Subscribers did exhibit more limited willingness to pay than farmers’ market respondents, potentially due to the higher baseline cost of a CSA share; however, 97% of subscribers were willing to pay more for locally grown and processed products.
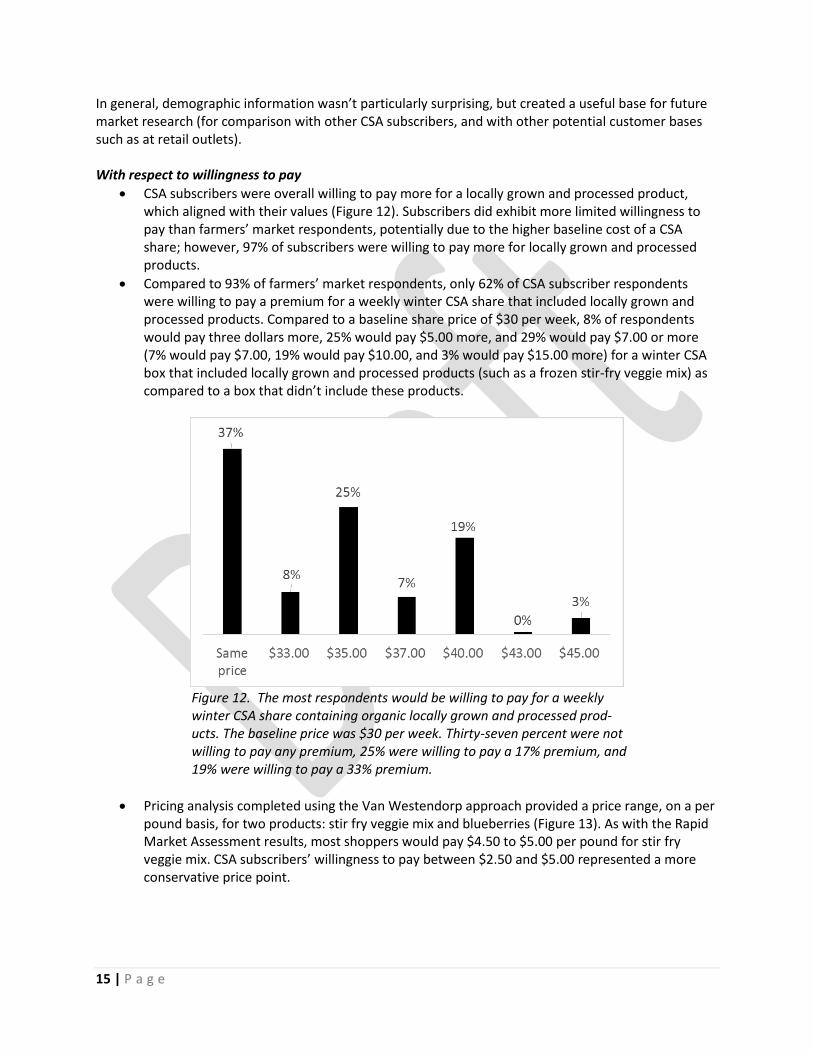
• Compared to 93% of farmers’ market respondents, only 62% of CSA subscriber respondents were willing to pay a premium for a weekly winter CSA share that included locally grown and processed products. Compared to a baseline share price of $30 per week, 8% of respondents would pay three dollars more, 25% would pay $5.00 more, and 29% would pay $7.00 or more (7% would pay $7.00, 19% would pay $10.00, and 3% would pay $15.00 more) for a winter CSA box that included locally grown and processed products (such as a frozen stir-fry veggie mix) as compared to a box that didn’t include these products.
Figure 12. The most respondents would be willing to pay for a weekly winter CSA share containing organic locally grown and processed prod-ucts. The baseline price was $30 per week. Thirty-seven percent were not willing to pay any premium, 25% were willing to pay a 17% premium, and 19% were willing to pay a 33% premium.
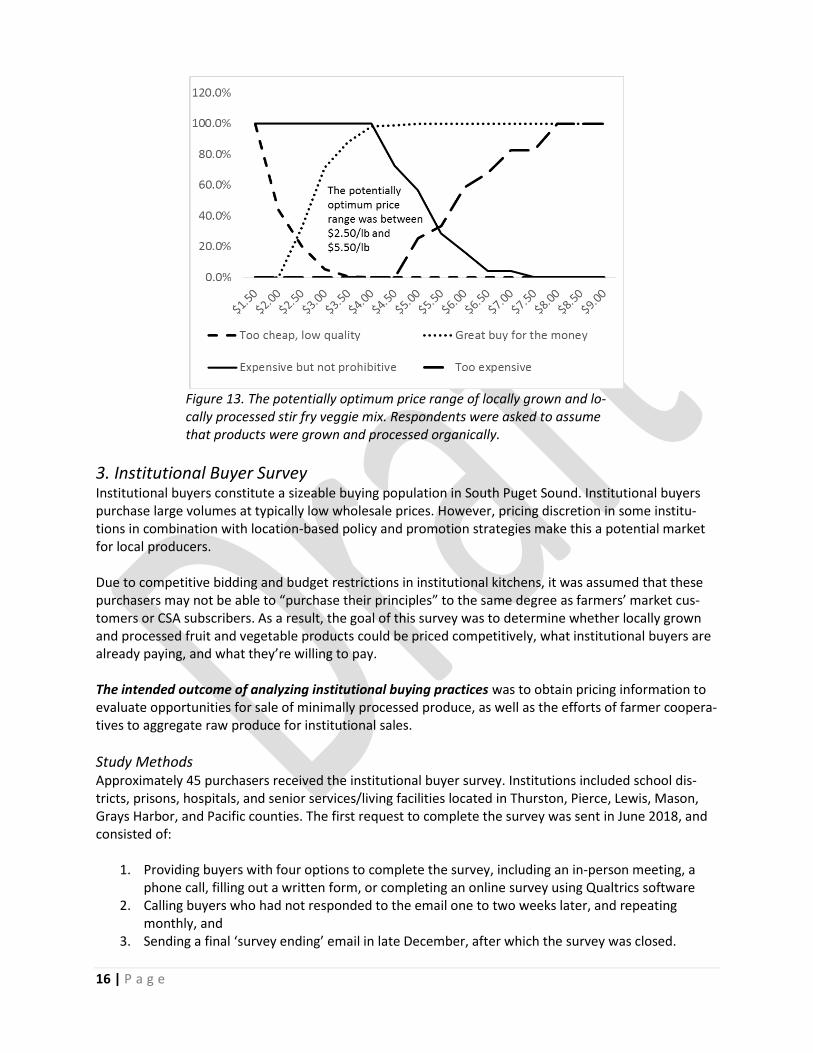
• Pricing analysis completed using the Van Westendorp approach provided a price range, on a per pound basis, for two products: stir fry veggie mix and blueberries (Figure 13). As with the Rapid Market Assessment results, most shoppers would pay $4.50 to $5.00 per pound for stir fry veggie mix. CSA subscribers’ willingness to pay between $2.50 and $5.00 represented a more conservative price point.
16 | P a g e
Figure 13. The potentially optimum price range of locally grown and lo-cally processed stir fry veggie mix. Respondents were asked to assume that products were grown and processed organically.
3. Institutional Buyer Survey
Institutional buyers constitute a sizeable buying population in South Puget Sound. Institutional buyers purchase large volumes at typically low wholesale prices. However, pricing discretion in some institu-tions in combination with location-based policy and promotion strategies make this a potential market for local producers. Due to competitive bidding and budget restrictions in institutional kitchens, it was assumed that these purchasers may not be able to “purchase their principles” to the same degree as farmers’ market cus-tomers or CSA subscribers. As a result, the goal of this survey was to determine whether locally grown and processed fruit and vegetable products could be priced competitively, what institutional buyers are already paying, and what they’re willing to pay. The intended outcome of analyzing institutional buying practices was to obtain pricing information to evaluate opportunities for sale of minimally processed produce, as well as the efforts of farmer coopera-tives to aggregate raw produce for institutional sales.
Study Methods Approximately 45 purchasers received the institutional buyer survey. Institutions included school dis-tricts, prisons, hospitals, and senior services/living facilities located in Thurston, Pierce, Lewis, Mason, Grays Harbor, and Pacific counties. The first request to complete the survey was sent in June 2018, and consisted of:
1. Providing buyers with four options to complete the survey, including an in-person meeting, a phone call, filling out a written form, or completing an online survey using Qualtrics software
2. Calling buyers who had not responded to the email one to two weeks later, and repeating monthly, and
3. Sending a final ‘survey ending’ email in late December, after which the survey was closed.
17 | P a g e
The institutional buyer survey was the longest of the three market assessments, containing 31 questions (Appendix II). Some questions were adapted from other studies, including Evaluation of Options for Freezing Produce in Western Massachusetts and Scaling up Vermont’s Local Food Production, Distribu-tion, and Marketing. The survey contained only one type of willingness to pay question, which was the Van Westendorp question set. Additionally, the survey contained questions asking about the price and quantity of frozen fruit and vegetable products the institutions currently purchase.
Survey Results and Discussion Thirteen institutional buyers completed the survey, for a 29% response rate, with variations in responses across questions due for example to certain question not applying to all buyers. In terms of facility type, interest in local foods, and motivation for purchasing local foods:
• The majority of respondents worked at educational facilities (38%), while 31% worked at correc-tional facilities, 15% at a hospitals, 8% at state cafeterias, and 8% at senior services/senior living facilities. Fifty-seven percent of respondents indicated that they already purchased local foods at their institutions. However, when asked what percent of their institution’s total food pur-chases were local, 83% said those local foods only made up 0-5% of all food bought.
• Sixty-nine percent if respondents were interested in increasing the percentage of local foods their institution purchases.
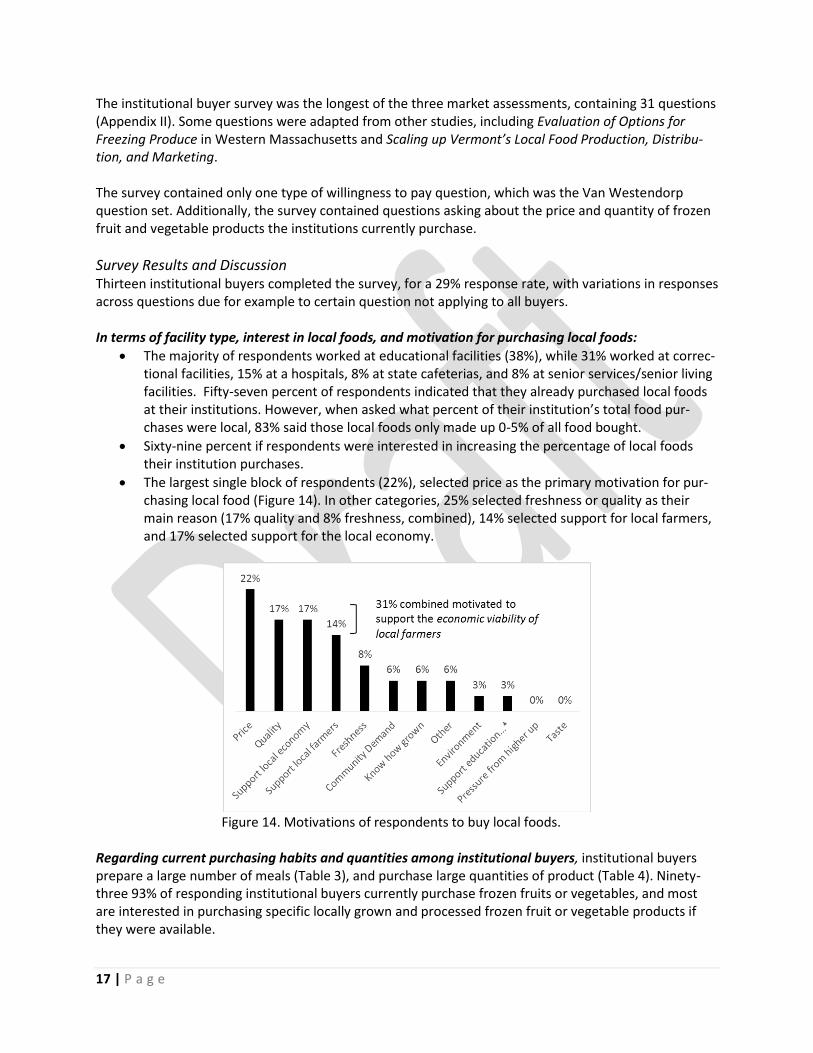
• The largest single block of respondents (22%), selected price as the primary motivation for pur-chasing local food (Figure 14). In other categories, 25% selected freshness or quality as their main reason (17% quality and 8% freshness, combined), 14% selected support for local farmers, and 17% selected support for the local economy.
Figure 14. Motivations of respondents to buy local foods.
Regarding current purchasing habits and quantities among institutional buyers, institutional buyers prepare a large number of meals (Table 3), and purchase large quantities of product (Table 4). Ninety-three 93% of responding institutional buyers currently purchase frozen fruits or vegetables, and most are interested in purchasing specific locally grown and processed frozen fruit or vegetable products if they were available.
18 | P a g e
Table 3. Number of meals served daily by local institutions
Breakfasts 11,520 Lunches 14,170 Dinners 4,811
Table 4. Approximate pounds of frozen vegetable and fruit product purchased monthly by local institutions
Product Amount (lbs)
Broccoli 11,471 Green beans 11,746 Carrots 11,571 Peas 11,308 Vegetable medley 6,746 Strawberries 833 Raspberries 833 Blueberries 521
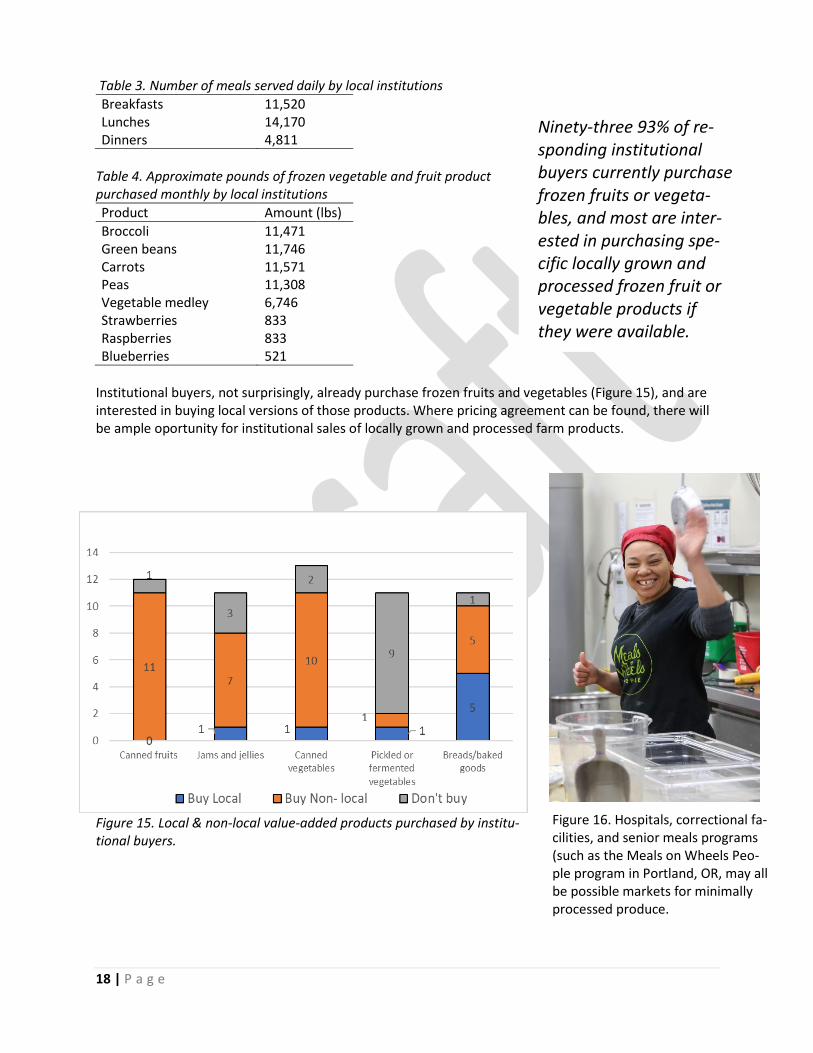
Institutional buyers, not surprisingly, already purchase frozen fruits and vegetables (Figure 15), and are interested in buying local versions of those products. Where pricing agreement can be found, there will be ample oportunity for institutional sales of locally grown and processed farm products.
Figure 15. Local & non-local value-added products purchased by institu-tional buyers.
Ninety-three 93% of re-sponding institutional buyers currently purchase frozen fruits or vegeta-bles, and most are inter-ested in purchasing spe-cific locally grown and processed frozen fruit or vegetable products if they were available.
Figure 16. Hospitals, correctional fa-cilities, and senior meals programs (such as the Meals on Wheels Peo-ple program in Portland, OR, may all be possible markets for minimally processed produce.
19 | P a g e
While substantial opportunity for sale of local product to institutions exists, several obstacles to these transactions exist as well (Table 5). Table 5. Obstacles preventing institutions from buying local foods
Obstacle Response rate (%)
I have not been able to focus on this 19% Food budget constraints 14% Other 11% Products are not available in the form I need them 8% Labor/food prep budget constraints 8% Food safety assurances/concerns 5% I lack the resources to receive deliveries from multiple farms 5% I want to purchase local foods directly from a farm, but don't know how
5%
I want to purchase local foods directly from a farm, but local farmer does not have enough product
5%
My distributor does not carry it 5% Storage 5% Equipment constraints 3% I was to purchase local foods, but local farmer does not deliver to my institution
3%
Pressure from higher up 3% My distributor does not identify or highlight local products 0%
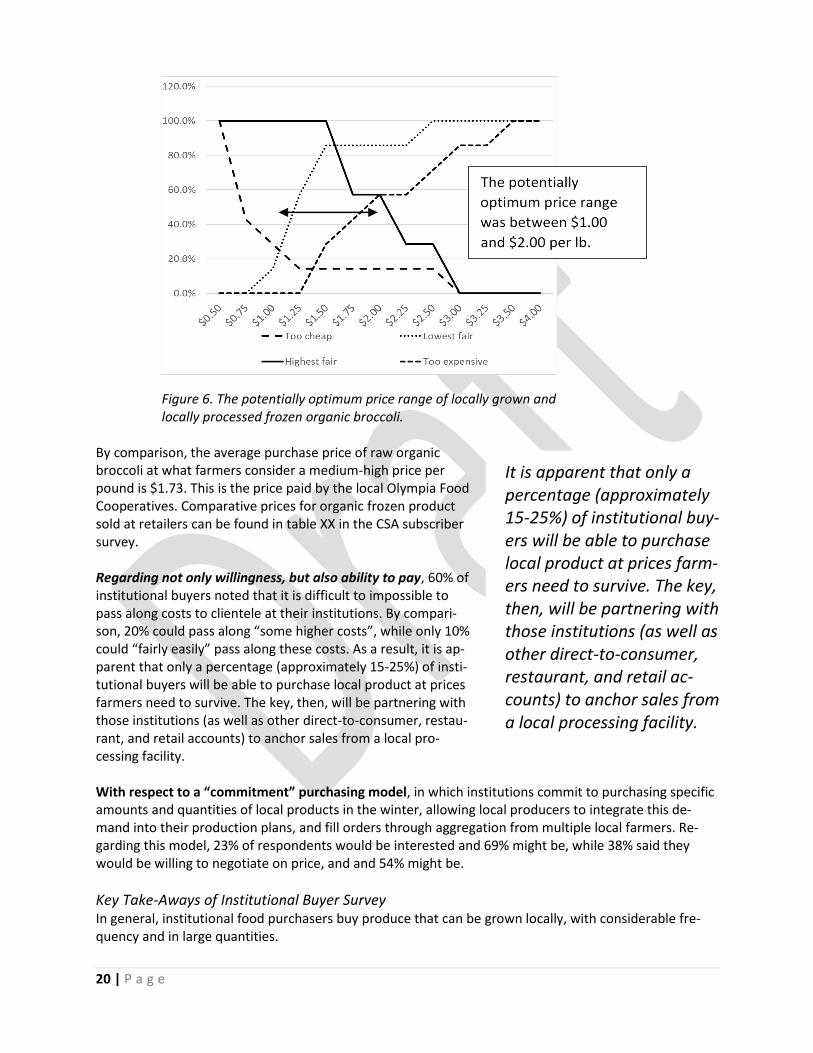
Regarding willingness to pay, institutional buyers re-ported the average price per pound they currently pay for several frozen vegetable and fruit products, as well as price bracketing data (van Westendorp question set). The average price per pound of peas was $0.86, and broccoli was $1.45. The vegetable medley, more valua-ble due to being an admixture of frozen vegetables, was priced at $1.52 per pound. The average price per pound for frozen fruit was $1.73, $1.75, and $2.12 for strawber-ries, raspberries and blueberries, respectively. Results of the van Westendorp question set for organic broccoli indicate that a “fair market” price range ac-counting for the willingness to pay of all respondents was between $1.00 and $2.00 per pound. Approximately 57% of respondents believed that $2.00 is “too expen-sive” (medium dashed line, increasing to right). Follow-ing that same line, only 25% of respondents are willing to pay as much as $2.50 for this product.
Figure 17. A Hobart food processor is a multi-functional piece of equipment that is affordable and versatile.
20 | P a g e
Figure 6. The potentially optimum price range of locally grown and locally processed frozen organic broccoli.
By comparison, the average purchase price of raw organic broccoli at what farmers consider a medium-high price per pound is $1.73. This is the price paid by the local Olympia Food Cooperatives. Comparative prices for organic frozen product sold at retailers can be found in table XX in the CSA subscriber survey. Regarding not only willingness, but also ability to pay, 60% of institutional buyers noted that it is difficult to impossible to pass along costs to clientele at their institutions. By compari-son, 20% could pass along “some higher costs”, while only 10% could “fairly easily” pass along these costs. As a result, it is ap-parent that only a percentage (approximately 15-25%) of insti-tutional buyers will be able to purchase local product at prices farmers need to survive. The key, then, will be partnering with those institutions (as well as other direct-to-consumer, restau-rant, and retail accounts) to anchor sales from a local pro-cessing facility. With respect to a “commitment” purchasing model, in which institutions commit to purchasing specific amounts and quantities of local products in the winter, allowing local producers to integrate this de-mand into their production plans, and fill orders through aggregation from multiple local farmers. Re-garding this model, 23% of respondents would be interested and 69% might be, while 38% said they would be willing to negotiate on price, and and 54% might be.
Key Take-Aways of Institutional Buyer Survey In general, institutional food purchasers buy produce that can be grown locally, with considerable fre-quency and in large quantities.
It is apparent that only a percentage (approximately 15-25%) of institutional buy-ers will be able to purchase local product at prices farm-ers need to survive. The key, then, will be partnering with those institutions (as well as other direct-to-consumer, restaurant, and retail ac-counts) to anchor sales from a local processing facility.
21 | P a g e
• Institutional buyers are motivated by an eclectic mix of price, quality, and desire to support the local farming economy. Some educational effort may be required to sort out factors of proximity and value, although reduced transportation costs of local food may confer some cost advantage.
• Among the 13 institutions surveyed, over 30,000 meals are served daily, with vegetable purchases among several vegetables exceeding 10,000 lbs per month.
• Extrapolated across 45 institutions solicited for this survey, as-suming similar responses which may or not accurately reflect purchasing patterns, over 105,000 meals are served daily in the region, utilizing over 34,000 lbs per month of such crops as broc-coli, green beans, carrots, and peas.
• The range of willingness to pay is indicative of most institutions’ limited budgets and inability to pass costs.
• However, institutions vary in their ability and willingness to pay, and that only some institutions may be able to offer adequate purchase prices, and this may include only 20-25% of local insti-tutions.
Lastly, a combined 92% of institutional buyers would or might be inter-ested in both purchasing produce using a commitment model, and negotiating to find a fair price for the farmer and the buyer.
A combined 92% of institutional buyers would or might be interested in both purchasing pro-duce using a com-mitment model, and negotiating to find a fair price for the farmer and buyer.
22 | P a g e
Section III. Enterprise Budget Tool for Minimally Processed Vegetables Budgeting Section Overview Enterprise budget and financial analysis presented in this section aims to take a hard look at the financial viability of producing minimally processed vegetables from local farms, and for sale to local institutions. It was and remains our understanding that certain minimum price limits are tolerable to farmers, while at the same time institutional food purchasers are restricted to a range of highest prices they can pay. The fundamental question considered by the enterprise budget and financial analysis was whether the varied costs to minimally-process vegetables could fit between these two limits.
Methods This section describes the budget tool and scenarios used to evaluate economic costs and profitability of a processing facility for minimally processed vegetables from local farms for sale to local institutions. The enterprise budget tool consists of worksheets that capture data and assumptions for detailing major costs of the enterprise on an annual basis.
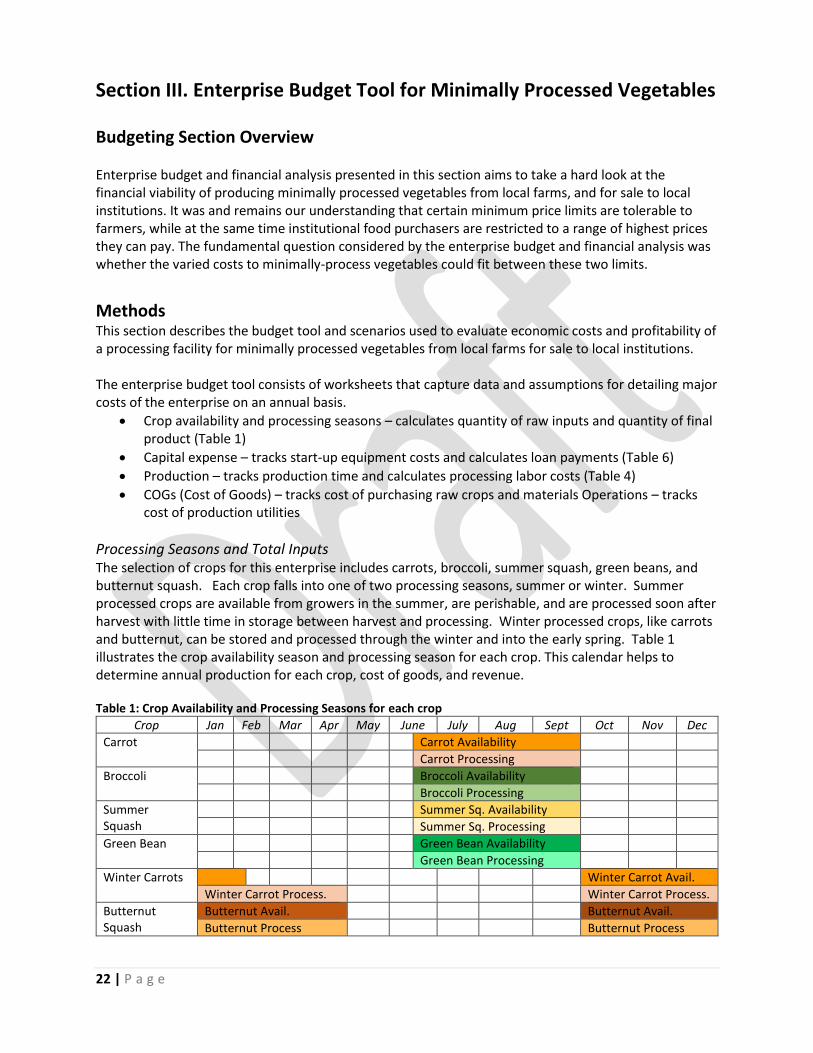
• Crop availability and processing seasons – calculates quantity of raw inputs and quantity of final product (Table 1)
• Capital expense – tracks start-up equipment costs and calculates loan payments (Table 6)
• Production – tracks production time and calculates processing labor costs (Table 4)
• COGs (Cost of Goods) – tracks cost of purchasing raw crops and materials Operations – tracks cost of production utilities
Processing Seasons and Total Inputs The selection of crops for this enterprise includes carrots, broccoli, summer squash, green beans, and butternut squash. Each crop falls into one of two processing seasons, summer or winter. Summer processed crops are available from growers in the summer, are perishable, and are processed soon after harvest with little time in storage between harvest and processing. Winter processed crops, like carrots and butternut, can be stored and processed through the winter and into the early spring. Table 1 illustrates the crop availability season and processing season for each crop. This calendar helps to determine annual production for each crop, cost of goods, and revenue. Table 1: Crop Availability and Processing Seasons for each crop
Crop Jan Feb Mar Apr May June July Aug Sept Oct Nov Dec
Carrot Carrot Availability
Carrot Processing
Broccoli Broccoli Availability
Broccoli Processing
Summer Squash
Summer Sq. Availability
Summer Sq. Processing
Green Bean Green Bean Availability
Green Bean Processing
Winter Carrots Winter Carrot Avail.
Winter Carrot Process. Winter Carrot Process.
Butternut Squash
Butternut Avail. Butternut Avail.
Butternut Process Butternut Process
23 | P a g e
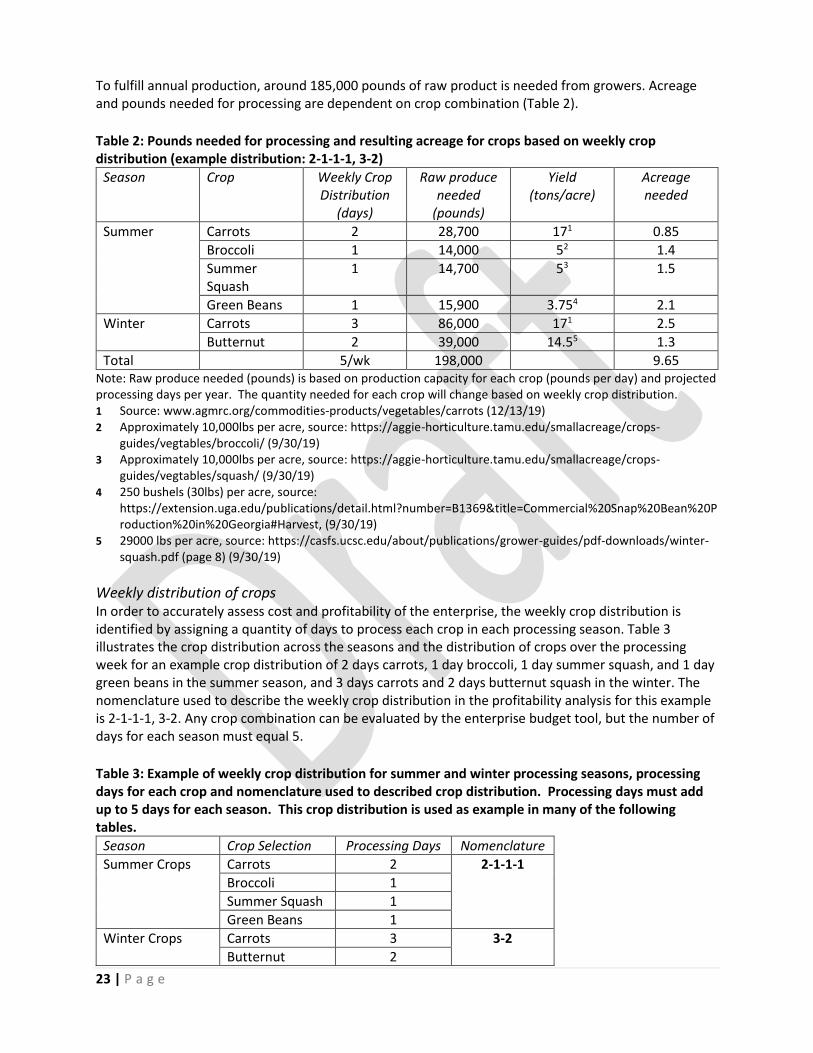
To fulfill annual production, around 185,000 pounds of raw product is needed from growers. Acreage and pounds needed for processing are dependent on crop combination (Table 2).
Table 2: Pounds needed for processing and resulting acreage for crops based on weekly crop distribution (example distribution: 2-1-1-1, 3-2)
Season Crop Weekly Crop Distribution
(days)
Raw produce needed
(pounds)
Yield (tons/acre)
Acreage needed
Summer Carrots 2 28,700 171 0.85
Broccoli 1 14,000 52 1.4
Summer Squash
1 14,700 53 1.5
Green Beans 1 15,900 3.754 2.1
Winter Carrots 3 86,000 171 2.5
Butternut 2 39,000 14.55 1.3
Total 5/wk 198,000 9.65 Note: Raw produce needed (pounds) is based on production capacity for each crop (pounds per day) and projected processing days per year. The quantity needed for each crop will change based on weekly crop distribution. 1 Source: www.agmrc.org/commodities-products/vegetables/carrots (12/13/19) 2 Approximately 10,000lbs per acre, source: https://aggie-horticulture.tamu.edu/smallacreage/crops-
guides/vegtables/broccoli/ (9/30/19) 3 Approximately 10,000lbs per acre, source: https://aggie-horticulture.tamu.edu/smallacreage/crops-
guides/vegtables/squash/ (9/30/19) 4 250 bushels (30lbs) per acre, source:
https://extension.uga.edu/publications/detail.html?number=B1369&title=Commercial%20Snap%20Bean%20Production%20in%20Georgia#Harvest, (9/30/19)
5 29000 lbs per acre, source: https://casfs.ucsc.edu/about/publications/grower-guides/pdf-downloads/winter-squash.pdf (page 8) (9/30/19)
Weekly distribution of crops In order to accurately assess cost and profitability of the enterprise, the weekly crop distribution is identified by assigning a quantity of days to process each crop in each processing season. Table 3 illustrates the crop distribution across the seasons and the distribution of crops over the processing week for an example crop distribution of 2 days carrots, 1 day broccoli, 1 day summer squash, and 1 day green beans in the summer season, and 3 days carrots and 2 days butternut squash in the winter. The nomenclature used to describe the weekly crop distribution in the profitability analysis for this example is 2-1-1-1, 3-2. Any crop combination can be evaluated by the enterprise budget tool, but the number of days for each season must equal 5.
Table 3: Example of weekly crop distribution for summer and winter processing seasons, processing days for each crop and nomenclature used to described crop distribution. Processing days must add up to 5 days for each season. This crop distribution is used as example in many of the following tables.
Season Crop Selection Processing Days Nomenclature
Summer Crops Carrots 2 2-1-1-1
Broccoli 1
Summer Squash 1
Green Beans 1
Winter Crops Carrots 3 3-2
Butternut 2
24 | P a g e
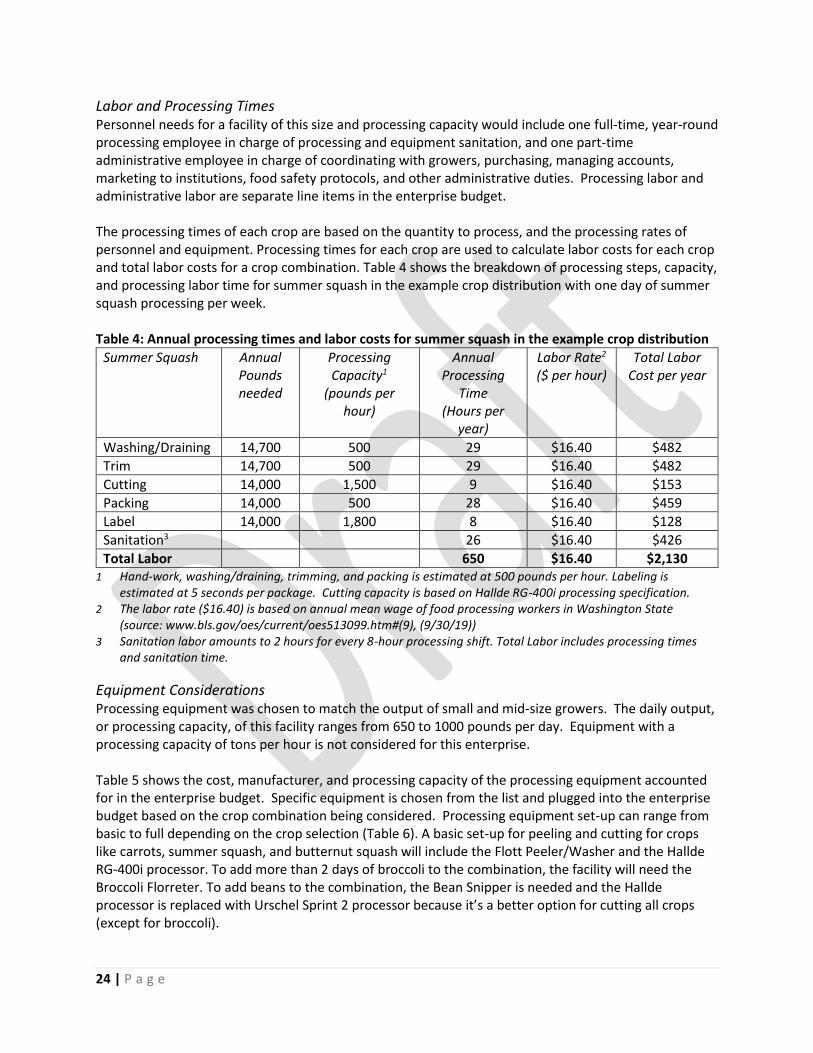
Labor and Processing Times Personnel needs for a facility of this size and processing capacity would include one full-time, year-round processing employee in charge of processing and equipment sanitation, and one part-time administrative employee in charge of coordinating with growers, purchasing, managing accounts, marketing to institutions, food safety protocols, and other administrative duties. Processing labor and administrative labor are separate line items in the enterprise budget. The processing times of each crop are based on the quantity to process, and the processing rates of personnel and equipment. Processing times for each crop are used to calculate labor costs for each crop and total labor costs for a crop combination. Table 4 shows the breakdown of processing steps, capacity, and processing labor time for summer squash in the example crop distribution with one day of summer squash processing per week. Table 4: Annual processing times and labor costs for summer squash in the example crop distribution
Summer Squash Annual Pounds needed
Processing Capacity1
(pounds per hour)
Annual Processing
Time (Hours per
year)
Labor Rate2 ($ per hour)
Total Labor Cost per year
Washing/Draining 14,700 500 29 $16.40 $482
Trim 14,700 500 29 $16.40 $482
Cutting 14,000 1,500 9 $16.40 $153
Packing 14,000 500 28 $16.40 $459
Label 14,000 1,800 8 $16.40 $128
Sanitation3 26 $16.40 $426
Total Labor 650 $16.40 $2,130 1 Hand-work, washing/draining, trimming, and packing is estimated at 500 pounds per hour. Labeling is
estimated at 5 seconds per package. Cutting capacity is based on Hallde RG-400i processing specification. 2 The labor rate ($16.40) is based on annual mean wage of food processing workers in Washington State
(source: www.bls.gov/oes/current/oes513099.htm#(9), (9/30/19)) 3 Sanitation labor amounts to 2 hours for every 8-hour processing shift. Total Labor includes processing times
and sanitation time.
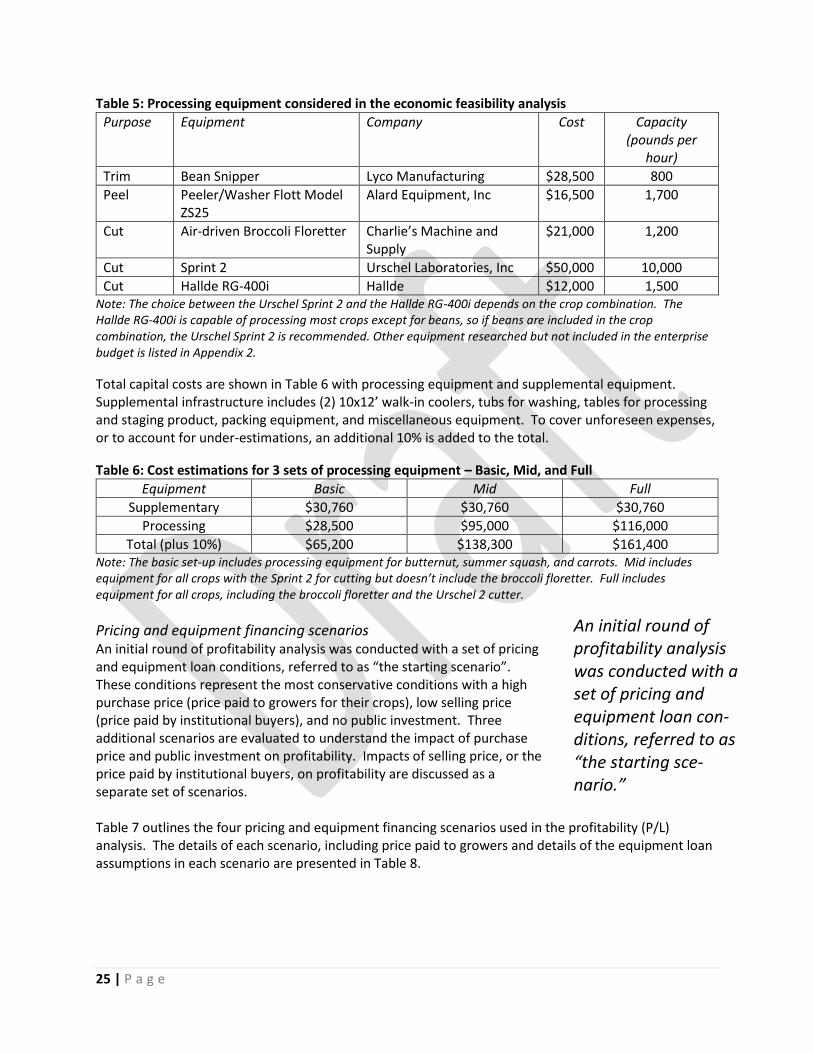
Equipment Considerations Processing equipment was chosen to match the output of small and mid-size growers. The daily output, or processing capacity, of this facility ranges from 650 to 1000 pounds per day. Equipment with a processing capacity of tons per hour is not considered for this enterprise. Table 5 shows the cost, manufacturer, and processing capacity of the processing equipment accounted for in the enterprise budget. Specific equipment is chosen from the list and plugged into the enterprise budget based on the crop combination being considered. Processing equipment set-up can range from basic to full depending on the crop selection (Table 6). A basic set-up for peeling and cutting for crops like carrots, summer squash, and butternut squash will include the Flott Peeler/Washer and the Hallde RG-400i processor. To add more than 2 days of broccoli to the combination, the facility will need the Broccoli Florreter. To add beans to the combination, the Bean Snipper is needed and the Hallde processor is replaced with Urschel Sprint 2 processor because it’s a better option for cutting all crops (except for broccoli).
25 | P a g e
Table 5: Processing equipment considered in the economic feasibility analysis
Purpose Equipment Company Cost Capacity (pounds per
hour)
Trim Bean Snipper Lyco Manufacturing $28,500 800
Peel Peeler/Washer Flott Model ZS25
Alard Equipment, Inc $16,500 1,700
Cut Air-driven Broccoli Floretter Charlie’s Machine and Supply
$21,000 1,200
Cut Sprint 2 Urschel Laboratories, Inc $50,000 10,000
Cut Hallde RG-400i Hallde $12,000 1,500 Note: The choice between the Urschel Sprint 2 and the Hallde RG-400i depends on the crop combination. The Hallde RG-400i is capable of processing most crops except for beans, so if beans are included in the crop combination, the Urschel Sprint 2 is recommended. Other equipment researched but not included in the enterprise budget is listed in Appendix 2.
Total capital costs are shown in Table 6 with processing equipment and supplemental equipment. Supplemental infrastructure includes (2) 10x12’ walk-in coolers, tubs for washing, tables for processing and staging product, packing equipment, and miscellaneous equipment. To cover unforeseen expenses, or to account for under-estimations, an additional 10% is added to the total.
Table 6: Cost estimations for 3 sets of processing equipment – Basic, Mid, and Full
Equipment Basic Mid Full
Supplementary $30,760 $30,760 $30,760
Processing $28,500 $95,000 $116,000
Total (plus 10%) $65,200 $138,300 $161,400 Note: The basic set-up includes processing equipment for butternut, summer squash, and carrots. Mid includes equipment for all crops with the Sprint 2 for cutting but doesn’t include the broccoli floretter. Full includes equipment for all crops, including the broccoli floretter and the Urschel 2 cutter.
Pricing and equipment financing scenarios An initial round of profitability analysis was conducted with a set of pricing and equipment loan conditions, referred to as “the starting scenario”. These conditions represent the most conservative conditions with a high purchase price (price paid to growers for their crops), low selling price (price paid by institutional buyers), and no public investment. Three additional scenarios are evaluated to understand the impact of purchase price and public investment on profitability. Impacts of selling price, or the price paid by institutional buyers, on profitability are discussed as a separate set of scenarios. Table 7 outlines the four pricing and equipment financing scenarios used in the profitability (P/L) analysis. The details of each scenario, including price paid to growers and details of the equipment loan assumptions in each scenario are presented in Table 8.
An initial round of profitability analysis was conducted with a set of pricing and equipment loan con-ditions, referred to as “the starting sce-nario.”
26 | P a g e
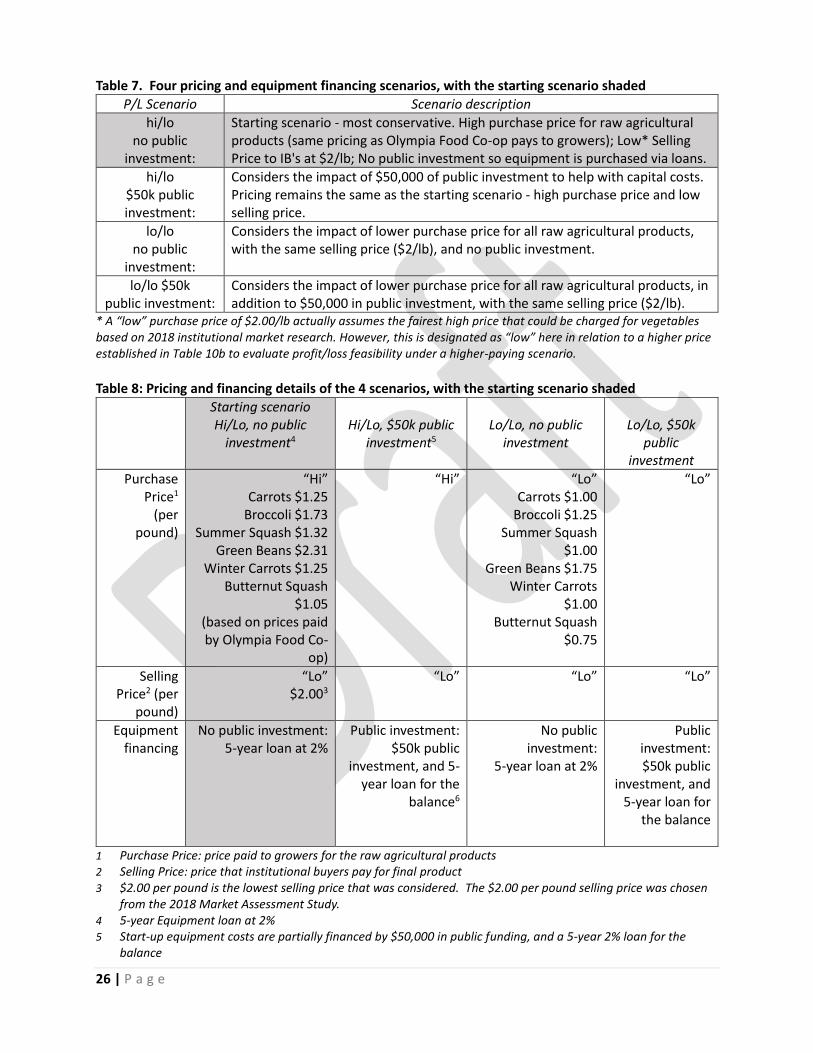
Table 7. Four pricing and equipment financing scenarios, with the starting scenario shaded
P/L Scenario Scenario description
hi/lo no public
investment:
Starting scenario - most conservative. High purchase price for raw agricultural products (same pricing as Olympia Food Co-op pays to growers); Low* Selling Price to IB's at $2/lb; No public investment so equipment is purchased via loans.
hi/lo $50k public investment:
Considers the impact of $50,000 of public investment to help with capital costs. Pricing remains the same as the starting scenario - high purchase price and low selling price.
lo/lo no public
investment:
Considers the impact of lower purchase price for all raw agricultural products, with the same selling price ($2/lb), and no public investment.
lo/lo $50k public investment:
Considers the impact of lower purchase price for all raw agricultural products, in addition to $50,000 in public investment, with the same selling price ($2/lb).
* A “low” purchase price of $2.00/lb actually assumes the fairest high price that could be charged for vegetables based on 2018 institutional market research. However, this is designated as “low” here in relation to a higher price established in Table 10b to evaluate profit/loss feasibility under a higher-paying scenario.
Table 8: Pricing and financing details of the 4 scenarios, with the starting scenario shaded
Starting scenario Hi/Lo, no public
investment4
Hi/Lo, $50k public
investment5
Lo/Lo, no public
investment
Lo/Lo, $50k
public investment
Purchase Price1 (per
pound)
“Hi” Carrots $1.25
Broccoli $1.73 Summer Squash $1.32
Green Beans $2.31 Winter Carrots $1.25
Butternut Squash $1.05
(based on prices paid by Olympia Food Co-
op)
“Hi” “Lo” Carrots $1.00
Broccoli $1.25 Summer Squash
$1.00 Green Beans $1.75
Winter Carrots $1.00
Butternut Squash $0.75
“Lo”
Selling Price2 (per
pound)
“Lo” $2.003
“Lo” “Lo” “Lo”
Equipment financing
No public investment: 5-year loan at 2%
Public investment: $50k public
investment, and 5-year loan for the
balance6
No public investment:
5-year loan at 2%
Public investment: $50k public
investment, and 5-year loan for
the balance
1 Purchase Price: price paid to growers for the raw agricultural products 2 Selling Price: price that institutional buyers pay for final product 3 $2.00 per pound is the lowest selling price that was considered. The $2.00 per pound selling price was chosen
from the 2018 Market Assessment Study. 4 5-year Equipment loan at 2% 5 Start-up equipment costs are partially financed by $50,000 in public funding, and a 5-year 2% loan for the
balance
27 | P a g e
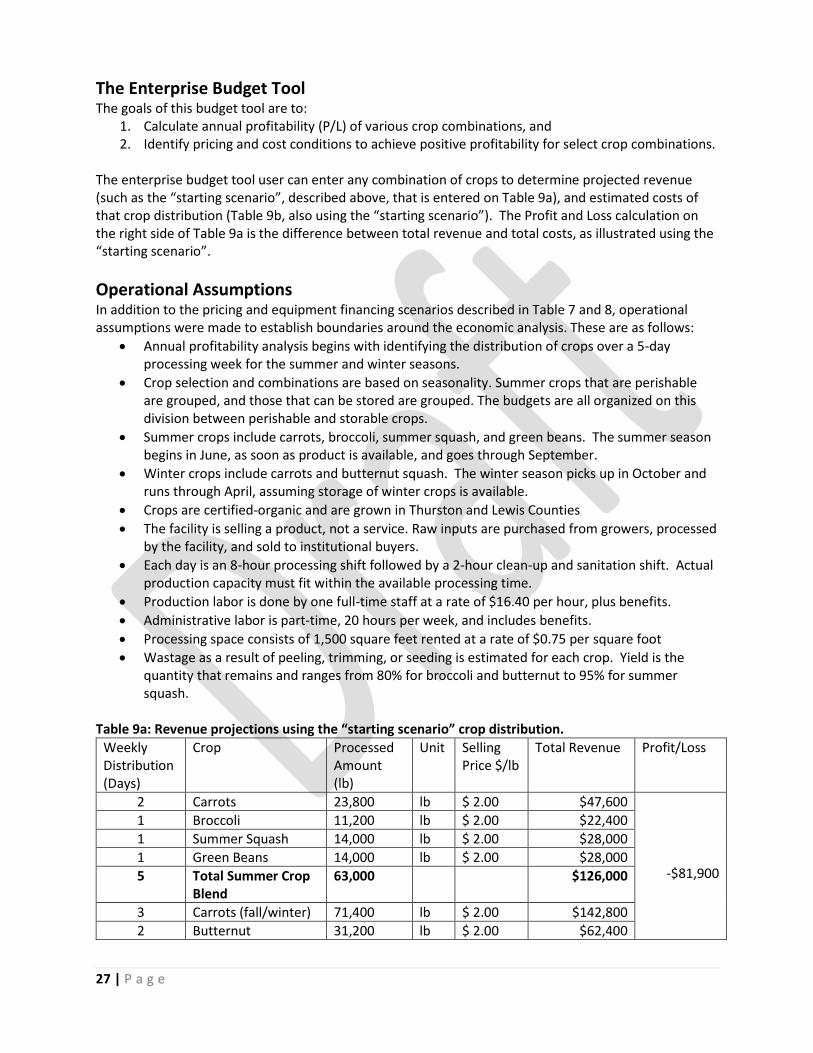
The Enterprise Budget Tool The goals of this budget tool are to:
1. Calculate annual profitability (P/L) of various crop combinations, and 2. Identify pricing and cost conditions to achieve positive profitability for select crop combinations.
The enterprise budget tool user can enter any combination of crops to determine projected revenue (such as the “starting scenario”, described above, that is entered on Table 9a), and estimated costs of that crop distribution (Table 9b, also using the “starting scenario”). The Profit and Loss calculation on the right side of Table 9a is the difference between total revenue and total costs, as illustrated using the “starting scenario”.
Operational Assumptions In addition to the pricing and equipment financing scenarios described in Table 7 and 8, operational assumptions were made to establish boundaries around the economic analysis. These are as follows:
• Annual profitability analysis begins with identifying the distribution of crops over a 5-day processing week for the summer and winter seasons.
• Crop selection and combinations are based on seasonality. Summer crops that are perishable are grouped, and those that can be stored are grouped. The budgets are all organized on this division between perishable and storable crops.
• Summer crops include carrots, broccoli, summer squash, and green beans. The summer season begins in June, as soon as product is available, and goes through September.
• Winter crops include carrots and butternut squash. The winter season picks up in October and runs through April, assuming storage of winter crops is available.
• Crops are certified-organic and are grown in Thurston and Lewis Counties
• The facility is selling a product, not a service. Raw inputs are purchased from growers, processed by the facility, and sold to institutional buyers.
• Each day is an 8-hour processing shift followed by a 2-hour clean-up and sanitation shift. Actual production capacity must fit within the available processing time.
• Production labor is done by one full-time staff at a rate of $16.40 per hour, plus benefits.
• Administrative labor is part-time, 20 hours per week, and includes benefits.
• Processing space consists of 1,500 square feet rented at a rate of $0.75 per square foot
• Wastage as a result of peeling, trimming, or seeding is estimated for each crop. Yield is the quantity that remains and ranges from 80% for broccoli and butternut to 95% for summer squash.
Table 9a: Revenue projections using the “starting scenario” crop distribution.
Weekly Distribution (Days)
Crop Processed Amount (lb)
Unit Selling Price $/lb
Total Revenue Profit/Loss
2 Carrots 23,800 lb $ 2.00 $47,600
-$81,900
1 Broccoli 11,200 lb $ 2.00 $22,400
1 Summer Squash 14,000 lb $ 2.00 $28,000
1 Green Beans 14,000 lb $ 2.00 $28,000
5 Total Summer Crop Blend
63,000 $126,000
3 Carrots (fall/winter) 71,400 lb $ 2.00 $142,800
2 Butternut 31,200 lb $ 2.00 $62,400
28 | P a g e
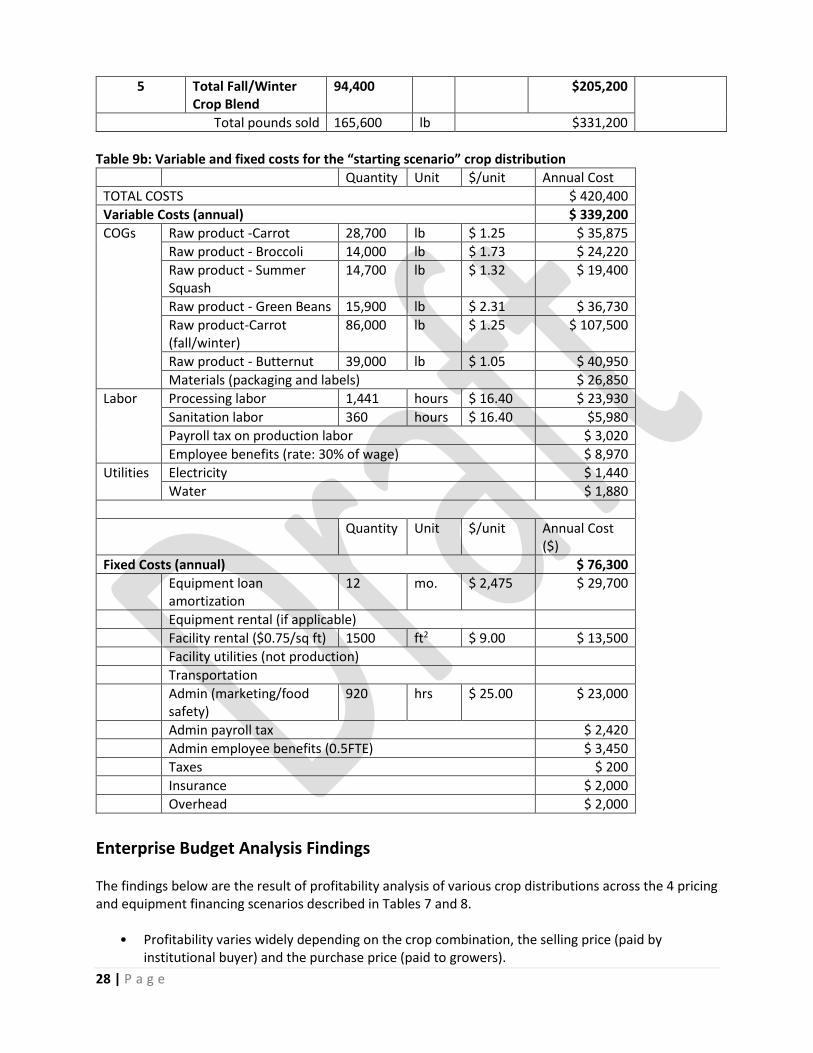
5 Total Fall/Winter Crop Blend
94,400 $205,200
Total pounds sold 165,600 lb $331,200
Table 9b: Variable and fixed costs for the “starting scenario” crop distribution
Quantity Unit $/unit Annual Cost
TOTAL COSTS $ 420,400
Variable Costs (annual) $ 339,200
COGs Raw product -Carrot 28,700 lb $ 1.25 $ 35,875
Raw product - Broccoli 14,000 lb $ 1.73 $ 24,220
Raw product - Summer Squash
14,700 lb $ 1.32 $ 19,400
Raw product - Green Beans 15,900 lb $ 2.31 $ 36,730
Raw product-Carrot (fall/winter)
86,000 lb $ 1.25 $ 107,500
Raw product - Butternut 39,000 lb $ 1.05 $ 40,950
Materials (packaging and labels) $ 26,850
Labor Processing labor 1,441 hours $ 16.40 $ 23,930
Sanitation labor 360 hours $ 16.40 $5,980
Payroll tax on production labor $ 3,020
Employee benefits (rate: 30% of wage) $ 8,970
Utilities Electricity $ 1,440
Water $ 1,880
Quantity Unit $/unit Annual Cost ($)
Fixed Costs (annual) $ 76,300
Equipment loan amortization
12 mo. $ 2,475 $ 29,700
Equipment rental (if applicable)
Facility rental ($0.75/sq ft) 1500 ft2 $ 9.00 $ 13,500
Facility utilities (not production)
Transportation
Admin (marketing/food safety)
920 hrs $ 25.00 $ 23,000
Admin payroll tax $ 2,420
Admin employee benefits (0.5FTE) $ 3,450
Taxes $ 200
Insurance $ 2,000
Overhead $ 2,000
Enterprise Budget Analysis Findings The findings below are the result of profitability analysis of various crop distributions across the 4 pricing and equipment financing scenarios described in Tables 7 and 8.
• Profitability varies widely depending on the crop combination, the selling price (paid by institutional buyer) and the purchase price (paid to growers).
29 | P a g e
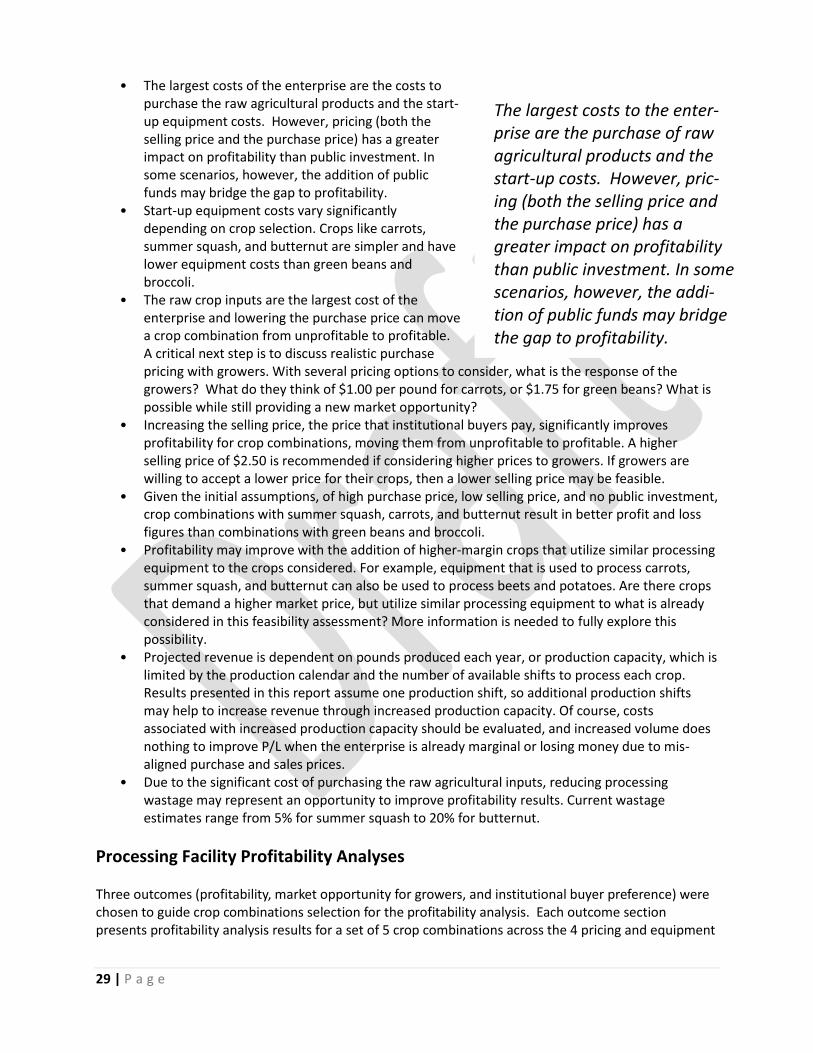
• The largest costs of the enterprise are the costs to purchase the raw agricultural products and the start-up equipment costs. However, pricing (both the selling price and the purchase price) has a greater impact on profitability than public investment. In some scenarios, however, the addition of public funds may bridge the gap to profitability.
• Start-up equipment costs vary significantly depending on crop selection. Crops like carrots, summer squash, and butternut are simpler and have lower equipment costs than green beans and broccoli.
• The raw crop inputs are the largest cost of the enterprise and lowering the purchase price can move a crop combination from unprofitable to profitable. A critical next step is to discuss realistic purchase pricing with growers. With several pricing options to consider, what is the response of the growers? What do they think of $1.00 per pound for carrots, or $1.75 for green beans? What is possible while still providing a new market opportunity?
• Increasing the selling price, the price that institutional buyers pay, significantly improves profitability for crop combinations, moving them from unprofitable to profitable. A higher selling price of $2.50 is recommended if considering higher prices to growers. If growers are willing to accept a lower price for their crops, then a lower selling price may be feasible.
• Given the initial assumptions, of high purchase price, low selling price, and no public investment, crop combinations with summer squash, carrots, and butternut result in better profit and loss figures than combinations with green beans and broccoli.
• Profitability may improve with the addition of higher-margin crops that utilize similar processing equipment to the crops considered. For example, equipment that is used to process carrots, summer squash, and butternut can also be used to process beets and potatoes. Are there crops that demand a higher market price, but utilize similar processing equipment to what is already considered in this feasibility assessment? More information is needed to fully explore this possibility.
• Projected revenue is dependent on pounds produced each year, or production capacity, which is limited by the production calendar and the number of available shifts to process each crop. Results presented in this report assume one production shift, so additional production shifts may help to increase revenue through increased production capacity. Of course, costs associated with increased production capacity should be evaluated, and increased volume does nothing to improve P/L when the enterprise is already marginal or losing money due to mis-aligned purchase and sales prices.
• Due to the significant cost of purchasing the raw agricultural inputs, reducing processing wastage may represent an opportunity to improve profitability results. Current wastage estimates range from 5% for summer squash to 20% for butternut.
Processing Facility Profitability Analyses Three outcomes (profitability, market opportunity for growers, and institutional buyer preference) were chosen to guide crop combinations selection for the profitability analysis. Each outcome section presents profitability analysis results for a set of 5 crop combinations across the 4 pricing and equipment
The largest costs to the enter-prise are the purchase of raw agricultural products and the start-up costs. However, pric-ing (both the selling price and the purchase price) has a greater impact on profitability than public investment. In some scenarios, however, the addi-tion of public funds may bridge the gap to profitability.
30 | P a g e
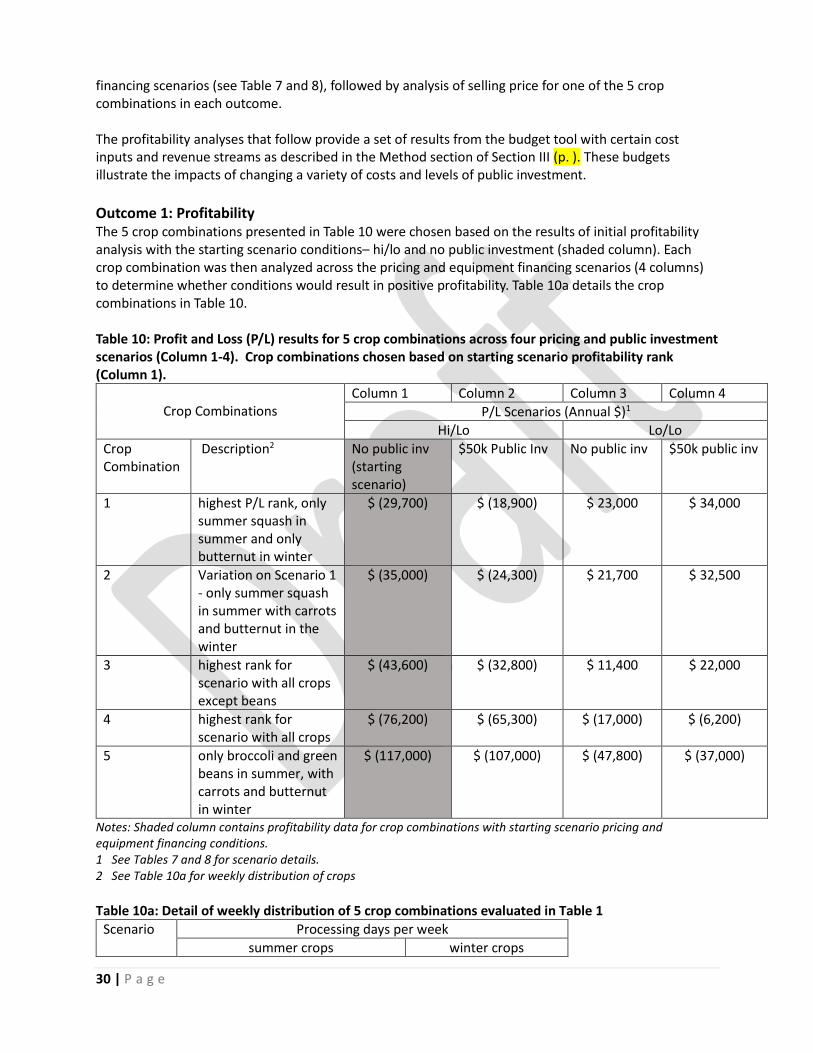
financing scenarios (see Table 7 and 8), followed by analysis of selling price for one of the 5 crop combinations in each outcome. The profitability analyses that follow provide a set of results from the budget tool with certain cost inputs and revenue streams as described in the Method section of Section III (p. ). These budgets illustrate the impacts of changing a variety of costs and levels of public investment.
Outcome 1: Profitability The 5 crop combinations presented in Table 10 were chosen based on the results of initial profitability analysis with the starting scenario conditions– hi/lo and no public investment (shaded column). Each crop combination was then analyzed across the pricing and equipment financing scenarios (4 columns) to determine whether conditions would result in positive profitability. Table 10a details the crop combinations in Table 10. Table 10: Profit and Loss (P/L) results for 5 crop combinations across four pricing and public investment scenarios (Column 1-4). Crop combinations chosen based on starting scenario profitability rank (Column 1).
Crop Combinations
Column 1 Column 2 Column 3 Column 4
P/L Scenarios (Annual $)1
Hi/Lo Lo/Lo
Crop Combination
Description2 No public inv (starting scenario)
$50k Public Inv No public inv $50k public inv
1 highest P/L rank, only summer squash in summer and only butternut in winter
$ (29,700) $ (18,900) $ 23,000 $ 34,000
2 Variation on Scenario 1 - only summer squash in summer with carrots and butternut in the winter
$ (35,000) $ (24,300) $ 21,700 $ 32,500
3 highest rank for scenario with all crops except beans
$ (43,600) $ (32,800) $ 11,400 $ 22,000
4 highest rank for scenario with all crops
$ (76,200) $ (65,300) $ (17,000) $ (6,200)
5 only broccoli and green beans in summer, with carrots and butternut in winter
$ (117,000) $ (107,000) $ (47,800) $ (37,000)
Notes: Shaded column contains profitability data for crop combinations with starting scenario pricing and equipment financing conditions. 1 See Tables 7 and 8 for scenario details. 2 See Table 10a for weekly distribution of crops
Table 10a: Detail of weekly distribution of 5 crop combinations evaluated in Table 1
Scenario Processing days per week
summer crops winter crops
31 | P a g e
carrot-broccoli-zucchini-green beans
carrots-butternut
1 0-0-5-0 0-5
2 0-0-5-0 3-2
3 1-1-3-0 1-4
4 1-1-2-1 1-4 5 0-3-0-2 2-3
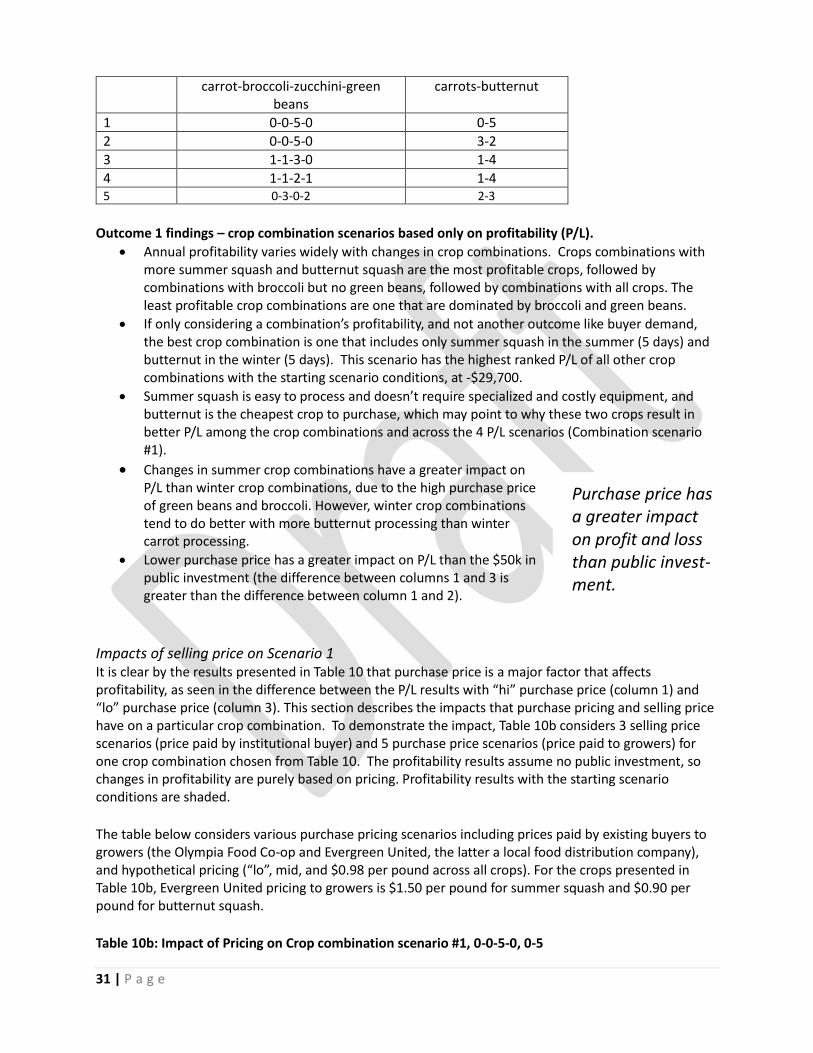
Outcome 1 findings – crop combination scenarios based only on profitability (P/L).
• Annual profitability varies widely with changes in crop combinations. Crops combinations with more summer squash and butternut squash are the most profitable crops, followed by combinations with broccoli but no green beans, followed by combinations with all crops. The least profitable crop combinations are one that are dominated by broccoli and green beans.
• If only considering a combination’s profitability, and not another outcome like buyer demand, the best crop combination is one that includes only summer squash in the summer (5 days) and butternut in the winter (5 days). This scenario has the highest ranked P/L of all other crop combinations with the starting scenario conditions, at -$29,700.
• Summer squash is easy to process and doesn’t require specialized and costly equipment, and butternut is the cheapest crop to purchase, which may point to why these two crops result in better P/L among the crop combinations and across the 4 P/L scenarios (Combination scenario #1).
• Changes in summer crop combinations have a greater impact on P/L than winter crop combinations, due to the high purchase price of green beans and broccoli. However, winter crop combinations tend to do better with more butternut processing than winter carrot processing.
• Lower purchase price has a greater impact on P/L than the $50k in public investment (the difference between columns 1 and 3 is greater than the difference between column 1 and 2).
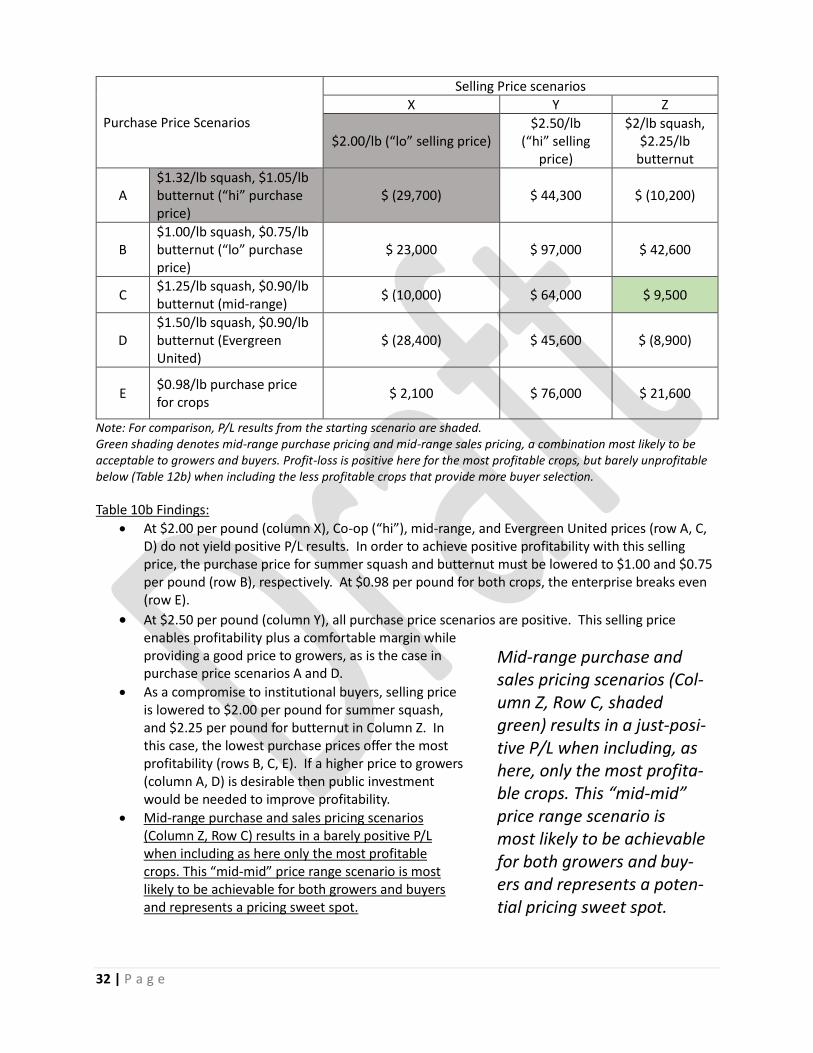
Impacts of selling price on Scenario 1 It is clear by the results presented in Table 10 that purchase price is a major factor that affects profitability, as seen in the difference between the P/L results with “hi” purchase price (column 1) and “lo” purchase price (column 3). This section describes the impacts that purchase pricing and selling price have on a particular crop combination. To demonstrate the impact, Table 10b considers 3 selling price scenarios (price paid by institutional buyer) and 5 purchase price scenarios (price paid to growers) for one crop combination chosen from Table 10. The profitability results assume no public investment, so changes in profitability are purely based on pricing. Profitability results with the starting scenario conditions are shaded.
The table below considers various purchase pricing scenarios including prices paid by existing buyers to growers (the Olympia Food Co-op and Evergreen United, the latter a local food distribution company), and hypothetical pricing (“lo”, mid, and $0.98 per pound across all crops). For the crops presented in Table 10b, Evergreen United pricing to growers is $1.50 per pound for summer squash and $0.90 per pound for butternut squash.
Table 10b: Impact of Pricing on Crop combination scenario #1, 0-0-5-0, 0-5
Purchase price has a greater impact on profit and loss than public invest-ment.
32 | P a g e
Purchase Price Scenarios
Selling Price scenarios
X Y Z
$2.00/lb (“lo” selling price) $2.50/lb
(“hi” selling price)
$2/lb squash, $2.25/lb
butternut
A $1.32/lb squash, $1.05/lb butternut (“hi” purchase price)
$ (29,700) $ 44,300 $ (10,200)
B $1.00/lb squash, $0.75/lb butternut (“lo” purchase price)
$ 23,000 $ 97,000 $ 42,600
C $1.25/lb squash, $0.90/lb butternut (mid-range)
$ (10,000) $ 64,000 $ 9,500
D $1.50/lb squash, $0.90/lb butternut (Evergreen United)
$ (28,400) $ 45,600 $ (8,900)
E $0.98/lb purchase price for crops
$ 2,100 $ 76,000 $ 21,600
Note: For comparison, P/L results from the starting scenario are shaded. Green shading denotes mid-range purchase pricing and mid-range sales pricing, a combination most likely to be acceptable to growers and buyers. Profit-loss is positive here for the most profitable crops, but barely unprofitable below (Table 12b) when including the less profitable crops that provide more buyer selection.
Table 10b Findings:
• At $2.00 per pound (column X), Co-op (“hi”), mid-range, and Evergreen United prices (row A, C, D) do not yield positive P/L results. In order to achieve positive profitability with this selling price, the purchase price for summer squash and butternut must be lowered to $1.00 and $0.75 per pound (row B), respectively. At $0.98 per pound for both crops, the enterprise breaks even (row E).
• At $2.50 per pound (column Y), all purchase price scenarios are positive. This selling price enables profitability plus a comfortable margin while providing a good price to growers, as is the case in purchase price scenarios A and D.
• As a compromise to institutional buyers, selling price is lowered to $2.00 per pound for summer squash, and $2.25 per pound for butternut in Column Z. In this case, the lowest purchase prices offer the most profitability (rows B, C, E). If a higher price to growers (column A, D) is desirable then public investment would be needed to improve profitability.
• Mid-range purchase and sales pricing scenarios (Column Z, Row C) results in a barely positive P/L when including as here only the most profitable crops. This “mid-mid” price range scenario is most likely to be achievable for both growers and buyers and represents a pricing sweet spot.
Mid-range purchase and sales pricing scenarios (Col-umn Z, Row C, shaded green) results in a just-posi-tive P/L when including, as here, only the most profita-ble crops. This “mid-mid” price range scenario is most likely to be achievable for both growers and buy-ers and represents a poten-tial pricing sweet spot.

33 | P a g e
34 | P a g e
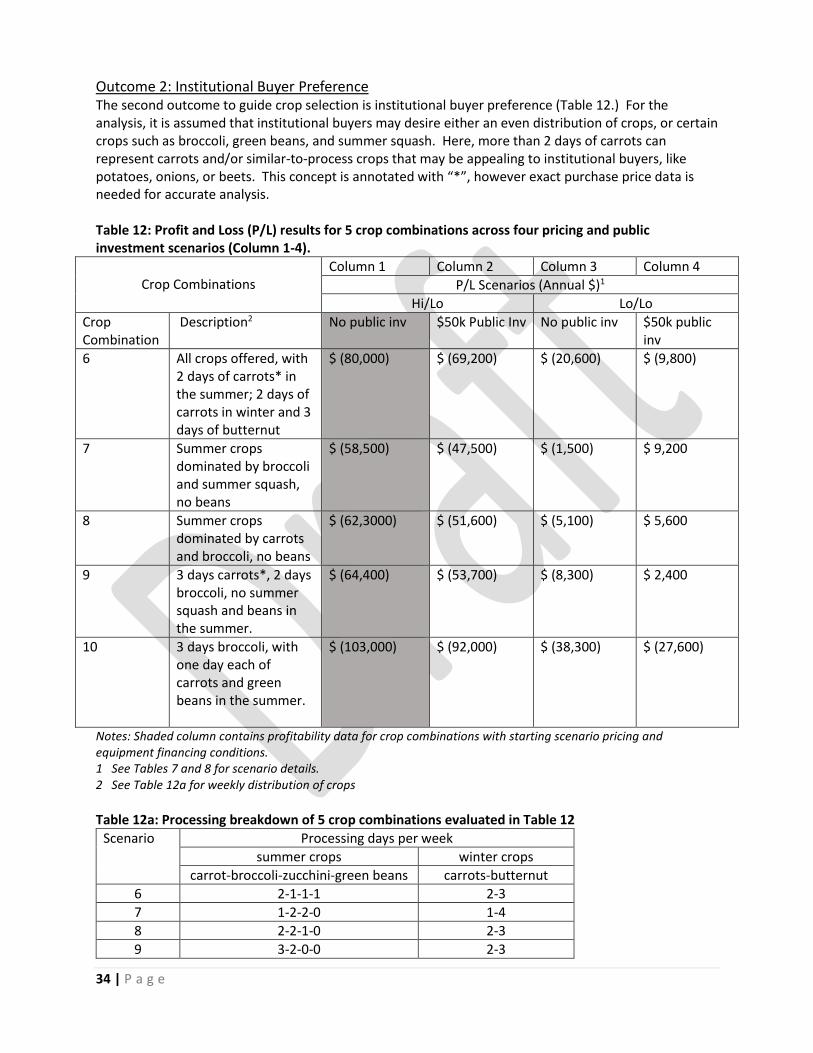
Outcome 2: Institutional Buyer Preference The second outcome to guide crop selection is institutional buyer preference (Table 12.) For the analysis, it is assumed that institutional buyers may desire either an even distribution of crops, or certain crops such as broccoli, green beans, and summer squash. Here, more than 2 days of carrots can represent carrots and/or similar-to-process crops that may be appealing to institutional buyers, like potatoes, onions, or beets. This concept is annotated with “*”, however exact purchase price data is needed for accurate analysis. Table 12: Profit and Loss (P/L) results for 5 crop combinations across four pricing and public investment scenarios (Column 1-4).
Crop Combinations
Column 1 Column 2 Column 3 Column 4
P/L Scenarios (Annual $)1
Hi/Lo Lo/Lo
Crop Combination
Description2 No public inv $50k Public Inv No public inv $50k public inv
6 All crops offered, with 2 days of carrots* in the summer; 2 days of carrots in winter and 3 days of butternut
$ (80,000) $ (69,200) $ (20,600) $ (9,800)
7 Summer crops dominated by broccoli and summer squash, no beans
$ (58,500) $ (47,500) $ (1,500) $ 9,200
8 Summer crops dominated by carrots and broccoli, no beans
$ (62,3000) $ (51,600) $ (5,100) $ 5,600
9 3 days carrots*, 2 days broccoli, no summer squash and beans in the summer.
$ (64,400) $ (53,700) $ (8,300) $ 2,400
10 3 days broccoli, with one day each of carrots and green beans in the summer.
$ (103,000) $ (92,000) $ (38,300) $ (27,600)
Notes: Shaded column contains profitability data for crop combinations with starting scenario pricing and equipment financing conditions. 1 See Tables 7 and 8 for scenario details. 2 See Table 12a for weekly distribution of crops
Table 12a: Processing breakdown of 5 crop combinations evaluated in Table 12
Scenario Processing days per week
summer crops winter crops
carrot-broccoli-zucchini-green beans carrots-butternut
6 2-1-1-1 2-3
7 1-2-2-0 1-4
8 2-2-1-0 2-3
9 3-2-0-0 2-3
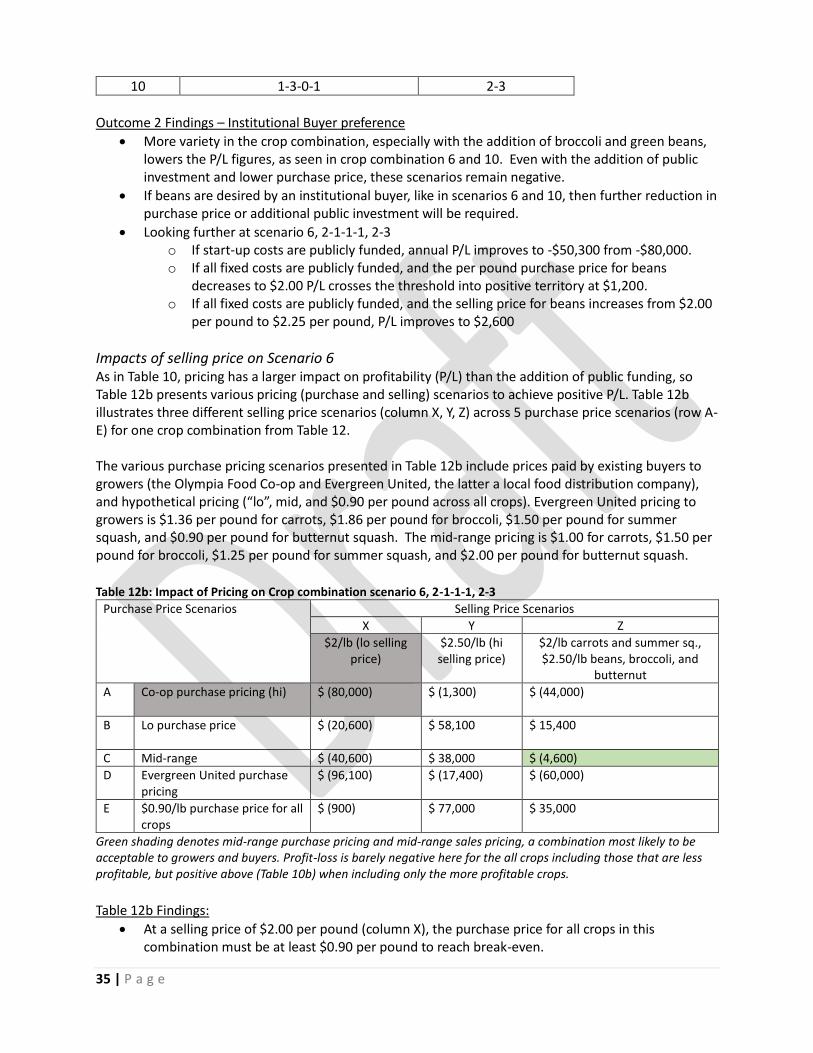
35 | P a g e
10 1-3-0-1 2-3
Outcome 2 Findings – Institutional Buyer preference
• More variety in the crop combination, especially with the addition of broccoli and green beans, lowers the P/L figures, as seen in crop combination 6 and 10. Even with the addition of public investment and lower purchase price, these scenarios remain negative.
• If beans are desired by an institutional buyer, like in scenarios 6 and 10, then further reduction in purchase price or additional public investment will be required.
• Looking further at scenario 6, 2-1-1-1, 2-3 o If start-up costs are publicly funded, annual P/L improves to -$50,300 from -$80,000. o If all fixed costs are publicly funded, and the per pound purchase price for beans
decreases to $2.00 P/L crosses the threshold into positive territory at $1,200. o If all fixed costs are publicly funded, and the selling price for beans increases from $2.00
per pound to $2.25 per pound, P/L improves to $2,600
Impacts of selling price on Scenario 6 As in Table 10, pricing has a larger impact on profitability (P/L) than the addition of public funding, so Table 12b presents various pricing (purchase and selling) scenarios to achieve positive P/L. Table 12b illustrates three different selling price scenarios (column X, Y, Z) across 5 purchase price scenarios (row A-E) for one crop combination from Table 12. The various purchase pricing scenarios presented in Table 12b include prices paid by existing buyers to growers (the Olympia Food Co-op and Evergreen United, the latter a local food distribution company), and hypothetical pricing (“lo”, mid, and $0.90 per pound across all crops). Evergreen United pricing to growers is $1.36 per pound for carrots, $1.86 per pound for broccoli, $1.50 per pound for summer squash, and $0.90 per pound for butternut squash. The mid-range pricing is $1.00 for carrots, $1.50 per pound for broccoli, $1.25 per pound for summer squash, and $2.00 per pound for butternut squash.
Table 12b: Impact of Pricing on Crop combination scenario 6, 2-1-1-1, 2-3
Purchase Price Scenarios Selling Price Scenarios
X Y Z
$2/lb (lo selling price)
$2.50/lb (hi selling price)
$2/lb carrots and summer sq., $2.50/lb beans, broccoli, and
butternut
A
Co-op purchase pricing (hi) $ (80,000) $ (1,300) $ (44,000)
B Lo purchase price $ (20,600)
$ 58,100
$ 15,400
C Mid-range $ (40,600) $ 38,000 $ (4,600)
D Evergreen United purchase pricing
$ (96,100) $ (17,400) $ (60,000)
E $0.90/lb purchase price for all crops
$ (900) $ 77,000 $ 35,000
Green shading denotes mid-range purchase pricing and mid-range sales pricing, a combination most likely to be acceptable to growers and buyers. Profit-loss is barely negative here for the all crops including those that are less profitable, but positive above (Table 10b) when including only the more profitable crops.
Table 12b Findings:
• At a selling price of $2.00 per pound (column X), the purchase price for all crops in this combination must be at least $0.90 per pound to reach break-even.
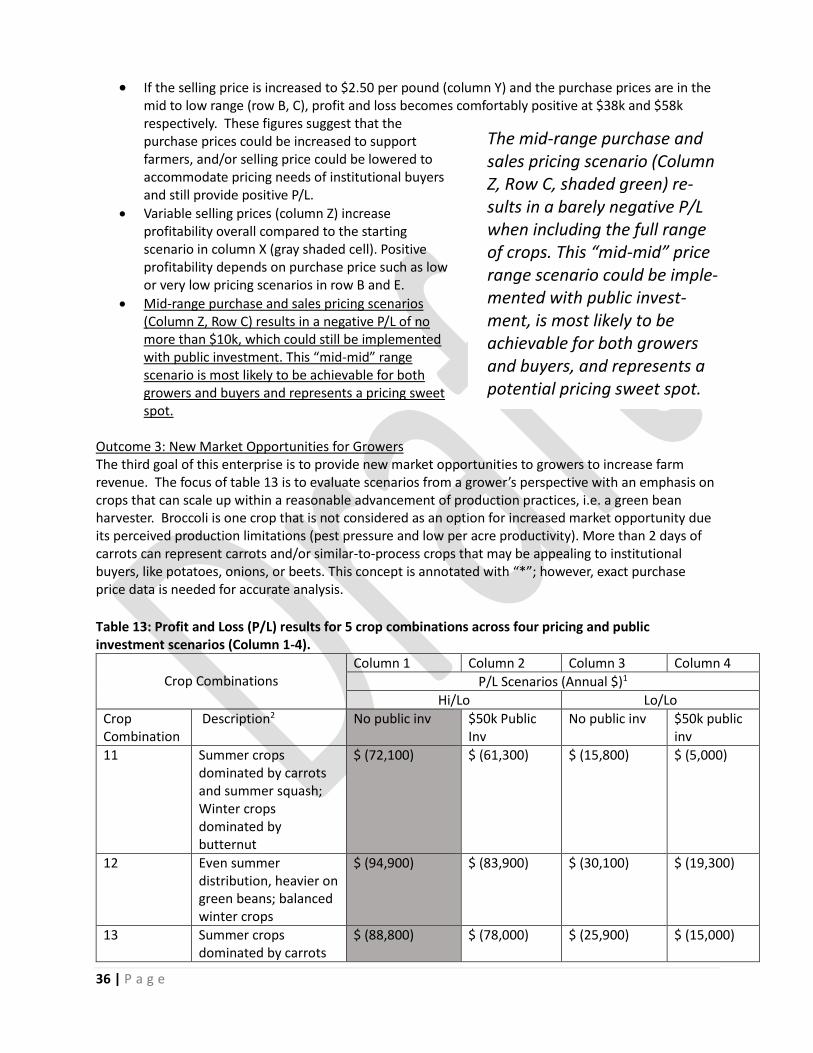
36 | P a g e
• If the selling price is increased to $2.50 per pound (column Y) and the purchase prices are in the mid to low range (row B, C), profit and loss becomes comfortably positive at $38k and $58k respectively. These figures suggest that the purchase prices could be increased to support farmers, and/or selling price could be lowered to accommodate pricing needs of institutional buyers and still provide positive P/L.
• Variable selling prices (column Z) increase profitability overall compared to the starting scenario in column X (gray shaded cell). Positive profitability depends on purchase price such as low or very low pricing scenarios in row B and E.
• Mid-range purchase and sales pricing scenarios (Column Z, Row C) results in a negative P/L of no more than $10k, which could still be implemented with public investment. This “mid-mid” range scenario is most likely to be achievable for both growers and buyers and represents a pricing sweet spot.
Outcome 3: New Market Opportunities for Growers The third goal of this enterprise is to provide new market opportunities to growers to increase farm revenue. The focus of table 13 is to evaluate scenarios from a grower’s perspective with an emphasis on crops that can scale up within a reasonable advancement of production practices, i.e. a green bean harvester. Broccoli is one crop that is not considered as an option for increased market opportunity due its perceived production limitations (pest pressure and low per acre productivity). More than 2 days of carrots can represent carrots and/or similar-to-process crops that may be appealing to institutional buyers, like potatoes, onions, or beets. This concept is annotated with “*”; however, exact purchase price data is needed for accurate analysis.
Table 13: Profit and Loss (P/L) results for 5 crop combinations across four pricing and public investment scenarios (Column 1-4).
Crop Combinations
Column 1 Column 2 Column 3 Column 4
P/L Scenarios (Annual $)1
Hi/Lo Lo/Lo
Crop Combination
Description2 No public inv $50k Public Inv
No public inv $50k public inv
11 Summer crops dominated by carrots and summer squash; Winter crops dominated by butternut
$ (72,100) $ (61,300) $ (15,800) $ (5,000)
12 Even summer distribution, heavier on green beans; balanced winter crops
$ (94,900) $ (83,900) $ (30,100) $ (19,300)
13 Summer crops dominated by carrots
$ (88,800) $ (78,000) $ (25,900) $ (15,000)
The mid-range purchase and sales pricing scenario (Column Z, Row C, shaded green) re-sults in a barely negative P/L when including the full range of crops. This “mid-mid” price range scenario could be imple-mented with public invest-ment, is most likely to be achievable for both growers and buyers, and represents a potential pricing sweet spot.
37 | P a g e
and green beans; balanced winter selection
14 Summer crops include carrots* and green beans only; Winter dominated by carrots*
$ (76,000) $ (65,200) $ (19,600) $ (8,800)
15 Only carrots* in the summer, balanced winter selection
$ (44,500) $ (33,700) $ 1,700 $ 12,500
Notes: Shaded column contains profitability data for crop combinations with starting scenario pricing and equipment financing conditions. 1 See Tables 7 and 8 for scenario details. 2 See Table 13a for weekly distribution of crops
Table 13a: Processing breakdown of 5 crop combinations evaluated in Table 3
Scenario Processing days per week
summer crops winter crops
carrot-broccoli-zucchini-green beans carrots-butternut
11 3-0-1-1 2-3
12 1-1-1-2 2-3
13 2-0-1-2 3-2
14 4-0-0-1 3-2
15 5-0-0-0 2-3
Outcome 3 Findings:
• At the $2.00 per pound selling price the profitability (P/L) for every scenario is negative.
• Crop combinations with green beans do not achieve positive profitability even at the “lo” purchase price (column 3) and with the addition of public investment (column 4). Green Beans are the most expensive crop to purchase from growers at $2.31 per pound, in addition to the expensive processing equipment (Lyco Bean Snipper).
• Scenario 15 does achieve positive P/L via public funding and low purchase prices, which may not be realistic.
Impacts of selling price on Scenario 11 As in the other outcomes, pricing has a larger impact on profitability (P/L) than the addition of public funding, so this section considers various pricing (purchase and selling) scenarios to achieve positive P/L. Table 13b shows 3 different selling price scenarios (column X, Y, Z) across 5 purchase price scenarios (row A-E) for one crop combination from Table 13.
The various purchase pricing scenarios presented in Table 13b include prices paid by existing buyers to growers (the Olympia Food Co-op and Evergreen United), and hypothetical pricing (“lo”, mid, and $0.90 per pound across all crops). Evergreen United pricing to growers is $1.36 per pound for carrots, $1.86 per pound for broccoli, $1.50 per pound for summer squash, and $0.90 per pound for butternut squash. Table 13b: Impact of Pricing on Crop combination scenario 11, 3-0-1-1, 2-3
Purchase Price Scenarios
Selling Price Scenarios
X Y Z
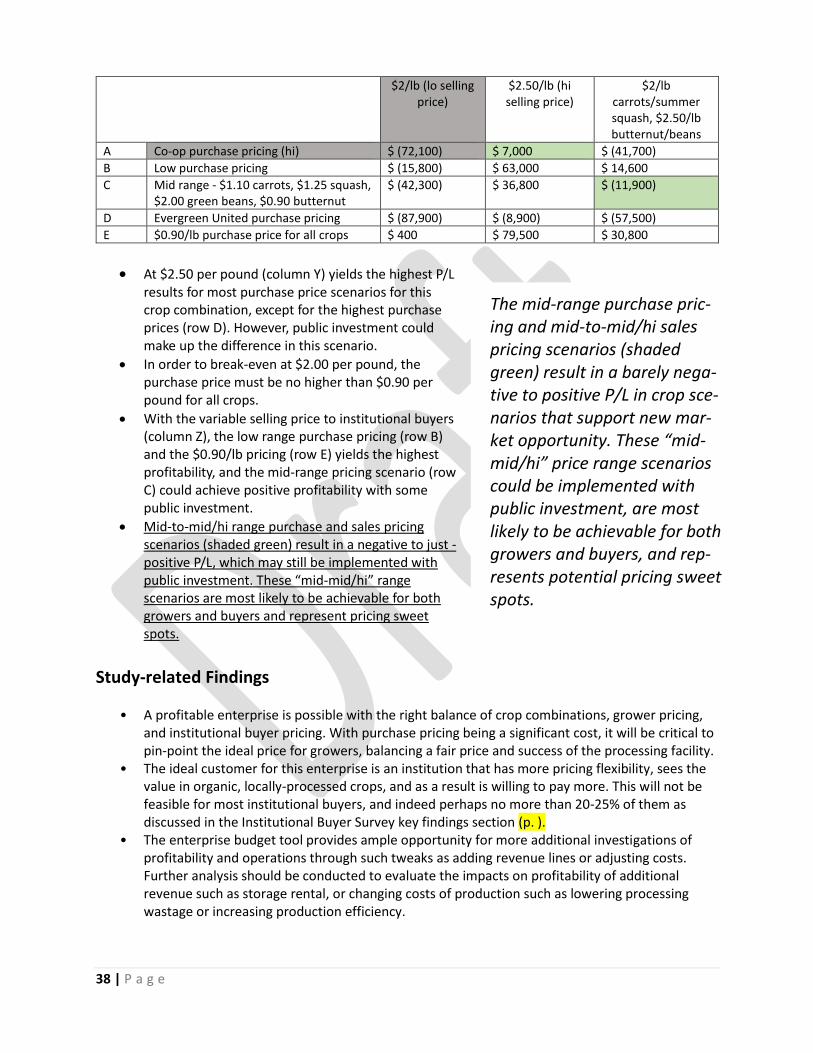
38 | P a g e
$2/lb (lo selling price)
$2.50/lb (hi selling price)
$2/lb carrots/summer squash, $2.50/lb butternut/beans
A Co-op purchase pricing (hi) $ (72,100) $ 7,000 $ (41,700)
B Low purchase pricing $ (15,800) $ 63,000 $ 14,600
C Mid range - $1.10 carrots, $1.25 squash, $2.00 green beans, $0.90 butternut
$ (42,300) $ 36,800 $ (11,900)
D Evergreen United purchase pricing $ (87,900) $ (8,900) $ (57,500)
E $0.90/lb purchase price for all crops $ 400 $ 79,500 $ 30,800
• At $2.50 per pound (column Y) yields the highest P/L results for most purchase price scenarios for this crop combination, except for the highest purchase prices (row D). However, public investment could make up the difference in this scenario.
• In order to break-even at $2.00 per pound, the purchase price must be no higher than $0.90 per pound for all crops.
• With the variable selling price to institutional buyers (column Z), the low range purchase pricing (row B) and the $0.90/lb pricing (row E) yields the highest profitability, and the mid-range pricing scenario (row C) could achieve positive profitability with some public investment.
• Mid-to-mid/hi range purchase and sales pricing scenarios (shaded green) result in a negative to just -positive P/L, which may still be implemented with public investment. These “mid-mid/hi” range scenarios are most likely to be achievable for both growers and buyers and represent pricing sweet spots.
Study-related Findings
• A profitable enterprise is possible with the right balance of crop combinations, grower pricing, and institutional buyer pricing. With purchase pricing being a significant cost, it will be critical to pin-point the ideal price for growers, balancing a fair price and success of the processing facility.
• The ideal customer for this enterprise is an institution that has more pricing flexibility, sees the value in organic, locally-processed crops, and as a result is willing to pay more. This will not be feasible for most institutional buyers, and indeed perhaps no more than 20-25% of them as discussed in the Institutional Buyer Survey key findings section (p. ).
• The enterprise budget tool provides ample opportunity for more additional investigations of profitability and operations through such tweaks as adding revenue lines or adjusting costs. Further analysis should be conducted to evaluate the impacts on profitability of additional revenue such as storage rental, or changing costs of production such as lowering processing wastage or increasing production efficiency.
The mid-range purchase pric-ing and mid-to-mid/hi sales pricing scenarios (shaded green) result in a barely nega-tive to positive P/L in crop sce-narios that support new mar-ket opportunity. These “mid-mid/hi” price range scenarios could be implemented with public investment, are most likely to be achievable for both growers and buyers, and rep-resents potential pricing sweet spots.

39 | P a g e
Pilot-Scale Operation
40 | P a g e
Next Steps The results of the profitability analysis, including a selection of promising crop combinations, quantities needed from growers, and the pricing and financing conditions needed for positive profitability, is information to bring to the table with growers and institutional buyers. The enterprise budget tool enables us to ask questions like, “If a processor were to purchase 98,000 lbs of butternut squash, what would be your price?” There are still many questions to answer.
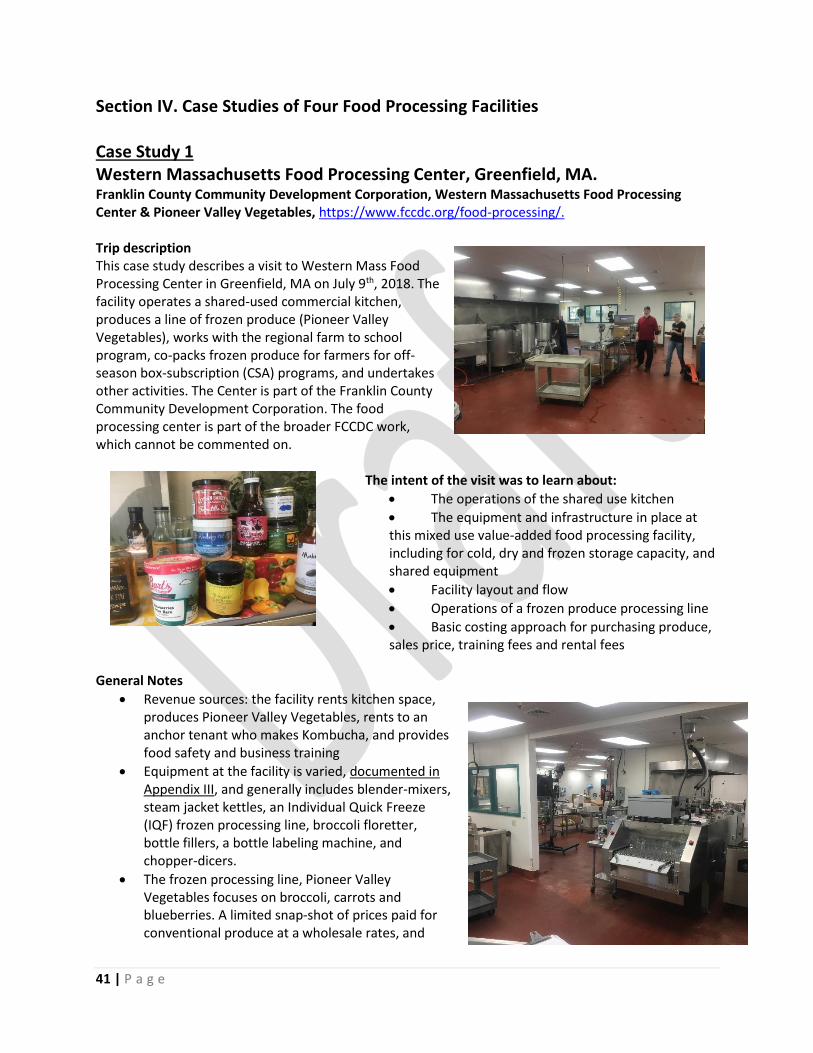
41 | P a g e
Section IV. Case Studies of Four Food Processing Facilities Case Study 1 Western Massachusetts Food Processing Center, Greenfield, MA. Franklin County Community Development Corporation, Western Massachusetts Food Processing Center & Pioneer Valley Vegetables, https://www.fccdc.org/food-processing/. Trip description This case study describes a visit to Western Mass Food Processing Center in Greenfield, MA on July 9th, 2018. The facility operates a shared-used commercial kitchen, produces a line of frozen produce (Pioneer Valley Vegetables), works with the regional farm to school program, co-packs frozen produce for farmers for off-season box-subscription (CSA) programs, and undertakes other activities. The Center is part of the Franklin County Community Development Corporation. The food processing center is part of the broader FCCDC work, which cannot be commented on.
The intent of the visit was to learn about:
• The operations of the shared use kitchen
• The equipment and infrastructure in place at this mixed use value-added food processing facility, including for cold, dry and frozen storage capacity, and shared equipment
• Facility layout and flow
• Operations of a frozen produce processing line
• Basic costing approach for purchasing produce, sales price, training fees and rental fees
General Notes
• Revenue sources: the facility rents kitchen space, produces Pioneer Valley Vegetables, rents to an anchor tenant who makes Kombucha, and provides food safety and business training
• Equipment at the facility is varied, documented in Appendix III, and generally includes blender-mixers, steam jacket kettles, an Individual Quick Freeze (IQF) frozen processing line, broccoli floretter, bottle fillers, a bottle labeling machine, and chopper-dicers.
• The frozen processing line, Pioneer Valley Vegetables focuses on broccoli, carrots and blueberries. A limited snap-shot of prices paid for conventional produce at a wholesale rates, and
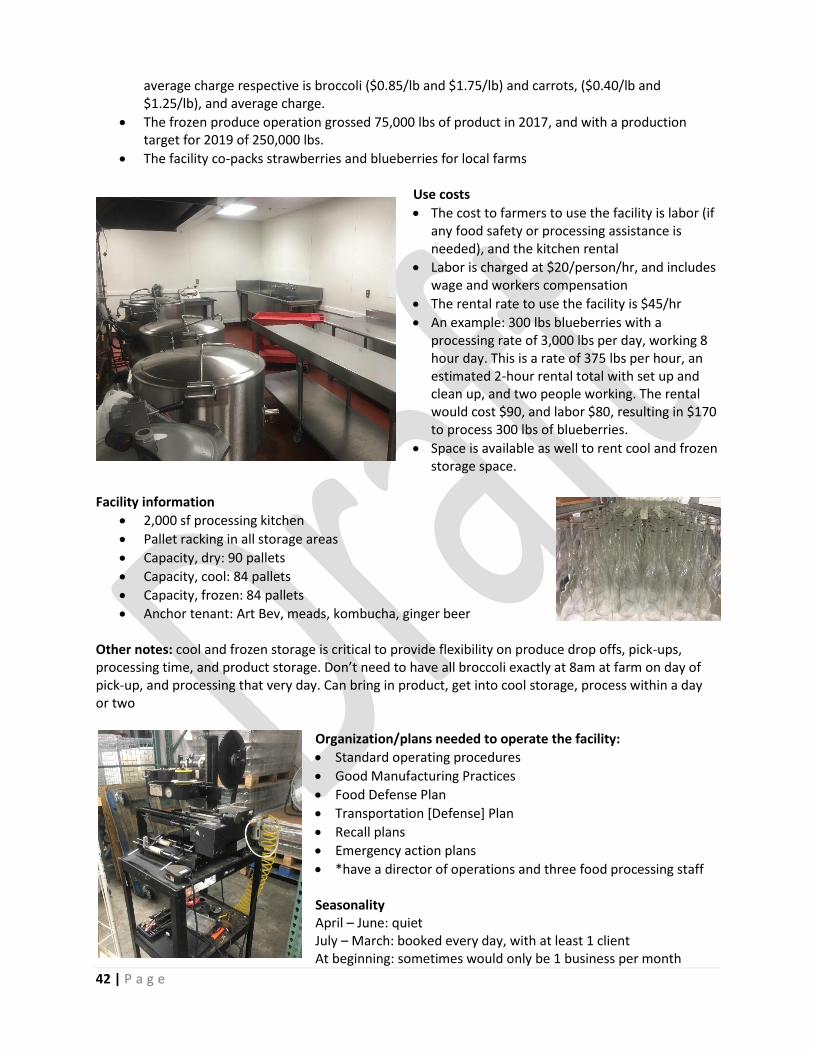
42 | P a g e
average charge respective is broccoli ($0.85/lb and $1.75/lb) and carrots, ($0.40/lb and $1.25/lb), and average charge.
• The frozen produce operation grossed 75,000 lbs of product in 2017, and with a production target for 2019 of 250,000 lbs.
• The facility co-packs strawberries and blueberries for local farms
Use costs
• The cost to farmers to use the facility is labor (if any food safety or processing assistance is needed), and the kitchen rental
• Labor is charged at $20/person/hr, and includes wage and workers compensation
• The rental rate to use the facility is $45/hr
• An example: 300 lbs blueberries with a processing rate of 3,000 lbs per day, working 8 hour day. This is a rate of 375 lbs per hour, an estimated 2-hour rental total with set up and clean up, and two people working. The rental would cost $90, and labor $80, resulting in $170 to process 300 lbs of blueberries.
• Space is available as well to rent cool and frozen storage space.
Facility information
• 2,000 sf processing kitchen
• Pallet racking in all storage areas
• Capacity, dry: 90 pallets
• Capacity, cool: 84 pallets
• Capacity, frozen: 84 pallets
• Anchor tenant: Art Bev, meads, kombucha, ginger beer Other notes: cool and frozen storage is critical to provide flexibility on produce drop offs, pick-ups, processing time, and product storage. Don’t need to have all broccoli exactly at 8am at farm on day of pick-up, and processing that very day. Can bring in product, get into cool storage, process within a day or two
Organization/plans needed to operate the facility:
• Standard operating procedures
• Good Manufacturing Practices
• Food Defense Plan
• Transportation [Defense] Plan
• Recall plans
• Emergency action plans
• *have a director of operations and three food processing staff Seasonality April – June: quiet July – March: booked every day, with at least 1 client At beginning: sometimes would only be 1 business per month
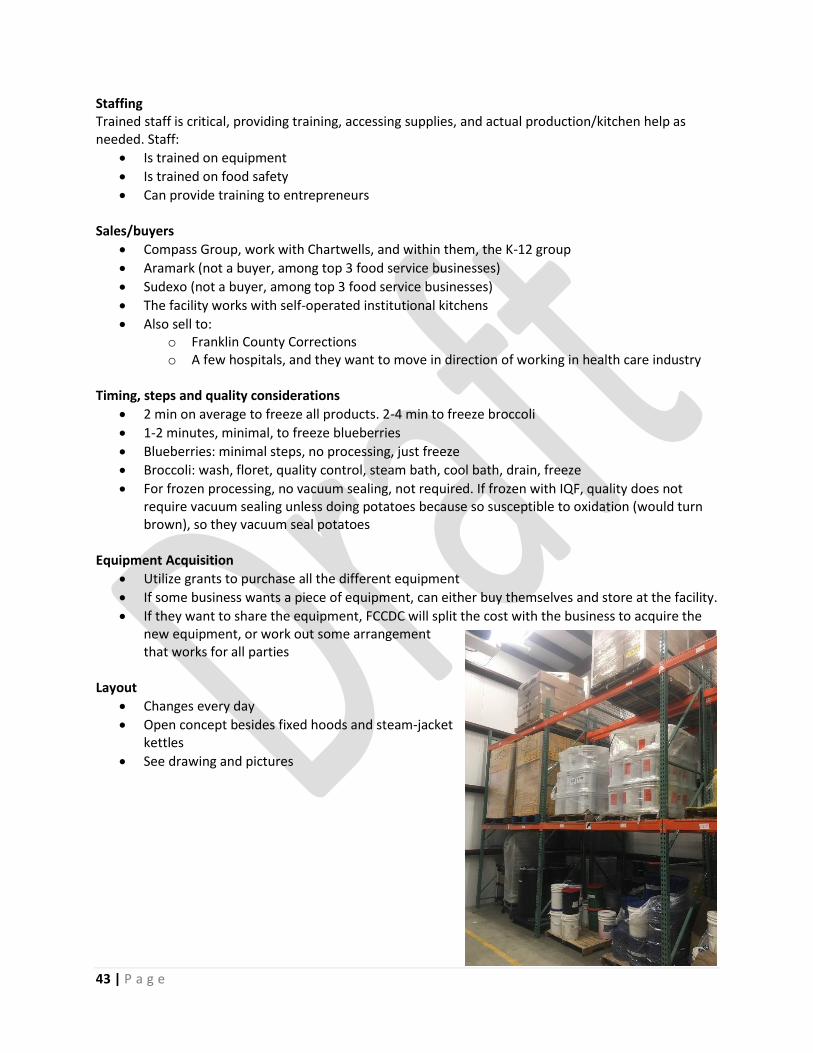
43 | P a g e
Staffing Trained staff is critical, providing training, accessing supplies, and actual production/kitchen help as needed. Staff:
• Is trained on equipment
• Is trained on food safety
• Can provide training to entrepreneurs Sales/buyers
• Compass Group, work with Chartwells, and within them, the K-12 group
• Aramark (not a buyer, among top 3 food service businesses)
• Sudexo (not a buyer, among top 3 food service businesses)
• The facility works with self-operated institutional kitchens
• Also sell to: o Franklin County Corrections o A few hospitals, and they want to move in direction of working in health care industry
Timing, steps and quality considerations
• 2 min on average to freeze all products. 2-4 min to freeze broccoli
• 1-2 minutes, minimal, to freeze blueberries
• Blueberries: minimal steps, no processing, just freeze
• Broccoli: wash, floret, quality control, steam bath, cool bath, drain, freeze
• For frozen processing, no vacuum sealing, not required. If frozen with IQF, quality does not require vacuum sealing unless doing potatoes because so susceptible to oxidation (would turn brown), so they vacuum seal potatoes
Equipment Acquisition
• Utilize grants to purchase all the different equipment
• If some business wants a piece of equipment, can either buy themselves and store at the facility.
• If they want to share the equipment, FCCDC will split the cost with the business to acquire the new equipment, or work out some arrangement that works for all parties
Layout
• Changes every day
• Open concept besides fixed hoods and steam-jacket kettles
• See drawing and pictures
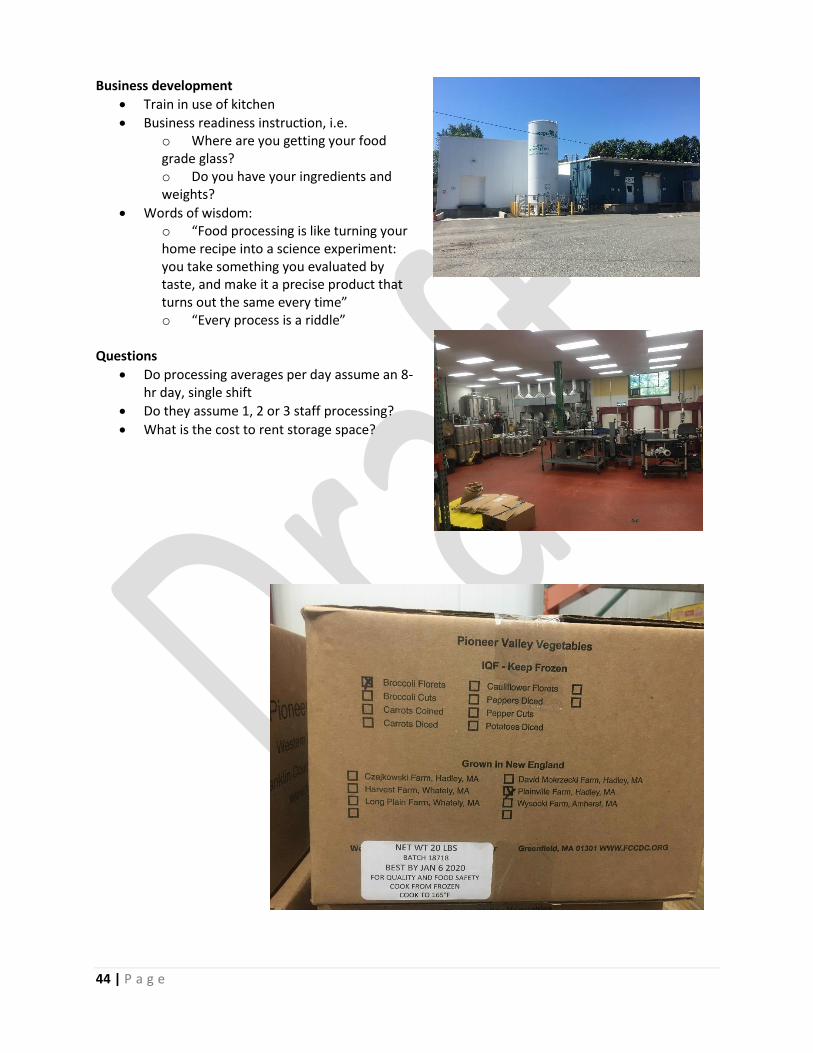
44 | P a g e
Business development
• Train in use of kitchen
• Business readiness instruction, i.e. o Where are you getting your food grade glass? o Do you have your ingredients and weights?
• Words of wisdom: o “Food processing is like turning your home recipe into a science experiment: you take something you evaluated by taste, and make it a precise product that turns out the same every time” o “Every process is a riddle”
Questions
• Do processing averages per day assume an 8-hr day, single shift
• Do they assume 1, 2 or 3 staff processing?
• What is the cost to rent storage space?
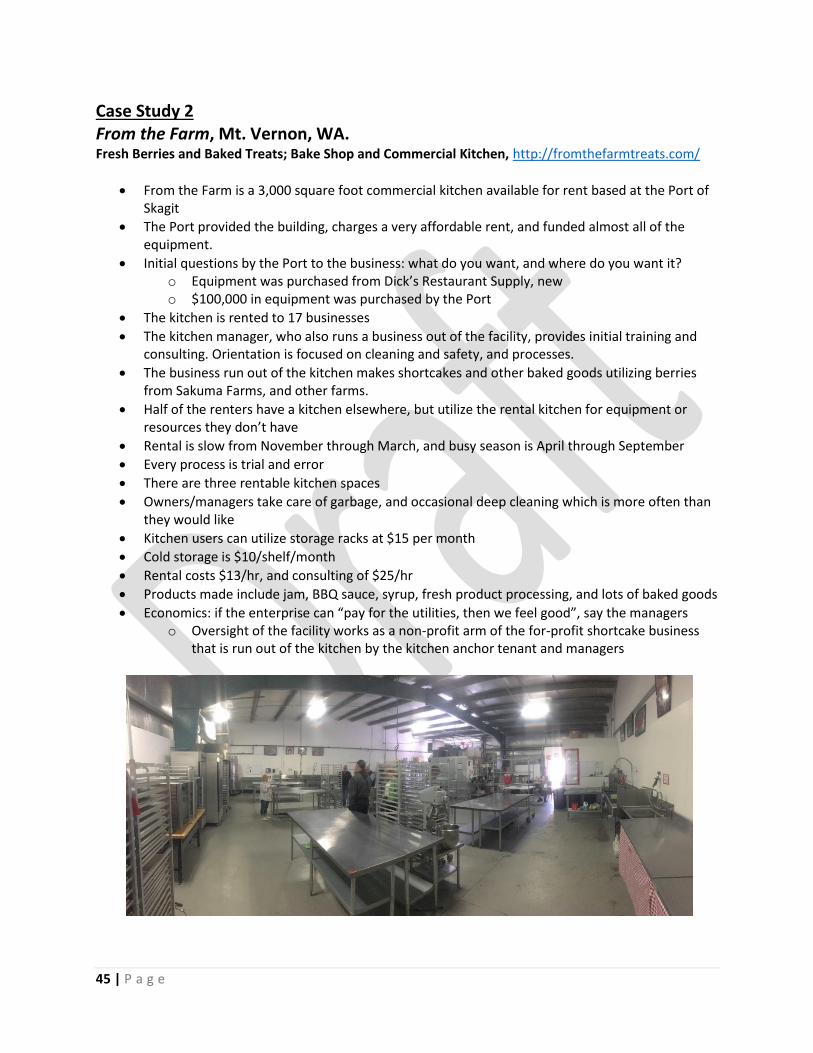
45 | P a g e
Case Study 2 From the Farm, Mt. Vernon, WA. Fresh Berries and Baked Treats; Bake Shop and Commercial Kitchen, http://fromthefarmtreats.com/
• From the Farm is a 3,000 square foot commercial kitchen available for rent based at the Port of Skagit
• The Port provided the building, charges a very affordable rent, and funded almost all of the equipment.
• Initial questions by the Port to the business: what do you want, and where do you want it? o Equipment was purchased from Dick’s Restaurant Supply, new o $100,000 in equipment was purchased by the Port
• The kitchen is rented to 17 businesses
• The kitchen manager, who also runs a business out of the facility, provides initial training and consulting. Orientation is focused on cleaning and safety, and processes.
• The business run out of the kitchen makes shortcakes and other baked goods utilizing berries from Sakuma Farms, and other farms.
• Half of the renters have a kitchen elsewhere, but utilize the rental kitchen for equipment or resources they don’t have
• Rental is slow from November through March, and busy season is April through September
• Every process is trial and error
• There are three rentable kitchen spaces
• Owners/managers take care of garbage, and occasional deep cleaning which is more often than they would like
• Kitchen users can utilize storage racks at $15 per month
• Cold storage is $10/shelf/month
• Rental costs $13/hr, and consulting of $25/hr
• Products made include jam, BBQ sauce, syrup, fresh product processing, and lots of baked goods
• Economics: if the enterprise can “pay for the utilities, then we feel good”, say the managers o Oversight of the facility works as a non-profit arm of the for-profit shortcake business
that is run out of the kitchen by the kitchen anchor tenant and managers
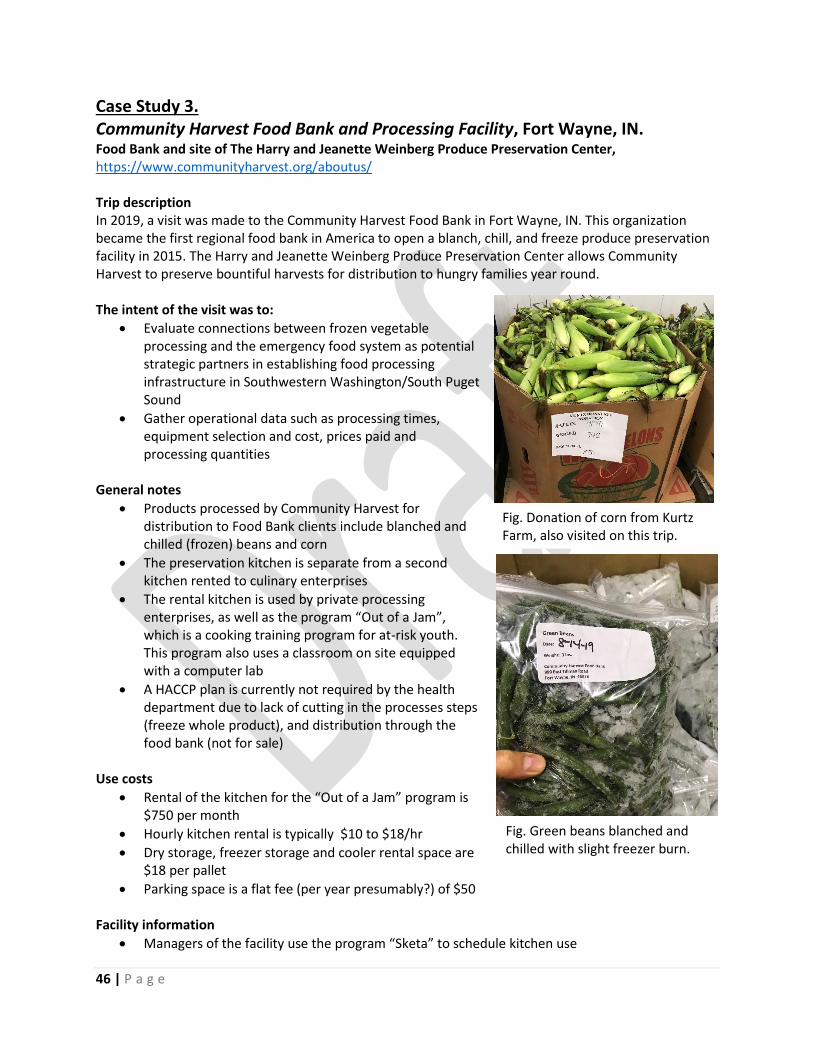
46 | P a g e
Case Study 3. Community Harvest Food Bank and Processing Facility, Fort Wayne, IN. Food Bank and site of The Harry and Jeanette Weinberg Produce Preservation Center, https://www.communityharvest.org/aboutus/ Trip description In 2019, a visit was made to the Community Harvest Food Bank in Fort Wayne, IN. This organization became the first regional food bank in America to open a blanch, chill, and freeze produce preservation facility in 2015. The Harry and Jeanette Weinberg Produce Preservation Center allows Community Harvest to preserve bountiful harvests for distribution to hungry families year round. The intent of the visit was to:
• Evaluate connections between frozen vegetable processing and the emergency food system as potential strategic partners in establishing food processing infrastructure in Southwestern Washington/South Puget Sound
• Gather operational data such as processing times, equipment selection and cost, prices paid and processing quantities
General notes
• Products processed by Community Harvest for distribution to Food Bank clients include blanched and chilled (frozen) beans and corn
• The preservation kitchen is separate from a second kitchen rented to culinary enterprises
• The rental kitchen is used by private processing enterprises, as well as the program “Out of a Jam”, which is a cooking training program for at-risk youth. This program also uses a classroom on site equipped with a computer lab
• A HACCP plan is currently not required by the health department due to lack of cutting in the processes steps (freeze whole product), and distribution through the food bank (not for sale)
Use costs
• Rental of the kitchen for the “Out of a Jam” program is $750 per month
• Hourly kitchen rental is typically $10 to $18/hr
• Dry storage, freezer storage and cooler rental space are $18 per pallet
• Parking space is a flat fee (per year presumably?) of $50 Facility information
• Managers of the facility use the program “Sketa” to schedule kitchen use
Fig. Donation of corn from Kurtz Farm, also visited on this trip.
Fig. Green beans blanched and chilled with slight freezer burn.
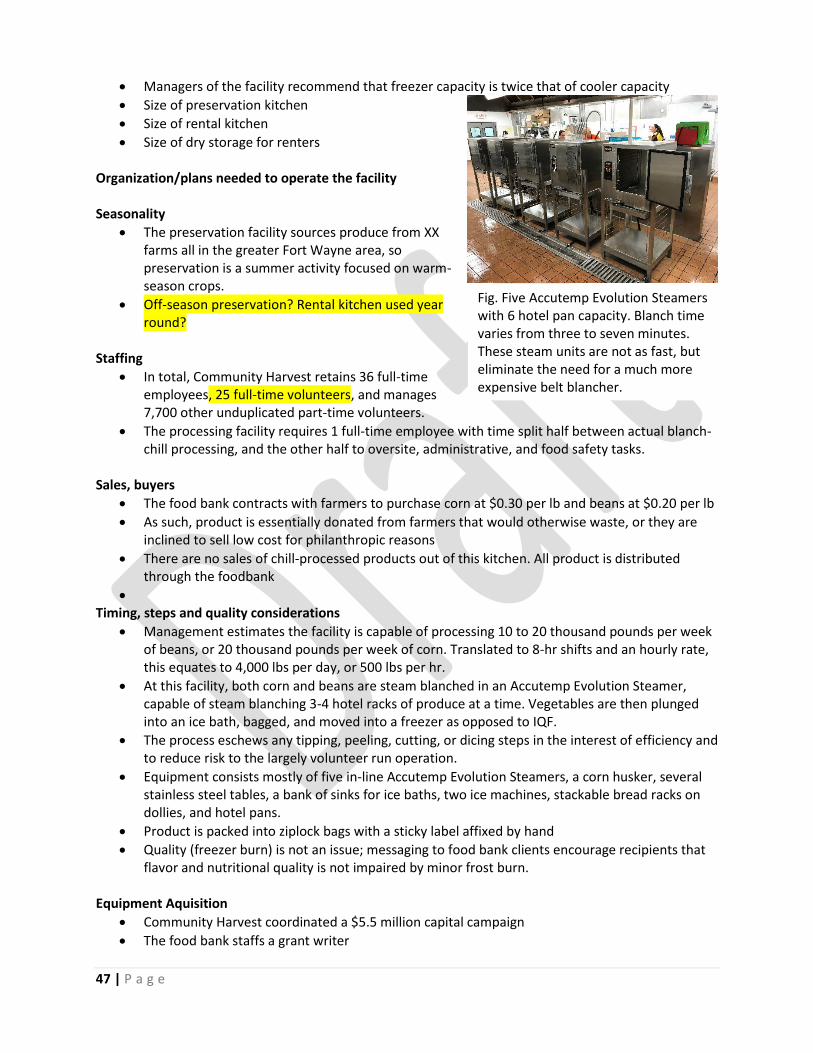
47 | P a g e
• Managers of the facility recommend that freezer capacity is twice that of cooler capacity
• Size of preservation kitchen
• Size of rental kitchen
• Size of dry storage for renters Organization/plans needed to operate the facility Seasonality
• The preservation facility sources produce from XX farms all in the greater Fort Wayne area, so preservation is a summer activity focused on warm-season crops.
• Off-season preservation? Rental kitchen used year round?
Staffing
• In total, Community Harvest retains 36 full-time employees, 25 full-time volunteers, and manages 7,700 other unduplicated part-time volunteers.
• The processing facility requires 1 full-time employee with time split half between actual blanch-chill processing, and the other half to oversite, administrative, and food safety tasks.
Sales, buyers
• The food bank contracts with farmers to purchase corn at $0.30 per lb and beans at $0.20 per lb
• As such, product is essentially donated from farmers that would otherwise waste, or they are inclined to sell low cost for philanthropic reasons
• There are no sales of chill-processed products out of this kitchen. All product is distributed through the foodbank
• Timing, steps and quality considerations
• Management estimates the facility is capable of processing 10 to 20 thousand pounds per week of beans, or 20 thousand pounds per week of corn. Translated to 8-hr shifts and an hourly rate, this equates to 4,000 lbs per day, or 500 lbs per hr.
• At this facility, both corn and beans are steam blanched in an Accutemp Evolution Steamer, capable of steam blanching 3-4 hotel racks of produce at a time. Vegetables are then plunged into an ice bath, bagged, and moved into a freezer as opposed to IQF.
• The process eschews any tipping, peeling, cutting, or dicing steps in the interest of efficiency and to reduce risk to the largely volunteer run operation.
• Equipment consists mostly of five in-line Accutemp Evolution Steamers, a corn husker, several stainless steel tables, a bank of sinks for ice baths, two ice machines, stackable bread racks on dollies, and hotel pans.
• Product is packed into ziplock bags with a sticky label affixed by hand
• Quality (freezer burn) is not an issue; messaging to food bank clients encourage recipients that flavor and nutritional quality is not impaired by minor frost burn.
Equipment Aquisition
• Community Harvest coordinated a $5.5 million capital campaign
• The food bank staffs a grant writer
Fig. Five Accutemp Evolution Steamers with 6 hotel pan capacity. Blanch time varies from three to seven minutes. These steam units are not as fast, but eliminate the need for a much more expensive belt blancher.
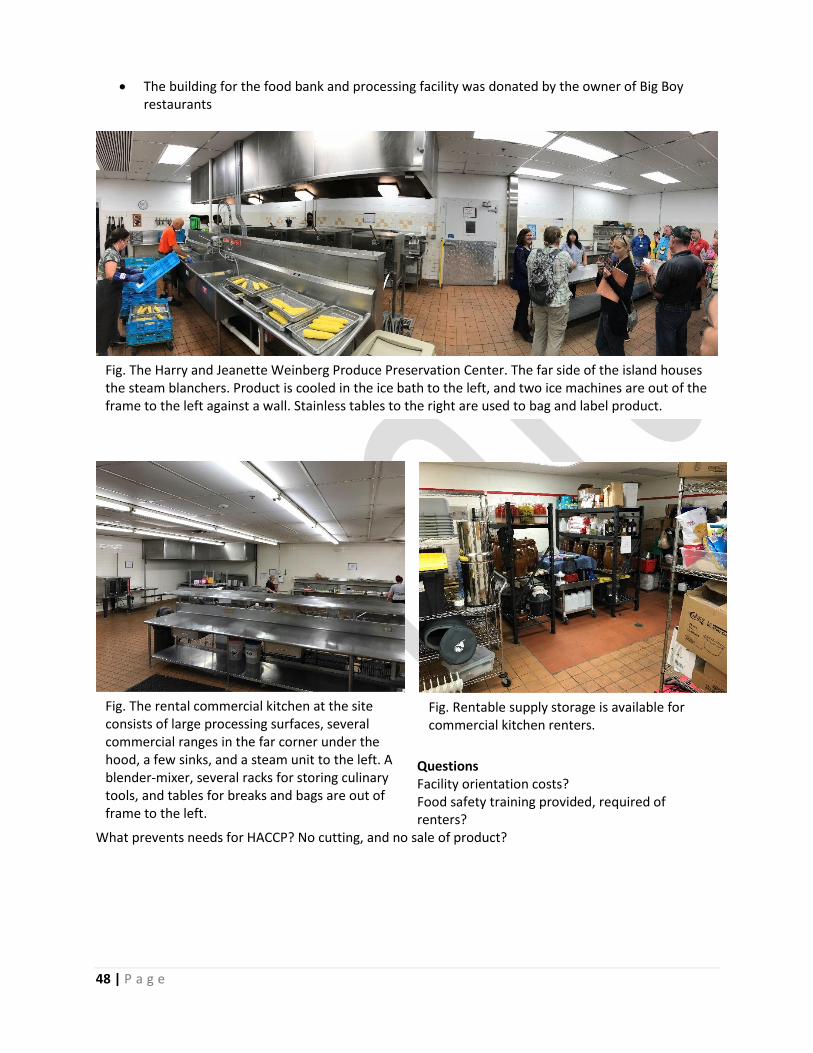
48 | P a g e
• The building for the food bank and processing facility was donated by the owner of Big Boy restaurants
Questions Facility orientation costs? Food safety training provided, required of renters?
What prevents needs for HACCP? No cutting, and no sale of product?
Fig. The Harry and Jeanette Weinberg Produce Preservation Center. The far side of the island houses the steam blanchers. Product is cooled in the ice bath to the left, and two ice machines are out of the frame to the left against a wall. Stainless tables to the right are used to bag and label product.
Fig. The rental commercial kitchen at the site consists of large processing surfaces, several commercial ranges in the far corner under the hood, a few sinks, and a steam unit to the left. A blender-mixer, several racks for storing culinary tools, and tables for breaks and bags are out of frame to the left.
Fig. Rentable supply storage is available for commercial kitchen renters.
49 | P a g e
References Donovan, C., and Kinney, K. (2017). Olympia Farmers Market 2017 Rapid Market Assessment Report. Re-
trieved from: http://www.wafarmersmarkettoolkit-org.wafarmersmarkets.org/wp-content/up-loads/2017/11/Olympia-FM-RMA-Report-9-30-2017.pdf.
Bramwell, S.G. (2019). Market Assessment for Value-Added Frozen Vegetable and Fruit Sales at a Farm-
ers Market. Journal of the National Association of County Agricultural Agents 12 (1). Retrieved from: https://www.nacaa.com/journal/index.php?jid=977.
Gwin, L., & Lev, L. (2011). Meat and Poultry Buying at Farmers Markets: A Survey of Shoppers at Three
Markets in Oregon. Journal of Extension, 49(1). Article 1RIB4. Retrieved from: https://www.joe.org/joe/2011february/rb4.php.
50 | P a g e
Extra information Brief Project Background and Justification This project aims to address the need for market and agriculture infrastructure expansion to support agriculture economic development in Thurston County. An emphasis on minimally processed and frozen produce products emerged from a documented need of growers for higher-value markets and expressed willingness of consumers to pay more for frozen product that is local. Extension has a responsibility to investigate and research ways to improve and expand agricultural viability in the county. A facility that processes raw fruits and vegetables into a frozen product may be one solution and we aim to assess the economic viability of this enterprise. Minimally processed and freeze processing adds value to raw agricultural products like fruits and vegetables in several ways:
• Light processing, and freezing in particular, allows growers to grow more during the growing season, or make use of excess, and sell year-round
• Extends the market season of perishable produce by allowing it to be stored beyond the normal market season
• New farmers can obtain market share through availability of a
• Customers benefit when there is a greater variety of produce available year round
• In addition to the conveniences of frozen product: easy to store, ready to use, and less perishable than fresh produce.
Outcomes 1. Documents assembled to coordinate a capital campaign for processing kitchen equipment

51 | P a g e
Appendix I. Interview and Survey Questions Used in Market Assessment
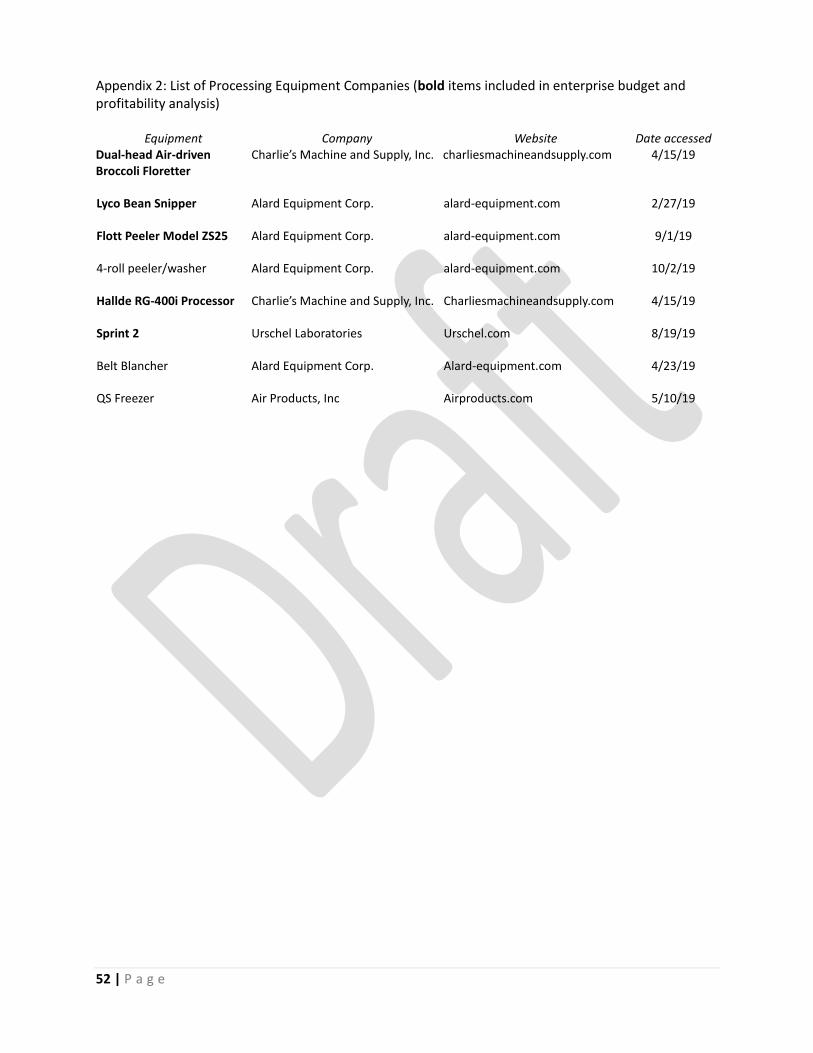
52 | P a g e
Appendix 2: List of Processing Equipment Companies (bold items included in enterprise budget and profitability analysis)
Equipment Company Website Date accessed Dual-head Air-driven Broccoli Floretter
Charlie’s Machine and Supply, Inc. charliesmachineandsupply.com 4/15/19
Lyco Bean Snipper Alard Equipment Corp. alard-equipment.com 2/27/19
Flott Peeler Model ZS25 Alard Equipment Corp. alard-equipment.com 9/1/19
4-roll peeler/washer Alard Equipment Corp. alard-equipment.com 10/2/19
Hallde RG-400i Processor Charlie’s Machine and Supply, Inc. Charliesmachineandsupply.com 4/15/19
Sprint 2 Urschel Laboratories Urschel.com 8/19/19
Belt Blancher Alard Equipment Corp. Alard-equipment.com 4/23/19
QS Freezer Air Products, Inc Airproducts.com 5/10/19