Embed Size (px)
Citation preview
Value Chain Analysis for High Value Crops (HVCs)
in the Punjab State
RS Sidhu
Sanjay Kumar
Kamal Vatta
Parminder Singh
Agro Economic Research Centre
PUNJAB AGRICULTURAL UNIVERSITY
LUDHIANA
June 2009

Table of contents
Page
1. Introduction 1-3
1.1 Background 1-2
1.2. Need for study 2-3
1.3. Objectives of the study 3
2. Methodology 4-9
2.1 Sampling Design 4-5
2.1.1 Selection of Sample Farm Households 4
2.1.2 Selection of Traders 5
2.2 Analytical framework 5-9
2.2.1 Cost and Return Analysis 6-7
2.2.2 Domestic Resource Cost (DRC) 7-8
2.2.3 Price Spread 8-9
3. Socio economic characteristics of high value crops growers 10-13
3.1 Family size, age of the head of the household and literacy
level
10
3.2 Land resources 10-11
3.3 Cropping pattern 12-13
4. Economics of production for high value crops 14-31
4.1 Economics of production of vegetable crops 14-19
4.2 Economics of production for fruit crops 19-25
4.3. Domestic Resource Cost (DRC) for vegetables 25-28
4.4 Domestic Resource Cost (DRC) for fruits 28-31
5. Marketing system for high value crops 32-
5.1 Disposal pattern for vegetables 32-36
5.2 Disposal pattern for fruits 36-37
5.3 Supply chain systems for vegetables 28-50
5.4. Supply chain systems for fruits 50-61
6. Problems faced by growers of high value crops 62-66
6.1 Production problems 62-64
6.2 Marketing problems 64-65
6.3 Suggestions 65-66
7. Summary and conclusion 67-73
References 74-75
ACKNOWLEDGEMENTS
Decline in farm incomes, almost stagnant food grain productivity and changes in
the consumption pattern, call for increase in the production of high value crops such as
fruits and vegetables. The present study was undertaken in order to estimate the
economics of production and marketing of important high-value crops; to ascertain the
Domestic Resource Cost (DRC) and to highlight the problems faced by the producers in
production and marketing of these high-value crops. The study was conducted in the
Punjab state focusing on two most important fruit crops namely kinnow and guava and
six vegetables such as peas, potato, onion, cauliflower, tomato and chillies.
Amongst different vegetables, the net returns were as low as Rs 24,172 per ha for
potato and as high as Rs 2,92,204 per ha for tomato. In case of fruit crops, the net returns
from kinnow turned positive only after four years when the fruit trees started full bearing
and the product started to be brought to the markets. The DRC analysis reveals a fall in
profitability in fruits and vegetable cultivation with the withdrawal of subsidies. The
ratios of protection and efficiency (NPC, EPC and DRC) of different vegetables and
fruits showed the presence of input subsidies, taxes and trade restrictions but Punjab has a
comparative advantage in producing these commodities. Wholesaler was the major
marketing agency in case of vegetables and guava, with more than 60 per cent of the
produce being marketed through them while Pre-harvest contractors were dominating in
kinnow. Producer-consumer channel was observed to be the most efficient channel and
the producer’s share in consumer’s rupee was found decrease with the increase in number
of market intermediaries involved. Lack of scientific and technical skills, weak extension
efforts by the public and private agencies and the prevalence of poor quality
seeds/seedlings were perceived to be the other major production problems. Lack of
market information, frequent and large fluctuations in prices, congestion in the wholesale
markets and lack of cheaper grading and packing facilities to the farmers were the major
marketing problems. The study highlighted the need for the provision for adequate short-
term credit facilities to high value crop growers, avoidance from purchasing large
machines by the small and marginal farmers, the strict vigilance on the poor quality of
seeds/seedlings and pesticides being supplied by the dealers, sale of good quality seeds
and pesticide through cooperative societies, introduction of crop insurance scheme,
formulation of effective price policy for these crops, and to establish processing units,
cold storages and dry freezing plants in the areas where horticultural crops are grown,
which can help the farmers in getting remunerative returns for the produce.
The authors are grateful to the Ministry of Agriculture, Government of India for
funding this study. We are also thankful to. Dr Usha Tuteja, Professor, Agricultural
Economic Research Centre, New Delhi for providing constructive comments to the
report, which has helped immensely in improving the present report.
Authors
1
Chapter 1
Introduction
1.1. Background
Declining farm incomes, almost stagnant foodgrain production and growing demand
for high value crops like fruits and vegetables due to increase in per capita income and
changes in the consumption pattern call for increase in the production of high value
crops. These crops not only enhance income of the cultivators but also generate more
employment through diversified farming and having been labour intensive crops. These
are more beneficial for the marginal and small farmers, where family labour availability
per unit of land is high. Small and marginal holdings constitute bulk of the rural poor in
our country. Because of their small operational base, it will not be possible to improve
incomes of these households merely by raising the yields of existing crops. So, poverty as
well as food and nutritional insecurity of large number of farm households can be
reduced with the introduction of the high value crops on these holdings. Besides, in
several cases diversification is needed to restore the degraded natural resource base
caused by monoculture of grain crops.
The monoculture of paddy-wheat, particularly in the Indo Gangetic plains, has
resulted into the emergence of various problems like over-exploitation of the ground
water resources, depletion of soil fertility and higher susceptibility of crops to the attack
of various insect pests and diseases. Further, income of the farmers growing grain crops
like wheat and paddy has fallen in recent years. The Punjab state showcases the classic
example of fast agricultural development based on few grain crops culminating to
2
agrarian crisis of stagnating productivity, falling income and growing indebtedness. Thus,
in order to improve incomes, provide gainful employment and save the natural resources
from further degradation, diversification from grain crops to high value crops like fruits
and vegetables emerges as a major strategy for agricultural growth. The most important
factor determing the pattern, if not the pace, of diversification is ‘the market’. There are a
number of studies in India and other developing countries, which suggest high elasticity
of demand of HVCs in response to income and prices. Price response however is one
aspect of the impact of the market on the cropping pattern. Equally important is the
production and marketing efficiency. Profitability of the crop/enterprise is the guiding
force for resource allocation decisions of the farmers. Income is another important
determinant of growth in demand for HVCs. It has been seen that the consumption for
fruits and vegetables has gone up in 1999-2000 as compared with 1986-87 (NSSO data).
On supply side, the delivery system for inputs and credit are important factors. The
agronomic conditions in a given region and the technology available for various crops are
two other important forces which condition diversification. Public interventions also
significantly influence the nature of cropping pattern and the extent of diversity. This
study will therefore focus on these issues and try to highlight the production and
marketing efficiency of entire value chain of HVCs in the Punjab state.
1.2. Need for study
The costs and returns analysis for various high-value crops will be helpful to examine
the relative profitability of these crops with respect to traditional foodgrain crops. The
momentum for the increased production of high-value crops cannot be sustained unless
simultaneous efforts are made to improve marketing of these crops through the
3
development of effective marketing system and marketing agencies. The farmers will get
the remunerative prices for their surplus produce only when the effective and efficient
marketing system is in place. It is also important to study the Domestic Resource Cost
(DRC) of different high value crops so that the comparative export competitiveness of
these crops from this region may be ascertained, keeping in view the various government
incentives/subsidies and social costs. The experience of the initiatives taken for the
promotion of these crops through contract/co-operative/corporate farming will be helpful
to identify the factors responsible for the success/failure of these programmes and to
explore the possibilities of their strengthening and replication in the other areas.
1.3. Objectives of the study
The study was carried out to accomplish the following objectives:
1. To estimate the costs of production and returns associated with the cultivation of
important high-value crops;
2. To identify the value chain systems and to estimate the costs and returns at each
link for these high-value crops;
3. To ascertain the Domestic Resource Cost (DRC) for important high value crops;
4. To highlight the case studies of contract/co-operative/corporate farming for
important high value crops;
5. To study the problems faced by the producers in production and marketing of these
high-value crops.

4
Chapter 2
Methodology
The methodology adopted for the selection of study area, sampling design,
data collection and analytical framework used in the light of specific objectives of
the study have been discussed in the present chapter.
2.1 Sampling Design
2.1.1 Selection of Sample Farm Households
The study was conducted in the Punjab state. High-value crops in this study
included important fruits and vegetables in the state. The present study focused on two
important fruit crops in the state namely Kinnow and Guava. Further six vegetable crops
were covered in the study such as peas, potato, onion, cauliflower, tomato and chillies.
The study wasbe based on primary as well as secondary data. The primary data were
collected from the growers and different market functionaries associated with the
production and marketing of fruits and vegetables in the selected states of the country.
For each of the eight selected crops, one/two districts with the highest area/production in
the state were selected purposively. Further based on the availability of the data, one/two
blocks with the largest area/production from each of the selected districts were selected to
ensure wider coverage of the sample. Village clusters were identified in each block.
Finally, a sample of up to 50 farmers were selected randomly for each of the selected
crops for primary data collection by the personal interview method. The reference
period for the study was 2006-07. The details of sample tomato growers selected is
as follow:

5
Table 2.1:Distribution of sample farmers for different crops
Crops Districts Block No. of sample
farmers
Total
Tomato Kapurthala Sultanpur lodhi 25 25
Chilies Jalandhar Shahkot 22 46
Tarntarn Bhikhiwind 24
Onion Patiala Rajpura 25 25
Cauliflower Hoshiarpur Haryana 25 50
Patiala Rajpura 25
Potato Hoshiarpur Hoshiarpur-II 24 36
Jalandhar Bhogpur 12
Peas Hoshiarpur Mahalpur 25 50
Amritsar Jandiala 25
Kinnow Hoshiarpur Bhunga 25 50
Ferozpur Abohar 25
Guava Sangrur Malerkotla 7 7
2.1.2 Selection of Traders
Different marketing channels for the disposal of high value crops in the
study area were examined to assess the cost and margins of different
intermediaries in the marketing till the produce reaches in the hands of the
consumers. Suitable number of market functionaries were selected for the data
collection. Secondary data regarding the area under high value crops in Punjab and
its different districts and blocks were collected from the Directorate of
Horticulture, Punjab, Chandigarh.
2.2 Analytical framework
Tabular analysis was adopted to analyze the cost and returns associated
with different high value crops, marketing channels, marketing costs and to study
various problems faced by the farmers and solutions there of.

6
2.2.1 Cost and Return Analysis
The cost of cultivation has been worked out by using the variable and fixed
cost components and standard cost concepts. The variable cost includes value of
hired and family labour, owned and hired machinery labour, seed, manure,
fertilizer, pesticides, irrigation, interest on working capital and other miscellaneous
expenses. The fixed cost includes rental value of owned land, rent paid for leased-
in land, depreciation on implements and farm buildings and interest on the fixed
capital.
The gross return has been calculated as:
Gross return = Total production x average price
The net returns over different cost concepts has been calculated as the difference
between the gross return and particular cost. The benefit cost ratios for different
vegetables over different cost concepts is calculated by dividing the gross return
by a particular cost.
The cost and return during the economic life of kinnow and guava orchards
has been estimated for all the stages of cultivation of these crops at the present
prices by using standard cost concepts. The commercial fruiting of kinnow and
guava in the study area was observed to be since 5th
and 4th
year respectively.
Further, age groups were framed based on the productivity pattern of these fruits
over the life of the orchards. Until the fruiting stage, the cost and return analysis
were done on year-wise basis.

7
The costs and gross returns for fruits were estimated by taking sample of
fruit growers representing all stages of life of the kinnow orchards. These
economic parameters were valued at 2006-07 prices and therefore represented
present values of respective parameters. B:C ratio was thus, worked out by
dividing average annual gross returns with average annual cost during the entire
life period of the orchard, using the following formula:
Average of Annual Return
BCR = --------------------------------------
Average of Annual Costs
The Average annual returnt is the equalized yearly value over the life of the
project which can be calculated by taking the average of the net return for the
useful life of the orchard. The net return in fruit cultivation for selected fruit
growers was computed by summing up the annual differences of gross returns and
gross costs which estimated at current prices during the useful life of the fruit
orchard, using the following formula:
T
Net Return from useful life of the orchard = � Gross Income- Gross Cost
i=t
t= Age of orchard (in year), and
T= Economic life of orchard (in years)
2.2.2 Domestic Resource Cost (DRC)
In Punjab, the govt. provides the subsidy on fertilizer as well as on power for the
irrigation. The Domestic Resource Cost (DRC) can be calculated by including these two
subsidies in the present cost analysis for the selected crops. The subsidy on Rs. per tonne

8
basis on for different fertilizers for the reference year of study (2006-07) were as follow
(Fertiliser Statistics (2005-06) and www.urvark.co.in):
Urea 5159
DAP 6737
MOP 7024
SSP 975
In Punjab, the flat rate for the supply of power for agriculture was fixed at Rs. 60
per BHP per month, but later in 2006-07, the Government decided that no tariff will be
levied on the farmers. As per the Punjab State Regulatory Commission, Chandigarh
calculations without government subsidy the flat rate for the supply of power for
agriculture should be Rs. 208 per BHP per month. Therefore, this whole amount is
the subsidy for the supply of power for agriculture in the state.
2.2.3 Price Spread
To study the price spread and marketing efficiency in marketing channels
of kinnow, the marketing costs and margins ;for each link of the channel were
worked out as under (Acharya and Agarwal, 2005):
Marketing Cost
Total cost of marketing was calculated as under:
C= CF +Cml + Cm2 + Cm3 ………….+ Cmn
Where,
C= Total cost of marketing
CF= Cost borne by the orchardists in marketing his produce
Cm= Cost incurred by the middlemen in the process of buying and selling
9
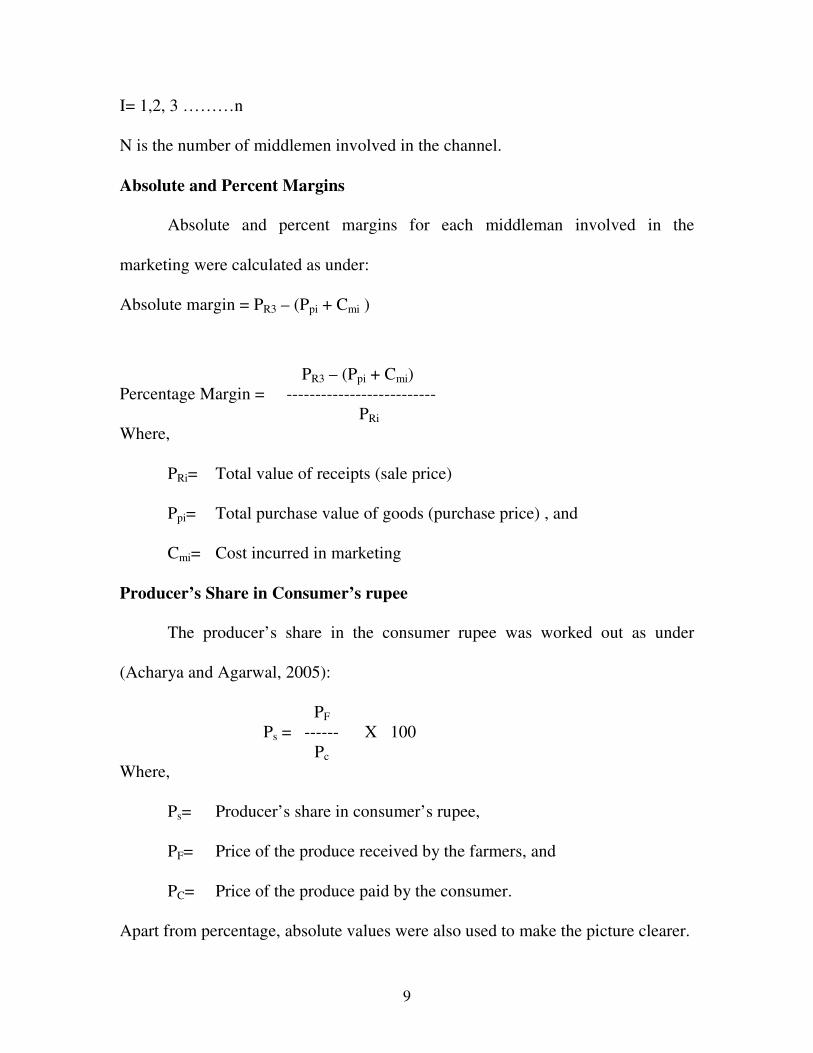
I= 1,2, 3 ………n
N is the number of middlemen involved in the channel.
Absolute and Percent Margins
Absolute and percent margins for each middleman involved in the
marketing were calculated as under:
Absolute margin = PR3 – (Ppi + Cmi )
PR3 – (Ppi + Cmi)
Percentage Margin = --------------------------
PRi
Where,
PRi= Total value of receipts (sale price)
Ppi= Total purchase value of goods (purchase price) , and
Cmi= Cost incurred in marketing
Producer’s Share in Consumer’s rupee
The producer’s share in the consumer rupee was worked out as under
(Acharya and Agarwal, 2005):
PF
Ps = ------ X 100
Pc
Where,
Ps= Producer’s share in consumer’s rupee,
PF= Price of the produce received by the farmers, and
PC= Price of the produce paid by the consumer.
Apart from percentage, absolute values were also used to make the picture clearer.

10
Chapter 3
Socio economic characteristics of high value crops growers
The socio-economic characteristics are the important parameters, which
affect the production and marketing decisions of the households. This section
deals with the important socio economic indicators of the sample households like
family size, age of the head of the household and literacy level, land utilization
and cropping pattern.
3.1 Family size, age of the head of the household and literacy level
Most of the fruit and vegetable growers were found to be living in the joint
family system as more than 55 per cent of the farm families were having the
family size of more than 5 (Table 3.1). Literacy rate in the study area was
observed to be higher than the state and national average. It was in the range of
about 71 per cent to 96 per cent for different fruit and vegetable growers. Most of
the heads of the household were less than 45 years of age, except for the tomato
and kinnow growers, where mostly of the heads of the household were more than
45 years of age.
3.2 Land resources
The average operational holding size of fruit and vegetable growers was found
to vary between 2.5 hectares for tomato growers to 12.8 hectares for the kinnow
growers (Table 3.2). It was strange to observe that mostly the practice of leasing in
was more prevalent among the fruit and vegetable growers while only the small
area was leased out, that’s too in some of the crops only.

11
Table: 3.1 General Characteristics of sample Farmers, Punjab, 2006-07
Sr
No. Particulars Tomoto Growers
Chilli Growers
Onion Growers
Cauliflower Growers
Potato Growers
Peas Growers
Kinnow Growers
Guava Growers
1 Average Family Size (Per cent)
Less than 5 32 11 44 30 33 27 27 14
5--10 60 74 48 68 58 56 67 86
Above 10 8 15 8 2 9 17 6 -
Total 100 100 100 100 100 100 100 100
2 Educational status (Per cent) Illiterate 8 22 16 12 8 29 4 29
Primary 28 46 36 34 8 29 22 29
Matric 48 24 40 42 56 28 35 14
Secondary 4 2 4 6 8 10 10 14
Higher 12 6 4 6 20 4 29 14
Total 100 100 100 100 100 100 100 100
3 Age of Head of the family (Years) (Per cent) Up to 25 Years - 2 12 6 3 6 - -
25-45 44 52 52 46 53 50 20 71
Above 45 56 46 36 48 44 44 80 29
Total 100 100 100 100 100 100 100 100
Table 3.2: Distribution of Operational holdings, sample households, Punjab, 2006-07
(Hectare/farm) Particulars Tomato
Growers Chilli Growers
Onion Growers
Cauliflower Growers
Potato Growers
Peas Growers
Kinnow Growers
Guava Growers
Owned Land 2.0
4.2 3.2 2.9 5.5 5.2 10.0 3.5
Leased- In 0.6
3.2 1.7 1.7 10.1 2.2 2.4 -
Leased- out 0.1
0.1 - - 0.1 0.03 - -
Total operational holdings
2.5 7.3 4.9 4.6 15.5 7.37 12.4 3.5

12
3.3 Cropping pattern
Paddy was the major kharif crop grown by the tomato, chillies, onion, peas
and guava growers in the study area as it is grown on more than 48 per cent of the
NCA (Net cultivated area) during kharif season (Table 3.3). Maize was the major
kharif crop grown by the cauliflower and potato growers as it was the important
crop of the season in Hoshiarpur district of the state. Cotton was the major kharif
crop grown by the kinnow growers as it was the important crop of the season in
Firozepur district of the state. Wheat was the major rabi season crop in the study
area grown, except for potato in case of potato growers. Tomato is grown in the
rabi and summer seasons in the study area. Onion, peas and potato are the rabi
season crops while cauliflower is grown in the kharif , rabi and summer seasons
in the state. Chillies is grown in the rabi and summer seasons in the state. Fodder
is grown in more than 3 per cent of the NCA (Net cultivated area) during the season.
For kinnow and guava growers, the NCA under these crops were about 27 and 44
per cent respectively.

13
Table 3.3: Cropping Pattern of Vegetables and Fruits growers in Punjab, 2006-07
(Per cent to Net cropped area)
Crops Tomato Growers
Chilli Growers
Onion Growers
Cauliflower Growers
Potato Growers
Peas Growers
Kinnow Growers
Guava Growers
Kharif Paddy 81.5 75.8 69.6 31.1 20.8 48.1 4.2 27.6 Basmati - 4.4 - - - - - -
Maize 0.5 3.6 7.6 31.2 53.8 40.2 10.2 5.0
Cotton - - - - - - 22.9 -
Jantar - - - - 17.7 0.1 -
Sugarcane - 1.0 - 0.4 1.7 0.8 5.8 5.0
Fodder 5.9 9.6 7.5 8.2 3.3 7.6 4.2 10.4
Cauliflower 4.7 0.1 11.4 32.7 - - - 3.3
Kerela 11.3 - - - - - - -
Other
vegetables
0.3 0.1 0.5 0.6 0.6 0.2 - 5.0
Pulses - - - - - 0.2 1.0 -
Rabi
Wheat 62.9 55.6 61.5 71.9 56.5 76.0 39.3 47.7
Sunflower 4.7 14.8 6.6 1.8 18.6 6.5 - -
Maize - 9.4 - 3.4 10.1 - 3.1 -
Sugarcane - 1.0 - 0.4 1.7 0.8 5.8 5.0
Karnoli - - - - - 2.1 - -
Fodder 5.2 10.0 10.2 8.8 3.3 6.5 4.1 8.7
Potato 13.0 39.3 25.5 23.4 75.4 22.9 2.3 -
Onion 0.3 - 11.2 3.0 - - - -
Cauliflower 1.3 0.4 6.8 10.8 0.1 - - -
Tomato 21.1 0.3 0.2 0.1 - - - -
Peas - 0.1 - - - 37.1 - -
Other
vegetables
4.6 4.6 0.8 1.5 - 2.4 - -
Pulses - - - - - - 0.6 -
Summer
Cauliflower 2.8 - - - - - - -
Tomato 7.7 - - - - - - -
Chillies 0.4 5.4 - - 0.1 - - -
Other
vegetables
- - 2.2 - 1.6 - - -
Pulses 3.7 - - - - - - -
Fruits
Kinnow - - - - - - 27.3 -
Guava - - - - - - 0.69 43.5
Other fruits - - - - - - 12.9 -
Net
cropped
area (ha.)
2.5 7.3 4.9 4.6 15.5 7.37 12.4 3.5

14
Chapter 4
Economics of production for high value crops
Production of high value crops is highly input intensive in nature. It
requires higher level of expenditure on labour, fertilizer, plant protection etc. as
compared to food grains. The analysis regarding cost and returns would be
beneficial for the farmers and policy planners to know about the comparative
benefit in cultivation of these crops in the state.
4.1 Economics of production of vegetable crops
The total cost on per hectare basis was found to vary from Rs 33889 for
cauliflower to Rs 116296 for tomato. The per hectare gross returns from the tomato
cultivation were found vary from Rs 408500 for tomato to Rs 74284 for cauliflower.
The net returns were found to vary from Rs 292204 for tomato to Rs 24172 for potato.
The benefit-cost ratio was also found to be vary from 3.51 for tomato to 1.43 for
potato, which shows that tomato cultivation is a very profitable venture as one
rupee invested on the cultivation of the crop fetches return of Rs. 3.51. The cost of
cultivation and associated returns have been calculated for different vegetables and
presented in Table 4.1 and Table 4.2.
i) Tomato
For tomato, the total cost on per hectare basis was found to be Rs 116296. The
variable cost components contributed about 81 per cent to the total cost. Amongst
variable cost components, the share of human labour was more than 39 per cent. It shows
that tomato cultivation is highly labour intensive. Expenses on plant protection,

15
Table 4.1: Cost of cultivation of Vegetable Crops in Punjab, 2006-07 (Rs/ha)
Sr No
Particulars
Tomato Chilli Onion Cauliflower Potato Peas
A Variable cost
For Seed and nursery raising
8662 (9.16)
1207 (1.84)
9400 (25.75)
4012 (16.36)
25707 (57.15)
5563 (24.51)
Permanent Fixtures 12478 (13.19)
- - - - -
Manures 632 (0.67)
349 (0.53)
1037 (2.84)
953 (3.89)
453 (1.01)
196 (0.86)
Fertilizers 8411 (8.89)
4217 (6.43)
3231 (8.85)
4009 (16.35)
5225 (11.62)
3332 (14.68)
Plant Protection 17804 (18.83)
7649 (11.66)
4219 (11.56)
3754 (15.31)
3400 (7.56)
1938 (8.54)
Micro Nutrients 375 (0.40)
127 (0.19)
190 (0.52)
93 (0.38)
549 (1.22)
93 (0.41)
Hired Labour 36523 (38.62)
39983 (60.97)
14695 (40.26)
7305 (29.79)
5292 (11.77)
7685 (33.86)
Family Labour 475 (0.50)
7823 (11.93)
639 (1.75)
1371 (5.59)
220 (0.49)
571 (2.52)
Machine Labour 2561 (2.71)
2311 (3.52)
2030 (5.56)
2658 (10.84)
3468 (7.71)
2981 (13.14)
Dori 3895 (4.12)
- - - - -
Interest on Working capital @12% for half of period under these crops
2754 (2.91)
1910 (2.91)
1063 (2.91)
363 (1.48)
665 (1.48)
336 (1.48)
Total variable Cost 94570 (81.32)
65576 (74.77)
36504 (73.66)
24518 (72.35)
44979 (80.61)
22695 (64.58)
B Fixed Cost
Rental value of owned land
14736 (67.83)
11302 (51.07)
6758 (51.77)
4326 (46.16)
3405 (31.48)
7581 (60.91)
Rent paid for leased-in land
4653 (21.72)
8880 (40.12)
3639 (27.87)
2541
(27.12) 6323
(58.45) 3249
(26.10)
Depreciation on farm implements and buildings
1030 (4.74)
774 (3.50)
1157 (8.86)
1024
(10.93) 424
(3.92) 603
(4.84)
Interest on fixed capital 1307 (6.02)
1176 (5.31)
1501 (11.50)
1480
(15.79) 665
(6.15) 1013 (8.14)
Total fixed cost 21726
(18.68)
22132 (25.23)
13055 (26.34)
9371
(27.65) 10817 (19.39)
12446 (35.42)
Total Cost 116296 87708 49559 33889 55796 35141 Note: Figures in parentheses for different components of variable cost and fixed cost are the per
centages to there respective totals, while the per centages to the total variable cost and fixed
cost are to the total cost

16
Table 4.2: Returns from vegetable crops in Punjab, 2006-07
(Rs./ha)
permanent fixtures and fertilisers were the other important components of the variable
cost. Amongst different fixed cost components, rental value of owned land alone
contributed more than 68 per cent to the fixed cost. The per hectare gross returns from
the tomato cultivation were found to be Rs 408500. The net returns were found to
be Rs 292204/hectare. The benefit-cost ratio was also found to be 3.51, which
shows that tomato cultivation is a very profitable venture as one rupee invested on
the cultivation of the crop fetches return of Rs. 3.51.
ii) Chillies
For chillies, the total cost on per hectare basis was found to be Rs 87708 (Table
4.1). The variable cost components contributed about 75 per cent to the total cost.
Amongst variable cost components, the share of human labour was about 73 per cent. It
shows that chillies cultivation is highly labour intensive. The growers were finding hard
to get the labour during the harvesting season and sometimes they had to incur losses due
to delayed harvesting. Expenses on plant protection, fertilisers and machine labour were
the other important components of the variable cost. Amongst different fixed cost
components, rental value of owned land alone contributed more than 51 per cent to the
Particulars Tomato Chilies Onion CauliflowerPotato Peas
Yield(qtls/ha) 817 201 256 196 224 60
Price(Rs/qtls) 500 987 535 379 357 1498
Gross returns 408500 198387 136960 74284 79968 89880
Total Variable cost 94570 65576 36504 24518 44979 22695 Total cost 116296 87708 49559 33889 55796 35141 Returns over variable cost 313930 132811 100456 49766 34989 67185
Net return 292204 110679 90401 40395 24172 54739
Benefit cost ratio 3.51 2.26 2.82 2.19 1.43 2.56
17
fixed cost. Per hectare gross returns from the chillies cultivation were found to be
Rs 198387. The net returns were found to be Rs 110679/hectare. The benefit-cost
ratio was also found to be 2.26, which shows that chillies cultivation is a very
profitable venture as one rupee invested on the cultivation of the crop fetches
return of Rs. 2.26 (Table 4.2).
iii) Onion
For onion, the total cost on per hectare basis was found to be Rs 49559 (Table
4.1). The variable cost components contributed about 74 per cent to the total cost.
Amongst variable cost components, the share of human labour was about 42 per cent. It
shows that onion cultivation is highly labour intensive. Expenses on seed and nursery
raising, plant protection and fertilisers were the other important components of the
variable cost. Amongst different fixed cost components, rental value of owned land alone
contributed about 52 per cent to the total fixed cost. Per hectare gross returns from the
onion cultivation were found to be Rs 136960. The net returns were found to be Rs
90401/hectare. The benefit-cost ratio was also found to be 2.82, which shows that
onion cultivation is a very profitable venture as one rupee invested on the
cultivation of the crop fetches return of Rs. 2.82, but crop takes more days for the
maturity (about 6 months) as compared to the other vegetables grown in the region
(Table 4.2).
iv) Cauliflower
The total cost on per hectare basis for cauliflower was found to be Rs 33889
(Table 4.1). The variable cost components contributed about 72 per cent to the total cost.
18
Amongst variable cost components, the share of human labour was about 35 per cent.
Expenses on seed and nursery raising, plant protection and fertilisers were the other
important components of the variable cost. Amongst different fixed cost components,
rental value of owned land alone contributed about 46 per cent to the total fixed cost. Per
hectare gross returns from the cauliflower cultivation were found to be Rs 74284.
The net returns were found to be Rs 40395/hectare (Table 4.2). The benefit-cost
ratio was also found to be 2.19, which shows that onion cultivation is a very
profitable venture as one rupee invested on the cultivation of the crop fetches
return of Rs. 2.19.
v) Potato
For potato, the total cost on per hectare basis was found to be Rs 55796. The
variable cost components contributed about 81 per cent to the total cost (Table 4.1).
Amongst variable cost components, the share of seed and nursery raising was about 57
per cent. Expenses on, labour, fertilisers and plant protection were the other important
components of the variable cost. Amongst different fixed cost components, rent paid for
leased in land alone contributed about 58 per cent to the total fixed cost. Per hectare
gross returns from the potato cultivation were found to be Rs 79968 (Table 4.2).
The net returns were found to be Rs 24172/hectare. The benefit-cost ratio was also
found to be 1.43, which was the least amongst different vegetables selected for the
study. Potato crop was observed to be highly sensitive in terms of the production
as well as the price risk.
19
vi) Peas
For peas, the total cost on per hectare basis was found to be Rs 35141 (Table 4.1).
The variable cost components contributed about 65 per cent to the total cost. Amongst
variable cost components, the share of human labour was about 34 per cent. Expenses on
seed and nursery raising, fertilisers and machine labour were the other important
components of the variable cost. Amongst different fixed cost components, rental value
of owned land alone contributed about 61 per cent to the total fixed cost. Per hectare
gross returns from the peas cultivation were found to be Rs 89880. The net returns
were found to be Rs 54739/hectare (Table 4.2). The benefit-cost ratio was also
found to be 2.56, which shows that onion cultivation is a very profitable venture as
one rupee invested on the cultivation of the crop fetches return of Rs. 2.56.
4.2 Economics of production for fruit crops
The cost and return during the economic life of kinnow and guava orchards has
been estimated for all the stages of cultivation of these crops at the present prices by
using standard cost concepts. The cost, gross returns for fruits were estimated by taking
sample of fruit growers representing all stages of life of the kinnow and guava orchards.
These economic parameters were valued at 2006-07 prices and therefore represented
present values of respective parameters. The commercial fruiting of kinnow and guava in
the study area was observed to be since 5th
and 4th
year respectively. Further, age groups
were framed based on the productivity pattern of these fruits over the life of the orchards.
Until the fruiting stage, the cost and return analysis were done on year-wise basis. The
productive life of the respective fruits which was 22, and 20 years for kinnow and guava,
respectively.

20
i) Kinnow
Kinnow have a long gestation period i.e. they take a long time (about 4 years) to
bear fruit on commercial basis after being planted in the field. A farmer has to incur huge
expenses on various operations before the returns start pouring in. The total cost on per
hectare basis for kinnow plantations was found to vary between Rs 47413 for the first
year to Rs. 35967 for the fourth year (Table 4.3). The higher cost of cultivation during
the first year was due to high expenses on plantation, machine and human labour. In the
first year, the variable cost components contributed about 36 per cent to the total cost.
Amongst variable cost components, the share of plantation, human labour and machine
labour was about 38, 33 and 18 per cent, respectively. Amongst different fixed cost
components, rental value of owned land alone contributed more than 75 per cent to the
total fixed cost. During the second to fourth year of plantations, the share of fixed costs
was more than 83 per cent of the total cost. After fruiting, the total cost on per hectare
basis marginally increased from Rs. 66133 for 5-7 year plantations to Rs. 66254 for 8-22
years of kinnow plantations. After fruiting, the variable cost components contributed
about 54 per cent to the total cost. Amongst variable cost components, the share of
human labour was more than 40 per cent. Expenses on fertilisers and plant protection
were the other important components of the variable cost. The average productivity of
kinnow plantations on per hectare basis was found to vary between 119q in the age group
of 5-7 to 155q in the age group of 8-22 (Table 4.4). Although, intercropping is not
recommended in guava orchards, but about 38 per cent of the sample farmers used to

21
Table 4.3: Cost of cultivation of Kinnow in Punjab, 2006-07 (Rs/ha)
Sr No Particulars/Years First Second Third Fourth 5-7 8-22
A Variable Cost
Plantation 6475
(37.62)
- - - - -
Manures 450
(2.61)
600
(16.35)
700
(15.87)
900
(15.16)
1763
(4.89)
1811
(5.05)
Fertilizers 311
(1.81)
427
(11.63)
578
(13.10)
806
(13.58)
6528
(18.11)
7694
(21.46)
Plant Protection 485
(2.82)
600
(16.35)
600
(13.60)
800
(13.47)
6376
(17.69)
7541
(21.04)
Micro Nutrients 139
(0.82)
200
(5.45)
325
(7.37)
550
(9.26)
877
(2.43)
710
(1.98)
Family Labour 238
(1.38)
85
(2.32)
90
(2.04)
120
(2.02)
137
(0.38)
272
(0.76)
Hired Labour 5457
(31.71)
1591
(43.35)
1870
(42.39)
2275
(38.32)
17052
(47.30)
14637
(40.83) Machine Labour 3155
(18.33)
60
(1.63)
120
(2.72)
150
(2.53)
1278
(3.54)
1154
(3.22) Interest on Working capital @12% for half of period under these crops
501
(2.91)
107
(2.92)
128
(2.90)
336
(5.66)
2041
(5.66)
2029
(5.66)
Total Variable cost 17211
(36.30)
3670
(10.89)
4411
(12.81)
5937
(16.51)
36052
(54.51)
35848
(54.37)
B Fixed Cost
Rental value of owned land
22831
(75.59)
22831
(76.03)
22831
(76.03)
22831
(76.03)
22831
(75.90)
22831
(75.90)
Rent paid for leased-in land
5355
(17.73)
5355
(17.83)
5355
(17.83)
5355
(17.83)
5355
(17.80)
5355
(17.80) Depreciation on farm implements and buildings
834
(2.76)
747
(2.49)
747
(2.49)
747
(2.49)
776
(2.58)
776
(2.58)
Interest on fixed capital
1182
(3.91)
1097
(3.65)
1097
(3.65)
1097
(3.65)
1119
(3.72)
1119
(3.72) Total fixed cost 30202
(63.70)
30030
(89.11)
30030
(87.19)
30030
(83.49)
30081
(45.49)
30081
(45.63) Total Cost 47413 33700 34441 35967 66133 66254 Note: Figures in parentheses for different components of variable cost and fixed cost are the per
centages to there respective totals, while the per centages to the total variable cost and fixed
cost are to the total cost

22
Table 4.4: Returns from Kinnow in Punjab, 2006-07
(Rs/hectare)
Particulars/Years First Second Third Fourth 5-7 8 -22
Yield(qtls/ha) - - - - 119 155
Price(Rs/qtls) - - - - 747 701
Gross returns 18300 16500 12700 18725 88643 108943
Total cost 47413 33700 34441 35967 66133 66254
Net return -29113 -17200 -21741 -17242 22510 42000
practice the intercropping of wheat, cowpea, moong, haldi, gram and pea in the guava
orchards till third year of plantations. The net returns from these crops were considered
while calculating the gross returns till third year of plantations. The net returns during
these years were found negative and these became positive once the commercial
production of kinnow started in the fifth year. The average net returns on per hectare
basis from kinnow plantations were found to vary between Rs. 22510 in the age group of
5-7 to Rs. 42000 in the age group of 8-22. To have a clear picture regarding the viability
of kinnow plantations, Annual average returns and Benefit cost ratios were also
calculated. The benefit cost ratio from kinnow plantations was found to be 1.46, while the
annual average returns were to the tune of Rs. 28299 per hectare, which shows the
economic worthiness of the kinnow plantations (Table 4.5).
Table 4.5: Average Costs and Returns from Kinnow and Guava in Punjab, 2006-07
(Rs/hectare)
ii) Guava
The fruit crops have a long gestation period i.e. they take a long time to bear fruit
after being planted in the field. A farmer has to incur huge expenses on various
Existing/fruits Kinnow Guava
Gross returns 89377 97361 Total cost 61079 70958 Annual returns 28299 26403 Benefit cost ratio 1.46 1.37
23
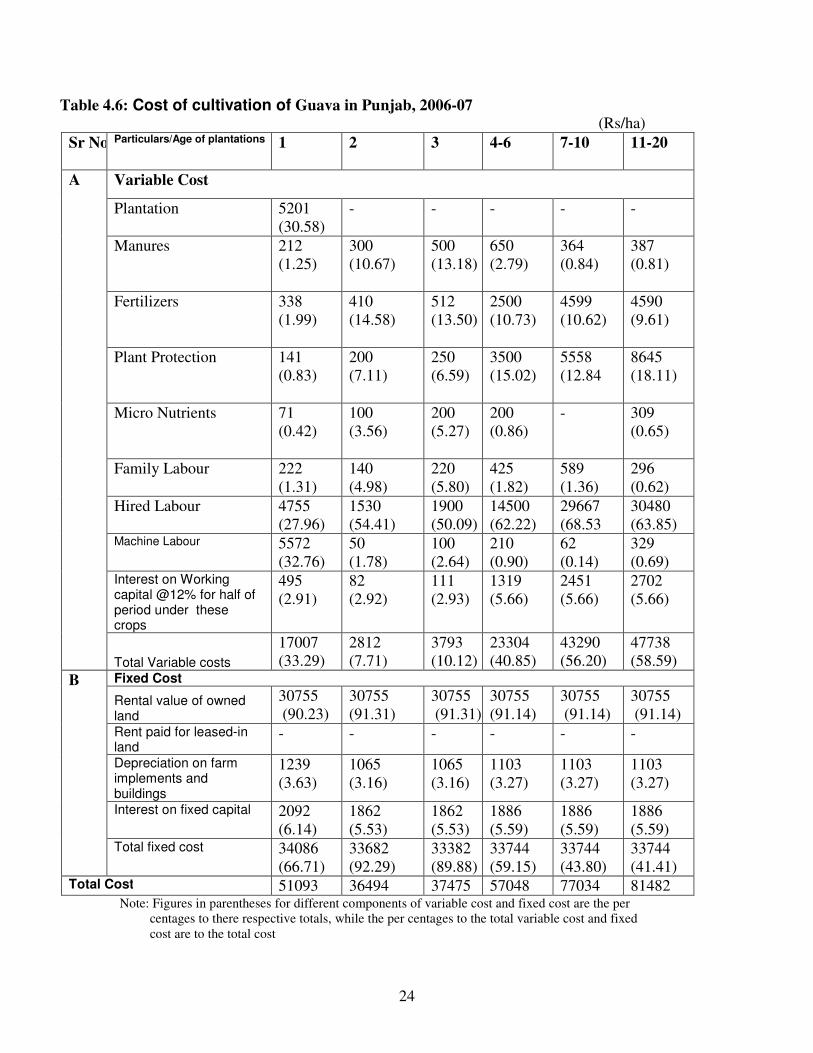
operations before the returns start pouring in. The total cost on per hectare basis for
guava plantations was found to vary between Rs 51093 for the first year to Rs. 37475 for
the third year (Table 4.6). The higher cost of cultivation during the first year is due to
high expenses on plantation, machine and human labour. In the first year, the variable
cost components contributed about 33 per cent to the total cost. Amongst variable cost
components, the share of machine labour, plantation and human labour was about 33, 31
and 29 per cent, respectively. Amongst different fixed cost components, rental value of
owned land alone contributed more than 90 per cent to the fixed cost. During the second
and third year of plantation, the share of fixed costs was more than 89 per cent of the total
cost. After fruiting, the total cost on per hectare basis increased from Rs. 57048 to Rs.
81482 with the age of plantations, which was mainly due to the increase in total variable
cost. The expenses on fertilizer, plant protection and human labour required for various
operations like pruning, harvesting etc. increased with the age of plantations. The
average productivity of guava plantations on per hectare basis was found to vary between
130q in the age group of 4-6 to 192q in the age group of 7-10 (Table 4.7). Although,
intercropping is not recommended in guava orchards, but about 24 per cent of the sample
farmers used to practice the intercropping of wheat, cowpea, moong, haldi, gram and pea
in the guava orchards till third year of plantations. The net returns from these crops were
considered while calculating the gross returns till third year of plantations. The net
24
Table 4.6: Cost of cultivation of Guava in Punjab, 2006-07 (Rs/ha)
Sr No Particulars/Age of plantations 1 2 3 4-6 7-10
11-20
A Variable Cost
Plantation 5201
(30.58)
- - - - -
Manures 212
(1.25)
300
(10.67)
500
(13.18)
650
(2.79)
364
(0.84)
387
(0.81)
Fertilizers 338
(1.99)
410
(14.58)
512
(13.50)
2500
(10.73)
4599
(10.62)
4590
(9.61)
Plant Protection 141
(0.83)
200
(7.11)
250
(6.59)
3500
(15.02)
5558
(12.84
8645
(18.11)
Micro Nutrients 71
(0.42)
100
(3.56)
200
(5.27)
200
(0.86)
- 309
(0.65)
Family Labour 222
(1.31)
140
(4.98)
220
(5.80)
425
(1.82)
589
(1.36)
296
(0.62)
Hired Labour 4755
(27.96)
1530
(54.41)
1900
(50.09)
14500
(62.22)
29667
(68.53
30480
(63.85) Machine Labour 5572
(32.76)
50
(1.78)
100
(2.64)
210
(0.90)
62
(0.14)
329
(0.69) Interest on Working capital @12% for half of period under these crops
495
(2.91)
82
(2.92)
111
(2.93)
1319
(5.66)
2451
(5.66)
2702
(5.66)
Total Variable costs
17007
(33.29)
2812
(7.71)
3793
(10.12)
23304
(40.85)
43290
(56.20)
47738
(58.59)
B
Fixed Cost
Rental value of owned land
30755
(90.23)
30755
(91.31)
30755
(91.31)
30755
(91.14)
30755
(91.14)
30755
(91.14) Rent paid for leased-in land
- - - - - -
Depreciation on farm implements and buildings
1239
(3.63)
1065
(3.16)
1065
(3.16)
1103
(3.27)
1103
(3.27)
1103
(3.27)
Interest on fixed capital 2092
(6.14)
1862
(5.53)
1862
(5.53)
1886
(5.59)
1886
(5.59)
1886
(5.59) Total fixed cost 34086
(66.71)
33682
(92.29)
33382
(89.88)
33744
(59.15)
33744
(43.80)
33744
(41.41) Total Cost 51093 36494 37475 57048 77034 81482
Note: Figures in parentheses for different components of variable cost and fixed cost are the per
centages to there respective totals, while the per centages to the total variable cost and fixed
cost are to the total cost

25
Table 4.7: Returns from Guava in Punjab, 2006-07
(Rs/hectare) Particulars/Age of plantations 1 2 3 4-6 7-10 11-20
Yield(qtls/ha) - - - 130 192 187
Price(Rs/qtls) - - - 610 643 623
Gross returns 19400 17800 13500 79300 123599 116423
Total cost 51093 36494 37475 57048 77034 81482
Net return -31693 -18694 -23975 22252 46565 34941
returns during these years were found negative and these became positive once the
commercial production of guava started in the fourth year. The average net returns on per
hectare basis from guava plantations were found to vary between Rs. 22252 in the age
group of 4-6 to Rs. 46565 in the age group of 7-10. To have a clear picture regarding the
viability of guava plantations, Annual average returns and Benefit cost ratios were also
calculated. The benefit cost ratio from guava plantations was found to be 1.37, while the
annual average returns were to the tune of Rs. 26443 per hectare, which shows the
economic worthiness of the guava plantations (Table 4.5).
4.3. Domestic Resource Cost (DRC) for vegetables
In Punjab, the govt. provides the subsidy on fertilizer as well as on power for the
irrigation. The Domestic Resource Cost (DRC) can be calculated by including these two
subsidies in the present cost analysis for the selected crops. The cost of cultivation and
associated returns, after including these two subsidy components, have been calculated
for different vegetables and presented in Table 4.8. The total cost on per hectare basis,
after including the subsidy, was found to increase of by 13 to 19 per cent for different
vegetables in the presently existing level. After including the subsidy, the expenses on
fertilisers have increased by more than 83 per cent, while the expenses on irrigation have
increased by more than Rs. 1542/ha for different vegetables from the presently existing
26
level. For different vegetables, the benefit-cost ratio was also found vary from 3.11
for tomato to 1.28 for potato, which shows that vegetable cultivation is a still very
profitable venture even after including the subsidy.
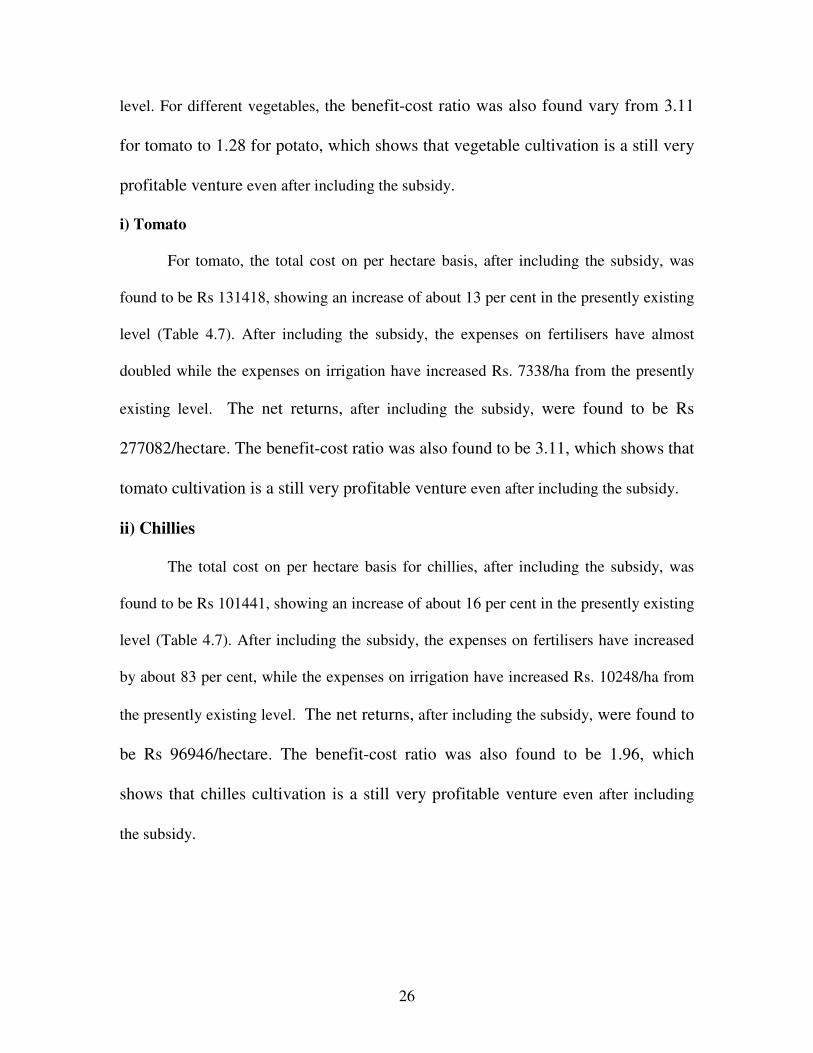
i) Tomato
For tomato, the total cost on per hectare basis, after including the subsidy, was
found to be Rs 131418, showing an increase of about 13 per cent in the presently existing
level (Table 4.7). After including the subsidy, the expenses on fertilisers have almost
doubled while the expenses on irrigation have increased Rs. 7338/ha from the presently
existing level. The net returns, after including the subsidy, were found to be Rs
277082/hectare. The benefit-cost ratio was also found to be 3.11, which shows that
tomato cultivation is a still very profitable venture even after including the subsidy.
ii) Chillies
The total cost on per hectare basis for chillies, after including the subsidy, was
found to be Rs 101441, showing an increase of about 16 per cent in the presently existing
level (Table 4.7). After including the subsidy, the expenses on fertilisers have increased
by about 83 per cent, while the expenses on irrigation have increased Rs. 10248/ha from
the presently existing level. The net returns, after including the subsidy, were found to
be Rs 96946/hectare. The benefit-cost ratio was also found to be 1.96, which
shows that chilles cultivation is a still very profitable venture even after including
the subsidy.

27
Table 4.8: Costs and returns from vegetable crops after including the subsidies in Punjab, 2006-07
(Rs/ha)
iii) Onion
The total cost on per hectare basis for onion, after including the subsidy, was
found to be Rs 58968, showing an increase of about 19 per cent in the presently existing
level (Table 4.7). After including the subsidy, the expenses on fertilisers have increased
by about 111 per cent, while the expenses on irrigation have increased Rs. 5832/ha from
the presently existing level. The net returns, after including the subsidy, were found to
be Rs 77992/hectare. The benefit-cost ratio was also found to be 2.32, which
shows that onion cultivation is a still very profitable venture even after including the
subsidy.
Crops Tomato Chilies Onion cauliflower Potato Peas
Existing costs and returns
Expenses on fertilizer 8411 4217 3231 4009 5225 3332
Expenses on irrigation 0 0 0 0 0 0
Total variable cost 94570 65576 36504 24518 44979 22695
Total cost 116296 87708 49559 33889 55796 35141
Yield(qtl/ha) 817 201 256 196 224 60
Price(Rs/qtl) 500 987 535 379 357 1498
Gross return 408500 198387 136960 74284 79968 89880
Return over variable cost
313930 132811 100456 49766 34989 67185
Net Return 292204 110679 90401 40395 24172 54739
Benefit cost ratio 3.51 2.26 2.82 2.19 1.43 2.56
Costs and returns after including the subsidies
Expenses on fertilizer 16195 7702 6808 7674 10308 6296
Expenses on irrigation 7338 10248 5832 2328 1542 1812
Total variable cost 109692 79309 45913 30511 51604 27471
Total cost 131418 101441 58968 39882 62421 39917
Yield(qtl/ha) 817 201 256 196 224 60
Price(Rs/qtl) 500 987 535 379 357 1498
Gross return 408500 198387 136960 74284 79968 89880
Return over variable cost 298808 119078 91047 43773 28364 62409
Net Return 277082 96946 77992 34402 17547 49963
Benefit cost ratio 3.11 1.96 2.32 1.86 1.28 2.25

28
iv) Cauliflower
The total cost on per hectare basis for cauliflower, after including the subsidy,
was found to be Rs 39882, showing an increase of about 18 per cent in the presently
existing level (Table 4.7). After including the subsidy, the expenses on fertilisers have
increased by about 91 per cent, while the expenses on irrigation have increased Rs.
2328/ha from the presently existing level. The net returns, after including the subsidy,
were found to be Rs 34402/hectare. The benefit-cost ratio was also found to be
1.86, which shows that cauliflower cultivation is a still very profitable venture
even after including the subsidy.
v) Potato
The total cost on per hectare basis for potato, after including the subsidy, was
found to be Rs 62421, showing an increase of about 12 per cent in the presently existing
level (Table 4.7). After including the subsidy, the expenses on fertilisers have have
almost doubled, while the expenses on irrigation have increased Rs. 1542/ha from the
presently existing level. The net returns, after including the subsidy, were found to be
Rs 17547/hectare. The benefit-cost ratio was also found to be 1.28, which shows
that potato cultivation is a still very profitable venture even after including the
subsidy.
vi) Peas
The total cost on per hectare basis for peas, after including the subsidy, was found
to be Rs 39917, showing an increase of about 14 per cent in the presently existing level
(Table 4.7). After including the subsidy, the expenses on fertilisers have increased by
about 89 per cent, while the expenses on irrigation have increased Rs. 1812/ha from the
29
presently existing level. The net returns, after including the subsidy, were found to be
Rs 49963/hectare. The benefit-cost ratio was also found to be 2.25, which shows
that peas cultivation is a still very profitable venture even after including the subsidy.
4.4 Domestic Resource Cost (DRC) for fruits
For fruits, after including the subsidy, with the increase in age of plantation the
increase in expenses on fertilizers was observed, mainly due to the use of higher doses of
fertilizers with the increase in age of plantation. The increase in total cost, after including
the subsidy, was with the increase in age of plantation. The average net returns, showed
a decrease of more than 61 per cent in the presently existing level. The benefit-cost
ratio was also found to be more than 1.24, which shows that fruit cultivation is a
still very profitable venture even after including the subsidy.
i) Kinnow
For kinnow, after including the subsidy, with the increase in age of plantation the
increase in expenses on fertilizers was observed, mainly due to the use of higher doses of
fertilizers with the increase in age of plantation. The increase in total cost, after including
the subsidy, was with the increase in age of plantation (Table 4.9). The average net
returns, after including the subsidy, were found to be Rs 17294/hectare showing a
decrease of about 61 per cent in the presently existing level (Table 4.10).. The benefit-
cost ratio was also found to be 1.24, which shows that kinnow cultivation is a still
very profitable venture even after including the subsidy.

30
Table 4.9: Costs and returns from Kinnow after including the subsidies in Punjab, 2006-07
(Rs/ha) Particulars/Age of plantations
First Second Third Fourth 5-7 8 -22
Existing costs and returns
Expenses on fertilizer
311 427 578 806 6528 7694
Expenses on irrigation
- -- - -- -- -
Total variable cost 17211 3670 4411 5937 36052 35848
Total cost 47413 33700 34441 35967 66133 66254
Yield(qtl/ha) - - - - 119 155
Price(Rs/qtl) - - - - 747 701
Gross return 18300 16500 12700 18725 88643 108943 Return over variable cost
1089 12830 8289 12788 52591 73095
Net Return -29113 -17200 -21741 -17242 22510 42689
Benefit cost ratio 0.39 0.49 0.37 0.52 1.34 1.64
Costs and returns after including the subsidies
Expenses on fertilizer
606 877 1090 1632 13054 15720
Expenses on irrigation
768 768 768 1152 2304 2304
Total variable cost 18274 4888 5691 7915 44882 46178
Total cost 48476 34918 35721 37945 74963 76259
Yield(qtl/ha) 0 0 0 0 119 155
Price(Rs/qtl) 0 0 0 0 747 701
Gross return 18300 16500 12700 18725 88643 108943
Return over variable cost
26 11612 7009 10810 43761 62765
Net Return -30176 -18418 -23021 -19220 13680 32684
Benefit cost ratio 0.38 0.47 0.36 0.49 1.18 1.43
Table 4.10: Average Costs and Returns from Kinnow and Guava in Punjab, 2006-07
(Rs/hectare)
Particulars Kinnow Guava Gross returns 89377 97361 Total cost 61079 70958 Annual returns 28299 26403 Benefit cost ratio 1.46 1.37
After including the subsidies Gross returns 89377 97361 Total cost 72083 77390 Annual returns 17294 19971 Benefit cost ratio 1.24 1.26

31
ii) Guava
For guava, after including the subsidy, with the increase in age of plantation the
increase in expenses on fertilizers was observed, mainly due to the use of higher doses of
fertilizers with the increase in age of plantation. The increase in total cost, after including
the subsidy, was with the increase in age of plantation (Table 4.11). The average net
returns, after including the subsidy, were found to be Rs 19971/hectare showing a
decrease of about 56 per cent in the presently existing level (Table 4.10).. The benefit-
cost ratio was also found to be 1.26, which shows that kinnow cultivation is a still
very profitable venture even after including the subsidy.

32
Table 4.11: Costs and returns from Guava after including the subsidies in Punjab, 2006-07
(Rs./ha)
Particulars/Age of plantations
1 2 3 4-6 7-10
11-20
Expenses on fertilizer 338 410 512 2500 4599 4590
Expenses on irrigation 0 0 0 0 0 0
Total variable cost 17007 2812 3793 23304 43290 47738
Total cost 51093 36494 37475 57048 77034 81482
Yield(qtl/ha) - - - 130 192 187
Price(Rs/qtl) - - - 610 643 623
Gross return 19400 17800 13500 79300 123599 116423
Return over variable cost 2393 14988 9707 55996 80309 68685
Net Return -31693 -18694 -23975 22252 46565 34941
Benefit cost ratio 0.38 0.49 0.36 1.39 1.60 1.43
After including the subsidies
Expenses on fertilizer 660 805 1037 6109 8798 9969
Expenses on irrigation 948 948 948 2844 2844 2844
Total variable cost 18277 4155 5266 29757 50333 55371
Total cost 52363 37837 38648 63501 84077 89115
Yield(qtl/ha) - - - 130 192 187
Price(Rs/qtl) - - - 610 643 623
Gross return 19400 17800 13500 79300 123599 116423
Return over variable cost 1123 13645 8234 49543 73266 61052
Net Return -32963 -20037 -25148 15799 39522 27308
Benefit cost ratio 0.37 0.47 0.35 1.25 1.47 1.31

33
Chapter 5
Marketing system for high value crops
Punjab farmers are getting the assured prices of paddy and wheat through
effective price policy for these crops in the state. The experts are in favour of
diversification of agriculture and cultivation of high value crops is one of the
alternatives to this, but the Punjab farmers are facing the problems during
marketing of these crops. The markets are highly volatile to the arrivals in the
market and the prices reduce tremendously whenever there is glut in the market.
5.1 Disposal pattern for vegetables
There were five marketing agencies operating in the study area which are
handling the vegetables sold by the growers. These are wholesaler, itinerant
merchant/local trader, corporate (Reliance fresh), retailer and consumer. The
proportion of produce disposed of through these agencies is shown in Table 5.1
and explained in the following paragraphs.
i) Tomato
The farmers preferably sold the tomatoes through wholesaler followed by
retailer, corporate (Reliance fresh) and consumer. About 87 per cent of the
produce was directly sold to the wholesalers (through the commission agent) by
about 96 per cent of the tomato growers. About 7 per cent of the produce was
directly sold to the retailers (through the commission agent) by about 40 per cent
of the tomato growers. Reliance fresh was also purchasing about 6 per cent of the
tomato sold by about 32 per cent of the tomato growers. They used to sell the

34
Table 5.1: Disposal pattern of vegetable crops in Punjab, 2006-07
(quantity in quintals)
Note: Figures in parentheses indicate the per cent of growers selling the produce through
a particular market functionary and in case of quantity the per cent to total produce sold
produce directly to the consumers at their outlets in the local market. Consumer
was the other agencies purchasing less than 1 per cent of the tomato sold directly
by the tomato growers. It shows that growers preferred to take their produce
directly to the wholesaler through the commission agents in the market.
ii) Chillies
Chillies were preferably sold by the farmers through wholesaler followed
by retailer and consumer. About 98 per cent of the produce was directly sold to the
wholesalers (through the commission agent) by all the tomato growers. About 2
per cent of the produce was directly sold to the retailers (through the commission
agent) by about 59 per cent of the chillies growers. Consumer was the other
agencies purchasing less than 1 per cent of the chillies sold directly by the
growers. It shows that growers preferred to take their produce directly to the
wholesaler through the commission agents in the market.
Crops wholesaler Retailer Corporate Itinerant merchant/
Local trader
Consumer Total
N0. Quantity N0. Quantity N0. Quantity N0. Quantity N0. Quantity N0. Quantity
Tomato 24 (96.0)
18158.0 (86.7)
10 (40.0)
1360.0 (6.5)
8 (32.0)
1275.0
(6.1) - - 12
(48.0) 152.0 (0.7)
25 (100.0)
20945.0 (100.0)
Chilies 46 (100.0)
3586.0 (97.6)
27 (59.0)
74.0 (2.0)
- - - - 21 (46.0)
15.45 ()
46 (100.0)
3675.45 (100.0)
Onion 21 (84.0)
2375.25 (70.1)
3 (12.0)
139.0 (4.1)
- - 5 (20.0)
833.0 (24.6)
10 (40.0)
43.0 (0.4)
25 (100.0)
3390.25 (100.0)
Cauliflower 50 (100.0)
10164.50 (96.1)
25 (50.0)
289.0 (2.7)
- - - - 15 (30.0)
123.5 (1.3)
50 (100.0)
10577.0 (100.0)
Potato 31 (86.0)
63016.0 (90.5)
14 (39.0)
390.0 (0.6)
- - 7 (19.0)
6162.5 (8.8)
17 (47.0)
77.0 (0.1)
36 (100.0)
69645.5 (100.0)
Peas 39 (81.0)
4677.25 (60.0)
19 (40.0)
232.0 (3.0)
- - 13 (27.0)
2824.0 (36.2)
22 (46.0)
60.0 (0.8)
48 (100.0)
7793.25 (100.0)
35
iii) Onion
The farmers preferably sold the onion through wholesaler followed by
itinerant merchant/local trader, retailer and consumer. About 70 per cent of the
produce was directly sold to the wholesalers (through the commission agent) by
about 84 per cent of the onion growers. Itinerant merchant/local trader was also
purchasing about 25 per cent of the produce sold by about 20 per cent of the onion
growers. They used to sell the produce in the distant market. About 4 per cent of
the produce was directly sold to the retailers (through the commission agent) by
about 12 per cent of the onion growers. Consumer was the other agencies
purchasing less than 1 per cent of the onion sold directly by the growers. It shows
that growers preferred to take their produce directly to the wholesaler through the
commission agents in the market. Itinerant merchant/local trader was also
purchasing about 25 per cent of the produce sold by the onion growers.
iv) Cauliflower
The farmers preferably sold the cauliflower through wholesaler followed by
retailer and consumer. About 96 per cent of the produce was directly sold to the
wholesalers (through the commission agent) by all the cauliflower growers. About
3 per cent of the produce was directly sold to the retailers (through the commission
agent) by about 50 per cent of the cauliflower growers. Consumer was the other
agencies purchasing about 1 per cent of the cauliflower sold directly by the
growers. It shows that growers preferred to take their produce directly to the
wholesaler through the commission agents in the market.
36
v) Potato
The farmers preferably sold the potato through wholesaler followed by itinerant
merchant/local trader, retailer and consumer. About 90 per cent of the produce was
directly sold to the wholesalers (through the commission agent) by about 86 per
cent of the potato growers. Itinerant merchant/local trader was also purchasing
about 9 per cent of the produce sold by about 19 per cent of the potato growers.
Retailer and consumer were the other agencies purchasing less than 1 per cent of
the potato sold directly by the growers. It shows that growers preferred to take
their produce directly to the wholesaler through the commission agents in the
market. Itinerant merchant/local trader was also purchasing about 19 per cent of
the produce sold by the potato growers.
vi) Peas
The farmers preferably sold the peas through wholesaler followed by
itinerant merchant/local trader, retailer and consumer. About 60 per cent of the
produce was directly sold to the wholesalers (through the commission agent) by
about 81 per cent of the peas growers. Itinerant merchant/local trader was also
purchasing about 36 per cent of the produce sold by about 27 per cent of the peas
growers. They used to sell the produce in the distant market. About 3 per cent of
the produce was directly sold to the retailers (through the commission agent) by
about 40 per cent of the peas growers. Consumer was the other agencies
purchasing less than 1 per cent of the peas sold directly by the growers. It shows
that growers preferred to take their produce directly to the wholesaler through the

37
commission agents in the market. Itinerant merchant/local trader was also
purchasing about 36 per cent of the produce sold by the peas growers.
5.2 Disposal pattern for fruits
There were four marketing agencies operating in the study area which are
handling the vegetables sold by the growers. These are pre harvest cotractor,
wholesaler, retailer and consumer. The proportion of produce disposed of through
these agencies is shown in Table 5.2 and explained in the following paragraphs.
i) Kinnow
The farmers preferably sold the kinnows through pre harvest contractor
followed by wholesaler, retailer and consumer. The pre harvest contractor were
more popular in the Hoshiarpur area as most of the producers were making the
contract with the pre harvest contractor after the fruiting of kinnow in the area.
About 74 per cent of the produce was directly sold to the pre harvest contractor by
about 62 per cent of the kinnow growers. About 26 per cent of the produce was
directly sold to the wholesalers (through the commission agent) by about 42 per
cent of the kinnow growers. Retailer and Consumer were the other agencies
purchasing less than 1 per cent of the kinnow directly sold by the kinnow growers.
It shows that growers preferred to take their produce directly to the pre harvest
contractor.
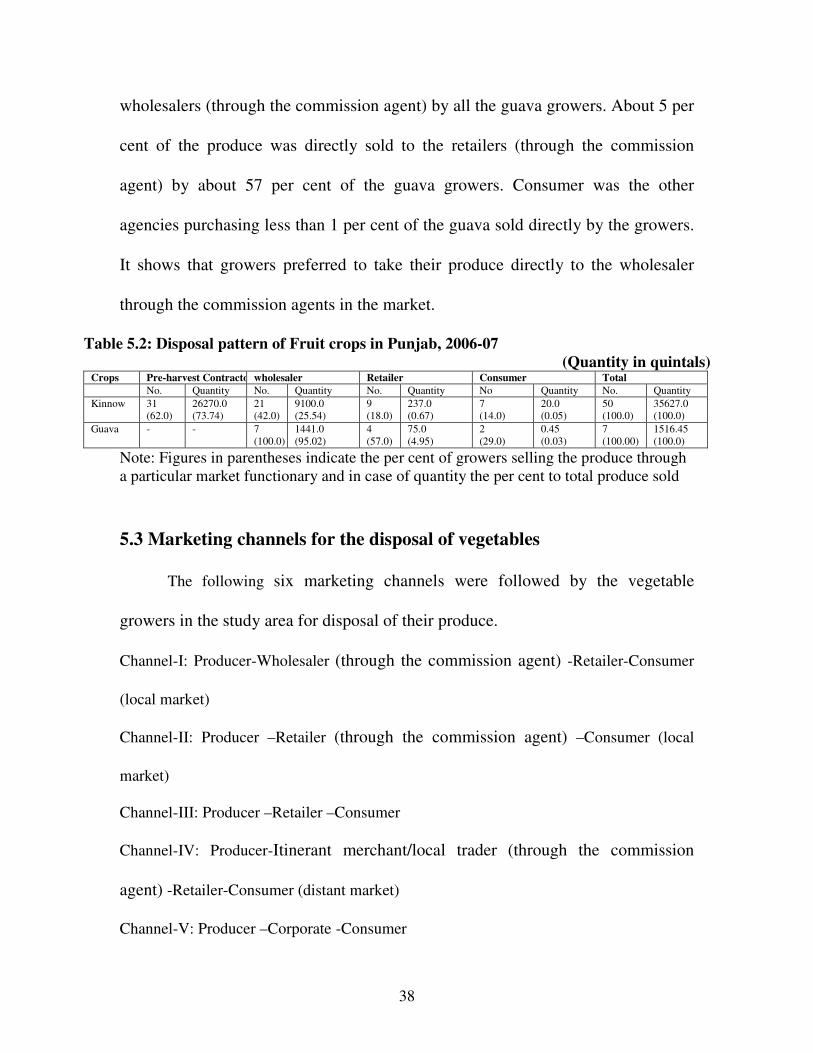
ii) Guava
The farmers preferably sold the guava through wholesaler followed by
retailer and consumer. About 95 per cent of the produce was directly sold to the
38
wholesalers (through the commission agent) by all the guava growers. About 5 per
cent of the produce was directly sold to the retailers (through the commission
agent) by about 57 per cent of the guava growers. Consumer was the other
agencies purchasing less than 1 per cent of the guava sold directly by the growers.
It shows that growers preferred to take their produce directly to the wholesaler
through the commission agents in the market.
Table 5.2: Disposal pattern of Fruit crops in Punjab, 2006-07
(Quantity in quintals) Crops Pre-harvest Contractorwholesaler Retailer Consumer Total
No. Quantity No. Quantity No. Quantity No Quantity No. Quantity
Kinnow 31
(62.0)
26270.0
(73.74)
21
(42.0)
9100.0
(25.54)
9
(18.0)
237.0
(0.67)
7
(14.0)
20.0
(0.05)
50
(100.0)
35627.0
(100.0)
Guava - - 7
(100.0)
1441.0
(95.02)
4
(57.0)
75.0
(4.95)
2
(29.0)
0.45
(0.03)
7
(100.00)
1516.45
(100.0)
Note: Figures in parentheses indicate the per cent of growers selling the produce through
a particular market functionary and in case of quantity the per cent to total produce sold
5.3 Marketing channels for the disposal of vegetables
The following six marketing channels were followed by the vegetable
growers in the study area for disposal of their produce.
Channel-I: Producer-Wholesaler (through the commission agent) -Retailer-Consumer
(local market)
Channel-II: Producer –Retailer (through the commission agent) –Consumer (local
market)
Channel-III: Producer –Retailer –Consumer
Channel-IV: Producer-Itinerant merchant/local trader (through the commission
agent) -Retailer-Consumer (distant market)
Channel-V: Producer –Corporate -Consumer
39
Channel-VI: Producer –Consumer
Channel-VI was observed to be the most efficient channel as producers were
fetching maximum price through direct sale to the consumer. The producer’s share in
consumer’s rupee was found to be the highest in channel-VI and the lowest in case of
channel-1 due to the more number of market intermediaries involved. In channel-I, the
producer sold the produce to the secondary wholesaler through commission agent which
was further sold to the retailer in the local market and finally came in the hands of
consumer. In channel-II, the producer sold the produce to the retailer through commission
agent in the local market who finally sold the produce to the consumer. In channel-III,
the producer sold the produce to the retailer who finally sold the produce to the
consumer. In channel-IV, the producer sold the produce to the Itinerant merchant/local
trader (through the commission agent) who sold it to the retailer in the distant market
who finally sold the produce to the consumer. In channel-V, the corporate purchasing
tomatoes in study area, had already made contract with the producers for the purchase of
good quality tomatoes. In channel-VI, producer sold the produce directly to the
consumer at the farm gate.
i) Tomato
In channel-I for the sale of tomato, the producer’s share in consumer’s rupee was
found to be about 43 per cent (Table 5.3). The marketing cost incurred by sample
farmers, secondary wholesaler and retailer in channel-I was Rs. 40.43/q, Rs. 43.01/q
and Rs. 57.84/q respectively. The marketing margin of secondary wholesaler and
retailer was Rs. 84.95/q and Rs. 350/q respectively. In channel-II, the producer’s share in
consumer’s rupee was found to be about 46 per cent. The marketing cost incurred by

40
producer and retailer was Rs. 43.54/q and Rs. 96.87/q respectively. The marketing
margin fetched by retailer was Rs. 390/q. In channel-III, the producer’s share in
consumer’s rupee was found to be about 51 per cent. The marketing cost incurred by
retailer was Rs. 56.47/q and the marketing margin fetched by retailer was Rs. 450/q.
In channel-V, the producer’s share in consumer’s rupee was found to the tune of about 62
per cent. The reliance fresh, the corporate purchasing tomatoes in study area, had already
made contract with the producers for the purchase of good quality tomatoes. Therefore,
the producer was getting remunerative prices for the produce and the consumer has to pay
the highest price due to the quality of tomatoes sold through the outlets. The marketing
cost incurred by corporate was Rs. 51.65/q and the marketing margin fetched by
retailer was Rs. 367/q.

41
Table 5.3: Marketing costs, margins and price spread analysis of Tomato during peak season in different Channels in Punjab, 2006-07 (Rs/qtl)
Figures in parentheses show percentage of consumer ‘price
Sr.No. Particulars Channel-I Channel-II Channel-III Channel-IV Channel-V
1 Net price received by the producer 437.47 (43.16)
450.16 (45.91)
523.43 (50.82)
678.04 (61.83)
800.26 (100.0)
Marketing costs of producer
(i) Grading and packing 2.44 (0.24)
2.48 (0.25)
- - -
(ii) Loading/unloading 4.87 (0.48)
4.77 (0.49)
- - -
(iii) Transportation 33.12 (3.27)
36.29 (3.70)
- - -
Sub-total 40.43 (3.99)
43.54 (4.44)
- - -
2 Purchase price of secondary wholesaler 477.9 (47.14)
- - - -
Costs of Secondary wholesaler
(i)Market fee 9.56 (0.94)
- - - -
(ii)Rural Development Fund 9.56 (0.94)
- -- - -
(iii)Commission charges 23.90 (2.36)
- - - -
Sub-total 43.01 (4.24)
- - - -
Net margins of secondary wholesaler 84.95 (8.38)
- - - -
3 Purchase price of Corporate - - - 678.04 (61.83)
-
Costs of Corporate
(i) Grading and packing - - - 6.15 (0.56)
-
(ii)Loading/unloading - - - 5.20 (0.47)
-
(iii)Transportation - - - 38.10 (3.47)
-
(iv) Miscellaneous - - - 2.20 (0.20)
-
Sub-total - - - 51.65 (4.71)
-
Net margins of reliance - - - 367.0 (33.46)
-
4 Purchase price of retailer 605.86 (59.77)
493.70 (50.35)
523.43 (50.82)
- -
Costs of retailer
(i) Grading and packing - - - - -
(ii)Loading/unloading 5.05 (0.50)
4.82 (0.49)
5.10 (0.50)
- -
(iii) Market fee - 9.87 (1.01)
- - -
(iv) Rural development fund - 9.87 (1.01)
- - -
(v)Commission charges - 24.69 (2.52)
- - -
(vi)Transportation 20.0 (1.97)
21.03 (2.14)
23.1 (2.24)
- -
(vii)Losses @ 5% 30.29 (2.99)
24.69 (2.52)
26.17 (2.54)
- -
(vii)Miscellaneous 2.50 (0.25)
1.90 (0.19)
2.1 (0.20)
- -
Sub-total 57.84 (5.71)
96.87 (9.88)
56.47 (5.48)
- -
Net margins of retailer 350.0 (34.53)
390.0 (39.77)
450.0 (43.69)
- -
5 Consumer’ price 1013.70 (100.0)
980.57 (100.0)
1029.90 (100.0)
1096.69 (100.0)
800.26 (100.0)
42
ii) Chillies
In channel-I for the sale of chillies, the producer’s share in consumer’s rupee was
found to be about 65 per cent (Table 5.4). The marketing cost incurred by sample
farmers, secondary wholesaler and retailer in channel-I was Rs. 57.65/q, Rs. 88.87/q
and Rs. 37.89/q respectively. The marketing margin of secondary wholesaler and
retailer was Rs. 54.90/q and Rs. 250/q respectively. In channel-II, the producer’s share in
consumer’s rupee was found to be about 65 per cent. The marketing cost incurred by
producer and retailer was Rs. 57.30/q and Rs. 126.13/q respectively. The marketing
margin fetched by retailer was Rs. 320/q. In channel-III, the producer’s share in
consumer’s rupee was found to be about 77 per cent. The marketing cost incurred by
retailer was Rs. 47/q and the marketing margin fetched by retailer was Rs. 250/q.
iii) Onion
In channel-I for the sale of onion, the producer’s share in consumer’s rupee was
found to be about 60 per cent (Table 5.5). The marketing cost incurred by sample
farmers, secondary wholesaler and retailer in channel-I was Rs. 35.23/q, Rs. 49.38/q
and Rs. 12.46/q respectively. The marketing margin of secondary wholesaler and

43
Table 5.4: Marketing costs, margins and price spread analysis of Chilies during peak season in different
Channels in Punjab, 2006-07 (Rs/qtl)
Figures in parentheses show percentage of consumer ‘price
Sr. No Particulars Channel-I Channel-II Channel-III Channel-IV
1 Net price received by the producer 928.64 (65.53)
953.49 (65.45)
1065.48 (77.07)
804.07 (100.00)
Marketing costs of producer
(i) Grading and packing 27.43 (1.94)
27.10 (1.86) - -
(ii) Loading/unloading 5.20 (0.37)
5.10 (0.35) - -
(iii) Transportation 25.02 (1.77)
25.10 (1.72) - -
Sub-total 57.65 (4.07)
57.30 (3.93) - -
2 Purchase price of secondary wholesaler 986.29 (69.60) - - -
Costs of Secondary wholesaler
(i)Market fee 19.73 (1.39) - - -
(ii)Rural Development Fund 19.73 (1.39) - - -
(iii)Commission charges 49.31 (3.48) - - -
Sub-total 88.77 (6.26) - - -
Net margins of secondary wholesaler 54.90 (3.82) - - -
3 Purchase price of retailer 1129.26 (79.69)
1010.79 (69.38)
1065.48 (77.07) -
Costs of retailer
(i) Grading and packing - -
25.0 (1.81) -
(ii)Market fee -
20.22 (1.39) - -
(iii)Rural Development Fund -
20.22 (1.39) - -
(iv)Commission charges -
50.54 (3.47) - -
(v) Loading/unloading 6.10 (0.43)
5.35 (0.37)
2.50 (0.18) -
(vi) Transportation 20.50 (1.45)
19.70 (1.35)
8.85 (0.64) -
(vii) Losses @ 1% 11.29 (0.80)
10.11 (0.69)
10.65 (0.77) -
Sub-total 37.89 (2.67)
126.13 (8.66)
47.0 (3.40) -
Net margins of retailer 250.0 (17.64)
320.0 (21.96)
270.0 (19.53) -
4 Consumer ‘price 1417.15 (100.00)
1456.92 (100.0)
1382.48 (100.00)
804.07 (100.0)
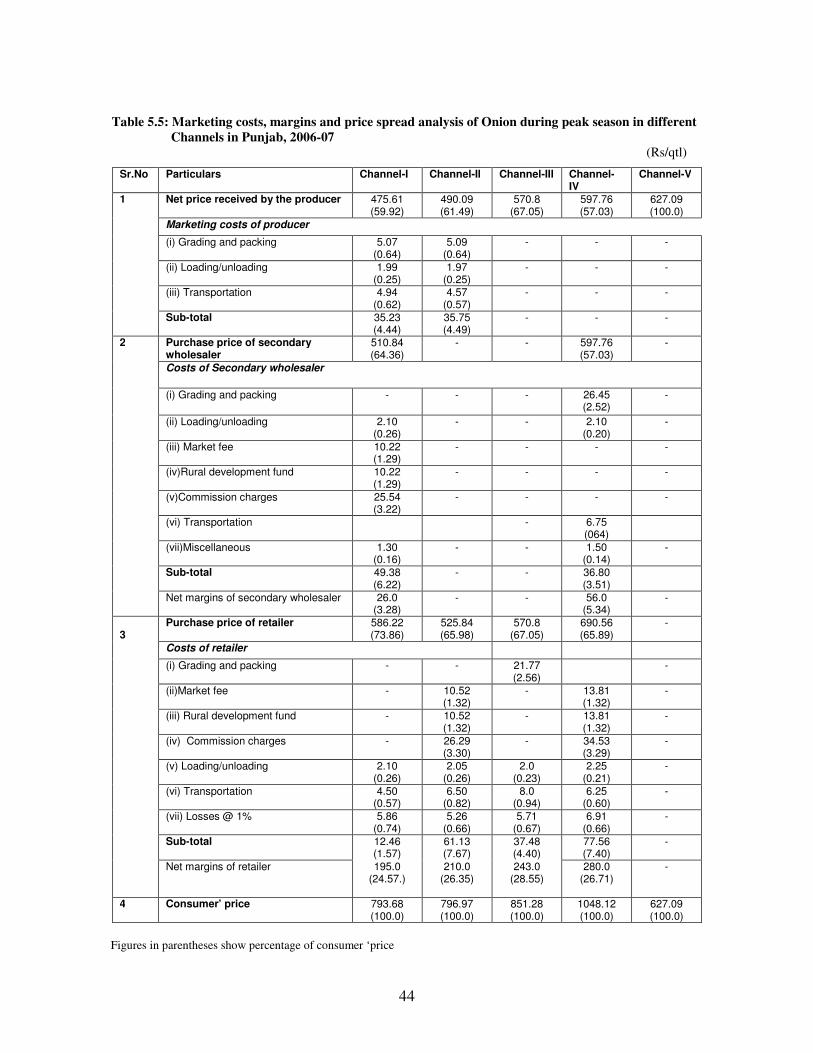
44
Table 5.5: Marketing costs, margins and price spread analysis of Onion during peak season in different
Channels in Punjab, 2006-07
(Rs/qtl)
Figures in parentheses show percentage of consumer ‘price
Sr.No Particulars Channel-I Channel-II Channel-III Channel-IV
Channel-V
1
Net price received by the producer 475.61 (59.92)
490.09 (61.49)
570.8 (67.05)
597.76 (57.03)
627.09 (100.0)
Marketing costs of producer
(i) Grading and packing 5.07 (0.64)
5.09 (0.64)
- - -
(ii) Loading/unloading 1.99 (0.25)
1.97 (0.25)
- - -
(iii) Transportation 4.94 (0.62)
4.57 (0.57)
- - -
Sub-total 35.23 (4.44)
35.75 (4.49)
- - -
2
Purchase price of secondary wholesaler
510.84 (64.36)
- - 597.76 (57.03)
-
Costs of Secondary wholesaler
(i) Grading and packing - - - 26.45 (2.52)
-
(ii) Loading/unloading 2.10 (0.26)
- - 2.10 (0.20)
-
(iii) Market fee 10.22 (1.29)
- - - -
(iv)Rural development fund 10.22 (1.29)
- - - -
(v)Commission charges 25.54 (3.22)
- - - -
(vi) Transportation - 6.75 (064)
(vii)Miscellaneous 1.30 (0.16)
- - 1.50 (0.14)
-
Sub-total 49.38 (6.22)
- - 36.80 (3.51)
Net margins of secondary wholesaler 26.0 (3.28)
- - 56.0 (5.34)
-
3
Purchase price of retailer 586.22 (73.86)
525.84 (65.98)
570.8 (67.05)
690.56 (65.89)
-
Costs of retailer
(i) Grading and packing - - 21.77 (2.56)
-
(ii)Market fee - 10.52 (1.32)
- 13.81 (1.32)
-
(iii) Rural development fund - 10.52 (1.32)
- 13.81 (1.32)
-
(iv) Commission charges - 26.29 (3.30)
- 34.53 (3.29)
-
(v) Loading/unloading 2.10 (0.26)
2.05 (0.26)
2.0 (0.23)
2.25 (0.21)
-
(vi) Transportation 4.50 (0.57)
6.50 (0.82)
8.0 (0.94)
6.25 (0.60)
-
(vii) Losses @ 1% 5.86 (0.74)
5.26 (0.66)
5.71 (0.67)
6.91 (0.66)
-
Sub-total 12.46 (1.57)
61.13 (7.67)
37.48 (4.40)
77.56 (7.40)
-
Net margins of retailer 195.0 (24.57.)
210.0 (26.35)
243.0 (28.55)
280.0 (26.71)
-
4 Consumer’ price 793.68 (100.0)
796.97 (100.0)
851.28 (100.0)
1048.12 (100.0)
627.09 (100.0)

45
retailer was Rs. 26/q and Rs. 195/q respectively. In channel-II, the producer’s
share in consumer’s rupee was found to be about 61 per cent. The marketing cost
incurred by producer and retailer was Rs. 35.75/q and Rs. 61.13/q respectively. The
marketing margin fetched by retailer was Rs. 210/q. In channel-III, the producer’s
share in consumer’s rupee was found to be about 67 per cent. The marketing cost
incurred by retailer was Rs. 37.48/q and the marketing margin fetched by retailer
was Rs. 243/q. In channel-IV, the producer’s share in consumer’s rupee was found to be
about 57 per cent. The itinerant merchant/local trader purchased the produce directly
from the producer and sold in the Chandigarh market through the commission agent.
The marketing cost incurred by Itinerant merchant/local trader and retailer was Rs.
36.80/q and Rs. 77.56/q respectively and the marketing margin fetched by
Itinerant merchant/local trader and retailer was Rs. 56/q and Rs. 280/q respectively.
iv) Cauliflower
In channel-I for the sale of cauliflower, the producer’s share in consumer’s rupee
was found to be about 52 per cent (Table 5.6). The marketing cost incurred by sample
farmers, secondary wholesaler and retailer was Rs. 12.53/q, Rs. 65.62/q and Rs.
22.59/q respectively. The marketing margin of secondary wholesaler and retailer
consumer was Rs. 40/q and Rs. 190/q respectively. In channel-II for the sale of
cauliflower, the producer’s share in consumer’s rupee was found to be about 55 per cent.
The marketing cost incurred by retailer was Rs. 77.34/q and the marketing margin
fetched by retailer was Rs. 205/q. In channel-III for the sale of cauliflower, the
producer’s share in consumer’s rupee was found to be about 65 per cent. The marketing
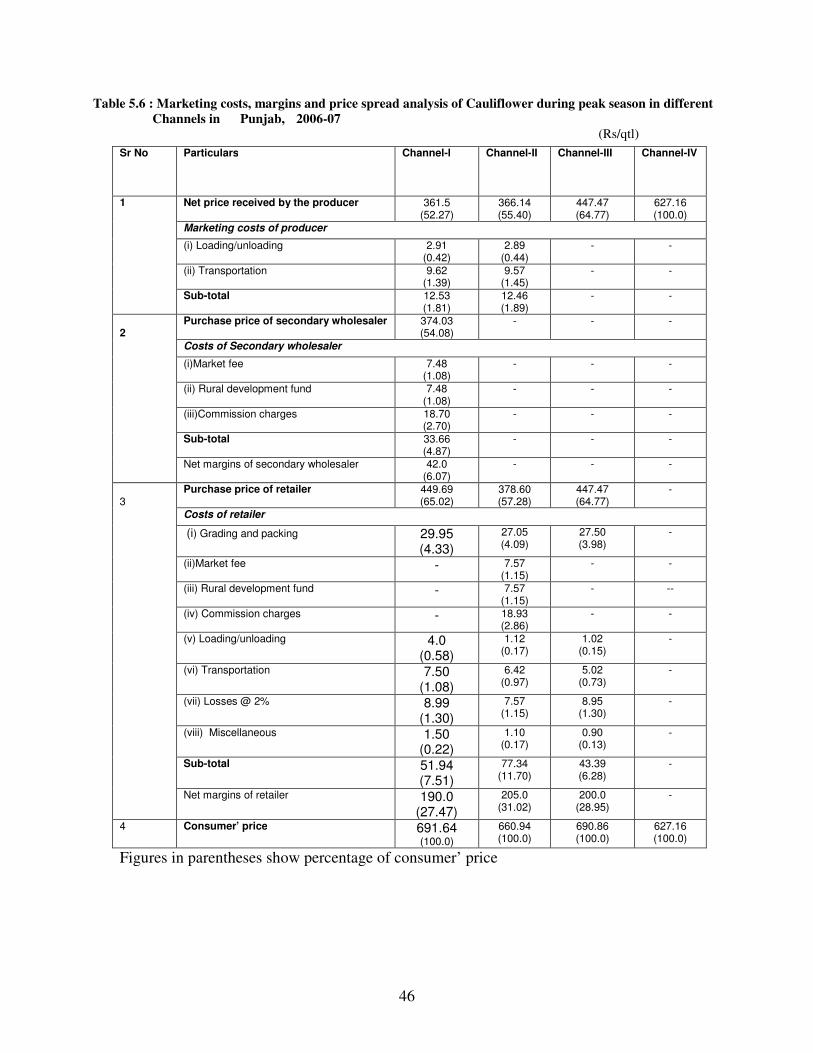
46
Table 5.6 : Marketing costs, margins and price spread analysis of Cauliflower during peak season in different
Channels in Punjab, 2006-07
(Rs/qtl)
Figures in parentheses show percentage of consumer’ price
Sr No Particulars
Channel-I Channel-II Channel-III Channel-IV
1
Net price received by the producer 361.5 (52.27)
366.14 (55.40)
447.47 (64.77)
627.16 (100.0)
Marketing costs of producer
(i) Loading/unloading 2.91 (0.42)
2.89 (0.44)
- -
(ii) Transportation 9.62 (1.39)
9.57 (1.45)
- -
Sub-total 12.53 (1.81)
12.46 (1.89)
- -
2
Purchase price of secondary wholesaler 374.03 (54.08)
- - -
Costs of Secondary wholesaler
(i)Market fee 7.48 (1.08)
- - -
(ii) Rural development fund 7.48 (1.08)
- - -
(iii)Commission charges 18.70 (2.70)
- - -
Sub-total 33.66 (4.87)
- - -
Net margins of secondary wholesaler 42.0 (6.07)
- - -
3
Purchase price of retailer 449.69 (65.02)
378.60 (57.28)
447.47 (64.77)
-
Costs of retailer
(i) Grading and packing 29.95 (4.33)
27.05 (4.09)
27.50 (3.98)
-
(ii)Market fee - 7.57 (1.15)
- -
(iii) Rural development fund - 7.57 (1.15)
- --
(iv) Commission charges - 18.93 (2.86)
- -
(v) Loading/unloading 4.0 (0.58)
1.12 (0.17)
1.02 (0.15)
-
(vi) Transportation 7.50 (1.08)
6.42 (0.97)
5.02 (0.73)
-
(vii) Losses @ 2% 8.99 (1.30)
7.57 (1.15)
8.95 (1.30)
-
(viii) Miscellaneous 1.50 (0.22)
1.10 (0.17)
0.90 (0.13)
-
Sub-total 51.94 (7.51)
77.34 (11.70)
43.39 (6.28)
-
Net margins of retailer 190.0 (27.47)
205.0 (31.02)
200.0 (28.95)
-
4 Consumer’ price 691.64 (100.0)
660.94 (100.0)
690.86 (100.0)
627.16 (100.0)
47
cost incurred by retailer was Rs. 43.39/q and the marketing margin fetched by
retailer was Rs. 200/q.
v) Potato
In channel-I for the sale of potato, the producer’s share in consumer’s rupee was
found to be about 48 per cent (Table 5.7). The marketing cost incurred by sample
farmers, secondary wholesaler and retailer was Rs. 32.11/q, Rs. 29.39/q and Rs.
17.07/q respectively. The marketing margin of secondary wholesaler and retailer
consumer was Rs. 35/q and Rs. 205/q respectively. In channel-II for the sale of potato,
the producer’s share in consumer’s rupee was found to be about 49 per cent. The
marketing cost incurred by retailer was Rs. 46.42/q and the marketing margin
fetched by retailer was Rs. 240/q. In channel-III for the sale of potato, the producer’s
share in consumer’s rupee was found to be about 59 per cent. The marketing cost
incurred by retailer was Rs. 45.46/q and the marketing margin fetched by retailer
was Rs. 225/q. In channel-IV, the producer’s share in consumer’s rupee was found to be
about 44 per cent. The itinerant merchant/local trader purchased the produce directly
from the producer and sold in the distant market (Ludhiana) through the commission
agent. The marketing cost incurred by Itinerant merchant/local trader and retailer
was Rs. 39.27/q and Rs. 51.98/q respectively and the marketing margin fetched by
Itinerant merchant/local trader and retailer was Rs. 45/q and Rs. 240/q respectively.
vi) Peas
In channel-I for the sale of peas, the producer’s share in consumer’s rupee was
found to be about 75 per cent (Table 5.8). The marketing cost incurred by sample

48
Table 5.7: Marketing costs, margins and price spread analysis of Potato during peak season in different Channels
in Punjab, 2006-07
(Rs/qtl)
Sr No Particulars Channel-I Channel-II Channel-III
Channel-IV Channel-V
1
Net price received by the producer 294.46 (48.03)
301.54 (48.60)
394.38 (59.32)
298.83 (44.27)
481.88 (100.0)
Marketing costs of producer
(i) Grading and packing 20.88 (3.41)
20.90 (3.37)
- -
(ii)Weighing/filling/sewing charges 5.24 (0.85)
5.36 (0.86)
- -
(iii) Loading/unloading 1.66 (0.27)
1.76 (0.28)
- -
(iv) Transportation 4.33 (0.71)
4.51 (0.73)
- -
Sub-total 32.11 (5.24)
32.53 (5.24)
- -
2
Purchase price of secondary wholesaler 326.57 (53.24)
- - 298.83 (44.27)
-
Costs of Secondary wholesaler
(i) Grading and packing - - - 18.90 (2.80)
-
(ii)Weighing/filling/sewing charges - - - 5.80 (0.86)
-
(iii) Loading/unloading - - - 1.7 (0.25)
-
(iv) Transportation - - - 12.87 (1.91)
-
(v)Market fee 6.53 (1.07)
- - -
(vi)Rural Development Fund 6.53 (1.07)
- - -
(vii)Commission charges 16.33 (2.66)
- - -
Sub-total 29.39 (4.71)
- - 39.27 (5.82)
-
Net margins of secondary wholesaler 35.0 (5.71)
- - 45.0 (6.67)
-
3
Purchase price of retailer 390.96
(63.78) 334.07
(53.84) 394.38
(59.32) 383.10
(56.75) -
Costs of retailer
(i) Grading and packing - - 22.0 (3.31)
-
(ii)Weighing/filling/sewing charges - - 6.10 (0.92)
-
(iii)Market fee - 6.68 (1.08)
- 7.66 (1.13)
-
(iv)Rural Development Fund - 6.68 (1.08)
- 7.66 (1.13)
-
(v)Commission charges - 16.70 (2.69)
- 19.16 (2.84)
-
(vi) Loading/unloading 1.80 (0.29)
1.75 (0.28)
1.90 (0.29)
1.82 (0.27)
-
(vii) Transportation 5.50 (0.90)
6.25 (1.01)
5.60 (0.84)
6.10 (0.90)
-
(viii) Losses @ 2.5% 9.77 (1.59)
8.35 (1.35)
9.86 (1.48)
9.58 (1.42)
-
Sub-total 17.07 (2.79)
46.42 (7.48)
45.46 (6.84)
51.98 (7.70)
-
Net margins of retailer 205.0 (3340)
240.0 (38.68)
225.00 (33.84)
240.0 (35.55)
-
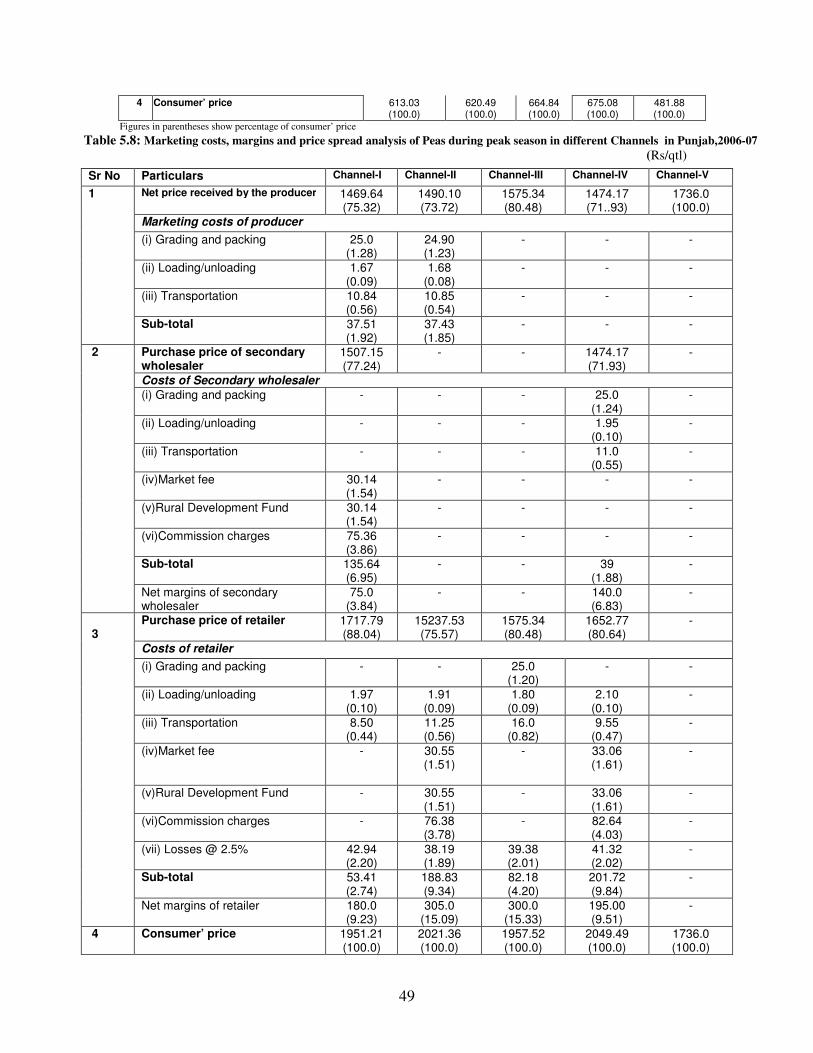
49
Figures in parentheses show percentage of consumer’ price
Table 5.8: Marketing costs, margins and price spread analysis of Peas during peak season in different Channels in Punjab,2006-07
(Rs/qtl)
4 Consumer’ price 613.03 (100.0)
620.49 (100.0)
664.84 (100.0)
675.08 (100.0)
481.88 (100.0)
Sr No Particulars Channel-I Channel-II Channel-III Channel-IV Channel-V
1
Net price received by the producer 1469.64 (75.32)
1490.10 (73.72)
1575.34 (80.48)
1474.17 (71..93)
1736.0 (100.0)
Marketing costs of producer
(i) Grading and packing 25.0 (1.28)
24.90 (1.23)
- - -
(ii) Loading/unloading 1.67 (0.09)
1.68 (0.08)
- - -
(iii) Transportation 10.84 (0.56)
10.85 (0.54)
- - -
Sub-total 37.51 (1.92)
37.43 (1.85)
- - -
2
Purchase price of secondary wholesaler
1507.15 (77.24)
- - 1474.17 (71.93)
-
Costs of Secondary wholesaler
(i) Grading and packing - - - 25.0 (1.24)
-
(ii) Loading/unloading - - - 1.95 (0.10)
-
(iii) Transportation - - - 11.0 (0.55)
-
(iv)Market fee 30.14 (1.54)
- - - -
(v)Rural Development Fund 30.14 (1.54)
- - - -
(vi)Commission charges 75.36 (3.86)
- - - -
Sub-total 135.64 (6.95)
- - 39 (1.88)
-
Net margins of secondary wholesaler
75.0 (3.84)
- - 140.0 (6.83)
-
3
Purchase price of retailer 1717.79 (88.04)
15237.53 (75.57)
1575.34 (80.48)
1652.77 (80.64)
-
Costs of retailer
(i) Grading and packing - - 25.0 (1.20)
- -
(ii) Loading/unloading 1.97 (0.10)
1.91 (0.09)
1.80 (0.09)
2.10 (0.10)
-
(iii) Transportation 8.50 (0.44)
11.25 (0.56)
16.0 (0.82)
9.55 (0.47)
-
(iv)Market fee - 30.55 (1.51)
- 33.06 (1.61)
-
(v)Rural Development Fund - 30.55 (1.51)
- 33.06 (1.61)
-
(vi)Commission charges - 76.38 (3.78)
- 82.64 (4.03)
-
(vii) Losses @ 2.5% 42.94 (2.20)
38.19 (1.89)
39.38 (2.01)
41.32 (2.02)
-
Sub-total 53.41 (2.74)
188.83 (9.34)
82.18 (4.20)
201.72 (9.84)
-
Net margins of retailer 180.0 (9.23)
305.0 (15.09)
300.0 (15.33)
195.00 (9.51)
-
4 Consumer’ price 1951.21 (100.0)
2021.36 (100.0)
1957.52 (100.0)
2049.49 (100.0)
1736.0 (100.0)

50
Figures in parentheses show percentage of consumer’ price

51
farmers, secondary wholesaler and retailer was Rs. 37.51/q, Rs. 135.64/q and
Rs. 53.41/q respectively. The marketing margin of secondary wholesaler and retailer
was Rs. 75/q and Rs. 180/q respectively. In channel-II for the sale of peas, the producer’s
share in consumer’s rupee was found to be about 74 per cent. The marketing cost
incurred by producer and retailer was Rs. 37.43/q and Rs. 188.83/q. The marketing
margin fetched by retailer was Rs. 305/q. In channel-III for the sale of peas, the
producer’s share in consumer’s rupee was found to be about 80 per cent. The marketing
cost incurred by retailer was Rs. 82.18/q and the marketing margin fetched by
retailer was Rs. 300/q. In channel-IV, the producer’s share in consumer’s rupee was
found to be about 44 per cent. The itinerant merchant/local trader purchased the
produce directly from the producer and sold in the distant market (Jalandhar) through
the commission agent. The marketing cost incurred by Itinerant merchant/local
trader and retailer was Rs. 39/q and Rs. 201/q respectively and the marketing
margin fetched by Itinerant merchant/local trader and retailer was Rs. 140/q and Rs.
195/q respectively.
5.4. Marketing channels for the disposal of fruits
i) Kinnow
The following seven marketing channels were followed by the kinnow
growers in the Abohar area for disposal of their produce.
Channel-I: Producer-Pre harvest contractor-Wholesaler (through the commission
agent) -Retailer-Consumer (Abohar market)
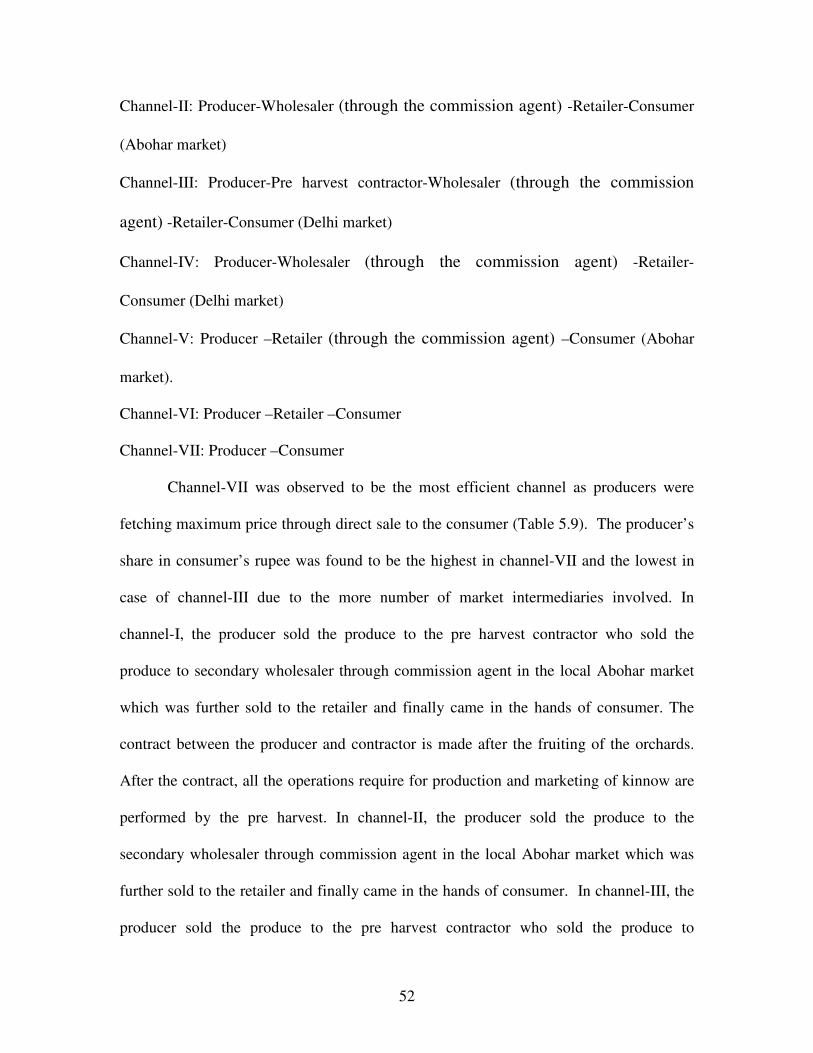
52
Channel-II: Producer-Wholesaler (through the commission agent) -Retailer-Consumer
(Abohar market)
Channel-III: Producer-Pre harvest contractor-Wholesaler (through the commission
agent) -Retailer-Consumer (Delhi market)
Channel-IV: Producer-Wholesaler (through the commission agent) -Retailer-
Consumer (Delhi market)
Channel-V: Producer –Retailer (through the commission agent) –Consumer (Abohar
market).
Channel-VI: Producer –Retailer –Consumer
Channel-VII: Producer –Consumer
Channel-VII was observed to be the most efficient channel as producers were
fetching maximum price through direct sale to the consumer (Table 5.9). The producer’s
share in consumer’s rupee was found to be the highest in channel-VII and the lowest in
case of channel-III due to the more number of market intermediaries involved. In
channel-I, the producer sold the produce to the pre harvest contractor who sold the
produce to secondary wholesaler through commission agent in the local Abohar market
which was further sold to the retailer and finally came in the hands of consumer. The
contract between the producer and contractor is made after the fruiting of the orchards.
After the contract, all the operations require for production and marketing of kinnow are
performed by the pre harvest. In channel-II, the producer sold the produce to the
secondary wholesaler through commission agent in the local Abohar market which was
further sold to the retailer and finally came in the hands of consumer. In channel-III, the
producer sold the produce to the pre harvest contractor who sold the produce to
53
secondary wholesaler through commission agent in the Delhi market which was further
sold to the retailer and finally came in the hands of consumer. In channel-IV, the
producer sold the produce to the secondary wholesaler through commission agent in the
Delhi market which was further sold to the retailer and finally came in the hands of
consumer. In channel-V, the producer sold the produce to the retailer through
commission agent in the local Abohar market and finally sold to the consumer. In
channel-VI, the producer sold the produce to the retailer who finally sold the produce to
the consumer. In channel-VII, producer sold the produce directly to the consumer at the
farm gate.
In channel-I for the sale of kinnow in Abohar block, the producer’s share in
consumer’s rupee was found to be about 38 per cent. The marketing cost incurred by
pre harvest contractor, secondary wholesaler and retailer in channel-I was Rs. 33.9/q ,
Rs. 104.60/q and Rs. 51.60/q respectively. The marketing margin of pre harvest
contractor, secondary wholesaler and retailer was Rs. 395.5/q, Rs. 215.56/q and Rs.
301/q respectively. In channel-II, the producer’s share in consumer’s rupee was found to
be about 44 per cent. The marketing cost incurred by sample farmers, secondary
wholesaler and retailer in channel-I was Rs. 39.3/q, Rs. 76.21/q and Rs. 44.55/q
respectively. The marketing margin of secondary wholesaler and retailer was Rs.
355.6/q and Rs. 475/q respectively. In channel-III for the sale of kinnow in Abohar
block, the producer’s share in consumer’s rupee was found to be about 31 per cent. The
marketing cost incurred by pre harvest contractor, secondary wholesaler and retailer in
channel-I was Rs. 281.19/q , Rs. 59.87/q and Rs. 69.94/q respectively. The
marketing margin of pre harvest contractor, secondary wholesaler and retailer was Rs.

54
Table 5.9: Marketing costs, margins and price spread analysis of Kinnow during peak season in
different Channels in Abohar, Punjab, 2006-07
(Rs/qtls)
Contd…..
Sr No
Particulars/Channels
I II III IV V VI VII
1
Net price received by the producer
682.86 (38.26)
771.4 (43.78)
689.25 (31.48)
1134.01 (53.52)
942.51 (58.63)
990.85 (67.09)
1485.0
(100.00)
Marketing costs of producer
(i)Grading and packing - 8.9 (0.51)
- 72.25 (3.41)
9.1 (0.57)
- -
(ii)Waxing - - - 41.00 (1.94)
- - -
(iii)Transportation - 17.45 (0.99)
- 50.61 (2.39)
17.82 (1.11)
- -
(iv)Octroi - - - 10.05 (0.47)
- - -
(v)Loading/unloading - 4.82 (0.27)
- 6.25 (0.29)
4.98 (0.31)
- -
(vi)Commission@6% - - - 84.79 (4.0)
- - -
(vii)Spoilage@1% - 8.11 (0.46)
- 14.13 (0.67)
9.84 (0.61)
- -
Sub-total - 39.3 (2.23)
- 279.08 (13.17)
41.74 (2.60)
- -
2
Purchase price of Pre-harvest contractor
682.86 (38.26)
- 689.25 (31.48)
- - - -
Costs of Pre-harvest contractor
(i)Grading and packing 9.80 (0.55)
- 65.64 (3.0)
- - - -
(ii)Waxing - 34.91 (1.59)
- - - -
(iii)Transportation 17.35 (0.97)
- 49.51 (2.26)
- - - -
(iv)octroi - - 9.95 (0.45)
- - - -
(v)Loading/unloading 4.25 (0.24)
- 6.75 (0.31)
- - - -
(vi)Commission@6% - -- 94.55 (4.32)
- - - -
(vii)Spoilage@1% - - 15.76 (0.72)
- - - -
(viii)Miscellaneous 2.5 (0.14)
- 4.12 (0.19)
- - - -
Sub-total 33.9 (1.90)
- 281.19 (12.84)
- - - -
Net margins of Contractor 395.5 (22.16)
- 605.36 (27.65)
- - - -

55
Figures in parentheses show percentage of consumer’ price
3
Purchase price of secondary wholesaler
1112.26 (62.31)
810.66 (46.01)
1575.80 (71.97)
1413.09 (66.70)
- - -
Costs of Secondary wholesaler
(i)Market fee 22.25 (1.25)
16.21 (0.92)
- - - -
(ii)Market fee@1% - 15.76 (0.72)
14.13 (0.67)
- -
(iii)Rural development fund 22.25 (1.25)
16.21 (0.92)
- - - -
(iv)Commission charges 55.61 (3.12)
40.53 (2.30)
- - - -
(v)loading unloading - - - - -
(vi)Quantity loss @2% - 31.52 (1.44)
28.26 (1.33)
- -
(vii)Miscellaneous 4.50 (0.25)
3.25 (0.18)
12.6 (0.58)
12.50 (0.59)
- -
Sub-total 104.60 (5.86)
76.21 (4.33)
59.87 (2.73)
54.89 (2.59)
- -
Net margins of secondary wholesaler
215.56 (12.08)
355.6 (20.18)
194.05 (8.86)
275 (12.98)
- -
4
Purchase price of retailer 1432.42 (80.25)
1242.47 (70.51)
1829.72 (83.56)
1742.98 (82.27)
984.25 (61.23)
990.85 (64.09)
-
Costs of retailer
(i)Grading and packing - - - - - 4.5 (0.29)
-
(ii)Loading/unloading 5.2 (0.29)
5.75 (0.33)
6.75 (0.31)
8.25 (0.39)
5.00 (0.31)
5.75 (0.37)
-
(iii)Market fee - - - - 19.69 (1.22)
- -
(iv)Rural development fund - - - - 19.69 (1.22)
- -
(v)Commission charges - - - - 49.21 (3.06)
- -
(vi)Transportation 14.50 (0.81)
11.45 (0.65)
19.10 (0.87)
18.75 (0.88)
11.70 (0.73)
12.5 (0.81)
-
(vii)Losses @ 2% 28.65 (1.60)
24.85 (1.41)
36.59 (1.67)
34.86 (1.65)
19.69 (1.22)
19.82 (1.28)
-
(viii)Miscellaneous 3.25 (0.18)
2.50 (0.14)
7.50 (0.34)
12.12 (0.59)
3.25 (0.20)
2.5 (0.16)
-
Sub-total 51.60 (2.89)
44.55 (2.53)
69.94 (3.19)
65.73 (3.10)
128.22 (7.98)
45.07 (2.92)
-
Net margins of retailer 301.00 (16.86)
475.00 (26.96)
290 (13.24)
310 (14.63)
495 (30.79)
510 (32.99)
-
5Consumer’ price 1785.02 (100.0)
1762.02 (100.0)
2189.67 (100.0)
2118.71 (100.0)
1607.47 (100.0)
1545.92 (100.0)
1485.0
(100.0)

56
605.36/q, Rs. 194.05/q and Rs. 290/q respectively. In channel-IV, the
producer’s share in consumer’s rupee was found to be about 54 per cent. The marketing
cost incurred by sample farmers, secondary wholesaler and retailer in channel-IV was
Rs. 279.08/q, Rs. 54.89/q and Rs. 65.73/q respectively. The marketing margin of
secondary wholesaler and retailer was Rs. 275/q and Rs. 310/q respectively. In channel-
V, the producer’s share in consumer’s rupee was found to be about 59 per cent. The
marketing cost incurred by producer and retailer was Rs. 41.74/q and Rs. 128.22/q
respectively. The marketing margin fetched by retailer was Rs. 495/q. In channel-VI,
the producer’s share in consumer’s rupee was found to be about 67 per cent. The
marketing cost incurred by retailer was Rs. 45.07/q and the marketing margin
fetched by retailer was Rs. 510/q.
The following six marketing channels were followed by the kinnow growers
in the Hoshiarpur area for disposal of their produce.
Channel-I: Producer-Pre harvest contractor-Wholesaler (through the commission
agent) -Retailer-Consumer (Hoshiarpur market)
Channel-II: Producer-Wholesaler (through the commission agent) -Retailer-Consumer
(Hoshiarpur market)
Channel-III: Producer-Pre harvest contractor-Wholesaler (through the commission
agent) -Retailer-Consumer (Delhi market)
Channel-IV: Producer –Retailer (through the commission agent) –Consumer
(Hoshiarpur market).
Channel-V: Producer –Retailer –Consumer
57
Channel-VI: Producer –Consumer
The marketing channels being followed by the kinnow growers in Hoshiarpur
area are almost similar to that of Abohar area, except that the channel of direct sale of
kinnow by the producer to the secondary wholesaler through commission agent in the
Delhi market was not existing in Hoshiarpur area (Table 5.10). Channel-VI was
observed to be the most efficient channel as producers were fetching maximum price
through direct sale to the consumer. The producer’s share in consumer’s rupee was
found to be the highest in channel-VI and the lowest in case of channel-1 due to the more
number of market intermediaries involved. In channel-I, the producer sold the produce to
the pre harvest contractor who sold the produce to secondary wholesaler through
commission agent in the local Hoshiarpur market which was further sold to the retailer
and finally came in the hands of consumer. The contract between the producer and
contractor is made after the fruiting of the orchards. After the contract, all the operations
require for production and marketing of kinnow are performed by the pre harvest. In
channel-II, the producer sold the produce to the secondary wholesaler through
commission agent in the local Hoshiarpur market which was further sold to the retailer
and finally came in the hands of consumer. In channel-III, the producer sold the produce
to the pre harvest contractor who sold the produce to secondary wholesaler through
commission agent in the Delhi market which was further sold to the retailer and finally
came in the hands of consumer. In channel-IV, the producer sold the produce to the
retailer through commission agent in the local Hoshiarpur market and finally sold to the
consumer. In channel-V, the producer sold the produce to the retailer who finally sold
the produce to

58
Table 5.10: Marketing costs, margins and price spread analysis of Kinnow during
peak season in different Channels in Hoshiarpur, Punjab, 2006-07
(Rs/qtls)
Contd..
Sr No
Particulars/Channels
I II III IV V VI
1
Net price received by the producer
619.63 (34.96)
809.17 (44.93)
666.85 (33.61)
951.30 (58.14)
990.7 (63.94)
1280.75 (100.0)
Marketing costs of producer
(i) Grading and packing - 8.35 (0.46)
- 8.95 (0.14)
- -
(ii) Transportation - 17.5 (0.97)
- 17.95 (1.10)
- -
(iii) Loading/unloading - 7.07 (0.39)
- 6.95 (0.42)
- -
(iv)Spoilage@1% - 8.51 (0.47)
- 10.05 (0.61)
- -
Sub-total - 41.4 (2.30)
- 43.90 (2.68)
- -
2
Purchase price of Pre-harvest contractor
619.63 (34.96)
- 666.85 (33.61)
- - -
Costs of Pre-harvest contractor
(i) Grading and packing 8.75 (0.49)
- 71.12 (3.58)
- - -
(ii)Waxing - - 38.25 (1.93)
- - -
(iii) Transportation 18.5 (1.04)
- 58.65 (2.96)
- - -
(iv)Octroi - - 8.72 (0.44)
- - -
(v) Loading/unloading 6.9 (0.39)
- 6.25 (0.31)
- - -
(vi)Commission@6% - - 83.41 (4.20)
- - -
(vii)Spoilage@1% - - 13.90 (0.70)
- - -
(viii)Miscellaneous 2.25 (0.13)
- 3.95 (0.20)
- - -
Sub-total 36.4 (2.05)
- 284.25 (14.32)
- - -
Net margins of Contractor 425.25 (23.99)
- 439.0 (22.12)
- - -

59
Figures in parentheses show percentage of consumer’ price
3
Purchase price of secondary wholesaler
1081.28 (61.01)
850.6 (47.23)
1390.1 (70.05)
- - -
Costs of Secondary wholesaler
(i)Market fee 21.63 (1.22)
17.01 (0.74)
- - - -
(ii)Market fee @1% - - 13.90 (0.70)
- - -
(iii)Rural Development Fund 21.63 (1.22)
17.01 (0.94)
- - - -
(iv)Commission charges 54.06 (3.05)
42.53 (2.36)
- - - -
(v) Loading/unloading - - - - - -
(vi)Quantity loss @2% - - 27.80 (1.40)
- - -
(vii)Miscellaneous 0.00 1.05 (0.06)
8.25 (0.42)
- - -
Sub-total 97.32 (3.49)
77.60 (4.31)
49.95 (2.52)
- - -
Net margins of secondary wholesaler
225.25 (12.71)
390.25 (21.67)
190.25 (9.59)
- - -
4
Purchase price of retailer 1403.85 (79.21)
1318.45 (73.20)
1630.30 (82.16)
1005.26 (61.44)
990.7 (63.94)
-
Costs of retailer
(i) Packing/grading - - - - 4.5 (0.29)
-
(ii) Loading/unloading 8.9 (0.50)
9.25 (0.51)
6.15 (0.31)
9.52 (0.58)
10.15 (0.66)
-
(iii)Market fee - - - 20.11 (1.23)
- -
(iv)Rural Development Fund - - - 20.11 (1.23)
- -
(v)Commission charges - - - 50.26 (3.07)
- -
(vi) Transportation 17.56 (0.99)
19.05 (1.06)
18.95 (0.95)
18.75 (1.15)
19.25 (1.24)
-
(vii) Losses @ 2% 28.08 (1.58)
26.37 (1.46)
32.61 (1.64)
20.11 (1.23)
19.81 (1.28)
-
(viii)Miscellaneous 1.45 (0.08)
2.50 (0.14)
6.25 (0.31)
1.75 (0.11)
2.75 (0.18)
-
Sub-total 55.99 (3.16)
57.17 (3.17)
63.96 (3.22)
140.60 (8.59)
56.46 (3.64)
-
Net margins of retailer 312.45 (17.63)
425.50 (23.62)
290.1 (14.62)
490.25 (29.96)
502.25 (32.42)
-
5Consumer’ price 1772.28 (100.0)
1801.12 (100.0)
1984.36 (100.0)
1636.11 (100.0)
1549.41 (100.0)
1280.75 (100.0)
60
the consumer. In channel-VI, producer sold the produce directly to the consumer
at the farm gate.
In channel-I for the sale of kinnow in Hoshiarpur area, the producer’s share in
consumer’s rupee was found to be about 35 per cent. The marketing cost incurred by
pre harvest contractor, secondary wholesaler and retailer in channel-I was Rs. 36.4/q ,
Rs. 97.32/q and Rs. 55.99/q respectively. The marketing margin of pre harvest
contractor, secondary wholesaler and retailer was Rs. 425.25/q, Rs. 225.25/q and Rs.
312.45/q respectively. In channel-II, the producer’s share in consumer’s rupee was found
to be about 45 per cent. The marketing cost incurred by sample farmers, secondary
wholesaler and retailer in channel-II was Rs. 41.4/q, Rs. 77.60/q and Rs. 57.17/q
respectively. The marketing margin of secondary wholesaler and retailer was Rs.
390.25/q and Rs. 425.50/q respectively. In channel-III for the sale of kinnow in
Hoshiarpur area, the producer’s share in consumer’s rupee was found to be about 34 per
cent. The marketing cost incurred by pre harvest contractor, secondary wholesaler and
retailer in channel-III was Rs. 284.25/q , Rs. 49.95/q and Rs. 63.96/q respectively.
The marketing margin of pre harvest contractor, secondary wholesaler and retailer was
Rs. 439/q, Rs. 190.25/q and Rs. 290.1/q respectively. In channel-IV, the producer’s
share in consumer’s rupee was found to be about 64 per cent. The marketing cost
incurred by producer and retailer was Rs. 43.90/q and Rs. 140.60/q respectively.
The marketing margin fetched by retailer was Rs. 490.25/q. In channel-V, the
producer’s share in consumer’s rupee was found to be about 64 per cent. The marketing

61
cost incurred by retailer was Rs. 56.46/q and the marketing margin fetched by
retailer was Rs. 502.25/q.
ii) Guava
The following four marketing channels were followed by the guava growers
for disposal of their produce.
Channel-I: Producer-Wholesaler (through the commission agent) -Retailer-Consumer
(Malerkotla market)
Channel-II: Producer–Retailer (through the commission agent)–Consumer
(Malerkotla market).
Channel-III: Producer –Retailer –Consumer
Channel-IV: Producer –Consumer
Channel-IV was observed to be the most efficient channel as producers were
fetching maximum price through direct sale to the consumer (Table 5.11). The
producer’s share in consumer’s rupee was found to be the highest in channel-VI and the
lowest in case of channel-1 due to the more number of market intermediaries involved. In
channel-I, the producer sold the produce to the secondary wholesaler through commission
agent in the local Malerkotla market which was further sold to the retailer and finally
came in the hands of consumer. In channel-II, the producer sold the produce to the
retailer through commission agent in the local Malerkotla market and finally sold to the
consumer. In channel-III, the producer sold the produce to the retailer who finally sold
the produce to the consumer. In channel-IV, producer sold the produce directly to the
consumer at the farm gate.

62
In channel-I, the producer’s share in consumer’s rupee was found to be about 65
per cent. The marketing cost incurred by sample farmers, secondary wholesaler and
retailer in channel-I was Rs. 68.12/q, Rs. 56.21/q and Rs. 30.96/q respectively. The
marketing margin of secondary wholesaler and retailer was Rs. 30/q and Rs. 110.25/q
respectively. In channel-II, the producer’s share in consumer’s rupee was found to be
about 67 per cent. The marketing cost incurred by producer and retailer was Rs.
69.38/q and Rs. 89.65/q respectively. The marketing margin fetched by retailer was
Rs. 125/q. In channel-III, the producer’s share in consumer’s rupee was found to be about
71 per cent. The marketing cost incurred by retailer was Rs. 78.63/q and the
marketing margin fetched by retailer was Rs. 170.45/q.
.

63
Table 5.11: Marketing costs, margins and price spread analysis of Guava during peak season in different Channels in Punjab,2006-07
(Rs/qtl) Sr No Particulars Channel-I Channel-II Channel-III Channel-IV
1
Net price received by the producer 596.80 (58.41)
609.77 (61.86)
610.15 (66.03)
750.0 (100.0)
Marketing costs of producer
(i) Packing/grading 7.55 (0.74)
8.25 (0.84)
- -
(ii) Loading/unloading 5.0 (0.49)
4.9 (0.50)
- -
(iii) Transportation 15.15 (1.48)
15.23 (1.54)
- -
Sub-total 27.70 (2.71)
28.38 (2.88)
- -
2
Purchase price of secondary wholesaler 624.5 (61.12)
- - -
Costs of Secondary wholesaler
(i)Market fee 12.49 (1.22)
- - -
(ii)Rural Development Fund 12.49 (1.22)
- - -
(iii)Commission charges 31.23 (3.06)
- - -
Sub-total 56.21 (5.50)
- - -
Net margins of secondary wholesaler 110.25 (10.79)
- - -
3 Purchase price of retailer 771.21 (77.41)
638.15 (6.73)
610.15 (66.03)
-
Costs of retailer
(i) Packing/grading - - 6.75 (0.73)
-
(ii)Market fee - 12.76 (1.29)
- -
(iii)Rural Development Fund - 12.76 (1.29)
- -
(iv)Commission charges - 31.91 (3.24)
- -
(v) Loading/unloading 5.5 (0.54)
5.70 (0.58)
5.4 (0.58)
-
(vi) Transportation 10.00 (0.98)
11.25 (1.14)
10.90 (1.18)
-
(vii) Losses @ 2% 15.82 (1.55)
12.76 (1.29)
12.20 (1.32)
-
(viii)Miscellaneous 1.25 (0.12)
2.50 (0.25)
0.00
-
Sub-total 32.17 (3.19)
89.65 (9.09)
35.25 (3.82)
-
Net margins of retailer 198.25 (19.40)
258.0 (26.17)
278.60 (30.15)
-
4 Consumer’ price 1021.77 (100.0)
985.80 (100.0)
924.0 (100.0)
750.0 (100.0)
Figures in parentheses show percentage of consumer’ price

64
Chapter 6
Problems faced by growers of high value crops
High value crop production requires the intensive use of inputs and is
highly susceptible to the attack of insect, pest and diseases. On the marketing
front, these being highly perishable in nature requires immediate disposal. The
price in the market fluctuates vigorously with the supply in market. This chapter is
devoted to assess the production and marketing problems faced by the tomato
growers and the pertinent suggestions forwarded by them during production and
marketing process in the study region.
6.1 Production problems
A cursory glance on Table 6.1 reveals that most of the high value
crops growers were facing the difficulty due to deficiency in technical know how
as the extension worker hardly visit the high value crops growers. More than 57
per cent of the fruit growers were facing the problems of supply of spurious
seedlings in the study area. Farmers were also facing the problem of the poor
quality of pesticides, as even after the frequent sprays of pesticides they were not
able to reduce the losses due to the attack of insect pest and diseases. More than 64
per cent of the potato and cauliflower growers were facing the problem of
infestation of these crop by various insect pest and diseases. In some of the areas,
the infestation is so severe that it may reduce the yield up to 30 per cent. Some of
the growers were also concerned about the increasing cost of inputs. About 80 per

65
Table 6.1: Problems faced during production of different vegetable and fruit crops in Punjab, 2006-07
(per cent multiple response) Problems/Crops Tomato Chilies Onion Cauliflower Potato Peas Kinnow Guava
1.Seed quality 16 - - 24 - - 76 57
2.Input delivery - - - - 8 - - -
3.Expenditure on production
28 4 - 38 28 - 36 14
4.Insect-pests and diseases
20 7 16 64 72 4 38 29
5.Technical knowledge 76 76 72 64 53 58 68 43
6.Access to credit - - - - - - - -
7.Availability and cost of labour
40 85 16 12 28 21 32 57
cent of the chillies growers were facing the problem of shortage of labour force
during peak season.
6.2 Marketing problems
Lack of market information was reported as the major marketing problem
confronted by high value growers of the study area (Table 6.2). The price in the
market abruptly changes with the arrivals in the market. Whenever there is glut in
the market, the prices comes down and farmers find it very difficult to dispose of
the produce at the remunerative prices in the market. Small farmers were most
severely hit followed by medium and large farmers during such situation.
Therefore, most of the fruit growers had to sell threir orchards to the pre harvest
contractors. Farmers disposing of the high value crops in wholesale markets were
experiencing the problem of congestion in the market, as the markets are located
in the center of the city. Farmers also told that they had to bear large grading and
packing cost while selling the produce in the market. Farmers could sell only
meager quantity to retailers due to high packing and transportation cost. Large

66
farmers were reluctant for direct sale to consumer due to shortage of manpower
and longer time required for marketing of the produce in this manner.
Table 6.2: Problems faced during marketing of different vegetable and fruit crops in Punjab, 2006-07
(per cent multiple response)
Problems/Crops Tomato Chilies Onion Cauliflower Potato Peas Kinnow Guava
1.Market information
12 - 48 - 44 - 78 57
2.Output price related problems
52 - - 56 56 - 64 71
3.Packing material - - - - - - 20
4.Grading - - - - - - 54 57
5.Waxing - - - - - - 70 -
6.Packaging - - - - - - 30 -
7.Transportation 12 - - - - - 20 -
8.Cogestion in the market
40 - 9 52 50 44 44 -
9.Delay in payments - - - - - - - -
10.Marketing costs - - - - - - 20 -
11. Role of intermediaries
16 - 24 20 - - 38 -
67
Chapter 7
Summary and conclusions
Declining farm incomes, almost stagnant foodgrain production and growing
demand for high value crops like fruits and vegetables due to increase in per capita
income and changes in the consumption pattern call for increase in the production of high
value crops. The costs and returns analysis for various high-value crops will be helpful to
examine the relative profitability of these crops with respect to traditional food grain
crops. The momentum for the increased production of high-value crops cannot be
sustained unless simultaneous efforts are made to improve marketing of these crops
through the development of effective marketing system and marketing agencies. The
farmers will get the remunerative prices for their surplus produce only when the effective
and efficient marketing system is in place. It is also important to study the Domestic
Resource Cost (DRC) of different high value crops so that the comparative export
competitiveness of these crops from this region may be ascertained, keeping in view the
various government incentives/subsidies and social costs. The experience of the
initiatives taken for the promotion of these crops through contract/co-operative/corporate
farming will be helpful to identify the factors responsible for the success/failure of these
programmes and to explore the possibilities of their strengthening and replication in the
other areas.
The study was carried out to accomplish the following objectives:
1. To estimate the costs of production and returns associated with the cultivation of
important high-value crops;

68
2. To identify the value chain systems and to estimate the costs and returns at each
link for these high-value crops;
3. To ascertain the Domestic Resource Cost (DRC) for important high value crops;
4. To highlight the case studies of contract/co-operative/corporate farming for
important high value crops;
5. To study the problems faced by the producers in production and marketing of these
high-value crops.
Methodology
The study was conducted in the Punjab state. High-value crops in this study included
important fruits and vegetables in the state. The present study focused on two important
fruit crops in the state namely Kinnow and Guava. Further six vegetable crops were
covered in the study such as peas, potato, onion, cauliflower, tomato and chillies. The
study wasbe based on primary as well as secondary data. The primary data were collected
from the growers and different market functionaries associated with the production and
marketing of fruits and vegetables in the selected states of the country. For each of the
eight selected crops, one/two districts with the highest area/production in the state were
selected purposively. Further based on the availability of the data, one/two blocks with
the largest area/production from each of the selected districts were selected to ensure
wider coverage of the sample. Village clusters were identified in each block. Finally, a
sample of up to 50 farmers were selected randomly for each of the selected crops for
primary data collection by the personal interview method.
Different marketing channels for the disposal of high value crops in the
study area were examined to assess the cost and margins of different
69
intermediaries in the marketing till the produce reaches in the hands of the
consumers. Suitable number of market functionaries were selected for the data
collection. Secondary data regarding the area under high value crops in Punjab and
its different districts and blocks were collected from the Directorate of
Horticulture, Punjab, Chandigarh.
Socio economic characteristics of high value crops growers
Most of the fruit and vegetable growers were found to be living in the joint
family system as more than 55 per cent of the farm families were having the
family size of more than 5. Literacy rate in the study area was observed to be
higher than the state and national average. It was in the range of about 71 per cent
to 96 per cent for different fruit and vegetable growers. Most of the heads of the
household were less than 45 years of age, except for the tomato and kinnow
growers, where mostly of the heads of the household were more than 45 years of
age.
The average operational holding size of fruit and vegetable growers was found
to vary between 2.5 hectares for tomato growers to 12.8 hectares for the kinnow
growers. It was strange to observe that mostly the practice of leasing in was more
prevalent among the fruit and vegetable growers while only the small area was
leased out, that’s too in some of the crops only.
Paddy was the major kharif crop grown by the tomato, chilli, onion, peas
and guava growers in the study area as it is grown on more than 48 per cent of the
NCA (Net cultivated area) during kharif season. Maize was the major kharif crop
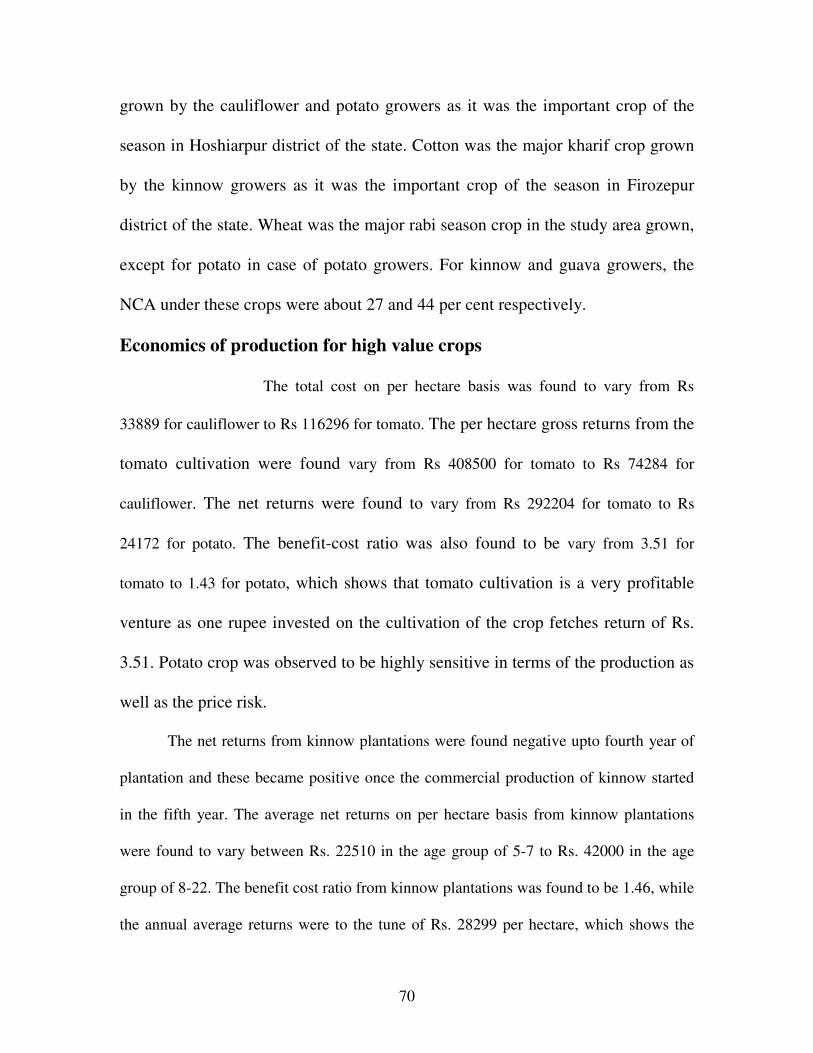
70
grown by the cauliflower and potato growers as it was the important crop of the
season in Hoshiarpur district of the state. Cotton was the major kharif crop grown
by the kinnow growers as it was the important crop of the season in Firozepur
district of the state. Wheat was the major rabi season crop in the study area grown,
except for potato in case of potato growers. For kinnow and guava growers, the
NCA under these crops were about 27 and 44 per cent respectively.
Economics of production for high value crops
The total cost on per hectare basis was found to vary from Rs
33889 for cauliflower to Rs 116296 for tomato. The per hectare gross returns from the
tomato cultivation were found vary from Rs 408500 for tomato to Rs 74284 for
cauliflower. The net returns were found to vary from Rs 292204 for tomato to Rs
24172 for potato. The benefit-cost ratio was also found to be vary from 3.51 for
tomato to 1.43 for potato, which shows that tomato cultivation is a very profitable
venture as one rupee invested on the cultivation of the crop fetches return of Rs.
3.51. Potato crop was observed to be highly sensitive in terms of the production as
well as the price risk.
The net returns from kinnow plantations were found negative upto fourth year of
plantation and these became positive once the commercial production of kinnow started
in the fifth year. The average net returns on per hectare basis from kinnow plantations
were found to vary between Rs. 22510 in the age group of 5-7 to Rs. 42000 in the age
group of 8-22. The benefit cost ratio from kinnow plantations was found to be 1.46, while
the annual average returns were to the tune of Rs. 28299 per hectare, which shows the
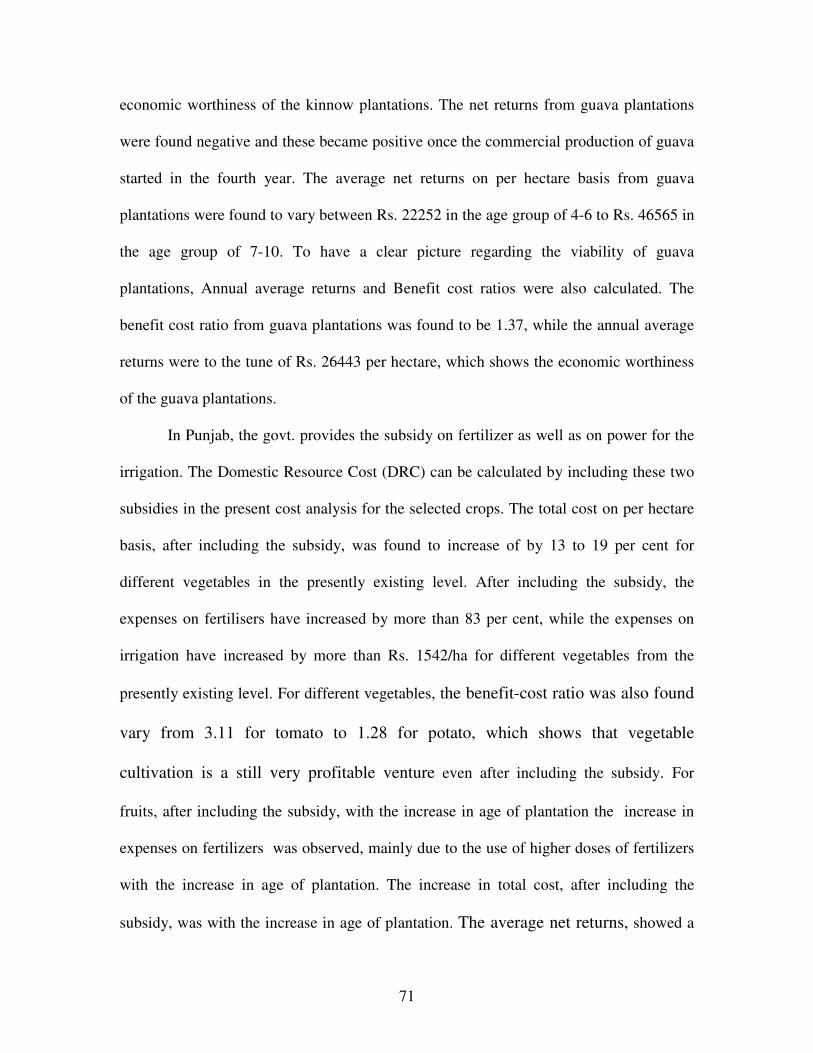
71
economic worthiness of the kinnow plantations. The net returns from guava plantations
were found negative and these became positive once the commercial production of guava
started in the fourth year. The average net returns on per hectare basis from guava
plantations were found to vary between Rs. 22252 in the age group of 4-6 to Rs. 46565 in
the age group of 7-10. To have a clear picture regarding the viability of guava
plantations, Annual average returns and Benefit cost ratios were also calculated. The
benefit cost ratio from guava plantations was found to be 1.37, while the annual average
returns were to the tune of Rs. 26443 per hectare, which shows the economic worthiness
of the guava plantations.
In Punjab, the govt. provides the subsidy on fertilizer as well as on power for the
irrigation. The Domestic Resource Cost (DRC) can be calculated by including these two
subsidies in the present cost analysis for the selected crops. The total cost on per hectare
basis, after including the subsidy, was found to increase of by 13 to 19 per cent for
different vegetables in the presently existing level. After including the subsidy, the
expenses on fertilisers have increased by more than 83 per cent, while the expenses on
irrigation have increased by more than Rs. 1542/ha for different vegetables from the
presently existing level. For different vegetables, the benefit-cost ratio was also found
vary from 3.11 for tomato to 1.28 for potato, which shows that vegetable
cultivation is a still very profitable venture even after including the subsidy. For
fruits, after including the subsidy, with the increase in age of plantation the increase in
expenses on fertilizers was observed, mainly due to the use of higher doses of fertilizers
with the increase in age of plantation. The increase in total cost, after including the
subsidy, was with the increase in age of plantation. The average net returns, showed a

72
decrease of more than 61 per cent in the presently existing level. The benefit-cost ratio
was also found to be more than 1.24, which shows that fruit cultivation is a still
very profitable venture even after including the subsidy.
Marketing system for high value crops
There were five marketing agencies operating in the study area which are
handling the vegetables sold by the growers. These are wholesaler, itinerant
merchant/local trader, corporate (Reliance fresh), retailer and consumer. There
were four marketing agencies operating in the study area which are handling the
fruits sold by the growers. These are pre harvest contractor, wholesaler, retailer
and consumer. The farmers preferably sold the kinnows through pre harvest
contractor followed by wholesaler, retailer and consumer. The pre harvest
contractor were more popular in the Hoshiarpur area as most of the producers
were making the contract with the pre harvest contractor after the fruiting of
kinnow in the area. The farmers preferably sold the guava through wholesaler
followed by retailer and consumer.
Producer –Consumer channel was observed to be the most efficient channel as
producers were fetching maximum price through direct sale to the consumer. For
vegetables, the producer’s share in consumer’s rupee was found to be the lowest in case
of channel (Producer-Wholesaler (through the commission agent) -Retailer-Consumer)
due to the more number of market intermediaries involved. For kinnow of Abohar area,
the producer’s share in consumer’s rupee was the lowest in case of channel (Producer-Pre
harvest contractor-Wholesaler (through the commission agent) -Retailer-Consumer)
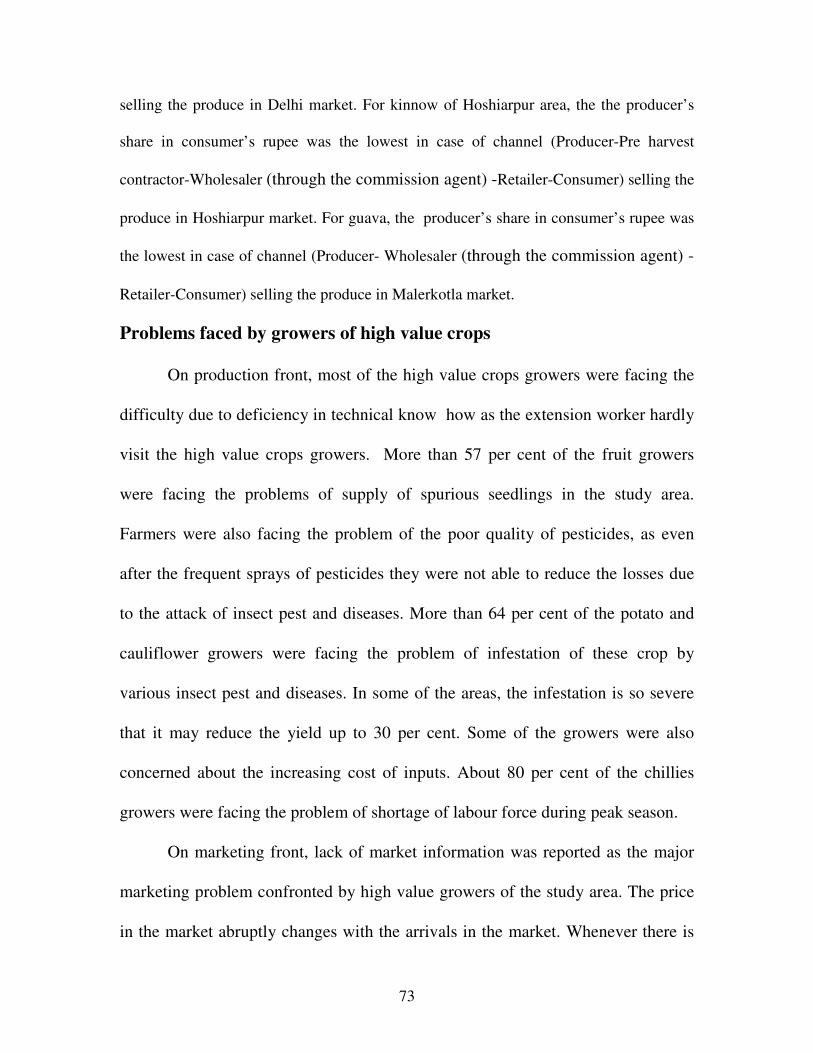
73
selling the produce in Delhi market. For kinnow of Hoshiarpur area, the the producer’s
share in consumer’s rupee was the lowest in case of channel (Producer-Pre harvest
contractor-Wholesaler (through the commission agent) -Retailer-Consumer) selling the
produce in Hoshiarpur market. For guava, the producer’s share in consumer’s rupee was
the lowest in case of channel (Producer- Wholesaler (through the commission agent) -
Retailer-Consumer) selling the produce in Malerkotla market.
Problems faced by growers of high value crops
On production front, most of the high value crops growers were facing the
difficulty due to deficiency in technical know how as the extension worker hardly
visit the high value crops growers. More than 57 per cent of the fruit growers
were facing the problems of supply of spurious seedlings in the study area.
Farmers were also facing the problem of the poor quality of pesticides, as even
after the frequent sprays of pesticides they were not able to reduce the losses due
to the attack of insect pest and diseases. More than 64 per cent of the potato and
cauliflower growers were facing the problem of infestation of these crop by
various insect pest and diseases. In some of the areas, the infestation is so severe
that it may reduce the yield up to 30 per cent. Some of the growers were also
concerned about the increasing cost of inputs. About 80 per cent of the chillies
growers were facing the problem of shortage of labour force during peak season.
On marketing front, lack of market information was reported as the major
marketing problem confronted by high value growers of the study area. The price
in the market abruptly changes with the arrivals in the market. Whenever there is
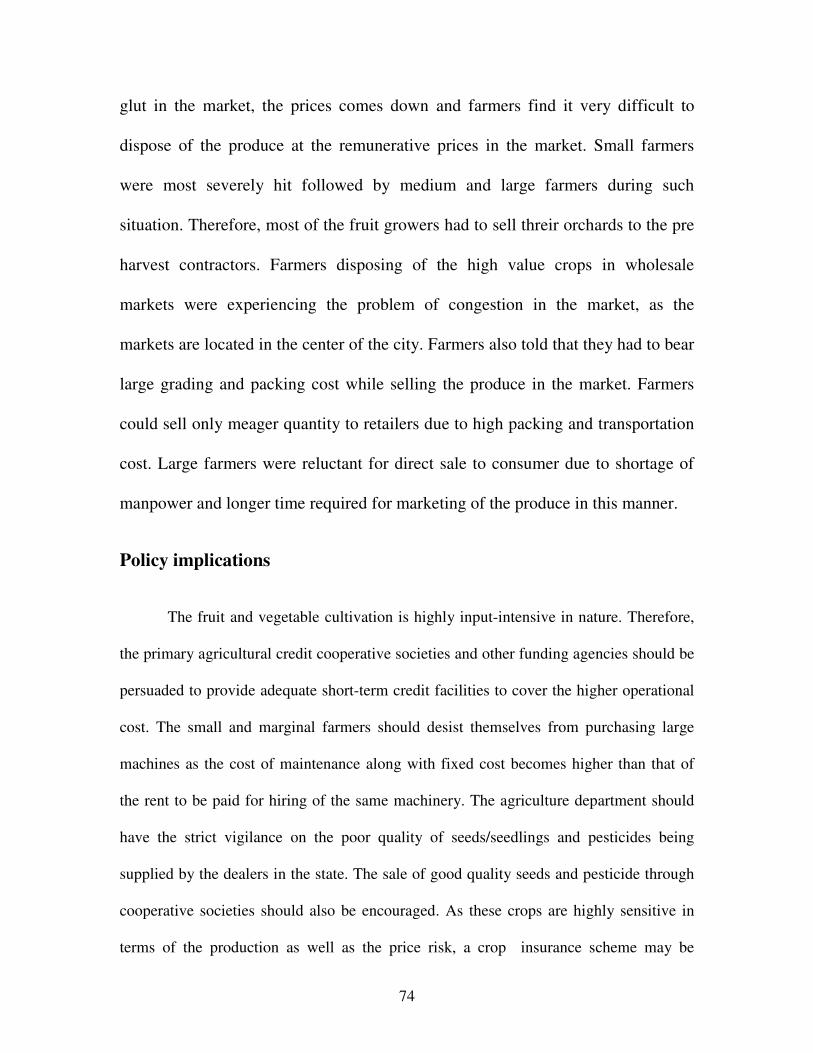
74
glut in the market, the prices comes down and farmers find it very difficult to
dispose of the produce at the remunerative prices in the market. Small farmers
were most severely hit followed by medium and large farmers during such
situation. Therefore, most of the fruit growers had to sell threir orchards to the pre
harvest contractors. Farmers disposing of the high value crops in wholesale
markets were experiencing the problem of congestion in the market, as the
markets are located in the center of the city. Farmers also told that they had to bear
large grading and packing cost while selling the produce in the market. Farmers
could sell only meager quantity to retailers due to high packing and transportation
cost. Large farmers were reluctant for direct sale to consumer due to shortage of
manpower and longer time required for marketing of the produce in this manner.
Policy implications
The fruit and vegetable cultivation is highly input-intensive in nature. Therefore,
the primary agricultural credit cooperative societies and other funding agencies should be
persuaded to provide adequate short-term credit facilities to cover the higher operational
cost. The small and marginal farmers should desist themselves from purchasing large
machines as the cost of maintenance along with fixed cost becomes higher than that of
the rent to be paid for hiring of the same machinery. The agriculture department should
have the strict vigilance on the poor quality of seeds/seedlings and pesticides being
supplied by the dealers in the state. The sale of good quality seeds and pesticide through
cooperative societies should also be encouraged. As these crops are highly sensitive in
terms of the production as well as the price risk, a crop insurance scheme may be
75
introduced to compensate the farmers, even when there is very high occurrence of pest
and diseases apart from adverse climatic conditions with a reasonable premium. The
higher growth in use of nitrogenous fertilizer has resulted into disturbance of the soil
structure in the state. The effective pricing of fertilizers not biased towards the use of a
single nutrient will help in achieving the objective of balanced fertilizer use. It further
indicates that there is need to rethink about the subsidies being provided on the nitrates.
The electricity supplied in the state was made free of cost for the Punjab farmers, which
further aggravated the shift to more water intensive crops like paddy thereby further
worsening the over exploitation of underground water resources in the State. This is also
the high time for the Government of Punjab to rethink their decision regarding free
electricity to the farms as the underground water resources are being over exploited and
the water table in the state is already going down. Also, due to this policy it is difficult to
persuade the farmers to shift from water intensive rice-wheat crop rotation.
The economists are talking about the diversification of Punjab agriculture but due
to assured prices of paddy and wheat and effective price policy for these crops has put the
farmers in a dilemma. So even if the farmer opts for diversification to break the paddy-
wheat rotation and grow any other crop including fruit and vegetable, the farmer are at
the mercy of traders to buy the produce. Thus, there is need to make more efforts to
formulate effective price policy for these crops and the Government agencies should
evolve an effective market intervention programme for these crops. The momentum of
production for fruit and vegetable cultivation in the state cannot be sustained unless there
is an effective market improvements for these crops so that the problems faced by the
farmers during marketing of these crops may be overcome.There is need to establish

76
processing units, cold storages and dry freezing plants in the areas where horticultural
crops are grown, which can help the farmers in getting remunerative returns for the
produce and can help in generation of non-farm employment opportunities in the villages
itself. Proper training should be provided to the growers in agro-processing and handling
of the produce. Regulation of markets and development of efficient market information
system will ensure better share to the producer in consumer's rupee. Strengthening of
extension services will help in creating awareness among the farmers.
77
REFERENCES
Aggarwal, M. (1999),"An Economic Analysis of Winter Vegetables Around
Ludhiana City", M.Sc.thesis (Unpublished), submitted to Punjab Agricultural
University, Ludhiana.
Chahal, S.S. (1981),"An Economic Analysis of Tomato Marketing Problems in
Punjab", M.Sc.thesis (Unpublished), submitted to Punjab Agricultural University,
Ludhiana.
Dileep, B.K., R.K.Grover and K.N.Rai (2002),"Contract Farming in Tomato: An
Economic Analysis", Indian Journal of Agricultural Economics, 57 (2): 197-210.
George, M.V. and A.J. Singh (1970),"Development of Rural Industries- A Case of
Vegetable Processing", Journal of Research, 7(3): 388-394.
Grover, D.K.; Sanjay Kumar and K. Vatta (2003), “Evaluation of post harvest losses in
tomato in Punjab”, Agro Economic Research Centre, Punjab Agricultural University,
Ludhiana.
Mann, G.S. (1967), "Marketing of Tomatoes in Punjab with Special Reference to
Ludhiana and Amritsar Markets", M.Sc.Thesis (Unpublished), submitted to PAU,
Ludhiana
Sharma, M. (2001),"Economic Evaluation of Contract Farming System for Agro-
processing Units in Punjab", M.Sc.thesis (Unpublished), submitted to Punjab
Agricultural University, Ludhianba.
Singh, G. (1999),"Economics of Summer Vegetables vis-à-vis Its Competing
Crops in Suburban Areas of Ludhiana City, M.Sc. Thesis (Unpublished), submitted
to Punjab Agricultural University, Ludhiana.
Singh, G. and M.V.George (1968),"Marketing Margins in Tomatoes in Punjab",
Agricultural Marketing, 11 (2): 16-20.
Singh, K.; D.K. Grover; K. Vatta and Sanjay Kumar (2000), "Evaluation of soft-loan
schemes for the development of post-harvest infrastructure for horticultural crops in
Punjab", Agro Economic Research Centre, Punjab Agricultural University, Ludhiana.
Singh Karam, D.K. Grover, Kamal Vatta and Sanjay Kumar (2001), "Pattern of
production and marketing of fruit crops in Punjab," Indian Journal of Agricultural
Marketing, Vol. 15(2): 8-16.
78
Singh Karam, D.K. Grover, Kamal Vatta and Sanjay Kumar, (2001), "Production and
marketing pattern of potato in Punjab," PSE Economic Analyst, Vol. 21(1-2): 45-51.
Grover, D.K., Sanjay Kumar and Kamal Vatta (2003), "Production and Marketing
Aspects of Tomato in Punjab," Journal of Agricultural Development and Policy, Vol.
15(2): 79-90.
Singh, S. (2000), "Contract Farming for Agricultural Diversification in the Indian
Punjab: A Study of Performance and Problems", Indian Journal of Agricultural
Economics, 55 (3): 283-294.

79
Appendix I: Comments on Draft Study Report entitled Value Chain
Analysis for High Value Crops (HVCs) in the Punjab State
The study is timely and useful in view of the problems associated with monoculture in Punjab. The study has covered all the four objectives given on page-3. After going through the draft report, following suggestions are offered:
1. Criteria for the selection of the districts/blocks/number of farmers covered under the study for each crop needs to be explained (page-4).
2. Suitable number of market functionaries needs to be clarified (page-5) and define average price (page-6).
3. Higher proportion of variable cost on machine labour needs some explanation (page-19).
4. Information on profitability of main crops (wheat, paddy etc.) in Punjab is available. Please add a summary table on relative profitability of food grains vis-à-vis high value crops. It would enhance utility of the report.
5. You have calculated “Domestic Resource Cost” for the selected crops. Literature is available on DRCR. Your analysis seems inadequate. Please strengthen this aspect. It is very useful for policy purposes.
6. Provide a list of tables and abbreviations used in the report. The study report is satisfactory in its coverage and analysis. I hope above suggestions will be incorporated before finalization and will be taken in the right spirit.
-sd-
Usha Tuteja
AERC, Delhi
80
Appendix II: Action Taken Report on the Comments of Draft Report entitled Value
Chain Analysis for High Value Crops (HVCs) in the Punjab State
All the comments were taken into consideration while finalizing the report. These
comments have been incorporated, wherever necessary, in the relevant chapters.
Authors