Embed Size (px)
Citation preview

With the Support of
H F M A’ S VA l u e P r o j e c t
Value in Health Care: Current State and Future Directions

o f all the transformations reshaping American
health care, none is more profound than the shift
toward value. Quality and patient satisfaction are
being factored into Medicare reimbursement, while private
payers are pushing for performance and risk-based payment
structures. At the same time, rising healthcare costs are
creating more price sensitivity among healthcare purchasers,
including government agencies, employers, and, of course,
patients themselves, who are being asked to pay higher
premiums, copayments, and deductibles for their care.
Hospitals have always cared about quality because they
are fundamentally dedicated to patient well-being. But
today’s pressures make it financially imperative to develop
collaborative approaches that combine strong clinical out-
comes with effective cost containment.
HFMA’s Value Project aims to help guide the transition
from a volume-based to a value-based healthcare payment
system. With the support of 17 leading hospitals and health
systems (listed on the inside back cover of this report), which
serve as the project’s steering committee and research
sponsors, HFMA has engaged in a series of interviews with
finance and administrative leaders and their clinical partners
at providers who are leading the transition to value, including:
Advocate Health care
Baptist Health South Florida
Baylor Health care System
Bellin Health
Bjc Healthcare
Bon Secours Health System
catholic Health east
catholic Healthcare West
cleveland clinic
Geisinger Health System
HcA – Hospital corporation
of America
Intermountain Healthcare
lee Memorial Health System
the Methodist Hospital System
New York-Presbyterian
Novant Health
Partners Healthcare
rush university Medical center
Scottsdale Healthcare
Sharp Healthcare
Spectrum Health
texas Health resources
uAB Medicine – uAB Hospital
unity Health System
About the VAlue Project
HFMA has also interviewed a range of organizations
representing the perspectives of patients, employers,
commercial payers, and government agencies, including:
the Access Project
American college of Physician executives
Blue cross Blue Shield Association
catalyst for Payment reform
HFMA-uK
Institute for Healthcare Improvement
In addition, HFMA has conducted two industry surveys,
the first on the current state of value in health care and the
second on future directions for value in health care. The
results of these interviews and surveys form the basis of this
report, which defines the concept of value in health care,
describes the current state of value and the capabilities that
are being developed by providers actively engaged in value-
based initiatives, and identifies likely future directions of a
value-based healthcare system.
This report is the first in a series of publications, educa-
tional events, and tools that will together form HFMA’s
Value Project. For additional information, visit the
Value Project website at www.hfma.org/ValueProject.

1
o f the many forces transforming our nation’s
healthcare system, none is more significant
than the turn from payment based on volume
to payment based on value. Value is driving a fundamental
reorientation of the healthcare system around the quality
and cost-effectiveness of care, for, as in any industry, value
in health care is defined through the relationship of these
two factors: the quality of care and the price paid for it.
Over the years, the mechanisms used to finance and
measure healthcare delivery have obstructed the ability of
patients and other purchasers of care to perceive value, as
detailed in the initial sections of this report. A payment
system in which a combination of employer contributions
and government funding is the dominant payment source
means that patients’ out-of-pocket expenses typically bear
little relationship to the total price of care. Price controls
and cost-shifting have created different pricing structures
for different purchasers of care. Quality metrics have
focused on process-related measures that tell patients little
about the functional outcomes they might expect from care.
The move toward value is starting to push these obstruc-
tions aside. Patients, employers, government agencies, and
health plans increasingly want to know what they can expect
to receive for what they pay for care. They are seeking out
providers who will give them this information and follow
through with cost-effective care. They are, in other words,
expecting to get value.
How should providers respond to the demand for value?
In interviews with leading provider organizations across the
country and surveys of the field, HFMA has identified four
capabilities that organizations should develop to prepare
for a value-based healthcare system. These include:
•People and culture: The ability to instill a culture of
collaboration, creativity, and accountability
•Business intelligence: The ability to collect, analyze,
and connect accurate quality and financial data to support
organizational decision making
•Performance improvement: The ability to use data to
reduce variability in clinical processes and improve the
delivery, cost-effectiveness, and outcomes of care
•Contract and risk management: The ability to develop
and manage effective care networks and predict and
manage different forms of patient-related risk
executiVe SummAry
“The Current State of Value in Health Care,” which forms
the central section of this report, details essential skills within
each of these four capabilities that healthcare organizations
should begin to develop now. Organizations that are actively
working to improve the value of care offer examples of how to
develop and apply these skills. Advocate Physician Partners,
for example, provides a non-employment model of physician
engagement for the people and culture capability, while
Spectrum Health describes how interdisciplinary teams of
clinicians and finance staff can collaborate on creating metrics
that provide actionable data for business intelligence. Rush
University Medical Center shares its approach to identifying
variability within clinical processes to drive performance
improvement. And Sharp HealthCare describes an innovative
risk management program that helps keep capitated patients
in network and ensures the continuity of their care.
Later in the report, focus turns to “The Future State
of Value in Health Care.” This section outlines a series of
assumptions that will push the healthcare system in two
directions. The first is a trend toward greater provider
integration, as accountability for care outcomes spreads
across the care continuum. The second is a trend toward
greater assumption of risk by providers, as the healthcare
system seeks to reduce costs through better management
of population health.
The trends toward increased provider integration and
greater provider assumption of risk will not necessarily
push all healthcare organizations in the same direction.
Instead, a range of strategies will likely be available, com-
bining different degrees of integration and risk. Based on
models that are emerging today, the report highlights five
possible future value strategies that healthcare organiza-
tions could pursue, detailing key capabilities, possible
benefits, and potential challenges for each.
Throughout the research process for this report, the
healthcare organizations HFMA interviewed made reference
to the “value journey.” This report begins with where our
healthcare system is today, follows promising paths that
innovative healthcare organizations are pioneering, and
describes possible new destinations for healthcare organi-
zations in a value-based future. Like the value journey,
HFMA’s Value Project is just beginning. This report is a
first step along the way.

2

3
tAble of contentS
Defining Value. . . . . . . . . . . . . . . . . . . . . . . . . . . . . . . . . . . . . . . . . . . . . . . . . . . . . . . . . . . . . . . . . . . . . . . . . . . . . . . . . . . . . . . . . . .5
. Toward.a.Purchaser-Centered.Value.Equation . . . . . . . . . . . . . . . . . . . . . . . . . . . . . . . . . . . . . . . . . . . . . . . . . . . . . . . . . . . .6
the current State of Value in health care. . . . . . . . . . . . . . . . . . . . . . . . . . . . . . . . . . . . . . . . . . . . . . . . . . . . . . . . . . . . . . . . . . 10
. People.and.Culture. . . . . . . . . . . . . . . . . . . . . . . . . . . . . . . . . . . . . . . . . . . . . . . . . . . . . . . . . . . . . . . . . . . . . . . . . . . . . . . . . . . 12
. Business.Intelligence .. .. .. .. .. .. .. .. .. .. .. .. .. .. .. .. .. .. .. .. .. .. .. .. .. .. .. .. .. .. .. .. .. .. .. .. .. .. .. .. .. .. .. .. .. .. .. .. .. .. .. .. .. .. .. .. .. .. .. .. .. .. .. .. .. .. .. .. .. .. .. .. .. .. .. .. .. .. .. . 16
. Performance.Improvement . . . . . . . . . . . . . . . . . . . . . . . . . . . . . . . . . . . . . . . . . . . . . . . . . . . . . . . . . . . . . . . . . . . . . . . . . . .20
. Contract.and.Risk.Management. . . . . . . . . . . . . . . . . . . . . . . . . . . . . . . . . . . . . . . . . . . . . . . . . . . . . . . . . . . . . . . . . . . . . . . .24
the future State of Value in health care. . . . . . . . . . . . . . . . . . . . . . . . . . . . . . . . . . . . . . . . . . . . . . . . . . . . . . . . . . . . . . . . . . . 27
Steps to Support Value-based transformation . . . . . . . . . . . . . . . . . . . . . . . . . . . . . . . . . . . . . . . . . . . . . . . . . . . . . . . . . . . . . .36

4

5
W hat is value in health care? In most industries,
value resides at the intersection of a purchaser’s
perception of the quality of a good or service
and the amount he or she is willing to pay for that good or
service. If you had to pay $15 for a cheeseburger at a fast-
food restaurant, you would probably not think that you got
good value. But if you paid the same amount for a well-
prepared filet mignon dinner, you would probably think
you received value, just as you might in a $3 cheeseburger.
Value, in other words, is a concept of relative worth. It is a
function of quality over payment, and a product’s value is
increased by an improvement in quality, a reduction in
the amount paid, or both.
The same definition should apply in health care, and for
most commentators on the question of value in health care,
it does.1 However, measuring value in health care remains
elusive for several reasons. First, there is no clear, consensus
definition of what constitutes “quality” among providers, let
alone purchasers, for whom a “quality” outcome will often
vary according to such factors as expectations, age, and
general health. Second, in many cases, the full amount paid
1 Harvard Business School professor Michael Porter, for example, defines value in health care as outcomes (the indicator of quality in Porter’s formulation) relative to costs (the total amount paid for the full cycle of care). See Michael Porter, “What Is Value in Health Care?”, New England Journal of Medicine (Dec. 23, 2010): 2477 – 2481.
for health care is not apparent. Payment for a full episode of
care (for example, pre-acute, acute, and post-acute services
related to a surgical procedure) is made to a fragmented
collection of providers. Also, payment for care is often
divided among multiple purchasers: the patient (primary
purchaser); employers and/or state and federal programs,
such as Medicaid and Medicare (secondary purchasers);
and perhaps a health plan (serving as an intermediary
between purchasers and providers). All of these purchasers
have overlapping, but not identical, interests in the quality
and price of the care provided. And third, under the current
payment system, providers typically are not compensated for
producing value; instead, they are economically rewarded
for the volume of services they provide.
HFMA’s Value Project is intended to help healthcare
organizations create value for the multiple purchasers of
health care. In this report and in subsequent publications,
educational opportunities, and web tools produced for the
Value Project, HFMA will do the following:
•Define the practices of providers who are leading the way
toward a value-based healthcare system
•Describe the primary capabilities that healthcare organi-
zations will need to develop in the areas of people and
culture, business intelligence, performance improvement,
and contract and risk management to improve the value of
care provided
•Provide specific strategies, tactics, and tools that health-
care organizations can use to build, enhance, and com-
municate their value capabilities
•Identify the trends today that are defining the future state of
value in health care and describe new care delivery models
that could help healthcare organizations create value
Defining VAlue
THE VALUE EQUATION RECONSIDERED FOR HEALTH CARE
Value =Quality*
Payment†
* A composite of patient outcomes, safety, and experiences† The cost to all purchasers of purchasing care
6
Defining VAlue towArD A PurchASer-centereD VAlue equAtion
c reating value in health care will require bringing
payment and quality—the two factors of the value
equation—to the fore and, as in other industries,
defining them around the purchaser’s needs.
PAymentTo avoid confusion, this paper uses the term “payment” to
describe the cost of purchasing services—the amount paid
by the patient, employer, and government purchasers—and
will use the term “cost” to describe the healthcare provider’s
cost of providing the service. In a purchaser-centered value
equation, the provider’s cost is relevant to the purchaser
only to the extent it drives the amount of payment. The cost
of providing care is, nonetheless, an important consider-
ation for providers, the main audience for this report, who
are tasked with maintaining financial viability while
improving quality of care.
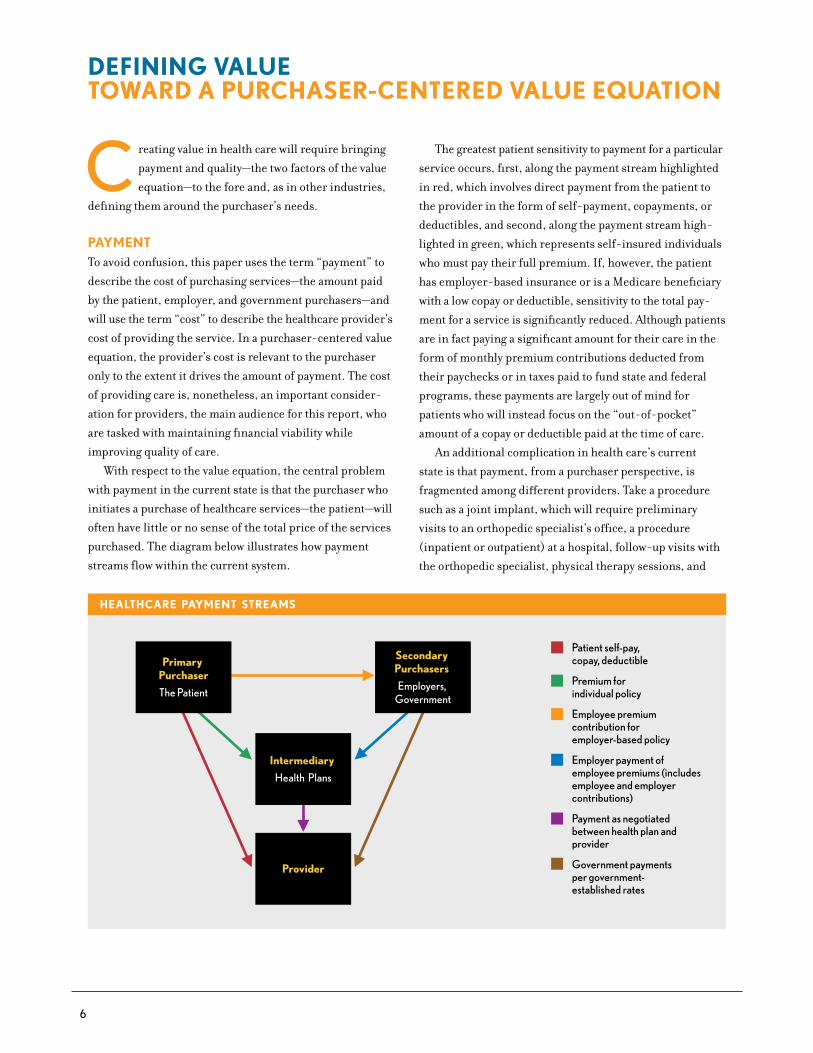
With respect to the value equation, the central problem
with payment in the current state is that the purchaser who
initiates a purchase of healthcare services—the patient—will
often have little or no sense of the total price of the services
purchased. The diagram below illustrates how payment
streams flow within the current system.
The greatest patient sensitivity to payment for a particular
service occurs, first, along the payment stream highlighted
in red, which involves direct payment from the patient to
the provider in the form of self-payment, copayments, or
deductibles, and second, along the payment stream high-
lighted in green, which represents self-insured individuals
who must pay their full premium. If, however, the patient
has employer-based insurance or is a Medicare beneficiary
with a low copay or deductible, sensitivity to the total pay-
ment for a service is significantly reduced. Although patients
are in fact paying a significant amount for their care in the
form of monthly premium contributions deducted from
their paychecks or in taxes paid to fund state and federal
programs, these payments are largely out of mind for
patients who will instead focus on the “out-of-pocket”
amount of a copay or deductible paid at the time of care.
An additional complication in health care’s current
state is that payment, from a purchaser perspective, is
fragmented among different providers. Take a procedure
such as a joint implant, which will require preliminary
visits to an orthopedic specialist’s office, a procedure
(inpatient or outpatient) at a hospital, follow-up visits with
the orthopedic specialist, physical therapy sessions, and
HEALTHCARE PAYMENT STREAMS
Primary Purchaser
The Patient
Secondary Purchasers
Employers, Government
Intermediary
Health Plans
Provider
Patient self-pay, copay, deductible
Premium for individual policy
Employee premium contribution for employer-based policy
Employer payment of employee premiums (includes employee and employer contributions)
Payment as negotiated between health plan and provider
Government payments per government-established rates

7
other related services. The services of the different providers
in this scenario will be billed separately, even though all
these services together define a single episode of care.
Without a consolidated bill, it is difficult for the individual
patient to fully understand the total amount paid for care.
On the other hand, employer and government purchasers
of care and health plans have high sensitivity to the total
amounts paid for health care, and are much more attuned to
the total price of care. This has several implications for the
value equation.
First, employers and health plans have an incentive to
shift more of the payment burden to patients in the form
of higher copays, deductibles, or premium contributions
to make patients more price-sensitive. The rise of
consumer-directed health plans since the early 2000s is
an example of such an effort, but these plans have had
mixed results, especially with respect to the quality of care.2
More recently, employers have begun shifting to employees
a higher percentage of the overall premium paid for their
coverage. According to the Kaiser Family Foundation,
the employee percentage of the premium held steady at
16 percent from 2002 through 2008, but increased to
19 percent as of 2010.3 As noted earlier, an employee may
not make a direct connection between a monthly premium
contribution and payment for an episode of care, but as
the percentage of employee copays and other direct care
payments increases—in addition to premium payments—
the employee should become increasingly sensitive to the
overall price of care.
Second, purchasers of all types have an incentive to
spend money on preventive programs or care coordination
programs if such programs have the effect of reducing
overall payments for health care (this is especially true for
employers if savings can be seen in the near term).
Employer-sponsored wellness programs have been around
for some time, but the significant rise in such programs in
recent years suggests that employers have reached a point
where the rising costs of health care justify an investment
2 See, for example, Melinda Beeuwkes Buntin et al., “Consumer-Directed Health Care: Early Evidence About Effects on Cost and Quality,” Health Affairs, Web Exclusive, vol. 25, no. 6, November/December 2006, pp. w516 – w530.
3 “Average Percentage of Premium Paid by Covered Workers for Single and Family Coverage, 1999-2010,” Kaiser/HRET Survey of Employer-Sponsored Health Benefits, 1999-2010 (Sept. 2, 2010)
in employee wellness.4 Health plans and employers are
still trying to quantify the ROI for such programs, but some
studies have indicated positive results.5
Third, and perhaps most important, employer and
government purchasers of care are heavily invested in
finding the right balance to the value equation, and have
significant influence over both health plans and providers.
These purchasers have already begun influencing the
payment system. The Centers for Medicare & Medicaid
Services (CMS), for example, has announced its intention
to use value-based purchasing “to transform Medicare from
a passive payer of claims to an active purchaser of quality
health care for its beneficiaries.”6 And both individual
employers and employer coalitions are actively working
with health plans and providers to move healthcare pay-
ment from an emphasis on volume to a focus on value.7
In many instances, these value-based payment methods
will push providers toward acceptance of more performance
risk and toward greater collaboration—and integration—
with other providers across the care continuum.
The trend in payment is thus to give the patient a
better sense of the price of care, shift more healthcare
dollars to preventive and primary care, and change the
payment system in ways intended to improve quality,
stabilize or lower prices, and promote the coordination
of care among providers.
quAlityIdentification of quality, the value equation’s numerator, is
ambiguous at best. The biggest problem, of course, is that
there is no comprehensive, standard definition of quality for
the healthcare industry. CMS has developed core measures
that have been adopted by many other payers, but with respect
to clinical treatment, these are largely focused on processes
that may be indicators of, but are at least one step removed
from, actual outcomes. The outcome metrics currently
employed are fairly blunt indicators of quality, emphasizing
either mortality or readmission rates within a certain period
4 Employer Investments in Improving Employee Health, a January 2011 report by the National Business Group on Health and Fidelity Investments, found that the ratio of the aggregate number of employee wellness programs to be implemented in 2011 compared with the aggregate number being discontinued was 8:1.
5 See, for example, John Commins, “Wellness Programs Show Hard-dollar Savings,” Health Leaders Media (Feb. 28, 2011).
6 Centers for Medicare & Medicaid Services, “Hospital Inpatient Value-Based Purchasing Program Final Rule,” Federal Register, vol. 76, no. 88 (May 6, 2011), p. 26490.7 See, for example, the agreement between home-improvement retailer Lowe’s, Inc., and the Cleveland Clinic regarding heart surgeries for Lowe’s employees and their
dependents, described on p. 33 of this report.

8
of time following a procedure or admission. Moreover,
these outcome metrics emphasize adverse events, not the
positive outcomes that purchasers expect from care.
Patient concerns
In beginning to work through a definition of quality of care,
one must start with the patient, the recipient of care. And
for the patient, the quality of care depends on a combination
of the factors highlighted in the exhibit above.
Access to care—making care both available and afford-
able—is a baseline requirement that brings the patient
within the process of care delivery. Once there, the patient
has three primary concerns with the quality of care: safety,
outcomes, and respect.
The first of these three concerns, safety, has always
been part of the healthcare landscape but took on increased
prominence in 1999, when the Institute of Medicine
released its landmark To Err Is Human: Building a Safer
Health System report. Many providers now have adopted
process metrics and patient safety checklists in an ongoing
effort to reduce preventable medical errors.8 But even
though safety is an essential component of the quality of
care, it does not sufficiently define it. Safety is something
patients assume when they enter a provider setting; it is
equivalent to the “defect rate” in industrial manufacturing,
but because it directly affects human lives, it has higher
stakes. Just as no one expects to pay for a defective product,
no one expects to pay for care that causes harm.
8 Note, however, that a recent study in Health Affairs indicates that several commonly used measures of patient safety miss many adverse events and that adverse event rates at many hospitals—even those that have focused on safety initiatives—remain high. David C. Classen et al., “‘Global Trigger Tool’ Shows that Adverse Events in Hospitals May Be Ten Times Greater than Previously Measured,” Health Affairs, vol. 30, no. 4 (April 2011): 581-589.
The industry has begun to take steps toward an outcome-
based definition of quality. The current metrics on mortality
and readmissions following inpatient admissions are
early examples. But neither mortality nor preventable
readmission is something that patients expect from care.
Instead, they are interested in functional outcomes: How
soon will I be able to walk or drive a car? When will I be
able to return to work? It may take weeks or months of the
patient’s treatment to report such functional outcomes,
meaning that accountability for quality of care must spread
across the care continuum. Moreover, these outcomes will
depend on such factors as the patient’s age, general health,
or comorbidities. Adding further complication, providers
must have functional ways to define outcomes that are both
measurable and manageable.
The last remaining concern—respect for the patient’s
needs—comprises several elements. Respect involves ask-
ing patients about their hopes and expectations for care,
including open conversations about care alternatives and
the attendant costs and benefits that will enable patients to
make decisions about the level of care that is best for them.
And it means respecting such fundamental patient needs as
privacy, comfort, convenience of care, and security. Care
delivery that respects the patient in these ways should lead
to higher patient satisfaction. At the same time, a clear
understanding of what the patient wants may help avoid
costs for care that the patient would prefer not to receive.
other Purchaser concerns
Although the patient is at the center of the value equation’s
quality numerator, the concerns of employers, government
agencies, and health plans will inevitably influence the
definition of quality. Even though the concerns of patients
and these other purchasers will overlap significantly, there
may be some important differences system stakeholders
will need to reconcile.
To the extent that health insurance benefits retain and
attract talented employees, employers will want to ensure
that the plan they offer satisfies employee expectations for
access to care. Government programs will also care about
access, especially for Medicare beneficiaries in the politi-
cally powerful age-65-and-older demographic. Employers
and government purchasers may, however, be more willing
PATIENT QUALITY CONCERNS
Access
Make my careavailable and
affordable
Patient
Safety
Don’t hurt me
Respect
Respect me as a person,
not a case
Outcomes
Make me better

9
than patients to consider tiered access programs, in which
preventive, acute, and other medically necessary care is
widely accessible and affordable but elective procedures are
less so. Gaps between patient and purchaser expectations
for access are already appearing, for example, in state
Medicaid programs, where efforts to contain the impact of
Medicaid payments on strapped state budgets are leading
state legislatures to consider controls on access to certain
high-cost services.9
There will be little difference between patients and
other purchasers with respect to patient safety concerns.
In the area of outcomes, purchaser concerns are also likely
to be closely aligned, although the concerns of employer
purchasers will focus primarily on cost and workforce
productivity. Employer and government purchasers are
also likely to support engagement efforts that help patients
make better informed choices about their care, especially
where these efforts help patients avoid care that is unlikely
to produce significant positive outcomes. For government
purchasers, however, this is a potentially sensitive area, as
demonstrated by the political debates over voluntary end-
of-life counseling when shaping implementation of the
Affordable Care Act.
9 The Arizona state legislature, for example, eliminated certain organ transplant services from Medicaid eligibility in the state’s FY11 budget, although those cuts were subsequently restored.
The key to quality, then, will involve the creation of
meaningful, measurable standards that address patient
concerns for care, while balancing the related concerns
of other purchasers. This will not be an easy process, and it
will require the ongoing collaboration of providers, patients,
government agencies, employers, and health plans.
Hospitals and health systems may well want to initiate
the process of developing meaningful quality and cost of
care metrics instead of waiting to have such metrics
imposed on them through government regulation or
employer or health plan demands. First, as accountability
for care begins to reach beyond the hospital walls, the long-
term outcomes of care will have increasingly significant
financial implications. Providers who are attuned to metrics
indicative of a procedure’s or treatment’s success will be
much more confident in their ability to predict long-term
financial outcomes. Second, providers who are able to speak
clearly and convincingly to patients and other purchasers
of care with meaningful data related to quality outcomes
and the price of care will be better positioned to compete
for purchasers’ healthcare dollars. And third, provider-
defined metrics that are linked to measurable quality and
cost improvements could play a significant role in shaping
industry standards.10
10 For example, six health systems (Cleveland Clinic, Dartmouth-Hitchcock, Denver Health, Geisinger Health System, Intermountain Healthcare, and Mayo Clinic) recently announced a collaboration with the Dartmouth Institute to gather data and share information on outcomes, quality, and costs for a range of common conditions and treatments.

10
A recognition that the current healthcare system
is unsustainable is driving the turn to value.
The Congressional Budget Office projects that
government spending on Medicare, Medicaid, and other
federal healthcare-related programs subject to mandatory
spending will more than double from a combined
$870 billion in 2011 to $1.8 trillion in 2021, growing
from a combined 5.8 percent to 7.4 percent of GDP over
the same period.11 From 1999 to 2010, premiums for
employer-sponsored health insurance grew a cumulative
138 percent, compared with cumulative wage growth of
42 percent over the same period.12 But there is little
evidence that increased spending is being matched with
increases in the quality of care.13
As noted earlier in this report, there are many problems
with the system today. Payment is fragmented among the
various purchasers of care, making it difficult for patients
to make informed choices based on the actual price of
care. Quality data, from the patient’s perspective, is often
not meaningful and is incomplete, with little information
available to compare expected functional outcomes among
providers. But the main culprit for the current system’s
ills is the fee-for-service payment system, which rewards
volume over value and does nothing to promote the coordi-
nation of care among providers. The first step in correcting
the system is a transition from volume-based to value-
based methods of payment, and that transition is already
under way.
11 Congressional Budget Office, The Budget and Economic Outlook: Fiscal Years 2011 to 2021 (January 2011)12 Kaiser Family Foundation, Employer Health Insurance Costs and Worker Compensation (February 2011) at http://www.kff.org/insurance/snapshot/Employer-Health-Insurance-
Costs-and-Worker-Compensation.cfm13 See, for example, Laura Yasaitis et al., “Hospital Quality and Intensity of Spending: Is There an Association?”, Health Affairs, vol. 24, no. 4 (July 2009): 566-572.
PAyment trenDSIn late 2008, CMS stopped reimbursing healthcare
providers for “never events”—serious adverse events that
should never occur or are reasonably preventable through
adherence to evidence-based guidelines. Since then, CMS
has continued to signal its intention to become “a prudent
purchaser of health care services, paying not just for
quantity of services but also for quality,”14 and several
provisions in the Affordable Care Act support this inten-
tion. Beginning in October 2012, CMS’s value-based pur-
chasing program will provide incentives to hospitals that
exceed certain quality measures relating to clinical care
processes and patient experience, while hospitals that fall
short on these measures compared with their peers will
receive reduced payments. The Affordable Care Act also
provides for the creation of accountable care organizations
(ACOs) that will participate in shared savings programs
for the management of Medicare beneficiary populations,
with implementation beginning in January 2012. In addi-
tion, it calls for a national bundled payment pilot program
for 10 conditions, in which hospitals, physicians, and other
members of the provider “team” would receive a global
payment for an episode of care, with implementation
beginning in January 2013.
On the private side, the not-for-profit PROMETHEUS
Payment® program is working with coalitions of providers
and payers (both health plans and employer coalitions)
14 CMS, “Fiscal Year 2009 Quality Measure Reporting for 2010 Payment Update” (Sept. 3, 2010)
the current StAte of VAlue in heAlth cAre

11
to test a bundled payment system based on “evidence-
informed case rates” for selected chronic conditions and
inpatient and outpatient procedures. Similarly, experiments
such as Blue Cross Blue Shield of Massachusetts’ Alternative
Quality Contract, which combines global health-adjusted
payments per patient with performance incentives for
high-quality care, seek to promote provider accountability
for managing the quality and cost of patient care.15
VAlue-DriVing cAPAbilitieSProviders are also preparing for a shift from volume-
based to value-based care. Research for the Value Project
has included surveys of the industry on the current state of
value in health care and interviews with providers that are
actively working to make a transition to value. This research
has identified four key areas of emphasis in which providers
are working to build their capabilities.
15 See Michael E. Chernew et al., “Private-Payer Innovation in Massachusetts: The ‘Alternative Quality Contract,’” Health Affairs, v. 30, no. 1 (January 2011): 51-61.
•People and culture: The ability to instill a culture of
collaboration, creativity, and accountability
•Business intelligence: The ability to collect, analyze, and
connect accurate quality and financial data to support
organizational decision making
•Performance improvement: The ability to use data to
reduce variability in clinical processes and improve the
delivery, cost-effectiveness, and outcomes of care
•Contract and risk management: The ability to develop
and manage effective care networks and predict and
manage different forms of patient-related risk
In the discussion that follows, highlights from the pro-
vider interviews and results from the current state survey
are combined to illustrate the state of the industry today in
relation to these four capabilities and the essential skills
that will be needed to further advance value transformation.

12
t he pursuit of value in health care will require new
levels of interdisciplinary collaboration, new levels
of accountability for results, a new focus on driving
process improvement throughout provider organizations,
and an ability to communicate the value of a provider’s care
to the community it serves. At a foundational level, providers
should have the skills to perform the following:
•Define the role of value in the organization’s strategic
mission and communicate value to both internal and
external stakeholders
•Create engaged, integrated, multidisciplinary teams
able to plan and implement process change
•Identify and effectively respond to patients’ concerns
or issues that might affect their experience or safety
StAte of the inDuStry toDAyThe creation of value requires the participation of clinicians
as well as finance and administrative staff. Each needs to
pay attention to and respect the concerns of the other.
Clinicians, in other words, must be conscious of the cost
implications of the choices they make, while finance and
administrative professionals must realize that quality
outcomes are at least as important as cost efficiencies
and reductions.
HFMA’s industry survey on the current state of value
indicates that organizations are engaging physicians in
key decision-making processes affecting costs, although
most do not currently engage physicians as full partners
in management. Using involvement of physicians in key
budgeting and resource allocation decisions as an indicator
of physician engagement at the management level, HFMA
found that physician leaders had no involvement at only
15 percent of the respondent organizations. At 59 percent
of the organizations, physicians provide feedback on budget
and resource allocation decisions, and at 27 percent,
physicians lead or are actively involved in decision making —
a good sign that physicians have been well integrated into
management decisions.
On the finance and administrative side, HFMA’s survey
on the current state of value indicates that CFOs spend the
majority of their time in more traditional roles, emphasiz-
ing cost reduction, efficiency improvement, and volume
and revenue growth. But a substantial portion of a CFO’s
time today is also dedicated to initiatives related to clinical
quality improvement and patient satisfaction. HFMA
found that a median 40 percent of a CFO’s time spent on
improvement initiatives is dedicated to clinical quality
improvement and patient satisfaction.
the current StAte of VAlue in heAlth cArePeoPle AnD culture
PHYSICIAN ENGAGEMENT
15%
59%
26%
1%
How are physician leaders typically involved in the department budgeting/resource allocation process?*
Not Involved
Provide Feedback
Actively Involved in
Decision Making
Lead theBudgeting
Process
Source: HFMA Value Project Survey, January 2011.
*Total exceeds 100% due to rounding.
CFO TIME ALLOCATIONS
60%
Consider the amount of time you spend on improvement initiatives. How would you estimate that your time is allocated?
Median Response
40%
Clinical QualityImprovement
and PatientSatisfaction
Volume/Revenue Growth and
Cost Reduction/Efficiency
Source: HFMA Value Project Survey, January 2011.

13
While these results indicate that CFOs are typically
devoting less time to quality and patient satisfaction than to
volume or revenue growth and cost-effectiveness initiatives,
the amount of time that CFOs already devote to quality
improvement and patient satisfaction shows promise. “I’m
encouraged by these results. It’s a good start in the direction
that CFOs will need to go,” says Peter DeAngelis, Jr., FHFMA,
CPA, COO of Catholic Health East in Newtown Square, Pa.,
and an HFMA Value Advisory Council member.
eSSentiAl PeoPle AnD culture SkillSA prerequisite to developing value-based people and
culture is the full commitment of the organization’s
executive leadership and board to guiding the organization
through the changes that a value-based system will require.
Building on this foundation requires two essential skills:
First is the ability to clearly and concisely articulate to
internal and external stakeholders the role that value
plays in the organization’s strategy. Next is the ability to
promote multidisciplinary collaboration while defining
the specific roles that key clinicians—physicians and
nurses—and finance and administrative professionals
play in the creation of value. As such, providers should
consider the following experiences of peers in communi-
cating their value message and how these organizations’
methods for including both clinical and financial
representatives facilitates process improvement and safer,
more patient-centered care.
communicating the Value message
A first step in communicating an organization’s value
message is distilling that message down to a clear, concise
statement that communicates the organization’s need for
value in a compelling way. Novant Health, based in
Winston-Salem, N.C., looked at the value equation through
the perspective of its patients and realized that affordability
of care was a significant concern. It also looked at payment
trends and determined that the direction is toward
Medicare levels of reimbursement. It combined these
perspectives into a simple statement for staff: The system’s
goal would be “affordability at Medicare levels.”
Many organizations also communicate the importance
of value internally by linking compensation structures to
quality and culture. Sullivan & Cotter’s survey of executive
compensation in not-for-profit hospitals and health systems
indicates that interest in compensation-based incentives
related to value is growing significantly (see exhibit below).
In 2009, 66 percent of hospitals tied management compen-
sation to patient satisfaction metrics, and almost 50 percent
linked compensation to clinical outcome metrics. Following
close behind were links to metrics for employee and
physician satisfaction.
COMPENSATION-BASED INCENTIVES
Percentage of Hospital Pay Packages Linking Each Category to Management Compensation
0%
25%
50%
75%
100%
ClinicalOutcomes
PatientSatisfaction
EmployeeSatisfaction
PhysicianSatisfaction
2007 2008 2009
Source: Sullivan & Cotter, Survey of Executive Compensation in Hospitals and Health Systems (2007-2009). Adapted with permission.

14
Nonfinancial incentives can also play a significant role
in communicating the value message internally. Spectrum
Health in Grand Rapids, Mich., hosts an annual Synergy
Awards program, now in its fifth year. Teams from within
the health system compete for the awards within such
categories as sustainability, innovation, and care improve-
ment, and their entries are scored against a grid that aligns
with key organizational goals. Miami-based Baptist Health
South Florida has taken a similar approach, hosting an
annual Performance Improvement Showcase event to award
entities that have been recognized for top performance
improvement efforts within the system. Abstracts of the
work the entities are doing are collected and distributed
throughout the system to facilitate knowledge sharing.
Advocate Physician Partners, a joint venture between
physicians and Advocate Health Care, based in Oak Brook,
Ill., addresses both internal and external stakeholders
with its annual Value Report. The report highlights the
organization’s clinical integration efforts and quantifies
these efforts in terms of patient lives affected and saved,
as well as economic impacts and cost savings.
As an example, Advocate Physician Partners’ 2011
Value Report highlights the organization’s Asthma
Outcomes initiative. The report identifies a tool it uses
to objectively assess asthma control levels, describes a
study that establishes the national average control rate,
outlines the components of an asthma action plan that all
the members of Advocate Physician Partners are asked
to implement, and highlights the organization’s achieve-
ment of an 88 percent control rate for patients with
asthma (38 percentage points above the national control).
Drawing on statistics on the economic and medical impact
of asthma, the Value Report quantifies the effect of the
Asthma Outcomes initiative in terms of days saved from
reduced absenteeism (58 days), lost productivity (436 days),
and amounts saved in direct and indirect medical costs
($13 million). The 2011 Value Report describes similar
outcomes and impacts for a generic prescribing initiative,
a diabetes care initiative, a post partum depression screen-
ing initiative, and a childhood immunization initiative.
The Value Reports published by Advocate Physician
Partners accomplish several communication goals: recog-
nition and affirmation of the work of the organization’s
clinicians; promotion of value to patients, employers,
government entities, and health plans; and emphasis on
leadership’s commitment to creating and improving value.
engaging clinicians in Value
A clear finding from the Value Project interviews is that
value cannot be created without the engagement and leader-
ship of clinicians: both physicians, who drive most of the
decisions affecting quality and cost of care, and nurses, who
are on the frontline of the patient experience and are often
best situated to identify and respond to issues affecting the
patient and care delivery.
Physicians. Many healthcare organizations are considering
an employment model to increase physician alignment and
engagement with organizational goals. But an employment
model is not feasible or desirable in all markets. The
Advocate Physician Partners joint venture with Advocate
Health Care, which today includes approximately 3,800
physicians, 2,900 of whom are independent, represents an
innovative approach to physician engagement outside the
employment model. The joint venture was set up with a
shared governance model, with two classes of directors—
one from the system side and one from the physician side—
represented on the board. Through the joint venture’s
Clinical Integration program, Advocate Physician Partners
and 10 Advocate Health Care hospitals employ structured
and ongoing collaboration to improve the quality and
efficiency of health care.
A key feature of the program is its pay-for-performance
incentive system. Advocate Physician Partners researches
metrics and establishes performance targets for each of
the program’s clinical initiatives, based on national best
practices, research findings, and other recognized bench-
marks.16 Physician performance on each of these metrics is
monitored throughout the year and reported to physicians
quarterly. An incentive plan links the performance of
hospital administrators and physicians as a means to
increase levels of collaboration and coordination of care.
Also, the incentive plan is structured to reward both
the individual physician and the physician’s peer group,
helping to develop a shared culture of excellence and
accountability. Physicians are awarded points based on
their achievement of quality metrics, and physician bonus
payments are based on the number of points earned.
16 A selection of the metrics used for Advocate Physician Partners’ initiatives is available in Advocate’s Value Report at www.advocatehealth.com/valuereport.

15
Because physicians are involved in all phases of develop-
ment and decision making for the performance metrics,
physician buy-in with the metrics is high. Nonfinancial
incentives—including recognition of high-scoring physi-
cians and competition between medical groups—have also
increased physician engagement.
The specific details of Advocate’s model yield several
general lessons for physician engagement at any organization.
First, physicians must be represented at a decision-making
level across all levels of the organization—from governance
down to the unit level. Second, metrics generated with the
participation of physicians will ensure the greatest physician
buy-in. And third, giving physicians a stake in the out-
comes of process improvement initiatives matters, whether
that stake takes the form of a financial or nonfinancial
incentive.
Nurses. Arizona-based Scottsdale Health System has a
strong shared governance program with its nursing staff.
If department metrics are not where they should be, then
the system will provide nursing staff with the support
needed. At the same time, nursing staff understand that
they will be accountable for improving the metrics. One
example of this shared sense of accountability and commit-
ment can be seen when system leadership identified an
increase in pressure ulcer rates at one of the facilities.
Two nurses traced it to a defect in mattresses affecting
600 patient beds that were then replaced at no charge by
the vendor. Since the discovery, the pressure ulcer rate
has decreased to zero in the intensive care unit.
The presence of nursing experience and expertise on
process improvement initiatives—again, starting at the top
and going down to the unit level—is a common factor among
most of the providers interviewed for the Value Project.
Peter Markell, CPA, CFO of Partners HealthCare in Boston,
Mass., notes that many hospitals have adopted Lean meth-
odologies, derived from Toyota’s production practices.
“Under the Toyota model, you let people on the floor make
decisions,” he says. “Nurses are the people on the floor.”
engaging finance and Administrative Staff in Value
Engaged clinicians are essential to value creation, but so
are engaged finance and administrative professionals.
“The CFO needs to be glued at the hip with the quality
officer,” says David Bernard, vice president of finance,
The Methodist Hospital System, Houston, Texas. “Revenue
depends on quality.”
Many of the CFOs interviewed for the Value Project
note that engagement with quality requires a change in
mind-set for the finance executive. “Not putting an initial
focus on cost was something that required a leap of faith
on my part, but I’m now a believer in this approach,” says
Kathy Arbuckle, CPA, CFO of Marriottsville, Md.-based
Bon Secours Health System. Clinicians are engaged by
quality and service improvements for the patient; any
resulting cost reductions become a natural outcome as
variability in clinical processes is reduced and inefficien-
cies in care delivery are identified and removed.
Bon Secours has also developed a “dyad” model of
leadership—combining finance and administrative staff
with physicians and nurses—for its Clinical Transformation
program. The model extends from the system’s senior
leadership team down to teams at local hospitals that
together “walk the line” by following patients through the
care process to identify safety and waste issues. The team
then works together to resolve the issues of care delivery
and unnecessary cost identified.
Bringing finance and administrative professionals
together with clinicians in an ongoing collaborative process
supports process improvement and a patient-centered
focus. When commenting on the ingredients for organiza-
tional success, Joseph Fifer, FHFMA, vice president of
finance for Spectrum Health’s hospital group, points to the
importance of a strong working relationship among the
executive team—including finance and administrative
officers, the chief medical officer, and the chief nursing
officer. “Sincere, mutual respect for each others’ disciplines
is an absolute necessity,” says Fifer. “You have to manage
with knowledge of what’s going on at the bedside, as well as
what’s going on at the bottom line. For finance executives,
this means getting out of the office to round with the chief
nursing officer or sit in on physician meetings. These
activities matter; you have to want to know about them.
Once that culture of mutual respect has been established at
the top, it cascades down throughout the organization.”

16
F or providers to deliver value in health care, they must
have accurate, actionable data on the two elements
driving the value equation: quality of the care delivered
and cost of providing care (the basis for the price that pur-
chasers should be asked to pay for care). They must also be
able to link quality and financial metrics to quantify the value
of care provided. To build this business intelligence, organi-
zations must have skills to perform several functions:
•Accurately and consistently report data on appropriate
metrics developed in collaboration with clinicians
•Drive information sharing throughout the organization
by linking department-level dashboards and individual
measures to strategic goals and executive dashboards
•Report quality results against core measures
StAte of the inDuStry toDAyHFMA’s survey on the current state of value indicates
that many providers, while recognizing the significance of
the link between quality improvement and cost-reduction
efforts, are just starting to measure the impact of poor
quality and waste on their organizations, and similarly,
are just beginning to move beyond traditional methods
of cost accounting.
As noted in the exhibit at lower left, fewer than
one-third of respondents believe there is no or limited
dependency between quality improvement and cost-
reduction efforts. One-half of respondents believe there
is some dependency, and the link is increasing. Almost
one-quarter believe there is extreme mutual dependency.
While more than half of respondents have begun mea-
suring the costs of adverse events and the margin impact of
readmissions, only 20 percent of respondents report that
they actively manage to these measures (i.e., use the data to
drive actions that reduce costs or improve margin). What’s
more, half of respondents have begun measuring or manag-
ing to the cost of waste in care processes, such as duplicative
or unnecessary tests or procedures.
The majority of respondents use traditional costing
methods, with 69 percent reporting use of ratio of cost-to-
charges. In contrast, only 30 percent report use of activity-
based costing, which provides a more accurate assignment
of both direct and indirect costs to hospital procedures and
services. This differential narrows, however, for larger
facilities (500 beds or more). Fifty-eight percent of larger
facility respondents use ratio of cost-to-charges, but
50 percent of these respondents also use activity-based
the current StAte of VAlue in heAlth cArebuSineSS intelligence
LINKING QUALITY AND COST
What level of dependency do you associate between quality improvement and cost-reduction efforts?*
Source: HFMA Value Project Survey, January 2011.
No Dependency
ExtremeDependency
Some Dependency, and the Link IsIncreasing
LimitedDependency
50%
22%
4%
25%
*Total exceeds 100% due to rounding.
Not Measure Manage
MEASUREMENT AND USE OF BUSINESS INTELLIGENCE
To what extent does your organization measure and utilize business intelligence related to value in the following areas?
Source: HFMA Value Project Survey, January 2011.
Costs of Adverse Events 43% 37% 20%
38% 42% 20%
50% 29% 21%
Margin Impact of Readmissions
Cost of Waste in Care Processes (i.e. duplicative/unnecessary tests or procedures
Not We do not measure.
Measure We have measured the impact, but do not manage to the metrics.
Manage We manage to these measures (e.g. data drives actions to reduce costs or improve margin).

17
costing (note that respondents to this survey question were
asked to select all costing methods used in their organization).
Moreover, 79 percent of larger facility respondents report
use of a specialized cost accounting system, as compared
with 39 percent of the overall respondents.
eSSentiAl buSineSS intelligence SkillSThe need for better business intelligence is both recog-
nized and real. Many of the providers interviewed for the
Value Project readily acknowledge the inadequacies of their
current systems, but they are working to enhance their
skills with using data and to develop the systems that will
lay the foundation to succeed under value-based payment.
ensuring Accuracy and consistency of Data
A small group of providers—including Intermountain
Healthcare, Geisinger Health System, and the Cleveland
Clinic—represent the vanguard of business intelligence in
health care. Intermountain, for example, has already spent
decades customizing its business intelligence system to its
changing needs. Its first system, introduced in 1960, used
automation to improve decisions by, for example, screening
for possible interactions during drug entry or recommend-
ing antibiotics and associated dosage schedule based on the
patient’s medical history. The latest iteration of its business
intelligence system—the Enterprise Clinical Information
COSTING METHODS
58%
69%
What methods are in use to allocate indirect and overhead costs to departments, procedures, or activities?
Ratio of Cost-to-Charges (RCC)
38%
47%Medicare Cost Allocation
79%
39%Specialized Cost Accounting System
54%
35%Standards-Based Costing/Relative Value Units
50%
30%Activity-BasedCosting
Source: HFMA Value Project Survey, January 2011.
500 Beds or MoreAll
System, currently in implementation stage—is a system-
wide electronic medical record that offers real-time
patient views aggregating patient data from all system visits,
provides access to best-practice clinical workflow protocols,
and uses clinical information to develop granular and
longitudinal costing estimates for patient care.
Few organizations, of course, have the expertise or
resources to develop their own custom business intelligence
systems, but many of the providers interviewed for the Value
Project are building business intelligence capabilities—
especially in the area of quality improvement—using available
software and tools. Bellin Health in Green Bay, Wis., uses a
commercially available software program to identify statis-
tically significant variations in care delivery that offer sig-
nificant opportunities for improvement. Baylor Health Care
System in Dallas, Texas, uses the Institute for Healthcare
Improvement’s Global Trigger Tool to monitor and charac-
terize the nature of adverse events within system facilities.
Hospital teams review the data regularly to direct quality
initiatives based on patterns of events and preventability.
In comparison with investments in business intelligence
for quality, investments in business intelligence on the
finance side have lagged behind. As a result, tying cost
implications to performance on quality metrics often
requires a good deal of time-consuming, manual work.

18
set of organizational goals. Sharp HealthCare’s leadership,
for example, felt it had reached a point where too many
metrics and targets were being measured and decided to
bring focus to the organization by defining the “Sharp
Experience” around six pillars: quality, service, people,
finance, growth, and community.17 All of the organization’s
strategic initiatives are aligned under these six pillars, and
management decisions are communicated to all employees
so they understand why the initiatives are in place and how
the initiative metrics drive toward the broader system goals.
Bellin Health Systems balances its system-wide score-
card across the fundamental categories of effectiveness,
efficiency, engaging others, growth, and teamwork. A cross-
functional, interdisciplinary leadership team works with
“brand” and unit leaders to translate the system-wide
scorecard measures into metrics that cascade down to the
individual goals of front-line staff (Bellin’s brands are
organizational structures that combine all of the services
needed for treatment of a condition or procedure). For
example, the system goal of engaging others has a “likeli-
hood of recommending” measure. This is traced at the
brand level by the “likelihood of recommending” score
from the Bellin Psychiatric Center’s inpatient survey result,
at the unit level by the “likelihood of recommending” score
for the Bellin Psychiatric Center’s adult unit, and at the
individual therapist’s or psychiatrist’s level by scores on
individual patient satisfaction surveys.
The alignment of system-wide goals with department-
level and individual metrics helps keep the entire organiza-
tion on track. Staff understand how the information they
are gathering and reporting relates to the organization’s
overall direction, while management and executive teams
can readily see whether the organization is exceeding,
meeting, or underperforming on its goals.
reporting quality results Against core measures
Changes in Medicare payment—particularly CMS’s
new value-based purchasing program—mean that most
healthcare organizations will be paying attention to their
ability to report on CMS core measures and HCAHPS
patient experience of care measures, if they have not
already been doing so. Payment under value-based pur-
chasing will be tied to both achievement, which measures a
hospital’s performance as compared with other hospitals’
17 The Sharp Experience pillars resemble the Studer Group’s five pillars of service, quality, financial, people, and growth (see www.studergroup.com), but add a sixth pillar for community.
Providers also struggle to quantify precisely the financial
impact of quality initiatives, although many of the Value
Project interviewees note that the effects of quality initia-
tives on metrics such as length of stay and other indirect
macro indicators provide some demonstration when
initiatives are working to reduce costs.
A key point is that less than perfect data should not stop
a provider from pursuing value. “We need direction, not
perfection, from the data,” says Phyllis Lantos, FHFMA,
CFO of New York-Presbyterian Healthcare System. “As an
industry, we have so far to go. Data use is a tool, not the
answer, in improving value.”
A second point is that, although data use may be
less than perfect, it needs to be used with the greatest
consistency possible. This consideration is especially
important when working with physicians, who are data-
driven and quick to question the credibility of the
information they are asked to work with in improving
the value of patient care. Spectrum Health wanted to use
clinical improvement projects to improve outcomes for
high-volume surgical procedures and medical conditions,
but it realized clinicians had little faith in existing metrics
and little consensus on the proper metrics. It formed
collaborative teams of clinicians and finance staff to
develop actionable data for these procedures and conditions.
The teams identified mutually agreed-upon metrics and
defined how the metrics would be calculated, collaboratively
determined the proper source of the data, and established
a formal vetting process for the data. As a result of these
efforts, Spectrum has been able to actively drive down
complication and mortality rates for its high-volume condi-
tions and procedures, positioning itself to take advantage
of $23 million in pay-for-performance incentives under
contracts with two managed care providers.
Sharing information Across the organization
For business intelligence to be actionable and effective,
organizations must ensure that the right information is
getting to the right users. At the same time, users need to
be able to understand the significance of the information
they are receiving within the broader context of organiza-
tional strategic goals.
Several of the organizations interviewed for the Value
Project have focused their balanced scorecards on a core

19
performance, and improvement, which measures a
hospital’s improvement on its baseline performance score.
For hospital business intelligence systems to be effective
under value-based systems, they will need to automate
reporting against these core measures in a way that allows
users to easily monitor and track progress across the orga-
nization, compare performance with internal benchmarks
and national averages, and respond to issues as they arise.
Partners HealthCare in Massachusetts has developed
a dashboard that tracks internal performance against
Massachusetts-area health system averages, national
hospital averages, and other selected competitors. The
dashboard tracks performance on such metrics as CMS core
measures, Leapfrog Group patient safety measures, HCAHPS
patient satisfaction survey measures, and HEDIS ambula-
tory care measures. The dashboard shows green if Partners
is performing in the top 10th percentile of its comparison
group, yellow if below the top 10th percentile but still above
the group average, and red if below the group average.
The Partners dashboard serves several purposes: It
demonstrates the organization’s commitment to quality
above and beyond what is required, it keeps staff focused
and engaged in quality improvement, and, through com-
parisons with specific competitors, it promotes the staff’s
own competitive drive to be the best.
Business intelligence will likely require the most
capital investment of the four value-driving capabilities
described in this report, as healthcare organizations build
IT systems and acquire software that enable them to track
and link performance outcomes and cost data. However,
business intelligence also may be the most important of
the four capabilities, as it facilitates linking clinicians
and staff throughout the organization, produces the data
that can verify the outcomes and financial implications
of performance improvement efforts, and enables the
creation of patient information repositories that will
become increasingly important as providers contemplate
the assumption of risk.

20
P erformance improvement capabilities comprise
the skills needed to reduce variability in clinical
processes and improve delivery and outcomes of
care. To effectively improve performance, providers will
need skills to be able to conduct the following:
•Identify and prioritize improvement opportunities
•Develop well-defined processes to ensure that clinical
redesign projects achieve their defined goals
•Identify and create consensus around evidence-based
practices (from both internal and external sources)
StAte of the inDuStry toDAyThe results of HFMA’s current state survey indicate that
more than 90 percent of respondents have at least some
experience redesigning clinical processes within a depart-
ment—with over 50 percent reporting significant experi-
ence. Just under 90 percent report significant (43 percent)
or some (46 percent) experience implementing cross-
department or system-wide initiatives. Experience levels
drop off significantly, however, for care redesign that
moves beyond a facility’s walls to a cross-continuum
initiative. Just 11 percent of organizations report significant
experience with such initiatives, while 48 percent have
some experience. Similarly, only 13 percent of respondents
report significant experience with designing and imple-
menting population health programs, with providers
reporting some experience in this area at 29 percent.
This difference between experience levels for in-facility
and cross-continuum initiatives is not surprising. The
earliest CMS quality initiatives have focused on patient
safety metrics and avoidance of “never events” within the
immediate control of a facility. But new initiatives are
moving accountability for care beyond a hospital’s walls.
A penalty for readmission of a patient within 30 days of a
procedure may relate back to the care provided within
the hospital, for example, but it may also be the product
of post-acute care or a patient’s failure to adhere to a care
protocol. As accountability for the longitudinal care out-
comes of patients increases, so too will the need for patient
engagement and coordination of care across the continuum.
the current StAte of VAlue in heAlth cArePerformAnce imProVement
EXPERIENCE WITH PERFORMANCE IMPROVEMENT ACROSS THE CONTINUUM
How would you describe your organization’s experience executing the following initiatives?
0%
40%
20%
60%
80%
100%
Significant
Source: HFMA Value Project Current State Survey, January 2011.
Limited None, but Ready None
Redesigning a Departmental
Process
Redesigning End-to-End
Care Processes within the
Facility
Implementing Cross-
Department or System-Wide
Initiatives
Executing Cross-
Continuum Initiatives
Designing and Implementing
Population Health
Programs
EXPERIENCE RATINGMORE
MOREEXPERIENCE
SOMEEXPERIENCE
NOEXPERIENCE
LESS

21
eSSentiAl PerformAnce imProVement SkillSThe organizations interviewed for the Value Project are
actively engaged in clinical process redesign focused on
reducing the variability of clinical practice patterns and
identifying and removing waste from clinical processes.
Success of these efforts depends on identifying the right
opportunities, ensuring that projects stay on goal, and
promoting the development and adoption of evidence-
based practices.
identifying and Prioritizing improvement opportunities
In virtually all organizations, opportunities for improving
clinical processes outnumber the resources available to
implement process redesign, so prioritization of these
opportunities is a critical first step.
At Rush University Medical Center in Chicago, Ill., the
prioritization process begins with examining data to identify
quality opportunities where there are higher costs per
discharge and greater variation in costs across the practice
group. In the exhibit at right, Service B would be a better
target for performance improvement because it has higher
average costs and greater variation in costs than Service A.
But examination of the data is just a first step. Equally
important is identifying and engaging physician groups
where there is a willingness to take on change. “Our
approach is data-driven, but making a decision on where
to start involves a mix of data, gut instinct, and physician
engagement,” says Raj Behal, MD, associate chief medical
officer at Rush. “You don’t want to start with your toughest
cases first.”
At Sharp HealthCare, projects that are considered for
implementation must fall under one of the system’s six
strategic pillars and must align with the system’s strategy.
Qualifying projects are then prioritized through multiple
senior leadership meetings where competing priorities are
brought to the table, discussed, and ranked. Sharp recog-
nizes that successful implementation depends on the avail-
ability of adequate resources, so it limits the number of
initiatives under way at any one time, demonstrating the
system’s focus and commitment to the initiatives that do
make it to implementation. The reasoning behind the
senior leadership’s prioritization of projects is communi-
cated to the staff to help mitigate frustration over projects
that are not selected.
Once a project has been functional for one year, Sharp
performs an assessment to determine how the initiative’s
outcomes compare with goals and expectations for the
project. If alignment isn’t sufficient between the project’s
goals and actual outcomes, the project is stopped so that
the system can dedicate resources to other initiatives.
Organizations skilled in identifying and prioritizing
performance improvement projects must, in other words,
know both when to begin a project and when to end it.
Not every project will be a success, and organizations
must be ready to redeploy their resources to pursue more
promising opportunities.
Developing Processes to ensure Projects meet goals
Several of the Value Project interviewees have developed
well-defined processes for clinical reengineering initia-
tives. These processes ensure that initiatives are both
viable and kept on track for implementation.
Rush University Medical Center has developed a
12-week rapid cycle improvement process, which begins
with prioritization of possible process improvement areas.
IDENTIFYING IMPROVEMENT OPPORTUNITIES
Cost Distribution for Clinical Value Bundles
Low High
Service A
Cost
Num
ber
of C
ases
Service B

22
The clinical department chair and other physicians
within a potential target area are engaged to consider
undertaking a process redesign, with the understanding
that clinicians will control the elements of the redesigned
care protocol. The physicians review data provided by the
hospital to identify practice variations among individual
physicians, analyze the reasons for these variations, and
then define metrics and processes intended to reduce the
variations. For example, in the exhibit below, an analysis
of physician practice variations in length of stay indicates
that Physician X displays higher cost patterns among his
peers, and his practice patterns would warrant further
analysis and discussion.
Following the development of the fact base and initial
metrics for the area, the improvement plan is introduced
at a formal kickoff with the clinical resource management
steering committee, which is chaired by Rush’s CEO.
Physicians, nurses, and pharmacists are brought in for this
meeting. The group reviews the initiative’s quality and cost
targets as well as potential for growth for the practice area,
and it assigns accountability for the initiative goals. Final
consideration comes at the end of the 12-week period, when
quality and cost targets and metrics have been approved,
are aligned with potential growth opportunities, and are
adopted as the standard for tracking performance improve-
ment within the area.
The performance plan at Bellin Health is based on the
Juran trilogy18 of quality design, quality control, and quality
improvement. Quality design focuses on new innovations
for performance improvement. Performance improvement
initiatives that make it to the system-wide agenda must
meet two criteria: They must affect multiple departments,
and they must address the system’s three priorities of
clinical outcomes, patient satisfaction, and financial viability.
Quality control focuses on current processes that have gone
off target in terms of reliability, predictability, or safety.
In the case of both quality design and quality control, inno-
vations or corrective actions follow a 120-day planning and
review cycle. During this period, system and initiative
leaders monitor and track performance and outcomes and
adjust resources toward improvement initiatives that are
showing the greatest promise. To support quality improve-
ment, processes with proven impact on the advancement of
the priorities are incorporated into the system’s balanced
scorecard metrics.
For hospitals and health systems to improve quality, they
need to ensure that their processes for supporting high
performance are able to accommodate and adapt to new
knowledge. At the same time, processes with clear param-
eters and time schedules, such as those employed by Rush
and Bellin, keep stakeholders focused and on task.
creating consensus Around evidence-based Practices
The ability to establish consensus among clinicians around
evidence-based practices is critical for both the initial and
long-term success of performance improvement efforts.
An effective model for building consensus has been devel-
oped by Bon Secours Health System as part of its Clinical
Transformation initiative.
Performance improvement initiatives are identified
and approved at the system’s senior leadership level, and
then they are rolled out to local interdisciplinary teams,
which include both clinicians and finance and administra-
tive staff at the system’s individual hospitals. The system
leadership defines general “guardrails” for the local trans-
formation teams, but the teams are encouraged to experi-
ment with process improvements within these constraints.
18 Named for 20th-century quality management theorist Joseph M. Juran.
PHYSICIAN PRACTICE VARIATIONS
Low High
Physician X Profile
Length of Stay
All Other Physicians

23
After the local interdisciplinary teams trace the patient
experience through the care process to identify practice
variations, possible safety issues, and waste in a manner
that mirrors industrial process redesign efforts, practicing
clinicians on the team are tasked with developing practical
care delivery solutions to the problems identified, which
helps ensure clinician buy-in.
All of the local teams working on a common initiative
meet monthly by phone to share knowledge, discuss prob-
lems, and identify emerging “best practices.” Once a best
practice is identified and agreed on, it is standardized
across the system. An internal audit follows after imple-
mentation to ensure that once a process is put in place,
it is adhered to across the system.
A best practice might be identified internally, as in
the Bon Secours example, or through external research.
In either case, the key to consensus-building is a collab-
orative approach that reflects the input of stakeholders
across the system who ultimately will be asked to imple-
ment the practice.
The need for collaboration runs throughout the perfor-
mance improvement capability. Clinicians and administrative
staff must partner to identify opportunities for change;
create processes and metrics for performance improvement
that are actionable, measurable, and sustainable; and promote
the adoption of proven practices throughout the organization.
Performance improvement cannot be a one-time collabo-
ration; it must represent a continuing, system-wide effort
to improve the quality and efficiency of care.

24
F or most providers, contract and risk management is
probably the capability with which they have the least
experience (although they may have had historical
experience with capitation during the managed care experi-
ments of the 1980s and 1990s). But as both government
agencies and health plans initiate programs piloting various
forms of value-based care, from episode-of-care-defined
bundled payments to ACOs that assume responsibility for
defined patient populations, the need to develop contract-
and risk-management capabilities will increase.
Management of care episodes or the delivery of
“accountable care” will in many cases require an extension
of care across a network of providers. Providers will need to
develop capabilities in assessing the potential risks and
benefits of acquiring other providers or engaging with
them contractually to build a care network. Considerations
will include how to divide the care services, accountability
for outcomes, and revenue among network members.
Also, providers will need to predict and manage different
forms of patient-related risk under different payment
methodologies. For example, providers will need to evaluate
performance risk for patient outcomes under an episodic or
bundled payment system for acute-care procedures, or they
will need to understand utilization risk under a bundled
payment system for chronic disease management or a per-
member-per-month capitated payment system.
In the near term, providers will need skills to perform
the following:
•Create partnerships with payers to meet mutual needs,
collaborate on payment system evolutions, and discuss
progress toward quality and cost goals
•Develop cross-functional collaboration among clinical,
finance, and contracting departments to ensure that
agreements can be successfully implemented and
managed
•Effectively manage utilization among the organization’s
patient population, ensuring that the right care is
provided at the right time at the right location
StAte of the inDuStry toDAyThe results of the HFMA current state survey show that
very few providers are ready to take on the network devel-
opment, network management, and actuarial activities that
will be necessary under value-based payment methods that
involve episodic bundling, partial capitation, or global risk.
Only 12 percent of providers say they are ready now to take
on network development. Slightly fewer—10 percent—are
prepared today for network management, and just 6 percent
are ready today to engage in actuarial activities. Many,
however, anticipate readiness within the next five years.
The need for contract- and risk-management capabili-
ties is emerging quickly, however, as public and private
the current StAte of VAlue in heAlth cArecontrAct AnD riSk mAnAgement
READINESS TO MANAGE UNDER OUTCOMES-BASED PAYMENT
14%30%43%12%
15%44%31%10%
14%44%36%6%
Please rate your organization’s readiness to execute the key finance activities necessary to manage under outcomes-based payment (e.g., episodic bundling, global or capitated risk).*
NetworkDevelopment
NetworkManagement
Actuarial
Source: HFMA Value Project Survey, January 2011.
Ready now Ready within 1-2 years Ready within 3-5 years Ready after 5 years
*Totals may not equal 100% due to rounding.

25
purchasers of care move forward with new payment models.
CMS’s new proposed regulations for ACOs, for example,
offer one model under which providers would accept risk
for their ACO population immediately (“track two” ACOs);
under the second available model (“track one” ACOs),
providers would have to accept risk after two years. Private
purchasers and health plans are already actively negotiating
with willing providers on models that involve greater per-
formance risk and shared savings. And in some areas of the
country, especially the West Coast, capitation has never
gone away.
eSSentiAl contrAct- AnD riSk-mAnAgement SkillSFew of the providers interviewed for the Value Project
have exposure today to payment methods that require the
strongest skills in contract and risk management. But many
have been working on better collaborations with payers,
stronger internal collaborations, and improved utilization
of their facilities—all important skills for successful contract
and risk management.
creating Partnerships with Payers
San Diego-based Sharp HealthCare receives over one-third
of its revenue under capitation and has managed capitated
payments for the past 25 years. Stacey Hrountas, Sharp’s
vice president, managed care, has this advice for any
provider considering a capitated payment arrangement:
“Get a commitment from your payer partners to look at the
arrangement as a collaboration, not a negotiation. They
must be willing to meet with you frequently and tweak and
adjust the arrangement as you go.”
Minnesota-based Fairview Health Services and Medica
Health Plans are developing this sort of provider-payer
collaboration to transition from fee-for-service payment to
a shared savings model and, ultimately, population health
management. They have developed this list of principles for
commercial payers and providers in a value-based world:
•Shared commitment to create value
•Shared commitment to multi-year partnerships
•Focus on population health and the engagement of
patients and consumers
•Collaboration on and investment in new care models
(both primary and specialty) and defined payment models
that recognize the value created
•Sharing of real-time, transparent data and information
to drive improvements
•Shared savings models in which providers retain the
majority of savings
•Commitment to creativity and innovation
•Dedication to better outcomes and reduced administra-
tive costs
•New products to expand covered lives 19
The principles defined in this list will furnish a collab-
orative roadmap for Fairview and Medica as they work to
implement a payment pilot in which Fairview’s guaranteed
fee-for-service payments diminish, while its incentives to
improve quality and cost of care increase. Creating such an
understanding with a payer in advance helps to ensure that
both parties agree on the goal and the flexibility that may
be needed to achieve it.
Sharp HealthCare also emphasizes that a payer partner
must be willing to share historical claims data on the full
managed population, especially if—as will usually be the
case—the provider organization does not have its own data
providing a complete picture of historical utilization.
Without access to the full claims history for a population, a
provider will not have sufficient information to understand
utilization and take measures to positively affect quality or
cost of care. Organizations that choose to pursue capitated
contracts without this crucial information will expose
themselves to substantial financial risk.
Developing collaborations Among clinicians, finance, and contracting Departments to ensure Success
Sharp HealthCare emphasizes the importance of having
relationships with clinicians to understand variations in
cost that may appear in the data. Josh Schmidt, Sharp’s
director of managed care finance, connects with clinicians
daily to get information from specific cases that stand out in
his review of data for the system. “The relationships with
clinicians are essential to make the numbers actionable,”
says Schmidt. “Numbers mean nothing without actionable
information.”
Equally important are relationships between the con-
tracting department and finance. “You need to get agree-
ments that can actually be implemented,” says Sharp’s
Stacey Hrountas. “Finance needs to know what the system
is committing to before the agreement is signed.”
19 Presentation of Terry Carroll, PhD, senior vice president for care transformation and CIO, Fairview Health Services, and Charles Fazio, MD, chief medical officer, Medica, at HFMA’s Leadership Conference on Value, April 1, 2011, Chicago, Ill.

26
Hrountas also cautions that capitated lines almost
always operate best within an environment that has
centralized finance, administrative, contracting, and
clinical functions, where it is easier for the left hand
to know what the right is doing.
managing utilization effectively
Providers who are considering an arrangement involving
assumption of risk for a patient population will need to
develop two essential skills for utilization management:
First, they must ensure that patients are properly utilizing
the right facilities for their care needs. Second, they must
try to ensure that patients stay within the provider’s network
when they do need care, so the provider that has assumed
the risk of managing the patient’s health can make sure
that care for the patient is being properly coordinated
and delivered.
Adventist HealthCare, a five-hospital healthcare system
based in Rockville, Md., assumes the financial risk of
providing health care to its employees and their dependents
through its own health plan, Adventist HealthNet, a self-
funded employee benefit plan. The organization examines
and manages factors affecting this risk carefully. As an
example, expenditures for the plan rose at a rate of approxi-
mately 4.2 percent from 2004 to 2008, but then rose by
more than 12 percent in 2009. Analysis revealed that this
increase was driven by 454 plan participants whose costs
represented 60 percent of the plan’s total costs for the year.
The system responded with the launch of a pilot patient-
centered medical home focused on caring for the needs of
what they define as “poly” users—those participants who
saw at least 15 providers and had at least nine prescribing
physicians within a year—within the group of 454 high-
cost participants. The system identified 46 “poly” users to
participate in the pilot and assigned eight primary care
physicians to manage their care needs. A personal health
nurse was also assigned to each of the primary care physi-
cians to develop a personal health plan addressing such
items as dietary counseling, baseline screening appoint-
ments, or exercise plans for each of the pilot participants
and to facilitate the participants’ compliance with the plan.
The first year of the pilot showed significant success,
with improved overall health of pilot participants, more
efficient use of the healthcare system, and reduced costs
per member in the plan. The number of high-risk patients
enrolled in the pilot was reduced by 48 percent, a reduction
represented largely by patients who were able to move
from high-risk to moderate-risk or low-risk categories as
a result of improved health. Reductions in overall utiliza-
tion of the healthcare system led to a 35 percent reduction
in per-member-per-month (PMPM) costs for the pilot
participants (from $1,981 in 2009 to $1,290 in 2010),
even as overall PMPM costs for non-pilot plan members
increased slightly over the same time period (from $296
in 2009 to $299 in 2010).
To help ensure that patients within its capitated
population of approximately 279,000 lives are receiving
properly coordinated care, Sharp HealthCare has developed
a centralized, system-wide department focused exclusively
on patient “repatriation,” or bringing those patients
admitted through out-of-network emergency departments
back into the system, where access to their medical record
supports better coordination of care and minimizes the
likelihood for duplicative tests and procedures. Sharp’s
repatriation department employs nurse case managers who
work with out-of-network providers in the area so they
know to contact Sharp if a Sharp patient is admitted to their
facility. If the patient is stable for transportation and Sharp
has the right bed available for the patient’s care, then the
patient is brought to the appropriate Sharp facility. If it is
not feasible to transport the patient back into the network,
Sharp’s nurse case managers go out daily to review the
patient’s care. “Our efforts add up to better care for our
patients,” says Hrountas. “Families of patients who are in
non-Sharp facilities are wowed when Sharp nurses come
by to check on their family member’s care.”
Sharp manages a sizeable capitated population, but
providers should not think that development of contract-
and risk-management capabilities is contingent upon
the return of capitation. Various forms of risk—from
performance to utilization—are quickly emerging as part
of the new healthcare landscape. Providers can prepare
themselves by developing relationships with payers in
their market; promoting the collaboration of clinicians,
finance, and contracting departments on new payer
contracts; and better understanding who their patients
are and how they utilize internal services.

27
t he trends toward value-based payment outlined
in the current state section of this report are likely
to intensify in the future. Looking forward, it is
important to understand key assumptions for the future
state of health care, industry perspectives on readiness in
light of these assumptions, and the types of care models
that will be most likely to succeed.
ASSumPtionS going forwArDPayment cuts. Growth of healthcare costs at the current
rate will almost certainly lead to government-imposed price
controls in the form of slowed payment rate growth or rate
reductions. Although providers have historically been able
to cost-shift these payment reductions to the private sector,
strong resistance to this approach means it will no longer
be sustainable.
Increased market demand for value, transparency.
System stakeholders—including patients and consumers,
employer and government purchasers, and health plans—
will demand greater value for their healthcare dollar,
pushing for increases in quality outcomes and cost savings.
Greater transparency of quality and pricing information will
allow stakeholders to identify and use high-value providers.
Push for innovation. To meet the demand for value,
providers will have to innovate with service-line mix and
cost structure and consider revenue models that hold
them accountable to some degree for performance-based
patient outcomes.
Focus on primary care and controlling high-cost acute care utilization. Attention will focus increasingly on
healthcare cost “hot spots”—including neonatal intensive
care, chronic disease management, and end-of-life care—
and on a primary-care led system that controls utilization
and coordinates care across the continuum. Although a
need for acute care will remain, hospital admissions will in
many cases be viewed as a potentially avoidable cost of care.
Shifting risk dynamics. The drive for accountability
will increase provider partnerships and integration, and
providers will need to develop contracts, manage networks,
and absorb risk in the most optimal manner, depending on
what role an organization chooses to play in a value-based
payment ecosystem.
inDuStry PerSPectiVeS on the future StAte of VAlueIn a survey on the future state of health care, HFMA found
that many providers anticipate significant change, even if
they have not yet begun preparing for it.
Over half of the survey respondents expect considerable
integration between hospitals and primary care physicians
over the next five years, and a third also expect considerable
integration between hospitals and specialty physicians.
the future StAte of VAlue in heAlth cAre
INTEGRATION TRENDS
4%
20%
34%
54%
18%
Over the next five years in your market, what level of consolidation/integration do you expect to see between hospitals and the following?
Payers
Post-AcuteCare Providers
SpecialtyPhysicians
Primary CarePhysicians
Other AcuteCare Hospitals
Source: HFMA Value Project Survey, March 2011.
Percentage Responding “Considerable”

28
Providers also anticipate that within the next 10 years
their payments will be subject to increasing levels of
performance risk through value-based payment method-
ologies such as bundled payments, capitated payments,
or shared savings with penalty contracts.
A clear majority of survey respondents anticipate a
future need to invest in population health management
capabilities; only 17 percent are not planning to invest.
As the exhibit at lower right indicates, many of the
providers that see a likely need to invest in population
health-management capabilities are planning to wait
for clarification on the future direction of payment
methodologies. Several of those methodologies—and the
care delivery models that might best respond to them—
are taking shape now.
future cAre DeliVery moDelSThe capabilities grid on p. 29 illustrates particular skills
within the four capabilities of people and culture, business
intelligence, performance improvement, and contract and
risk management that providers will need to develop to
accommodate the demands of different payment method-
ologies requiring varying levels of provider integration and
assumption of risk. As payment methodologies shift to the
right side of the grid the need to create integrated networks
of providers (formal or informal) to coordinate care across
the continuum intensifies. Providers also assume more risk
as payment methodologies shift to the right. Performance
risk emerges almost immediately under a pay-for-perfor-
mance methodology. Population risk and the attendant
need to manage utilization effectively become critical con-
siderations under disease and chronic care management
and total health management methodologies.
For the foreseeable future, it is likely that a range of
payment methodologies will coexist, although emphasis
will shift toward the center and right of the grid. Similarly, a
range of strategies will be available to healthcare providers,
depending on their desire or need to integrate with other
providers and their ability to assume risk. Decisions
regarding integration and assumption of risk will be driven
by a number of factors:
•Alignment of medical staff
•Sophistication and use of IT for clinical and financial
decision making
•Access to human and financial capital
•Market share and competitive environment
•Record of success with performance improvement
•Skills in the medical management needs of the provider’s
patient population
POPULATION HEALTH MANAGEMENT PLANS
7%
What are your plans related to investing in population health management capabilities?
Already Madea Significant
Investment
13%Already Made
a LimitedInvestment
15%Planning to
Invest within1-2 Years
49%Planning
to Invest, but Will Wait
17%Not Planning to Invest
Source: HFMA Value Project Survey, March 2011.
EXPOSURE TO RISK
27% 32%
17% 5%
3% 0%
How much of your payment do you predict will be exposed to performance risk (e.g., value-based reimbursement based on bundled payment, capitated payment, or shared savings with penalty contract):
In 10 Years
In 5 Years
Over the Course of the
Next Year
Source: HFMA Value Project Survey, March 2011.
10–20%
More than 20%

29
A provider with strength in all these areas will have
considerable flexibility in considering future strategies,
but a provider with weakness in any of these areas should
carefully consider whether it can survive independently
or should pursue a strategy involving integration with a
stronger entity.
The range of future state strategies displayed in the
exhibit below does not represent an exhaustive list. Instead,
it is a highlight of strategies currently taking shape that
hold promise for a value-based future state; each of these
strategies involves varying degrees of integration and
risk assumption.
Price-taking Providers
Many industries have already gone through a value-based
transformation. The retail industry, for example, has been
reshaped over the past few decades. The rise of “big box”
retailers, focused on generating large sales volumes through
a nationwide network of stores, challenged smaller, inde-
pendent retailers by offering a wider breadth (e.g., Wal-Mart)
or depth (e.g., Barnes & Noble) of inventory at lower prices
than independent retailers could match. Some of the big
box retailers have, in turn, been challenged by the rise
of e-commerce. Both Borders and Barnes & Noble have
struggled against Amazon’s online business, and the
organizational capabilities focus Area
fee for Service
Pay for Performance
Penalties for Adverse/
Preventable eventsepisodic bundling
Disease/chronic care management
total health management
People & culture
cultural emphasis
establishing learning organization
leading with QualityManaging long- term conditions
engaging the community
Management and Governance
Informal Physician leadership
Formal Acute-care Physician leadership
communities of Practice
operating Model
Department Structure
episode-Focused Service lines
cross-continuum Product lines
community collaboratives
Performance and compensation
Productivity-Based outcomes Based
Business Intelligence
Financial reporting and costing
Procedure-level Activity-level longitudinal PMPM
Quality reporting
core Measures
Process Measures
outcome Measurescondition Measures
Population Indicators
Business case
Supply/Drug and Productivity
Medical/Surgical Interventions
lifestyle Interventions
Decisions Support Systems
Financial DataAcute
Quality DataAmbulatory
Indicatorsclaims and
Prescription InfoHealth risk Assessment,
Biometrics, and Predictive Modeling
Performance Improvement
Process engineering
Identifying Service Variability
Increasing reliability within clinical Value Bundles
optimizing care Pathways Across the continuum
evidence-Based Medicine
Increasing Patient Safety
Developing clinical Value Bundles
Managing conditions
Improving Wellness
Stakeholder engagement
creating transparency
Informing Patient Alternatives
Developing Accountability
contract and risk Management
contract Management
Negotiating Pricing
Balancing cost and Quality Aims
Network Development Funds Distribution
risk Modeling and Management
Profit/loss Analysis
estimating exposure
Predicting outcomes
■ low Degree ■ Medium Degree ■ High Degree
lower Degree of risk and integration required Higher
cAPAbilitieS griD

30
increasing popularity of e-books further threatens the
status of their bricks-and-mortar outlets.
Changes in the retail industry have had a significant
impact on independent retailers, which cannot compete on
either selection or cost. Many—but not all—have gone out of
business. Those that have survived have done so because of
other factors, such as quality of service, quality of products
offered, or convenience of location, that retain a sufficient
customer base to maintain profitability. But success for these
retailers requires vigilance: A slip in the quality of service
or product offered, the introduction of a new competitor, or
too great an increase in the differential between the inde-
pendent retailer’s prices and those of its larger competitors
can erode the customer base.
Just as some independent retailers have survived the
transformation of retail, some healthcare organizations
may be able to adapt to and survive the value transformation
of health care relatively unchanged. These organizations
will most likely be the dominant provider in their local
market. They will need to offer a consistently high level
of care for the services offered and do so at prices that are
attractive or perhaps fully competitive with the lowest
cost providers. These providers will have to maintain a
high level of vigilance with respect to both quality and cost.
People may prefer to use a local healthcare provider, but
quality of life—and sometimes life itself—is at stake with
health care. If patients have any reason to doubt the quality
or safety of their local care option, many will go elsewhere
for their care, especially if they will not have to pay more
to do so. Price-taking providers will also face the threat
of competition from new entrants in their market—and,
as in retail, these entrants might be virtual or bricks-and-
mortar. Price-taking providers will also have to prove
continually their value proposition to other purchasers of
care—employers, government agencies, and health plans—
which will always be looking for better value providers.
They will also need to maintain their flexibility, remaining
open to alliances that may expand the services they can
offer or lower the cost of the care they provide. If the
pressures of a value-based system become too great, they
may ultimately need to merge with other organizations.
For organizations that prefer to exist as price-taking
providers, the following capabilities will be essential.
People and culture. Price-taking providers will have
difficulty matching the cost-effectiveness of larger, more
integrated networks. Therefore, they will need to focus on
leading with quality—including safety and clinical outcomes.
Respect for their patients’ comfort and needs—maximizing
the patient experience—will also augment these providers’
value proposition.
Business intelligence. Price-taking providers will
need to keep their prices as low as possible to minimize
the risk of losing patients or being dropped from a health
plan’s network, and they will have to accept the price they
receive from government programs. As a result, activity-
level costing will be necessary to ensure that the prices
paid for care generate a sufficient operating margin for
the provider. These providers will also need meaningful,
comparative data on quality outcomes and patient
DEGREE OF RISK, INTEGRATION IN FUTURE STATE VALUE-DRIVING STRATEGIES
Focused Factories
Integrated Care Networks
Price-Taking Providers
Res
pons
ibili
tyfo
r R
isk
LOW HIGHProvider Integration
LO
WH
IGH
Centers of Excellence
Population Health Management

31
satisfaction to communicate their value message to patients
and other purchasers.
Performance improvement. Identifying and eliminating
service variability will be needed to ensure a constant level
of quality for the services provided. Consistent quality
and high patient safety will be essential to retain customer
loyalty and optimize revenues under Medicare’s value-
based purchasing program.
Contract and risk management. Price-taking providers
will have little flexibility in negotiations with employers
and health plans. They will have to enter negotiations with
a clear sense of the patient volumes and prices needed to
maintain their viability.
focused factories
The “focused factory” strategy in health care has been most
fully developed in the work of Harvard Business School
professor Regina Herzlinger. In focused factories, providers
integrate around treatment of specific conditions or proce-
dures, emphasizing consumer needs regarding the price,
efficiency, and convenience of care. Retail clinics, such as
CVS Caremark’s MinuteClinics or Walgreens’ Take Care
Clinics, are an example of focused factories. They offer a
limited menu of services—typically vaccinations, treatment
of minor illnesses and injuries, physical examinations, and
disease management services (e.g., high blood pressure or
blood sugar testing)—with set prices and offer convenient
locations and service hours.
Hospitals and health systems are also entering the
market with primary care clinics tailored to the needs
of employers and patients. Southwest Florida-based
Lee Memorial Health System established primary care
clinics for its own employees several years ago. In conversa-
tions with human resources officers from other industries,
the system’s chief human resources officer realized that
there was a demand for such services from local employers.
Working with the city of Cape Coral, one of the largest local
employers, Lee Memorial developed primary care clinics
that are run out of four of the system’s hospitals. The clinics
offer a limited menu of primary care services, such as flu
shots, treatments for cold and flu, and blood pressure
screening, that was developed in collaboration with the
city. Plans are in the works to equip the clinics for physical
examinations as well. Up to three medications can be
prescribed per visit from a formulary of approximately
30 medications. The city pays a flat fee for each visit and for
medications prescribed from the formulary, and employee
copayments are waived for visits to the clinics.
Lee Memorial’s clinics offer the city and its employees
several advantages. The clinics reduce high-cost employee
visits to emergency departments. They also have a strong
positive impact on productivity through convenience of
location. Most city employees work within five minutes of a
clinic, are seen within 10 minutes of their arrival, and can
be back in the office within another 20 minutes. Also, early
treatment of common illnesses has reduced absenteeism.
What’s more, the clinics will soon be connected with
Lee Memorial’s electronic health record, enabling the
system to build a complete record of care for city employees
who stay within the system.
Lee Memorial benefits from the clinics as well. The
clinics build positive relationships with local employers—
the success of the city’s experience has attracted the interest
of other local employers. The clinics also create referrals
to the system’s employed physicians and to its hospitals.
The clinics have also helped move the system toward a
more purchaser-centric culture. “For too long, healthcare
providers have simply told patients what they need,” says
John Wiest, Lee Memorial’s chief operating officer for
business and strategic services. “Developing these clinics
in collaboration with the city and its employees has made
us more responsive to what the customer wants.”
For organizations pursuing a focused factories approach,
the following capabilities will be needed.
People and culture. With their emphasis on consumer
needs, focused factories require a strong patient- and
purchaser-centric culture. As in the case of Lee Memorial,
focused factory providers should actively seek conversa-
tions with patients and other purchasers of care to ensure
that convenience, price, and service needs are being met.
Business intelligence. To keep prices low, focused
factories will typically operate on a tight margin. Accurate
costing of services—including both direct and indirect
costs—is important to ensure that focused factories generate
a positive margin. Focused factories that are part of a larger
provider organization should also be part of the organization’s
integrated electronic health record to ensure continuity of
patient records.

32
Performance improvement. Efficiency of operations is a
major strength of focused factory models. Performance
improvement efforts should focus on minimizing patient
wait times and streamlining the patient visit to maximize
the focused factory’s value proposition. Focused factories
will also need to standardize care around clearly defined
sets of evidence-based protocols.
Contract and risk management. Exposure to performance
risk will be low for most focused factories, given the limited
menu of services they offer. Contract management efforts
(with large employers, for example) should focus on
simplicity of the terms for care (flat fees, guaranteed
wait times, etc.) to make apparent the value of the focused
factory model. These terms should be based on a clear
understanding of customer needs and what the customer
values most in a service.
For many providers, a focused factory strategy
will supplement the provider’s broader strategy. For
example, the approach may serve to complement a strategy
of managing population health. Focused factories will
typically require some level of integration (a retail clinic,
for example, requires integration with primary care
providers). Also, if the focused factory charges a flat
fee for service, then it should be prepared for a limited
degree of performance risk.
integrated care networks
An integrated care network model involves both a
formal integration of providers and a greater assumption
of performance risk spreading across part or all of the
care continuum. Providers collaborate to create integrated
bundled services defined around an acute-care procedure
(which may include pre- or post-acute care) or a chronic
condition, such as congestive heart failure or diabetes.
Providers could be integrated through consolidation or
contractual relationships.
A number of payment methodologies are possible with
an integrated care network. The network could offer a flat
price (potentially risk-adjusted) for a bundle of services,
or it could participate in a shared savings relationship with
a purchaser in which a maximum price is established for
the bundle of services, with the integrated care network
sharing in any savings produced by improving the efficiency
of care while maintaining the quality of patient outcomes.
As multiple providers within a market begin to offer
similar bundles, providers could use retail-type pricing to
compete for patients and other purchasers of care.
Early examples of integrated care networks include the
Medicare Acute Care Episode demonstration projects and
providers currently working to implement pilots of the
PROMETHEUS Payment model. Payments for care under
the PROMETHEUS Payment model, for example, are based
on evidence-informed case rates (ECRs). An ECR is a
budget for an entire care episode that includes all covered
services, bundled across all providers that would typically
treat a patient for a single condition or procedure. ECRs
have several components: the clinically indicated costs of
treating a condition or performing a procedure, adjusted
for the severity and complexity of each patient’s condition;
an allowance for potentially avoidable costs (reductions of
which create a bonus pool to be shared among the providers);
and an allowance for a margin to account for return on
capital assets and reinvestment in business operations.
Within the capabilities grid on p. 29, integrated care
networks would fall on the right side of the grid, below
episode bundling and disease and chronic care manage-
ment. In building their capabilities, integrated care
networks will need to focus especially on the following.
People and culture. To deliver effective bundles of
services or coordinated care for a specific population
(e.g., patients with diabetes), integrated care networks
will need to develop cross-continuum “communities of
practice.” Communities of practice are microsystems
comprised of related clinicians working collaboratively
on the treatment of a specific condition or disease.
Business intelligence. Longitudinal costing skills
become critical as integrated care networks attempt to
bundle services and pricing across a continuum of providers.
The networks must also be able to compare those costs with
procedural outcome and condition management measures
for the patients they serve and the purchasers of their
bundled services.
Performance improvement. Integrated care networks
will need to focus on delivering a consistently high level
of quality across the care continuum. Also, they will need
to effectively deploy their clinical communities of practice
to optimize cross-continuum care pathways—including
care transitions between providers along the pathway.

33
Contract and risk management. Network development
and funds management emerge as critical skills for inte-
grated care networks to effectively motivate and manage
their cross-continuum communities of practice.
Developing an algorithm for distribution of revenue
from bundled payments or from shared savings will be
complicated, especially in cases where the network is not
consolidated, but bound contractually. Factors contributing
to this algorithm would include such considerations as
the amount of savings a provider generated relative to a
baseline for the network, amount of time or activities the
provider contributed in delivering care, or the provider’s
contribution to achieving positive patient outcomes.
Another complication will be the participation of
hospital providers in chronic condition management care
networks, where hospital admissions represent potentially
avoidable costs. Hospitals will need to be part of such
networks for treatment of acute conditions that do arise.
However, they will likely experience reduced admissions
and revenues and may require a share of savings from
reduced admissions to mitigate financial impacts as they
adjust to lower volumes.
centers of excellence
A centers of excellence model combines attributes of
both focused factories and integrated care networks.
Centers of excellence are organized around treatment of
specific conditions and related procedures, typically at the
complex tertiary end of a care delivery scale. They require
tight integration of the medical specialties involved in
treating the condition and performing the procedures that
are the center’s focus. Participants in the model are usually
not multi-site providers. More frequently, they are organi-
zations that draw from a regional or, in some cases, national
patient population, with patients traveling to receive care.
Centers of excellence differ from integrated care networks
in that they typically are part of fully consolidated organiza-
tions, not members of a more loosely integrated, multi-
provider network.
The Cleveland Clinic’s institutes, in which depart-
ments of related medical specialties collaborate as unified
institutes to offer patient-centered care, offer examples
of centers of excellence. In 2010, Cleveland Clinic’s Heart
and Vascular Institute announced an arrangement with
home-improvement retailer Lowe’s Companies, Inc., to
provide Lowe’s employees and their dependents in the
company’s self-funded medical plan with the option of
scheduling qualifying heart surgery procedures at the
Cleveland Clinic at an enhanced benefit rate. Under the plan,
Lowe’s covers all qualified patients’ medical deductibles,
coinsurance amounts, and travel and lodging expenses for
the patient and a companion. Cleveland Clinic, in turn,
charges Lowe’s a flat rate for all services related to the
procedure.
A flat-rate payment involves potentially significant
performance risk for centers of excellence, corresponding
to the complexity of the condition or procedure at issue and
the possibility for complications. At the same time, centers
of excellence can limit their performance risk to the services
and procedures within their direct control—especially with
respect to surgical procedures. In the Cleveland Clinic heart
surgery model, for example, there is no guarantee— or
continued exposure to risk—if a patient is discharged in
stable condition but later develops a complication. Instead,
the Cleveland Clinic relies on maintaining high-quality
outcomes to minimize purchasers’ concerns about additional
costs related to complications. Negotiation of performance
risk exposure for centers of excellence focusing on treat-
ment of chronic diseases or conditions would be complex,
given both the duration and range of services needed for
effective treatment.
Centers of excellence may exist within a network of
providers assembled by an integrator, such as a health
plan, disease management company, or large employer
(or its third-party administrator). A provider organization
could also technically take on the role of integrator, but as
the main contact point for the purchaser of care, it would
have to be able to take on many payer-like attributes—
something that few providers would have the skills or
capital to assume. Centers of excellence have a contractual
relationship with the integrator (not with other providers
in the network).
On the capabilities grid on p. 29, a centers of excellence
delivery model would fall toward the center to right, requir-
ing capabilities for payment methodologies through episodic

34
bundling and—in the case of a chronic-disease focused
center—chronic condition management. Capabilities
needed for those pursuing a centers of excellence strategy
would include the following.
People and culture. Centers of excellence will be respon-
sible for organizing themselves and their care delivery
around specific conditions or procedures, which will often
require both intradepartmental and interdepartmental
integration. A culture intensely focused on quality and
process improvement will also be necessary for centers
of excellence to maintain a “best in class” standing.
Business intelligence. Accurate data for both costing
(activity-level) and quality will be needed to set pricing for
service bundles and to demonstrate value to healthcare
purchasers.
Performance improvement. To sustain the level of perfor-
mance demanded by purchasers, centers of excellence will
need to apply evidence-based practices to develop clinical
value bundles, with a focus on optimizing the quality and
price of the bundles.
Contract and risk management. Centers of excellence
will need to manage performance risk to thrive in an
episode-of-care, bundled payment environment. Also,
they will need to be able to organize contracts with
institutional purchasers of their services.
As indicated earlier, a center of excellence model could
be adapted to a wide range of providers and care services.
There are, however, caveats: Some not-for-profit providers
could find that defining themselves around a limited set of
services will challenge the provision of community benefits
that provides the rationale for their not-for-profit status.
Also, centers of excellence might work best on a regional
level, unless significant numbers of patients are willing
to travel outside of their “comfort zone” near home for
complex procedures.
Population health management
In this model, providers organize into an integrated, cross-
continuum organization that contracts with employers,
government purchasers, or health plans to manage the
health of a defined population. This model will involve the
most significant degree of risk, and it will require a patient-
centric care delivery strategy emphasizing primary and
preventive care to improve the health of the managed
population and minimize more costly acute-care episodes.
Examples of population health management today
include medical homes, Medicare’s recently completed
Physician Group Practice demonstration project, and the
ACO models defined in CMS regulations implementing
the Affordable Care Act’s shared savings program. CMS’s
ACO models have drawn significant attention. As part of
its current state of value survey, HFMA asked organizations
HOSPITAL PLANS REGARDING ACOS
39%
How would you describe your organization's accountable care organization (ACO) strategy?
Positioning Our Organization to Develop/Lead an ACO
26%Positioning Our Organization to Become Part of an ACO
27%Not Currently Exploring Our Role in an ACO
8%Unsure
Source: HFMA Value Project Survey, January 2011.

35
about their ACO strategy.20 Almost 40 percent of respon-
dents indicate that they are positioning their organizations
to develop or lead an ACO, while another 26 percent are
positioning their organization to be a part of an ACO.
CMS is predicting that between 75 and 150 ACOs will
participate in the first three-year phase of a voluntary
shared savings program defined by the Affordable Care Act,
with up to 5 million Medicare beneficiaries receiving care
from these ACOs.
As described in CMS’s proposed rule for ACOs, released
on March 31, 2011, ACOs participating in the three-year
shared savings program will have the option of accepting
both upside and downside risk for all three years of the
program, or postponing acceptance of downside risk until
year three. Those that accept two-sided risk will be entitled
to a greater percentage of shared savings on the upside,
while those accepting one-sided risk accept a lower per-
centage of shared savings by avoiding the risk of downside
loss. In both cases, shared savings are at risk if the ACO
does not achieve a range of quality metrics (the proposed
regulation identifies 65 such metrics in five domains). On
the downside, ACOs that perform well on quality metrics
but miss performance benchmarks on expenditures will
share fewer losses than ACOs that are low quality and low
performance. The three-year program will continue to use
Medicare’s fee-for-service payment methodology, with
savings or losses calculated at year end based on an ACO’s
ability to achieve quality metrics and reduce expenditures
below that year’s benchmark. CMS could eventually shift
the payment methodology toward a partial or full capitation
model if the three-year project is successful.
Assuming that a future population health management
organization would operate under a PMPM capitated pay-
ment system, the organization would fall to the far right of
the capabilities grid on p. 29. Those pursuing a population
health management strategy would need to develop the
following capabilities.
People and culture. Population health management
organizations will need to orient themselves around the
effective management of long-term chronic conditions
and other key drivers of cost. Leadership will also have to
20 The survey was conducted before CMS published proposed rules for ACOs in the shared savings program.
drive significant changes in culture. Compensation models
will have to change from volume-based incentives to incen-
tives focused on improving general measures of population
health and on improving outcomes for specific conditions
and procedures. Organizations will also need to recruit staff
whose skills extend beyond the range of “normal health
care” to experience in managing population health out-
comes related to socioeconomic factors, such as housing,
education, and nutrition.
Business intelligence. Business intelligence in a popula-
tion health management model will center on per-member
statistics such as PMPM costs. Decision support systems
must enable predictive modeling and health risk assess-
ment to support the organization’s ability to manage
utilization risk.
Performance improvement. Condition management
within the population will be a key factor driving the success
of a population health management organization. These
organizations will also have to create means for developing
accountability for outcomes among members of the
managed population.
Contract and risk management. The ability to effectively
predict outcomes will be fundamental as population health
management organizations accept greater performance
and utilization risk. Organizations will want to acquire or
contract for actuarial skills to help estimate risk within
the managed population.
The population health management business will be
fundamentally different from an acute-care-focused
healthcare system. Success will be defined by the ability to
identify condition-specific standards to maximize popula-
tion health outcomes and minimize preventable utilization
of acute-care facilities. Costs will be measured longitudi-
nally, on a per-member basis across the continuum of care,
not per incidence of care provided. Organizations will focus
on maximizing the number of lives covered, not the units of
care provided. If the healthcare system moves toward popu-
lation health management, hospitals will have to prepare
for a much different future by reducing overhead costs and
eliminating excess capacity.

36
t he future state alternatives described are all in an
early stage of development, and their viability will
be tested over the next few years. What is clear, how-
ever, is the industry’s movement toward value. Providers
should begin now to plan for a value-based future, using
these four steps:
1. Assess your organization’s current and desired state
on the value continuum. HFMA is developing a web-
based tool tied to the four value capabilities and related
skills that will be available on the Value Project’s website
(www.hfma.org/ValueProject). The tool will include a
self-assessment questionnaire that identifies where you
are on the value continuum, and what skills you should
develop to achieve foundational and advanced status
as a value provider. Or users can simply browse the tool
to see what skills are recommended for the value capa-
bilities. The skills are supported by strategies, tactics,
and tools contributed by the providers interviewed for
the Value Project. Organizations should also assess
conditions in their local market to help predict future
directions for change, considering such factors as align-
ment with clinicians, access to capital, sophistication
and use of IT for clinical and financial decision making,
success with performance management, market share,
and competitive environment.
2. Prioritize the development of capabilities for your
organization. After assessing your organization’s
current capabilities and those needed to reach the
desired state, it will be important to examine areas in
need of greatest skill development. What forces within
your organization could constrain or accelerate your
development of value capabilities, and how could you
constrain negative forces and strengthen positive
forces for change?
3. institute proven practices to develop necessary
capabilities. Reference the Value Project’s future web-
based tool for specific strategies and tactics to build
skills within the four value capabilities. Also, watch for
Value Project educational opportunities and HFMA
publications featuring provider case studies on proven
value-based practices.
4. Develop a process to measure the progress of your
organization’s capability development. Align goals
across your organization to create a uniform emphasis
on achieving your value objectives, establishing realistic
targets for short-term and long-term goals. Identify
the right metrics for scorecards that cascade these goals
throughout your organization. Be disciplined in measuring
and reporting progress toward these goals by establish-
ing baseline performance, seeking to understand the
causes of progress and delay, and adjusting your goals
accordingly. Prepare for missteps, but commit to learn
from them as your organization moves toward a stronger
value position.
In the coming months, HFMA will also produce a
series of shorter reports dedicated to each of the four
value capabilities outlined in this document, describing
how providers can begin to bridge the gap between current
practices and a value-based future. A fifth report will
focus specifically on the evolving role of the CFO in a
value-based healthcare system.
In his 2008 letter to Berkshire Hathaway stockholders,
Warren Buffett wrote about a lesson he learned from his
mentor, economist and investor Ben Graham: “Price is
what you pay; value is what you get.” We as a nation are now
demanding that the price we pay for health care gets us
value in return. It is our job as an industry to determine
how we can best produce that value.
StePS to SuPPort VAlue-bASeD trAnSformAtion

reSeArch SPonSorS AnD AcknowleDgementS
research for this report was sponsored by the 17 hospitals and health systems represented on HFMA’s Value Steering Group, including
Project consultant: terry Allison rappuhn

PublicAtion SPonSorS
VAlue in heAlth cAre: current StAte AnD future DirectionS
june 2011 copyright 2011
healthcare financial management Associationtwo westbrook corporate center, Suite 700westchester, illinois 60154-5700
All rights reserved.correspondence: [email protected]
the Healthcare Financial Management Association (HFMA) provides the resources healthcare organizations need to achieve sound fiscal health in order to provide excellent patient care. With more than 35,000 members, HFMA is the nation’s leading membership organization of healthcare finance executives and leaders. We provide education, analysis, and guidance; we lead change and innovative thinking; and we create practical tools and solutions that help our members get results. Addressing capital access to improved patient care to technology advancement, HFMA is an indispensable resource on healthcare finance issues.
PubliSheD by