Embed Size (px)
Citation preview
Valuing ASCs and Recent Trends in ASC Transactions
Presented By
Todd J. Mello, ASA, CVA, MBA, Founding Partner
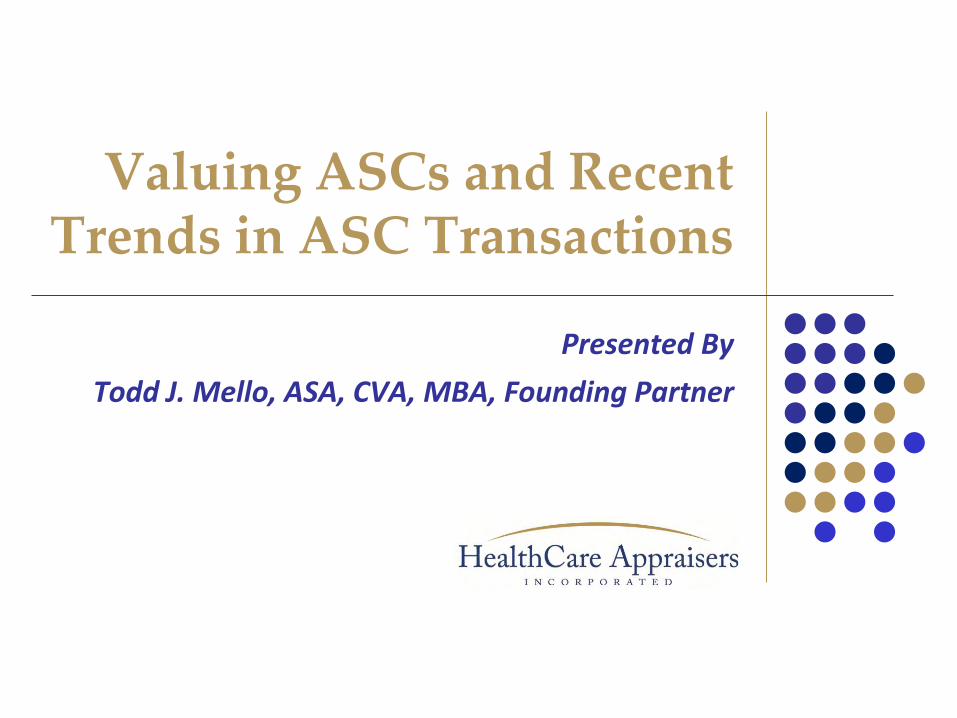
Presentation Outline
• Valuation 101: Approaches and Methods and other 411
• Do’s and Don’ts
• Value Enhancers and Value Detractors
• Minority vs. Majority/Control
• History, Purpose and Limitations of the Survey
• What are Valuation Multiples?
• Reported Earnings Multiples
• Other Survey Observations (time permitting)
2 Valuing ASCs and Recent Trends in ASC Transactions
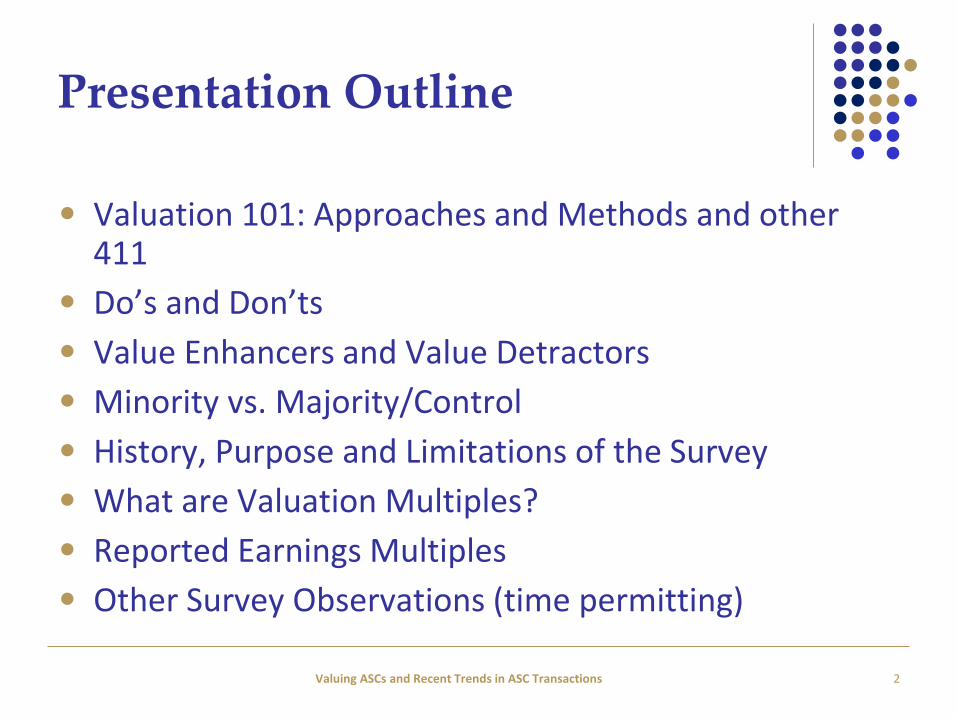
Valuation 101
• Valuation is forward looking
• Why get a valuation?
• Standard of value in most healthcare transactions is Fair Market Value. The definition of fair market value in healthcare is slightly different than
the standard valuation definition.
• the price at which property would change hands between a hypothetical willing and able buyer and a hypothetical willing and able seller, acting at arm’s length in an open and unrestricted market, when neither is under compulsion to buy or sell … between well informed parties who are not otherwise in a position to generate business for the other party…
• Implications of “hypothetical”
3 Valuing ASCs and Recent Trends in ASC Transactions
Valuation 101
• Income Approach – A general way of determining a value indication of a business, business ownership interest, security, or intangible asset using one or more methods that convert anticipated future economic benefits into a single present amount.
• Most common methods: Discounted Cash Flow Method and Capitalization of Earnings Method
• When and why?
• Example: next slide
4 Valuing ASCs and Recent Trends in ASC Transactions
Valuation 101
5 Valuing ASCs and Recent Trends in ASC Transactions
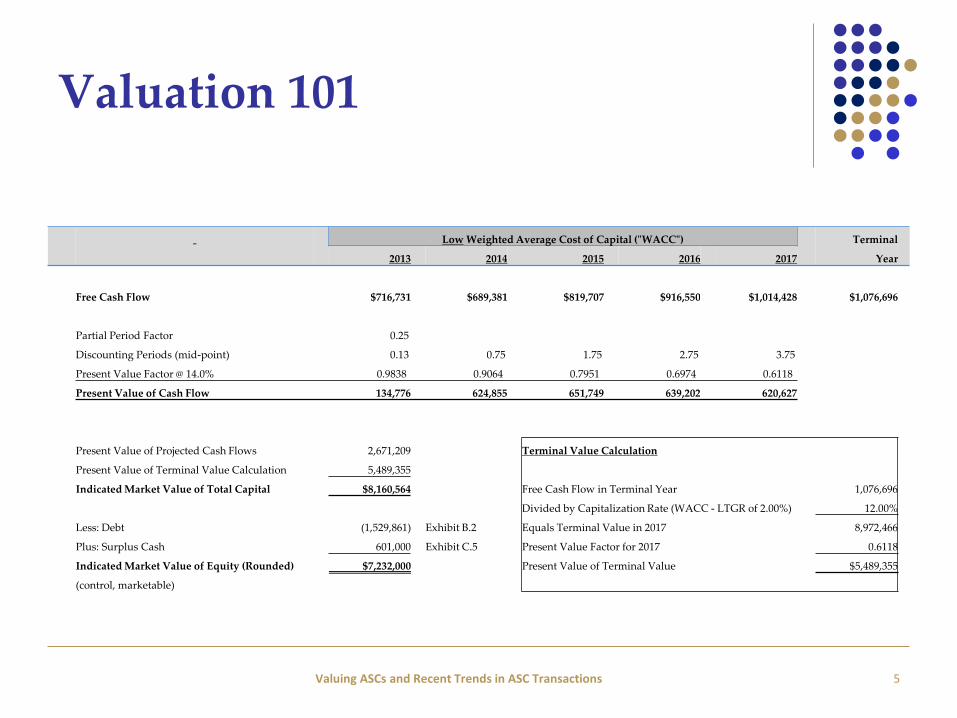
Low Weighted Average Cost of Capital ("WACC") Terminal
2013 2014 2015 2016 2017 Year
Free Cash Flow $716,731 $689,381 $819,707 $916,550 $1,014,428 $1,076,696
Partial Period Factor 0.25
Discounting Periods (mid-point) 0.13 0.75 1.75 2.75 3.75
Present Value Factor @ 14.0% 0.9838 0.9064 0.7951 0.6974 0.6118
Present Value of Cash Flow 134,776 624,855 651,749 639,202 620,627
Present Value of Projected Cash Flows 2,671,209 Terminal Value Calculation
Present Value of Terminal Value Calculation 5,489,355
Indicated Market Value of Total Capital $8,160,564 Free Cash Flow in Terminal Year 1,076,696
Divided by Capitalization Rate (WACC - LTGR of 2.00%) 12.00%
Less: Debt (1,529,861) Exhibit B.2 Equals Terminal Value in 2017 8,972,466
Plus: Surplus Cash 601,000 Exhibit C.5 Present Value Factor for 2017 0.6118
Indicated Market Value of Equity (Rounded) $7,232,000 Present Value of Terminal Value $5,489,355
(control, marketable)
Valuation 101
• Market Approach – A general way of determining a value indication of a business, business ownership interest, security, or intangible asset using one or more methods that compare the subject to similar businesses, business ownership interests, securities, or intangible assets that have been sold.
• Most common methods: Guideline Publicly Traded Method and Comparative Transactions Method
• When and why?
6 Valuing ASCs and Recent Trends in ASC Transactions
What are Valuation Multiples?
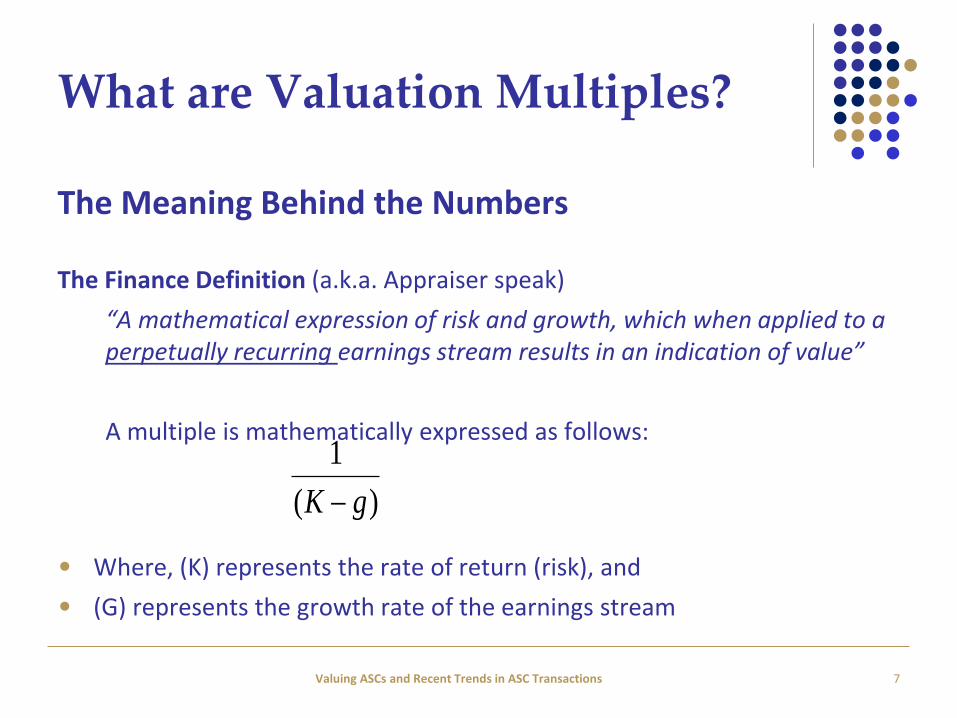
The Meaning Behind the Numbers
The Finance Definition (a.k.a. Appraiser speak)
“A mathematical expression of risk and growth, which when applied to a perpetually recurring earnings stream results in an indication of value”
A multiple is mathematically expressed as follows:
• Where, (K) represents the rate of return (risk), and
• (G) represents the growth rate of the earnings stream
7
)(
1
gK
Valuing ASCs and Recent Trends in ASC Transactions
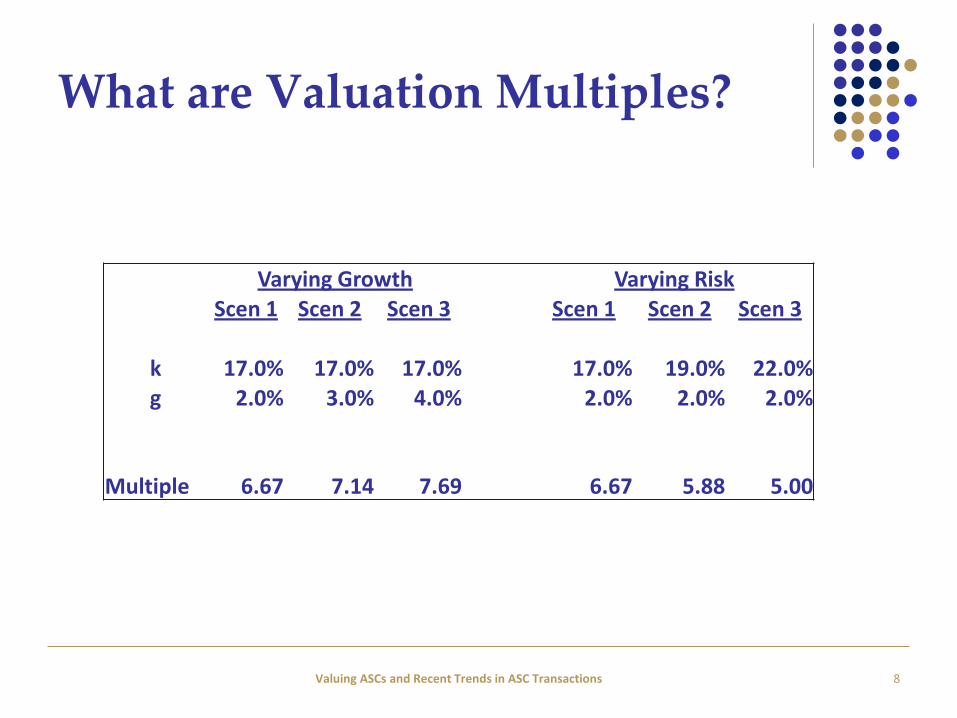
What are Valuation Multiples?
Varying Growth Varying Risk Scen 1 Scen 2 Scen 3 Scen 1 Scen 2 Scen 3
k 17.0% 17.0% 17.0% 17.0% 19.0% 22.0% g 2.0% 3.0% 4.0% 2.0% 2.0% 2.0%
Multiple
6.67
7.14
7.69
6.67
5.88
5.00
8 Valuing ASCs and Recent Trends in ASC Transactions
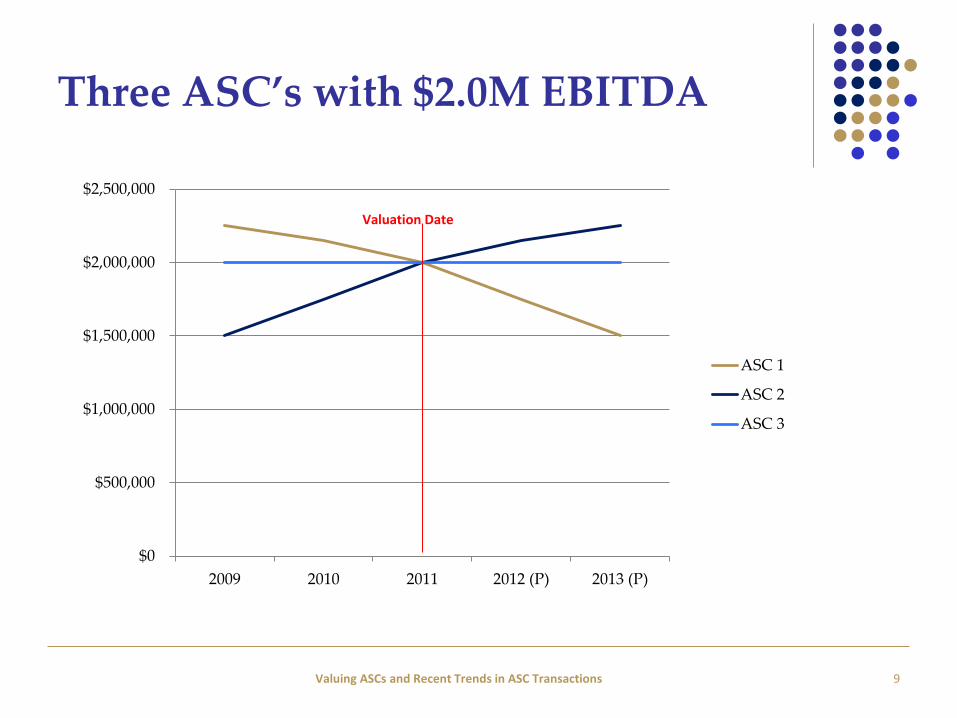
Three ASC’s with $2.0M EBITDA
$0
$500,000
$1,000,000
$1,500,000
$2,000,000
$2,500,000
2009 2010 2011 2012 (P) 2013 (P)
ASC 1
ASC 2
ASC 3
Valuation Date
9 Valuing ASCs and Recent Trends in ASC Transactions
Valuation 101
• Asset or Cost Approach – A general way of determining a value indication of a business, business ownership interest, or security using one or more methods based on the value of the assets net of liabilities.
• When and why?
10 Valuing ASCs and Recent Trends in ASC Transactions
Minority vs. Majority Control
• Interests providing absolute control (e.g., greater than a 50% interest) are worth more than interests which do not have the same control rights.
• Control granted by the governing documents. Examples include:
• Major equipment purchases and investments
• Debt signing authority
• Admitting new owners
• Granting physician privileges
11 Valuing ASCs and Recent Trends in ASC Transactions
Do’s and Don’ts
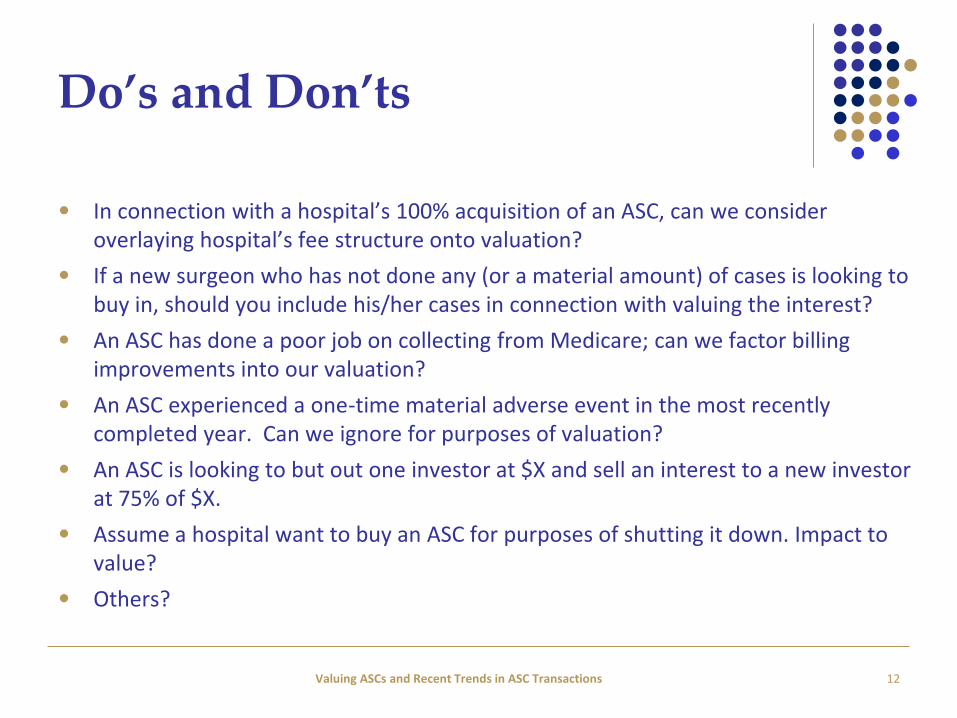
• In connection with a hospital’s 100% acquisition of an ASC, can we consider overlaying hospital’s fee structure onto valuation?
• If a new surgeon who has not done any (or a material amount) of cases is looking to buy in, should you include his/her cases in connection with valuing the interest?
• An ASC has done a poor job on collecting from Medicare; can we factor billing improvements into our valuation?
• An ASC experienced a one-time material adverse event in the most recently completed year. Can we ignore for purposes of valuation?
• An ASC is looking to but out one investor at $X and sell an interest to a new investor at 75% of $X.
• Assume a hospital want to buy an ASC for purposes of shutting it down. Impact to value?
• Others?
12 Valuing ASCs and Recent Trends in ASC Transactions
Value Enhancers/Detractors
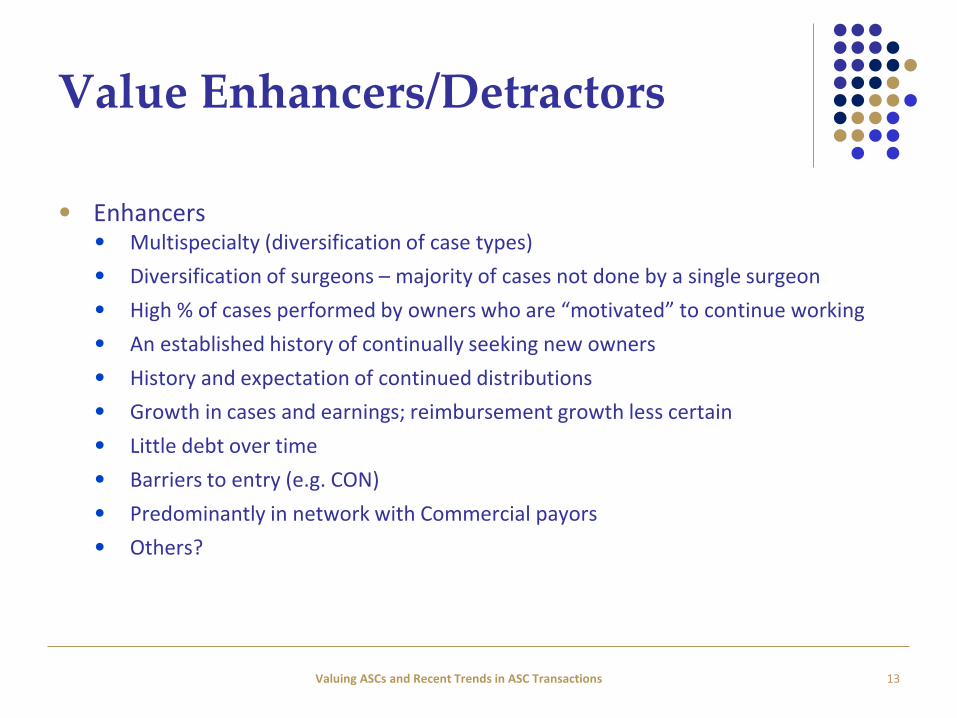
• Enhancers • Multispecialty (diversification of case types)
• Diversification of surgeons – majority of cases not done by a single surgeon
• High % of cases performed by owners who are “motivated” to continue working
• An established history of continually seeking new owners
• History and expectation of continued distributions
• Growth in cases and earnings; reimbursement growth less certain
• Little debt over time
• Barriers to entry (e.g. CON)
• Predominantly in network with Commercial payors
• Others?
13 Valuing ASCs and Recent Trends in ASC Transactions
Value Enhancers/Detractors
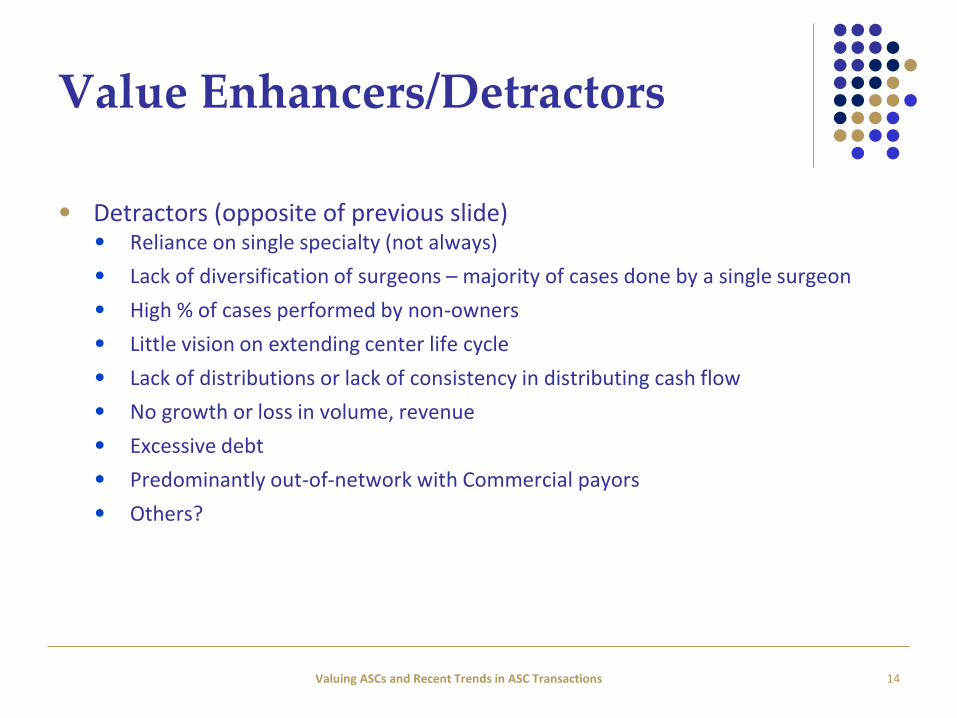
• Detractors (opposite of previous slide) • Reliance on single specialty (not always)
• Lack of diversification of surgeons – majority of cases done by a single surgeon
• High % of cases performed by non-owners
• Little vision on extending center life cycle
• Lack of distributions or lack of consistency in distributing cash flow
• No growth or loss in volume, revenue
• Excessive debt
• Predominantly out-of-network with Commercial payors
• Others?
14 Valuing ASCs and Recent Trends in ASC Transactions
History, Purpose & Limitations of the Survey
• Since 2003, HAI has published ten annual ASC surveys
• Why? To provide a centralized source of market intelligence on valuation trends within the ASC industry.
• 2014 was largest to date with 25 companies respondents
• Disclaimer: Survey should not be used in lieu of a formal valuation.
15 Valuing ASCs and Recent Trends in ASC Transactions
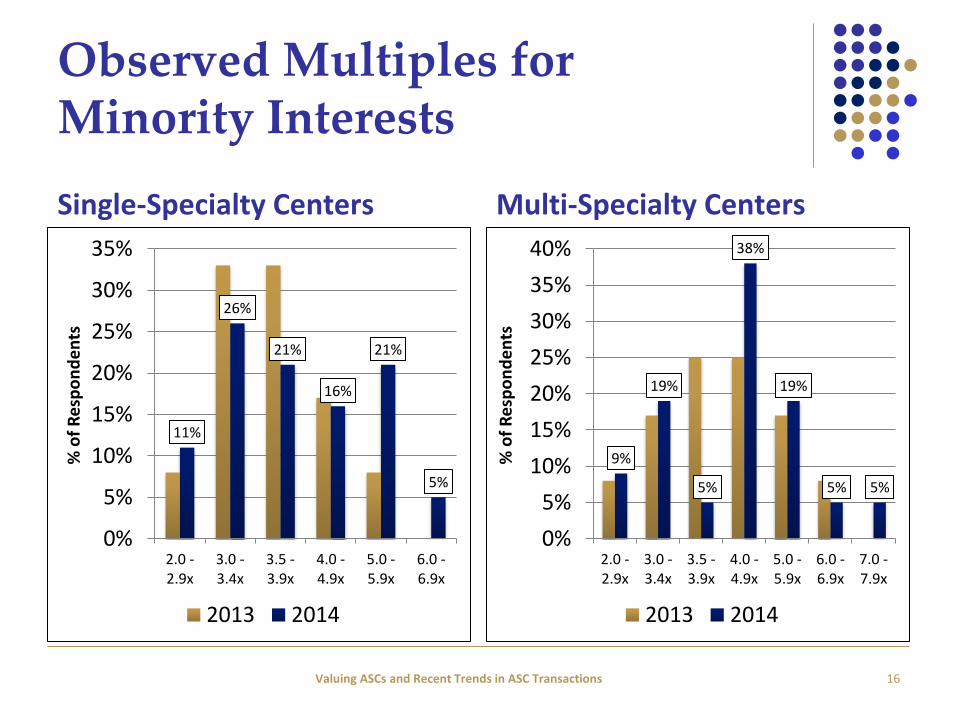
Observed Multiples for Minority Interests
Single-Specialty Centers Multi-Specialty Centers
16
11%
26%
21%
16%
21%
5%
0%
5%
10%
15%
20%
25%
30%
35%
2.0 -2.9x
3.0 -3.4x
3.5 -3.9x
4.0 -4.9x
5.0 -5.9x
6.0 -6.9x
% o
f R
esp
on
de
nts
2013 2014
9%
19%
5%
38%
19%
5% 5%
0%
5%
10%
15%
20%
25%
30%
35%
40%
2.0 -2.9x
3.0 -3.4x
3.5 -3.9x
4.0 -4.9x
5.0 -5.9x
6.0 -6.9x
7.0 -7.9x
% o
f R
esp
on
de
nts
2013 2014
Valuing ASCs and Recent Trends in ASC Transactions
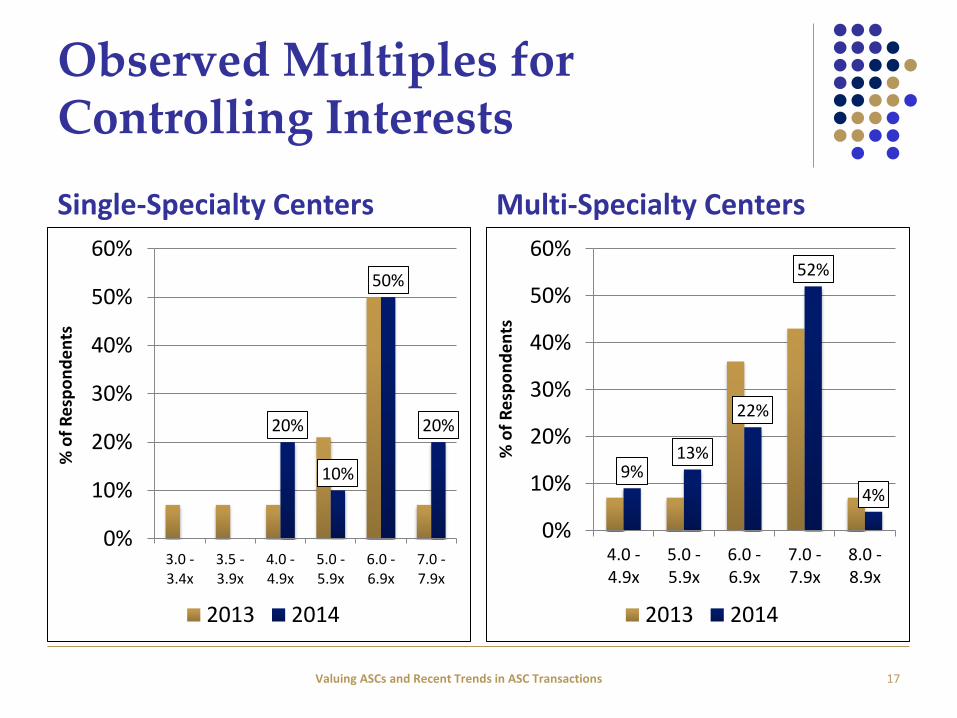
Observed Multiples for Controlling Interests
Single-Specialty Centers Multi-Specialty Centers
17
20%
10%
50%
20%
0%
10%
20%
30%
40%
50%
60%
3.0 -3.4x
3.5 -3.9x
4.0 -4.9x
5.0 -5.9x
6.0 -6.9x
7.0 -7.9x
% o
f R
esp
on
de
nts
2013 2014
9% 13%
22%
52%
4%
0%
10%
20%
30%
40%
50%
60%
4.0 -4.9x
5.0 -5.9x
6.0 -6.9x
7.0 -7.9x
8.0 -8.9x
% o
f R
esp
on
de
nts
2013 2014
Valuing ASCs and Recent Trends in ASC Transactions
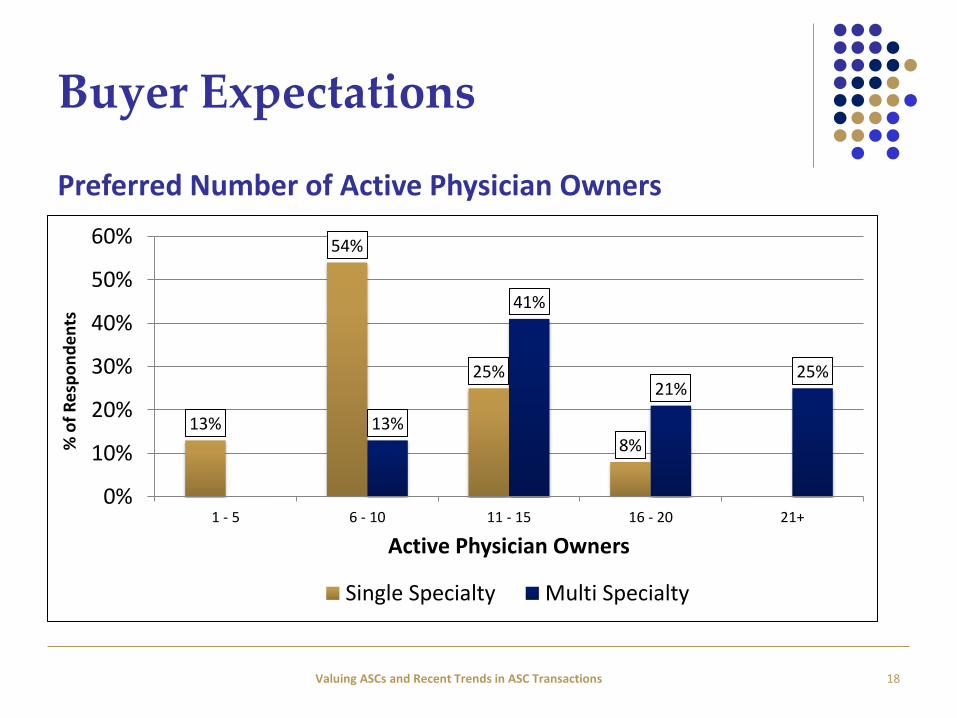
Buyer Expectations
18
Preferred Number of Active Physician Owners
13%
54%
25%
8% 13%
41%
21% 25%
0%
10%
20%
30%
40%
50%
60%
1 - 5 6 - 10 11 - 15 16 - 20 21+
% o
f R
esp
on
de
nts
Active Physician Owners
Single Specialty Multi Specialty
Valuing ASCs and Recent Trends in ASC Transactions
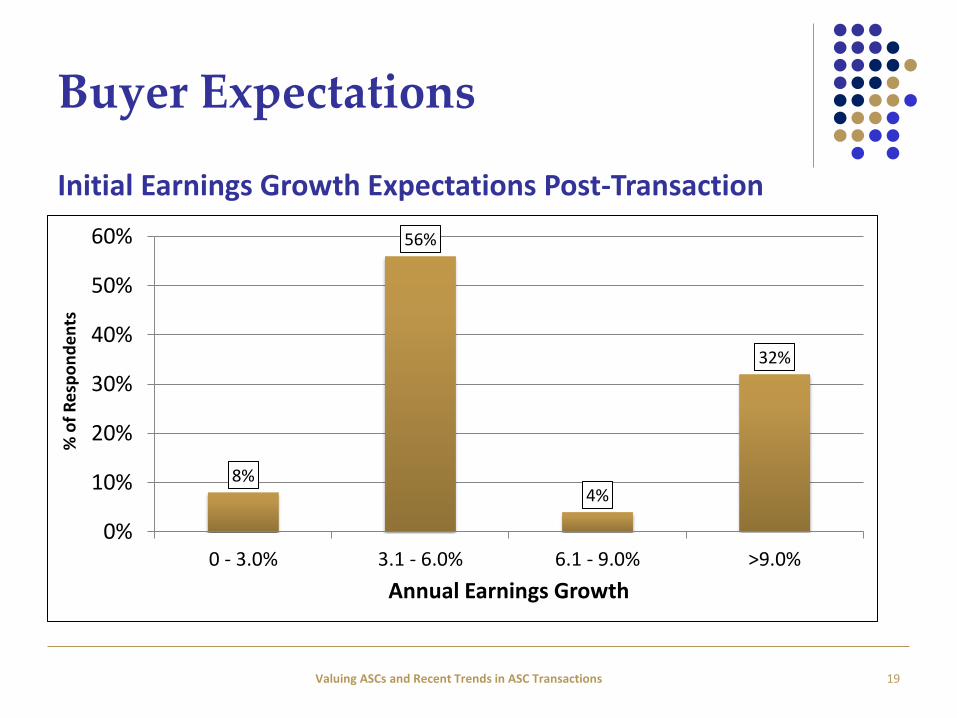
Buyer Expectations
19
Initial Earnings Growth Expectations Post-Transaction
8%
56%
4%
32%
0%
10%
20%
30%
40%
50%
60%
0 - 3.0% 3.1 - 6.0% 6.1 - 9.0% >9.0%
% o
f R
esp
on
de
nts
Annual Earnings Growth
Valuing ASCs and Recent Trends in ASC Transactions
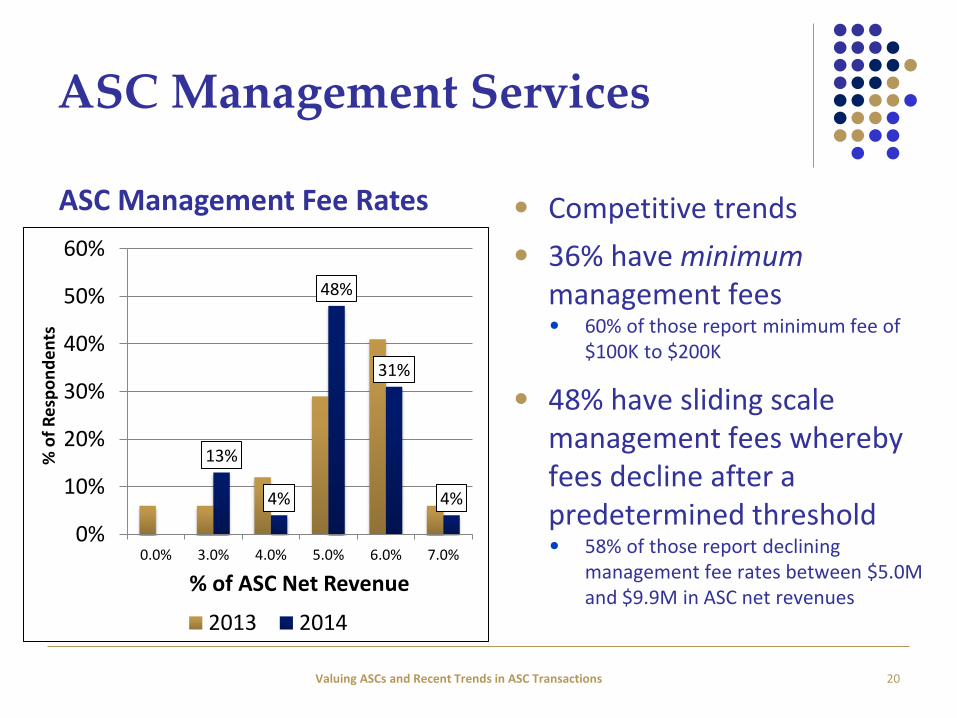
ASC Management Services
• Competitive trends
• 36% have minimum management fees • 60% of those report minimum fee of
$100K to $200K
• 48% have sliding scale management fees whereby fees decline after a predetermined threshold • 58% of those report declining
management fee rates between $5.0M and $9.9M in ASC net revenues
20
13%
4%
48%
31%
4%
0%
10%
20%
30%
40%
50%
60%
0.0% 3.0% 4.0% 5.0% 6.0% 7.0%
% o
f R
esp
on
de
nts
% of ASC Net Revenue
2013 2014
ASC Management Fee Rates
Valuing ASCs and Recent Trends in ASC Transactions
ASC Management Services
• 80% report no management arrangements with fees at risk for performance • 76% reported no at risk arrangements in 2013
• 64% report holding ownership in all managed ASCs • Over half of those who manage, or plan to manage, non-owned ASCs indicate
increasing management fees 1% to 3% or more for service-only ASCs
21 Valuing ASCs and Recent Trends in ASC Transactions
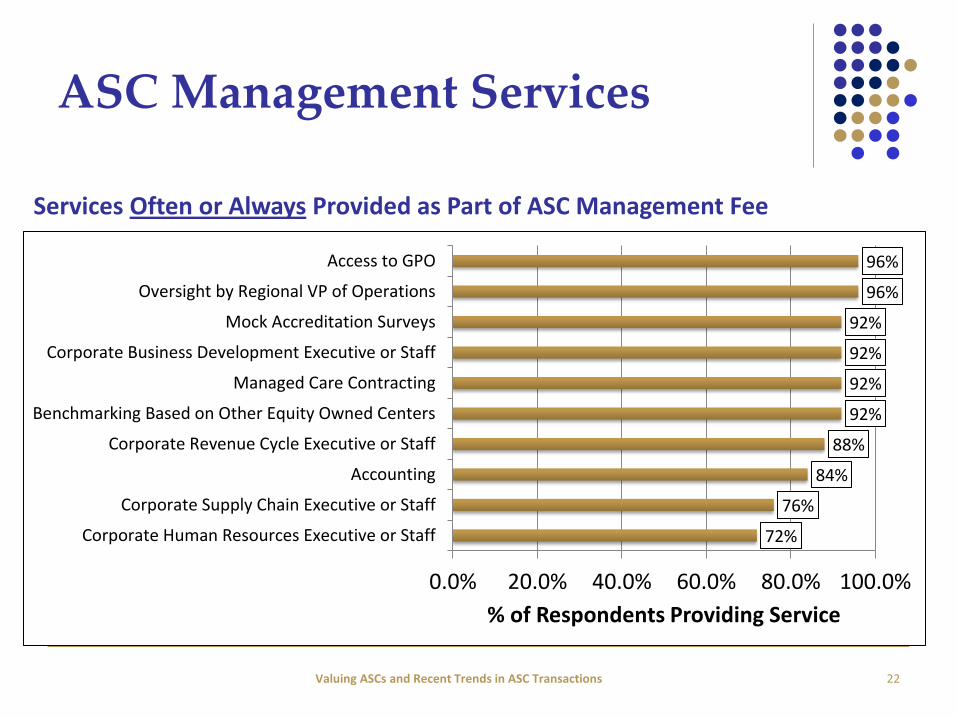
ASC Management Services
22
72%
76%
84%
88%
92%
92%
92%
92%
96%
96%
0.0% 20.0% 40.0% 60.0% 80.0% 100.0%
Corporate Human Resources Executive or Staff
Corporate Supply Chain Executive or Staff
Accounting
Corporate Revenue Cycle Executive or Staff
Benchmarking Based on Other Equity Owned Centers
Managed Care Contracting
Corporate Business Development Executive or Staff
Mock Accreditation Surveys
Oversight by Regional VP of Operations
Access to GPO
% of Respondents Providing Service
Services Often or Always Provided as Part of ASC Management Fee
Valuing ASCs and Recent Trends in ASC Transactions
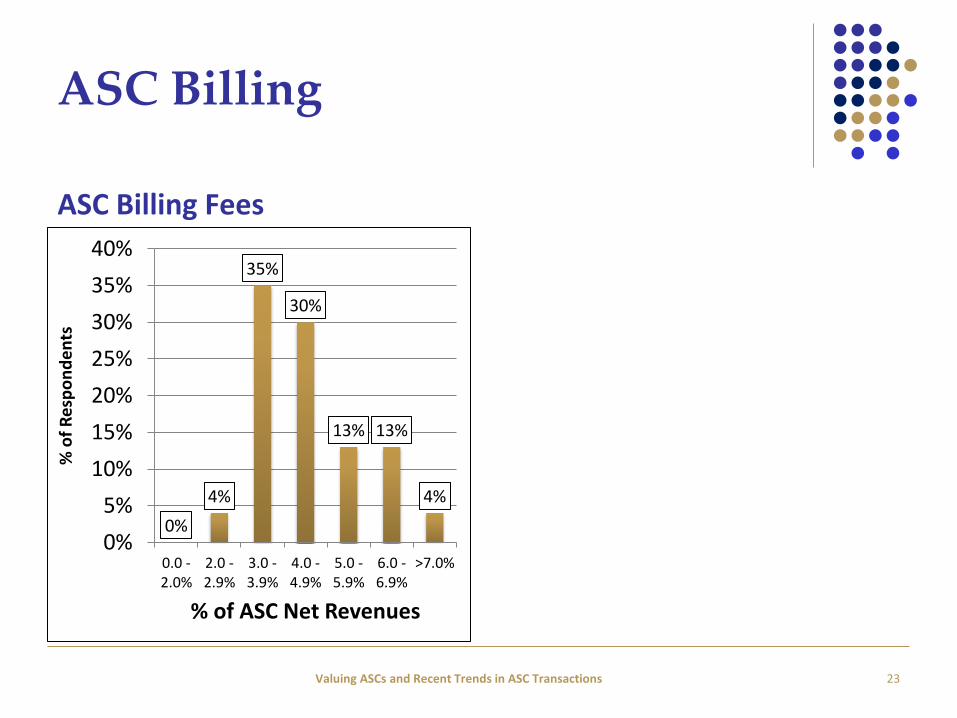
ASC Billing
ASC Billing Fees
23
0%
4%
35%
30%
13% 13%
4%
0%
5%
10%
15%
20%
25%
30%
35%
40%
0.0 -2.0%
2.0 -2.9%
3.0 -3.9%
4.0 -4.9%
5.0 -5.9%
6.0 -6.9%
>7.0%
% o
f R
esp
on
de
nts
% of ASC Net Revenues
Valuing ASCs and Recent Trends in ASC Transactions
QUESTIONS?
24 Valuing ASCs and Recent Trends in ASC Transactions
Valuing ASCs and Recent Trends in ASC Transactions
Todd J. Mello • [email protected]
HealthCare Appraisers, Inc. – Denver Office
(303) 688-0700