Embed Size (px)
Citation preview
See the inside front cover for important information about accessto your fund’s annual and semiannual shareholder reports.
Annual Report | January 31, 2020
Vanguard Dividend Growth Fund
Contents
Please note: The opinions expressed in this report are just that—informed opinions. They should not be considered promisesor advice. Also, please keep in mind that the information and opinions cover the period through the date on the front of thisreport. Of course, the risks of investing in your fund are spelled out in the prospectus.
Important information about access to shareholder reports
Beginning on January 1, 2021, as permitted by regulations adopted by theSecurities and Exchange Commission, paper copies of your fund’s annual andsemiannual shareholder reports will no longer be sent to you by mail, unless youspecifically request them. Instead, you will be notified by mail each time a reportis posted on the website and will be provided with a link to access the report.
If you have already elected to receive shareholder reports electronically, you will notbe affected by this change and do not need to take any action. You may elect toreceive shareholder reports and other communications from the fund electronicallyby contacting your financial intermediary (such as a broker-dealer or bank) or, if youinvest directly with the fund, by calling Vanguard at one of the phone numbers onthe back cover of this report or by logging on to vanguard.com.
You may elect to receive paper copies of all future shareholder reports freeof charge. If you invest through a financial intermediary, you can contact theintermediary to request that you continue to receive paper copies. If you investdirectly with the fund, you can call Vanguard at one of the phone numbers on theback cover of this report or log on to vanguard.com. Your election to receive papercopies will apply to all the funds you hold through an intermediary or directly withVanguard.
A Note From Our Chairman. . . . . . . . . . . . . . . . . . . . . . . . . . 1
Your Fund’s Performance at a Glance. . . . . . . . . . . . . . . . . . 2
Advisor’s Report. . . . . . . . . . . . . . . . . . . . . . . . . . . . . . . . . . . 3
About Your Fund’s Expenses. . . . . . . . . . . . . . . . . . . . . . . . . 7
Performance Summary. . . . . . . . . . . . . . . . . . . . . . . . . . . . . .9
Financial Statements. . . . . . . . . . . . . . . . . . . . . . . . . . . . . . 11
Trustees Approve Advisory Arrangement. . . . . . . . . . . . . . 22
1
Dear Shareholder,
These are challenging times. The markets plummet one day and bounce back the next as investors process the uncertainty surrounding the coronavirus outbreak.
At Vanguard, we tell investors to “stay the course” in good times and bad. This means focusing on your investment goals, keeping a long-term perspective, being balanced across and diversified within asset classes, and limiting cost.
Vanguard investors have proven time and again that they know how to stay calm in a market downturn—an attribute that has served them well. But for those who are weathering their first bout of market volatility or could just use a friendly reminder, let me offer three points.
First, we stand by our counsel—“stay the course.”
Don’t be tempted to time the markets. It’s a losing strategy. An investment plan established during calmer times should not be abandoned in the midst of a market downturn. Although having exposure to different asset classes does not eliminate the risk of loss, we believe investors should let the potential benefits of diversification play out.
Second, whether you’re new to investing or a seasoned financial advisor, don’t feel that you need to go it alone. Our mission is to help you succeed, so reach out if we can be of help.
Our websites are constantly refreshed with our latest thinking on the markets and economy. And our experts offer practical advice on how to put this perspective to work in your portfolios.
And, finally, thank you.
Thank you for entrusting us with your financial success. It’s a tremendous responsibility that we take very seriously. No matter the market conditions, we look forward to partnering with you and helping you reach your investment goals.
Sincerely,
Mortimer J. Buckley Chairman and Chief Executive Officer March 3, 2020
A Note From Our Chairman
Tim BuckleyChairman and Chief Executive Officer
• For the fiscal year ended January 31, 2020, Vanguard Dividend Growth Fund returned 23.33%, ahead of the 22.73% return of its benchmark, the NASDAQ US Dividend Achievers Select Index.
• Dividend-paying stocks outpaced the broad U.S. stock market for the 12 months amid continuing concerns about slowing global economic growth, trade disputes, and geopolitical tensions.
• Large-capitalization stocks outperformed small- and mid-caps and growth stocks outperformed their value counterparts for the period.
• The fund’s benchmark consists of the stocks of companies that have a record of increasing dividends over time.
• All but one of the fund’s industry sectors posted positive results, led by information technology and materials. Only the energy sector declined for the fund. The advisor’s stock selections in consumer staples and health care boosted the fund’s return most compared with the benchmark.
Your Fund’s Performance at a Glance
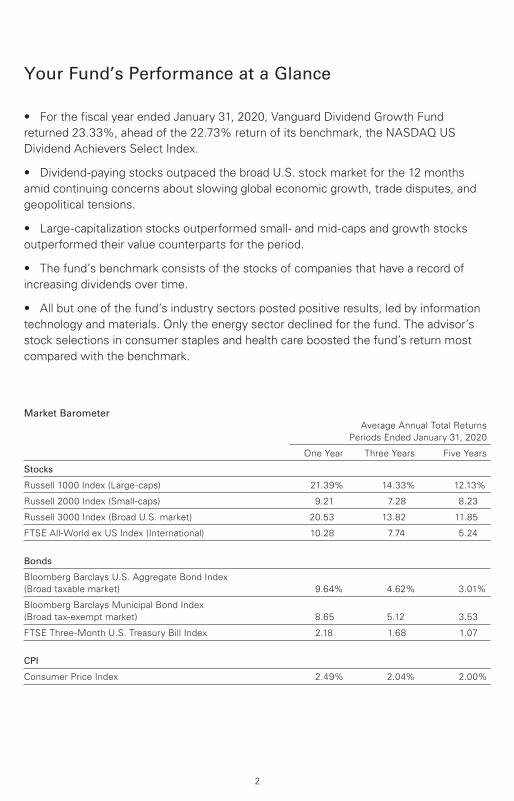
Market Barometer Average Annual Total Returns Periods Ended January 31, 2020
One Year Three Years Five Years
Stocks
Russell 1000 Index (Large-caps) 21.39% 14.33% 12.13%
Russell 2000 Index (Small-caps) 9.21 7.28 8.23
Russell 3000 Index (Broad U.S. market) 20.53 13.82 11.85
FTSE All-World ex US Index (International) 10.28 7.74 5.24
Bonds
Bloomberg Barclays U.S. Aggregate Bond Index (Broad taxable market) 9.64% 4.62% 3.01%
Bloomberg Barclays Municipal Bond Index (Broad tax-exempt market) 8.65 5.12 3.53
FTSE Three-Month U.S. Treasury Bill Index 2.18 1.68 1.07
CPI
Consumer Price Index 2.49% 2.04% 2.00%
2
Advisor’s Report
3
For the fiscal year ended January 31, 2020, Vanguard Dividend Growth Fund returned 23.33%, outperforming the 22.73% return of its benchmark, the NASDAQ US Dividend Achievers Select Index.
The investment environmentU.S. equities, as measured by the Standard & Poor’s 500 Index, rose 21.68%, buoyed by waning recession fears, improved trade sentiment, and accommodative Federal Reserve policies. Non-U.S. equities also climbed, returning 12.10%, as measured by the MSCI EAFE Index. They were aided by the signing of a phase-one U.S.-China trade agreement and by easing concerns about Brexit after Boris Johnson’s victory in the U.K. general election.
The fund’s relative performance over the 12 months was positive. During the first quarter of 2019, U.S. equities rallied to their largest quarterly advance since 2009, buoyed by a dovish shift in Fed policy and guidance, optimism over a U.S.-China trade deal, relatively strong fourth-quarter 2018 earnings, and corporate buybacks. By the summer, unresolved U.S. trade frictions with China, Mexico, Japan, and the European Union unsettled markets and raised concerns about potential risks to U.S. economic growth from increasing cost pressures, supply-chain disruptions, and waning business confidence and investment plans.
In the third quarter, U.S. equities continued to rise, and the U.S. economy remained resilient despite elevated geopolitical
uncertainties and slowing global growth. U.S.-China trade relations were particularly volatile in the absence of meaningful compromises on key structural issues, and expectations for a protracted trade war and the potential for a longer-term decoupling of the world’s two largest economies eroded consumer and business confidence and curtailed capital spending. The Fed lowered its benchmark interest rate in August and September by a combined half percentage point in an effort to sustain economic expansion and mitigate the risks of trade frictions and moderating growth.
U.S. equities surged again in the fourth quarter, benefiting from waning recession fears, improved trade sentiment, and accommodative Fed policies. In October, the Fed lowered rates for the final time in 2019, by a quarter percentage point. Trade tensions eased in December after the U.S. and China reached agreement.
For 2020, we anticipate volatility around near-term events (such as U.S.-China trade relations, the U.S. elections, and geopolitical risks) and remain mindful of the longer-term risks, including the potential impact of the coronavirus. We feel good about the companies we own and their ability to perform well regardless of the macroeconomic environment.
We are pleased with the fund’s performance and its consistency with our expectations in the current environment, but we remind ourselves that this is a long game. The storyline of consistent dividend
4
growth is a time-tested winner, and we intend to write many good chapters in the years ahead.
The fund’s successesStock selection in health care, information technology, consumer staples, and materials were the largest contributors for the fiscal year.
Sector allocation, a residual of our bottom-up stock selection process, detracted from performance. This was partly offset by our lack of exposure to communication services and our underweight allocation to industrials.
Among the top absolute contributors were Microsoft (information technology), American Tower (real estate), and Danaher (health care).
Microsoft, a worldwide provider of software services and solutions, gained on strong earnings and rapid growth in its cloud-computing business, Azure.
American Tower, a leading independent owner, operator, and developer of multitenant communications real estate, traded higher on strong earnings over the last three quarters. In 2019, the company announced its plan to acquire Eaton Towers in a push to take advantage of accelerating mobile phone usage and the rollout of 4G technology in Africa. By the start of 2020, the deal with Eaton was complete. And in
September 2019, AT&T signed a new master lease agreement with American Tower, pushing shares up another 3%.
Danaher, a provider of medical equipment, climbed early in the fiscal year on its announcement of a deal to acquire General Electric’s biopharma unit, putting Danaher at the forefront of biotechnology equipment makers. Strong earnings and the announced split-off of dental business Envista further benefited Danaher stock.
On a run-rate basis, the fund is expected to produce asset-weighted dividend growth of 18.3% for calendar year 2020. Our run-rate calculation is a rough estimate of potential dividend growth: It takes a company’s current declared dividend rate, annualizes it, and compares it with the previous calendar year’s actual dividend rate. This calculation does not accurately reflect dividend increases that may be announced later in the year, nor does it take into account the dollar amounts of the increases. Therefore, companies in the early stages of dividend growth tend to show large percentage increases even if their absolute cash dividend is small. The run-rate calculation also is not an accurate reflection of growth in the fund’s dividend payments to shareholders. Despite these shortcomings, we view this estimate as a reasonable report card.
A holding with a recent notable dividend run-rate increase is American Tower. On a run-rate basis, the company increased its dividend by 11.9%.
5
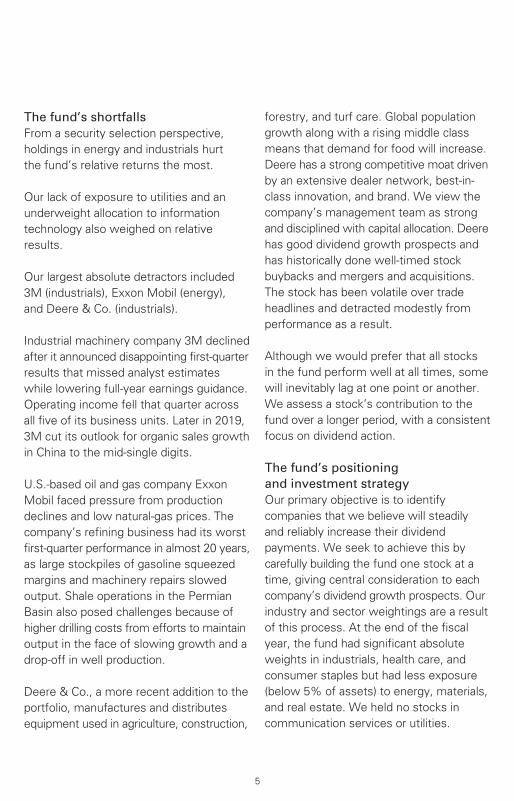
The fund’s shortfallsFrom a security selection perspective, holdings in energy and industrials hurt the fund’s relative returns the most.
Our lack of exposure to utilities and an underweight allocation to information technology also weighed on relative results.
Our largest absolute detractors included 3M (industrials), Exxon Mobil (energy), and Deere & Co. (industrials).
Industrial machinery company 3M declined after it announced disappointing first-quarter results that missed analyst estimates while lowering full-year earnings guidance. Operating income fell that quarter across all five of its business units. Later in 2019, 3M cut its outlook for organic sales growth in China to the mid-single digits.
U.S.-based oil and gas company Exxon Mobil faced pressure from production declines and low natural-gas prices. The company’s refining business had its worst first-quarter performance in almost 20 years, as large stockpiles of gasoline squeezed margins and machinery repairs slowed output. Shale operations in the Permian Basin also posed challenges because of higher drilling costs from efforts to maintain output in the face of slowing growth and a drop-off in well production.
Deere & Co., a more recent addition to the portfolio, manufactures and distributes equipment used in agriculture, construction,
forestry, and turf care. Global population growth along with a rising middle class means that demand for food will increase. Deere has a strong competitive moat driven by an extensive dealer network, best-in-class innovation, and brand. We view the company’s management team as strong and disciplined with capital allocation. Deere has good dividend growth prospects and has historically done well-timed stock buybacks and mergers and acquisitions. The stock has been volatile over trade headlines and detracted modestly from performance as a result.
Although we would prefer that all stocks in the fund perform well at all times, some will inevitably lag at one point or another. We assess a stock’s contribution to the fund over a longer period, with a consistent focus on dividend action.
The fund’s positioning and investment strategyOur primary objective is to identify companies that we believe will steadily and reliably increase their dividend payments. We seek to achieve this by carefully building the fund one stock at a time, giving central consideration to each company’s dividend growth prospects. Our industry and sector weightings are a result of this process. At the end of the fiscal year, the fund had significant absolute weights in industrials, health care, and consumer staples but had less exposure (below 5% of assets) to energy, materials, and real estate. We held no stocks in communication services or utilities.
6
Working on behalf of the fund’s share-holders, we are continuously trying to balance the virtue of rigid adherence to a focused approach to investment with the need to adjust and protect when necessary. We have high confidence in our investment approach and conviction that patience and careful stock-picking will deliver in the long term.
Donald J. Kilbride Senior Managing Director and Equity Portfolio Manager
Wellington Management Company LLP
February 12, 2020
About Your Fund’s Expenses
7
As a shareholder of the fund, you incur ongoing costs, which include costs for portfolio management, administrative services, and shareholder reports (like this one), among others. Operating expenses, which are deducted from a fund’s gross income, directly reduce the investment return of the fund.
A fund’s expenses are expressed as a percentage of its average net assets. This figure is known as the expense ratio. The following examples are intended to help you understand the ongoing costs (in dollars) of investing in your fund and to compare these costs with those of other mutual funds. The examples are based on an investment of $1,000 made at the beginning of the period shown and held for the entire period.
The accompanying table illustrates your fund’s costs in two ways:
• Based on actual fund return. This section helps you to estimate the actual expenses that you paid over the period. The ”Ending Account Value“ shown is derived from the fund‘s actual return, and the third column shows the dollar amount that would have been paid by an investor who started with $1,000 in the fund. You may use the information here, together with the amount you invested, to estimate the expenses that you paid over the period.
To do so, simply divide your account value by $1,000 (for example, an $8,600 account value divided by $1,000 = 8.6), then multiply the result by the number given for your fund under the heading ”Expenses Paid During Period.“
• Based on hypothetical 5% yearly return. This section is intended to help you compare your fund‘s costs with those of other mutual funds. It assumes that the fund had a yearly return of 5% before expenses, but that the expense ratio is unchanged. In this case—because the return used is not the fund’s actual return—the results do not apply to your investment. The example is useful in making comparisons because the Securities and Exchange Commission requires all mutual funds to calculate expenses based on a 5% return. You can assess your fund’s costs by comparing this hypothetical example with the hypothetical examples that appear in shareholder reports of other funds.
Note that the expenses shown in the table are meant to highlight and help you compare ongoing costs only and do not reflect transaction costs incurred by the fund for buying and sellingsecurities. Further, the expenses do not include any purchase, redemption, or account servicefees described in the fund prospectus. If such fees were applied to your account, your costswould be higher. Your fund does not carry a “sales load.”
The calculations assume no shares were bought or sold during the period. Your actual costs mayhave been higher or lower, depending on the amount of your investment and the timing of anypurchases or redemptions.
You can find more information about the fund’s expenses, including annual expense ratios, in theFinancial Statements section of this report. For additional information on operating expenses andother shareholder costs, please refer to your fund’s current prospectus.

8
Six Months Ended January 31, 2020
Dividend Growth Fund
BeginningAccount Value
7/31/2019
EndingAccount Value
1/31/2020
ExpensesPaid During
Period
Based on Actual Fund Return $1,000.00 $1,065.06 $1.46
Based on Hypothetical 5% Yearly Return 1,000.00 1,023.79 1.43
The calculations are based on expenses incurred in the most recent six-month period. The fund’s annualized six-month expense ratio forthat period is 0.28%. The dollar amounts shown as “Expenses Paid” are equal to the annualized expense ratio multiplied by the averageaccount value over the period, multiplied by the number of days in the most recent six-month period, then divided by the number of days inthe most recent 12-month period (184/365).
Performance Summary
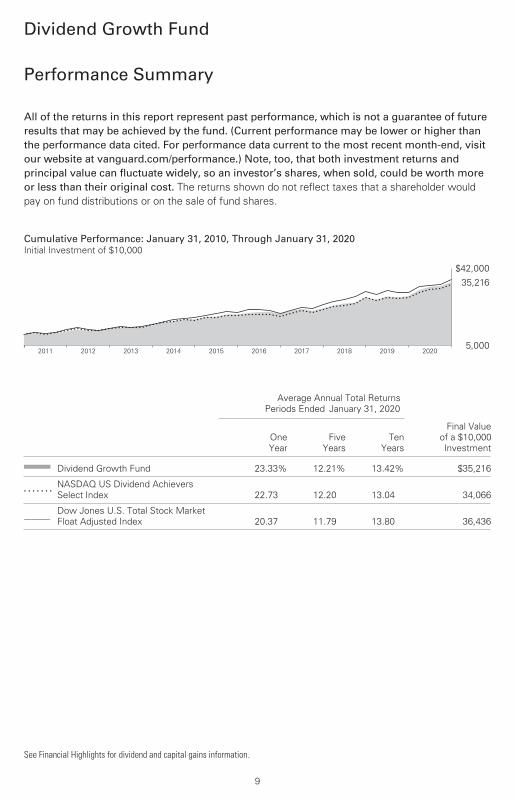
All of the returns in this report represent past performance, which is not a guarantee of future results that may be achieved by the fund. (Current performance may be lower or higher thanthe performance data cited. For performance data current to the most recent month-end, visitour website at vanguard.com/performance.) Note, too, that both investment returns and principal value can fluctuate widely, so an investor’s shares, when sold, could be worth more or less than their original cost. The returns shown do not reflect taxes that a shareholder would pay on fund distributions or on the sale of fund shares.
See Financial Highlights for dividend and capital gains information.
Dividend Growth Fund
9
Cumulative Performance: January 31, 2010, Through January 31, 2020Initial Investment of $10,000
2020201920182017201620152014201320122011
$42,000
5,000
35,216
Average Annual Total ReturnsPeriods Ended January 31, 2020
OneYear
FiveYears
TenYears
Final Valueof a $10,000Investment
Dividend Growth Fund 23.33% 12.21% 13.42% $35,216
• • • • • • •NASDAQ US Dividend AchieversSelect Index 22.73 12.20 13.04 34,066
_________Dow Jones U.S. Total Stock MarketFloat Adjusted Index 20.37 11.79 13.80 36,436
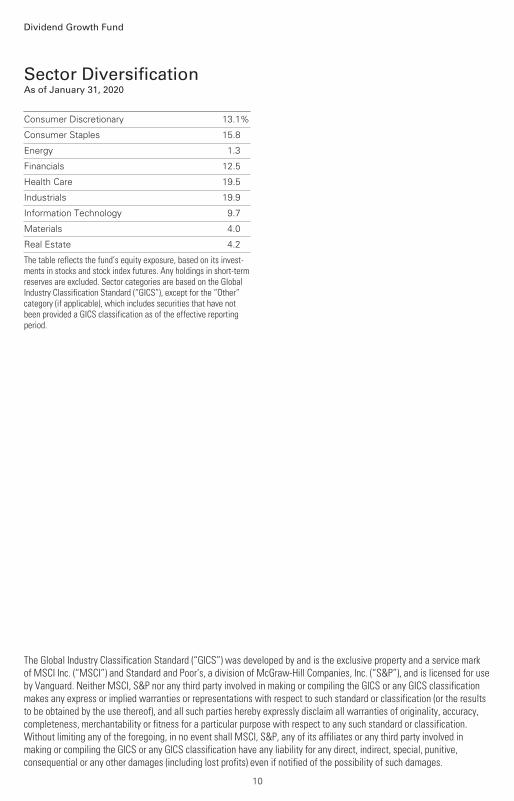
Sector DiversificationAs of January 31, 2020
Dividend Growth Fund
10
Consumer Discretionary 13.1%
Consumer Staples 15.8
Energy 1.3
Financials 12.5
Health Care 19.5
Industrials 19.9
Information Technology 9.7
Materials 4.0
Real Estate 4.2
The table reflects the fund’s equity exposure, based on its invest-ments in stocks and stock index futures. Any holdings in short-termreserves are excluded. Sector categories are based on the GlobalIndustry Classification Standard (“GICS”), except for the “Other”category (if applicable), which includes securities that have notbeen provided a GICS classification as of the effective reportingperiod.
The Global Industry Classification Standard (“GICS”) was developed by and is the exclusive property and a service markof MSCI Inc. (“MSCI”) and Standard and Poor’s, a division of McGraw-Hill Companies, Inc. (“S&P”), and is licensed for useby Vanguard. Neither MSCI, S&P nor any third party involved in making or compiling the GICS or any GICS classificationmakes any express or implied warranties or representations with respect to such standard or classification (or the resultsto be obtained by the use thereof), and all such parties hereby expressly disclaim all warranties of originality, accuracy,completeness, merchantability or fitness for a particular purpose with respect to any such standard or classification.Without limiting any of the foregoing, in no event shall MSCI, S&P, any of its affiliates or any third party involved inmaking or compiling the GICS or any GICS classification have any liability for any direct, indirect, special, punitive,consequential or any other damages (including lost profits) even if notified of the possibility of such damages.
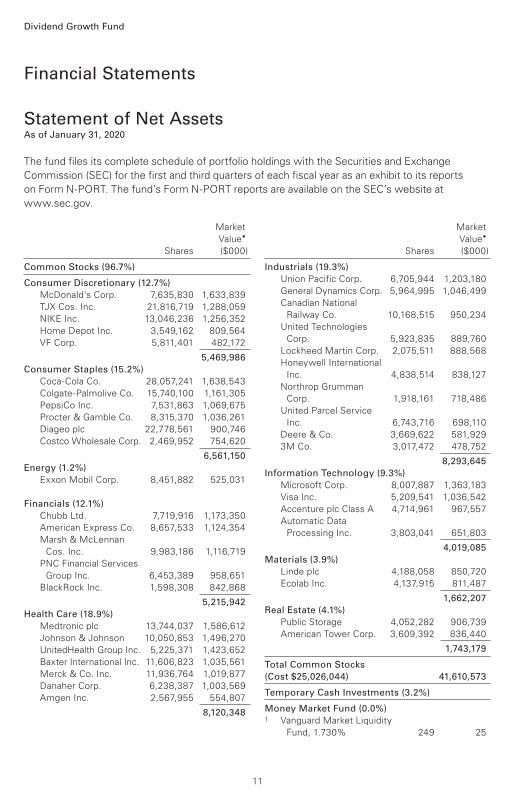
Financial Statements
Statement of Net AssetsAs of January 31, 2020
Dividend Growth Fund
Market
Value•
Shares ($000)
Market
Value•
Shares ($000)
Common Stocks (96.7%)
Consumer Discretionary (12.7%)
McDonald’s Corp. 7,635,830 1,633,839
TJX Cos. Inc. 21,816,719 1,288,059
NIKE Inc. 13,046,236 1,256,352
Home Depot Inc. 3,549,162 809,564
VF Corp. 5,811,401 482,172
5,469,986
Consumer Staples (15.2%)
Coca-Cola Co. 28,057,241 1,638,543
Colgate-Palmolive Co. 15,740,100 1,161,305
PepsiCo Inc. 7,531,863 1,069,675
Procter & Gamble Co. 8,315,370 1,036,261
Diageo plc 22,778,561 900,746
Costco Wholesale Corp. 2,469,952 754,620
6,561,150
Energy (1.2%)
Exxon Mobil Corp. 8,451,882 525,031
Financials (12.1%)
Chubb Ltd. 7,719,916 1,173,350
American Express Co. 8,657,533 1,124,354
Marsh & McLennan
Cos. Inc. 9,983,186 1,116,719
PNC Financial Services
Group Inc. 6,453,389 958,651
BlackRock Inc. 1,598,308 842,868
5,215,942
Health Care (18.9%)
Medtronic plc 13,744,037 1,586,612
Johnson & Johnson 10,050,853 1,496,270
UnitedHealth Group Inc. 5,225,371 1,423,652
Baxter International Inc. 11,606,823 1,035,561
Merck & Co. Inc. 11,936,764 1,019,877
Danaher Corp. 6,238,387 1,003,569
Amgen Inc. 2,567,955 554,807
8,120,348
Industrials (19.3%)
Union Pacific Corp. 6,705,944 1,203,180
General Dynamics Corp. 5,964,995 1,046,499
Canadian National
Railway Co. 10,168,515 950,234
United Technologies
Corp. 5,923,835 889,760
Lockheed Martin Corp. 2,075,511 888,568
Honeywell International
Inc. 4,838,514 838,127
Northrop Grumman
Corp. 1,918,161 718,486
United Parcel Service
Inc. 6,743,716 698,110
Deere & Co. 3,669,622 581,929
3M Co. 3,017,472 478,752
8,293,645
Information Technology (9.3%)
Microsoft Corp. 8,007,887 1,363,183
Visa Inc. 5,209,541 1,036,542
Accenture plc Class A 4,714,961 967,557
Automatic Data
Processing Inc. 3,803,041 651,803
4,019,085
Materials (3.9%)
Linde plc 4,188,058 850,720
Ecolab Inc. 4,137,915 811,487
1,662,207
Real Estate (4.1%)
Public Storage 4,052,282 906,739
American Tower Corp. 3,609,392 836,440
1,743,179
Total Common Stocks
(Cost $25,026,044) 41,610,573
Temporary Cash Investments (3.2%)
Money Market Fund (0.0%)1 Vanguard Market Liquidity
Fund, 1.730% 249 25
The fund files its complete schedule of portfolio holdings with the Securities and Exchange
Commission (SEC) for the first and third quarters of each fiscal year as an exhibit to its reports
on Form N-PORT. The fund’s Form N-PORT reports are available on the SEC’s website at
www.sec.gov.
11
Dividend Growth Fund
Face Market
Amount Value•
($000) ($000)
Face Market
Amount Value•
($000) ($000)
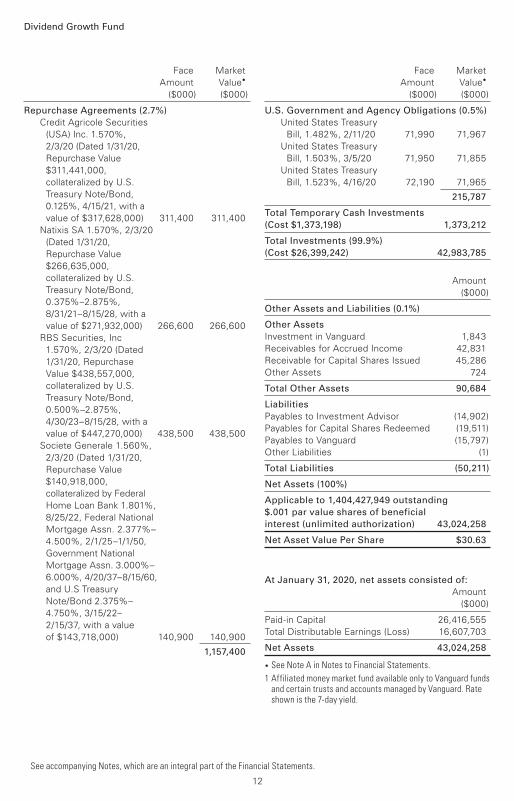
Repurchase Agreements (2.7%)
Credit Agricole Securities
(USA) Inc. 1.570%,
2/3/20 (Dated 1/31/20,
Repurchase Value
$311,441,000,
collateralized by U.S.
Treasury Note/Bond,
0.125%, 4/15/21, with a
value of $317,628,000) 311,400 311,400
Natixis SA 1.570%, 2/3/20
(Dated 1/31/20,
Repurchase Value
$266,635,000,
collateralized by U.S.
Treasury Note/Bond,
0.375%–2.875%,
8/31/21–8/15/28, with a
value of $271,932,000) 266,600 266,600
RBS Securities, Inc
1.570%, 2/3/20 (Dated
1/31/20, Repurchase
Value $438,557,000,
collateralized by U.S.
Treasury Note/Bond,
0.500%–2.875%,
4/30/23–8/15/28, with a
value of $447,270,000) 438,500 438,500
Societe Generale 1.560%,
2/3/20 (Dated 1/31/20,
Repurchase Value
$140,918,000,
collateralized by Federal
Home Loan Bank 1.801%,
8/25/22, Federal National
Mortgage Assn. 2.377%–
4.500%, 2/1/25–1/1/50,
Government National
Mortgage Assn. 3.000%–
6.000%, 4/20/37–8/15/60,
and U.S Treasury
Note/Bond 2.375%–
4.750%, 3/15/22–
2/15/37, with a value
of $143,718,000) 140,900 140,900
1,157,400
U.S. Government and Agency Obligations (0.5%)
United States Treasury
Bill, 1.482%, 2/11/20 71,990 71,967
United States Treasury
Bill, 1.503%, 3/5/20 71,950 71,855
United States Treasury
Bill, 1.523%, 4/16/20 72,190 71,965
215,787
Total Temporary Cash Investments
(Cost $1,373,198) 1,373,212
Total Investments (99.9%)
(Cost $26,399,242) 42,983,785
Amount
($000)
Other Assets and Liabilities (0.1%)
Other Assets
Investment in Vanguard 1,843
Receivables for Accrued Income 42,831
Receivable for Capital Shares Issued 45,286
Other Assets 724
Total Other Assets 90,684
Liabilities
Payables to Investment Advisor (14,902)
Payables for Capital Shares Redeemed (19,511)
Payables to Vanguard (15,797)
Other Liabilities (1)
Total Liabilities (50,211)
Net Assets (100%)
Applicable to 1,404,427,949 outstanding
$.001 par value shares of beneficial
interest (unlimited authorization) 43,024,258
Net Asset Value Per Share $30.63
At January 31, 2020, net assets consisted of:
Amount
($000)
Paid-in Capital 26,416,555
Total Distributable Earnings (Loss) 16,607,703
Net Assets 43,024,258
• See Note A in Notes to Financial Statements.
1 Affiliated money market fund available only to Vanguard funds and certain trusts and accounts managed by Vanguard. Rate shown is the 7-day yield.
See accompanying Notes, which are an integral part of the Financial Statements.
12
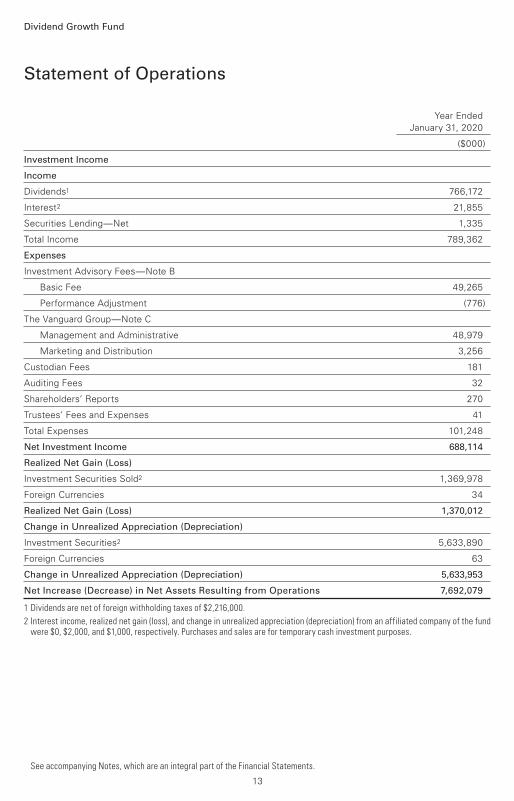
Year Ended
January 31, 2020
($000)
Investment Income
Income
Dividends1 766,172
Interest2 21,855
Securities Lending—Net 1,335
Total Income 789,362
Expenses
Investment Advisory Fees—Note B
Basic Fee 49,265
Performance Adjustment (776)
The Vanguard Group—Note C
Management and Administrative 48,979
Marketing and Distribution 3,256
Custodian Fees 181
Auditing Fees 32
Shareholders’ Reports 270
Trustees’ Fees and Expenses 41
Total Expenses 101,248
Net Investment Income 688,114
Realized Net Gain (Loss)
Investment Securities Sold2 1,369,978
Foreign Currencies 34
Realized Net Gain (Loss) 1,370,012
Change in Unrealized Appreciation (Depreciation)
Investment Securities2 5,633,890
Foreign Currencies 63
Change in Unrealized Appreciation (Depreciation) 5,633,953
Net Increase (Decrease) in Net Assets Resulting from Operations 7,692,079
1 Dividends are net of foreign withholding taxes of $2,216,000.
2 Interest income, realized net gain (loss), and change in unrealized appreciation (depreciation) from an affiliated company of the fund were $0, $2,000, and $1,000, respectively. Purchases and sales are for temporary cash investment purposes.
Statement of Operations
Dividend Growth Fund
See accompanying Notes, which are an integral part of the Financial Statements.
13
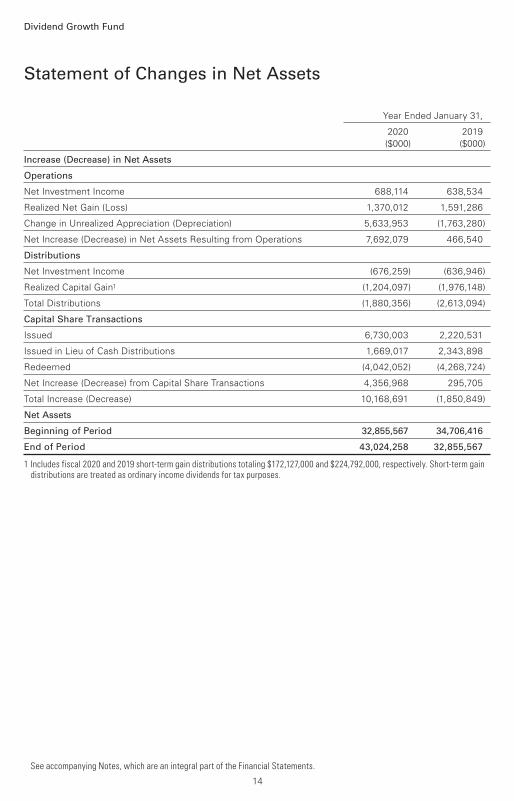
Statement of Changes in Net Assets
Dividend Growth Fund
See accompanying Notes, which are an integral part of the Financial Statements.
Year Ended January 31,
2020 2019
($000) ($000)
Increase (Decrease) in Net Assets
Operations
Net Investment Income 688,114 638,534
Realized Net Gain (Loss) 1,370,012 1,591,286
Change in Unrealized Appreciation (Depreciation) 5,633,953 (1,763,280)
Net Increase (Decrease) in Net Assets Resulting from Operations 7,692,079 466,540
Distributions
Net Investment Income (676,259) (636,946)
Realized Capital Gain1 (1,204,097) (1,976,148)
Total Distributions (1,880,356) (2,613,094)
Capital Share Transactions
Issued 6,730,003 2,220,531
Issued in Lieu of Cash Distributions 1,669,017 2,343,898
Redeemed (4,042,052) (4,268,724)
Net Increase (Decrease) from Capital Share Transactions 4,356,968 295,705
Total Increase (Decrease) 10,168,691 (1,850,849)
Net Assets
Beginning of Period 32,855,567 34,706,416
End of Period 43,024,258 32,855,567
1 Includes fiscal 2020 and 2019 short-term gain distributions totaling $172,127,000 and $224,792,000, respectively. Short-term gain distributions are treated as ordinary income dividends for tax purposes.
14
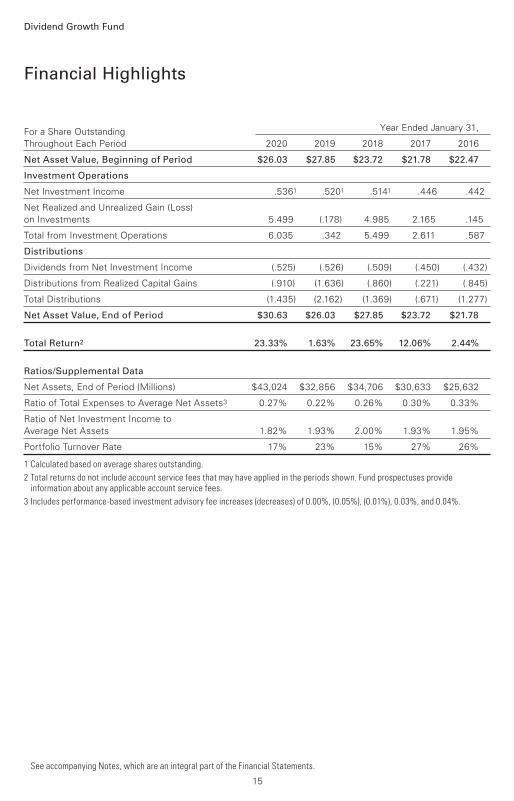
For a Share Outstanding Year Ended January 31,
Throughout Each Period 2020 2019 2018 2017 2016
Net Asset Value, Beginning of Period $26.03 $27.85 $23.72 $21.78 $22.47
Investment Operations
Net Investment Income .5361 .5201 .5141 .446 .442
Net Realized and Unrealized Gain (Loss)
on Investments 5.499 (.178) 4.985 2.165 .145
Total from Investment Operations 6.035 .342 5.499 2.611 .587
Distributions
Dividends from Net Investment Income (.525) (.526) (.509) (.450) (.432)
Distributions from Realized Capital Gains (.910) (1.636) (.860) (.221) (.845)
Total Distributions (1.435) (2.162) (1.369) (.671) (1.277)
Net Asset Value, End of Period $30.63 $26.03 $27.85 $23.72 $21.78
Total Return2 23.33% 1.63% 23.65% 12.06% 2.44%
Ratios/Supplemental Data
Net Assets, End of Period (Millions) $43,024 $32,856 $34,706 $30,633 $25,632
Ratio of Total Expenses to Average Net Assets3 0.27% 0.22% 0.26% 0.30% 0.33%
Ratio of Net Investment Income to
Average Net Assets 1.82% 1.93% 2.00% 1.93% 1.95%
Portfolio Turnover Rate 17% 23% 15% 27% 26%
1 Calculated based on average shares outstanding.
2 Total returns do not include account service fees that may have applied in the periods shown. Fund prospectuses provide information about any applicable account service fees.
3 Includes performance-based investment advisory fee increases (decreases) of 0.00%, (0.05%), (0.01%), 0.03%, and 0.04%.
Financial Highlights
See accompanying Notes, which are an integral part of the Financial Statements.
Dividend Growth Fund
15
Notes to Financial Statements
Dividend Growth Fund
Vanguard Dividend Growth Fund is registered under the Investment Company Act of 1940 as an
open-end investment company, or mutual fund.
A. The following significant accounting policies conform to generally accepted accounting
principles for U.S. investment companies. The fund consistently follows such policies in preparing
its financial statements.
1. Security Valuation: Securities are valued as of the close of trading on the New York Stock
Exchange (generally 4 p.m., Eastern time) on the valuation date. Equity securities are valued at
the latest quoted sales prices or official closing prices taken from the primary market in which
each security trades; such securities not traded on the valuation date are valued at the mean of the
latest quoted bid and asked prices. Securities for which market quotations are not readily available,
or whose values have been affected by events occurring before the fund’s pricing time but after
the close of the securities’ primary markets, are valued at their fair values calculated according to
procedures adopted by the board of trustees. These procedures include obtaining quotations from
an independent pricing service, monitoring news to identify significant market- or security-specific
events, and evaluating changes in the values of foreign market proxies (for example, ADRs, futures
contracts, or exchange-traded funds), between the time the foreign markets close and the fund’s
pricing time. When fair-value pricing is employed, the prices of securities used by a fund to calculate
its net asset value may differ from quoted or published prices for the same securities. Investments
in Vanguard Market Liquidity Fund are valued at that fund’s net asset value. Temporary cash
investments are valued using the latest bid prices or using valuations based on a matrix system
(which considers such factors as security prices, yields, maturities, and ratings), both as furnished
by independent pricing services.
2. Foreign Currency: Securities and other assets and liabilities denominated in foreign currencies
are translated into U.S. dollars using exchange rates obtained from an independent third party as
of the fund’s pricing time on the valuation date. Realized gains (losses) and unrealized appreciation
(depreciation) on investment securities include the effects of changes in exchange rates since the
securities were purchased, combined with the effects of changes in security prices. Fluctuations
in the value of other assets and liabilities resulting from changes in exchange rates are recorded as
unrealized foreign currency gains (losses) until the assets or liabilities are settled in cash, at which
time they are recorded as realized foreign currency gains (losses).
3. Repurchase Agreements: The fund enters into repurchase agreements with institutional
counterparties. Securities pledged as collateral to the fund under repurchase agreements are held
by a custodian bank until the agreements mature, and in the absence of a default, such collateral
cannot be repledged, resold, or rehypothecated. Each agreement requires that the market value
of the collateral be sufficient to cover payments of interest and principal. The fund further mitigates
its counterparty risk by entering into repurchase agreements only with a diverse group of prequalified
counterparties, monitoring their financial strength, and entering into master repurchase agreements
with its counterparties. The master repurchase agreements provide that, in the event of a
counterparty’s default (including bankruptcy), the fund may terminate any repurchase agreements
with that counterparty, determine the net amount owed, and sell or retain the collateral up to the
net amount owed to the fund. Such action may be subject to legal proceedings, which may delay
or limit the disposition of collateral.
16
Dividend Growth Fund
4. Federal Income Taxes: The fund intends to continue to qualify as a regulated investment company
and distribute all of its taxable income. Management has analyzed the fund’s tax positions taken for
all open federal income tax years (January 31, 2017–2020), and has concluded that no provision for
federal income tax is required in the fund’s financial statements.
5. Distributions: Distributions to shareholders are recorded on the ex-dividend date. Distributions
are determined on a tax basis and may differ from net investment income and realized capital gains
for financial reporting purposes.
6. Securities Lending: To earn additional income, the fund lends its securities to qualified institutional
borrowers. Security loans are subject to termination by the fund at any time, and are required to be
secured at all times by collateral in an amount at least equal to the market value of securities loaned.
Daily market fluctuations could cause the value of loaned securities to be more or less than the
value of the collateral received. When this occurs, the collateral is adjusted and settled before the
opening of the market on the next business day. The fund further mitigates its counterparty risk by
entering into securities lending transactions only with a diverse group of prequalified counterparties,
monitoring their financial strength, and entering into master securities lending agreements with
its counterparties. The master securities lending agreements provide that, in the event of a
counterparty’s default (including bankruptcy), the fund may terminate any loans with that borrower,
determine the net amount owed, and sell or retain the collateral up to the net amount owed to
the fund; however, such actions may be subject to legal proceedings. While collateral mitigates
counterparty risk, in the event of a default, the fund may experience delays and costs in recovering
the securities loaned. The fund invests cash collateral received in Vanguard Market Liquidity Fund,
and records a liability in the Statement of Net Assets for the return of the collateral, during the
period the securities are on loan. Securities lending income represents fees charged to borrowers
plus income earned on invested cash collateral, less expenses associated with the loan. During the
term of the loan, the fund is entitled to all distributions made on or in respect of the loaned securities.
7. Credit Facility: The fund and certain other funds managed by The Vanguard Group (“Vanguard”)
participate in a $4.3 billion committed credit facility provided by a syndicate of lenders pursuant to
a credit agreement that may be renewed annually; each fund is individually liable for its borrowings,
if any, under the credit facility. Borrowings may be utilized for temporary and emergency purposes,
and are subject to the fund’s regulatory and contractual borrowing restrictions. The participating
funds are charged administrative fees and an annual commitment fee of 0.10% of the undrawn
amount of the facility; these fees are allocated to the funds based on a method approved by the
fund’s board of trustees and included in Management and Administrative expenses on the fund’s
Statement of Operations. Any borrowings under this facility bear interest at a rate based upon the
higher of the one-month London Interbank Offered Rate, federal funds effective rate, or overnight
bank funding rate plus an agreed-upon spread.
The fund had no borrowings outstanding at January 31, 2020, or at any time during the period
then ended.
8. Other: Dividend income is recorded on the ex-dividend date. Interest income includes income
distributions received from Vanguard Market Liquidity Fund and is accrued daily. Premiums and
discounts on debt securities are amortized and accreted, respectively, to interest income over the
lives of the respective securities, except for premiums on certain callable debt securities that are
amortized to the earliest call date. Security transactions are accounted for on the date securities are
bought or sold. Costs used to determine realized gains (losses) on the sale of investment securities
are those of the specific securities sold.
17
Dividend Growth Fund
B. Wellington Management Company LLP provides investment advisory services to the fund for
a fee calculated at an annual percentage rate of average net assets. The basic fee is subject to
quarterly adjustments based on the fund’s performance relative to the NASDAQ US Dividend
Achievers Select Index for the preceding three years. For the year ended January 31, 2020, the
investment advisory fee represented an effective annual basic rate of 0.13% of the fund’s average
net assets before a decrease of $776,000 (0.00%) based on performance.
C. In accordance with the terms of a Funds’ Service Agreement (the “FSA”) between Vanguard
and the fund, Vanguard furnishes to the fund corporate management, administrative, marketing,
and distribution services at Vanguard’s cost of operations (as defined by the FSA). These costs
of operations are allocated to the fund based on methods and guidelines approved by the board
of trustees. Vanguard does not require reimbursement in the current period for certain costs of
operations (such as deferred compensation/benefits and risk/insurance costs); the fund’s liability
for these costs of operations is included in Payables to Vanguard on the Statement of Net Assets.
All other costs of operations payable to Vanguard are generally settled twice a month.
Upon the request of Vanguard, the fund may invest up to 0.40% of its net assets as capital in
Vanguard. At January 31, 2020, the fund had contributed to Vanguard capital in the amount of
$1,843,000, representing less than 0.01% of the fund’s net assets and 0.74% of Vanguard’s capital
received pursuant to the FSA. The fund’s trustees and officers are also directors and employees,
respectively, of Vanguard.
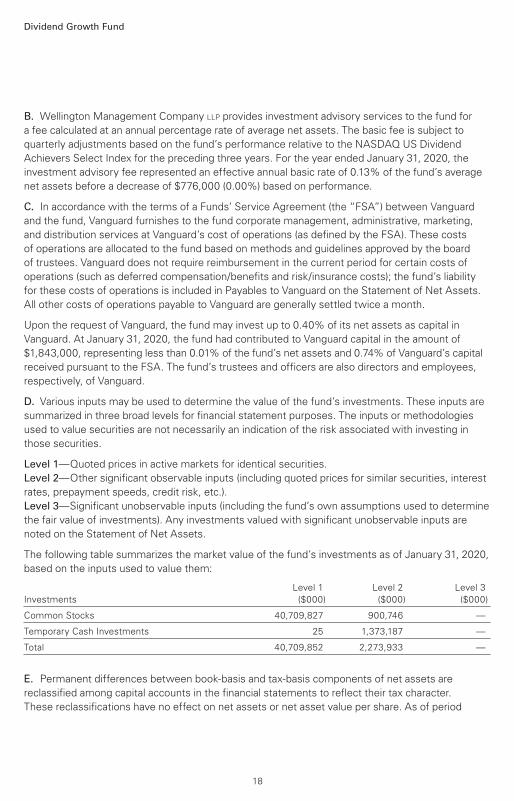
D. Various inputs may be used to determine the value of the fund’s investments. These inputs are
summarized in three broad levels for financial statement purposes. The inputs or methodologies
used to value securities are not necessarily an indication of the risk associated with investing in
those securities.
Level 1—Quoted prices in active markets for identical securities.
Level 2—Other significant observable inputs (including quoted prices for similar securities, interest
rates, prepayment speeds, credit risk, etc.).
Level 3—Significant unobservable inputs (including the fund’s own assumptions used to determine
the fair value of investments). Any investments valued with significant unobservable inputs are
noted on the Statement of Net Assets.
The following table summarizes the market value of the fund’s investments as of January 31, 2020,
based on the inputs used to value them:
Level 1 Level 2 Level 3
Investments ($000) ($000) ($000)
Common Stocks 40,709,827 900,746 —
Temporary Cash Investments 25 1,373,187 —
Total 40,709,852 2,273,933 —
E. Permanent differences between book-basis and tax-basis components of net assets are
reclassified among capital accounts in the financial statements to reflect their tax character.
These reclassifications have no effect on net assets or net asset value per share. As of period
18
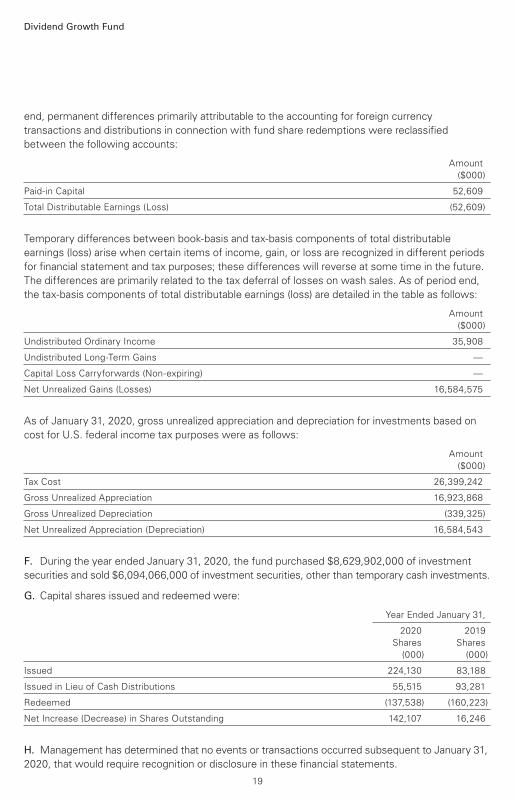
Dividend Growth Fund
end, permanent differences primarily attributable to the accounting for foreign currency
transactions and distributions in connection with fund share redemptions were reclassified
between the following accounts:
Amount
($000)
Paid-in Capital 52,609
Total Distributable Earnings (Loss) (52,609)
Temporary differences between book-basis and tax-basis components of total distributable
earnings (loss) arise when certain items of income, gain, or loss are recognized in different periods
for financial statement and tax purposes; these differences will reverse at some time in the future.
The differences are primarily related to the tax deferral of losses on wash sales. As of period end,
the tax-basis components of total distributable earnings (loss) are detailed in the table as follows:
Amount
($000)
Undistributed Ordinary Income 35,908
Undistributed Long-Term Gains —
Capital Loss Carryforwards (Non-expiring) —
Net Unrealized Gains (Losses) 16,584,575
As of January 31, 2020, gross unrealized appreciation and depreciation for investments based on
cost for U.S. federal income tax purposes were as follows:
Amount
($000)
Tax Cost 26,399,242
Gross Unrealized Appreciation 16,923,868
Gross Unrealized Depreciation (339,325)
Net Unrealized Appreciation (Depreciation) 16,584,543
F. During the year ended January 31, 2020, the fund purchased $8,629,902,000 of investment
securities and sold $6,094,066,000 of investment securities, other than temporary cash investments.
G. Capital shares issued and redeemed were:
Year Ended January 31,
2020 2019
Shares Shares
(000) (000)
Issued 224,130 83,188
Issued in Lieu of Cash Distributions 55,515 93,281
Redeemed (137,538) (160,223)
Net Increase (Decrease) in Shares Outstanding 142,107 16,246
H. Management has determined that no events or transactions occurred subsequent to January 31,
2020, that would require recognition or disclosure in these financial statements.
19
20
To the Board of Trustees of Vanguard Specialized Funds and Shareholders of Vanguard Dividend Growth Fund
Opinion on the Financial Statements
We have audited the accompanying statement of net assets of Vanguard Dividend Growth Fund (one of the funds constituting Vanguard Specialized Funds, referred to hereafter as the “Fund”) as of January 31, 2020, the related statement of operations for the year ended January 31, 2020, the statement of changes in net assets for each of the two years in the period ended January 31, 2020, including the related notes, and the financial highlights for each of the five years in the period ended January 31, 2020 (collectively referred to as the “financial statements”). In our opinion, the financial statements present fairly, in all material respects, the financial position of the Fund as of January 31, 2020, the results of its operations for the year then ended, the changes in its net assets for each of the two years in the period ended January 31, 2020 and the financial highlights for each of the five years in the period ended January 31, 2020 in conformity with accounting principles generally accepted in the United States of America.
Basis for Opinion
These financial statements are the responsibility of the Fund’s management. Our responsibility is to express an opinion on the Fund’s financial statements based on our audits. We are a public accounting firm registered with the Public Company Accounting Oversight Board (United States) (“PCAOB”) and are required to be independent with respect to the Fund in accordance with the U.S. federal securities laws and the applicable rules and regulations of the Securities and Exchange Commission and the PCAOB.
We conducted our audits of these financial statements in accordance with the standards of the PCAOB. Those standards require that we plan and perform the audit to obtain reasonable assurance about whether the financial statements are free of material misstatement, whether due to error or fraud.
Our audits included performing procedures to assess the risks of material misstatement of the financial statements, whether due to error or fraud, and performing procedures that respond to those risks. Such procedures included examining, on a test basis, evidence regarding the amounts and disclosures in the financial statements. Our audits also included evaluating the accounting principles used and significant estimates made by management, as well as evaluating the overall presentation of the financial statements. Our procedures included confirmation of securities owned as of January 31, 2020 by correspondence with the custodian, transfer agent and brokers. We believe that our audits provide a reasonable basis for our opinion.
/s/PricewaterhouseCoopers LLP Philadelphia, Pennsylvania March 16, 2020
We have served as the auditor of one or more investment companies in The Vanguard Group of Funds since 1975.
Report of Independent Registered Public Accounting Firm
Special 2019 tax information (unaudited) for Vanguard Dividend Growth Fund
This information for the fiscal year ended January 31, 2020, is included pursuant to provisions of the Internal Revenue Code.
The fund distributed $1,078,810,000 as capital gain dividends (20% rate gain distributions) to shareholders during the fiscal year.
For nonresident alien shareholders, 100% of short-term capital gain dividends distributed by the fund are qualified short-term capital gains.
The fund distributed $706,554,000 of qualified dividend income to shareholders during the fiscal year.
For corporate shareholders, 70.9% of investment income (dividend income plus short-term gains, if any) qualifies for the dividends-received deduction.
21
The board of trustees of Vanguard Dividend Growth Fund has renewed the fund’s investment
advisory arrangement with Wellington Management Company LLP (Wellington Management).
The board determined that renewing the fund’s advisory arrangement was in the best interests
of the fund and its shareholders.
The board based its decision upon an evaluation of the advisor’s investment staff, portfolio
management process, and performance. This evaluation included information provided to the board
by Vanguard’s Portfolio Review Department, which is responsible for fund and advisor oversight
and product management. The Portfolio Review Department met regularly with the advisor and
made monthly presentations to the board during the fiscal year that directed the board’s focus to
relevant information and topics.
The board, or an investment committee made up of board members, also received information
throughout the year during advisor presentations. For each advisor presentation, the board was
provided with letters and reports that included information about, among other things, the advisory
firm and the advisor’s assessment of the investment environment, portfolio performance, and
portfolio characteristics.
In addition, the board received monthly reports, which included a Market and Economic Report, a
Fund Dashboard Monthly Summary, and a Fund Performance Report.
Prior to their meeting, the trustees were provided with a memo and materials that summarized the
information they received over the course of the year. They also considered the factors discussed
below, among others. However, no single factor determined whether the board approved the
arrangement. Rather, it was the totality of the circumstances that drove the board’s decision.
Nature, extent, and quality of services
The board reviewed the quality of the fund’s investment management services over both the short
and long term, and took into account the organizational depth and stability of the advisor. The board
considered that Wellington Management, founded in 1928, is among the nation’s oldest and most
respected institutional managers. The board also noted that the portfolio manager of the fund has
nearly three decades of industry experience. Wellington Management seeks to invest in companies
with a history of paying a stable or growing dividend and the ability to continue increasing their
dividend over the long term. Utilizing fundamental research, Wellington Management focuses on a
company’s ability to create value and the ability and willingness to distribute that value to sharehold-
ers in a sustainable manner. Valuation is also an important input to the investment process, as the
advisor seeks to purchase these businesses when short-term dislocations have made the share
price attractive. Wellington Management has advised the fund since its inception in 1992.
The board concluded that Wellington Management’s experience, stability, depth, and performance,
among other factors, warranted continuation of the advisory arrangement.
Investment performance
The board considered the short- and long-term performance of the fund, including any periods of
outperformance or underperformance compared with a relevant benchmark index and peer group.
The board concluded that the performance was such that the advisory arrangement should continue.
Trustees Approve Advisory Arrangement
22
Cost
The board concluded that the fund’s expense ratio was well below the average expense ratio
charged by funds in its peer group and that the fund’s advisory fee rate was also well below the
peer-group average.
The board did not consider the profitability of Wellington Management in determining whether to
approve the advisory fee, because Wellington Management is independent of Vanguard and the
advisory fee is the result of arm’s-length negotiations.
The benefit of economies of scale
The board concluded that the fund’s shareholders benefit from economies of scale because of
breakpoints in the fund’s advisory fee schedule. The breakpoints reduce the effective rate of the
fee as the fund’s assets increase.
The board will consider whether to renew the advisory arrangement again after a one-year period.
23

This page intentionally left blank.

This page intentionally left blank.

This page intentionally left blank.
The People Who Govern Your Fund
The trustees of your mutual fund are there to see that the fund is operated and managed in your
best interests since, as a shareholder, you are a part owner of the fund. Your fund’s trustees also
serve on the board of directors of The Vanguard Group, Inc., which is owned by the Vanguard
funds and provides services to them.
A majority of Vanguard’s board members are independent, meaning that they have no affiliation
with Vanguard or the funds they oversee, apart from the sizable personal investments they have
made as private individuals. The independent board members have distinguished backgrounds
in business, academia, and public service. Each of the trustees and executive officers oversees
213 Vanguard funds.
Information for each trustee and executive officer of the fund appears below. That information,
as well as the Vanguard fund count, is as of the date on the cover of this fund report. The mailing
address of the trustees and officers is P.O. Box 876, Valley Forge, PA 19482. More information
about the trustees is in the Statement of Additional Information, which can be obtained, without
charge, by contacting Vanguard at 800-662-7447, or online at vanguard.com.
Interested Trustee1
Mortimer J. Buckley
Born in 1969. Trustee since January 2018. Principal
occupation(s) during the past five years and other
experience: chairman of the board (2019–present) of
Vanguard and of each of the investment companies
served by Vanguard; chief executive officer (2018–
present) of Vanguard; chief executive officer, president,
and trustee (2018–present) of each of the investment
companies served by Vanguard; president and
director (2017–present) of Vanguard; and president
(2018–present) of Vanguard Marketing Corporation.
Chief investment officer (2013–2017), managing
director (2002–2017), head of the Retail Investor
Group (2006–2012), and chief information officer
(2001–2006) of Vanguard. Chairman of the board
(2011–2017) and trustee (2009–2017) of the Children’s
Hospital of Philadelphia; and trustee (2018–present)
and vice chair (2019–present) of The Shipley School.
Independent Trustees
Emerson U. Fullwood
Born in 1948. Trustee since January 2008. Principal
occupation(s) during the past five years and other
experience: executive chief staff and marketing officer
for North America and corporate vice president (retired
2008) of Xerox Corporation (document management
products and services). Former president of the
Worldwide Channels Group, Latin America, and
Worldwide Customer Service and executive chief
staff officer of Developing Markets of Xerox. Executive
in residence and 2009–2010 Distinguished Minett
Professor at the Rochester Institute of Technology.
Director of SPX FLOW, Inc. (multi-industry manufac-
turing). Director of the University of Rochester Medical
Center, the Monroe Community College Foundation,
the United Way of Rochester, North Carolina A&T
University, and Roberts Wesleyan College. Trustee
of the University of Rochester.
Amy Gutmann
Born in 1949. Trustee since June 2006. Principal
occupation(s) during the past five years and other
experience: president (2004–present) of the University
of Pennsylvania. Christopher H. Browne Distinguished
Professor of Political Science, School of Arts and
Sciences, and professor of communication, Annenberg
School for Communication, with secondary faculty
appointments in the Department of Philosophy, School
of Arts and Sciences, and at the Graduate School of
Education, University of Pennsylvania.
F. Joseph Loughrey
Born in 1949. Trustee since October 2009. Principal
occupation(s) during the past five years and other
experience: president and chief operating officer
(retired 2009) and vice chairman of the board
(2008–2009) of Cummins Inc. (industrial machinery).
Chairman of the board of Hillenbrand, Inc. (specialized
consumer services) and the Lumina Foundation.
Director of the V Foundation. Member of the advisory
1 Mr. Buckley is considered an “interested person,” as defined in the Investment Company Act of 1940, because he is an officer of the Vanguard funds.
council for the College of Arts and Letters and
chair of the advisory board to the Kellogg Institute
for International Studies, both at the University of
Notre Dame.
Mark Loughridge
Born in 1953. Trustee since March 2012. Principal
occupation(s) during the past five years and other
experience: senior vice president and chief financial
officer (retired 2013) of IBM (information technology
services). Fiduciary member of IBM’s Retirement
Plan Committee (2004–2013), senior vice president
and general manager (2002–2004) of IBM Global
Financing, vice president and controller (1998–2002)
of IBM, and a variety of other prior management roles
at IBM. Member of the Council on Chicago Booth.
Scott C. Malpass
Born in 1962. Trustee since March 2012. Principal
occupation(s) during the past five years and other
experience: chief investment officer (1989–present)
and vice president (1996–present) of the University
of Notre Dame. Assistant professor of finance at the
Mendoza College of Business, University of Notre
Dame, and member of the Notre Dame 403(b)
Investment Committee. Member of the board of
TIFF Advisory Services, Inc. Member of the board
of Catholic Investment Services, Inc. (investment
advisors) and the board of superintendence
of the Institute for the Works of Religion.
Deanna Mulligan
Born in 1963. Trustee since January 2018. Principal
occupation(s) during the past five years and other
experience: chief executive officer (2011–present)
of The Guardian Life Insurance Company of America.
President (2010–2019), chief operating officer
(2010–2011), and executive vice president (2008–2010)
of Individual Life and Disability of The Guardian Life
Insurance Company of America. Member of the
board of The Guardian Life Insurance Company of
America, the American Council of Life Insurers, and
the Economic Club of New York. Trustee of the
Partnership for New York City (business leadership),
Chief Executives for Corporate Purpose, NewYork-
Presbyterian Hospital, Catalyst, and the Bruce Museum
(arts and science). Member of the Advisory Council
for the Stanford Graduate School of Business.
André F. Perold
Born in 1952. Trustee since December 2004. Principal
occupation(s) during the past five years and other
experience: George Gund Professor of Finance and
Banking, Emeritus at the Harvard Business School
(retired 2011). Chief investment officer and co-
managing partner of HighVista Strategies (private
investment firm). Member of the board of advisors
and the investment committee of the Museum of Fine
Arts Boston. Member of the board (2018–present) of
RIT Capital Partners (investment firm). Member of the
investment committee of Partners Health Care System.
Sarah Bloom Raskin
Born in 1961. Trustee since January 2018. Principal
occupation(s) during the past five years and other
experience: deputy secretary (2014–2017) of
the United States Department of the Treasury.
Governor (2010–2014) of the Federal Reserve
Board. Commissioner (2007–2010) of financial
regulation for the State of Maryland. Member of
the board of directors (2012–2014) of Neighborhood
Reinvestment Corporation. Director (2017–present)
of i(x) Investments, LLC; director (2017–present) of
Reserve Trust. Rubenstein Fellow (2017–present)
of Duke University; trustee (2017–present) of Amherst
College, and trustee (2019–present) of the Folger
Shakespeare Library.
Peter F. Volanakis
Born in 1955. Trustee since July 2009. Principal
occupation(s) during the past five years and other
experience: president and chief operating officer
(retired 2010) of Corning Incorporated (communications
equipment) and director of Corning Incorporated
(2000–2010) and Dow Corning (2001–2010).
Director (2012) of SPX Corporation (multi-industry
manufacturing). Overseer of the Amos Tuck School
of Business Administration, Dartmouth College
(2001–2013). Chairman of the board of trustees
of Colby-Sawyer College. Member of the board of
Hypertherm Inc. (industrial cutting systems, software,
and consumables).
Executive Officers
John Bendl
Born in 1970. Principal occupation(s) during the past
five years and other experience: principal of Vanguard.
Chief financial officer (2019–present) of each of the
investment companies served by Vanguard. Chief
accounting officer, treasurer, and controller of Vanguard
(2017–present). Partner (2003–2016) at KPMG (audit,
tax, and advisory services).
Glenn Booraem
Born in 1967. Principal occupation(s) during the past
five years and other experience: principal of Vanguard.
Investment stewardship officer (2017–present),
treasurer (2015–2017), controller (2010–2015),
and assistant controller (2001–2010) of each of
the investment companies served by Vanguard.
Christine M. Buchanan
Born in 1970. Principal occupation(s) during the past
five years and other experience: principal of Vanguard.
Treasurer (2017–present) of each of the investment
companies served by Vanguard. Partner (2005–2017)
at KPMG (audit, tax, and advisory services).
David Cermak
Born in 1960. Principal occupation(s) during the
past five years and other experience: principal of
Vanguard. Finance director (2019–present) of each
of the investment companies served by Vanguard.
Managing director and head (2017–present) of
Vanguard Investments Singapore. Managing director
and head (2017–2019) of Vanguard Investments Hong
Kong. Representative director and head (2014–2017)
of Vanguard Investments Japan.
Thomas J. Higgins
Born in 1957. Principal occupation(s) during the past
five years and other experience: principal of Vanguard.
Finance director (2019–present), chief financial officer
(2008–2019), and treasurer (1998–2008) of each of
the investment companies served by Vanguard.
Peter Mahoney
Born in 1974. Principal occupation(s) during the past
five years and other experience: principal of Vanguard.
Controller (2015–present) of each of the investment
companies served by Vanguard. Head of International
Fund Services (2008–2014) at Vanguard.
Anne E. Robinson
Born in 1970. Principal occupation(s) during the
past five years and other experience: general
counsel (2016–present) of Vanguard. Secretary
(2016–present) of Vanguard and of each of the
investment companies served by Vanguard.
Managing director (2016–present) of Vanguard.
Managing director and general counsel of Global
Cards and Consumer Services (2014–2016) at
Citigroup. Counsel (2003–2014) at American Express.
Michael Rollings
Born in 1963. Principal occupation(s) during the
past five years and other experience: finance
director (2017–present) and treasurer (2017) of each
of the investment companies served by Vanguard.
Managing director (2016–present) of Vanguard. Chief
financial officer (2016–present) of Vanguard. Director
(2016–present) of Vanguard Marketing Corporation.
Executive vice president and chief financial officer
(2006–2016) of MassMutual Financial Group.
John E. Schadl
Born in 1972. Principal occupation(s) during the past
five years and other experience: principal of Vanguard.
Chief compliance officer (2019–present) of Vanguard
and of each of the investment companies served by
Vanguard. Assistant vice president (2019–present)
of Vanguard Marketing Corporation.
Vanguard Senior Management Team
Joseph Brennan Chris D. McIsaac
Mortimer J. Buckley James M. Norris
Gregory Davis Thomas M. Rampulla
John James Karin A. Risi
Martha G. King Anne E. Robinson
John T. Marcante Michael Rollings
Connect with Vanguard® > vanguard.com
Fund Information > 800-662-7447
Direct Investor Account Services > 800-662-2739
Institutional Investor Services > 800-523-1036
Text Telephone for PeopleWho Are Deaf or Hard of Hearing > 800-749-7273
This material may be used in conjunctionwith the offering of shares of any Vanguardfund only if preceded or accompanied bythe fund’s current prospectus.
All comparative mutual fund data are from Morningstar,Inc., unless otherwise noted.
You can obtain a free copy of Vanguard’s proxy votingguidelines by visiting vanguard.com/proxyreporting or bycalling Vanguard at 800-662-2739. The guidelines arealso available from the SEC’s website, www.sec.gov. Inaddition, you may obtain a free report on how your fundvoted the proxies for securities it owned during the 12months ended June 30. To get the report, visit eithervanguard.com/proxyreporting or www.sec.gov.
You can review information about your fund on theSEC’s website, and you can receive copies of thisinformation, for a fee, by sending a request via emailaddressed to [email protected].
Source for Bloomberg Barclays indexes: BloombergIndex Services Limited. Copyright 2020, Bloomberg. Allrights reserved.
© 2020 The Vanguard Group, Inc.All rights reserved.Vanguard Marketing Corporation, Distributor.
Q570 032020