Embed Size (px)
Citation preview
Strictly confidential1
PRESENTATIONFULL-YEAR 2018 RESULTS
Strictly confidential2
IMPORTANT NOTICE
This presentation includes forward-looking information and
statements, including statements concerning the outlook for
our business. These statements are based on current
expectations, estimates and projections about the factors
that may affect our future performance, including the
economic conditions in the property markets relevant to us.
These expectations, estimates and projections are generally
identifiable by statements containing words such as
“expects,” “believes,” “estimates,” “targets,” “plans,”
“outlook” or similar expressions.
There are numerous risks and uncertainties, many of which
are beyond our control, that could cause our actual results
to differ materially from the forward-looking information and
statements made in this presentation and which could affect
our ability to achieve any or all of our stated targets. The
important factors that could cause such differences include,
among others:
– business risks associated with the volatile economic
environment and political conditions
– costs associated with natural disasters affecting our
properties
– changes in governmental regulations
– changes in currency exchange and interest rates, and
– such other factors as may be discussed from time to time
in prospectuses
Although we believe that its expectations reflected in any
such forward-looking statement are based upon reasonable
assumptions, it can give no assurance that those
expectations will be achieved. This presentation contains
non-GAAP measures of performance. We provide
definitions of these measures and reconciliations between
these measures and their IFRS counterparts as we believe
are appropriate.

Strictly confidential3
AGENDAAPRIL 3, 2019
▪ Key achievements
▪ Financials FY 2018
▪ Portfolio and growth strategy
▪ Outlook
▪ Q&A

Strictly confidential4
TODAY’S SPEAKERS
■ Delegate of the Board of
Directors, Varia US
Properties AG
■ Head of US Investments
of Stoneweg SA,
the Asset Manager of
Varia US Properties AG
PATRICK RICHARDMANUEL LEUTHOLD
■ Chairman,
Varia US Properties AG
Strictly confidential5
KEY ACHIEVEMENTS
Strictly confidential6
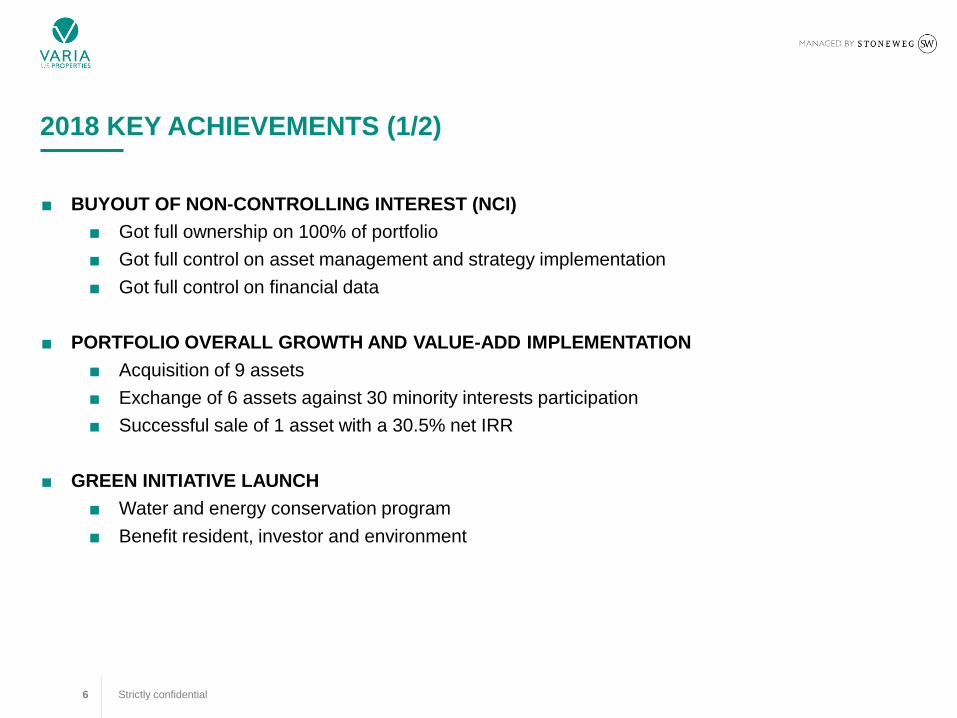
2018 KEY ACHIEVEMENTS (1/2)
■ BUYOUT OF NON-CONTROLLING INTEREST (NCI)
■ Got full ownership on 100% of portfolio
■ Got full control on asset management and strategy implementation
■ Got full control on financial data
■ PORTFOLIO OVERALL GROWTH AND VALUE-ADD IMPLEMENTATION
■ Acquisition of 9 assets
■ Exchange of 6 assets against 30 minority interests participation
■ Successful sale of 1 asset with a 30.5% net IRR
■ GREEN INITIATIVE LAUNCH
■ Water and energy conservation program
■ Benefit resident, investor and environment
Strictly confidential7
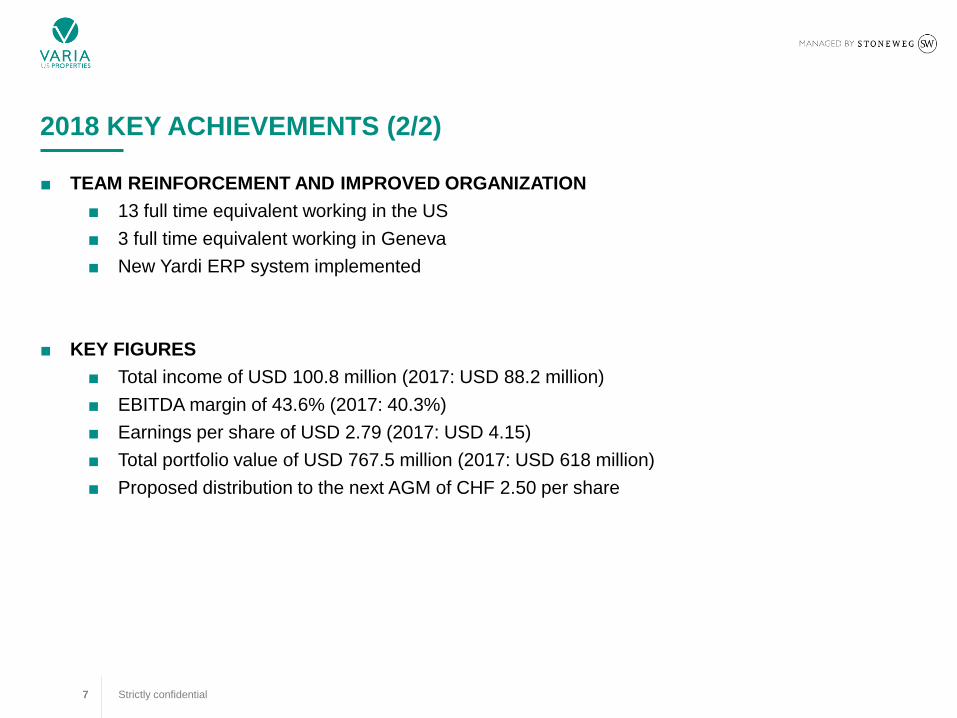
2018 KEY ACHIEVEMENTS (2/2)
■ TEAM REINFORCEMENT AND IMPROVED ORGANIZATION
■ 13 full time equivalent working in the US
■ 3 full time equivalent working in Geneva
■ New Yardi ERP system implemented
■ KEY FIGURES
■ Total income of USD 100.8 million (2017: USD 88.2 million)
■ EBITDA margin of 43.6% (2017: 40.3%)
■ Earnings per share of USD 2.79 (2017: USD 4.15)
■ Total portfolio value of USD 767.5 million (2017: USD 618 million)
■ Proposed distribution to the next AGM of CHF 2.50 per share
Strictly confidential8
FINANCIALS FY 2018
Strictly confidential9
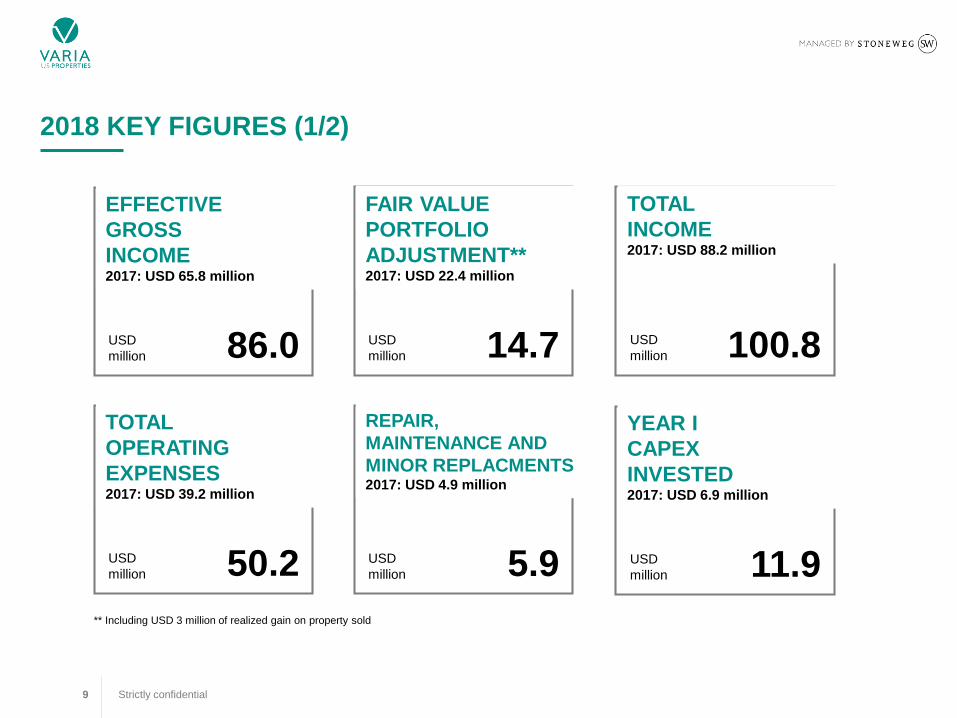
2018 KEY FIGURES (1/2)
EFFECTIVE
GROSS
INCOME2017: USD 65.8 million
USD
million 86.0
FAIR VALUE
PORTFOLIO
ADJUSTMENT**2017: USD 22.4 million
USD
million 14.7
TOTAL
INCOME2017: USD 88.2 million
USD
million 100.8
TOTAL
OPERATING
EXPENSES2017: USD 39.2 million
USD
million 50.2
REPAIR,
MAINTENANCE AND
MINOR REPLACMENTS2017: USD 4.9 million
USD
million 5.9
YEAR I
CAPEX
INVESTED2017: USD 6.9 million
USD
million 11.9
** Including USD 3 million of realized gain on property sold
Strictly confidential10
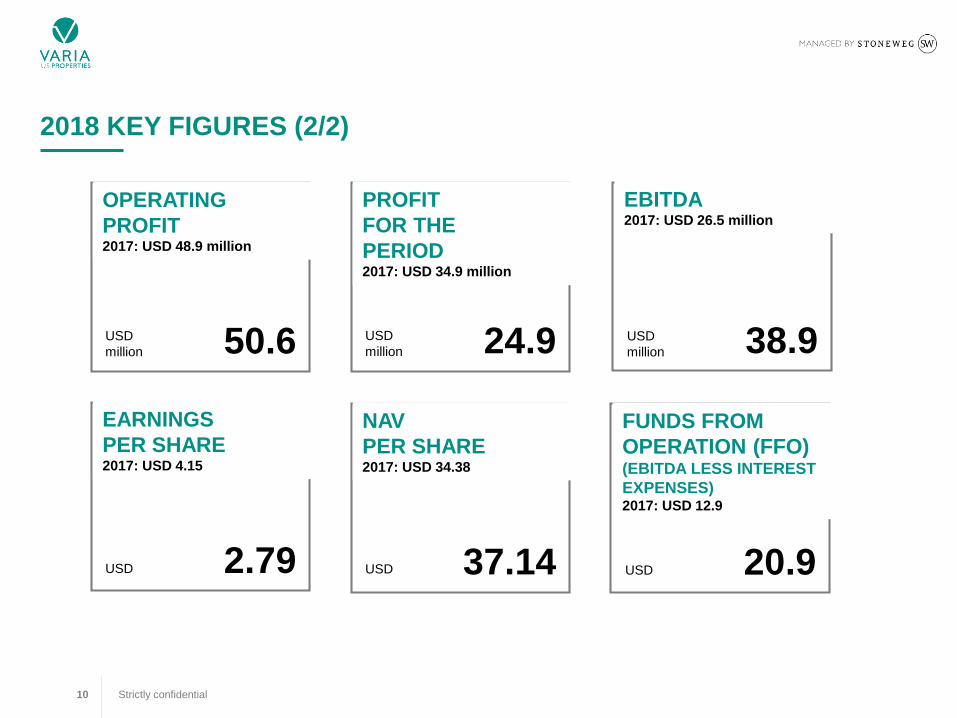
2018 KEY FIGURES (2/2)
OPERATING
PROFIT2017: USD 48.9 million
USD
million 50.6
PROFIT
FOR THE
PERIOD2017: USD 34.9 million
USD
million 24.9
EBITDA 2017: USD 26.5 million
USD
million 38.9
NAV
PER SHARE2017: USD 34.38
USD 37.14
FUNDS FROM
OPERATION (FFO)(EBITDA LESS INTEREST
EXPENSES)2017: USD 12.9
USD 20.9
EARNINGS
PER SHARE2017: USD 4.15
USD 2.79

Strictly confidential11
PROFIT AND LOSS (CONSOLIDATED)
In USD million As of December 31, 2018 As of December 31, 2017
Rental income 76.3 59.9
Other income including insurance proceeds 9.8 5.8
Net gain from fair value adjustment (realized) 3.0 -
Net gain from fair value adjustment on invest. property 11.7 22.4
Total income 100.8 88.2
Total operating expenses (50.2) (39.2)
Operating profit 50.6 48.9
Financing expenses (18.0) (13.2)
Profit before income tax 32.6 35.7
Income tax (7.7) (0.8)
Profit for the period 24.9 34.9
Profit attributable to:
Varia US Properties AG shareholders (in USD million) 24.9 28.1
Non-controlling interests (in USD million) - 6.8
NAV & Earnings per share
Net asset value (NAV) per share (in USD) 37.14 34.38
Basic and diluted earnings per share (in USD) 2.79 4.15
Strictly confidential12
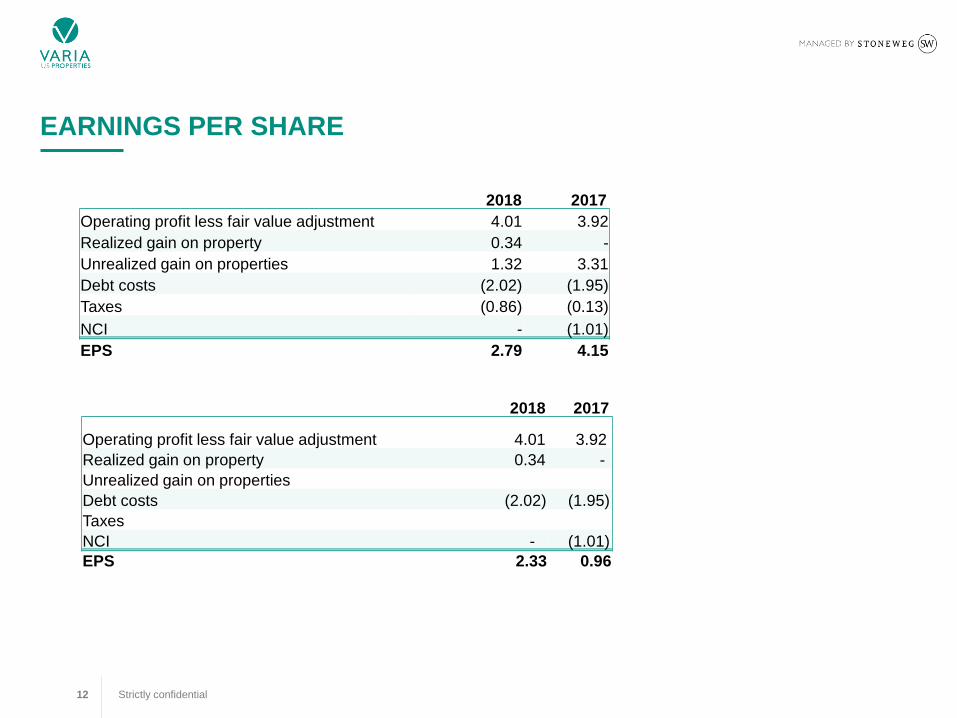
EARNINGS PER SHARE
2018 2017
Operating profit less fair value adjustment 4.01 3.92
Realized gain on property 0.34 -
Unrealized gain on properties 1.32 3.31
Debt costs (2.02) (1.95)
Taxes (0.86) (0.13)
NCI - (1.01)
EPS 2.79 4.15
2018 2017
Operating profit less fair value adjustment 4.01 3.92
Realized gain on property 0.34 -
Unrealized gain on properties
Debt costs (2.02) (1.95)
Taxes
NCI - (1.01)
EPS 2.33 0.96
Strictly confidential13
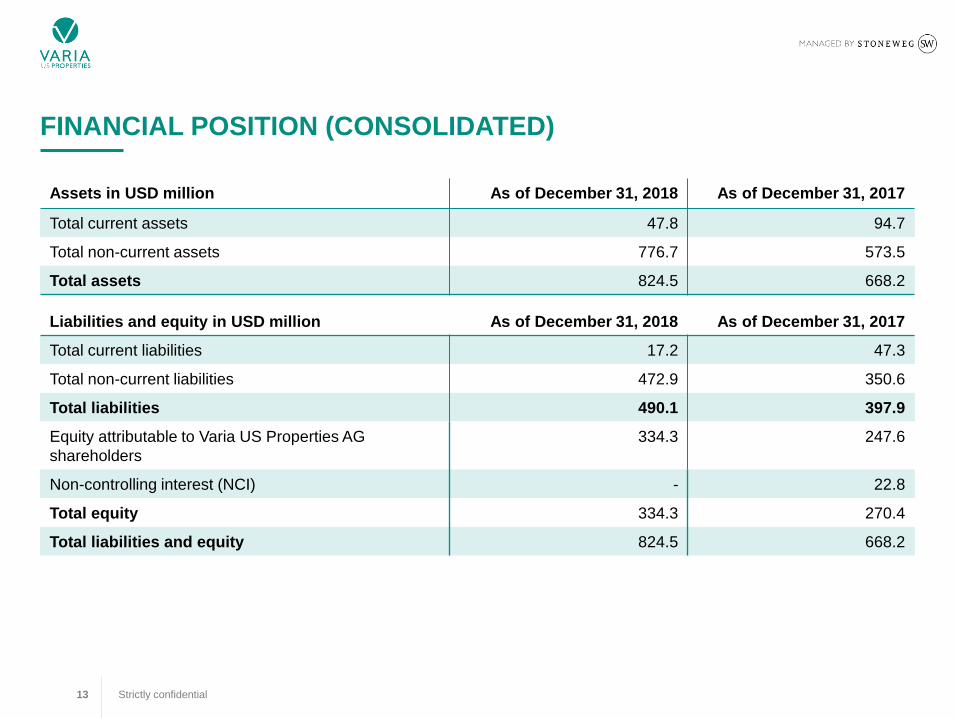
FINANCIAL POSITION (CONSOLIDATED)
Assets in USD million As of December 31, 2018 As of December 31, 2017
Total current assets 47.8 94.7
Total non-current assets 776.7 573.5
Total assets 824.5 668.2
Liabilities and equity in USD million As of December 31, 2018 As of December 31, 2017
Total current liabilities 17.2 47.3
Total non-current liabilities 472.9 350.6
Total liabilities 490.1 397.9
Equity attributable to Varia US Properties AG
shareholders
334.3 247.6
Non-controlling interest (NCI) - 22.8
Total equity 334.3 270.4
Total liabilities and equity 824.5 668.2

Strictly confidential14
PORTFOLIO AND GROWTH STRATEGY
Strictly confidential15
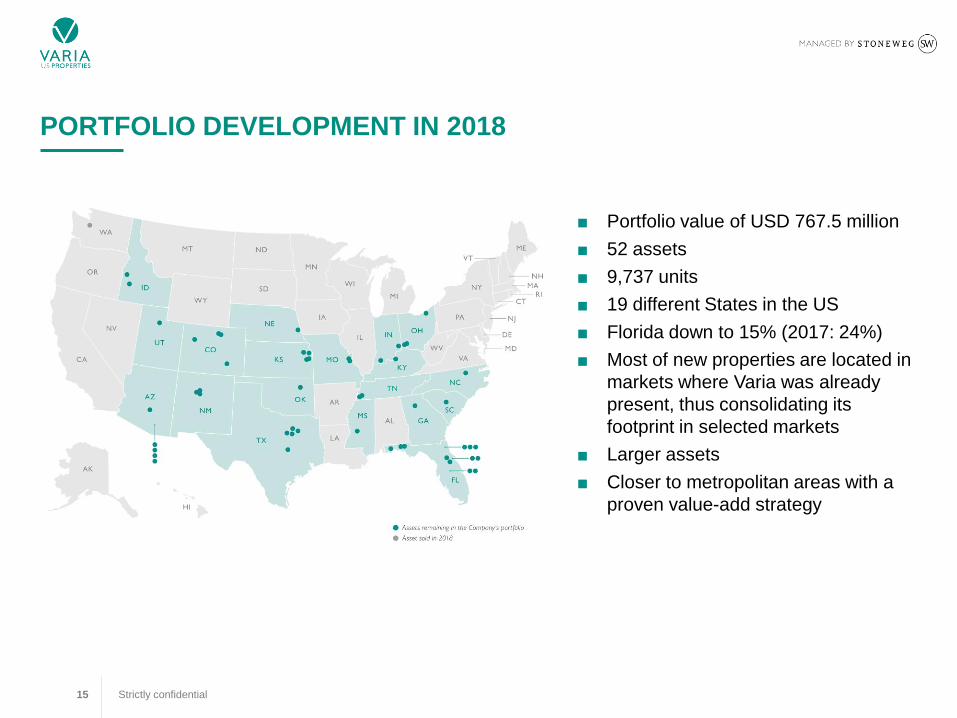
PORTFOLIO DEVELOPMENT IN 2018
■ Portfolio value of USD 767.5 million
■ 52 assets
■ 9,737 units
■ 19 different States in the US
■ Florida down to 15% (2017: 24%)
■ Most of new properties are located in
markets where Varia was already
present, thus consolidating its
footprint in selected markets
■ Larger assets
■ Closer to metropolitan areas with a
proven value-add strategy
Strictly confidential16
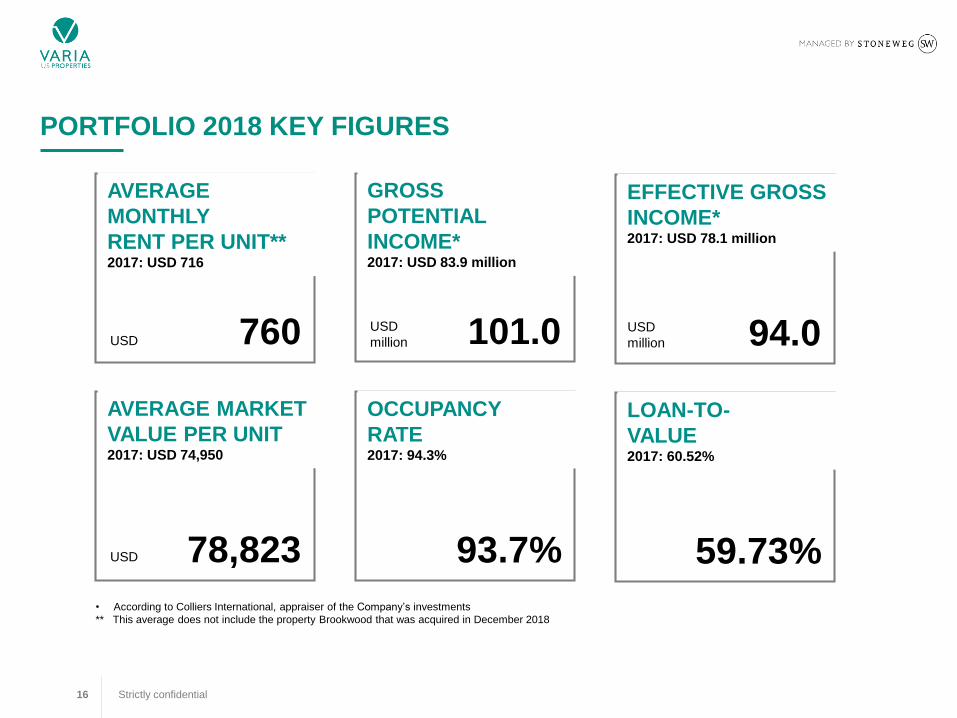
PORTFOLIO 2018 KEY FIGURES
AVERAGE
MONTHLY
RENT PER UNIT**2017: USD 716
USD 760
GROSS
POTENTIAL
INCOME*2017: USD 83.9 million
USD
million 101.0
AVERAGE MARKET
VALUE PER UNIT2017: USD 74,950
USD 78,823
OCCUPANCY
RATE2017: 94.3%
93.7%
• According to Colliers International, appraiser of the Company’s investments
** This average does not include the property Brookwood that was acquired in December 2018
EFFECTIVE GROSS
INCOME*2017: USD 78.1 million
94.0
LOAN-TO-
VALUE2017: 60.52%
59.73%
USD
million
Strictly confidential17
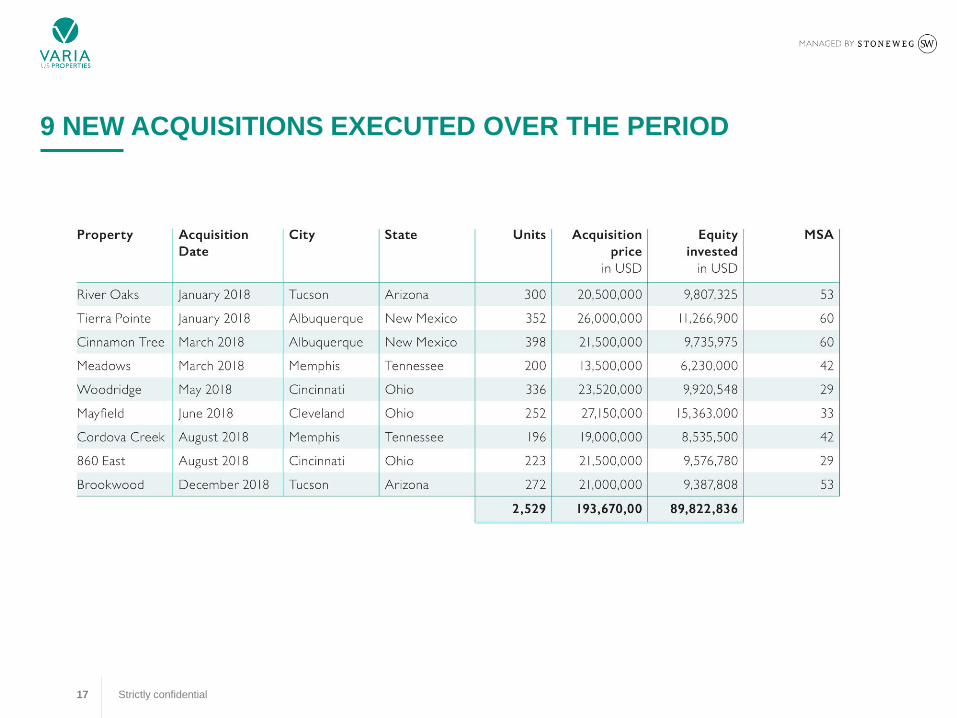
9 NEW ACQUISITIONS EXECUTED OVER THE PERIOD
Strictly confidential18
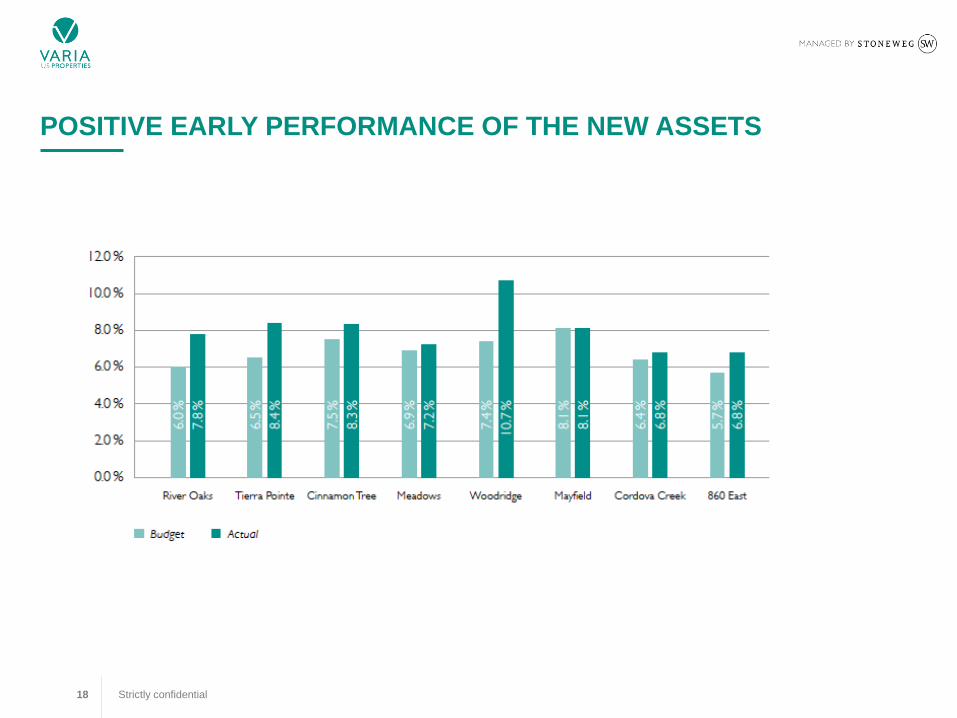
POSITIVE EARLY PERFORMANCE OF THE NEW ASSETS
Strictly confidential19
ADDING VALUE TO THE PORTFOLIO
▪ In 2018, a total of 600 units have been rehabbed for the amount of more than USD 2.7 million
▪ The average rehab cost per unit is USD 4,489
▪ Investing in the common areas and in the unit rehab works
▪ An average rent increase of USD 98 per month has been achieved
▪ Average ROCE of 26%
▪ An additional USD 8.3 million has been spent in various deferred maintenance and property
enhancement projects in common areas.
Strictly confidential20
GREEN INITIATIVE
■ Varia is committed to deploy a portfolio wide green program that will improve the energy scorecard
of the portfolio
■ Main purpose of this initiative is to save between 25% and 35% of the water and electricity
consumption
■ This initiative will benefit the residents, the investors and the environment
■ To achieve this goal,
■ Varia will replace shower heads, toilet tanks and faucets with water conservation efficient
solutions
■ Varia will implement an electricity conservation program which includes replacing regular
bulbs with LED products as well as old appliances as refrigerators and dishwashers with
more efficient ones
■ Investments will be financed with equity or with the proceed of refinancing
■ The green initiative will be further evaluated and implemented in the next few years

Strictly confidential21
GREEN INITIATIVE
Strictly confidential22
OUTLOOK
Strictly confidential23
THE MARKET IN 2019
■ Positive market for multifamily investments and especially for workforce housing
According to CBRE: “The multifamily sector will continue to attract high levels of investments and
debt capital, and workforce housing will remain an appealing investment strategy given its
favorable supply/demand balance”.
■ Rental organic growth of 2.5 – 3% with sustained 94 – 95% occupancy
■ Investors are not expecting a significant increase of interest rates in 2019, but volatility may
appear on a short-term basis
■ Currency should remain pretty stable in 2019 with again some volatility, but no big changes
expected in 2019
Strictly confidential24
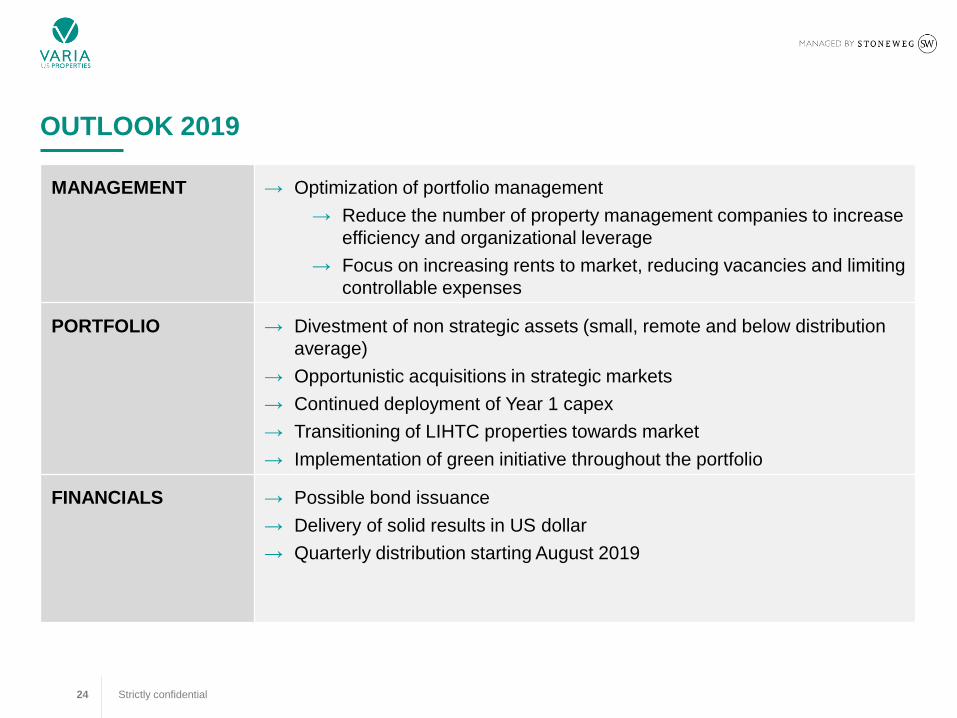
OUTLOOK 2019
MANAGEMENT → Optimization of portfolio management
→ Reduce the number of property management companies to increase
efficiency and organizational leverage
→ Focus on increasing rents to market, reducing vacancies and limiting
controllable expenses
PORTFOLIO → Divestment of non strategic assets (small, remote and below distribution
average)
→ Opportunistic acquisitions in strategic markets
→ Continued deployment of Year 1 capex
→ Transitioning of LIHTC properties towards market
→ Implementation of green initiative throughout the portfolio
FINANCIALS → Possible bond issuance
→ Delivery of solid results in US dollar
→ Quarterly distribution starting August 2019

Strictly confidential25
FINANCIAL CALENDAR
■ Annual General Meeting 2019
■ Half-Year Results 2019
30 April 2019
29 August 2019

Strictly confidential26
Q&A
Strictly confidential27
APPENDIX

Strictly confidential28
9 ACQUISITIONS IN 2018 (1/3)
CITY STATE ACQUISITION DATE
Tucson Arizona January 2018
NUMBER OF
UNITS
NET RENTABLE
AREA
GROSS
POTENTIAL INCOME
300 212,074 m2 2,560,200 USD
RIVER OAKS TIERRA POINTE
CITY STATE ACQUISITION DATE
Albuquerque New Mexico January 2018
NUMBER OF
UNITS
NET RENTABLE
AREA
GROSS
POTENTIAL INCOME
352 217,250 m2 3,122,896 USD
CITY STATE ACQUISITION DATE
Albuquerque New Mexico March 2018
NUMBER OF
UNITS
NET RENTABLE
AREA
GROSS
POTENTIAL INCOME
398 187,426 m2 3,067,140 USD
CINNAMON TREE
CITY STATE ACQUISITION DATE
Memphis Tennessee March 2018
NUMBER OF
UNITS
NET RENTABLE
AREA
GROSS
POTENTIAL INCOME
200 191,200 m2 1,831,900 USD
MEADOWS
Strictly confidential29
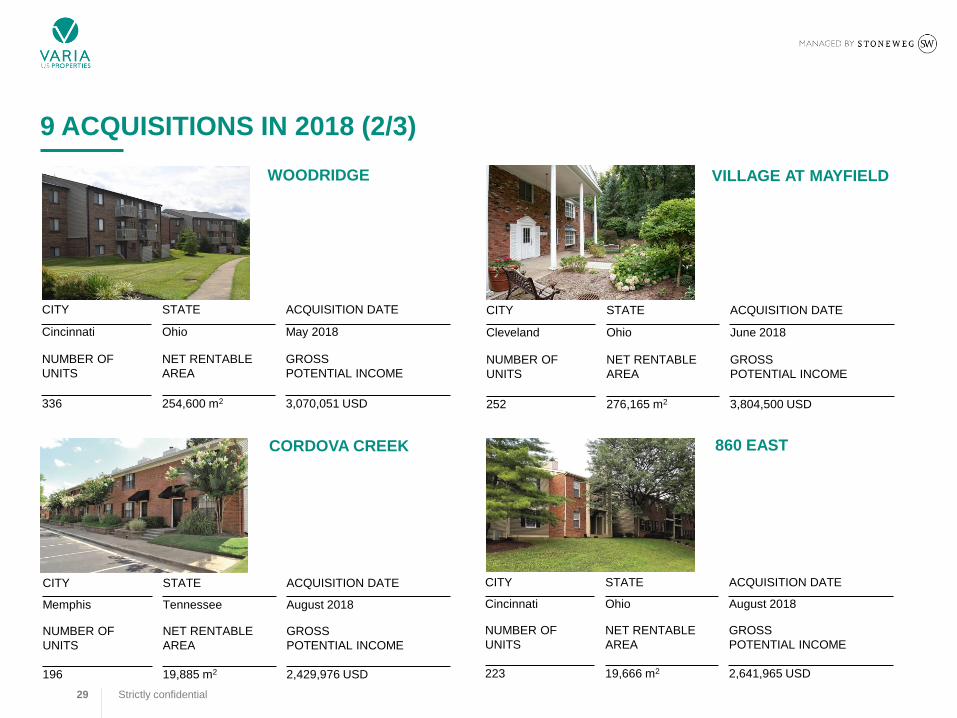
9 ACQUISITIONS IN 2018 (2/3)
CITY STATE ACQUISITION DATE
Cincinnati Ohio May 2018
NUMBER OF
UNITS
NET RENTABLE
AREA
GROSS
POTENTIAL INCOME
336 254,600 m2 3,070,051 USD
WOODRIDGE VILLAGE AT MAYFIELD
CITY STATE ACQUISITION DATE
Cleveland Ohio June 2018
NUMBER OF
UNITS
NET RENTABLE
AREA
GROSS
POTENTIAL INCOME
252 276,165 m2 3,804,500 USD
CITY STATE ACQUISITION DATE
Memphis Tennessee August 2018
NUMBER OF
UNITS
NET RENTABLE
AREA
GROSS
POTENTIAL INCOME
196 19,885 m2 2,429,976 USD
CORDOVA CREEK
CITY STATE ACQUISITION DATE
Cincinnati Ohio August 2018
NUMBER OF
UNITS
NET RENTABLE
AREA
GROSS
POTENTIAL INCOME
223 19,666 m2 2,641,965 USD
860 EAST
Strictly confidential30
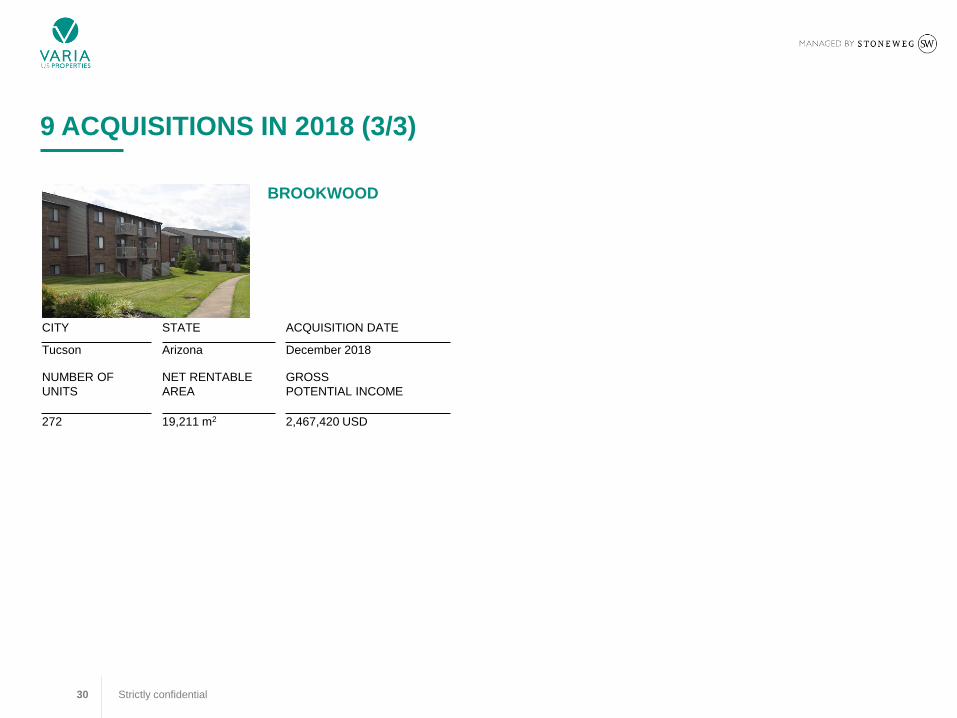
9 ACQUISITIONS IN 2018 (3/3)
CITY STATE ACQUISITION DATE
Tucson Arizona December 2018
NUMBER OF
UNITS
NET RENTABLE
AREA
GROSS
POTENTIAL INCOME
272 19,211 m2 2,467,420 USD
BROOKWOOD
Strictly confidential31
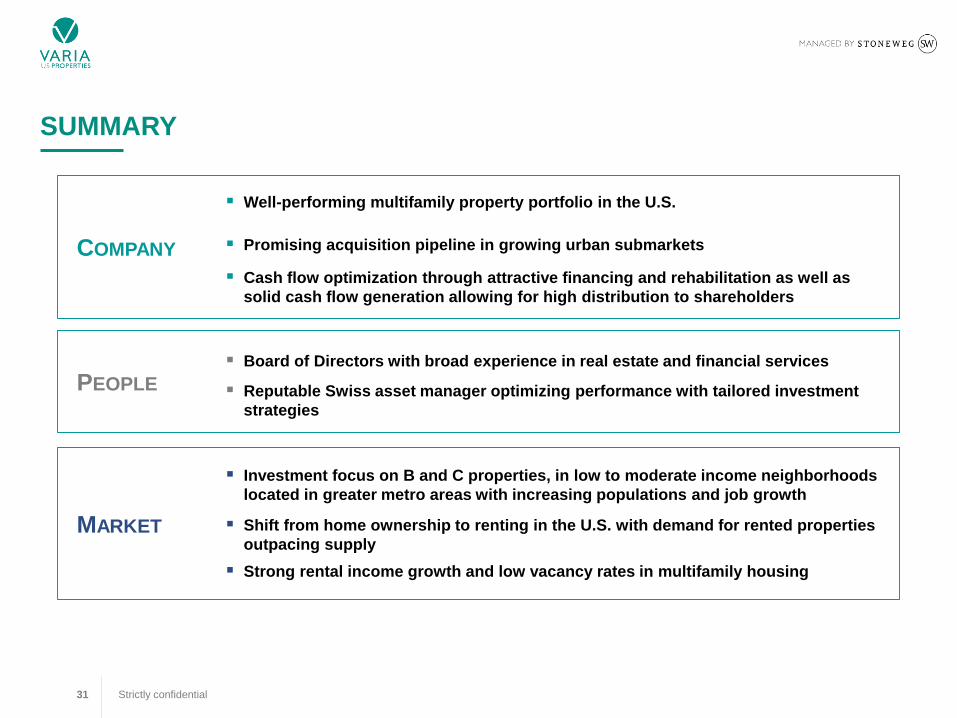
SUMMARY
MARKET
PEOPLE
COMPANY
▪ Well-performing multifamily property portfolio in the U.S.
▪ Promising acquisition pipeline in growing urban submarkets
▪ Board of Directors with broad experience in real estate and financial services
▪ Reputable Swiss asset manager optimizing performance with tailored investment
strategies
▪ Strong rental income growth and low vacancy rates in multifamily housing
▪ Investment focus on B and C properties, in low to moderate income neighborhoods
located in greater metro areas with increasing populations and job growth
▪ Shift from home ownership to renting in the U.S. with demand for rented properties
outpacing supply
▪ Cash flow optimization through attractive financing and rehabilitation as well as
solid cash flow generation allowing for high distribution to shareholders