Embed Size (px)
Citation preview
Variability and trends in the global tropopause estimated from
radiosonde data
Dian J. Seidel1 and William J. Randel2
Received 3 April 2006; revised 3 July 2006; accepted 18 July 2006; published 3 November 2006.
[1] This study examines global tropopause variability on synoptic, monthly, seasonal, andmultidecadal timescales using 1980–2004 radiosonde data. On synoptic and monthlytimescales, tropopause height variations are anticorrelated with stratospheric temperaturevariations and positively correlated with tropospheric temperature variations.Correlations are stronger in the extratropics than in the tropics, for the upper troposphere(500–300 hPa) than for the lower troposphere, and for the lower stratosphere than forthe middle stratosphere. The extratropical tropopause is more sensitive to temperaturechanges than the tropical tropopause, and in both regions, monthly anomalies oftropopause height are more sensitive to stratospheric temperature change thantropospheric, rising 2–3 km per degree cooling of the lower stratosphere. Tropopauseheight trends over 1980–2004 are upward at almost all of the (predominantlyextratropical) stations analyzed, yielding an estimated global trend of 64 ± 21 m/decade,a corresponding tropopause pressure trend of �1.7 ± 0.6 hPa/decade, and tropopausetemperature decrease of 0.41 ± 0.09 K/decade. These tropopause trends are accompaniedby significant stratospheric cooling and smaller tropospheric warming. However, thetropopause trends are spatially correlated with stratospheric temperature trends anduncorrelated with tropospheric temperature trends. This association of tropopause heightand stratospheric temperature trends, together with the presence of a significantquasi-biennial oscillation signal in tropopause height, suggests that at these lowestfrequencies the tropopause is primarily coupled with stratospheric temperatures.Therefore, as an indicator of climate change, long-term changes in the tropopause maycarry less information about changes throughout the vertical temperature profile than hasbeen suggested by previous studies using reanalyses and global climate models.
Citation: Seidel, D. J., and W. J. Randel (2006), Variability and trends in the global tropopause estimated from radiosonde data,
J. Geophys. Res., 111, D21101, doi:10.1029/2006JD007363.
1. Introduction
[2] Recent work by Sausen and Santer [2003] and Santeret al. [2003a, 2003b, 2004] suggests that changes in theheight (or pressure) of the global tropopause may be asensitive indicator of anthropogenic climate change. Thesestudies employed reanalysis data and climate model simu-lations, in which tropopause height increases were closelyassociated with tropospheric warming and stratosphericcooling. Global tropopause pressure changes in theECMWF 15-year reanalysis for 1979–1993 have beenestimated between +0.1 and �1.13 hPa/decade [Hoinka,1998, 1999; Santer et al., 2003a], and the ECMWF 40-yearreanalysis and the NCEP/NCAR reanalysis both showlarger trends of about �2 hPa/decade for 1979–2001[Santer et al., 2003a, 2004]. These reported tropopausetrends in reanalyses are remarkable given that typicalreanalysis vertical resolution is about 50 hPa in the vicinity
of the tropopause, and that the tropopause is calculated byinterpolation of lapse rates between model or analysislevels. To date, no studies have reported global tropopausetrends based on the primary upper air data source enteringthe reanalyses–radiosonde data, although several investiga-tors have done so for limited regions [Nagurny, 1998;Highwood et al., 2000; Randel et al., 2000; Chakrabartyet al., 2000; Seidel et al., 2001; Varotsos et al., 2004; Anel etal., 2006].[3] In this study, we attempt to estimate trends in the
global tropopause on the basis of radiosonde observations,which offer substantially higher vertical resolution thanreanalyses, thus allowing a more accurate identification ofthe tropopause and possible multiple tropopause levels.Daily or twice-daily soundings, extending back about50 years at some locations, present the possibility ofexamining tropopause variations on timescales rangingfrom synoptic to multidecadal. To provide a broader contextfor the analysis of long-term tropopause changes, we alsoexamine the covariability of tropopause height and strato-spheric and tropospheric temperature.[4] Section 2 outlines the radiosonde data used and
methods of analysis, including a discussion of temporal
JOURNAL OF GEOPHYSICAL RESEARCH, VOL. 111, D21101, doi:10.1029/2006JD007363, 2006ClickHere
for
FullArticle
1NOAA Air Resources Laboratory, Silver Spring, Maryland, USA.2National Center for Atmospheric Research, Boulder, Colorado, USA.
Copyright 2006 by the American Geophysical Union.0148-0227/06/2006JD007363$09.00
D21101 1 of 17
inhomogeneity in the observations. Section 3 discusses theclimatological location and temperature of the tropopauseand its mean seasonal cycle. Section 4 compares the typicalmagnitudes of tropopause height and pressure variability ondifferent timescales, and section 5 discusses the day-to-dayand monthly covariability of tropopause height and thetemperature profile. Trends in tropopause height, pressureand temperature are presented in section 6, and a summaryis given in section 7. Appendix A discusses the effect ofreducing the vertical resolution of sounding data on ourresults.
2. Data and Methods
2.1. Radiosonde Observations
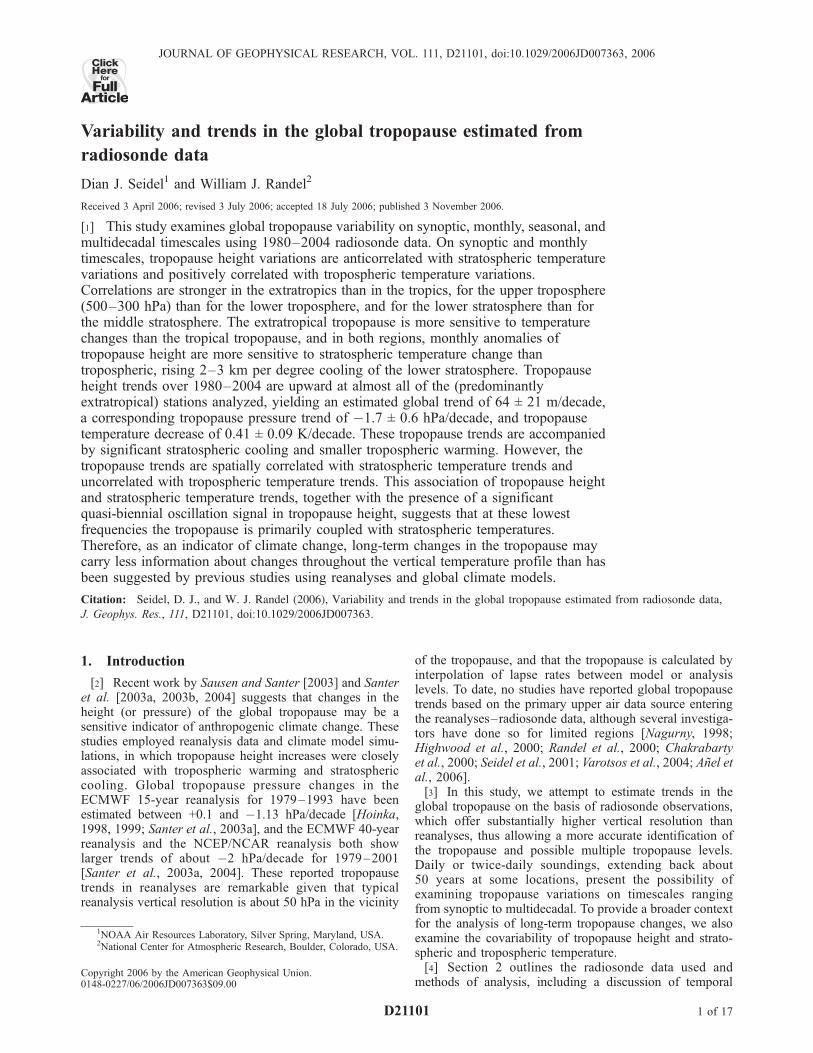
[5] Our analysis is based on radiosonde observationsfrom the 100 stations shown in Figure 1 and listed inTable 1 obtained from the Integrated Global RadiosondeArchive [Durre et al., 2006] at the NOAA National Cli-matic Data Center (NCDC). These stations were selected onthe basis of the length and completeness of their archiveddata record, with an aim toward global coverage. Many ofthe stations have been extensively studied by Gaffen [1994],Lanzante et al. [2003], Free et al. [2005], and Randel andWu [2006] and so some of their station histories andidiosyncrasies were familiar to us.[6] Using all available soundings taken during the period
1958–2004 and within three hours of 0000 or 1200 UTC, wedetermined the location of the lapse rate tropopause (LRT, orLRT1) and, if present, the second tropopause (LRT2), usingthe definition promulgated by the World MeteorologicalOrganization’s Commission for Aerology [World Meteoro-logical Organization, 1957, p. 137], which we cite herebecause the original reference is not readily available:
(a) The first tropopause is defined as the lowest level at which thelapse rate decreases to 2�C/km or less, provided also the averagelapse rate between this level and all higher levels within 2 km doesnot exceed 2�C/km.
(b) If above the first tropopause the average lapse rate between anylevel and all higher levels within 1 km exceeds 3�C/km, then asecond tropopause is defined by the same criterion as under (a).This tropopause may be either within or above the 1 km layer.
[7] We used all reported levels of data (both the standardand ‘‘significant’’ levels) but did not rely on the reportedLRT in the sounding data, because these values are some-times unreliable and often missing (J. C. Antuna et al.,Impact of missing sounding reports on mandatory levels andtropopause statistics: A case study, unpublished manuscript,2006). (Appendix A examines the influence of reducing thevertical resolution of the soundings by ignoring significantlevel data on our results.) In addition to identifying thepressure, temperature, and geopotential height (interpolatingthe existing height data when necessary) of the tropo-pause(s), we also extracted temperature and height datafor the surface and the 850, 500, 300, 200, 150, 100, 70, 50,30, 20 hPa levels, and computed the layer mean temperaturefor 850–300 hPa and 100–50 hPa. Soundings with noidentifiable LRT or with scanty data were not included. Acompanion paper, in preparation, focuses on the definitionand characteristics of the second tropopause, which is oftenevident in the extratropics. Here our main interest is in thefirst tropopause and its relation to the temperature profileabove and below it.[8] The daily soundings were used to create time series
for analysis of variability on four timescales: synoptic,monthly, seasonal, and multidecadal, separately for thetwo observation times. The mean seasonal cycle wascomputed by averaging all soundings for each calendar
Figure 1. Locations of radiosonde stations used in this study. Solid circles indicate that data for both0000 and 1200 UTC were used. Half-solid circles indicate that data for only one observation time wereused; if 0000 (1200) UTC data were used, the left (right) side of the circle is solid. Open circles indicatethat no data were used, and circles with a vertical line in the center indicate that data were used only in thecreation of climatological means and zonal time series.
D21101 SEIDEL AND RANDEL: GLOBAL TROPOPAUSE VARIABILITY AND TRENDS
2 of 17
D21101
month. Monthly means for each month were calculated if atleast 50% of the expected observations were available.Monthly anomaly time series were computed by subtractingthe mean seasonal cycle from the monthly means, and theseanomalies were used in estimating multidecadal trends.Synoptic variations, the shortest timescale studied, weredefined as the departure of daily values from the monthlymean for the relevant month and year.
2.2. Temporal Homogeneity Concerns
[9] It is well known that radiosonde temperature, humid-ity, geopotential height, and tropopause observations sufferfrom time-varying biases that confound attempts to extractclimate signals, particularly multidecadal trends [Gaffen,1994; Parker and Cox, 1995; Seidel et al., 2001; Redder etal., 2004; Lanzante et al., 2003; Sherwood et al., 2005;Randel and Wu, 2006]. Although two new radiosondetemperature data sets incorporate homogeneity adjustmentsto remove these biases [Free et al., 2005; Thorne et al.,2005], they are not suitable for analysis of the tropopause,because they deal only with temperature at specified pres-sure levels (the so-called mandatory levels) and make noattempt to address the tropopause. In both cases, the
Table 1. Radiosonde Stations Used in This Study, Including
Latitude, Longitude, World Meteorological Organization Identifi-
cation Number, and an Indication of What Data Were Used
Station Latitude Longitudea ID Datab
Alert 82.50 �62.33 71082 5Mould Bay 76.23 �119.33 71072 2Preobrazheniya 74.67 112.93 21504 2Point Barrow 71.30 �156.78 70026 5Jan Mayen 70.93 �8.67 01001 3 RChetyrekhstolbovoy 70.63 162.40 21965 2Verkhoyansk 67.55 133.38 24266 5Sodankyla 67.37 26.65 02836 1 RTuruhansk 65.78 87.95 23472 1 LAngmagssalik 65.60 �37.63 04360 1 RPechora 65.12 57.10 23418 1 LBaker Lake 64.30 �96.00 71926 5Keflavik 63.97 �22.60 04018 3 LAnchorage 61.16 �149.98 70273 1 SLerwick 60.13 �1.18 03005 5Kirensk 57.77 108.12 30230 2Saint Paul Island 57.15 �170.22 70308 3 RAnnette Island 55.03 �131.57 70398 5Omsk 54.93 73.40 28698 5Petropavlovsk 53.08 158.55 32540 5Orenburg 51.68 55.10 35121 1 LMoosonee 51.27 �80.65 71836 5International Falls 48.57 �93.38 72747 1 SMunchen 48.25 11.58 10868 5Glasgow 48.21 �106.63 72768 5Quillayute 47.95 �124.55 72797 5Torbay 47.67 �52.75 71801 5Great Falls 47.48 �111.35 72776 5Rostov-on-Donu 47.25 39.82 34731 4 LCaribou 46.87 �68.02 72712 5Wakkanai 45.42 141.68 47401 4 LSalem 44.92 �123.02 72694 5Green Bay 44.48 �88.13 72645 5Pittsburgh 40.53 �80.23 72520 5Kashi 39.47 75.98 51709 5Sterling 38.98 �77.48 72403 1 SLajes 38.73 �27.07 08508 1 LVMinqin 38.72 103.10 52681 2Ashabad 37.97 58.33 38880 3Dodge City 37.77 �99.97 72451 5Oakland 37.75 �122.22 72493 5Nashville 36.25 �86.57 72327 5North Front 36.25 �5.55 08495 1 LCharleston 32.90 �80.30 72208 5Miramar 32.85 �117.12 72293 5Tripoli 32.68 13.17 62010 2 LVBermuda 32.37 �64.68 78016 1 LRBet Dagan 32.00 34.82 40179 5Kagoshima 31.63 130.60 47827 1 LSanta Cruz 28.47 �16.25 60020 2 RCorpus Christi 27.78 �97.51 72251 1 SVBrownsville 25.92 �97.42 72250 5Key West 24.58 �81.70 72201 5Minamitorishima 24.30 153.97 47991 1 LVHong Kong 22.32 114.17 45004 4 RLihue 21.98 �159.35 91165 1 SJeddah 21.67 39.15 41024 1 LHilo 19.72 �155.07 91285 5San Juan 18.43 �66.00 78526 5Dakar 14.73 �17.50 61641 1 LRBangkok 13.73 100.50 48455 3Niamey 13.48 2.17 61052 1 VTruk 7.47 151.85 91334 1 LSKoror 7.33 134.48 91408 1 LVMajuro 7.08 171.38 91376 1 RAbidjan 5.25 �3.93 65578 2Bogota 4.70 �74.15 80222 1 RSingapore 1.37 103.98 48698 4 RNairobi �1.30 36.75 63741 3Manaus �3.15 �59.98 82332 2Diego Garcia �7.35 72.48 61967 2
Table 1. (continued)
Station Latitude Longitudea ID Datab
Ascension Island �7.97 �14.40 61902 1 RHoniara �9.42 160.05 91517 2Darwin �12.43 130.87 94120 1 LVNandi �17.45 177.27 91680 1 RPapeete �17.55 �149.62 91938 1 RAntananarivo �18.80 47.48 67083 2Townsville �19.25 146.77 94294 1 LRio de Janeiro �22.82 �43.25 83746 1 VAntofagasta �23.42 �70.47 85442 1 RIsla de Pascua �27.17 �109.43 85469 2Norfolk Island �29.03 167.93 94996 1 LVDurban �29.97 30.95 68588 3 VPerth �31.92 115.97 94610 1 LRVCapetown �33.96 18.60 68816 5Buenos Aires �34.82 �58.53 87576 1 RAdelaide �34.95 138.53 94672 3 LMartin de Vivies �37.80 77.53 61996 4Gough Island �40.35 �9.88 68906 3 LPuerto Montt �41.43 �73.10 85799 1 RChatham Island �43.95 �176.57 93986 1 RInvercargill �46.40 168.33 93844 3 LMarion Island �46.88 37.87 68994 3 LMacquarie Island �54.50 158.95 94998 3 LBellingshausen �62.20 �58.93 89050 2Syowa �69.00 39.58 89532 5Mawson �67.60 62.88 89564 4Molodezhnaya �67.67 45.85 89542 2McMurdo �77.85 166.67 89664 2 RAmundsen Scott �90.00 180.00 89009 3
aPositive, east; negative, west.bData indicators are as follows: 1, no data were used because of
suspected inhomogeneities (except in Figure 8 (left)); 2, data were not usedbecause of insufficient sampling, except to create climatological stationsmeans and zonal-average time series and trends; 3, only 0000 UTC datawere used; 4, only 1200 UTC data were used; 5, 0000 and 1200 UTCdata were used. The reason for suspecting that data from stations withdata indicators 1, 3, or 4 may be temporally inhomogeneous during theperiod 1980–2004 (for one or both observation times) is indicated by thecodes L (change points identified by Lanzante et al. [2003]), R (satellite-radiosonde comparison by Randel and Wu [2006]), S (station historyinformation, including Gaffen [1993] and Elliott et al. [2002]), and/or V(visual inspection of tropopause height anomaly time series).
D21101 SEIDEL AND RANDEL: GLOBAL TROPOPAUSE VARIABILITY AND TRENDS
3 of 17
D21101
adjusted data are monthly anomaly time series, so it is notpossible to identify either the daily tropopause location oreven its monthly mean level (because the data are anoma-lies, not actual temperatures, and so lapse rates cannot becomputed).[10] Embarking on this study, our hope was that temporal
inhomogeneities affecting the temperature and geopotentialheight data would not affect observations of the pressure ofthe tropopause level. Our reasoning was that the location ofthe ‘‘kink’’ in the temperature sounding associated with thetropopause would not be influenced by high or low biases inthe temperature data if pressure were used as the verticalcoordinate, since, unlike geopotential height (derived fromvertical integration of temperature, humidity and pressure
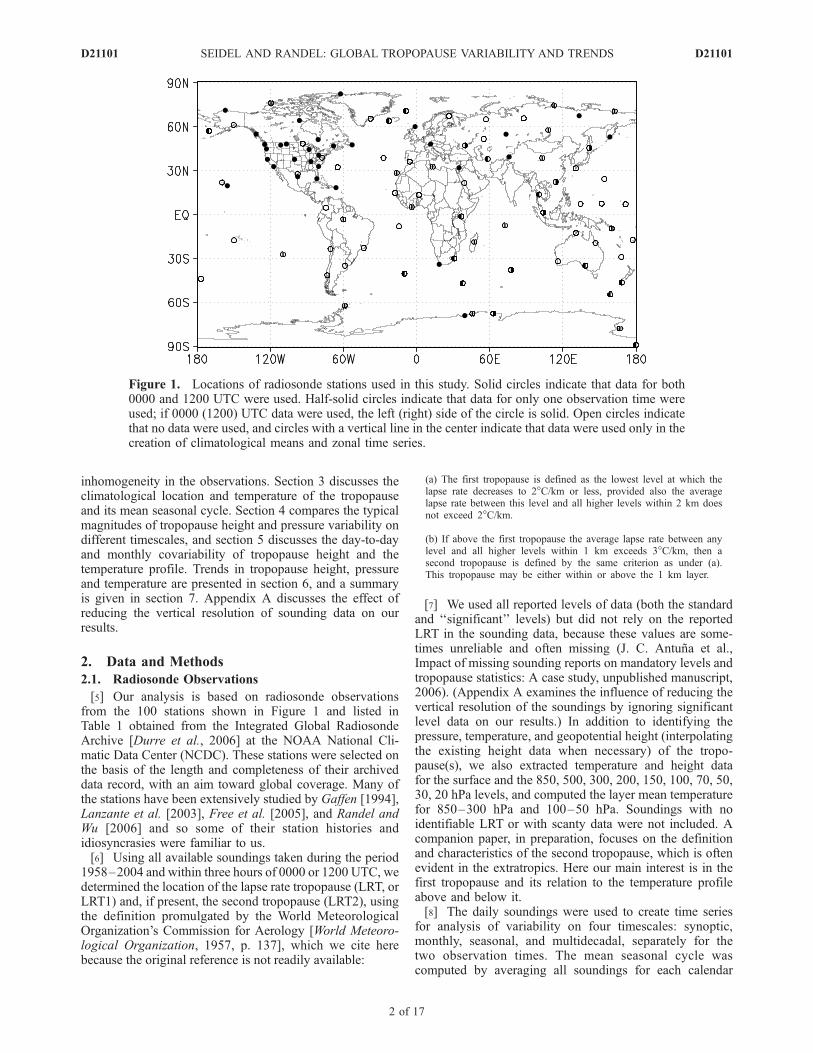
observations), pressure is independently measured, and it isgenerally thought that radiosonde pressure observations aremore accurate than temperature. Unfortunately, this argu-ment was not valid (see Figure 2), so we were compelled toconfront the homogeneity issue directly.[11] Four sources of information were used to screen
stations with inhomogeneous data. First, we relied on theextensive analysis of Lanzante et al. [2003], whose ‘‘deci-sion files’’ include the dates of inhomogeneities conserva-tively or liberally identified by that expert team for each oftheir 87 stations, for 0000 and 1200 UTC separately, for1958–1997. Conservatively identified change points at orabove the 850 hPa level were grounds for our excluding astation’s data. Second, stations were excluded if there were
Figure 2. Time series of monthly anomalies (mean annual cycle removed) of tropopause height andpressure at 0000 UTC at Darwin, Australia (top two panels), and at 1200 UTC at Buenos Aires,Argentina (bottom two panels).
D21101 SEIDEL AND RANDEL: GLOBAL TROPOPAUSE VARIABILITY AND TRENDS
4 of 17
D21101
known instrument changes documented in station historyrecords (Gaffen [1993] and subsequent updates by NCDC;Elliott et al. [2002]), some occurring after 1997, the end ofthe Lanzante et al. [2003] analysis. Third, we eliminatedseveral stations that Randel and Wu [2006] suspected wereinhomogeneous on the basis of discontinuities in time seriesof radiosonde minus satellite observations during 1979–2004. In particular, we excluded any station with a lowerstratospheric trend difference between the radiosonde dataand satellite data exceeding 0.5 K/decade [Randel and Wu,2006, Table 1]. Fourth, we visually inspected time series ofmonthly tropopause height and pressure anomalies for eachstation and found some examples of obvious change pointsin the data. In many cases, more than one source ofinformation pointed to inhomogeneity problems at a givenstation. Table 1 (rightmost column) shows whether and whydata from each station were suspected of being inhomoge-neous, or had excessive missing values.[12] Figure 2 shows two examples of tropopause height
and pressure monthly anomaly time series to illustrate thedata homogeneity issue. At Darwin, Australia, there is anabrupt upward jump in tropopause height of about 1 km inabout 1984. The strong anticorrelation between LRT pres-sure and height is reassuring, but the 20–30 hPa LRTpressure jump in 1984 indicates that, if the height changeat that time is spurious, pressure data are also affected. Asimilar feature is evident in the data from Buenos Aires,Argentina, in late 1979. Although no abrupt changes areapparent in the Buenos Aires data after 1980 in Figure 2,Randel and Wu [2006] identified this station’s 1979–2004data as suspect on the basis of comparison with satellitedata, and we eliminated them from our main analysis.
[13] We also omitted stations with more than one third ofthe monthly anomalies missing. On the basis of thiscriterion and the four indicators of data inhomogeneity,we restricted our analysis to the 25-year period 1980–2004, to best balance the number of stations and the lengthof record. This left 50 of the original 100 stations (Table 1and Figure 1), of which 31 had data deemed homogeneousfor both 0000 and 1200 UTC. An additional 16 stations withinsufficient sampling for trend analysis were included inanalyses of climatological statistics (section 3) and zonal-average time series (section 6).
3. Climatological Tropopause Location andMean Seasonal Variations
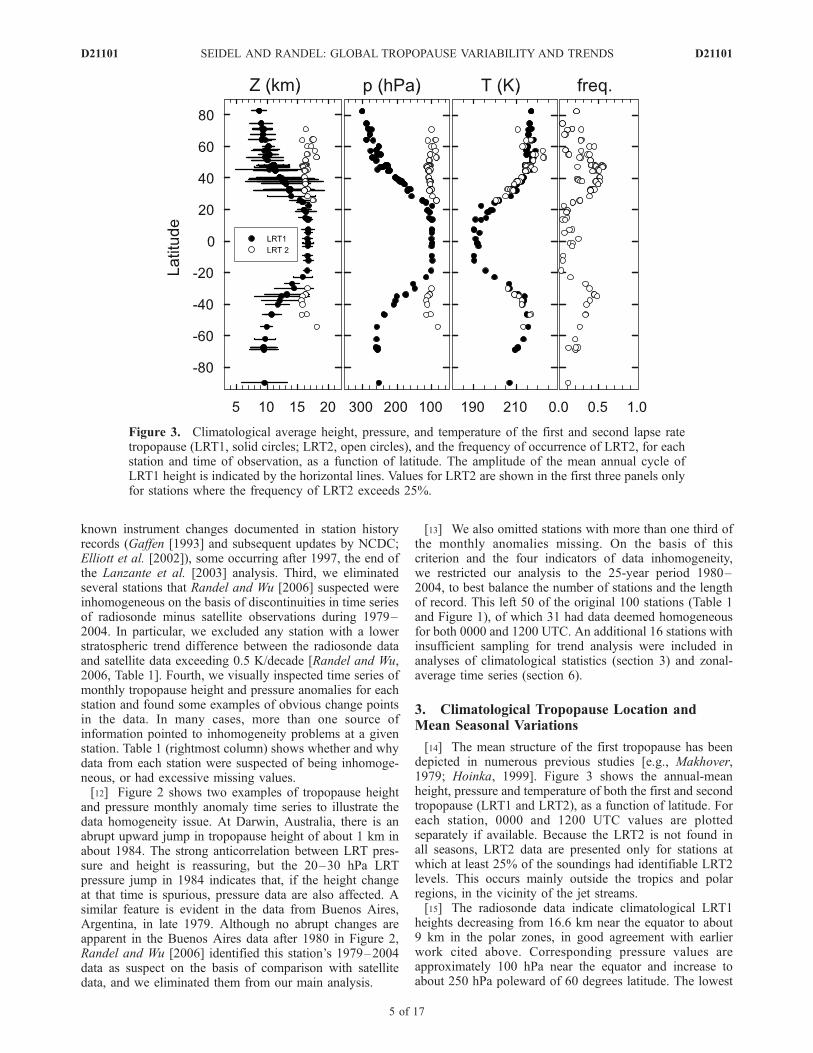
[14] The mean structure of the first tropopause has beendepicted in numerous previous studies [e.g., Makhover,1979; Hoinka, 1999]. Figure 3 shows the annual-meanheight, pressure and temperature of both the first and secondtropopause (LRT1 and LRT2), as a function of latitude. Foreach station, 0000 and 1200 UTC values are plottedseparately if available. Because the LRT2 is not found inall seasons, LRT2 data are presented only for stations atwhich at least 25% of the soundings had identifiable LRT2levels. This occurs mainly outside the tropics and polarregions, in the vicinity of the jet streams.[15] The radiosonde data indicate climatological LRT1
heights decreasing from 16.6 km near the equator to about9 km in the polar zones, in good agreement with earlierwork cited above. Corresponding pressure values areapproximately 100 hPa near the equator and increase toabout 250 hPa poleward of 60 degrees latitude. The lowest
Figure 3. Climatological average height, pressure, and temperature of the first and second lapse ratetropopause (LRT1, solid circles; LRT2, open circles), and the frequency of occurrence of LRT2, for eachstation and time of observation, as a function of latitude. The amplitude of the mean annual cycle ofLRT1 height is indicated by the horizontal lines. Values for LRT2 are shown in the first three panels onlyfor stations where the frequency of LRT2 exceeds 25%.
D21101 SEIDEL AND RANDEL: GLOBAL TROPOPAUSE VARIABILITY AND TRENDS
5 of 17
D21101
climatological LRT pressure is 97 hPa at Bangkok, Thai-land, and the highest value is 300 hPa at Alert, Canada. Theamplitude of the mean seasonal cycle of LRT1 height isshown by the horizontal lines in Figure 3. The amplitude issmallest (0.5–1.7 km) at stations between 20�N and 20�Slatitude and has maximum values (2–6 km) in midlatitudes.There is some indication of larger amplitude seasonal varia-tions in the Northern Hemisphere (NH) than in the SouthernHemisphere (SH), which could be related to the greaterfraction of land-covered surface there.[16] In midlatitudes, the location of LRT2, which is not
present all year but mainly in winter, is almost identical tothe location of the tropical LRT1, 16 km and 100 hPa. Itstemperature, however, more closely resembles that of thelocal LRT1 and never differs by more than 5 K. At moststations, LRT2 is a few Kelvin cooler than LRT1, which is acombined result of the lapse rate between the two levels andthe fact that LRT2 statistics are based mainly on fall-winter-spring data, whereas LRT1 data are more representative ofthe year. At stations near 50�N and 50�S latitude, LRT2 is afew degrees warmer than LRT1, because of temperatureinversions between LRT1 and LRT2 in winter.[17] Figure 4 shows the mean seasonal cycle of the height
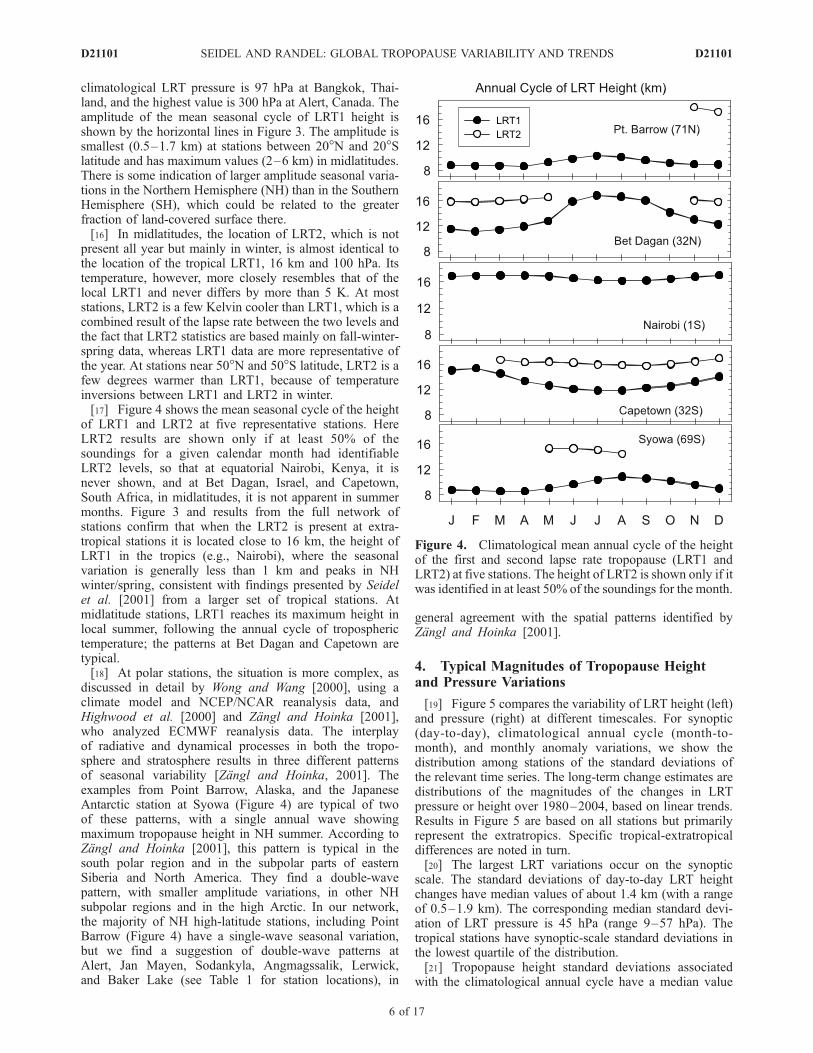
of LRT1 and LRT2 at five representative stations. HereLRT2 results are shown only if at least 50% of thesoundings for a given calendar month had identifiableLRT2 levels, so that at equatorial Nairobi, Kenya, it isnever shown, and at Bet Dagan, Israel, and Capetown,South Africa, in midlatitudes, it is not apparent in summermonths. Figure 3 and results from the full network ofstations confirm that when the LRT2 is present at extra-tropical stations it is located close to 16 km, the height ofLRT1 in the tropics (e.g., Nairobi), where the seasonalvariation is generally less than 1 km and peaks in NHwinter/spring, consistent with findings presented by Seidelet al. [2001] from a larger set of tropical stations. Atmidlatitude stations, LRT1 reaches its maximum height inlocal summer, following the annual cycle of tropospherictemperature; the patterns at Bet Dagan and Capetown aretypical.[18] At polar stations, the situation is more complex, as
discussed in detail by Wong and Wang [2000], using aclimate model and NCEP/NCAR reanalysis data, andHighwood et al. [2000] and Zangl and Hoinka [2001],who analyzed ECMWF reanalysis data. The interplayof radiative and dynamical processes in both the tropo-sphere and stratosphere results in three different patternsof seasonal variability [Zangl and Hoinka, 2001]. Theexamples from Point Barrow, Alaska, and the JapaneseAntarctic station at Syowa (Figure 4) are typical of twoof these patterns, with a single annual wave showingmaximum tropopause height in NH summer. According toZangl and Hoinka [2001], this pattern is typical in thesouth polar region and in the subpolar parts of easternSiberia and North America. They find a double-wavepattern, with smaller amplitude variations, in other NHsubpolar regions and in the high Arctic. In our network,the majority of NH high-latitude stations, including PointBarrow (Figure 4) have a single-wave seasonal variation,but we find a suggestion of double-wave patterns atAlert, Jan Mayen, Sodankyla, Angmagssalik, Lerwick,and Baker Lake (see Table 1 for station locations), in
general agreement with the spatial patterns identified byZangl and Hoinka [2001].
4. Typical Magnitudes of Tropopause Heightand Pressure Variations
[19] Figure 5 compares the variability of LRT height (left)and pressure (right) at different timescales. For synoptic(day-to-day), climatological annual cycle (month-to-month), and monthly anomaly variations, we show thedistribution among stations of the standard deviations ofthe relevant time series. The long-term change estimates aredistributions of the magnitudes of the changes in LRTpressure or height over 1980–2004, based on linear trends.Results in Figure 5 are based on all stations but primarilyrepresent the extratropics. Specific tropical-extratropicaldifferences are noted in turn.[20] The largest LRT variations occur on the synoptic
scale. The standard deviations of day-to-day LRT heightchanges have median values of about 1.4 km (with a rangeof 0.5–1.9 km). The corresponding median standard devi-ation of LRT pressure is 45 hPa (range 9–57 hPa). Thetropical stations have synoptic-scale standard deviations inthe lowest quartile of the distribution.[21] Tropopause height standard deviations associated
with the climatological annual cycle have a median value
Figure 4. Climatological mean annual cycle of the heightof the first and second lapse rate tropopause (LRT1 andLRT2) at five stations. The height of LRT2 is shown only if itwas identified in at least 50% of the soundings for the month.
D21101 SEIDEL AND RANDEL: GLOBAL TROPOPAUSE VARIABILITY AND TRENDS
6 of 17
D21101
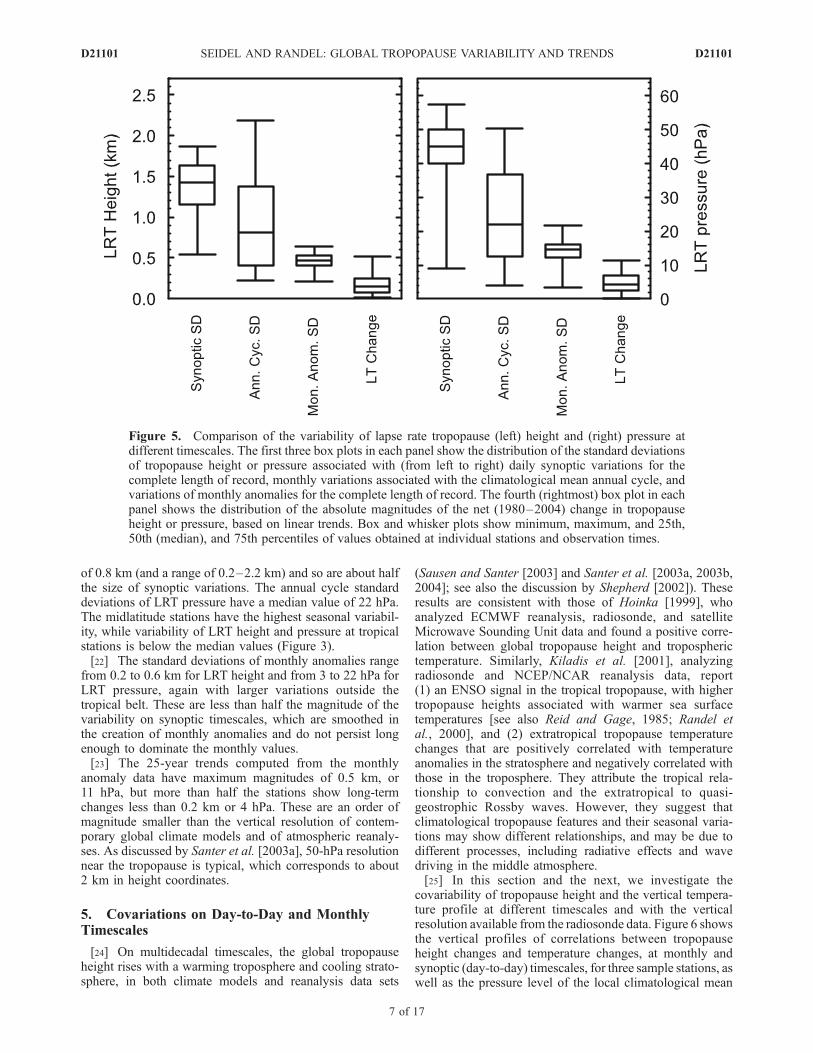
of 0.8 km (and a range of 0.2–2.2 km) and so are about halfthe size of synoptic variations. The annual cycle standarddeviations of LRT pressure have a median value of 22 hPa.The midlatitude stations have the highest seasonal variabil-ity, while variability of LRT height and pressure at tropicalstations is below the median values (Figure 3).[22] The standard deviations of monthly anomalies range
from 0.2 to 0.6 km for LRT height and from 3 to 22 hPa forLRT pressure, again with larger variations outside thetropical belt. These are less than half the magnitude of thevariability on synoptic timescales, which are smoothed inthe creation of monthly anomalies and do not persist longenough to dominate the monthly values.[23] The 25-year trends computed from the monthly
anomaly data have maximum magnitudes of 0.5 km, or11 hPa, but more than half the stations show long-termchanges less than 0.2 km or 4 hPa. These are an order ofmagnitude smaller than the vertical resolution of contem-porary global climate models and of atmospheric reanaly-ses. As discussed by Santer et al. [2003a], 50-hPa resolutionnear the tropopause is typical, which corresponds to about2 km in height coordinates.
5. Covariations on Day-to-Day and MonthlyTimescales
[24] On multidecadal timescales, the global tropopauseheight rises with a warming troposphere and cooling strato-sphere, in both climate models and reanalysis data sets
(Sausen and Santer [2003] and Santer et al. [2003a, 2003b,2004]; see also the discussion by Shepherd [2002]). Theseresults are consistent with those of Hoinka [1999], whoanalyzed ECMWF reanalysis, radiosonde, and satelliteMicrowave Sounding Unit data and found a positive corre-lation between global tropopause height and tropospherictemperature. Similarly, Kiladis et al. [2001], analyzingradiosonde and NCEP/NCAR reanalysis data, report(1) an ENSO signal in the tropical tropopause, with highertropopause heights associated with warmer sea surfacetemperatures [see also Reid and Gage, 1985; Randel etal., 2000], and (2) extratropical tropopause temperaturechanges that are positively correlated with temperatureanomalies in the stratosphere and negatively correlated withthose in the troposphere. They attribute the tropical rela-tionship to convection and the extratropical to quasi-geostrophic Rossby waves. However, they suggest thatclimatological tropopause features and their seasonal varia-tions may show different relationships, and may be due todifferent processes, including radiative effects and wavedriving in the middle atmosphere.[25] In this section and the next, we investigate the
covariability of tropopause height and the vertical tempera-ture profile at different timescales and with the verticalresolution available from the radiosonde data. Figure 6 showsthe vertical profiles of correlations between tropopauseheight changes and temperature changes, at monthly andsynoptic (day-to-day) timescales, for three sample stations, aswell as the pressure level of the local climatological mean
Figure 5. Comparison of the variability of lapse rate tropopause (left) height and (right) pressure atdifferent timescales. The first three box plots in each panel show the distribution of the standard deviationsof tropopause height or pressure associated with (from left to right) daily synoptic variations for thecomplete length of record, monthly variations associated with the climatological mean annual cycle, andvariations of monthly anomalies for the complete length of record. The fourth (rightmost) box plot in eachpanel shows the distribution of the absolute magnitudes of the net (1980–2004) change in tropopauseheight or pressure, based on linear trends. Box and whisker plots show minimum, maximum, and 25th,50th (median), and 75th percentiles of values obtained at individual stations and observation times.
D21101 SEIDEL AND RANDEL: GLOBAL TROPOPAUSE VARIABILITY AND TRENDS
7 of 17
D21101
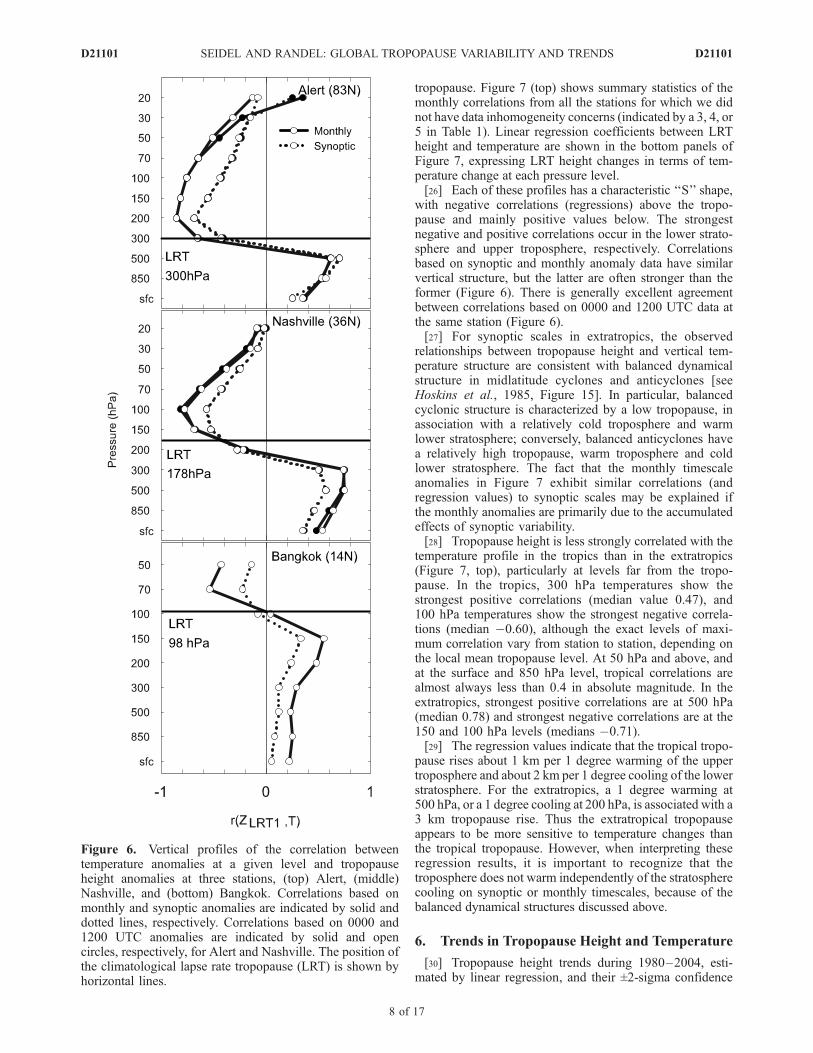
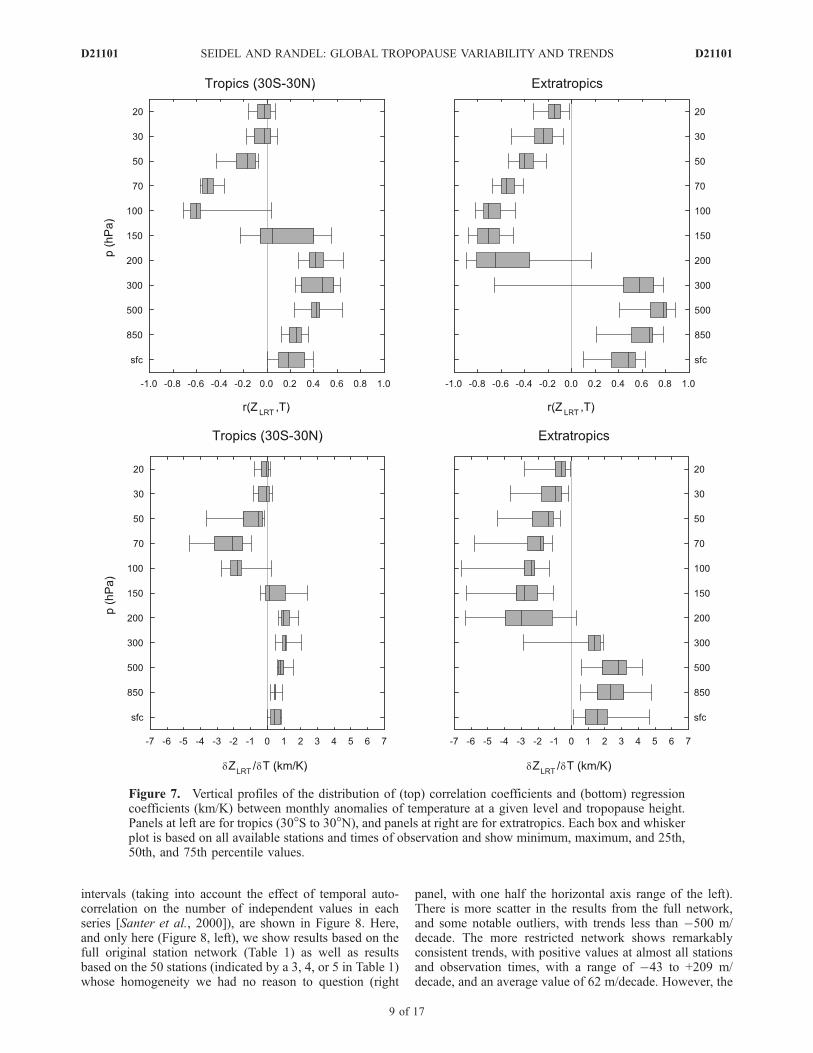
tropopause. Figure 7 (top) shows summary statistics of themonthly correlations from all the stations for which we didnot have data inhomogeneity concerns (indicated by a 3, 4, or5 in Table 1). Linear regression coefficients between LRTheight and temperature are shown in the bottom panels ofFigure 7, expressing LRT height changes in terms of tem-perature change at each pressure level.[26] Each of these profiles has a characteristic ‘‘S’’ shape,
with negative correlations (regressions) above the tropo-pause and mainly positive values below. The strongestnegative and positive correlations occur in the lower strato-sphere and upper troposphere, respectively. Correlationsbased on synoptic and monthly anomaly data have similarvertical structure, but the latter are often stronger than theformer (Figure 6). There is generally excellent agreementbetween correlations based on 0000 and 1200 UTC data atthe same station (Figure 6).[27] For synoptic scales in extratropics, the observed
relationships between tropopause height and vertical tem-perature structure are consistent with balanced dynamicalstructure in midlatitude cyclones and anticyclones [seeHoskins et al., 1985, Figure 15]. In particular, balancedcyclonic structure is characterized by a low tropopause, inassociation with a relatively cold troposphere and warmlower stratosphere; conversely, balanced anticyclones havea relatively high tropopause, warm troposphere and coldlower stratosphere. The fact that the monthly timescaleanomalies in Figure 7 exhibit similar correlations (andregression values) to synoptic scales may be explained ifthe monthly anomalies are primarily due to the accumulatedeffects of synoptic variability.[28] Tropopause height is less strongly correlated with the
temperature profile in the tropics than in the extratropics(Figure 7, top), particularly at levels far from the tropo-pause. In the tropics, 300 hPa temperatures show thestrongest positive correlations (median value 0.47), and100 hPa temperatures show the strongest negative correla-tions (median �0.60), although the exact levels of maxi-mum correlation vary from station to station, depending onthe local mean tropopause level. At 50 hPa and above, andat the surface and 850 hPa level, tropical correlations arealmost always less than 0.4 in absolute magnitude. In theextratropics, strongest positive correlations are at 500 hPa(median 0.78) and strongest negative correlations are at the150 and 100 hPa levels (medians �0.71).[29] The regression values indicate that the tropical tropo-
pause rises about 1 km per 1 degree warming of the uppertroposphere and about 2 km per 1 degree cooling of the lowerstratosphere. For the extratropics, a 1 degree warming at500 hPa, or a 1 degree cooling at 200 hPa, is associated with a3 km tropopause rise. Thus the extratropical tropopauseappears to be more sensitive to temperature changes thanthe tropical tropopause. However, when interpreting theseregression results, it is important to recognize that thetroposphere does not warm independently of the stratospherecooling on synoptic or monthly timescales, because of thebalanced dynamical structures discussed above.
6. Trends in Tropopause Height and Temperature
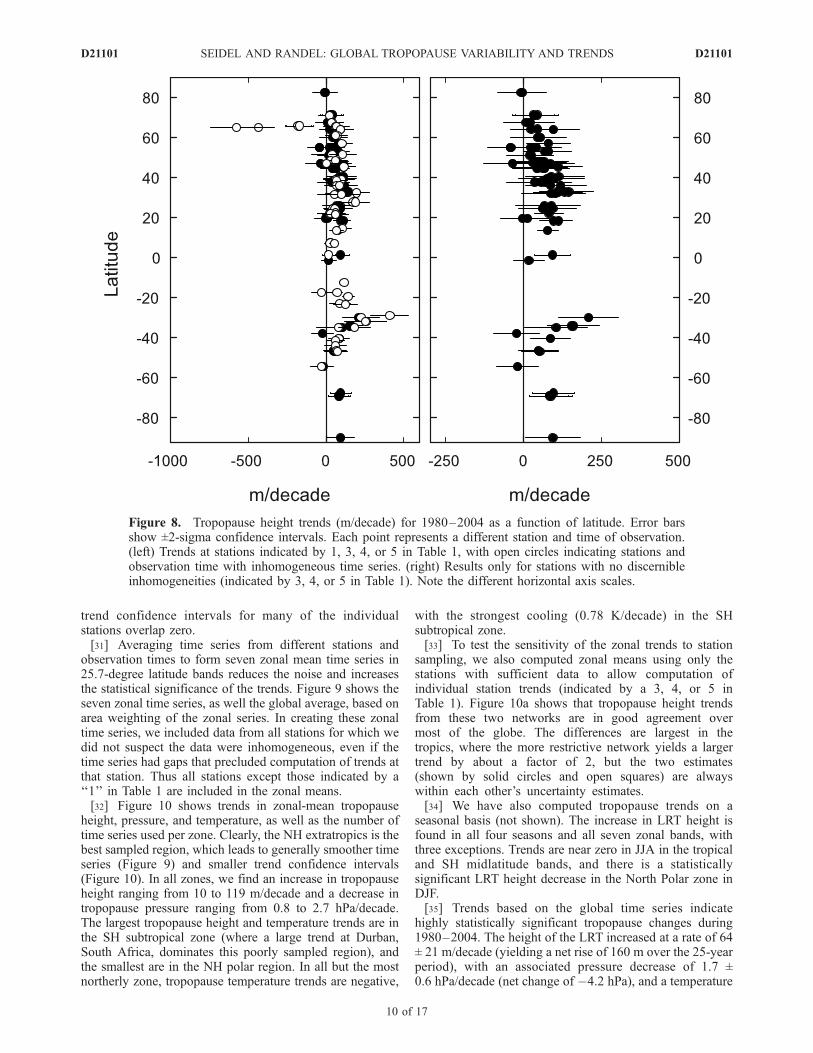
[30] Tropopause height trends during 1980–2004, esti-mated by linear regression, and their ±2-sigma confidence
Figure 6. Vertical profiles of the correlation betweentemperature anomalies at a given level and tropopauseheight anomalies at three stations, (top) Alert, (middle)Nashville, and (bottom) Bangkok. Correlations based onmonthly and synoptic anomalies are indicated by solid anddotted lines, respectively. Correlations based on 0000 and1200 UTC anomalies are indicated by solid and opencircles, respectively, for Alert and Nashville. The position ofthe climatological lapse rate tropopause (LRT) is shown byhorizontal lines.
D21101 SEIDEL AND RANDEL: GLOBAL TROPOPAUSE VARIABILITY AND TRENDS
8 of 17
D21101
intervals (taking into account the effect of temporal auto-correlation on the number of independent values in eachseries [Santer et al., 2000]), are shown in Figure 8. Here,and only here (Figure 8, left), we show results based on thefull original station network (Table 1) as well as resultsbased on the 50 stations (indicated by a 3, 4, or 5 in Table 1)whose homogeneity we had no reason to question (right
panel, with one half the horizontal axis range of the left).There is more scatter in the results from the full network,and some notable outliers, with trends less than �500 m/decade. The more restricted network shows remarkablyconsistent trends, with positive values at almost all stationsand observation times, with a range of �43 to +209 m/decade, and an average value of 62 m/decade. However, the
Figure 7. Vertical profiles of the distribution of (top) correlation coefficients and (bottom) regressioncoefficients (km/K) between monthly anomalies of temperature at a given level and tropopause height.Panels at left are for tropics (30�S to 30�N), and panels at right are for extratropics. Each box and whiskerplot is based on all available stations and times of observation and show minimum, maximum, and 25th,50th, and 75th percentile values.
D21101 SEIDEL AND RANDEL: GLOBAL TROPOPAUSE VARIABILITY AND TRENDS
9 of 17
D21101
trend confidence intervals for many of the individualstations overlap zero.[31] Averaging time series from different stations and
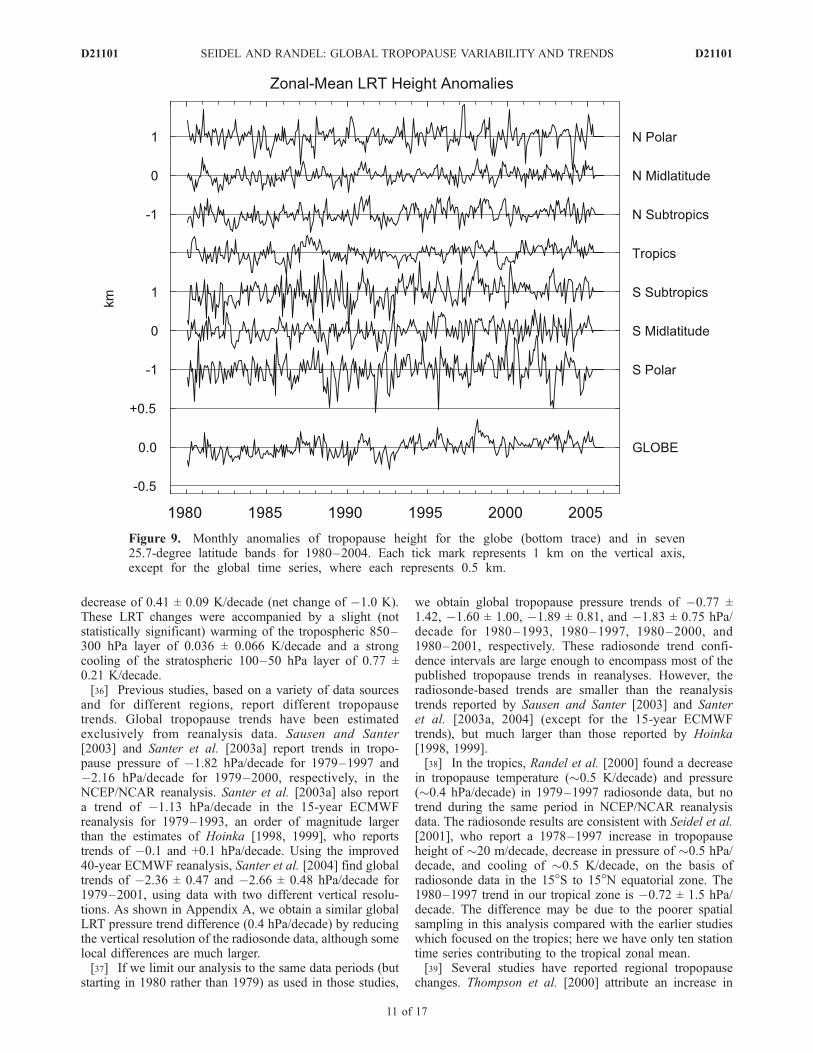
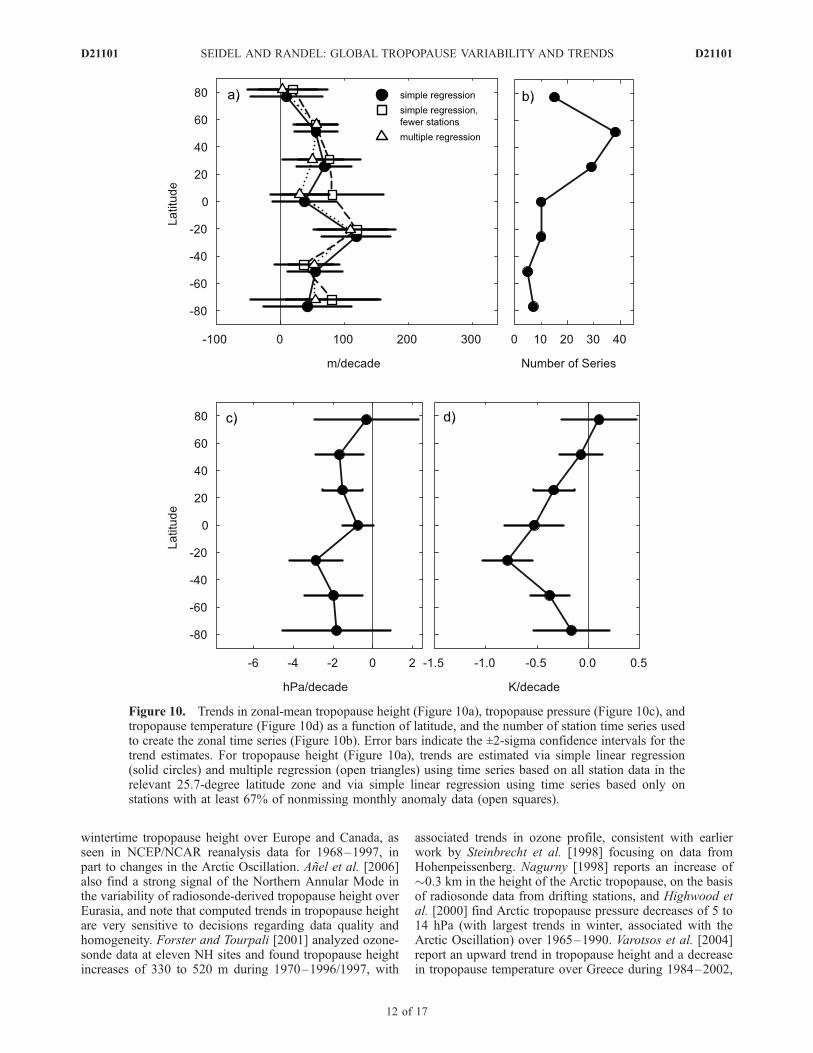
observation times to form seven zonal mean time series in25.7-degree latitude bands reduces the noise and increasesthe statistical significance of the trends. Figure 9 shows theseven zonal time series, as well the global average, based onarea weighting of the zonal series. In creating these zonaltime series, we included data from all stations for which wedid not suspect the data were inhomogeneous, even if thetime series had gaps that precluded computation of trends atthat station. Thus all stations except those indicated by a‘‘1’’ in Table 1 are included in the zonal means.[32] Figure 10 shows trends in zonal-mean tropopause
height, pressure, and temperature, as well as the number oftime series used per zone. Clearly, the NH extratropics is thebest sampled region, which leads to generally smoother timeseries (Figure 9) and smaller trend confidence intervals(Figure 10). In all zones, we find an increase in tropopauseheight ranging from 10 to 119 m/decade and a decrease intropopause pressure ranging from 0.8 to 2.7 hPa/decade.The largest tropopause height and temperature trends are inthe SH subtropical zone (where a large trend at Durban,South Africa, dominates this poorly sampled region), andthe smallest are in the NH polar region. In all but the mostnortherly zone, tropopause temperature trends are negative,
with the strongest cooling (0.78 K/decade) in the SHsubtropical zone.[33] To test the sensitivity of the zonal trends to station
sampling, we also computed zonal means using only thestations with sufficient data to allow computation ofindividual station trends (indicated by a 3, 4, or 5 inTable 1). Figure 10a shows that tropopause height trendsfrom these two networks are in good agreement overmost of the globe. The differences are largest in thetropics, where the more restrictive network yields a largertrend by about a factor of 2, but the two estimates(shown by solid circles and open squares) are alwayswithin each other’s uncertainty estimates.[34] We have also computed tropopause trends on a
seasonal basis (not shown). The increase in LRT height isfound in all four seasons and all seven zonal bands, withthree exceptions. Trends are near zero in JJA in the tropicaland SH midlatitude bands, and there is a statisticallysignificant LRT height decrease in the North Polar zone inDJF.[35] Trends based on the global time series indicate
highly statistically significant tropopause changes during1980–2004. The height of the LRT increased at a rate of 64± 21 m/decade (yielding a net rise of 160 m over the 25-yearperiod), with an associated pressure decrease of 1.7 ±0.6 hPa/decade (net change of �4.2 hPa), and a temperature
Figure 8. Tropopause height trends (m/decade) for 1980–2004 as a function of latitude. Error barsshow ±2-sigma confidence intervals. Each point represents a different station and time of observation.(left) Trends at stations indicated by 1, 3, 4, or 5 in Table 1, with open circles indicating stations andobservation time with inhomogeneous time series. (right) Results only for stations with no discernibleinhomogeneities (indicated by 3, 4, or 5 in Table 1). Note the different horizontal axis scales.
D21101 SEIDEL AND RANDEL: GLOBAL TROPOPAUSE VARIABILITY AND TRENDS
10 of 17
D21101
decrease of 0.41 ± 0.09 K/decade (net change of �1.0 K).These LRT changes were accompanied by a slight (notstatistically significant) warming of the tropospheric 850–300 hPa layer of 0.036 ± 0.066 K/decade and a strongcooling of the stratospheric 100–50 hPa layer of 0.77 ±0.21 K/decade.[36] Previous studies, based on a variety of data sources
and for different regions, report different tropopausetrends. Global tropopause trends have been estimatedexclusively from reanalysis data. Sausen and Santer[2003] and Santer et al. [2003a] report trends in tropo-pause pressure of �1.82 hPa/decade for 1979–1997 and�2.16 hPa/decade for 1979–2000, respectively, in theNCEP/NCAR reanalysis. Santer et al. [2003a] also reporta trend of �1.13 hPa/decade in the 15-year ECMWFreanalysis for 1979–1993, an order of magnitude largerthan the estimates of Hoinka [1998, 1999], who reportstrends of �0.1 and +0.1 hPa/decade. Using the improved40-year ECMWF reanalysis, Santer et al. [2004] find globaltrends of �2.36 ± 0.47 and �2.66 ± 0.48 hPa/decade for1979–2001, using data with two different vertical resolu-tions. As shown in Appendix A, we obtain a similar globalLRT pressure trend difference (0.4 hPa/decade) by reducingthe vertical resolution of the radiosonde data, although somelocal differences are much larger.[37] If we limit our analysis to the same data periods (but
starting in 1980 rather than 1979) as used in those studies,
we obtain global tropopause pressure trends of �0.77 ±1.42, �1.60 ± 1.00, �1.89 ± 0.81, and �1.83 ± 0.75 hPa/decade for 1980–1993, 1980–1997, 1980–2000, and1980–2001, respectively. These radiosonde trend confi-dence intervals are large enough to encompass most of thepublished tropopause trends in reanalyses. However, theradiosonde-based trends are smaller than the reanalysistrends reported by Sausen and Santer [2003] and Santeret al. [2003a, 2004] (except for the 15-year ECMWFtrends), but much larger than those reported by Hoinka[1998, 1999].[38] In the tropics, Randel et al. [2000] found a decrease
in tropopause temperature (�0.5 K/decade) and pressure(�0.4 hPa/decade) in 1979–1997 radiosonde data, but notrend during the same period in NCEP/NCAR reanalysisdata. The radiosonde results are consistent with Seidel et al.[2001], who report a 1978–1997 increase in tropopauseheight of �20 m/decade, decrease in pressure of �0.5 hPa/decade, and cooling of �0.5 K/decade, on the basis ofradiosonde data in the 15�S to 15�N equatorial zone. The1980–1997 trend in our tropical zone is �0.72 ± 1.5 hPa/decade. The difference may be due to the poorer spatialsampling in this analysis compared with the earlier studieswhich focused on the tropics; here we have only ten stationtime series contributing to the tropical zonal mean.[39] Several studies have reported regional tropopause
changes. Thompson et al. [2000] attribute an increase in
Figure 9. Monthly anomalies of tropopause height for the globe (bottom trace) and in seven25.7-degree latitude bands for 1980–2004. Each tick mark represents 1 km on the vertical axis,except for the global time series, where each represents 0.5 km.
D21101 SEIDEL AND RANDEL: GLOBAL TROPOPAUSE VARIABILITY AND TRENDS
11 of 17
D21101
wintertime tropopause height over Europe and Canada, asseen in NCEP/NCAR reanalysis data for 1968–1997, inpart to changes in the Arctic Oscillation. Anel et al. [2006]also find a strong signal of the Northern Annular Mode inthe variability of radiosonde-derived tropopause height overEurasia, and note that computed trends in tropopause heightare very sensitive to decisions regarding data quality andhomogeneity. Forster and Tourpali [2001] analyzed ozone-sonde data at eleven NH sites and found tropopause heightincreases of 330 to 520 m during 1970–1996/1997, with
associated trends in ozone profile, consistent with earlierwork by Steinbrecht et al. [1998] focusing on data fromHohenpeissenberg. Nagurny [1998] reports an increase of�0.3 km in the height of the Arctic tropopause, on the basisof radiosonde data from drifting stations, and Highwood etal. [2000] find Arctic tropopause pressure decreases of 5 to14 hPa (with largest trends in winter, associated with theArctic Oscillation) over 1965–1990. Varotsos et al. [2004]report an upward trend in tropopause height and a decreasein tropopause temperature over Greece during 1984–2002,
Figure 10. Trends in zonal-mean tropopause height (Figure 10a), tropopause pressure (Figure 10c), andtropopause temperature (Figure 10d) as a function of latitude, and the number of station time series usedto create the zonal time series (Figure 10b). Error bars indicate the ±2-sigma confidence intervals for thetrend estimates. For tropopause height (Figure 10a), trends are estimated via simple linear regression(solid circles) and multiple regression (open triangles) using time series based on all station data in therelevant 25.7-degree latitude zone and via simple linear regression using time series based only onstations with at least 67% of nonmissing monthly anomaly data (open squares).
D21101 SEIDEL AND RANDEL: GLOBAL TROPOPAUSE VARIABILITY AND TRENDS
12 of 17
D21101
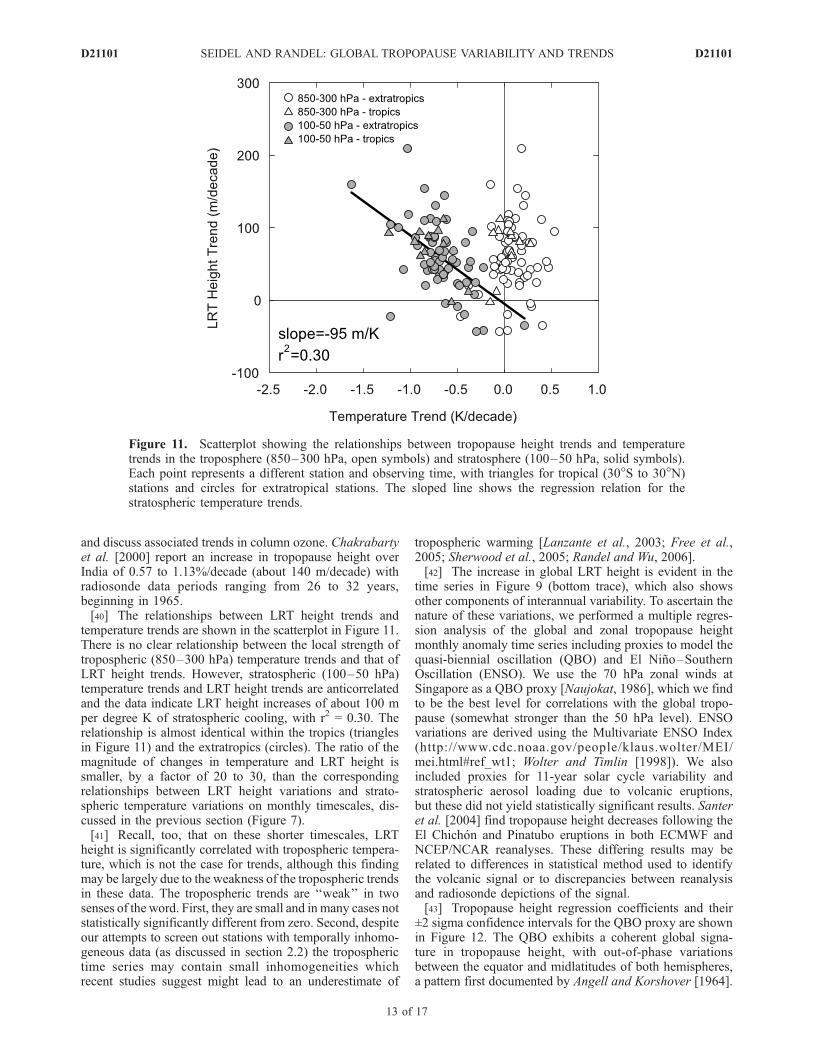
and discuss associated trends in column ozone. Chakrabartyet al. [2000] report an increase in tropopause height overIndia of 0.57 to 1.13%/decade (about 140 m/decade) withradiosonde data periods ranging from 26 to 32 years,beginning in 1965.[40] The relationships between LRT height trends and
temperature trends are shown in the scatterplot in Figure 11.There is no clear relationship between the local strength oftropospheric (850–300 hPa) temperature trends and that ofLRT height trends. However, stratospheric (100–50 hPa)temperature trends and LRT height trends are anticorrelatedand the data indicate LRT height increases of about 100 mper degree K of stratospheric cooling, with r2 = 0.30. Therelationship is almost identical within the tropics (trianglesin Figure 11) and the extratropics (circles). The ratio of themagnitude of changes in temperature and LRT height issmaller, by a factor of 20 to 30, than the correspondingrelationships between LRT height variations and strato-spheric temperature variations on monthly timescales, dis-cussed in the previous section (Figure 7).[41] Recall, too, that on these shorter timescales, LRT
height is significantly correlated with tropospheric tempera-ture, which is not the case for trends, although this findingmay be largely due to the weakness of the tropospheric trendsin these data. The tropospheric trends are ‘‘weak’’ in twosenses of the word. First, they are small and in many cases notstatistically significantly different from zero. Second, despiteour attempts to screen out stations with temporally inhomo-geneous data (as discussed in section 2.2) the tropospherictime series may contain small inhomogeneities whichrecent studies suggest might lead to an underestimate of
tropospheric warming [Lanzante et al., 2003; Free et al.,2005; Sherwood et al., 2005; Randel and Wu, 2006].[42] The increase in global LRT height is evident in the
time series in Figure 9 (bottom trace), which also showsother components of interannual variability. To ascertain thenature of these variations, we performed a multiple regres-sion analysis of the global and zonal tropopause heightmonthly anomaly time series including proxies to model thequasi-biennial oscillation (QBO) and El Nino–SouthernOscillation (ENSO). We use the 70 hPa zonal winds atSingapore as a QBO proxy [Naujokat, 1986], which we findto be the best level for correlations with the global tropo-pause (somewhat stronger than the 50 hPa level). ENSOvariations are derived using the Multivariate ENSO Index(http://www.cdc.noaa.gov/people/klaus.wolter/MEI/mei.html#ref_wt1; Wolter and Timlin [1998]). We alsoincluded proxies for 11-year solar cycle variability andstratospheric aerosol loading due to volcanic eruptions,but these did not yield statistically significant results. Santeret al. [2004] find tropopause height decreases following theEl Chichon and Pinatubo eruptions in both ECMWF andNCEP/NCAR reanalyses. These differing results may berelated to differences in statistical method used to identifythe volcanic signal or to discrepancies between reanalysisand radiosonde depictions of the signal.[43] Tropopause height regression coefficients and their
±2 sigma confidence intervals for the QBO proxy are shownin Figure 12. The QBO exhibits a coherent global signa-ture in tropopause height, with out-of-phase variationsbetween the equator and midlatitudes of both hemispheres,a pattern first documented by Angell and Korshover [1964].
Figure 11. Scatterplot showing the relationships between tropopause height trends and temperaturetrends in the troposphere (850–300 hPa, open symbols) and stratosphere (100–50 hPa, solid symbols).Each point represents a different station and observing time, with triangles for tropical (30�S to 30�N)stations and circles for extratropical stations. The sloped line shows the regression relation for thestratospheric temperature trends.
D21101 SEIDEL AND RANDEL: GLOBAL TROPOPAUSE VARIABILITY AND TRENDS
13 of 17
D21101
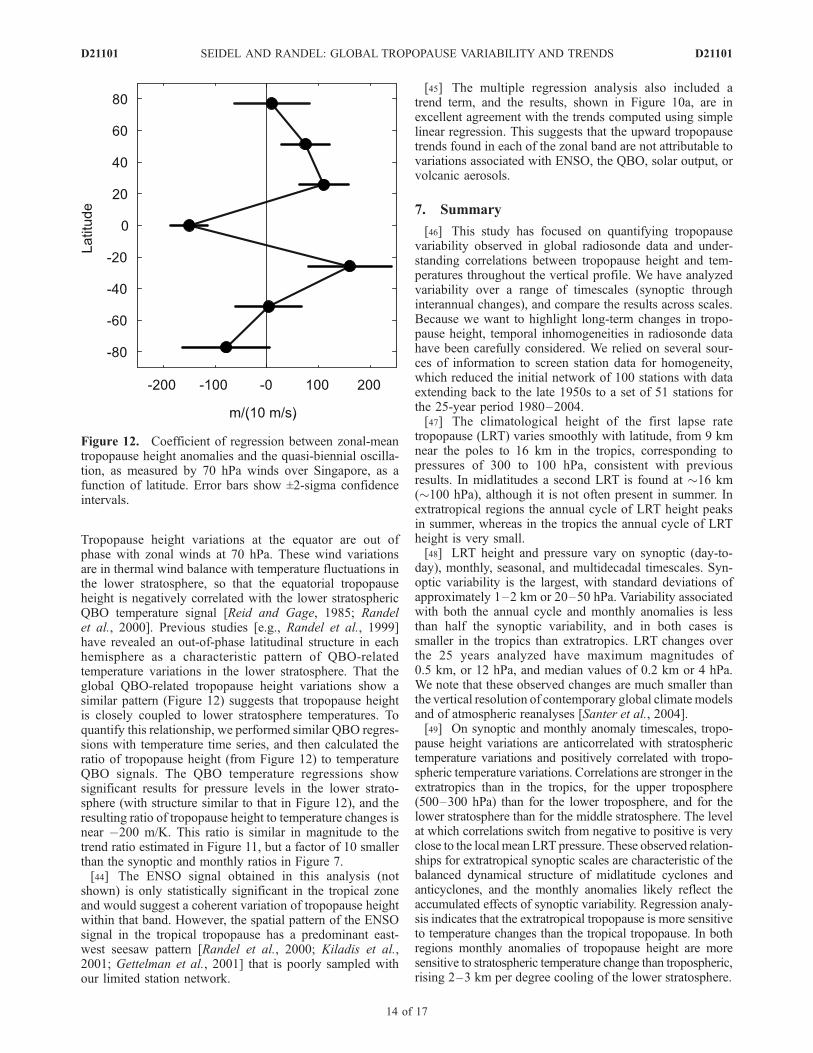
Tropopause height variations at the equator are out ofphase with zonal winds at 70 hPa. These wind variationsare in thermal wind balance with temperature fluctuations inthe lower stratosphere, so that the equatorial tropopauseheight is negatively correlated with the lower stratosphericQBO temperature signal [Reid and Gage, 1985; Randelet al., 2000]. Previous studies [e.g., Randel et al., 1999]have revealed an out-of-phase latitudinal structure in eachhemisphere as a characteristic pattern of QBO-relatedtemperature variations in the lower stratosphere. That theglobal QBO-related tropopause height variations show asimilar pattern (Figure 12) suggests that tropopause heightis closely coupled to lower stratosphere temperatures. Toquantify this relationship, we performed similar QBO regres-sions with temperature time series, and then calculated theratio of tropopause height (from Figure 12) to temperatureQBO signals. The QBO temperature regressions showsignificant results for pressure levels in the lower strato-sphere (with structure similar to that in Figure 12), and theresulting ratio of tropopause height to temperature changes isnear �200 m/K. This ratio is similar in magnitude to thetrend ratio estimated in Figure 11, but a factor of 10 smallerthan the synoptic and monthly ratios in Figure 7.[44] The ENSO signal obtained in this analysis (not
shown) is only statistically significant in the tropical zoneand would suggest a coherent variation of tropopause heightwithin that band. However, the spatial pattern of the ENSOsignal in the tropical tropopause has a predominant east-west seesaw pattern [Randel et al., 2000; Kiladis et al.,2001; Gettelman et al., 2001] that is poorly sampled withour limited station network.
[45] The multiple regression analysis also included atrend term, and the results, shown in Figure 10a, are inexcellent agreement with the trends computed using simplelinear regression. This suggests that the upward tropopausetrends found in each of the zonal band are not attributable tovariations associated with ENSO, the QBO, solar output, orvolcanic aerosols.
7. Summary
[46] This study has focused on quantifying tropopausevariability observed in global radiosonde data and under-standing correlations between tropopause height and tem-peratures throughout the vertical profile. We have analyzedvariability over a range of timescales (synoptic throughinterannual changes), and compare the results across scales.Because we want to highlight long-term changes in tropo-pause height, temporal inhomogeneities in radiosonde datahave been carefully considered. We relied on several sour-ces of information to screen station data for homogeneity,which reduced the initial network of 100 stations with dataextending back to the late 1950s to a set of 51 stations forthe 25-year period 1980–2004.[47] The climatological height of the first lapse rate
tropopause (LRT) varies smoothly with latitude, from 9 kmnear the poles to 16 km in the tropics, corresponding topressures of 300 to 100 hPa, consistent with previousresults. In midlatitudes a second LRT is found at �16 km(�100 hPa), although it is not often present in summer. Inextratropical regions the annual cycle of LRT height peaksin summer, whereas in the tropics the annual cycle of LRTheight is very small.[48] LRT height and pressure vary on synoptic (day-to-
day), monthly, seasonal, and multidecadal timescales. Syn-optic variability is the largest, with standard deviations ofapproximately 1–2 km or 20–50 hPa. Variability associatedwith both the annual cycle and monthly anomalies is lessthan half the synoptic variability, and in both cases issmaller in the tropics than extratropics. LRT changes overthe 25 years analyzed have maximum magnitudes of0.5 km, or 12 hPa, and median values of 0.2 km or 4 hPa.We note that these observed changes are much smaller thanthe vertical resolution of contemporary global climatemodelsand of atmospheric reanalyses [Santer et al., 2004].[49] On synoptic and monthly anomaly timescales, tropo-
pause height variations are anticorrelated with stratospherictemperature variations and positively correlated with tropo-spheric temperature variations. Correlations are stronger in theextratropics than in the tropics, for the upper troposphere(500–300 hPa) than for the lower troposphere, and for thelower stratosphere than for the middle stratosphere. The levelat which correlations switch from negative to positive is veryclose to the local mean LRT pressure. These observed relation-ships for extratropical synoptic scales are characteristic of thebalanced dynamical structure of midlatitude cyclones andanticyclones, and the monthly anomalies likely reflect theaccumulated effects of synoptic variability. Regression analy-sis indicates that the extratropical tropopause is more sensitiveto temperature changes than the tropical tropopause. In bothregions monthly anomalies of tropopause height are moresensitive to stratospheric temperature change than tropospheric,rising 2–3 km per degree cooling of the lower stratosphere.
Figure 12. Coefficient of regression between zonal-meantropopause height anomalies and the quasi-biennial oscilla-tion, as measured by 70 hPa winds over Singapore, as afunction of latitude. Error bars show ±2-sigma confidenceintervals.
D21101 SEIDEL AND RANDEL: GLOBAL TROPOPAUSE VARIABILITY AND TRENDS
14 of 17
D21101
[50] Tropopause height trends over 1980–2004 areupward at almost all of the stations analyzed, yielding aglobal trend of 64 ± 21 m/decade, a corresponding globalLRT pressure trend of �1.7 ± 0.6 hPa/decade, and associ-ated LRT temperature decrease of 0.41 ± 0.09 K/decade (ornet changes of 160 m, �4.2 hPa and �1.0 K). These LRTtrends are accompanied by significant stratospheric coolingand smaller tropospheric warming. However, the strength ofthe LRT trends is spatially correlated with that of thestratospheric temperature trend but there is no significantcorrelation between LRT trends and tropospheric tempera-ture trends. Whether this result is physically meaningful oris a statistical artifact of the larger stratospheric thantropospheric trend signal is unclear.[51] The sensitivity of tropopause height trends to strato-
spheric temperature trends is about 100 m/K, which is20–30 times weaker than the corresponding sensitivity forsynoptic or monthly timescales. A similar small value of200 m/K is found for relating QBO variations in tropopauseheight and lower stratospheric temperature. This suggeststhat the coupling of tropopause height and stratospherictemperatures on interannual timescales involves different oradditional mechanisms than for synoptic/monthly scales.Radiative effects are a likely contributor to this balance; the
relatively long radiative timescale in the lower stratosphere(�30 days) suggests that radiation is relatively unimportantfor synoptic scales, but probably a large influence for inter-annual changes. We note that the radiosonde data analyzedhere do not allow separation of this sensitivity between thetropics and extratropics (because there are few tropical sta-tions and our results are based primarily on extratropics).Such a difference in sensitivity might be expected becausethe equilibrium structure and dynamical balance of thetropopause is fundamentally different between the tropics(radiative-convective balance [e.g., Thuburn and Craig,2002]) versus extratropics (baroclinic wave dynamics [e.g.,Haynes et al., 2001; Schneider, 2004]).[52] The observed correlation of tropopause height trends
with stratospheric temperature trends, plus observation of asignificant QBO signal in tropopause height time series,suggest that at these lowest frequencies the tropopause isprimarily coupled with stratospheric temperatures. Con-versely, tropopause height trends and tropospheric temper-ature trends are uncorrelated (although the smallness anduncertainties in the latter may influence this result). There-fore, as an indicator of climate change, long-term changes inthe tropopause may carry less information about changesthroughout the vertical temperature profile than has been
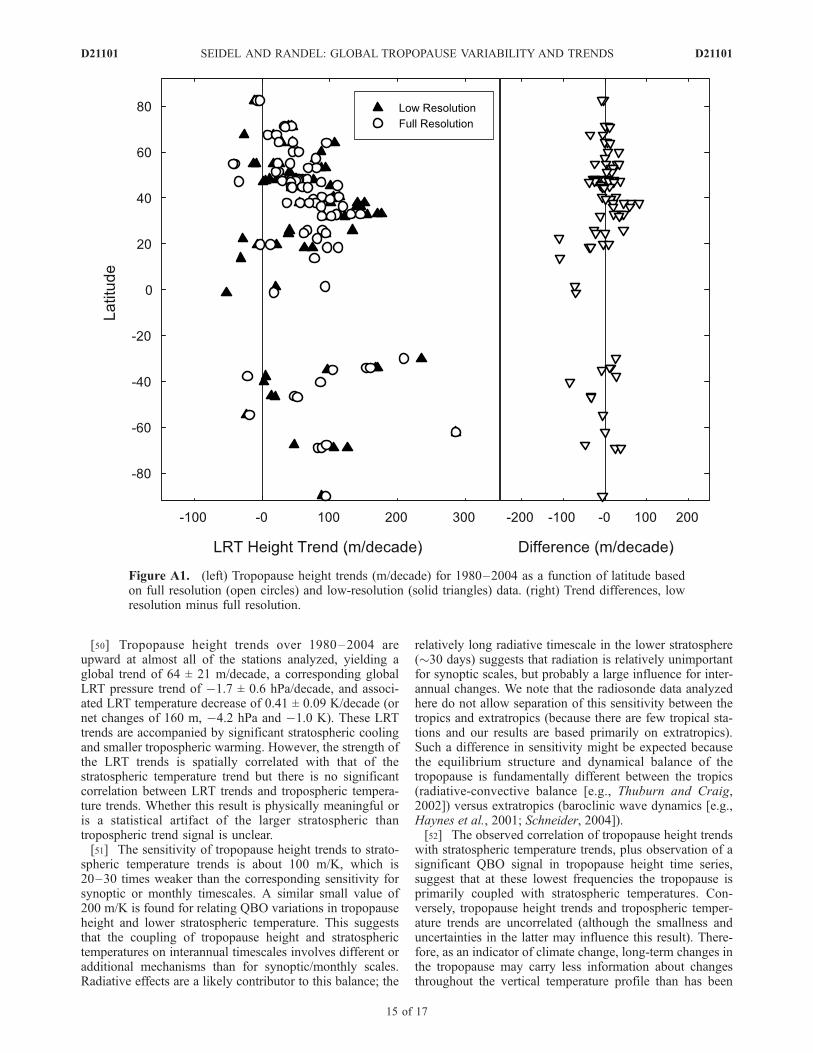
Figure A1. (left) Tropopause height trends (m/decade) for 1980–2004 as a function of latitude basedon full resolution (open circles) and low-resolution (solid triangles) data. (right) Trend differences, lowresolution minus full resolution.
D21101 SEIDEL AND RANDEL: GLOBAL TROPOPAUSE VARIABILITY AND TRENDS
15 of 17
D21101
suggested by previous studies using reanalyses and globalclimate models.
Appendix A: Effect of Vertical Resolution ofSounding Data on Lapse Rate TropopauseStatistics
[53] Reanalysis data and climate model simulations havelower vertical resolution than radiosonde data, which couldinfluence both the precision and accuracy of derived lapserate tropopause heights. To investigate the effect of verticalresolution of temperature sounding data on LRTstatistics, werepeated our analyses using radiosonde profiles degradedby elimination of all of the ‘‘significant’’ data levels. Foreach sounding, temperature and height data at the ‘‘manda-tory’’ levels (1000, 850, 700, 500, 400, 300, 200, 150, 100,50, 30, 20, 10, 7, 5, 3, 2, and 1 hPa) were used to evaluatelapse rates at intermediate levels (between pairs of adjacentmandatory levels), and the LRT was identified by interpo-lation (in height coordinates) of the lapse rate data to a levelat which the LRT definition was satisfied. Using these LRTdata, we computed all of the same climatological statisticsas was done with the full resolution data.[54] Climatological annual-average LRT height and pres-
sure based on the low-resolution data (not shown) show thesame overall patterns as obtained using the full resolutionsoundings (Figure 3). However, small biases were found,with LRT pressure and height differences ranging from �6to 9 hPa and �164 to 364 m, respectively, with meanabsolute differences of 2.7 hPa and 96 m.[55] Trends in LRT height for the period 1980–2004
evaluated from the low- and full resolution data are shownin Figure A1 (left). At some stations the values are verysimilar, but at many the differences (Figure A1, right) aresimilar in magnitude to the trends themselves. The range oftrend differences (low minus full resolution) is �110 to82 m/decade, the mean absolute difference is 24 m/decade,and typical differences are 10–50% of the trend based onthe full resolution data. There is better agreement for large-scale average trends. Zonal trends from the full resolutiondata (Figure 10a) are not statistically significantly differentfrom those based on the low-resolution data (not shown).The global LRT height trend from low-resolution data is51 ± 26 m/decade, compared with 64 ± 21 m/decade for fullresolution, and comparable values for LRT pressure trendsare �2.1 ± 0.7 and �1.7 ± 0.6 hPa/decade.[56] On the basis of this analysis, we conclude that
climatological statistics based on lower-resolution datacontain biases that vary from location to location and thatlocal trend estimate from lower-resolution data can bebiased with respect to those based on full resolution data,but the biases in global-average trends are less severe.
[57] Acknowledgments. We thank Fei Wu (NCAR) for data pro-cessing assistance and Melissa Free and Val Garcia (NOAA), Ben Santer(LLNL), and two anonymous reviewers for helpful suggestions. Thiswork is partially supported by the NASA ACMAP program. TheNational Center for Atmospheric Research is sponsored by the NationalScience Foundation.
ReferencesAngell, J. K., and J. Korshover (1964), Quasi-biennial variations in tem-perature, total ozone and tropopause height, J. Atmos. Sci., 21, 479–492.
Anel, J. A., L. Gimeno, L. de la Torre, and R. Nieto (2006), Changes intropopause height for the Eurasian region determined from CARDSradiosonde data, Naturwissenchaften, doi:10.1007/S00114-006-0147-5.
Chakrabarty, D. K., N. C. Shah, K. V. Pandya, and S. K. Peshin (2000),Long-term trend of tropopause over New Delhi and Thiruvananthapuram,Geophys. Res. Lett., 27(15), 2181–2184.
Durre, I., R. S. Vose, and D. B. Wuertz (2006), Overview of the IntegratedGlobal Radiosonde Archive, J. Clim., 19, 53 – 68, doi:10.1175/JCLI3594.1.
Elliott, W. P., R. J. Ross, and W. H. Blackmore (2002), Recent changes inNWS upper-air observations with emphasis on changes from VIZ toVaisala radiosondes, Bull. Am. Meteorol. Soc., 83, 1003–1017.
Forster, P. M. de F., and K. Tourpali (2001), Effect of tropopause heightchanges on the calculation of ozone trends and their radiative forcing,J. Geophys. Res., 106, 12,241–12,252.
Free, M., D. J. Seidel, J. K. Angell, J. Lanzante, I. Durre, and T. C. Peterson(2005), Radiosonde Atmospheric Temperature Products for AssessingClimate (RATPAC): A new data set of large-area anomaly time series,J. Geophys. Res., 110, D22101, doi:10.1029/2005JD006169.
Gaffen, D. J. (1993), Historical changes in radiosonde instruments andpractices, WMO/TD 541, Instrum. Obs. Methods Rep. 50, 123 pp., WorldMeteorol. Organ., Geneva.
Gaffen, D. J. (1994), Temporal inhomogeneities in radiosonde temperaturerecords, J. Geophys. Res., 99, 3667–3676.
Gettelman, A., W. J. Randel, S. Massie, F. Wu, W. G. Read, and J. M.Russell (2001), El Nino as a natural experiment for studying the tropicaltropopause region, J. Clim., 14, 3375–3392.
Haynes, P., J. Scinocca, and M. Greenslade (2001), Formation and main-tenance of the extratropical tropopause by baroclinic eddies, Geophys.Res. Lett., 28(22), 4179–4182.
Highwood, E. J., B. J. Hoskins, and P. Berrisford (2000), Properties of theArctic tropopause, Q. J. R. Meteorol. Soc., 126, 1515–1532.
Hoinka, K. P. (1998), Statistics of the global tropopause pressure, Mon.Weather Rev., 126, 3303–3325.
Hoinka, K. P. (1999), Temperature, humidity, and wind at the global tro-popause, Mon. Weather Rev., 127, 2248–2265.
Hoskins, B. J., M. E. McIntyre, and A. W. Robertson (1985), On the useand significance of isentropic potential vorticity maps, Q. J. R. Meteorol.Soc., 111, 877–946.
Kiladis, G. N., K. H. Straub, G. C. Reid, and K. S. Gage (2001), Aspects ofinterannual and intraseasonal variability of the tropopause and lowerstratosphere, Q. J. R. Meteorol. Soc., 127, 1961–1984.
Lanzante, J. R., S. A. Klein, and D. J. Seidel (2003), Temporal homogeni-zation of monthly radiosonde temperature data. Part I: Methodology,J. Clim., 16, 224–240.
Makhover, Z. M. (1979), Features of the tropopause distribution over theglobe (in Russian), Meteorol. Geophys., 12, 33–39.
Nagurny, A. P. (1998), Climatic characteristics of the tropopause over theArctic Basin, Ann. Geophys., 16, 110–115.
Naujokat, B. (1986), An update of the observed quasi-biennial oscillationof stratospheric winds over the tropics, J. Atmos. Sci., 43, 1873–1877.
Parker, D. E., and D. I. Cox (1995), Towards a consistent global climato-logical rawinsonde data-base, Int. J. Climatol., 15, 473–496.
Randel, W. J., and F. Wu (2006), Biases in stratospheric and tropospherictemperature trends derived from historical radiosonde data, J. Clim., 19,2094–2104.
Randel, W. J., F. Wu, R. Swinbank, J. Nash, and A. O’Neill (1999), GlobalQBO circulation derived from UKMO stratospheric analyses, J. Atmos.Sci., 56, 457–474.
Randel, W. J., F. Wu, and D. J. Gaffen (2000), Interannual variability of thetropical tropopause derived from radiosonde data and NCEP reanalyses,J. Geophys. Res., 105, 15,509–15,524.
Redder, C. R., J. K. Luers, and R. E. Eskridge (2004), Unexplained dis-continuity in the U.S. radiosonde temperature data. Part II: Stratosphere,J. Atmos. Oceanic Technol., 21, 1133–1144.
Reid, G. C., and K. S. Gage (1985), Interannual variations in the height ofthe tropical tropopause, J. Geophys. Res., 90, 5629–5635.
Santer, B. D., T. M. L. Wigley, J. S. Boyle, D. J. Gaffen, J. J. Hnilo,D. Nychka, D. E. Parker, and K. E. Taylor (2000), Statistical significanceof trend differences in layer-average temperature time series, J. Geophys.Res, 105, 7337–7356.
Santer, B. D., et al. (2003a), Behavior of tropopause height and atmospherictemperature in models, reanalyses, and observations: Decadal changes,J. Geophys. Res., 108(D1), 4002, doi:10.1029/2002JD002258.
Santer, B. D., et al. (2003b), Contributions of anthropogenic andnatural forcing to recent tropopause height changes, Science, 301,479–483.
Santer, B. D., et al. (2004), Identification of anthropogenic climate changeusing a second-generation reanalysis, J. Geophys. Res., 109, D21104,doi:10.1029/2004JD005075.
D21101 SEIDEL AND RANDEL: GLOBAL TROPOPAUSE VARIABILITY AND TRENDS
16 of 17
D21101
Sausen, R., and B. D. Santer (2003), Use of changes in tropopause height todetect human influences on climate, Meteorol. Z., 12, 131–136.
Schneider, T. (2004), The tropopause and the thermal stratification in theextratropics of a dry atmosphere, J. Atmos. Sci., 61, 1317–1340.
Seidel, D. J., R. J. Ross, J. K. Angell, and G. C. Reid (2001), Climatolo-gical characteristics of the tropical tropopause as revealed by radiosondes,J. Geophys. Res., 106, 7857–7878.
Shepherd, T. G. (2002), Issues in stratosphere-troposphere coupling,J. Meteorol. Soc. Jpn., 80, 769–792.
Sherwood, S. C., J. R. Lanzante, and C. L. Meyer (2005), Radiosondedaytime biases and late 20th century warming, Science, 309, 1556–1559.
Steinbrecht, W., H. Claude, U. Kohler, and K. P. Hoinka (1998), Correla-tions between tropopause height and total ozone: Implications for long-term changes, J. Geophys. Res., 103, 19,183–19,192.
Thompson, D. W. J., J. M. Wallace, and G. C. Hegerl (2000), Annularmodes in the extratropical circulation. Part II: Trends, J. Clim., 13,1018–1036.
Thorne, P. W., D. E. Parker, S. F. B. Tett, P. D. Jones, M. McCarthy,H. Coleman, and P. Brohan (2005), Revisiting radiosonde upper-airtemperatures from 1958 to 2002, J. Geophys. Res., 110, D18105,doi:10.1029/2004JD005753.
Thuburn, J., and G. C. Craig (2002), On the temperature structure of thetropical substratosphere, J. Geophys. Res., 107(D2), 4017, doi:10.1029/2001JD000448.
Varotsos, C., C. Cartalis, A. Vlamakis, C. Tzanis, and I. Keramitsoglou(2004), The long-term coupling between column ozone and tropopauseproperties, J. Clim., 17, 3843–3854.
Wolter, K., and M. S. Timlin (1998), Measuring the strength of ENSO:How does 1997/98 rank?, Weather, 53, 315–324.
Wong, S., and W.-C. Wang (2000), Interhemispheric asymmetry in theseasonal variation of the zonal mean tropopause, J. Geophys. Res.,105, 26,645–26,659.
World Meteorological Organization (1957), Meteorology–A three-dimen-sional science: Second session of the Commission for Aerology, WMOBull. IV, no. 4, pp. 134–138, Geneva.
Zangl, G., and K. P. Hoinka (2001), The tropopause in the polar regions,J. Clim., 14, 3117–3139.
�����������������������W. J. Randel, National Center for Atmospheric Research, P. O. Box 3000,
Boulder, CO 80307-3000, USA.D. J. Seidel, NOAA Air Resources Laboratory (R/ARL), 1315 East West
Highway, Silver Spring, MD 20910, USA. ([email protected])
D21101 SEIDEL AND RANDEL: GLOBAL TROPOPAUSE VARIABILITY AND TRENDS
17 of 17
D21101


![Home - ClinicalTrials.gov · (coefficient of variation [CV%]) was estimated to be 25.5% by assuming m trasubject variability half of the total variability of 51% (CDER 2003); Martin](https://img.pdfslide.net/doc/110x75/5f14f36cb862d171bf54ba67/home-coefficient-of-variation-cv-was-estimated-to-be-255-by-assuming-m.jpg)