Embed Size (px)
Citation preview
Indian Journal of Radio & Space Physics
Vol. 36, August 2007, pp. 325-344
Variability of millimetrewave rain attenuation and rain rate prediction: A survey
R Bhattacharya, R Das, R Guha & S Deb Barman
Department of Environmental Science, University of Kalyani, Kalyani 741 235, India
and
A B Bhattacharya
Department of Physics, University of Kalyani, Kalyani 741 235, India
Received 24 May 2006; revised 31 January 2007; accepted 3 May 2007
This paper reviews the literature on attenuation of mm-wave due to rain and rain rate prediction methods to analyze the
performance of the various systems proposed by different workers at different parts of the globe under varying
meteorological and topographical conditions with an emphasis on the observational reports made in the tropics, particularly
in the Indian subcontinent. In this comprehensive review, besides considering the various features related to rain rate, the
various methods proposed for prediction of rain attenuation have been examined and thereby a comparison of those
prediction methods is made. Finally, scopes for future investigation have been critically focused.
Key words: Rain attenuation, rain rate, millimetrewave
PACS No.: 92.60. Ta
1 Introduction
Radio wave propagation is a complex
phenomenon. The international regulations for
tropospheric radio wave communication are based on
set of propagation models. Such models are
developed by making physical and statistical
analyses of collected data. The more we become
rich in the understanding of different phenomena
involved, the more we can improve our models.
Several propagation models through the troposphere
for frequencies above 1 GHz can be thought of.
Existing models may be improved for rain attenuation
and for trans-horizon tropospheric scatter
(troposcatter) propagation. Rain plays a significant
role in the undesired absorption of microwave,
millimetre and centimetre wave propagation in the
lower atmosphere. Besides rain, other major
contributors are water vapour, liquid water clouds and
fog. Such absorptions cause variations in the signal
strengths.
Attenuation value exceeded less than 2% of the
year is due to rain or cloud except at 22 GHz water
vapour absorption line and 60 GHz oxygen line. The
model cloud gives attenuation comparable to rain at
2% of the year. At smaller percentages, rain is
considered as the sole cause of attenuation to the
communication system designer.
In the past, several theoretical and experimental
studies were made in respect of rain attenuation to
obtain better service reliability in communication.
Crane1 theoretically calculated attenuation for a
known rainfall intensity along a path. During 1980
and onwards, prediction techniques for statistical
estimation of attenuation probability for a particular
path have been studied. Two approaches are made −
one based on the use of large number of attenuation
statistics at different frequencies, locations and path
geometries and the other based on the synthesis of
attenuation values from meteorological data. Latter
approach is of great interest in modelling since a large
number of data are available.
There is no established theory of statistical
variations of rainfall intensity, specific attenuation
and attenuation along a path which are linked with
each other in a complex manner. Rice and Holmberg2,
Lee3 and Dutton and Dougherty
4 carried out statistical
analysis of U.S. National Weather Service rain
accumulation data and provided an estimate of year-
to-year variations of rain rate distribution.
Rain shows prominent spatial and temporal
variation along a horizontal path, which prompts
statistical estimation of instantaneous rain rate profile
along the path. Several workers have proposed
different models for calculation of attenuation along a
INDIAN J RADIO & SPACE PHYS, AUGUST 2007
326
path. Most of the models were developed using point
rain rate and path attenuation measurements. Model
rainstorms have also been developed from weather
radar data analysis to convert point rainfall statistics
to path attenuation estimates5.
A very useful new technique, viz., ‘observation of
phase delay from GPS satellites’ has emerged; it
allows continuous monitoring of atmospheric water
vapour content along a slant path using
millimetrewave radio propagation6-11
. Water vapour,
rain, cloud and oxygen attenuate radiowaves very
significantly. Attenuation due to water vapour along
earth-space radio links increase prominently above 50
GHz and becomes higher than the peak absorption
found at 22.235 GHz water vapour resonance line12
.
Moreover, oxygen, cloud and rain (especially, light
rain) play a very important role on propagation above
50 GHz. Water vapour contributes to both attenuation
and tropospheric scintillation on earth-space paths13
;
also a relation has been established between the
occurrence of water vapour and cloud attenuation14
.
Due to continuous presence of water vapour in the
atmosphere and a greater occurrence rate of cloud
than rain, these two factors need to be properly
assessed. Using GPS technique, a comparison of
attenuation has been made between the radiosonde
and radiometer data15
to support millimetrewave
propagation in the study of attenuation.
Lastly, a suitable model is needed for predicting
the attenuation on a slant path with the variation of
rain intensity. Below 60 GHz, the attenuation due to
snow or ice is very small and hence neglected16
.
Liquid rain drop is the only cause of attenuation.
Studies on the variation of attenuation with height
show that major attenuation occurs below the height
of the bright band17
(0C isotherm); this fact is also
supported from comparisons between radar based
attenuation prediction and simultaneous path
attenuation measurements18,19
. The rain intensity, on
the average, does not vary with height between the
surface and the base of the bright band as evident
from weather radar data20,21
. This leads one to model
the specific attenuation as constant from the surface
up to a height near 0C isotherm level which also
needs to be estimated statistically.
An attenuation prediction model should contain
estimates of expected year-to-year and station-to-
station variation and also expected attenuation at the
same exceedence probability. A model on such
estimates has been developed by Crane16
. The
attenuation was compared between predictions from
model and available attenuation observations made on
a number of propagation paths and obtained
agreement within expected uncertainty.
The growing demand of communication services
has congested the currently available radio spectrum
to such an extent that a need has been felt for larger
bandwidth and new frequency band above 20 GHz is
being explored. However, the rain attenuates the
upper spectrum and frequencies suffer strong
impairment as the rain drop diameter approaches the
size of operating wavelength. In tropical countries
like India, a great diversity of climatic conditions has
been witnessed in the recent past and a search is on to
find out a prediction model, useful for all ranges of
rain fall rate.
2 Troposcatter propagation
Rain scatter is considered to be partly due to
interference. However, it is unlikely that there would
be interference due to rain. At frequencies slightly
below 10 GHz, rain scatter prediction technique gives
an excellent estimate of the strength of scattered
signal. Rain scatter model suffers a problem above 10
GHz when rain attenuation along signal path and from
scattering volume reduces signal level, whereas
simultaneous scattering within the volume boosts up
the signal level. Attenuation and scattering need not
be modelled together, since the former is much more
important, and troposcatter link systems should be
designed at lower frequencies. In fact, modelling of
transhorizon scatter propagation is undergoing a rapid
change due to lot of research work and in the coming
days revised models are likely to revolutionize our
knowledge of troposcatter processes.
2.1 Rain attenuation
Another part of rain scatter process is the
attenuation of signal by rain along the scatter path.
Way back in 1947 Ryde22
presented a rain attenuation
model. After two decades Medhurst23
published a
revised model of Ryde & Ryde and he concluded that
“… (the) agreement is not entirely satisfactory; there
is a tendency for the measured attenuations to exceed
the maximum possible levels predicted by the
theory”. A decade later, Crane24
looked afresh at the
model predictions and compared them with the
measured values taking the data available to Medhurst
and new data published after that. He found an
average matching between model predictions and
measurements.
BHATTACHARYA et al.: MILLIMETREWAVE RAIN ATTENUATION & RAIN RATE PREDICTION
327
A rain attenuation model should predict both the
median distribution for a number of yearly attenuation
distributions as well as the amount of expected
deviations of distribution of attenuation for any single
year of observation from the long term median
distribution. Old and early models considered
raindrop sizes, shapes, uniform rain rates along a path,
etc. For uniformity in rain rate, the time average of
rain rate at a point was considered by Bussey25
to
approximate the path average rain rate along a link.
Considering the specific attenuation to be propor-
tional to rain rate, such a model works well, but the
physics involved in the process was very much
complicated. Earlier models give estimation of point
rain rate statistics and the statistics of variation of rain
along a path. Statistics of path length through rain has
also been modelled with the advent of satellite
communication.
Initially, the models were physical observation
based, but with the availability of attenuation statistics
such models were adjusted. Today, enough data are
available for a standard model. However, the practical
methods, which are adopted to measure the
attenuation statistics do not give a reliable model and
compels one to turn back to the models that are
physical in nature. Development and evaluation of
models require a method to control the quality of data
observation in the model26-28
. The ITUR (formerly
known as CCIR) gathers round the clock global data,
which measures attenuation. Crane29
used such data
and noticed that the statistical deviations of
attenuation from model predictions were log-normal
and the parameters used in log-normal process
practically did not change significantly for different
models. The ITUR (CCIR) recommended models did
show the smallest deviations.
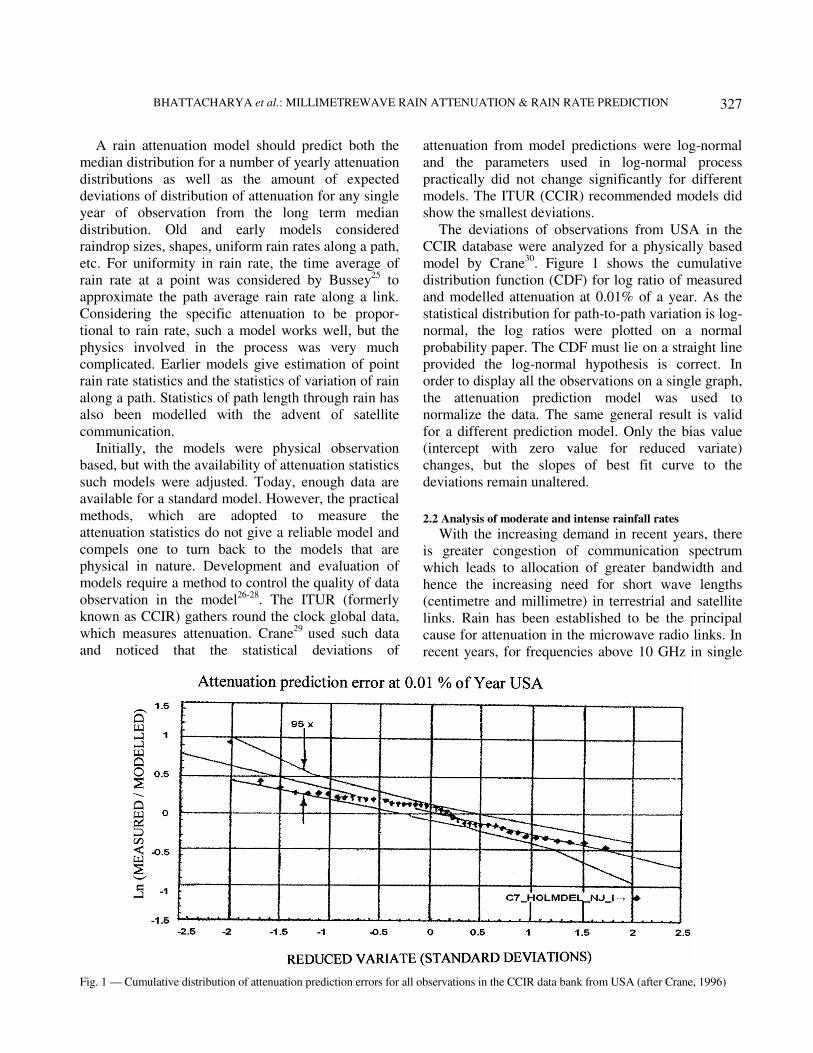
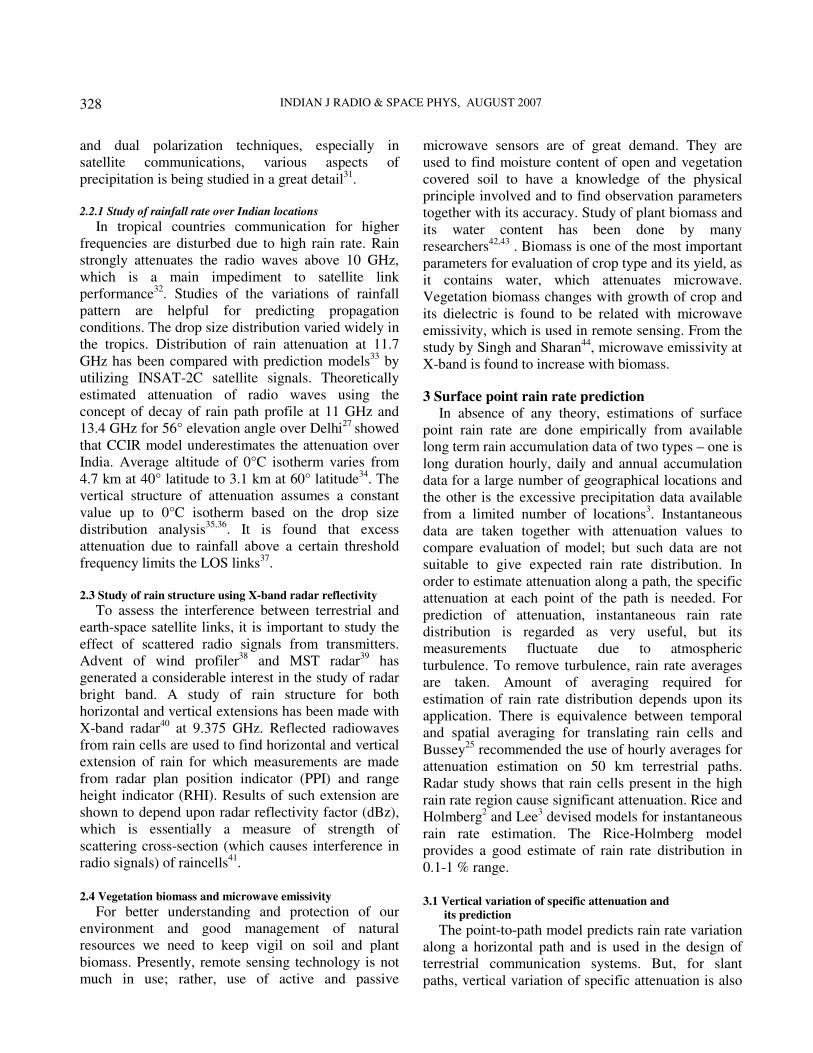
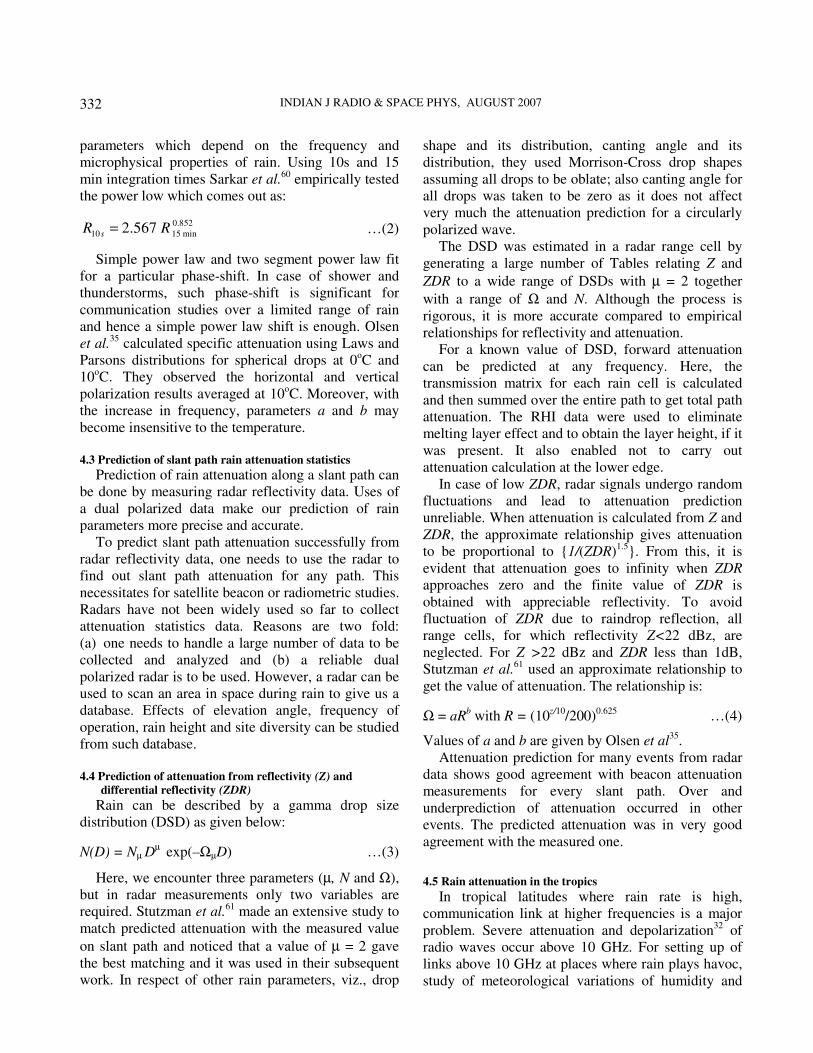
The deviations of observations from USA in the
CCIR database were analyzed for a physically based
model by Crane30
. Figure 1 shows the cumulative
distribution function (CDF) for log ratio of measured
and modelled attenuation at 0.01% of a year. As the
statistical distribution for path-to-path variation is log-
normal, the log ratios were plotted on a normal
probability paper. The CDF must lie on a straight line
provided the log-normal hypothesis is correct. In
order to display all the observations on a single graph,
the attenuation prediction model was used to
normalize the data. The same general result is valid
for a different prediction model. Only the bias value
(intercept with zero value for reduced variate)
changes, but the slopes of best fit curve to the
deviations remain unaltered.
2.2 Analysis of moderate and intense rainfall rates
With the increasing demand in recent years, there
is greater congestion of communication spectrum
which leads to allocation of greater bandwidth and
hence the increasing need for short wave lengths
(centimetre and millimetre) in terrestrial and satellite
links. Rain has been established to be the principal
cause for attenuation in the microwave radio links. In
recent years, for frequencies above 10 GHz in single
Fig. 1 — Cumulative distribution of attenuation prediction errors for all observations in the CCIR data bank from USA (after Crane, 1996)
INDIAN J RADIO & SPACE PHYS, AUGUST 2007
328
and dual polarization techniques, especially in
satellite communications, various aspects of
precipitation is being studied in a great detail31
.
2.2.1 Study of rainfall rate over Indian locations
In tropical countries communication for higher
frequencies are disturbed due to high rain rate. Rain
strongly attenuates the radio waves above 10 GHz,
which is a main impediment to satellite link
performance32
. Studies of the variations of rainfall
pattern are helpful for predicting propagation
conditions. The drop size distribution varied widely in
the tropics. Distribution of rain attenuation at 11.7
GHz has been compared with prediction models33
by
utilizing INSAT-2C satellite signals. Theoretically
estimated attenuation of radio waves using the
concept of decay of rain path profile at 11 GHz and
13.4 GHz for 56° elevation angle over Delhi27
showed
that CCIR model underestimates the attenuation over
India. Average altitude of 0°C isotherm varies from
4.7 km at 40° latitude to 3.1 km at 60° latitude34
. The
vertical structure of attenuation assumes a constant
value up to 0°C isotherm based on the drop size
distribution analysis35,36
. It is found that excess
attenuation due to rainfall above a certain threshold
frequency limits the LOS links37
.
2.3 Study of rain structure using X-band radar reflectivity
To assess the interference between terrestrial and
earth-space satellite links, it is important to study the
effect of scattered radio signals from transmitters.
Advent of wind profiler38
and MST radar39
has
generated a considerable interest in the study of radar
bright band. A study of rain structure for both
horizontal and vertical extensions has been made with
X-band radar40
at 9.375 GHz. Reflected radiowaves
from rain cells are used to find horizontal and vertical
extension of rain for which measurements are made
from radar plan position indicator (PPI) and range
height indicator (RHI). Results of such extension are
shown to depend upon radar reflectivity factor (dBz),
which is essentially a measure of strength of
scattering cross-section (which causes interference in
radio signals) of raincells41
.
2.4 Vegetation biomass and microwave emissivity
For better understanding and protection of our
environment and good management of natural
resources we need to keep vigil on soil and plant
biomass. Presently, remote sensing technology is not
much in use; rather, use of active and passive
microwave sensors are of great demand. They are
used to find moisture content of open and vegetation
covered soil to have a knowledge of the physical
principle involved and to find observation parameters
together with its accuracy. Study of plant biomass and
its water content has been done by many
researchers42,43
. Biomass is one of the most important
parameters for evaluation of crop type and its yield, as
it contains water, which attenuates microwave.
Vegetation biomass changes with growth of crop and
its dielectric is found to be related with microwave
emissivity, which is used in remote sensing. From the
study by Singh and Sharan44
, microwave emissivity at
X-band is found to increase with biomass.
3 Surface point rain rate prediction In absence of any theory, estimations of surface
point rain rate are done empirically from available
long term rain accumulation data of two types – one is
long duration hourly, daily and annual accumulation
data for a large number of geographical locations and
the other is the excessive precipitation data available
from a limited number of locations3. Instantaneous
data are taken together with attenuation values to
compare evaluation of model; but such data are not
suitable to give expected rain rate distribution. In
order to estimate attenuation along a path, the specific
attenuation at each point of the path is needed. For
prediction of attenuation, instantaneous rain rate
distribution is regarded as very useful, but its
measurements fluctuate due to atmospheric
turbulence. To remove turbulence, rain rate averages
are taken. Amount of averaging required for
estimation of rain rate distribution depends upon its
application. There is equivalence between temporal
and spatial averaging for translating rain cells and
Bussey25
recommended the use of hourly averages for
attenuation estimation on 50 km terrestrial paths.
Radar study shows that rain cells present in the high
rain rate region cause significant attenuation. Rice and
Holmberg2 and Lee
3 devised models for instantaneous
rain rate estimation. The Rice-Holmberg model
provides a good estimate of rain rate distribution in
0.1-1 % range.
3.1 Vertical variation of specific attenuation and
its prediction
The point-to-path model predicts rain rate variation
along a horizontal path and is used in the design of
terrestrial communication systems. But, for slant
paths, vertical variation of specific attenuation is also
BHATTACHARYA et al.: MILLIMETREWAVE RAIN ATTENUATION & RAIN RATE PREDICTION
329
required. Although ice, snow, etc. do not produce
attenuation, but raindrops, raindrop sizes and melting
ice particles give significant attenuation.
Radar studies show that rain can be represented, on
the average, by a constant reflectivity from surface up
to the height of 0οC isotherm
21. Depending upon the
raindrop size distribution, a constant reflectivity value
means a constancy in the value of specific attenuation.
This fact leads to model a vertical profile of specific
attenuation, which gives a constant value from ground
up to the height of 0C isotherm.
To estimate the vertical attenuation the required
measurement is the rain height. Some investigations
on the variation of rain height at different locations
are reported by Mondal et al.26
taking the 0°C
isotherm as the rain height.
3.2 Variation of attenuation about its estimated value
Specific attenuation is calculated from point rain
rate value using a power law and employing Laws and
Parsons raindrop size distribution35,45,46
. Differences
in specific attenuation obtained from above
distribution as well as from a large number of
observed drop size distributions are statistically very
small for frequencies up to 50 GHz. But at higher
frequencies, errors in the measurement of drop size
distribution for small drop size range affect the
accuracy of specific attenuation and rain rate
relationship. Additional uncertainties linked with
sampling of drop size distribution are small and
ignorable16
. The physical limit of attenuating zone is
defined without any uncertainty for a terrestrial path,
but it depends upon the vertical extent of rain region
for a slant path.
Thus, the several steps of attenuation prediction
model use the median values of statistically variable
quantities. The statistical processes linked with each
step are assumed to be independent of each other and
the variances combined on that basis.
A new model for easy application for prediction of
rain attenuation in case of terrestrial or slant path
propagation has been prepared by Crane. This model
was extended globally on the basis of zonal averages.
It was successfully applied for stations in low
mountains near the coast, but not considered for
modification of vertical temperature profile due to
large regions of high terrain. Further studies on
understanding of the local variations in rain
rate climate are essential. The model can also be
extended to accommodate seasonal and monthly
predictions.
3.3 Prediction of attenuation on earth-space links
Modification of refractive condition of atmosphere
depending upon the moisture content has been
investigated in India by many workers. It is found that
LOS links are affected around the coastal regions up
to a few kilometres due to land-sea breeze. The
change of refractive profile, in turn, reduces the
microwave signal47
. Deterioration of a communication
link at 13 GHz in monsoon month revealed that the
communication link did not serve the purpose 5% of
time48
. Full communication link can be achieved
during monsoon months if an extra gain of 12-15 dB
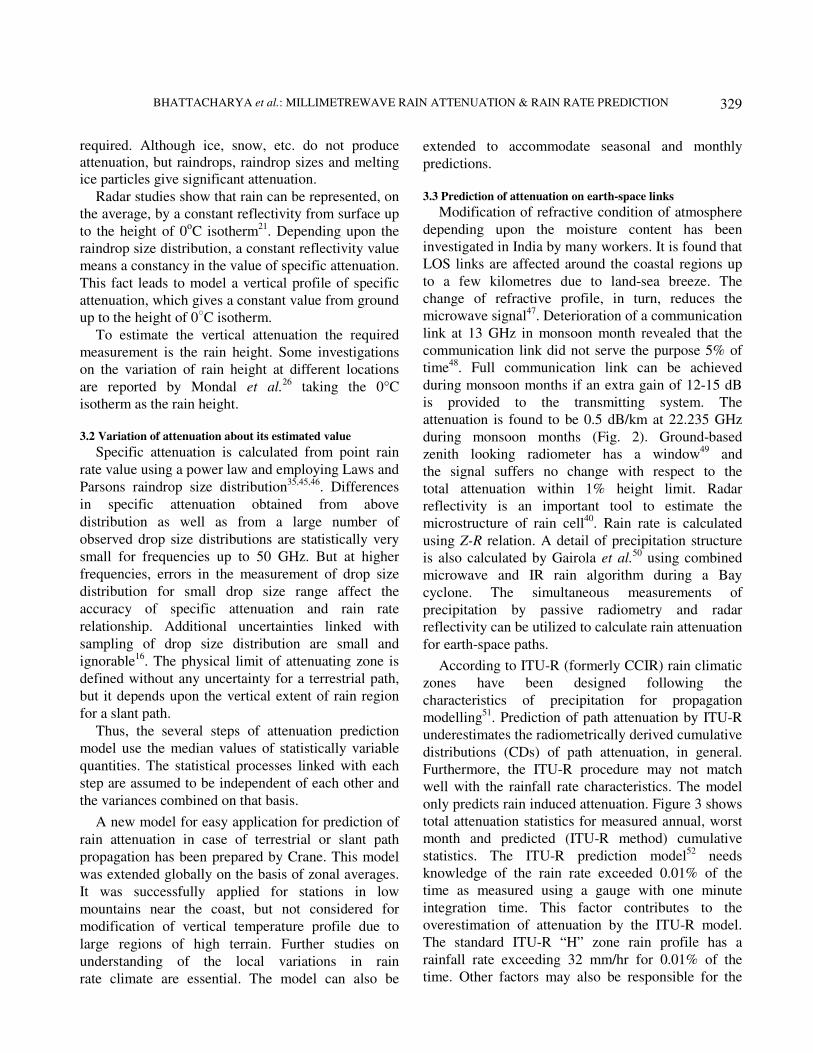
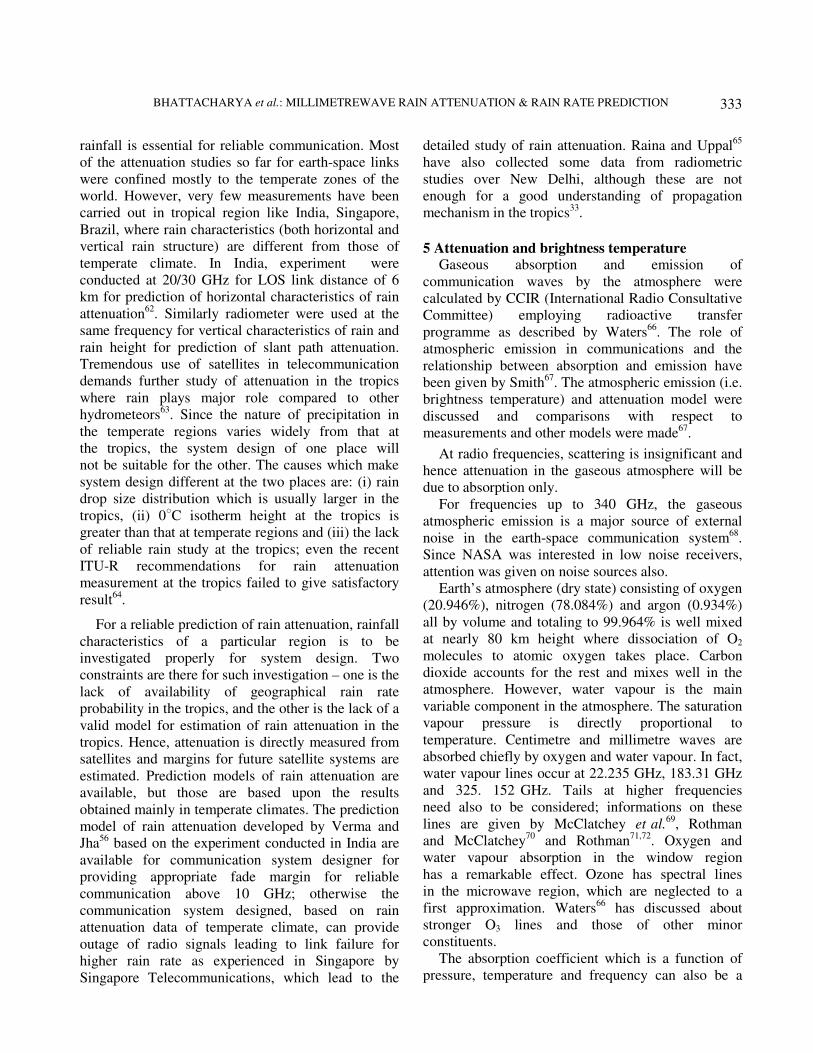
is provided to the transmitting system. The
attenuation is found to be 0.5 dB/km at 22.235 GHz
during monsoon months (Fig. 2). Ground-based
zenith looking radiometer has a window49
and
the signal suffers no change with respect to the
total attenuation within 1% height limit. Radar
reflectivity is an important tool to estimate the
microstructure of rain cell40
. Rain rate is calculated
using Z-R relation. A detail of precipitation structure
is also calculated by Gairola et al.50
using combined
microwave and IR rain algorithm during a Bay
cyclone. The simultaneous measurements of
precipitation by passive radiometry and radar
reflectivity can be utilized to calculate rain attenuation
for earth-space paths.
According to ITU-R (formerly CCIR) rain climatic
zones have been designed following the
characteristics of precipitation for propagation
modelling51
. Prediction of path attenuation by ITU-R
underestimates the radiometrically derived cumulative
distributions (CDs) of path attenuation, in general.
Furthermore, the ITU-R procedure may not match
well with the rainfall rate characteristics. The model
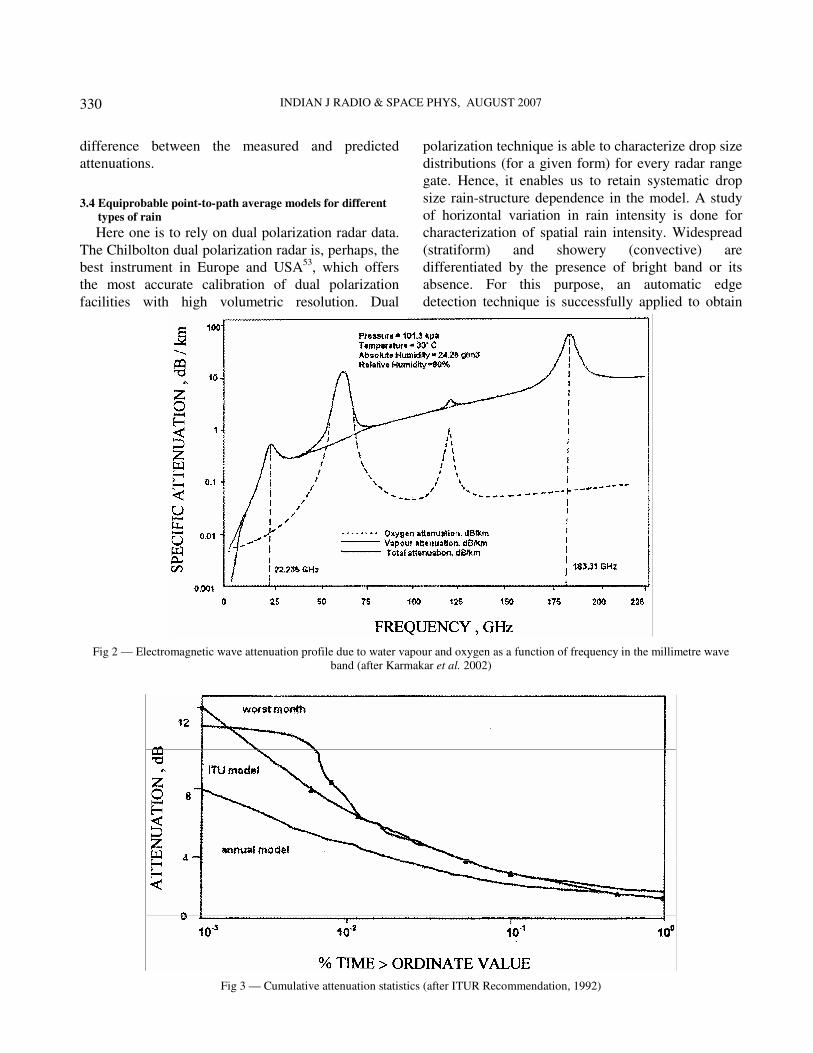
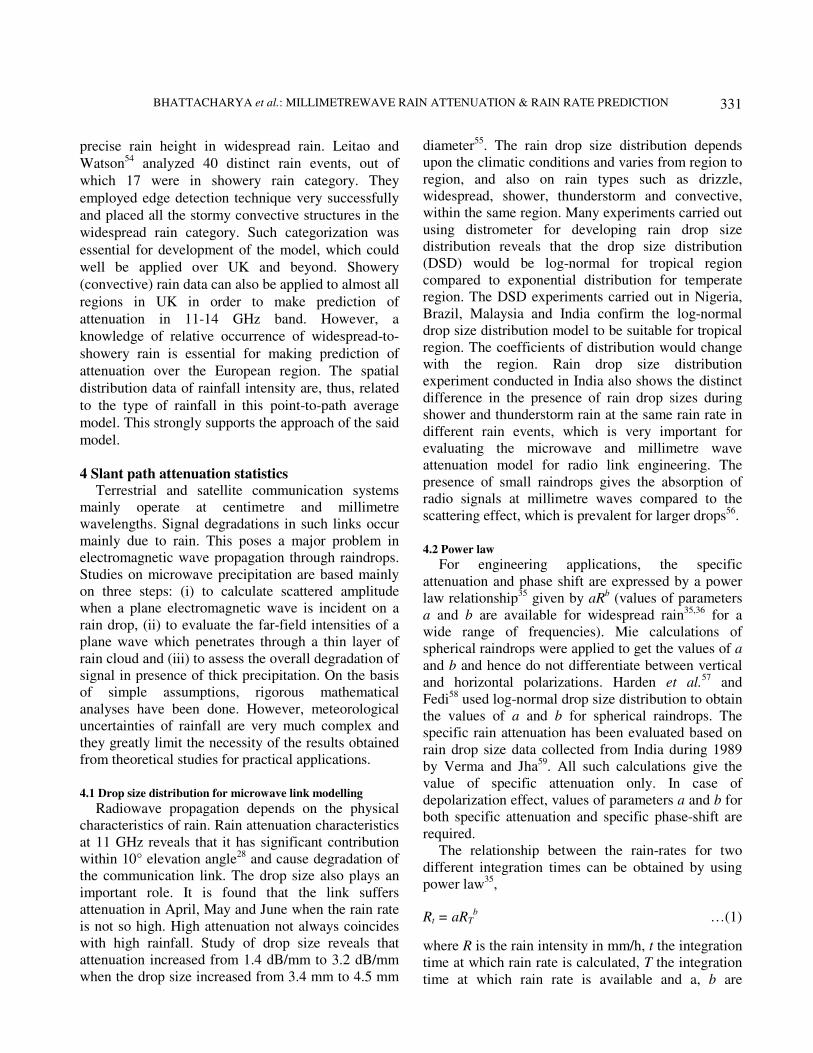
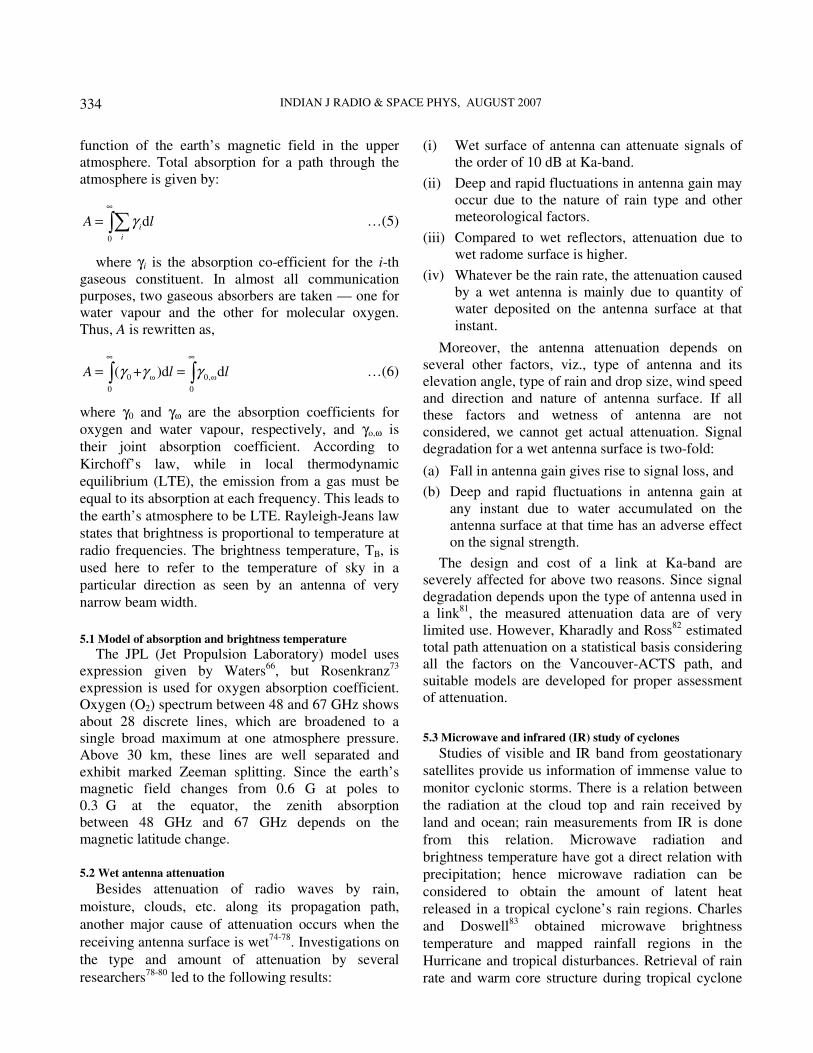
only predicts rain induced attenuation. Figure 3 shows
total attenuation statistics for measured annual, worst
month and predicted (ITU-R method) cumulative
statistics. The ITU-R prediction model52
needs
knowledge of the rain rate exceeded 0.01% of the
time as measured using a gauge with one minute
integration time. This factor contributes to the
overestimation of attenuation by the ITU-R model.
The standard ITU-R “H” zone rain profile has a
rainfall rate exceeding 32 mm/hr for 0.01% of the
time. Other factors may also be responsible for the
INDIAN J RADIO & SPACE PHYS, AUGUST 2007
330
difference between the measured and predicted
attenuations.
3.4 Equiprobable point-to-path average models for different
types of rain
Here one is to rely on dual polarization radar data.
The Chilbolton dual polarization radar is, perhaps, the
best instrument in Europe and USA53
, which offers
the most accurate calibration of dual polarization
facilities with high volumetric resolution. Dual
polarization technique is able to characterize drop size
distributions (for a given form) for every radar range
gate. Hence, it enables us to retain systematic drop
size rain-structure dependence in the model. A study
of horizontal variation in rain intensity is done for
characterization of spatial rain intensity. Widespread
(stratiform) and showery (convective) are
differentiated by the presence of bright band or its
absence. For this purpose, an automatic edge
detection technique is successfully applied to obtain
Fig 2 — Electromagnetic wave attenuation profile due to water vapour and oxygen as a function of frequency in the millimetre wave
band (after Karmakar et al. 2002)
Fig 3 — Cumulative attenuation statistics (after ITUR Recommendation, 1992)
BHATTACHARYA et al.: MILLIMETREWAVE RAIN ATTENUATION & RAIN RATE PREDICTION
331
precise rain height in widespread rain. Leitao and
Watson54
analyzed 40 distinct rain events, out of
which 17 were in showery rain category. They
employed edge detection technique very successfully
and placed all the stormy convective structures in the
widespread rain category. Such categorization was
essential for development of the model, which could
well be applied over UK and beyond. Showery
(convective) rain data can also be applied to almost all
regions in UK in order to make prediction of
attenuation in 11-14 GHz band. However, a
knowledge of relative occurrence of widespread-to-
showery rain is essential for making prediction of
attenuation over the European region. The spatial
distribution data of rainfall intensity are, thus, related
to the type of rainfall in this point-to-path average
model. This strongly supports the approach of the said
model.
4 Slant path attenuation statistics
Terrestrial and satellite communication systems
mainly operate at centimetre and millimetre
wavelengths. Signal degradations in such links occur
mainly due to rain. This poses a major problem in
electromagnetic wave propagation through raindrops.
Studies on microwave precipitation are based mainly
on three steps: (i) to calculate scattered amplitude
when a plane electromagnetic wave is incident on a
rain drop, (ii) to evaluate the far-field intensities of a
plane wave which penetrates through a thin layer of
rain cloud and (iii) to assess the overall degradation of
signal in presence of thick precipitation. On the basis
of simple assumptions, rigorous mathematical
analyses have been done. However, meteorological
uncertainties of rainfall are very much complex and
they greatly limit the necessity of the results obtained
from theoretical studies for practical applications.
4.1 Drop size distribution for microwave link modelling
Radiowave propagation depends on the physical
characteristics of rain. Rain attenuation characteristics
at 11 GHz reveals that it has significant contribution
within 10° elevation angle28
and cause degradation of
the communication link. The drop size also plays an
important role. It is found that the link suffers
attenuation in April, May and June when the rain rate
is not so high. High attenuation not always coincides
with high rainfall. Study of drop size reveals that
attenuation increased from 1.4 dB/mm to 3.2 dB/mm
when the drop size increased from 3.4 mm to 4.5 mm
diameter55
. The rain drop size distribution depends
upon the climatic conditions and varies from region to
region, and also on rain types such as drizzle,
widespread, shower, thunderstorm and convective,
within the same region. Many experiments carried out
using distrometer for developing rain drop size
distribution reveals that the drop size distribution
(DSD) would be log-normal for tropical region
compared to exponential distribution for temperate
region. The DSD experiments carried out in Nigeria,
Brazil, Malaysia and India confirm the log-normal
drop size distribution model to be suitable for tropical
region. The coefficients of distribution would change
with the region. Rain drop size distribution
experiment conducted in India also shows the distinct
difference in the presence of rain drop sizes during
shower and thunderstorm rain at the same rain rate in
different rain events, which is very important for
evaluating the microwave and millimetre wave
attenuation model for radio link engineering. The
presence of small raindrops gives the absorption of
radio signals at millimetre waves compared to the
scattering effect, which is prevalent for larger drops56
.
4.2 Power law
For engineering applications, the specific
attenuation and phase shift are expressed by a power
law relationship35
given by aRb (values of parameters
a and b are available for widespread rain35,36
for a
wide range of frequencies). Mie calculations of
spherical raindrops were applied to get the values of a
and b and hence do not differentiate between vertical
and horizontal polarizations. Harden et al.57
and
Fedi58
used log-normal drop size distribution to obtain
the values of a and b for spherical raindrops. The
specific rain attenuation has been evaluated based on
rain drop size data collected from India during 1989
by Verma and Jha59
. All such calculations give the
value of specific attenuation only. In case of
depolarization effect, values of parameters a and b for
both specific attenuation and specific phase-shift are
required.
The relationship between the rain-rates for two
different integration times can be obtained by using
power law35
,
Rt = aRTb …(1)
where R is the rain intensity in mm/h, t the integration
time at which rain rate is calculated, T the integration
time at which rain rate is available and a, b are
INDIAN J RADIO & SPACE PHYS, AUGUST 2007
332
parameters which depend on the frequency and
microphysical properties of rain. Using 10s and 15
min integration times Sarkar et al.60
empirically tested
the power low which comes out as:
0.852
10 15 min2.567sR R= …(2)
Simple power law and two segment power law fit
for a particular phase-shift. In case of shower and
thunderstorms, such phase-shift is significant for
communication studies over a limited range of rain
and hence a simple power law shift is enough. Olsen
et al.35
calculated specific attenuation using Laws and
Parsons distributions for spherical drops at 0оC and
10оC. They observed the horizontal and vertical
polarization results averaged at 10оC. Moreover, with
the increase in frequency, parameters a and b may
become insensitive to the temperature.
4.3 Prediction of slant path rain attenuation statistics
Prediction of rain attenuation along a slant path can
be done by measuring radar reflectivity data. Uses of
a dual polarized data make our prediction of rain
parameters more precise and accurate.
To predict slant path attenuation successfully from
radar reflectivity data, one needs to use the radar to
find out slant path attenuation for any path. This
necessitates for satellite beacon or radiometric studies.
Radars have not been widely used so far to collect
attenuation statistics data. Reasons are two fold:
(a) one needs to handle a large number of data to be
collected and analyzed and (b) a reliable dual
polarized radar is to be used. However, a radar can be
used to scan an area in space during rain to give us a
database. Effects of elevation angle, frequency of
operation, rain height and site diversity can be studied
from such database.
4.4 Prediction of attenuation from reflectivity (Z) and
differential reflectivity (ZDR)
Rain can be described by a gamma drop size
distribution (DSD) as given below:
N(D) = Nµ Dµ
exp(–ΩµD) …(3)
Here, we encounter three parameters (µ, N and Ω),
but in radar measurements only two variables are
required. Stutzman et al.61
made an extensive study to
match predicted attenuation with the measured value
on slant path and noticed that a value of µ = 2 gave
the best matching and it was used in their subsequent
work. In respect of other rain parameters, viz., drop
shape and its distribution, canting angle and its
distribution, they used Morrison-Cross drop shapes
assuming all drops to be oblate; also canting angle for
all drops was taken to be zero as it does not affect
very much the attenuation prediction for a circularly
polarized wave.
The DSD was estimated in a radar range cell by
generating a large number of Tables relating Z and
ZDR to a wide range of DSDs with µ = 2 together
with a range of Ω and N. Although the process is
rigorous, it is more accurate compared to empirical
relationships for reflectivity and attenuation.
For a known value of DSD, forward attenuation
can be predicted at any frequency. Here, the
transmission matrix for each rain cell is calculated
and then summed over the entire path to get total path
attenuation. The RHI data were used to eliminate
melting layer effect and to obtain the layer height, if it
was present. It also enabled not to carry out
attenuation calculation at the lower edge.
In case of low ZDR, radar signals undergo random
fluctuations and lead to attenuation prediction
unreliable. When attenuation is calculated from Z and
ZDR, the approximate relationship gives attenuation
to be proportional to 1/(ZDR)1.5
. From this, it is
evident that attenuation goes to infinity when ZDR
approaches zero and the finite value of ZDR is
obtained with appreciable reflectivity. To avoid
fluctuation of ZDR due to raindrop reflection, all
range cells, for which reflectivity Z<22 dBz, are
neglected. For Z >22 dBz and ZDR less than 1dB,
Stutzman et al.61
used an approximate relationship to
get the value of attenuation. The relationship is:
Ω = aRb with R = (10
z/10/200)
0.625 …(4)
Values of a and b are given by Olsen et al35
.
Attenuation prediction for many events from radar
data shows good agreement with beacon attenuation
measurements for every slant path. Over and
underprediction of attenuation occurred in other
events. The predicted attenuation was in very good
agreement with the measured one.
4.5 Rain attenuation in the tropics
In tropical latitudes where rain rate is high,
communication link at higher frequencies is a major
problem. Severe attenuation and depolarization32
of
radio waves occur above 10 GHz. For setting up of
links above 10 GHz at places where rain plays havoc,
study of meteorological variations of humidity and
BHATTACHARYA et al.: MILLIMETREWAVE RAIN ATTENUATION & RAIN RATE PREDICTION
333
rainfall is essential for reliable communication. Most
of the attenuation studies so far for earth-space links
were confined mostly to the temperate zones of the
world. However, very few measurements have been
carried out in tropical region like India, Singapore,
Brazil, where rain characteristics (both horizontal and
vertical rain structure) are different from those of
temperate climate. In India, experiment were
conducted at 20/30 GHz for LOS link distance of 6
km for prediction of horizontal characteristics of rain
attenuation62
. Similarly radiometer were used at the
same frequency for vertical characteristics of rain and
rain height for prediction of slant path attenuation.
Tremendous use of satellites in telecommunication
demands further study of attenuation in the tropics
where rain plays major role compared to other
hydrometeors63
. Since the nature of precipitation in
the temperate regions varies widely from that at
the tropics, the system design of one place will
not be suitable for the other. The causes which make
system design different at the two places are: (i) rain
drop size distribution which is usually larger in the
tropics, (ii) 0C isotherm height at the tropics is
greater than that at temperate regions and (iii) the lack
of reliable rain study at the tropics; even the recent
ITU-R recommendations for rain attenuation
measurement at the tropics failed to give satisfactory
result64
.
For a reliable prediction of rain attenuation, rainfall
characteristics of a particular region is to be
investigated properly for system design. Two
constraints are there for such investigation – one is the
lack of availability of geographical rain rate
probability in the tropics, and the other is the lack of a
valid model for estimation of rain attenuation in the
tropics. Hence, attenuation is directly measured from
satellites and margins for future satellite systems are
estimated. Prediction models of rain attenuation are
available, but those are based upon the results
obtained mainly in temperate climates. The prediction
model of rain attenuation developed by Verma and
Jha56
based on the experiment conducted in India are
available for communication system designer for
providing appropriate fade margin for reliable
communication above 10 GHz; otherwise the
communication system designed, based on rain
attenuation data of temperate climate, can provide
outage of radio signals leading to link failure for
higher rain rate as experienced in Singapore by
Singapore Telecommunications, which lead to the
detailed study of rain attenuation. Raina and Uppal65
have also collected some data from radiometric
studies over New Delhi, although these are not
enough for a good understanding of propagation
mechanism in the tropics33
.
5 Attenuation and brightness temperature
Gaseous absorption and emission of
communication waves by the atmosphere were
calculated by CCIR (International Radio Consultative
Committee) employing radioactive transfer
programme as described by Waters66
. The role of
atmospheric emission in communications and the
relationship between absorption and emission have
been given by Smith67
. The atmospheric emission (i.e.
brightness temperature) and attenuation model were
discussed and comparisons with respect to
measurements and other models were made67
.
At radio frequencies, scattering is insignificant and
hence attenuation in the gaseous atmosphere will be
due to absorption only.
For frequencies up to 340 GHz, the gaseous
atmospheric emission is a major source of external
noise in the earth-space communication system68
.
Since NASA was interested in low noise receivers,
attention was given on noise sources also.
Earth’s atmosphere (dry state) consisting of oxygen
(20.946%), nitrogen (78.084%) and argon (0.934%)
all by volume and totaling to 99.964% is well mixed
at nearly 80 km height where dissociation of O2
molecules to atomic oxygen takes place. Carbon
dioxide accounts for the rest and mixes well in the
atmosphere. However, water vapour is the main
variable component in the atmosphere. The saturation
vapour pressure is directly proportional to
temperature. Centimetre and millimetre waves are
absorbed chiefly by oxygen and water vapour. In fact,
water vapour lines occur at 22.235 GHz, 183.31 GHz
and 325. 152 GHz. Tails at higher frequencies
need also to be considered; informations on these
lines are given by McClatchey et al.69
, Rothman
and McClatchey70
and Rothman71,72
. Oxygen and
water vapour absorption in the window region
has a remarkable effect. Ozone has spectral lines
in the microwave region, which are neglected to a
first approximation. Waters66
has discussed about
stronger O3 lines and those of other minor
constituents.
The absorption coefficient which is a function of
pressure, temperature and frequency can also be a
INDIAN J RADIO & SPACE PHYS, AUGUST 2007
334
function of the earth’s magnetic field in the upper
atmosphere. Total absorption for a path through the
atmosphere is given by:
0
dii
A lγ∞
= ∑∫ …(5)
where γi is the absorption co-efficient for the i-th
gaseous constituent. In almost all communication
purposes, two gaseous absorbers are taken — one for
water vapour and the other for molecular oxygen.
Thus, A is rewritten as,
0 ω 0,ω
0 0
( + )d dA l lγ γ γ∞ ∞
= =∫ ∫ …(6)
where γ0 and γω are the absorption coefficients for
oxygen and water vapour, respectively, and γo,ω is
their joint absorption coefficient. According to
Kirchoff’s law, while in local thermodynamic
equilibrium (LTE), the emission from a gas must be
equal to its absorption at each frequency. This leads to
the earth’s atmosphere to be LTE. Rayleigh-Jeans law
states that brightness is proportional to temperature at
radio frequencies. The brightness temperature, TB, is
used here to refer to the temperature of sky in a
particular direction as seen by an antenna of very
narrow beam width.
5.1 Model of absorption and brightness temperature
The JPL (Jet Propulsion Laboratory) model uses
expression given by Waters66
, but Rosenkranz73
expression is used for oxygen absorption coefficient.
Oxygen (O2) spectrum between 48 and 67 GHz shows
about 28 discrete lines, which are broadened to a
single broad maximum at one atmosphere pressure.
Above 30 km, these lines are well separated and
exhibit marked Zeeman splitting. Since the earth’s
magnetic field changes from 0.6 G at poles to
0.3 G at the equator, the zenith absorption
between 48 GHz and 67 GHz depends on the
magnetic latitude change.
5.2 Wet antenna attenuation
Besides attenuation of radio waves by rain,
moisture, clouds, etc. along its propagation path,
another major cause of attenuation occurs when the
receiving antenna surface is wet74-78
. Investigations on
the type and amount of attenuation by several
researchers78-80
led to the following results:
(i) Wet surface of antenna can attenuate signals of
the order of 10 dB at Ka-band.
(ii) Deep and rapid fluctuations in antenna gain may
occur due to the nature of rain type and other
meteorological factors.
(iii) Compared to wet reflectors, attenuation due to
wet radome surface is higher.
(iv) Whatever be the rain rate, the attenuation caused
by a wet antenna is mainly due to quantity of
water deposited on the antenna surface at that
instant.
Moreover, the antenna attenuation depends on
several other factors, viz., type of antenna and its
elevation angle, type of rain and drop size, wind speed
and direction and nature of antenna surface. If all
these factors and wetness of antenna are not
considered, we cannot get actual attenuation. Signal
degradation for a wet antenna surface is two-fold:
(a) Fall in antenna gain gives rise to signal loss, and
(b) Deep and rapid fluctuations in antenna gain at
any instant due to water accumulated on the
antenna surface at that time has an adverse effect
on the signal strength.
The design and cost of a link at Ka-band are
severely affected for above two reasons. Since signal
degradation depends upon the type of antenna used in
a link81
, the measured attenuation data are of very
limited use. However, Kharadly and Ross82
estimated
total path attenuation on a statistical basis considering
all the factors on the Vancouver-ACTS path, and
suitable models are developed for proper assessment
of attenuation.
5.3 Microwave and infrared (IR) study of cyclones
Studies of visible and IR band from geostationary
satellites provide us information of immense value to
monitor cyclonic storms. There is a relation between
the radiation at the cloud top and rain received by
land and ocean; rain measurements from IR is done
from this relation. Microwave radiation and
brightness temperature have got a direct relation with
precipitation; hence microwave radiation can be
considered to obtain the amount of latent heat
released in a tropical cyclone’s rain regions. Charles
and Doswell83
obtained microwave brightness
temperature and mapped rainfall regions in the
Hurricane and tropical disturbances. Retrieval of rain
rate and warm core structure during tropical cyclone
BHATTACHARYA et al.: MILLIMETREWAVE RAIN ATTENUATION & RAIN RATE PREDICTION
335
were done by Brueske and Velden84
using Advanced
Microwave Sounding Unit (AMSU) radiometer.
Some satellite-derived parameters are: precipitable
water, liquid water, rainfall rate, sea surface
temperature and wind speed which were considered
by Elsberry and Velden85
. They developed a linear
regression relationship from the estimation of surface
intensity and cloud cover associated with the tropical
cyclones based upon hydrostatic assumptions. Gairola
and Krishnamurti86
used Special Sensor
Microwave/Imager (SSM/I), Nimbus and Sea-sat
SMMR data to locate the position of deep depression,
cyclones, etc. Microwave data were used successfully
by Rao and MacArthur87
, and Rodgers and Pierce88
to
determine the intensity of a tropical cyclone and its
change. Stress was also given on hybrid techniques by
several workers who used geostationary satellite and
polar passive microwave radiometer in order to cover
a vast area to prepare a global map of tropical rainfall.
The algorithm developed by Gairola and Krishna-
murti86
is well tested for entire global tropics to
predict medium range cyclones. Gairola et al.50
have
used this algorithm to get precipitation regionally
during a very heavy cyclonic storm over Bay of
Bengal. Knowledge of rainfall at a place can help
planning and design of water resources project.
Although the algorithm was prepared initially for
global scale, it is capable of predicting rain properly
in the regional scale phenomena like cyclone.
6 Water vapour attenuation In the study of earth-space communication links,
role of oxygen and water vapour need special
treatment as they play a dominant role in such links.
They attenuate signals to a large extent leading to
unreliability of the links. The attenuation due to
oxygen molecule remains almost constant over the
entire world, whereas water vapour density changes to
a large extent from place to place. As a result,
attenuation due to water vapour will be of main
interest89-92
.
6.1 Measurement of attenuation
In clear air, both water vapour and oxygen
attenuate signals to an extent depending upon its
frequency; they also cause delay in propagation,
bending of ray and produce noise in receivers. Most
important gaseous element in the lower atmosphere is
water vapour, which absorbs ultra short waves at
22.235, 183.3 and 325.152 GHz. The liquid water in
the atmosphere absorbs strongly above radio waves
due to heavy displacement current. As temperature is
strongly connected with saturation water vapour
pressure, so the attenuation of signals due to water
vapour will vary as its concentration always change
with place and time.
Distribution of water vapour is obtained by using
radiosonde data. The change in distribution of water
vapour content over the Indian subcontinent is largely
due to its geographical and seasonal pattern. Along
the south-west coast the moisture content is maximum
whilst the minimum value is obtained over Srinagar.
The attenuation due to water vapour for small angle of
elevation becomes high due to dominance of the
tropospheric effects.
At radio frequencies, scattering effect can be
neglected in a gaseous atmosphere; hence attenuation
measurement due to absorption is of major concern.
Total gaseous absorption in the atmosphere for a path
of length γg (in km) is:
0
0
(in dB) ( )da a
A r r
γ
γ= ∫ …(7)
where,
γa(r) = γ0(r) + γω(r)
γa = Specific attenuation (dB/km)
γo, γω = Oxygen and water vapour attenuations.
To facilitate computer calculations use of Van
Vleck-Weisskoff line approximation was done.
Hence, γω can be written as:
ω 2 2
24 7.330.067
( 22.3) 6.6 ( 183.5) 5f fγ
= + +
− + − +
2 4
2
4.4( ρ10 )
( 323.8) 10f
f
−+
− + …(8)
here, f is the signal frequency and ρ the water vapour
density (g/m3). This Eq. (8) is found to be valid up to
350 GHz.
Upon integration of Eq. (8), one gets total
attenuation over earth-space link through the
atmosphere. The troposphere is largely responsible for
attenuation in the slant path communication for
elevation angle less than 10o. Introducing the concept
of equivalent path by replacing actual length in the
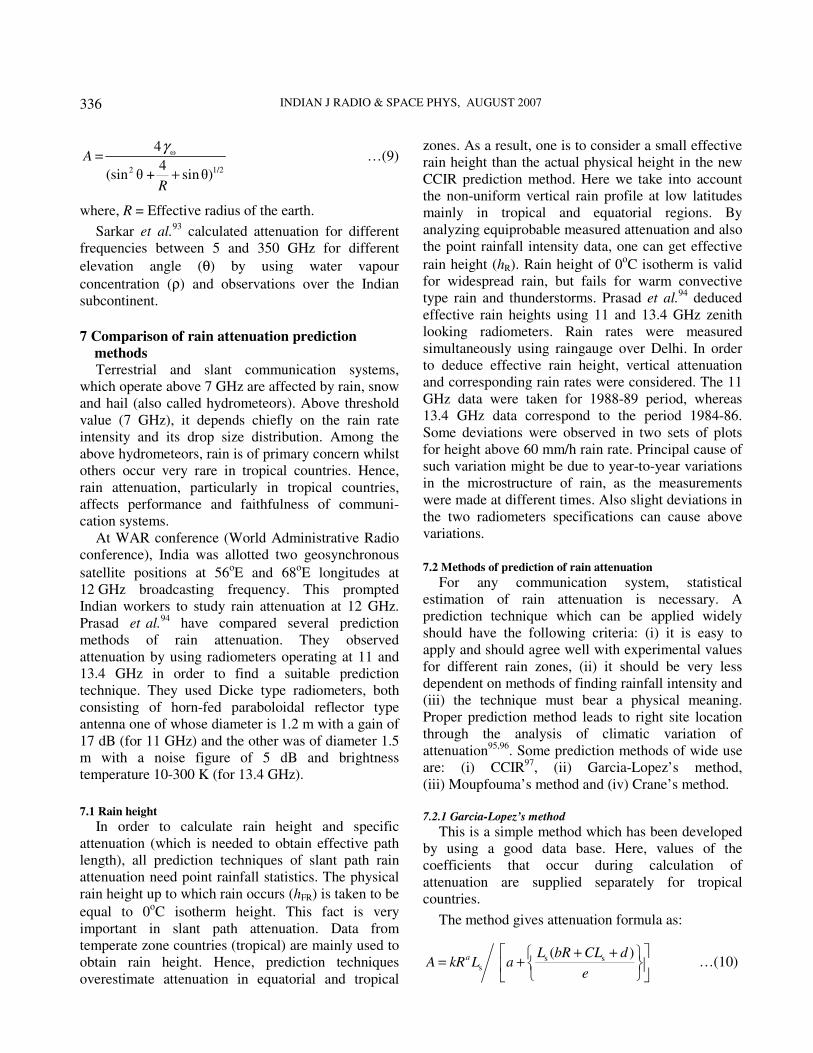
atmosphere we get the total path attenuation as:
INDIAN J RADIO & SPACE PHYS, AUGUST 2007
336
ω
2 1/2
4
4(sin θ + sinθ)
A
R
γ=
+
…(9)
where, R = Effective radius of the earth.
Sarkar et al.93
calculated attenuation for different
frequencies between 5 and 350 GHz for different
elevation angle (θ) by using water vapour
concentration (ρ) and observations over the Indian
subcontinent.
7 Comparison of rain attenuation prediction
methods Terrestrial and slant communication systems,
which operate above 7 GHz are affected by rain, snow
and hail (also called hydrometeors). Above threshold
value (7 GHz), it depends chiefly on the rain rate
intensity and its drop size distribution. Among the
above hydrometeors, rain is of primary concern whilst
others occur very rare in tropical countries. Hence,
rain attenuation, particularly in tropical countries,
affects performance and faithfulness of communi-
cation systems.
At WAR conference (World Administrative Radio
conference), India was allotted two geosynchronous
satellite positions at 56οE and 68
οE longitudes at
12 GHz broadcasting frequency. This prompted
Indian workers to study rain attenuation at 12 GHz.
Prasad et al.94
have compared several prediction
methods of rain attenuation. They observed
attenuation by using radiometers operating at 11 and
13.4 GHz in order to find a suitable prediction
technique. They used Dicke type radiometers, both
consisting of horn-fed paraboloidal reflector type
antenna one of whose diameter is 1.2 m with a gain of
17 dB (for 11 GHz) and the other was of diameter 1.5
m with a noise figure of 5 dB and brightness
temperature 10-300 K (for 13.4 GHz).
7.1 Rain height
In order to calculate rain height and specific
attenuation (which is needed to obtain effective path
length), all prediction techniques of slant path rain
attenuation need point rainfall statistics. The physical
rain height up to which rain occurs (hFR) is taken to be
equal to 0οC isotherm height. This fact is very
important in slant path attenuation. Data from
temperate zone countries (tropical) are mainly used to
obtain rain height. Hence, prediction techniques
overestimate attenuation in equatorial and tropical
zones. As a result, one is to consider a small effective
rain height than the actual physical height in the new
CCIR prediction method. Here we take into account
the non-uniform vertical rain profile at low latitudes
mainly in tropical and equatorial regions. By
analyzing equiprobable measured attenuation and also
the point rainfall intensity data, one can get effective
rain height (hR). Rain height of 0οC isotherm is valid
for widespread rain, but fails for warm convective
type rain and thunderstorms. Prasad et al.94
deduced
effective rain heights using 11 and 13.4 GHz zenith
looking radiometers. Rain rates were measured
simultaneously using raingauge over Delhi. In order
to deduce effective rain height, vertical attenuation
and corresponding rain rates were considered. The 11
GHz data were taken for 1988-89 period, whereas
13.4 GHz data correspond to the period 1984-86.
Some deviations were observed in two sets of plots
for height above 60 mm/h rain rate. Principal cause of
such variation might be due to year-to-year variations
in the microstructure of rain, as the measurements
were made at different times. Also slight deviations in
the two radiometers specifications can cause above
variations.
7.2 Methods of prediction of rain attenuation
For any communication system, statistical
estimation of rain attenuation is necessary. A
prediction technique which can be applied widely
should have the following criteria: (i) it is easy to
apply and should agree well with experimental values
for different rain zones, (ii) it should be very less
dependent on methods of finding rainfall intensity and
(iii) the technique must bear a physical meaning.
Proper prediction method leads to right site location
through the analysis of climatic variation of
attenuation95,96
. Some prediction methods of wide use
are: (i) CCIR97
, (ii) Garcia-Lopez’s method,
(iii) Moupfouma’s method and (iv) Crane’s method.
7.2.1 Garcia-Lopez’s method
This is a simple method which has been developed
by using a good data base. Here, values of the
coefficients that occur during calculation of
attenuation are supplied separately for tropical
countries.
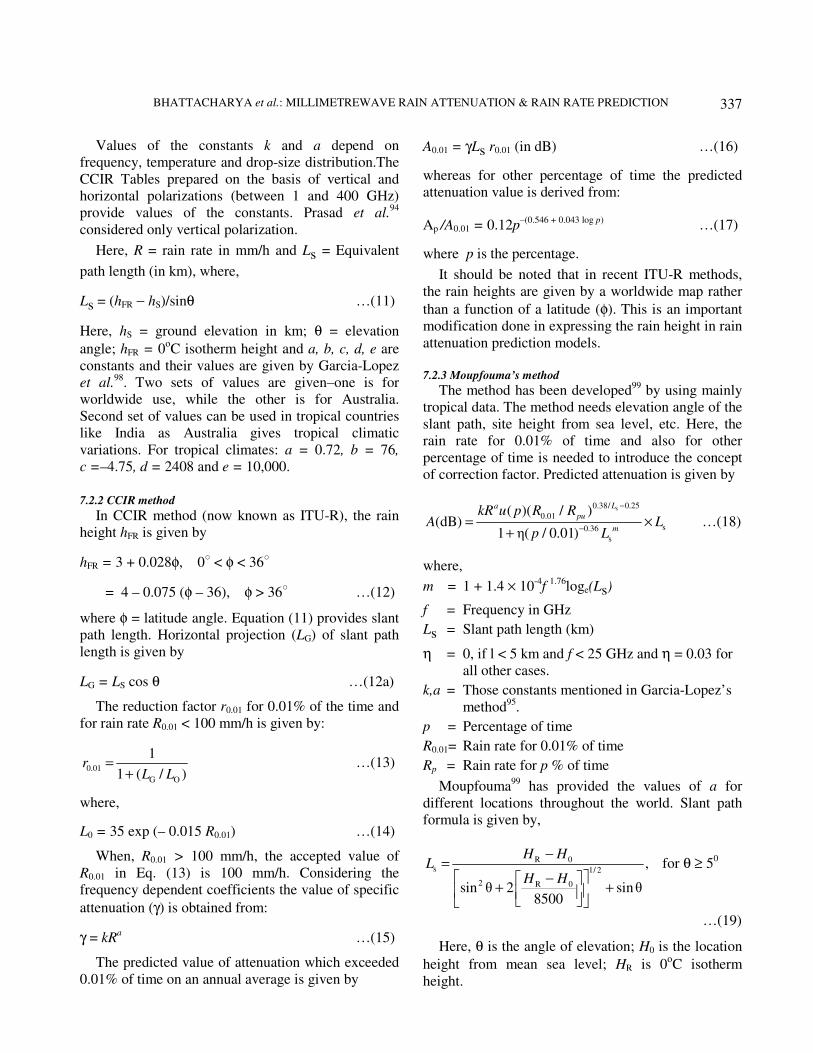
The method gives attenuation formula as:
s ss
( )a L bR CL dA kR L a
e
+ + = +
…(10)
BHATTACHARYA et al.: MILLIMETREWAVE RAIN ATTENUATION & RAIN RATE PREDICTION
337
Values of the constants k and a depend on
frequency, temperature and drop-size distribution.The
CCIR Tables prepared on the basis of vertical and
horizontal polarizations (between 1 and 400 GHz)
provide values of the constants. Prasad et al.94
considered only vertical polarization.
Here, R = rain rate in mm/h and Ls = Equivalent
path length (in km), where,
Ls = (hFR − hS)/sinθ …(11)
Here, hS = ground elevation in km; θ = elevation
angle; hFR = 0οC isotherm height and a, b, c, d, e are
constants and their values are given by Garcia-Lopez
et al.98
. Two sets of values are given–one is for
worldwide use, while the other is for Australia.
Second set of values can be used in tropical countries
like India as Australia gives tropical climatic
variations. For tropical climates: a = 0.72, b = 76,
c =–4.75, d = 2408 and e = 10,000.
7.2.2 CCIR method
In CCIR method (now known as ITU-R), the rain
height hFR is given by
hFR = 3 + 0.028φ, 0 < φ < 36
= 4 – 0.075 (φ – 36), φ > 36
…(12)
where φ = latitude angle. Equation (11) provides slant
path length. Horizontal projection (LG) of slant path
length is given by
LG = LS cos θ …(12a)
The reduction factor r0.01 for 0.01% of the time and
for rain rate R0.01 < 100 mm/h is given by:
0.01
G O
1
1 ( / )r
L L=
+ …(13)
where,
L0 = 35 exp (– 0.015 R0.01) …(14)
When, R0.01 > 100 mm/h, the accepted value of
R0.01 in Eq. (13) is 100 mm/h. Considering the
frequency dependent coefficients the value of specific
attenuation (γ) is obtained from:
γ = kRa …(15)
The predicted value of attenuation which exceeded
0.01% of time on an annual average is given by
A0.01 = γLs r0.01 (in dB) …(16)
whereas for other percentage of time the predicted
attenuation value is derived from:
Ap /A0.01 = 0.12p–(0.546 + 0.043 log p)
…(17)
where p is the percentage.
It should be noted that in recent ITU-R methods,
the rain heights are given by a worldwide map rather
than a function of a latitude (φ). This is an important
modification done in expressing the rain height in rain
attenuation prediction models.
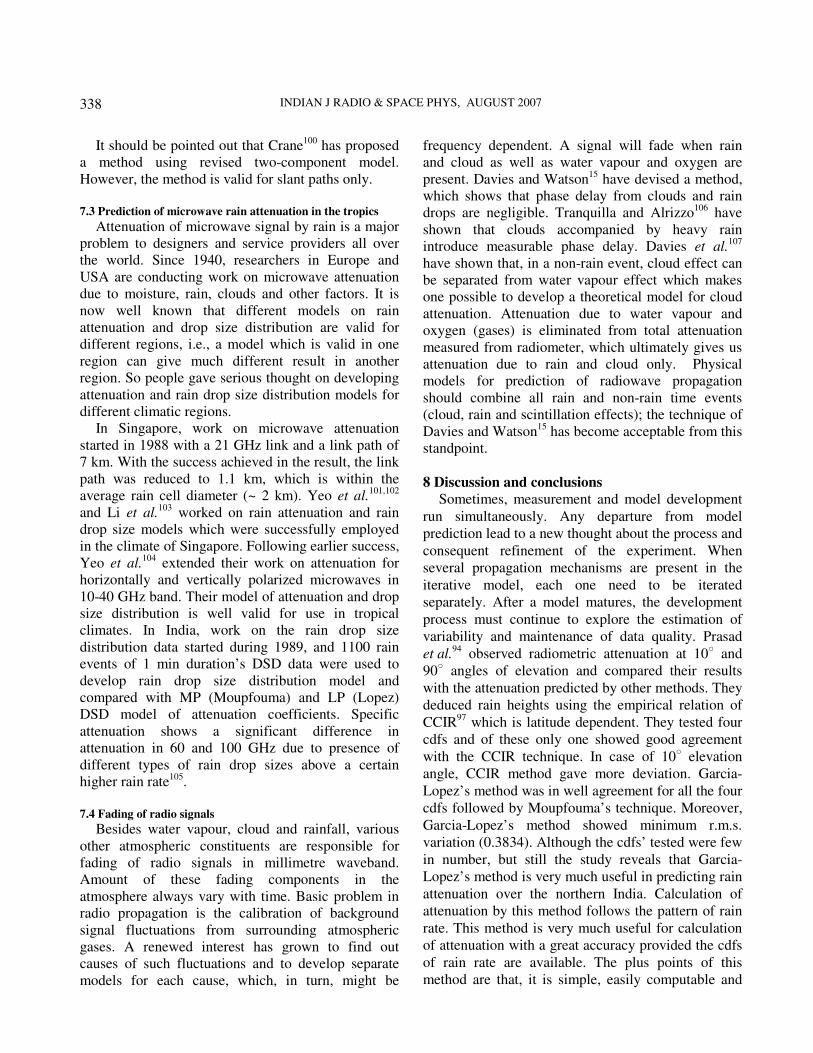
7.2.3 Moupfouma’s method
The method has been developed99
by using mainly
tropical data. The method needs elevation angle of the
slant path, site height from sea level, etc. Here, the
rain rate for 0.01% of time and also for other
percentage of time is needed to introduce the concept
of correction factor. Predicted attenuation is given by
s0.38/ 0.25
0.01
s0.36
s
( )( / )(dB)
1 η( / 0.01)
La
pu
m
kR u p R RA L
p L
−
−= ×
+ …(18)
where,
m = 1 + 1.4 × 10⁻⁴
f 1.76
loge(Ls)
f = Frequency in GHz
Ls = Slant path length (km)
η = 0, if l < 5 km and f < 25 GHz and η = 0.03 for
all other cases.
k,a = Those constants mentioned in Garcia-Lopez’s
method95
.
p = Percentage of time
R0.01= Rain rate for 0.01% of time
Rp = Rain rate for p % of time
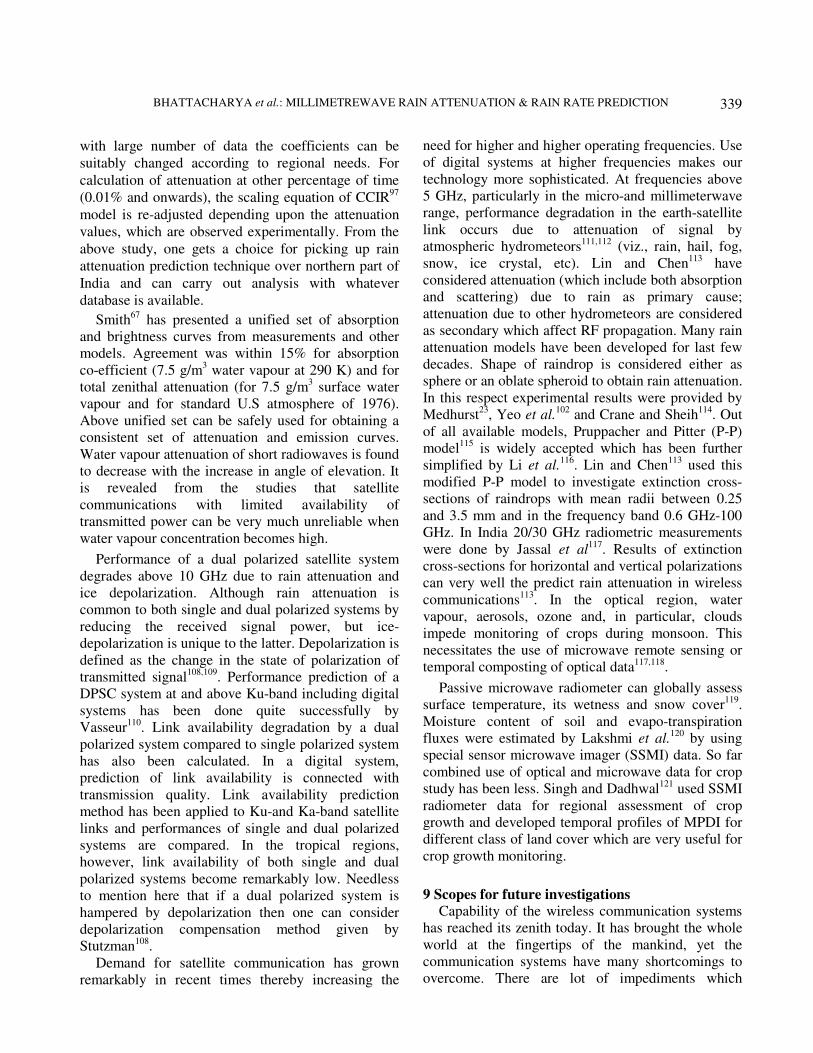
Moupfouma99
has provided the values of a for
different locations throughout the world. Slant path
formula is given by,
R 0s 1/ 2
2 R 0
,
sin θ 2 sinθ8500
H HL
H H
−= −
+ +
for θ ≥ 50
…(19)
Here, θ is the angle of elevation; H0 is the location
height from mean sea level; HR is 0οC isotherm
height.
INDIAN J RADIO & SPACE PHYS, AUGUST 2007
338
It should be pointed out that Crane100
has proposed
a method using revised two-component model.
However, the method is valid for slant paths only.
7.3 Prediction of microwave rain attenuation in the tropics
Attenuation of microwave signal by rain is a major
problem to designers and service providers all over
the world. Since 1940, researchers in Europe and
USA are conducting work on microwave attenuation
due to moisture, rain, clouds and other factors. It is
now well known that different models on rain
attenuation and drop size distribution are valid for
different regions, i.e., a model which is valid in one
region can give much different result in another
region. So people gave serious thought on developing
attenuation and rain drop size distribution models for
different climatic regions.
In Singapore, work on microwave attenuation
started in 1988 with a 21 GHz link and a link path of
7 km. With the success achieved in the result, the link
path was reduced to 1.1 km, which is within the
average rain cell diameter (~ 2 km). Yeo et al.101,102
and Li et al.103
worked on rain attenuation and rain
drop size models which were successfully employed
in the climate of Singapore. Following earlier success,
Yeo et al.104
extended their work on attenuation for
horizontally and vertically polarized microwaves in
10-40 GHz band. Their model of attenuation and drop
size distribution is well valid for use in tropical
climates. In India, work on the rain drop size
distribution data started during 1989, and 1100 rain
events of 1 min duration’s DSD data were used to
develop rain drop size distribution model and
compared with MP (Moupfouma) and LP (Lopez)
DSD model of attenuation coefficients. Specific
attenuation shows a significant difference in
attenuation in 60 and 100 GHz due to presence of
different types of rain drop sizes above a certain
higher rain rate105
.
7.4 Fading of radio signals
Besides water vapour, cloud and rainfall, various
other atmospheric constituents are responsible for
fading of radio signals in millimetre waveband.
Amount of these fading components in the
atmosphere always vary with time. Basic problem in
radio propagation is the calibration of background
signal fluctuations from surrounding atmospheric
gases. A renewed interest has grown to find out
causes of such fluctuations and to develop separate
models for each cause, which, in turn, might be
frequency dependent. A signal will fade when rain
and cloud as well as water vapour and oxygen are
present. Davies and Watson15
have devised a method,
which shows that phase delay from clouds and rain
drops are negligible. Tranquilla and Alrizzo106
have
shown that clouds accompanied by heavy rain
introduce measurable phase delay. Davies et al.107
have shown that, in a non-rain event, cloud effect can
be separated from water vapour effect which makes
one possible to develop a theoretical model for cloud
attenuation. Attenuation due to water vapour and
oxygen (gases) is eliminated from total attenuation
measured from radiometer, which ultimately gives us
attenuation due to rain and cloud only. Physical
models for prediction of radiowave propagation
should combine all rain and non-rain time events
(cloud, rain and scintillation effects); the technique of
Davies and Watson15
has become acceptable from this
standpoint.
8 Discussion and conclusions
Sometimes, measurement and model development
run simultaneously. Any departure from model
prediction lead to a new thought about the process and
consequent refinement of the experiment. When
several propagation mechanisms are present in the
iterative model, each one need to be iterated
separately. After a model matures, the development
process must continue to explore the estimation of
variability and maintenance of data quality. Prasad
et al.94
observed radiometric attenuation at 10 and
90 angles of elevation and compared their results
with the attenuation predicted by other methods. They
deduced rain heights using the empirical relation of
CCIR97
which is latitude dependent. They tested four
cdfs and of these only one showed good agreement
with the CCIR technique. In case of 10 elevation
angle, CCIR method gave more deviation. Garcia-
Lopez’s method was in well agreement for all the four
cdfs followed by Moupfouma’s technique. Moreover,
Garcia-Lopez’s method showed minimum r.m.s.
variation (0.3834). Although the cdfs’ tested were few
in number, but still the study reveals that Garcia-
Lopez’s method is very much useful in predicting rain
attenuation over the northern India. Calculation of
attenuation by this method follows the pattern of rain
rate. This method is very much useful for calculation
of attenuation with a great accuracy provided the cdfs
of rain rate are available. The plus points of this
method are that, it is simple, easily computable and
BHATTACHARYA et al.: MILLIMETREWAVE RAIN ATTENUATION & RAIN RATE PREDICTION
339
with large number of data the coefficients can be
suitably changed according to regional needs. For
calculation of attenuation at other percentage of time
(0.01% and onwards), the scaling equation of CCIR97
model is re-adjusted depending upon the attenuation
values, which are observed experimentally. From the
above study, one gets a choice for picking up rain
attenuation prediction technique over northern part of
India and can carry out analysis with whatever
database is available.
Smith67
has presented a unified set of absorption
and brightness curves from measurements and other
models. Agreement was within 15% for absorption
co-efficient (7.5 g/m3 water vapour at 290 K) and for
total zenithal attenuation (for 7.5 g/m3 surface water
vapour and for standard U.S atmosphere of 1976).
Above unified set can be safely used for obtaining a
consistent set of attenuation and emission curves.
Water vapour attenuation of short radiowaves is found
to decrease with the increase in angle of elevation. It
is revealed from the studies that satellite
communications with limited availability of
transmitted power can be very much unreliable when
water vapour concentration becomes high.
Performance of a dual polarized satellite system
degrades above 10 GHz due to rain attenuation and
ice depolarization. Although rain attenuation is
common to both single and dual polarized systems by
reducing the received signal power, but ice-
depolarization is unique to the latter. Depolarization is
defined as the change in the state of polarization of
transmitted signal108,109
. Performance prediction of a
DPSC system at and above Ku-band including digital
systems has been done quite successfully by
Vasseur110
. Link availability degradation by a dual
polarized system compared to single polarized system
has also been calculated. In a digital system,
prediction of link availability is connected with
transmission quality. Link availability prediction
method has been applied to Ku-and Ka-band satellite
links and performances of single and dual polarized
systems are compared. In the tropical regions,
however, link availability of both single and dual
polarized systems become remarkably low. Needless
to mention here that if a dual polarized system is
hampered by depolarization then one can consider
depolarization compensation method given by
Stutzman108
.
Demand for satellite communication has grown
remarkably in recent times thereby increasing the
need for higher and higher operating frequencies. Use
of digital systems at higher frequencies makes our
technology more sophisticated. At frequencies above
5 GHz, particularly in the micro-and millimeterwave
range, performance degradation in the earth-satellite
link occurs due to attenuation of signal by
atmospheric hydrometeors111,112
(viz., rain, hail, fog,
snow, ice crystal, etc). Lin and Chen113
have
considered attenuation (which include both absorption
and scattering) due to rain as primary cause;
attenuation due to other hydrometeors are considered
as secondary which affect RF propagation. Many rain
attenuation models have been developed for last few
decades. Shape of raindrop is considered either as
sphere or an oblate spheroid to obtain rain attenuation.
In this respect experimental results were provided by
Medhurst23
, Yeo et al.102
and Crane and Sheih114
. Out
of all available models, Pruppacher and Pitter (P-P)
model115
is widely accepted which has been further
simplified by Li et al.116
. Lin and Chen113
used this
modified P-P model to investigate extinction cross-
sections of raindrops with mean radii between 0.25
and 3.5 mm and in the frequency band 0.6 GHz-100
GHz. In India 20/30 GHz radiometric measurements
were done by Jassal et al117
. Results of extinction
cross-sections for horizontal and vertical polarizations
can very well the predict rain attenuation in wireless
communications113
. In the optical region, water
vapour, aerosols, ozone and, in particular, clouds
impede monitoring of crops during monsoon. This
necessitates the use of microwave remote sensing or
temporal composting of optical data117,118
.
Passive microwave radiometer can globally assess
surface temperature, its wetness and snow cover119
.
Moisture content of soil and evapo-transpiration
fluxes were estimated by Lakshmi et al.120
by using
special sensor microwave imager (SSMI) data. So far
combined use of optical and microwave data for crop
study has been less. Singh and Dadhwal121
used SSMI
radiometer data for regional assessment of crop
growth and developed temporal profiles of MPDI for
different class of land cover which are very useful for
crop growth monitoring.
9 Scopes for future investigations
Capability of the wireless communication systems
has reached its zenith today. It has brought the whole
world at the fingertips of the mankind, yet the
communication systems have many shortcomings to
overcome. There are lot of impediments which
INDIAN J RADIO & SPACE PHYS, AUGUST 2007
340
radiowaves suffer in its journey and thereby
hampering reliable communication. Researchers have
solved several problems to obtain a faithful link but
much more work need to be done.
The lines for further investigation are indicated
below:
(i) It has been observed that fog attenuation
dominates in the infrared and optical bands,
whereas rain attenuation plays havoc at
millimetre wavebands; hence a combined dual
waveband link or use of a compromise
propagation frequency can be thought of.
Absorption bands at 60 GHz and 183 GHz have
many civil and defence applications for a short
path-length of a few kilometres and even less
since absorption at these bands beyond a few
kilometres is very high. Amount of attenuation
may vary from place to place; in cities or
industrial belts pollution may play a big role; in
forests vegetation may have a different role,
whereas in villages or deserts attenuation will be
different. A similar study may, therefore, be
carried out for obtaining a proper path-length.
(ii) For propagation along vertical and horizontal
paths at 22.235 GHz and 94 GHz, absorption
values are often found to be not correlated. It is
suggested to look for correlation of attenuation,
if any, for 22.235 GHz along horizontal and 94
GHz along vertical paths, since attenuation will
be less at 22.235 GHz. At lower rain rates,
attenuation becomes large and increases with
frequency above a critical value. Due to growing
need of millimetrewave frequencies, it is
proposed to look afresh at the low rain rate
attenuation statistics at higher frequencies.
(iii) Post rain attenuation modelling has been done at
22.235 GHz (λ=1.35 cm); the same modelling
can be considered at other window frequencies
in the millimetre waveband. Again the amount
of residual post-rain attenuation was found to be
higher at lower rain rates, which indicates that
such rain rates are associated with smaller
raindrops and low velocity of fall. A study of
post-rain attenuation with rain rate or a relation
between rain drop size and velocity of fall may
be carried out.
(iv) Scattering of radio waves is another major cause
of concern to the communication people.
Electromagnetic waves are scattered mainly by
raindrops, water vapour and oxygen molecules.
Scattered waves cause interference which
degrades signal. Hence a thorough study of
radioscatter in the microwave and millimeter
wavebands will be vital for planning and
designing of radiosystems. A major cause of
attenuation is the effect of wet antenna during
rain. Studies of antenna attenuation and
development of antenna design which does not
attenuate signal during rain can be undertaken.
(v) Multipath fading is an important cause of signal
deterioration in the clear sky condition and
during rain events in the microwave and
millimetrewave ranges. Further researches can
be carried out on multipath fading. With the ever
increasing demand for radio wave
communications, more frequencies above 10
GHz need to be considered for terrestrial and
satellite communications. But signal attenuation
beyond 10 GHz due to rain, water vapour and
other atmospheric constituents is of major
concern. Accurate prediction of attenuation is a
great challenge to the communication people.
Usually, rain data are collected for intervals of
1 h or more; but correct prediction of attenuation
generally requires 1 min or less interval of rain
rate data. Statistical conversion of 1h rain rate
data into 1 min or less rain rate data for proper
prediction of attenuation over tropical and non-
tropical zones may be explored globally.
(vi) Rain drop size distribution models and
attenuation models are established to be highly
regionalized. Studies can be undertaken on such
models at different propagation frequencies and
a global map for prediction of attenuation can be
thought of. Microwave and millimetrewave
remote sensing of various land, soil and
environment at various frequencies are now in
great demand because such a study can provide
a lot of inputs to the agriculture and meteorology
in association with modern satellites. Hence, a
vivid investigation of such remote sensing
technique needs to be probed further. Effects of
sea breeze and breeze in hilly terrains on
propagation factors over a LOS link in India and
elsewhere can be investigated at different
frequencies.
BHATTACHARYA et al.: MILLIMETREWAVE RAIN ATTENUATION & RAIN RATE PREDICTION
341
(vii) Remote sensing of microwave and
milimetrewave radiometry is of paramount
importance to monitor soil and vegetation status
on a regional and global scale. It can also help us
to study the moisture content of soil and its
fertility to investigate vegetation biomass for
estimation of crop yield and its type and many
such agricultural needs may be explored in a
great detail. Radio refractivity largely controls
the quality and reliability of radars and
communication systems. Hence, a thorough
study of radio refractivity in the coastal regions,
hilly places, forests and deserts can be
undertaken at various frequencies in different
seasons. Such a study can be of immense help
for prediction of radar and other communication
system performances.
There are many questions still unanswered,
hopefully, awaits for the improvement of the existing
instruments and techniques and development of the
new ones.
Acknowledgements
The authors are extremely grateful to the
Reviewers of this paper for the valuable comments
and suggestions. We are also thankful to the research
workers whose work published in different
journals/proceedings, etc. have been used in this
paper.
References
1 Crane R K, Propagation phenomenon affecting satellite
communication systems operating in the centimeter and
millimeter wavelength bands, Proc IEEE (USA), 59 (1971)
173.
2 Rice P L & Holmberg N R, Cumulative time statistics of
surface-point rainfall rates, IEEE Trams Commun (USA),
Com 21 (1973) 1131.
3 Lee W C Y, An approximate method for obtaining rain rate
statistics for use in signal attenuation estimating, IEEE
Trans Antennas & Propag (USA), AP 27 (1979) 407.
4 Dutton E J & Dougherty H T, Year-to-Year variability of
rainfall for microwave applications in the USA, IEEE Trans
Commun (USA), Com 27 (1979) 829.
5 Crane R K, Refraction effects in the neutral atmosphere in
methods of experimental physics, edited by M L Meeks
(Academic Pres New York), Vol 2, part B, 1976, p. 187.
6 Bevis M, Businger S, Harring T A, Rocken C, Anthes R A
& Ware R H, GPS meteorology: Remote sensing of
atmospheric water vapour using the global positioning
system, J Geophys Res (USA), 97 (1992) 15787.
7 Thayer G D, An improved equation for the radio refractive
index of air, Radio Sci (USA), 9 (1974) 803.
8 Davis J L, Herring T A, Shapiro I I, Rogers A E E &
Elgered G, Geodesy by radio interferometry: Effects of
atmospheric modeling errors on estimates of baseline length,
Radio Sci (USA), 20 (1985) 1593.
9 Saastamoinen J, Atmospheric correction for the troposphere
and stratosphere in radio ranging of satellites, The use of
artificial satellites for geodesy, Geophys Monogr Ser (USA),
15 (1972) 247.
10 Zumberge J F, Heflin M B, Jefferson D C, Watkins M M &
Webb F H, Precise point positioning for efficient and robust
analysis of GPS data from large networks, J Geophys Res
(USA), 102 (1997) 5005.
11 Davies O T & Watson P A, Comparison of integrated
precipitable water vapour obtained by GPS and radiosondes,
Electron Lett (UK), 34 (1998) 645.
12 ITU-R Rec, Attenuation by atmospheric gases, ITU, 1997,
676-3.
13 Karasawa Y, Yamada M & Allnutt J E, A new prediction
method for tropospheric scintillation on earth-space paths,
IEEE Trans Antennas & Propag (USA), 36 (1988) 1608.
14 Salonen E, Karhu S, Jokela P, Zhang W, Uppala S, Aulamo
H & Sarkkula S, Study of propagation phenomena for low
availabilities, Final Rpt ESA/Estee cont, 8025/88/NL/PR
(1990).
15 Davies O T & Watson P A, GPS phase-delay measurement:
Technique for the calibration and analysis in millimetre
wave radio propagation studies, IEE Proc-Microw Antennas
& Propag (UK), 146 (1999) 369.
16 Crane R K, Prediction of the effects of rain on satellite
communication system, Proc IEEE (USA), 65 (1977) 456.
17 Joss J R, Cavalli R & Crane R K, Good agreement between
theory and experiment for attenuation data, J Rech Atmos
(France), 8 (1974) 299.
18 McCormick K S, A comparison of precipitation attenuation
and radar backscatter along earth-space paths, IEEE Trans
Antennas & Propag (USA), AP-20 (1972) 745.
19 Goldhirsh J, Predictive methods for rain attenuation using
radar and in-situ measurements tested against the 28-GHz
COMSTAR beacon signal, IEEE Trans Antennas & Propag
(USA), AP-27 (1979) 398.
20 Capsoni C, Fedi F, Magistoni C & Paraboni A, Data and
theory for a new model of the horizontal structure of rain
cells for propagation applications, Radio Sci (USA), 22
(1987) 359.
21 Goldhirsh J & Katz I, Useful experimental results for earth-
satellite rain attenuation modeling, IEEE Trans Antennas &
Propag (USA), AP-27 (1979) 413.
22 Ryde J W, The attenuation and radar echoes produced at
centimeter wavelengths by various meteorological
phenomena, Meteorological Factors in Radio Wave
propagation, Physical Society of London, 1947, p. 169.
23 Medhurst R G, Rainfall attenuations of centimeter waves:
Comparison of theory and measurement, IEEE Trans
Antennas & propag (USA), AP-13 (1965) 550.
24 Crane R K, Attenuation due to rain – A mini review, IEEE
Trans Antennas & Propag (USA), AP-23 (1975) 750.
INDIAN J RADIO & SPACE PHYS, AUGUST 2007
342
25 Bussey H E, Microwave attenuation statistics estimated
from rainfall and water vapour statistics, Proc Inst Electr
Eng (UK), 38 (1950) 781.
26 Mondal N C, Bhattacharya A B & Sarkar S K, Some more
results on 0°C isotherm height over several Indian stations
for rain attenuation estimation, Indian J Phys, 71B (1997)
641.
27 Mondal N C, Timothy K I, Bhattacharya A B & Sarkar S K,
The effect of rate of decay of rain path profile on microwave
communication, Int J Remote Sens (UK), 18 (1997) 3669.
28 Sarkar S K, Mondal N C, Bhattacharya A B & Bhattacharya
R, Some studies on attenuation and atmospheric water
vapour measurements in India, Int J Remote Sens (UK), 19
(1998) 473.
29 Crane R K, Comparative evaluation of several rain
attenuation model, Radio Sci (USA), 20 (1985) 843.
30 Crane R K, Electromagnetic wave propagation through rain
(John Wiley & Sons), New York, 1996.
31 Burgueno A, Austin J, Vilar E & Puigcerver M, Analysis of
modereate and intense rainfall rates continuously recorded
over half a century and influence on microwave
communication planning and rain-rate data acquisition,
IEEE Trans Commun (USA), Com 35(4) (1987) 382.
32 Patt T, Satellite Communications (John Wiley & Sons, New
York), 1986.
33 Rao S V B, Rao T R, Reddy I V S, Prasad M V S N, Reddy
V G & Reddy B M, Rain attenuation studies at 11.7 GHz
over southern India, Indian J Radio & Space Phys, 31
(2002) 107.
34 Bhattacharya R, Karmakar P K, Maitra A & Sen A K,
Studies on rain induced attenuation phase shift and
scattering coefficient at millimeter wavelengths during
tropical rainfall, J Inst Electron Telecommun Eng (India), 41
(1995) 89.
35 Olsen R L, Rogers D V & Hodge D B, The aRb relation in
the calculation of rain attenuation, IEEE Trans Antennas &
Propag (USA), AP-26 (1978) 318.
36 Crane R K, Prediction of attenuation by rain, IEEE Trans
Commun (USA), Com 28 (1980) 1717.
37 Moupfouma P, Improvement of a rain attenuation prediction
method for terrestrial microwave links, IEEE Trans
Antennas & Propag (USA), AP-32 (1984) 1368.
38 Fabry F & Zawadzki I, Long-Term radar observations of the
melting layer of precipitation and their interpretation, J
Atmos Sci (USA), 52 (1995) 838.
39 Rao D N, Study of precipitating weather systems with MST
radar in Technical Report, Department of Physics, SV
University, Tirupati India 1999.
40 Sarkar S K, Kumar R, Ahmed I, Prasad M V S N, Das J &
De A K, Rain structure estimation from X-band radar
reflectivity measurements for radio system applications in
microwave and millimetre wave frequency bands, Indian J
Radio & Space Phys, 32 (2003) 98.
41 Clift G A, Use of radar in meteorology, Secretariat of World
Met Org, Geneva 1985.
42 Paloscia S & Pampaloni P, Microwave polarization index
for monitoring vegetation growth, IEEE Trans Geosci
Remote Sens (USA), 26 (1988) 617.
43 Ulaby F T, Dobson M C & Razani M, Effects of vegetation
cover on the microwave radiometric sensitivity to soil
moisture, IEEE Trans Geosci Remote Sens (USA), 21 (1983)
51.
44 Singh D & Sharan S K, Effect of vegetation biomass on
microwave emissivity at X-band, Indian J Radio & Space
Phys, 28 (1999) 103.
45 Hendrantoro G, Bultitude J C R & Faleoner D D, Use of
cell-site diversity in millimeter-wave fixed cellular systems
to combat the effects of rain attenuation, IEEE J Sel Areas
Commun (USA), 20 (2002) 602.
46 Laws J O & Parsons D A, The relation of rain drop size to
intensity, Trans Am Geophys Union (USA), 24 (1943) 452.
47 Rao T R, Rao S V B, Prasad M V S N, Sarkar S K &
Lakshmi D R, Effect of sea breeze on propagation
characteristics over a LOS microwave link located in Indian
south-east coast, Indian J Radio & Space Phys, 28 (1999)
113.
48 Sarkar S K, Ahmed I, Gupta M M, Prasad M VS N, Das J,
De A K & Rajesh Kumar, Performance deterioration of a
communication link at 13 GHz due to rain, Indian J Phys,
79 (2005) 117.
49 Karmakar P K, Maiti M & Mitra A, Radio visibility at
microwave frequencies, Indian J Radio & Space Phys, 31
(2002) 264.
50 Gairola R M, Varma A K, Pokhrel S & Agarwal V K,
Integrated satellite microwave and infrared measurements of
precipitation during a Bay of Bengal cyclone, Indian J
Radio & Space Phys, 33 (2004) 115.
51 ITU-R Recommendation 837: Characteristics of
precipitation for propagation modelling – RPN series
propagation in non-ionized media, Geneva, 1992, p. 201.
52 CCIR XVIIth Plenary Assembly, Dusseldorf, Reports of the
CCIR, 1990 – Annex to 5, Propagation in non-ionised
media, 1990, p. 453.
53 Bringi V N, Cherry S M, Hall M P M & Selia T A, Dual
polarization radar attenuation prediction in Proceedings of
a one day radar workshop, held at the Tech-Univ. of Graz,
Austria, 24 Nov. 1978, p. 191.
54 Leitao M J M & Watson P A, Method for prediction of
attenuation on earth-space links based on radar
measurements of the physical structure of rainfall, IEE Pro-
F Radar Signal Process (UK), 133 (1986) 429.
55 Timothy K I, Sharma S, Barbara A K & Minakshi Devi,
Rain attenuation characteristics: An observation study over
LOS microwave link at 11 GHz, Indian J Radio & Space
Phys, 23 (1994) 130.
56 Verma A K & Jha K K, Raindrop size distribution model for
Indian climate, Indian J Radio & Space Phys, 25 (1996) 15.
57 Harden B N, Norbury J R & White W J K, Measurement of
rainfall for studies of millimetric radio attenuation, Microw
Opt & Acous (USA), 1 (1977) 197.
58 Fedi F, Prediction of attenuation due to rainfall on terrestrial
links, Radio Sci (USA), 16 (1981) 731.
59 Verma A K & Jha K K, Influence of rain drop size
distribution on specific attenuation at mm waves, Indian J
Radio & Space Phys, 25 (1996) 179.
BHATTACHARYA et al.: MILLIMETREWAVE RAIN ATTENUATION & RAIN RATE PREDICTION
343
60 Sarkar S K, Bhattacharya A B & Mondal N C, Arrenuation
of radiowave due to rain and water vapour – An overview, J
Sci & Ind Res (India), 55 (1996) 781.
61 Stutzman W L, Pratt T, Bostian C W & Porter R E,
Prediction of slant path propagation statistics using dual
polarized radar, IEEE Trans Antennas & Propag (USA),
(1989)
62 Jassal B S, Gupta G D & Verma A K, 20/30 GHz
radiometric propagation measurements in India,
Proceedings of IEEE-Antenna and Propagation Symposium
(USA), 1994, p. 1340.
63 Ajayi G O (Ed), URSI Hand book on radio waves
propagation related to satellite communications in Tropical
and subtropical countries, 1996.
64 Bryant G H, Adimula I A & Riva C, Rain cell diameters and
heights: A new model of attenuation, presented in URSI
Comm F, Aveiro, Portugise, 1998.
65 Raina M K & Uppal G S, Frequency dependence of rain
attenuation measurements at microwave frequencies, IEEE
Trans Antennas & Propag (USA), AP-32 (1984) 185.
66 Waters J W, Absorption and emission of microwave
radiation by atmospheric gases in methods of experimental
physics in Part B, Radio Astronomy, edited by M L Meeks
(Academic Press), Sec. 2.3, 1976, p. 12.
67 Smith E K, Centimeter and millimeter wave attenuation and
brightness temperature due to atmospheric oxygen and water
vapor, Radio Sci (USA), 17 (1982) 1455.
68 Crane R K, Fundamental limitations caused by RF
propagation, Proc IEEE (USA), 69 (1981) 196.
69 McClatchey R A & others, AFCRL atmospheric absorption
line parameters compilation, Air Force Geophys Lab,
AFCRL TR-0096 Hanscom Air Force Base Massachussetts,
1973.
70 Rothman L S & McClatchey R A, Updating the AFCRL
atmospheric absorption line parameters compilation, Appl
Opt (USA), 15 (1976) 2616.
71 Rothman L S, Update of the AFGL atmospheric absorption
line parameter compilation, Appl Opt (USA), 17 (1978)
3517.
72 Rothman L S, AFGL atmospheric absorption line
parameters compilation 1980 version, Appl Opt (USA), 20
(1981) 791.
73 Rosenkranz P W, Shape of the 5-mm oxygen band in the
atmosphere, IEEE Trans Antennas & Propag (USA), AP-23
(1975) 498.
74 Kharadly M, Ross R & Dow B, Analysis of the ACTS –
Vancouver path propagation data, in Proceedings of NAPEX
XX & ACTS Prop Studies Mini Workshop, edited by A K
Fairbanks, 1996, p. 67.
75 Bringi V N & Beaver J, Ka-Band propagation studies using
ACTS propagation terminal and the CSU-CHILL
multiparameter radar, in Proceedings of Ninth ACTS
Propagation Studies Workshop (APSW IX), edited by V A
Herndon, 1996, p 61.
76 Horan S, Paulic F & Atle B, New Mexico ACTS
propagation terminal status, in Proceedings of NAPEX XXI
& ACTS Prop Studies Mini Workshop, edited by C A El
Segundo, 1997, p. 1.103.
77 Acosta R J, Reinhart R, Kifer D X & Emrich C, Wet antenna
studies at LeRC in Proceedings of NAPEX XXI & ACTS
Prop Studies Mini Workshop, edited by C A El Segundo,
1987, p 2.41.
78 Kharadly M & Dow B, The UBC/ACTS experiment – Status
report, in Proceedings of Ninth ACTS Propagation Studies
Workshop (APSW IX), edited by V A Herndon, 1996, p 45.
79 Cheah J Y C, Wet antenna effect on VSAT rain margin,
IEEE Trans Commun (USA), 41 (1993) 1238.
80 Kharadly M M Z & Ross R, Analysis and modeling of
corrupt propagation data due to antenna surface wetting
during rain events, in Proceedings of 1st Inernatinal
Workshop on Radiowave Propagation Model at Ka-Band
and above, ESTEC, Netherlands, 1998, p. 65.
81 Kharadly M M Z & Chan A Y, New antenna concept for
efficient Ka-band terminal operation in rain, in Proceedings
of 4th Ka-Band Utilization Conference, Venice, Italy, 1998,
p 223.
82 Kharadly M M Z & Ross R, Effect of wet antenna
attenuation on propagation data statistics, IEEE Trans
Antennas & Propag (USA), 49 (2001) 1183.
83 Charles A & Doswell III, (Ed), Severe Storms, American
Meteorological Society, 2001, p 561.
84 Brueske K F & Velden C S, Satellite based tropical cyclone
intensity estimation using the NOAA-KLM series Advanced
Microwave Sounding Unit (AMSU), Mon Weather Rev
(USA), 131 (2003) 687.
85 Elsberry R L & Velden C S, A survey of tropical cyclone
forecast centres – uses and needs of satellite data, WMO Bull
(Switzerland), 52 (2003) 258.
86 Gairola R M & Krishnamurti T, Rain rates based on SSM/I,
OLR and raingauge data sets, Meteorol Atmos Phys
(Austria), 50 (1992) 165.
87 Rao G V & MacArthur P D, The SSM/I estimated rainfall
amounts of tropical cyclones and their potential in predicting
the cyclone intensity changes, Mon Weather Rev (USA), 122
(1994) 1568.
88 Rodgers E B & Pierce H F, A satellite observational study of
precipitation characteristics in Western North Pacific
Tropical cyclones, J Appl Meteorol (USA), 34 (1995) 2587.
89 Sen A K, Karmakar P K, Das T K, Devgupta A K,
Chakraborty P K & Deb Barman S, Significant heights for
water vapour content in the atmosphere, Int J Remote Sens
(UK), 10 (1989) 1119.
90 Sen A K, Deb Barman S, Karmakar P K, Devgupta A K,
Mitra A, Dasgupta M K, Calla O P N & Rana S S,
Radiometric studies of attenuation and water vapour content
in the atmosphere at 22.235 GHz over Calcutta, Atmos
Environ (UK), 24 (1990) 1909.
91 Sen A K, Karmakar P K, Deb Barman S, Devgupta A K,
Dasgupta M K, Calla O P N & Rana S S, Tropospheric
water vapour modeling over a tropical location by
radiometric study, Indian J Radio & Space Phys, 20 (1991)
347.
92 Karmakar P K, Deb Barman S, Chattopadhyay S & Sen A
K, Radiometric studies of transportation of water vapour
over Calcutta, Int J Remote Sens (UK), 15 (1994) 1537.
INDIAN J RADIO & SPACE PHYS, AUGUST 2007
344
93 Sarkar S K, Prasad M V S N, Datta H N, Reddy B M &
Narayana D R, Water vapour attenuation studies from 1 to
350 GHz over the Indian subcontinent, Indian J Radio &
Space Phys, 16 (1987) 236.
94 Prasad M V S N, Sarkar S K, Sain M & Reddy B M,
Comparison of rain attenuation prediction methods for earth-
space path over northern India, Indian J Radio & Space
Phys, 23 (1994) 135.
95 Sen A K, Das T K, Deb Barman S, Karmakar P K, Devgupta
A K, Dasgupta M K, Calla O P N & Rana S S, Modelling of
post-rain attenuation of microwaves at 22.235 GHz in
relation to vertical transport of water vapour, Int J Remote
Sens (UK), 11 (1990) 1869.
96 Sen A K, Karmakar P K, Das T K, Rahaman M & Deb
Barman S, A theoretical estimate of relative contribution of
refractivity towards group delay, Indian J Radio & Space
Phys, 20 (1991) 26.
97 CCIR, Propagation data and prediction methods required for
the design of earth-space telecommunication systems, Draft
Rev to Recom, SG5, 1991, p. 618.
98 Garcia-Lopez J A, Hernanando J M & Selga J M, Simple
rain attenuation prediction method satellite radio links, IEEE
Trans Antennas & Propag (USA), 36 (1988) 444.
99 Moupfouma F & De Reffye J, Model for rainfall rate
distribution, Electron Lett (UK), 18 (1982) 460.
100 Crane R K, Modelling attenuation by rain in tropical
regions, Int J Satell Commun (UK), 8 (1990) 197.
101 Yeo T S, Kooi P S, Leong M S & Ng S S, Microwave
attenuation due to rainfall at 21.225 GHz in the Singapore
environment, Electron Lett (UK), 26(14) (1991) 1021.
102 Yeo T S, Kooi P S & Leong M S, A two-year measurement
of rainfall attenuation of CW microwave in Singapore, IEEE
Trans Antennas & Propag (USA), 41 (1993) 709.
103 Li L W, Yeo T S, Kooi P S & Leong M S, Comments on
raindrop size distribution model, IEEE Trans Antennas &
Propag (USA), 42 (1994) 1360.
104 Yeo T S, Kooi P S, Leong M S & Li L W, Tropical raindrop
size distribution for the prediction of rain attenuation of
microwaves in the 10-40 GHz band, IEEE Trans Antennas
& Propag (USA), 49 (2001) 80.
105 Jassal B S, Verma A K & Lal Singh, Influence of raindrop
size distribution and attenuation for Indian climate, Indian J
Radio & Space Phys, 23 (1994) 193.
106 Tranquilla J M & Alrizzo H M, Range errors in global
positioning system during ice-cloud and snowfall periods,
IEEE Trans Antennas & Propag (USA), 42 (1994) 157.
107 Davies O T, Howell R G & Watson P A, Measurement and
modelling of cloud attenuation at millimetre wavelengths,
Electron Lett (UK), 34 (1998) 2433.
108 Stutzman W L, Polarization in electromagnetic systems,
MA: Arctech House, Boston, 1993.
109 Allnutt J E, Satellite-to-ground radiowave propagation,
(UK: Peregrinus London) 1989.
110 Vasseur H, Degradation of availability performance in dual-
polarized satellite communications systems, IEEE Trans
Commun (USA), 48 (2000) 465.
111 Doble J, Introduction to radio propagation for fixed and
mobil communications, MA: Arctech House, Boston, 1996.
112 Hogg D C & Chu T S, The role of rainfall satellite
communications, Proc IEEE (USA), 63 (1975) 1308.
113 Lin D P & Chen H Y, Volume integral equation solution of
extinction cross section by raindrops in the range 0.6-100
GHz, IEEE Trans Antennas & Propag (USA), 49 (2001)
494.
114 Crane R K & Sheih H C, A two component rain model for
the prediction of site diversity performance, Radio Sci
(USA), 24 (1989) 641
115 Pruppacher H R & Pitter R L, A semi-emperical
determinance of the shape of cloud and raindrops, J Atmos
Sci (USA), 28 (1971) 86.
116 Li L W, Kooi P S, Leong M S & Yeo T S, On the simplified
expression of realistic raindrop shapes, Microw Opt Technol
Lett (USA), 7 (1994) 201.
117 Ippolito J, Radio wave propagation in satellite
communications (Van Nostrand Reihold Company, New
York), 1986.
118 Bhattacharya R, Calculation of the variability of the window
channel frequency near 90 GHz for four Indian stations,
Mausam (India), 56 (2005) 873.
119 Basist A, Grody N C, Peterson T C & Williams C N, Using
the special sensor microwave/imager to monitor land surface
temperatures, wetness, and snow cover, J Appl Meteorol
(USA), 37 (1998) 888.
120 Lakshmi V, Wood E F & Choudhury B J, Evaluation of
special sensor microwave/imager satellite data for regional
soil moisture estimation over the red river basin, J Appl
Meteorol (USA), 36 (1997) 1309.
121 Singh R P & Dadhwal V K, Comparison of space-based
microwave polarization difference index and normalized
difference vegetation index for crop growth monitoring,
Indian J Radio & Space Phys, 32 (2003) 193.