Embed Size (px)
Citation preview

Hoehnea 31(2): 181-188,6 tab., I fig., 2004
Variation in the contents ofmacronutrients in Ouratea spectabilis (Mart.)EngL, in area ofcerrado in Sao Paulo, Brazil
Adriana Carrha LeiHio l ,3 and Osvaldo Aulino da Silva2
Received: April 28, 2003; accepted: June 22, 2004
ABSTRACT - (Variation in the contents of macronutrients in Ouratea spectabilis (Mart.) Engl., in area of cerrado in SaoPaulo, Brazil). The present study aims to evaluate monthly the mineral nutrition presented by the population of Ourateaspectabilis (Mart.) Engl. in different phenophases, from August 1995 to July 1996, in a cerrado area at the Biological Reserveand Experimental Station of Mogi-Guar;:u, located at Mogi-Guar;:u, Sao Paulo. All the macronutrients N, P, K, Ca, Mg and Swere analyzed from leaves, branches, tlowers, green fruits and ripe fruits compartments, and from three leaf developmentalstages. The phenological study was made monthly in 20 specimens distributed in the cerrado area and the phenophases(leaftlushing, leaffall, tlowering, green and ripe fruits) were monitored quantitatively. The distribution of the nutrients in thevegetative and reproductive sampled parts revealed significant differences and a well-defined seasonal pattern, allowing toidentify the importance of each nutrient in different developmental phase of the plant, as well as suggesting about themineral translocation capacity and its nutritional status maintenance. In face of these facts, O. spectabilis shows significantefficiency in nutrient utilization, retlecting a phenological pattern that guarantees its survival in cerrado's environments.Key words: mineral nutrition, plant phenology, cerrado
RESUMO - (Variar;:ao no conteudo de macronutrientes em Ouratea spectabilis (Mart.) Engl., em area de cerrado em SaoPaulo, Brasil). 0 presente estudo visou avaliar mensalmente a compartimentar;:ao mineral em Ouratea spectabilis (Mart.)Engl. nas diferentes fenofases, no periodo de agosto de 1995 ajulho de 1996, em area de cerrado, na Reserva Biol6gica eEstar;:ao Experimental de Mogi-Guar;:u, localizado no municipio de Mogi-Guar;:u, em Sao Paulo. Foram analisados osmacronutrientes ,P, K, Ca, Mg e S nas folhas, em 3 estadios de desenvolvimento foliar, ramos, tlores e frutos. Asobservar;:6es fenol6gicas foram realizadas mensalmente em 20 especimens distribuidos na area de cerrado, sendo consideradasas fenofases brotamento, queda foliar, tlorar;:ao e fruti ficar;:ao. A distribuir;:ao dos elementos minerais nos compartimentos enos diferentes estadios de desenvolvimento foliar revelou diferenr;:as significativas e padr6es sazonais bem definidos,permitindo identificar a importancia de cada nutriente nas diferentes fases do desenvolvimento da planta, e sugerir sobre acapacidade de retranslocar;:ao destes elementos e manutenr;:ao do balanr;:o nutricional. Face a essas analises, a especieO. spectabilis comporta-se de maneira altamente eficiente na utilizar;:ao de nutrientes, retletindo em padr6es fenol6gicosque garantem a sua sobrevivencia em ambientes de cerrado.Palavras-chave: nutrir;:ao mineral, fenologia de plantas, cerrado
Introduction
The community's structure is determined by thehabits of species that developed in the area, e.g., bythe way that each species is adapted for the limitedfactors of the surroundings (Beadle 1953).
The nutritional behavior of forest trees can varylargely during its cycle; as a result of changes in themetabolism, internal transport and leaching caused bythe rain water (Guha & Mitchell 1966, Davy & Taylor1975, Ernst 1975). Plant species can develop efficientmechanisms for the maintenance of its metabolism
that guarantee its survival in adverse environments.The minerals retranslocation is a way to decrease thenutrient loss by the plants, and to assure themaintenance of metabolic activities, mainly duringnutritional stress periods (Stachurski & Zimka 1975,Melillo 1981, Staaf & Berg 1981). Rathcke & Lacey(1985) pointed out that the availability of a specificnutrient and the plant capacity in absorb it can intluencethe phenological pattern of the species.
Villela & Lacerda (1992) have found thatseasonal variation of mineral elements in Vochysiarufa and Curatella americana leaves, both species
I. Universidade Federal do Rio Grande do Norte, Departamento de Botanica, Ecologia e Zoologia, Caixa Postal 1524,59072-970 Natal,RN, Brasil.
2. Universidade Estadual PauJista, Departamento de Botanica, Rio Claro, SP, Brasil.3. Corresponding author: [email protected]
182 Hoehnea 3\ (2), 2004
ofcerrado, seems to be strongly related to the nutrientabsorption mechanisms and retranslocation of theseelements.
The analysis of leaves, branches, roots andxilopody in two species of cerrado (Byrsonimacoccoloblfolia and Kielmeyera coriacea) showeddifferences in the nutritional demand betweencompartments (Martinez et al. 1977).
Pagano et al. (1982) observed nutritionaldifferences between organs, and a great variability inconcentrations of a same nutrient in cerrado species(A nadenanthera falcata, Dalbergia miscolobium(e.g., D. violacea) and Stryphnodendronadstringens).
The knowledge about nutrients quantity in thedifferent plant organs allows to infer on metabolicdemands developed in each compartment, on supplyingbase to understand these variations and on theirimplications in the ecosystem plant responses. Fewworks relate the nutrient stock variations as a specificadaptation ofplants in taking and distributing resources,in different phenophases and in different ecosystems.
The present study evaluated the nutritionalbehavior in a typical species of cerrado, throughanalysis ofmineral variation in three leafdevelopmentalstages, branches, flowers and fruits.
Material and methods
The species were selected by some characteristicsas frequency and fitosociological importance (Gibbset al. 1983, Batista & Couto 1992) in cerradosecosystems. Ouratea spectabilis (Mart.) Engl.,Ochnaceae, is one of the most abundant species inthe study area. It is popularly known as murici-bravoor batiputa.
The study was carried out in a cerrado area atthe Biological Reserve and Experimental Station ofMogi-Guac;;u, Sao Paulo State, Southeastern Brazil(220 IS' -16'S and 470 08' -12'W). The precipitation andtemperature data of the local cl imate corresponds toCw'a of Koppen, characterized as mesothermic, drywinter, with low water deficit and water excess duringsummer (De Vuono et al. 1986). In the present studythe dry period extended from April to September, andthe rainy period from October to March.
Three individuals of 0. spectabilis were monthlyselected among twenty specimens previously chosen.Leaves, branches, flowers and fruits were collected.Different developmental leaf stages were sampledfrom the base, medium and extremity of branches.
However, it was not always possible to detect thenutrient variations expected for young and adult leave,except when these stages had significant presence inthe majority of the studied months. The sampledmaterial was dried in stove at 70 DC, till constantweight, and then ground for later mineral nutrientanalysis.
The analysis ofnitrogen, phosphorus, potassium,calcium, magnesium, and sulfur followed themethodology proposed by Malavolta et al. (1989). Foreach sample an average value was obtained fromthree repl icates.
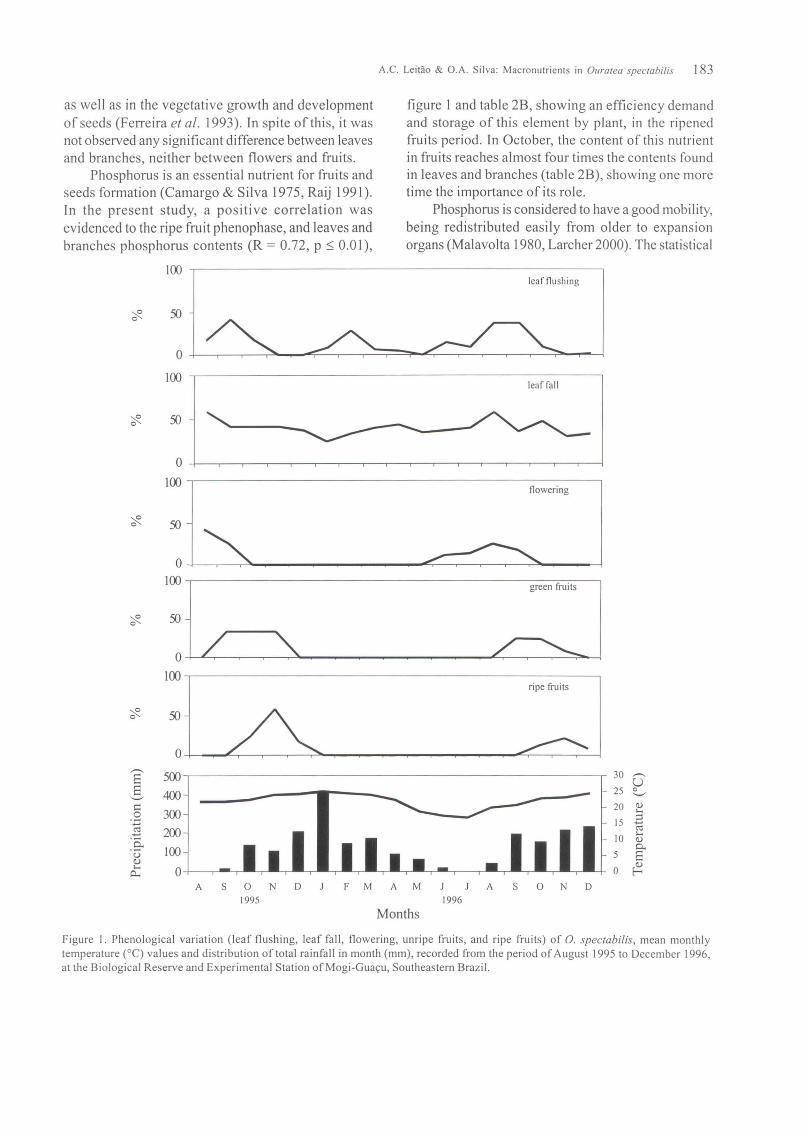
The leaf flushing, leaffall, flowering, green fruitsand ripe fruits phenophases were observed monthlyin 20 specimens of 0. spectabilis during a period ofseventeen months. The phenological information wasappraised quantitatively (Fournier 1974).
The Kruskal-Wallis Test (H), followed by theJonckheere Test (Campos 1983), was used to detectnutritional differences and seasonality between leafstages, and between leaves and branches. TheSpearman Correlation coefficients (R) (Rees 1995)were used to determine the correlation betweenphenophases presented by species and nutrients onleaves.
Results and Discussion
Many cerrado's plants develop specificcharacteristics that prevent nutrient loss through outleaf cuticle or soil by water leaching caused by rains.At the same time, it was found that the efficiency ofnutrient retranslocation contributes to maintenance ofthe nutritional status of plant.
The leafflushing peak was observed in September(figure I), when the nitrogen content was significantlyhigher in leaves of the extremity of the branches(table 1A). The nitrogen content decreases as theleaves reach the senescence (H = 69.89, p::; 0.01). Inspite of apparent efficiency in the absorption ofnitrogen, it was not observed any significant di fferencebetween leaves and branches, neither between flowersand fruits (table IB). In the same way, Medeiros &Haridasan (1985) found higher contents of nitrogen inrecent expanded leaves ofcerrado species. These canbe explained by the good mobility of nitrogen, whichcan be retranslocated from the mature leaves to thenewer leaves (Raij 199 I), as observed by Toslma et al.(1987) in leaves ofsavanna species. This nutrient hasan important role in the formation and development offlowering and fruiting buds (Coelho & Verlengia 1973),
A.C. Leitao & a.A. Silva: Macronutrients in Dura/eo spec/abilis 183
figure 1 and table 2B, showing an efficiency demandand storage of this element by plant, in the ripenedfruits period. In October, the content of this nutrientin fruits reaches almost four times the contents foundin leaves and branches (table 2B), showing one moretime the importance of its role.
Phosphorus is considered to have a good mobility,being redistributed easily from older to expansionorgans (MalavoIta 1980, Larcher 2000). The statistical
as well as in the vegetative growth and developmentof seeds (Ferreira et 01. 1993). In spite of this, it wasnot observed any significant difference between leavesand branches, neither between flowers and fruits.
Phosphorus is an essential nutrient for fruits andseeds formation (Camargo & Silva 1975, Raij 1991).In the present study, a positive correlation wasevidenced to the ripe fruit phenophase, and leaves andbranches phosphorus contents (R = 0.72, p ~ 0.01),
100 -,-----------------------~leaf flushing
nowering
green fruits
ripe fruits
leaf fall
0..-...
500 30 ..-...E uE 400 - 25 0
'-" '-"
s:: 20 Q)
0 300 .....'':;; 15 B1:l 200 ro
10.....
.S<Q)
100 0..u 5 EQ)
~.....0 00..
A S a N D F M A M J J A S a N D1995 1996
Months
0
100
~ 50
0
100
~ 50
0
~
I:J ~oL
100
~ 50
Figure 1. Phenological variation (leaf flushing, leaf fall, flowering, unripe fruits, and ripe fruits) of 0. spec/abi/is, mean monthlytemperature (0C) values and distribution of total rainfall in month (mm), recorded from the period ofAugust 1995 to December 1996,at the Biological Reserve and Experimental Station ofMogi-Guayu, Southeastern Brazil.

184 Hoehnea 3 1(2), 2004
Table IA. Nitrogen contents (g kg,l) in leaves from the extremity (Stage 1), medium (Stage 2), and base of branches (Stage 3) of0. speclabilis.
Aug Sep Oct Nov Dec Jan Feb Mar Apr May Jun Jul
Stage I 1.37 2.02 1.53 1.43 1.45 1.45 1.58 1.70 1.32 1.50 1.27 1.42Stage 2 1.12 1.40 1.53 1.48 1.43 1.37 1.45 1.58 1.35 1.50 1.43 1.27Stage 3 1.02 1.22 1.42 1.42 1.17 1.35 1.42 1.50 1.33 1.38 1.48 1.28
Table IB. Nitrogen contents (g kg'l) in leaves, branches, flowers, and fruits of 0. speclabilis.
Aug Sep Oct Nov Dec Jan Feb Mar Apr May Jun Jul
Leaves 1.17 1.55 1.49 1.44 1.35 1.39 1.48 1.59 1.33 1.46 1.39 1.32Branches 0.95 1.00 0.92 0.80 1.15 0.80 0.87 0.90 0.83 0.90 0.83 0.73Flowers 1.55 1.33Fruits 1.70 1.60 1.45
results indicated that phosphorus contents did notdiffer significantly between leaf stages analyzed, andbetween leaves and branches. However, a punctualincrease in phosphorus content became evident inleaves of the extremity of branches in September(table 2A). In this period the plant reaches its maximumproduction of new leaves (figure I). The phosphoruslevels in cerrado soils are unavailable because of thelow pH values, and high aluminum concentrations,which decreases the phosphorus availability (Goodland1971, Kamprath 1976, Volkweiss & Raij 1976). This
suggests that 0. spectabilis species is adapted to thesefield conditions, through an important mechanism ofnutritional status maintenance, which allows its survivalin such ecosystem.
The plants absorb most of potassium duringvegetative growth (Raij 1991), this mineral has afundamental role in the photosynthesis andcarbohydrates synthesis (Yamada 1987). In this study,significant differences int the potassium concentrationswere found between three leaf stages analyzed, withhigher concentrations found in younger leaves
Table 2A. Phosphorus contents (g kg'l) in leaves from the extremity (Stage I), medium (Stage 2), and base of branches (Stage 3) of0. speclabilis.
Aug Sep Oct Nov Dec Jan Feb Mar Apr May Jun Jul
Stage I 0.10 0.14 0.11 0.08 0.08 0.06 0.10 0.09 0.08 0.09 0.07 0.07Stage 2 0.07 0.07 0.08 0.08 0.08 0.06 0.09 0.08 0.08 0.09 0.07 0.08Stage 3 0.07 0.06 0.08 0.07 0.08 0.06 0.08 0.08 0.08 0.09 0.07 0.08
Table 2B. Phosphorus contents (g kg· l) in leaves, branches, flowers, and fruits of 0. speclabilis.
Aug Sep Oct Nov Dec Jan Feb Mar Apr May JUIl Jul
Leaves 0.08 0.09 0.09 0.08 0.08 0.06 0.09 0.08 0.08 0.09 0.07 0.08Branches 0.05 0.05 0.08 0.11 0.13 0.06 0.07 0.08 0.08 0.12 0.08 0.09Flowers 0.13 0.\0Fruits 0.\3 0.40 0.11
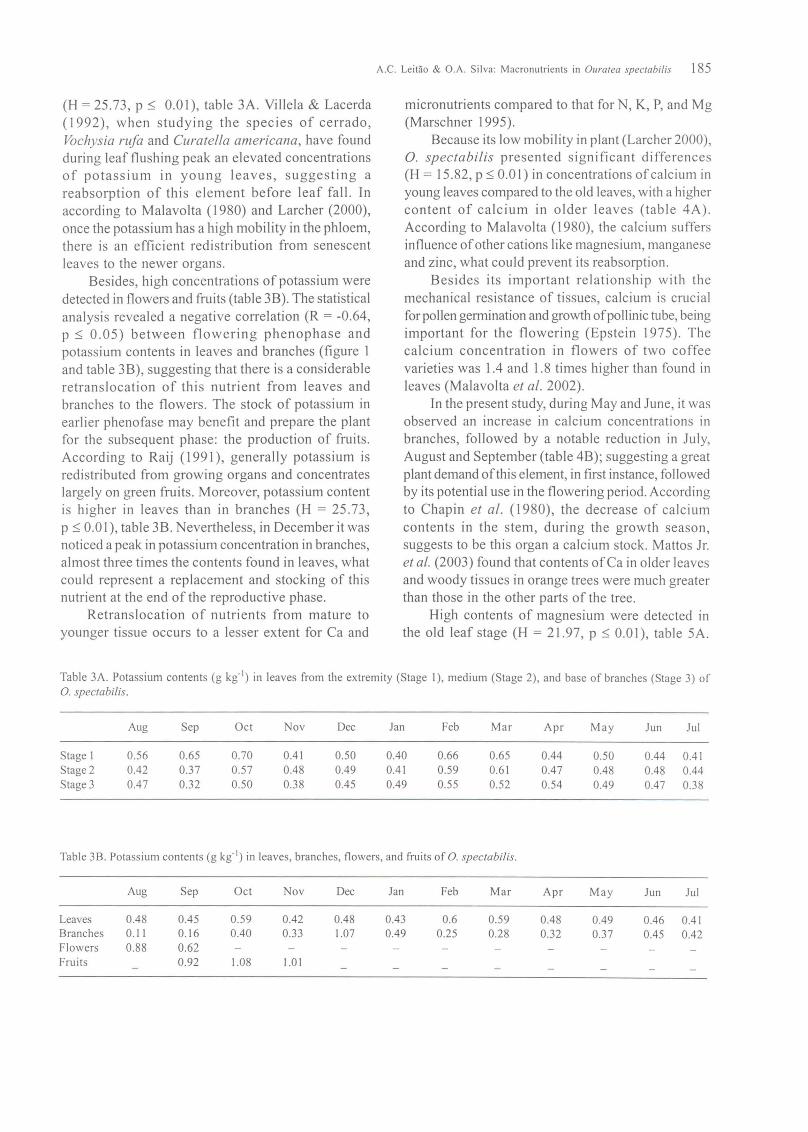
(H = 25.73, p ~ 0.01), table 3A. Villela & Lacerda(1992), when studying the species of cerrado,Vochysia rufa and Curatella americana, have foundduring leaf flushing peak an elevated concentrationsof potassium in young leaves, suggesting areabsorption of this element before leaf fall. Inaccording to Malavolta (1980) and Larcher (2000),once the potassium has a high mobility in the phloem,there is an efficient redistribution from senescentleaves to the newer organs.
Besides, high concentrations of potassium weredetected in flowers and fruits (table 3B). The statisticalanalysis revealed a negative correlation (R = -0.64,p ~ 0.05) between flowering phenophase andpotassium contents in leaves and branches (figure 1and table 3B), suggesting that there is a considerableretranslocation of this nutrient from leaves andbranches to the flowers. The stock of potassium inearlier phenofase may benefit and prepare the plantfor the subsequent phase: the production of fruits.According to Raij (1991), generally potassium isredistributed from growing organs and concentrateslargely on green fruits. Moreover, potassium contentis higher in leaves than in branches (H = 25.73,p ~ 0.0 I), table 3B. Nevertheless, in December it wasnoticed a peak in potassium concentration in branches,almost three times the contents found in leaves, whatcould represent a replacement and stocking of thisnutrient at the end of the reproductive phase.
Retranslocation of nutrients from mature toyounger tissue occurs to a lesser extent for Ca and
A.C. Leitao & a.A. Silva: Macronutrients in Oll/'alea speclabilis 185
micronutrients compared to that for N, K, P, and Mg(Marschner 1995).
Because its low mobility in plant (Larcher 2000),O. spectabilis presented significant differences(H = 15.82, P ~ 0.0 I) in concentrations of calcium inyoung leaves compared to the old leaves, with a highercontent of calcium in older leaves (table 4A).According to Malavolta (1980), the calcium suffersinfluence ofother cations like magnesium, manganeseand zinc, what could prevent its reabsorption.
Besides its important relationship with themechanical resistance of tissues, calcium is crucialfor pollen germination and growth ofpollinic tube, beingimportant for the flowering (Epstein 1975). Thecalcium concentration in flowers of two coffeevarieties was 1.4 and 1.8 times higher than found inleaves (Malavolta et al. 2002).
In the present study, during May and June, it wasobserved an increase in calcium concentrations inbranches, followed by a notable reduction in July,August and September (table 4B); suggesting a greatplant demand ofthis element, in first instance, followedby its potential use in the flowering period. Accordingto Chapin et al. (1980), the decrease of calciumcontents in the stem, during the growth season,suggests to be this organ a calcium stock. Mattos Jr.et al. (2003) found that contents ofCa in older leavesand woody tissues in orange trees were much greaterthan those in the other parts of the tree.
High contents of magnesium were detected inthe old leaf stage (H = 21.97, p ~ 0.0 I), table 5A.
Table 3A. Potassium contents (g kg· l) in leaves from the extremity (Stage I), medium (Stage 2), and base of branches (Stage 3) of
0. spectabilis.
Aug Sep Oct Nov Dec Jan Feb Mar Apr May Jun Jul
Stage 1 0.56 0.65 0.70 0.41 0.50 0.40 0.66 0.65 0.44 0.50 0.44 0.41Stage 2 0.42 0.37 0.57 0.48 0.49 0.41 0.59 0.61 0.47 0.48 0.48 0.44Stage 3 0.47 0.32 0.50 0.38 0.45 0.49 0.55 0.52 0.54 0.49 0.47 0.38
Table 3B. Potassium contents (g kg· l ) in leaves, branches, flowers, and fruits of O. spectabilis.
Aug Sep Oct Nov Dec Jan Feb Mar Apr May Jun Jul
Leaves 0.48 0.45 0.59 0.42 0.48 0.43 0.6 0.59 0.48 0.49 0.46 0.41Branches 0.11 0.16 0.40 0.33 1.07 0.49 0.25 0.28 0.32 0.37 0.45 0.42Flowers 0.88 0.62Fruits 0.92 1.08 1.0 I

186 Hoehnea 31 (2), 2004
Table 4A. Calcium contents (g kg'l) in leaves from the extremity (Stage 1), medium (Stage 2), and base of branches (Stage 3) of0. spec/obilis.
Aug Sep Oct Nov Dec Jan Feb Mar Apr May Jun Jul
Stage 1 0.37 0.30 0.42 0.42 0.44 0.71 0.49 0.52 0.53 0.55 0.68 0.59Stage 2 0.46 0.51 0.54 0.50 0.47 0.75 0.52 0.56 0.44 0.50 0.68 0.58Stage 3 0.49 0.45 0.58 0.53 0.52 0.75 0.64 0.64 0.51 0.54 0.66 0.64
Table 4B. Calcium contents (g kg,l) in leaves, branches, flowers, and fruits of 0. spec/obi/is.
Aug Sep Oct Nov Dec Jan Feb Mar Apr May Jun lui
Leaves 0.44 0.42 0.51 0.48 0.48 0.74 0.55 0.57 0.49 0.53 0.67 0.60Branches 0.43 0.45 0.78 0.75 0.79 0.80 0.52 0.82 0.81 1.02 1.18 0.75Flowers 0.17 0.38Fruits 0.24 0.15 0.16
Malavolta (1980) found in his experiments that olderleaves showed higher magnesium contents than theyounger ones. Moreover, it was evidenced that thebranches are storage organs ofthis nutrient, presentinghigher contents than leaves in the most of studiedperiod (H = 21.97, P ::; 0.0 I), table 5B, what can be acharacteristic of 0. spectabilis.
The sulfur has a fundamental role in the synthesisoffats, oils and proteins, being related to the vegetablegrowth and being very important for the fruiting(Camargo & Silva 1975). This nutrient has a lowmobility in the phloem. The accumulation sites ofsulfur
occur in seeds and leaves, more specifically in matureleaves (Larcher 2000). However, we have notdetected significant differences in sulfur contents,neither in the leaf stages (table 6A), nor in the leafand branch samples (table 6B).
In conclusion, the mineral distribution betweendifferent organs and leaf development stages, duringthe period of study, allowed to relate the nutritionalvariation to its metabolic functions, and to identify theimportance of each nutrient in the phenology, as wellas to infer about the nutrient retranslocation ability inO. spectabilis.
Table SA. Magnesium contents (g kg'l) in leaves from the extremity (Stage 1), medium (Stage 2), and base of branches (Stage 3) of0. spec/obi/is.
Aug Sep Oct Nov Dec Jan Feb Mar Apr May Jun Jul
Stage I 0.11 0.16 0.13 0.14 0.15 0.14 0.15 0.14 0.15 0.16 0.14 0.17Stage 2 0.13 0.18 0.15 0.15 0.15 0.17 0.15 0.14 0.15 0.17 0.16 0.19Stage 3 0.14 0.21 0.18 0.17 0.17 0.17 0.20 0.16 0.17 0.19 0.18 0.20
Table 5B. Magnesium contents (g kg,l) in leaves, branches, flowers, and fruits of O. spec/obi/is.
Aug Sep Oct Nov Dec Jan Feb Mar Apr May Jun Jul
Leaves 0.13 0.18 0.15 0.15 0.16 0.16 0.17 0.15 0.16 0.17 0.16 0.19Branches 0.09 0.15 0.23 0.26 0.24 0.22 0.17 0.19 0.24 0.27 0.26 0.21Flowers 0.11 0.17Fruits 0.15 0.13 0.11

A.C. Leitao & a.A. Silva: Macronutrients in Ouro/eo spec/obi/is 187
Table 6A. Sulfur contents (g kg'l) in leaves from the extremity (Stage 1), medium (Stage 2), and base of branches (Stage 3) of0. spec/obi/is.
Aug Sep Oct Nov Dec Jan Feb Mar Apr May Jun Jul
Stage 1 0.11 0.10 0.11 0.13 0.10 0.11 0.09 0.08 0.10 0.11 0.13 0.10Stage 2 0.10 0.09 0.09 0.14 0.10 0.09 0.09 0.09 0.09 0.11 0.12 0.09Stage 3 0.10 0.09 0.09 0.13 0.09 0.09 0.09 0.10 0.09 0.10 0.11 0.09
Table 6B. Sulfur contents (g kg'l) in leaves, branches, flowers, and fruits of 0. spec/abi/is.
Aug Sep Oct Nov Dec Jan Feb Mar Apr May Jun Jul
Leaves 0.10 0.09 0.10 0.13 0.10 0.10 0.09 0.09 0.09 0.11 0.12 0.09Branches 0.08 0.07 0.10 0.13 0.11 0.09 0.07 0.D7 0.11 0.09 0.12 0.08Flowers 0.10 0.12Fruits 0.11 0.09 0.10
Acknowledgments
We thank Benedito Domingues do Amaral, for thehelp in the statistical analyses; "Instituto de Botanica"(Sao Paulo), for allowing the access to the BiologicalReserve and Experimental Station of Mogi-Guayu andCNPq (Conselho Nacional de DesenvolvimentoCientifico e TecnoI6gico), for the fellowship.
Literature cited
Batista, E.A. & Couto, H.T.Z. 1992. Influencia de fatoresquimicos do solo sobre 0 desenvolvimento das especiesflorestais mais importantes do cerrado da ReservaBiol6gica de Mogi-Guayu, SP. Revista do InstitutoFlorestal4: 324-329.
Beadle, N.C.M. 1953. The edaphic factor in plant ecologywith a special note on soil phosphates. Ecology 34:426-428.
Camargo, P.N. & Silva, O. 1975. Manual de adubayao foliar.Herba, Sao Paulo, 258 p.
Campos, H. 1983. Estatistica experimental nao-parametrica.4 ed. ESALQ/USP, Piracicaba, 349 p.
Chapin, F.S., Johnson, D. A. & Mckendrick, J. D. 1980.Seasonal movement of nutrients in plants of differinggrowth form in a Alaskan tundra ecosystem: implicationfor herbivory. Journal of Ecology 68: 189-209.
Coelho, F.S. & Verlengia, F. 1973. Fertilidade do solo. InstitutoCampineiro de Ensino Agricola, Campinas, 384 p.
Davy, A.J. & Taylor, K. 1975. Seasonal changes in theinorganic nutrient concentrations in Deschampsiacaespi/osa (L.) Beauv. in relation to its tolerance ofcontrasting soils in the Chiltern Hills. Journal ofEcology63: 27-39.
De Vuono, Y.S., Batista, E.A. & Funari, F.L. 1986. Balanyohidrico da Reserva Biol6gica de Mogi-Guayu, SP.Hoehnea 13: 73-85.
Epstein, E. 1975. Nutriyao mineral das plantas: principios eperspectivas. EDUSP, Sao Paulo, 344 p.
Ernst, W. 1975. Variation in the mineral contents of leavesof trees in Miombo Woodland in south central Africa.Journal of Ecology 63: 801-807.
Ferreira, M.E., Castellane, P.O. & Cruz, M.C.P. 1993.Nutriyao e adubayao de hortaliyas. AssociayaoBrasileira para Pesquisa da Potassa e do Fosfato,Piracicaba, 480 p.
Fournier, L.A. 1974. Un metodo cuantitativo para lamedici6n de caracteristicas fenol6gicas en arboles.Turrialba 24: 422-423.
Gibbs, P.E., Leitao Filho, H.F. & Shepherd, G 1983. Floristiccomposition and community structure in an area ofcerrado in SE Brazil. Flora 173: 433-449.
Goodland, R 1971. Oligotrofismo e aluminio no cerrado. [n:
M.G. Ferri (coord.). 3° Simp6sio sobre 0 Cerrado, EDUSP,Editora Edgard BlUcher, Sao Paulo, pp. 44-60.
Guha, M.M. & Mitchell, RL. 1966. The trace and majorelement composition of the leaves of somedeciduous trees. I\. Seasonal changes. Plant andSoi124: 90-112.
Kamprath, E.J. 1977. Phosphorus fixation and availabilityin highly weathered soils. In: M.G. Ferri (coord.). 4°Simp6sio sobre 0 Cerrado, EDUSP, Editora Itatiaia Uda,Sao Paulo, Belo Horizonte, pp. 333-347.
Larcher, W. 2000. Ecofisiologia Vegetal. RiMa Artes eTextos, Sao Carlos, 53 I p.
Malavolta, E. 1980. Elementos de nutriyao mineral deplantas. Agronomica Ceres, Sao Paulo, 251 p.
188 Hoehnea 31 (2), 2004
Malavolta, E., Vitti, Gc. & Oliveira, S.A. 1989. Avaliayaodo estado nutricional das plantas: principios eaplicayoes. Associayao Brasileira para Pesquisa daPotassa e do Fosfato, Piracicaba, 20 I p.
Malavolta, E., Favarin, J.L., Malavolta, M., Cabral, c.P.,Heinrichs, R & Silveira, J.S.M. 2002. Repartiyao denutrientes nos ramos, folhas e flares do cafeeiro.Pesquisa Agropecmiria Brasileira 37: 1018-1022.
Marschner, H. 1995. Mineral nutrition of higher plants.2.ed. Academic Press, San Diego, 889p.
Martinez, H.E., Pitelli, RA. & Haag, H.P. 1977. Nutriyaomineral de especies do cerrado. I. Composiyao quimicade Byrsonima cocc%bifolia (Sp) kunth e Kielmeyeracoriacea (Sp) Mart. Anais da Escola Superior deAgricultura Luiz de Queiroz 34: 415-426.
Mattos Junior, D., Quaggio, J.A., Cantarella, H. & Alva,A.K. 2003. Nutrient content of biomass componentsof Hamlin sweet orange trees. Scientia Agricola 60:155-160.
Medeiros, RA. & Haridasan, M. 1985. Seasonal variationsin the foliar concentrations of nutrients in somealuminium accumulating and non-accumulating speciesof the cerrado region ofcentral Brazil. Plant and Soi188:433-436.
Melillo, J.O. 1981. Nitrogen cycling in deciduous forest.Ecological Bulletin 33: 427-442.
Pagano, S.N., Cesar, O. & Santos, P.S. 1982.Compartimentayao de nutrientes em 6rgaos vegetativosaereos em tres especies de leguminosas numecossistema de cerrado. Silvicultura em Sao Paulo l6-A:536-543.
Raij, B. 1991. Fertilidade do solo e adubayao. AssociayaoBrasileira para Pesquisa da Potassa e do Fosfato,Agron6mica Ceres, Piracicaba, Sao Paulo, 343 p.
Rathcke, B. & Lacey, E.P. 1985. Phenological patterns ofterrestrial plants. Annual Review Ecology andSystematics 16: 179-214.
Rees, D.G. 1995. Essential statistics. Chapman & Hall,London, 265 p.
Staaf, H. & Berg, B. 1981. Plant litter imput to soil. EcologicalBulletin 33: 147-162.
Stachurski, A. & Zimka, J.R 1975. Methods of studyingforest ecosystems: leaf area, leaf production, andwithdrawal of nutrients from leaves of trees. EkologiyaPolska23: 637-648.
Tolsma, D.J., Ernst, W.H.O., Verweij, RA. & Vooijs, R1987. Seasonal variation of nutrient concentrations in asemi-arid savanna ecosystem in Botswana. Journal ofEcology 75: 755-770.
Villela, D.M. & Lacerda, L.D. 1992. Dinamica deelementos minerais em folhas de duas especiesarb6reas de cerrado. Revista Brasileira de Biologia52: 151-160.
Volkweiss, S.J. & Raij, B. 1977. Retenyao e.disponibilidadede f6sforo em solos. In: M.G. Ferri (coord.). 4° Simp6siosabre a Cerrado, EDUSP, Editora Itatiaia Uda., SaoPaulo, Bela Horizonte, pp. 317-332.
Yamada, T. 1987. Potassio: dinamica e disponibilidade nosolo. In: EM. Fernandes & v'M. Nascimento (eds.).Curso de atualizayao em fertilidade do solo. FundayaoCargill, Campinas, pp. 183-205.