Embed Size (px)
Citation preview
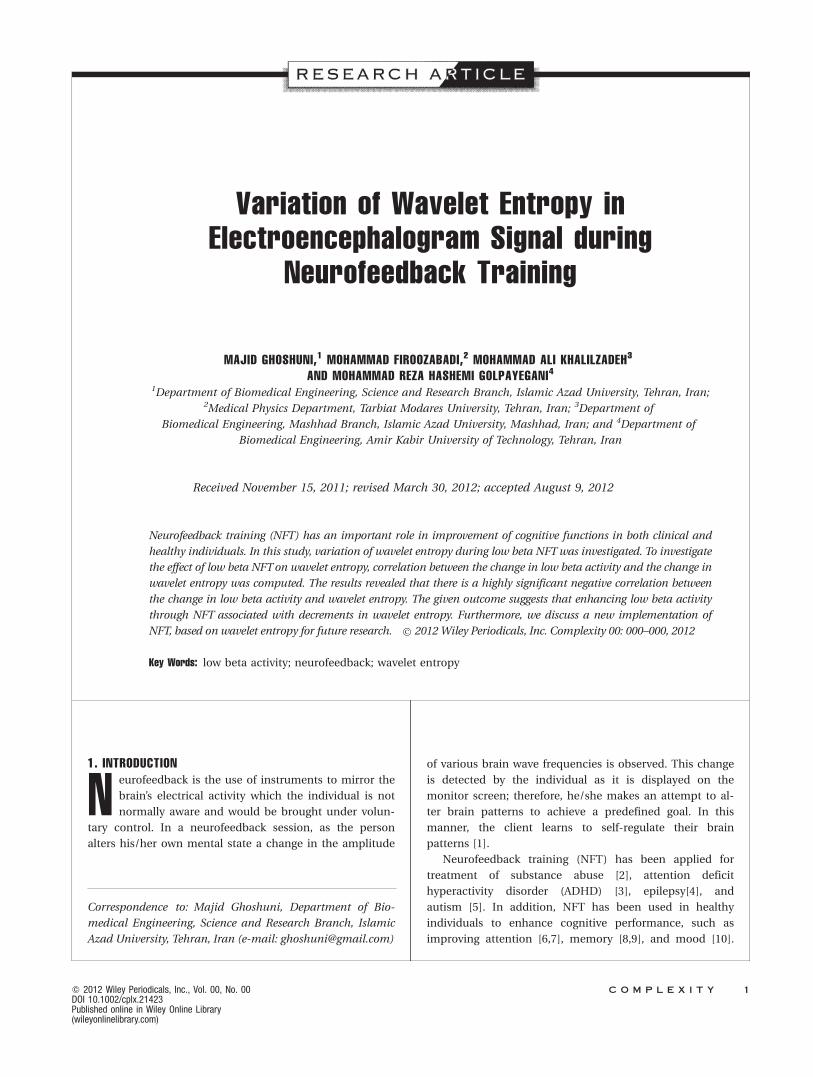
Variation of Wavelet Entropy inElectroencephalogram Signal during
Neurofeedback Training
MAJID GHOSHUNI,1 MOHAMMAD FIROOZABADI,2 MOHAMMAD ALI KHALILZADEH3
AND MOHAMMAD REZA HASHEMI GOLPAYEGANI41Department of Biomedical Engineering, Science and Research Branch, Islamic Azad University, Tehran, Iran;
2Medical Physics Department, Tarbiat Modares University, Tehran, Iran; 3Department of
Biomedical Engineering, Mashhad Branch, Islamic Azad University, Mashhad, Iran; and 4Department of
Biomedical Engineering, Amir Kabir University of Technology, Tehran, Iran
Received November 15, 2011; revised March 30, 2012; accepted August 9, 2012
Neurofeedback training (NFT) has an important role in improvement of cognitive functions in both clinical and
healthy individuals. In this study, variation of wavelet entropy during low beta NFTwas investigated. To investigate
the effect of low beta NFTon wavelet entropy, correlation between the change in low beta activity and the change in
wavelet entropy was computed. The results revealed that there is a highly significant negative correlation between
the change in low beta activity and wavelet entropy. The given outcome suggests that enhancing low beta activity
through NFT associated with decrements in wavelet entropy. Furthermore, we discuss a new implementation of
NFT, based on wavelet entropy for future research. � 2012 Wiley Periodicals, Inc. Complexity 00: 000–000, 2012
Key Words: low beta activity; neurofeedback; wavelet entropy
1. INTRODUCTION
Neurofeedback is the use of instruments to mirror the
brain’s electrical activity which the individual is not
normally aware and would be brought under volun-
tary control. In a neurofeedback session, as the person
alters his/her own mental state a change in the amplitude
of various brain wave frequencies is observed. This change
is detected by the individual as it is displayed on the
monitor screen; therefore, he/she makes an attempt to al-
ter brain patterns to achieve a predefined goal. In this
manner, the client learns to self-regulate their brain
patterns [1].
Neurofeedback training (NFT) has been applied for
treatment of substance abuse [2], attention deficit
hyperactivity disorder (ADHD) [3], epilepsy[4], and
autism [5]. In addition, NFT has been used in healthy
individuals to enhance cognitive performance, such as
improving attention [6,7], memory [8,9], and mood [10].
Correspondence to: Majid Ghoshuni, Department of Bio-
medical Engineering, Science and Research Branch, Islamic
Azad University, Tehran, Iran (e-mail: [email protected])
Q 2012 Wiley Periodicals, Inc., Vol. 00, No. 00 C O M P L E X I T Y 1
DOI 10.1002/cplx.21423Published online in Wiley Online Library(wileyonlinelibrary.com)
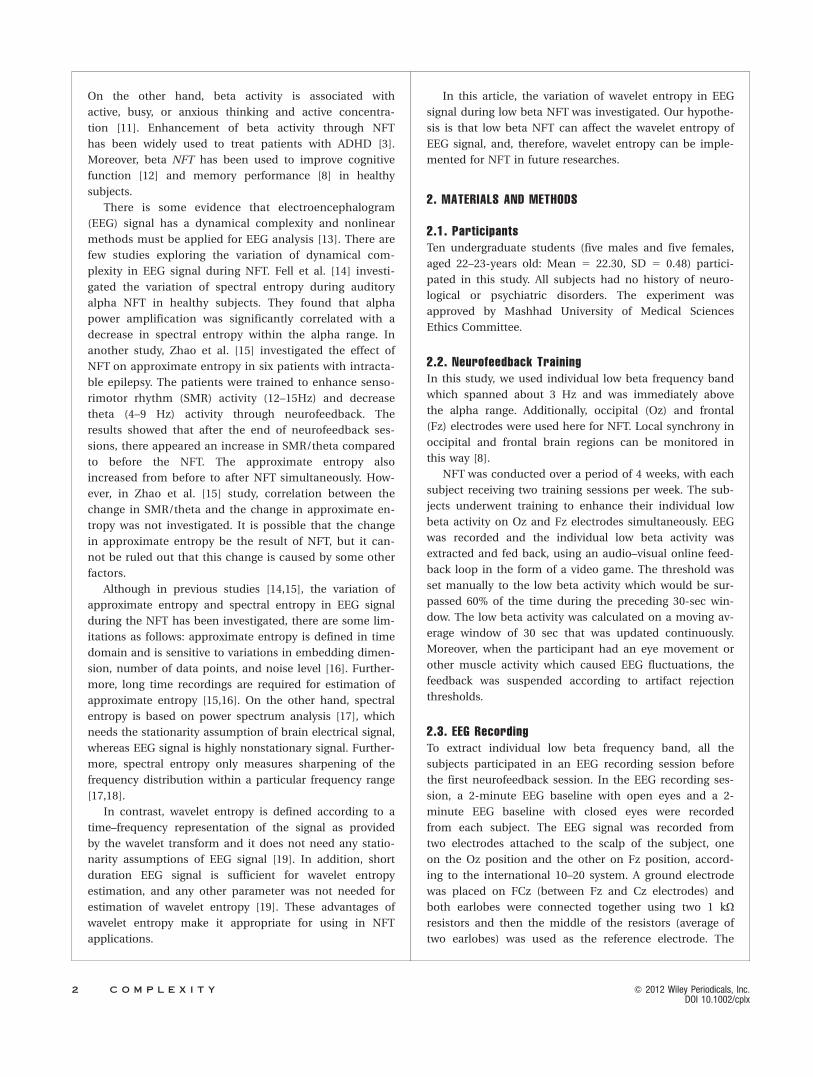
On the other hand, beta activity is associated with
active, busy, or anxious thinking and active concentra-
tion [11]. Enhancement of beta activity through NFT
has been widely used to treat patients with ADHD [3].
Moreover, beta NFT has been used to improve cognitive
function [12] and memory performance [8] in healthy
subjects.
There is some evidence that electroencephalogram
(EEG) signal has a dynamical complexity and nonlinear
methods must be applied for EEG analysis [13]. There are
few studies exploring the variation of dynamical com-
plexity in EEG signal during NFT. Fell et al. [14] investi-
gated the variation of spectral entropy during auditory
alpha NFT in healthy subjects. They found that alpha
power amplification was significantly correlated with a
decrease in spectral entropy within the alpha range. In
another study, Zhao et al. [15] investigated the effect of
NFT on approximate entropy in six patients with intracta-
ble epilepsy. The patients were trained to enhance senso-
rimotor rhythm (SMR) activity (12–15Hz) and decrease
theta (4–9 Hz) activity through neurofeedback. The
results showed that after the end of neurofeedback ses-
sions, there appeared an increase in SMR/theta compared
to before the NFT. The approximate entropy also
increased from before to after NFT simultaneously. How-
ever, in Zhao et al. [15] study, correlation between the
change in SMR/theta and the change in approximate en-
tropy was not investigated. It is possible that the change
in approximate entropy be the result of NFT, but it can-
not be ruled out that this change is caused by some other
factors.
Although in previous studies [14,15], the variation of
approximate entropy and spectral entropy in EEG signal
during the NFT has been investigated, there are some lim-
itations as follows: approximate entropy is defined in time
domain and is sensitive to variations in embedding dimen-
sion, number of data points, and noise level [16]. Further-
more, long time recordings are required for estimation of
approximate entropy [15,16]. On the other hand, spectral
entropy is based on power spectrum analysis [17], which
needs the stationarity assumption of brain electrical signal,
whereas EEG signal is highly nonstationary signal. Further-
more, spectral entropy only measures sharpening of the
frequency distribution within a particular frequency range
[17,18].
In contrast, wavelet entropy is defined according to a
time–frequency representation of the signal as provided
by the wavelet transform and it does not need any statio-
narity assumptions of EEG signal [19]. In addition, short
duration EEG signal is sufficient for wavelet entropy
estimation, and any other parameter was not needed for
estimation of wavelet entropy [19]. These advantages of
wavelet entropy make it appropriate for using in NFT
applications.
In this article, the variation of wavelet entropy in EEG
signal during low beta NFT was investigated. Our hypothe-
sis is that low beta NFT can affect the wavelet entropy of
EEG signal, and, therefore, wavelet entropy can be imple-
mented for NFT in future researches.
2. MATERIALS AND METHODS
2.1. ParticipantsTen undergraduate students (five males and five females,
aged 22–23-years old: Mean 5 22.30, SD 5 0.48) partici-
pated in this study. All subjects had no history of neuro-
logical or psychiatric disorders. The experiment was
approved by Mashhad University of Medical Sciences
Ethics Committee.
2.2. Neurofeedback TrainingIn this study, we used individual low beta frequency band
which spanned about 3 Hz and was immediately above
the alpha range. Additionally, occipital (Oz) and frontal
(Fz) electrodes were used here for NFT. Local synchrony in
occipital and frontal brain regions can be monitored in
this way [8].
NFT was conducted over a period of 4 weeks, with each
subject receiving two training sessions per week. The sub-
jects underwent training to enhance their individual low
beta activity on Oz and Fz electrodes simultaneously. EEG
was recorded and the individual low beta activity was
extracted and fed back, using an audio–visual online feed-
back loop in the form of a video game. The threshold was
set manually to the low beta activity which would be sur-
passed 60% of the time during the preceding 30-sec win-
dow. The low beta activity was calculated on a moving av-
erage window of 30 sec that was updated continuously.
Moreover, when the participant had an eye movement or
other muscle activity which caused EEG fluctuations, the
feedback was suspended according to artifact rejection
thresholds.
2.3. EEG RecordingTo extract individual low beta frequency band, all the
subjects participated in an EEG recording session before
the first neurofeedback session. In the EEG recording ses-
sion, a 2-minute EEG baseline with open eyes and a 2-
minute EEG baseline with closed eyes were recorded
from each subject. The EEG signal was recorded from
two electrodes attached to the scalp of the subject, one
on the Oz position and the other on Fz position, accord-
ing to the international 10–20 system. A ground electrode
was placed on FCz (between Fz and Cz electrodes) and
both earlobes were connected together using two 1 kX
resistors and then the middle of the resistors (average of
two earlobes) was used as the reference electrode. The
2 C O M P L E X I T Y Q 2012 Wiley Periodicals, Inc.DOI 10.1002/cplx
electrode impedances were also kept below 10 kX. For
EEG recording, the FlexComp (Thought Technology Ltd.)
differential amplifier was used. Acquired signal was
amplified and filtered with an analog elliptic band pass
filter ranging from 0.1 to 64 Hz. Furthermore, a 50-Hz
notch filter was enabled. Sampling frequency was 256 Hz
and A to D precision was 14 bit.
2.4. ProcedureThe subjects first participated in an EEG recording session
through which their individual low beta frequency band
was extracted. On the next level, they completed eight
NFT sessions over a 4-week period. Each NFT session con-
sisted of three 5-minute segments of NFT, while each seg-
ment was followed by a 2-minute ‘‘blink break.’’
2.5. EEG Analysis
2.5.1. Power Spectrum Density
The power spectrum density (PSD) of EEG baselines was
estimated from each subject to extract individual low beta
band. The PSD of EEG signals was approximated by means
of Welch’s averaged modified periodogram [20] with 2-sec
epochs (0.5-Hz frequency resolution), 50% overlap, and a
Hanning window. The PSD of EEG baselines in both open
and closed-eye conditions were computed. Then, individ-
ual alpha peak (IAP) frequency was calculated for each
subject according to the formula:
IAP ¼
Pf 2
f¼f 1
Pðf Þ3f
Pf 2
f¼f 1
Pðf Þ(1)
where P(f) is the PSD estimate of closed eyes EEG baseline
at frequency f and the index of summation is in the range
of f1–f2. The frequency window f1–f2 was the range of
alpha peak which was determined individually for each
subject. For determining the frequency window f1–f2, the
PSD of EEG baseline was plotted with open and closed
eyes together. By visual inspection, the bandwidth of the
frequency window f1–f2 was determined. f1 marks the be-
ginning of the ‘‘ascent’’ and f2 the end of the ‘‘descent’’ of
the alpha peak for closed eyes PSD, compared to open
eyes PSD. After computing IAP for each subject, we
defined IAP-2 Hz to IAP12 Hz as an individual alpha fre-
quency band and IAP12 Hz to IAP15 Hz as an individual
low beta frequency band. These definitions were used
because in traditional EEG frequency bands, low beta (12–
15 Hz) frequency band mostly lies after alpha (8–12 Hz)
frequency band.
Amplitude of EEG signal recorded in a particular sub-
ject depends on many factors including neurophysiologi-
cal, anatomical, and physical properties of the brain, sur-
rounding tissues, and electrode impedances [21]. These
parameters vary from one subject to another and resulted
in large variations in absolute PSD of EEG signal. To com-
pensate for these variations, relative EEG power was com-
puted and used in subsequent analysis. Relative power
was computed based on the following formula:
Prðf Þ ¼ Paðf ÞPPaðfiÞ
(2)
where Pr(f) is a relative power at frequency f, Pa(f) is an
absolute PSD at the same frequency, andP
is a sum of
the power over the all bandwidth.
2.5.2. Wavelet Entropy
Wavelet entropy is defined according to a time–frequency
representation of the signal as provided by the wavelet
transform [19]. In this study, a multiresolution decomposi-
tion [22] was performed by applying a discrete wavelet
transform (DWT). Quadratic B-Spline function was used as
a mother wavelet. In the previous studies [23–26], this
function has been used for short duration brain electrical
signals.
The algorithm, which was used for estimating wavelet
entropy, closely resembled the algorithm used in the study
of Rosso et al. [19]. The EEG signal of three 5-minute seg-
ments in each NFT session was decomposed into five lev-
els by DWT. Six sets of coefficients (including residual
scale) within the following frequency bands were obtained;
64–128 Hz (j 5 21), 32–64 Hz (j 5 22), 16–32 Hz (j 5
23), 8–16 Hz (j 5 24), 4–8 Hz (j 5 25), and the residues
in the 0.1–4 Hz (r 5 25). To simplify the notation, we rep-
resent the coefficients of the residue by j 5 26 instead of
r 5 25. The coefficients within 64–128 Hz (j 5 21) has
been removed in the subsequent analysis, because the
coefficients within this range have been filtered and do
not have any useful information. After decomposing the
EEG signal, the coefficients of each resolution level j were
divided in nonoverlapping temporal windows of length
equal to 1 sec of the EEG signal. The mean wavelet energy
at resolution level j for each time window i was computed
according to the formula:
EðiÞj ¼ 1
Nj
Xi:Nj
k¼ði�1ÞNjþ1
CjðkÞ�� ��2 i ¼ 1; 2; . . . ;NT (3)
where Cj represents wavelet coefficients at resolution level
j, Nj represents the number of wavelet coefficients at reso-
Q 2012 Wiley Periodicals, Inc. C O M P L E X I T Y 3
DOI 10.1002/cplx
lution level j included in the time interval i, and NT repre-
sents the number of time windows. Then, the total mean
energy at this time window would be:
EðiÞtot ¼
X
j<0
EðiÞj (4)
The time evolution of the relative wavelet energy was
computed as:
pðiÞj ¼
EðiÞj
EðiÞtot
(5)
and the time evolution of wavelet entropy would be given
by:
WEðiÞ ¼ �X
j<0
pðiÞj lnðpðiÞ
j Þ (6)
To obtain a quantifier for the whole time period, the tem-
poral average was evaluated. The temporal average of
wavelet entropy was given by:
WEh i ¼ 1
NT
XNT
i¼1
WEðiÞ (7)
3. RESULTSThe mean IAP for all subjects was obtained 9.89 6 0.46
Hz. Therefore, the mean value of individual low beta fre-
quency band was 11.89–14.89 Hz. To see whether NFT has
been successful in increasing low beta band amplitudes,
the average relative low beta power of three 5-minute
segments in the first and last neurofeedback sessions were
computed. Two-way repeated measures analysis of var-
iance (ANOVA) was performed using two within subject
factors: ‘‘Electrode’’ (two levels: Fz/Oz) and ‘‘Session’’ (two
levels: first neurofeedback session/last neurofeedback ses-
sion). Results showed a significant main effect of Electrode
(F(1,29) 5 10.33, P < 0.01), Session (F(1,29) 5 5.87, P <
0.05) and Electrode 3 Session interaction (F(1,29) 5 5.75,
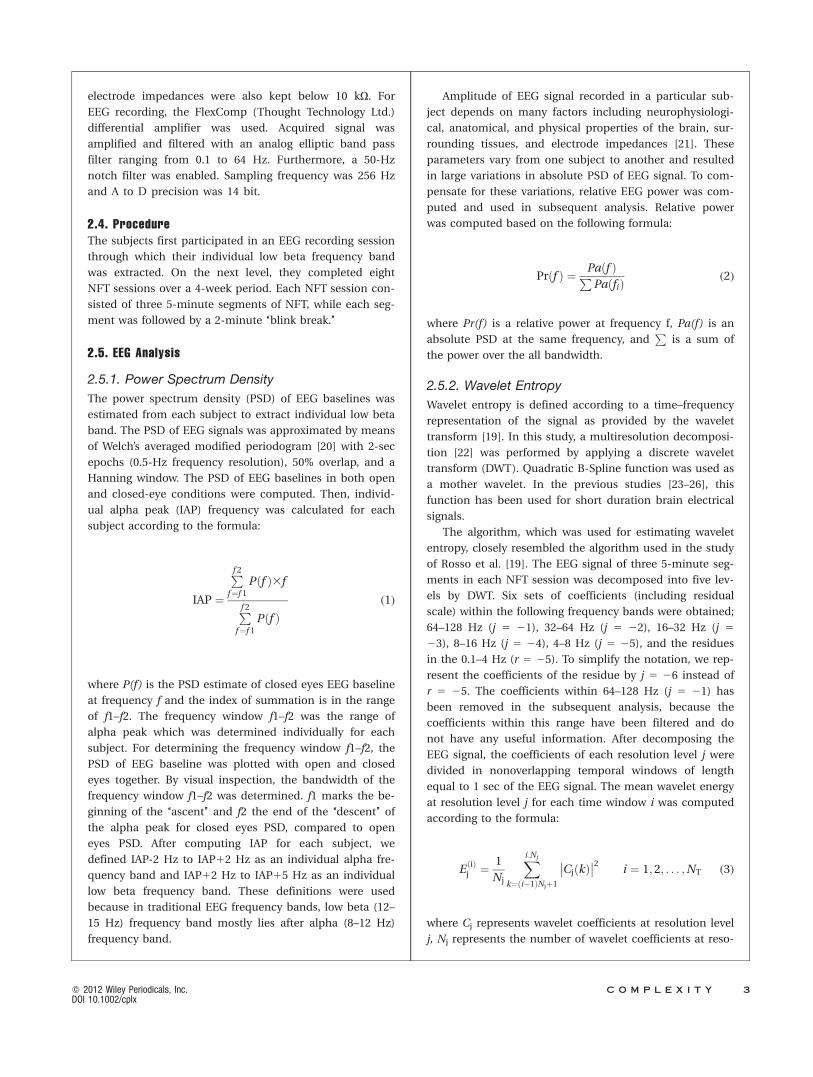
P < 0.05). In Figure 1, relative low beta power of the first
and last neurofeedback sessions on Fz and Oz electrodes
was shown. As can be seen from Figure 1, relative low
beta power was increased from the first to the last session
especially on Fz electrode.
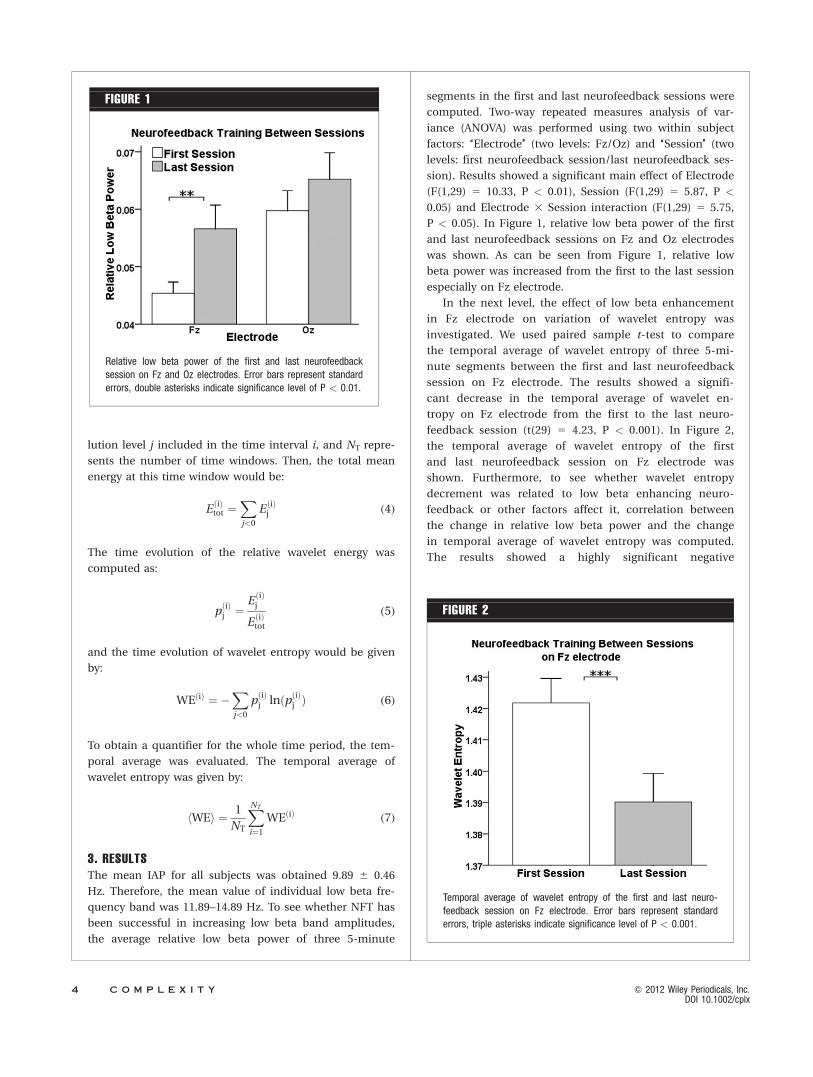
In the next level, the effect of low beta enhancement
in Fz electrode on variation of wavelet entropy was
investigated. We used paired sample t-test to compare
the temporal average of wavelet entropy of three 5-mi-
nute segments between the first and last neurofeedback
session on Fz electrode. The results showed a signifi-
cant decrease in the temporal average of wavelet en-
tropy on Fz electrode from the first to the last neuro-
feedback session (t(29) 5 4.23, P < 0.001). In Figure 2,
the temporal average of wavelet entropy of the first
and last neurofeedback session on Fz electrode was
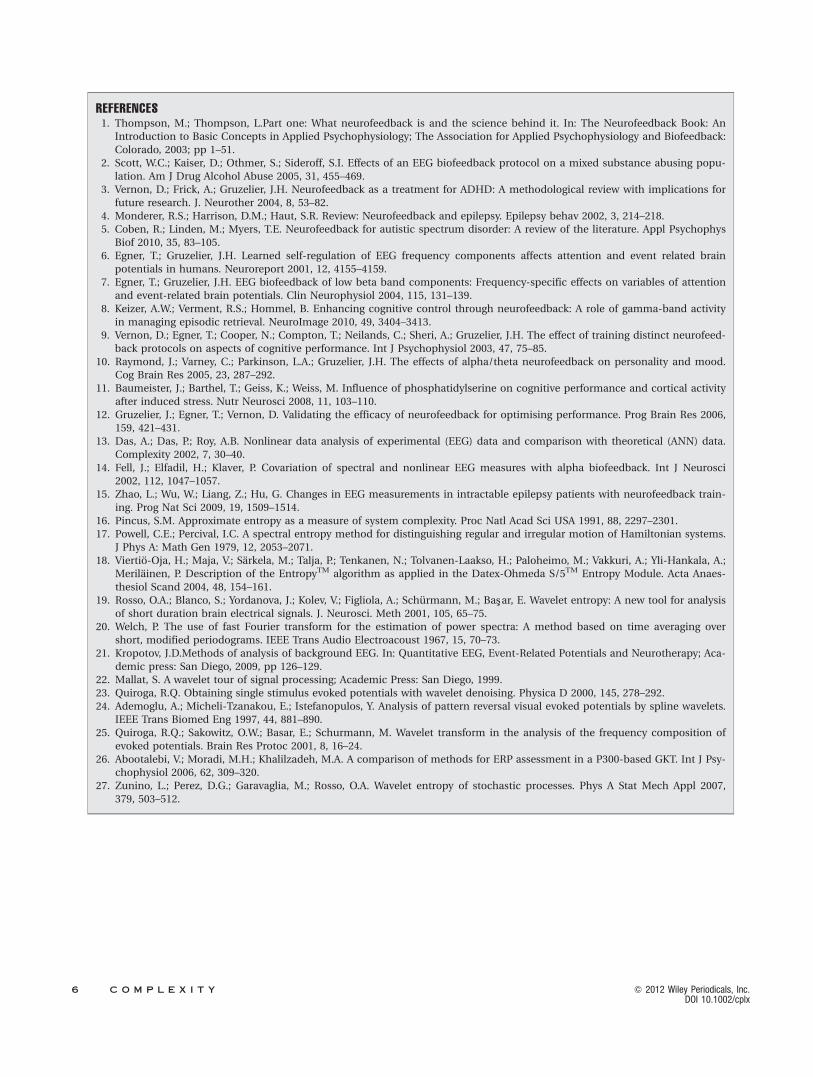
shown. Furthermore, to see whether wavelet entropy
decrement was related to low beta enhancing neuro-
feedback or other factors affect it, correlation between
the change in relative low beta power and the change
in temporal average of wavelet entropy was computed.
The results showed a highly significant negative
FIGURE 1
Relative low beta power of the first and last neurofeedbacksession on Fz and Oz electrodes. Error bars represent standarderrors, double asterisks indicate significance level of P < 0.01.
FIGURE 2
Temporal average of wavelet entropy of the first and last neuro-feedback session on Fz electrode. Error bars represent standarderrors, triple asterisks indicate significance level of P < 0.001.
4 C O M P L E X I T Y Q 2012 Wiley Periodicals, Inc.DOI 10.1002/cplx
correlation between the change in relative low beta
power and the change in the temporal average of wave-
let entropy on Fz electrode, r 5 20.72, P < 0.00001
(two-tailed; Figure 3).
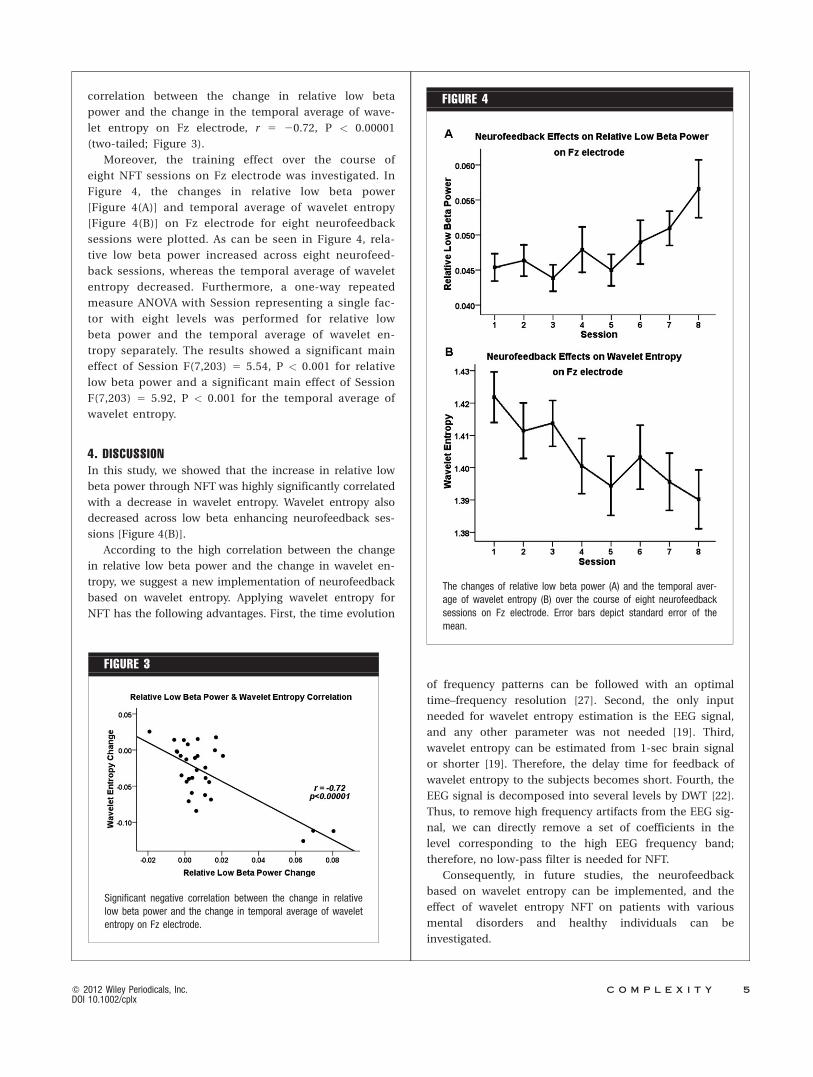
Moreover, the training effect over the course of
eight NFT sessions on Fz electrode was investigated. In
Figure 4, the changes in relative low beta power
[Figure 4(A)] and temporal average of wavelet entropy
[Figure 4(B)] on Fz electrode for eight neurofeedback
sessions were plotted. As can be seen in Figure 4, rela-
tive low beta power increased across eight neurofeed-
back sessions, whereas the temporal average of wavelet
entropy decreased. Furthermore, a one-way repeated
measure ANOVA with Session representing a single fac-
tor with eight levels was performed for relative low
beta power and the temporal average of wavelet en-
tropy separately. The results showed a significant main
effect of Session F(7,203) 5 5.54, P < 0.001 for relative
low beta power and a significant main effect of Session
F(7,203) 5 5.92, P < 0.001 for the temporal average of
wavelet entropy.
4. DISCUSSIONIn this study, we showed that the increase in relative low
beta power through NFT was highly significantly correlated
with a decrease in wavelet entropy. Wavelet entropy also
decreased across low beta enhancing neurofeedback ses-
sions [Figure 4(B)].
According to the high correlation between the change
in relative low beta power and the change in wavelet en-
tropy, we suggest a new implementation of neurofeedback
based on wavelet entropy. Applying wavelet entropy for
NFT has the following advantages. First, the time evolution
of frequency patterns can be followed with an optimal
time–frequency resolution [27]. Second, the only input
needed for wavelet entropy estimation is the EEG signal,
and any other parameter was not needed [19]. Third,
wavelet entropy can be estimated from 1-sec brain signal
or shorter [19]. Therefore, the delay time for feedback of
wavelet entropy to the subjects becomes short. Fourth, the
EEG signal is decomposed into several levels by DWT [22].
Thus, to remove high frequency artifacts from the EEG sig-
nal, we can directly remove a set of coefficients in the
level corresponding to the high EEG frequency band;
therefore, no low-pass filter is needed for NFT.
Consequently, in future studies, the neurofeedback
based on wavelet entropy can be implemented, and the
effect of wavelet entropy NFT on patients with various
mental disorders and healthy individuals can be
investigated.
FIGURE 3
Significant negative correlation between the change in relativelow beta power and the change in temporal average of waveletentropy on Fz electrode.
FIGURE 4
The changes of relative low beta power (A) and the temporal aver-age of wavelet entropy (B) over the course of eight neurofeedbacksessions on Fz electrode. Error bars depict standard error of themean.
Q 2012 Wiley Periodicals, Inc. C O M P L E X I T Y 5
DOI 10.1002/cplx
REFERENCES1. Thompson, M.; Thompson, L.Part one: What neurofeedback is and the science behind it. In: The Neurofeedback Book: An
Introduction to Basic Concepts in Applied Psychophysiology; The Association for Applied Psychophysiology and Biofeedback:
Colorado, 2003; pp 1–51.
2. Scott, W.C.; Kaiser, D.; Othmer, S.; Sideroff, S.I. Effects of an EEG biofeedback protocol on a mixed substance abusing popu-
lation. Am J Drug Alcohol Abuse 2005, 31, 455–469.
3. Vernon, D.; Frick, A.; Gruzelier, J.H. Neurofeedback as a treatment for ADHD: A methodological review with implications for
future research. J. Neurother 2004, 8, 53–82.
4. Monderer, R.S.; Harrison, D.M.; Haut, S.R. Review: Neurofeedback and epilepsy. Epilepsy behav 2002, 3, 214–218.
5. Coben, R.; Linden, M.; Myers, T.E. Neurofeedback for autistic spectrum disorder: A review of the literature. Appl Psychophys
Biof 2010, 35, 83–105.
6. Egner, T.; Gruzelier, J.H. Learned self-regulation of EEG frequency components affects attention and event related brain
potentials in humans. Neuroreport 2001, 12, 4155–4159.
7. Egner, T.; Gruzelier, J.H. EEG biofeedback of low beta band components: Frequency-specific effects on variables of attention
and event-related brain potentials. Clin Neurophysiol 2004, 115, 131–139.
8. Keizer, A.W.; Verment, R.S.; Hommel, B. Enhancing cognitive control through neurofeedback: A role of gamma-band activity
in managing episodic retrieval. NeuroImage 2010, 49, 3404–3413.
9. Vernon, D.; Egner, T.; Cooper, N.; Compton, T.; Neilands, C.; Sheri, A.; Gruzelier, J.H. The effect of training distinct neurofeed-
back protocols on aspects of cognitive performance. Int J Psychophysiol 2003, 47, 75–85.
10. Raymond, J.; Varney, C.; Parkinson, L.A.; Gruzelier, J.H. The effects of alpha/theta neurofeedback on personality and mood.
Cog Brain Res 2005, 23, 287–292.
11. Baumeister, J.; Barthel, T.; Geiss, K.; Weiss, M. Influence of phosphatidylserine on cognitive performance and cortical activity
after induced stress. Nutr Neurosci 2008, 11, 103–110.
12. Gruzelier, J.; Egner, T.; Vernon, D. Validating the efficacy of neurofeedback for optimising performance. Prog Brain Res 2006,
159, 421–431.
13. Das, A.; Das, P.; Roy, A.B. Nonlinear data analysis of experimental (EEG) data and comparison with theoretical (ANN) data.
Complexity 2002, 7, 30–40.
14. Fell, J.; Elfadil, H.; Klaver, P. Covariation of spectral and nonlinear EEG measures with alpha biofeedback. Int J Neurosci
2002, 112, 1047–1057.
15. Zhao, L.; Wu, W.; Liang, Z.; Hu, G. Changes in EEG measurements in intractable epilepsy patients with neurofeedback train-
ing. Prog Nat Sci 2009, 19, 1509–1514.
16. Pincus, S.M. Approximate entropy as a measure of system complexity. Proc Natl Acad Sci USA 1991, 88, 2297–2301.
17. Powell, C.E.; Percival, I.C. A spectral entropy method for distinguishing regular and irregular motion of Hamiltonian systems.
J Phys A: Math Gen 1979, 12, 2053–2071.
18. Viertio-Oja, H.; Maja, V.; Sarkela, M.; Talja, P.; Tenkanen, N.; Tolvanen-Laakso, H.; Paloheimo, M.; Vakkuri, A.; Yli-Hankala, A.;
Merilainen, P. Description of the EntropyTM algorithm as applied in the Datex-Ohmeda S/5TM Entropy Module. Acta Anaes-
thesiol Scand 2004, 48, 154–161.
19. Rosso, O.A.; Blanco, S.; Yordanova, J.; Kolev, V.; Figliola, A.; Schurmann, M.; Bas�ar, E. Wavelet entropy: A new tool for analysis
of short duration brain electrical signals. J. Neurosci. Meth 2001, 105, 65–75.
20. Welch, P. The use of fast Fourier transform for the estimation of power spectra: A method based on time averaging over
short, modified periodograms. IEEE Trans Audio Electroacoust 1967, 15, 70–73.
21. Kropotov, J.D.Methods of analysis of background EEG. In: Quantitative EEG, Event-Related Potentials and Neurotherapy; Aca-
demic press: San Diego, 2009, pp 126–129.
22. Mallat, S. A wavelet tour of signal processing; Academic Press: San Diego, 1999.
23. Quiroga, R.Q. Obtaining single stimulus evoked potentials with wavelet denoising. Physica D 2000, 145, 278–292.
24. Ademoglu, A.; Micheli-Tzanakou, E.; Istefanopulos, Y. Analysis of pattern reversal visual evoked potentials by spline wavelets.
IEEE Trans Biomed Eng 1997, 44, 881–890.
25. Quiroga, R.Q.; Sakowitz, O.W.; Basar, E.; Schurmann, M. Wavelet transform in the analysis of the frequency composition of
evoked potentials. Brain Res Protoc 2001, 8, 16–24.
26. Abootalebi, V.; Moradi, M.H.; Khalilzadeh, M.A. A comparison of methods for ERP assessment in a P300-based GKT. Int J Psy-
chophysiol 2006, 62, 309–320.
27. Zunino, L.; Perez, D.G.; Garavaglia, M.; Rosso, O.A. Wavelet entropy of stochastic processes. Phys A Stat Mech Appl 2007,
379, 503–512.
6 C O M P L E X I T Y Q 2012 Wiley Periodicals, Inc.DOI 10.1002/cplx