Embed Size (px)
Citation preview
Costs and Benefits of Labour Mobility between the EU and the Eastern Partnership Partner Countries
Country report: Moldova Vasile Cantarji Georgeta Mincu
EuropeAid/130215/C/SER/Multi

January 7, 2013
This country study is part of the project entitled “Costs and Benefits of Labour Mobility between the EU and the Eastern Partner Partnership Countries” for the European Commission (Contract No. 2011/270-312, tender procedure EuropeAid/130215/C/SER/Multi). The study was conducted under the direction of Luca Barbone, CASE project director.
The views expressed in this paper are those of the authors, and should not be interpreted as representing the
official position of the European Commission and its institutions
Costs and Benefits of Labour Mobility between the EU and the Eastern Partnership Partner Countries
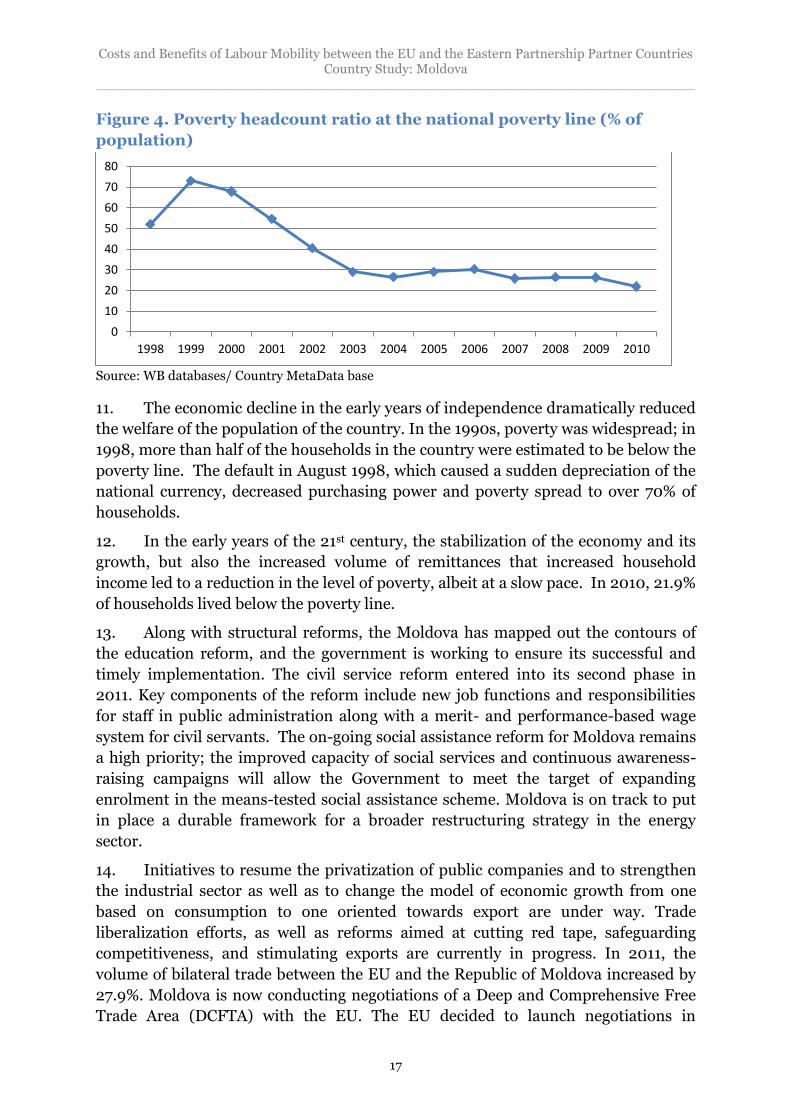
MOLDOVA COUNTRY STUDY
Vasile Cantarji
Georgeta Mincu
Chisnau
Tom Coupe
Hanna Vakhitova
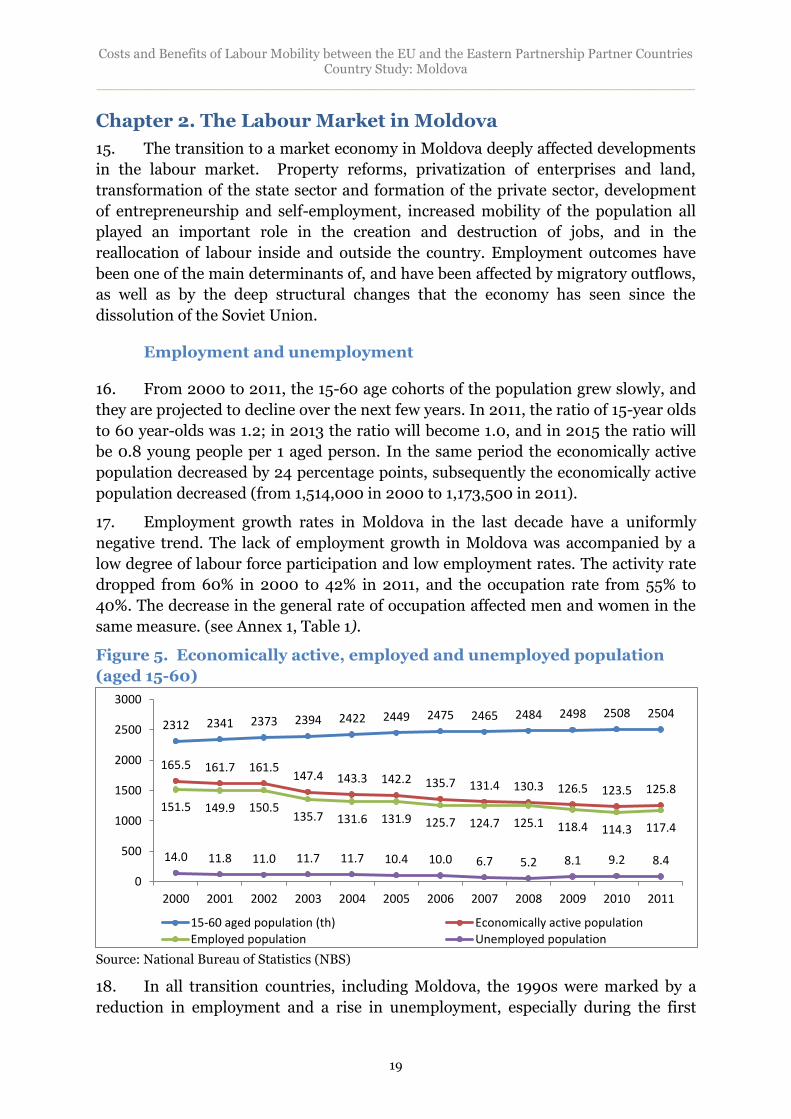
Kyiv-2012
Costs and Benefits of Labour Mobility between the EU and the Eastern Partnership Partner Countries Country Study: Moldova
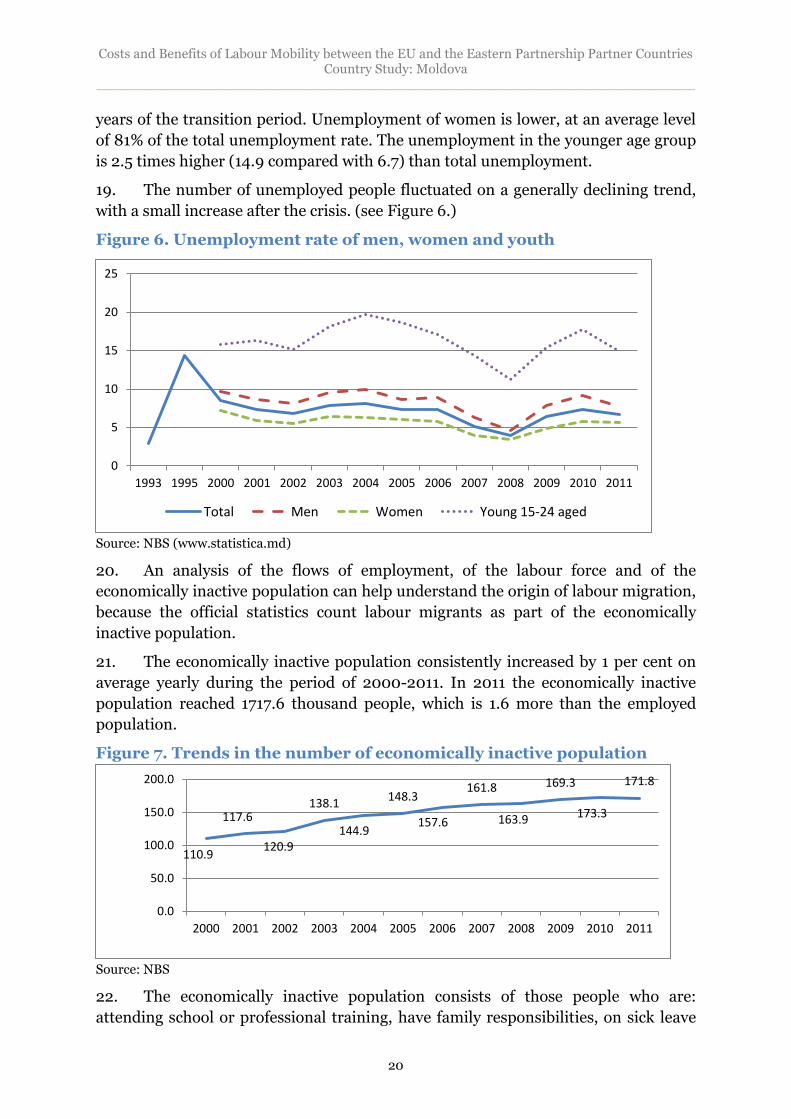
______________________________________________________________________
2
Contents
List of figures .......................................................................................... 4
List of tables ........................................................................................... 6
List of boxes ............................................................................................ 6
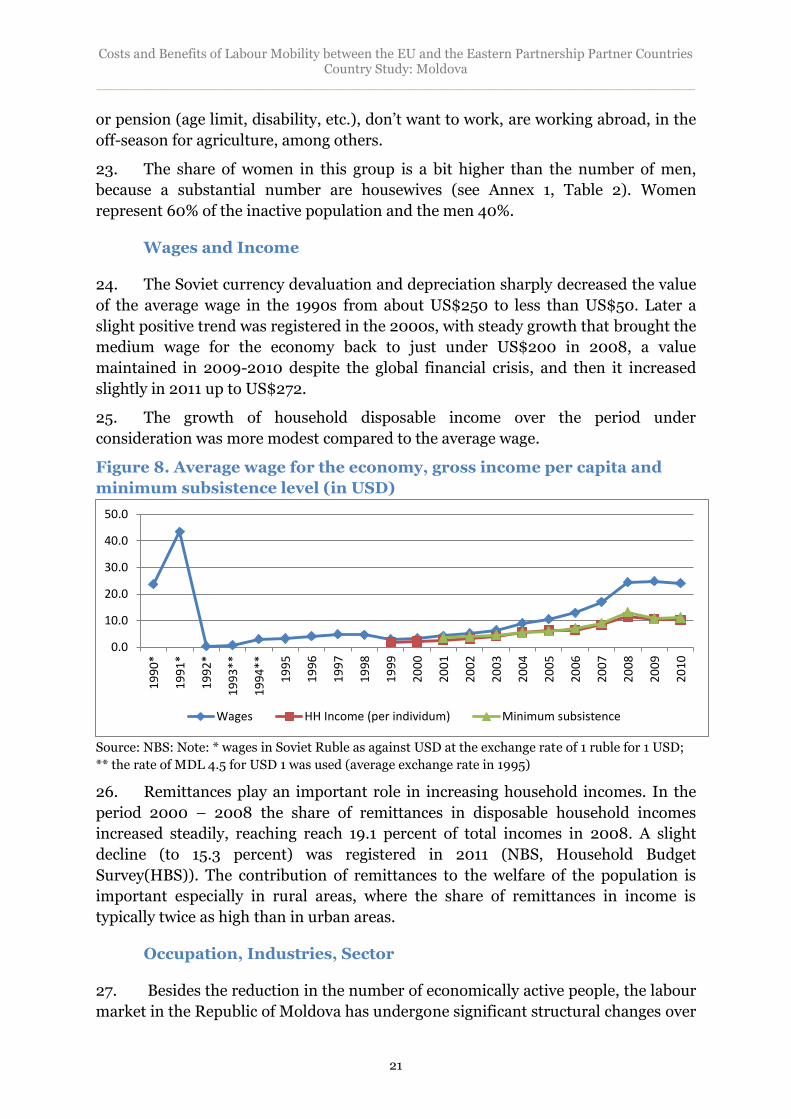
Abbreviations and Acronyms .................................................................. 7
Executive Summary ............................................................................... 8 Migration as a Response to Economic Hardship ................................................................... 8
Has migration been good for Moldova? ................................................................................ 8
Enhancing the development potential of migration in Moldova: an agenda ...................... 10
Introduction ......................................................................................... 12
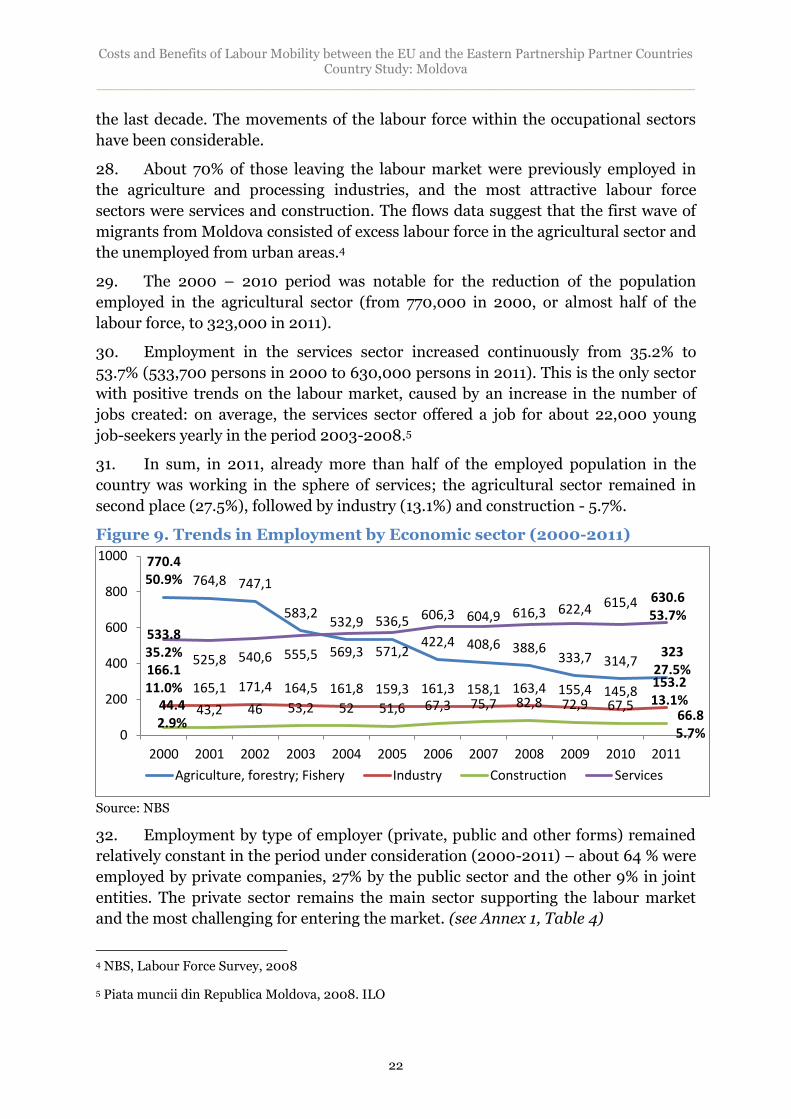
Chapter 1. Background: The Moldovan Economy after Independence ... 14 Deep Crisis and Recovery, 1990-2012 ................................................................................. 14
Chapter 2. The Labour Market in Moldova ............................................ 19 Employment and unemployment ........................................................................................ 19
Wages and Income ............................................................................................................... 21
Occupation, Industries, Sector ............................................................................................ 21
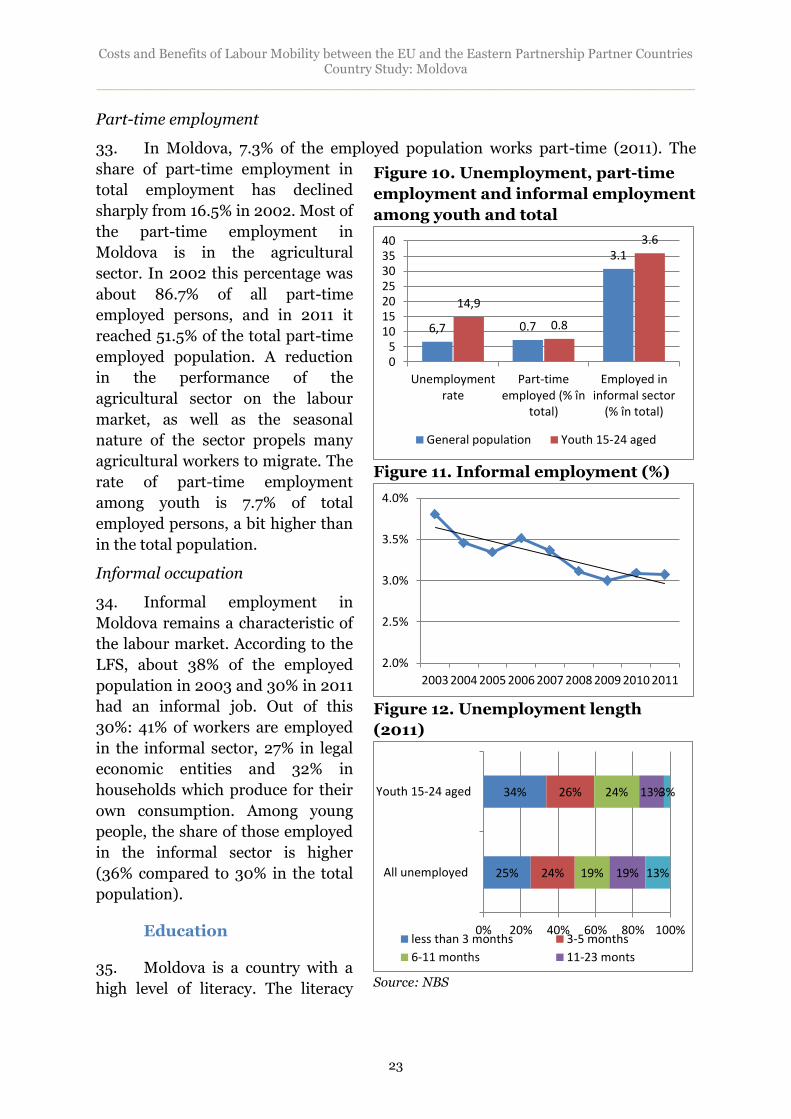
Education ............................................................................................................................. 23
Poverty, income distribution and the working poor ............................................................ 24
Chapter 3.Labour Migration: Trends and Profile .................................. 26 History and trends in migration .......................................................................................... 26
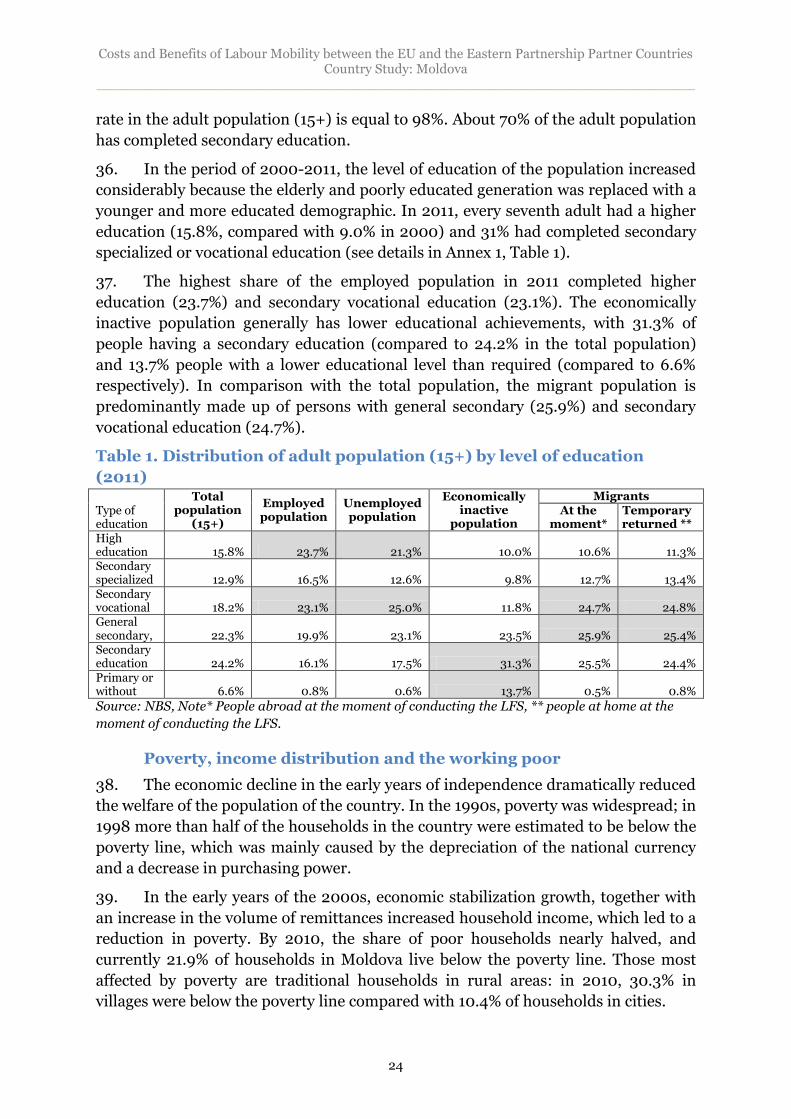
Number of labour migrants ................................................................................................. 26
Type of migration by duration ............................................................................................. 28
Reasons and causes of migration ......................................................................................... 31
Features of migrant profiles ................................................................................................ 32
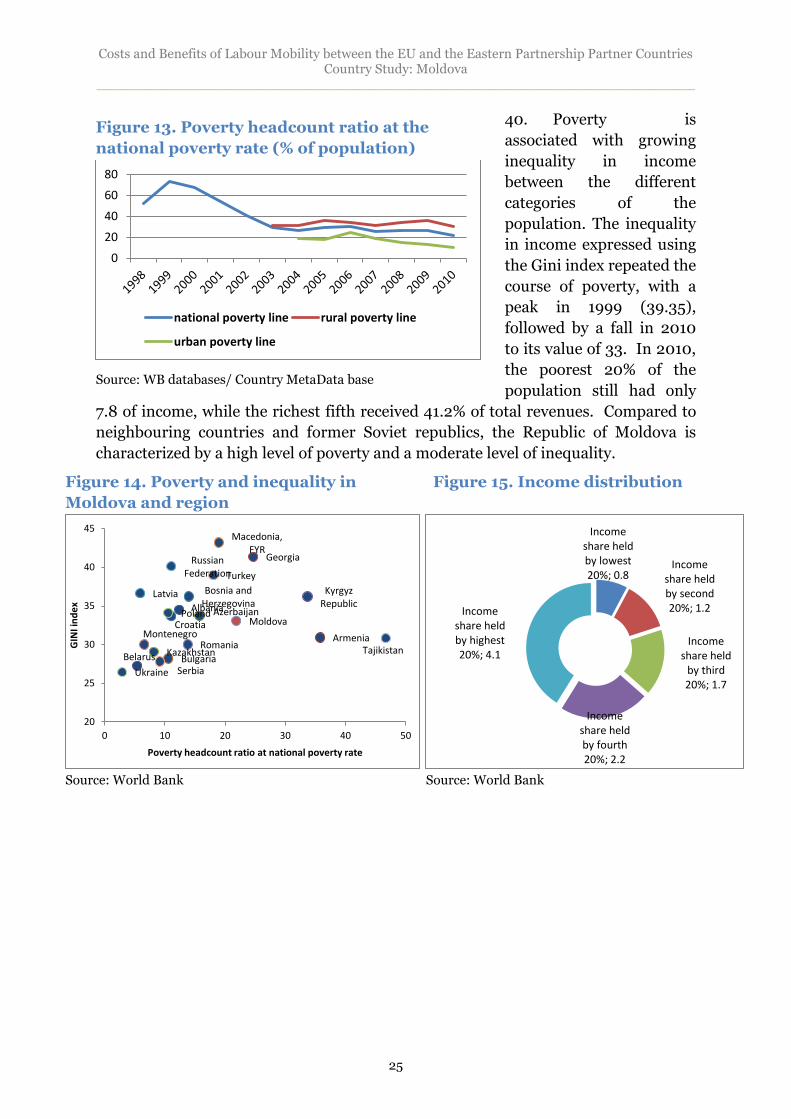
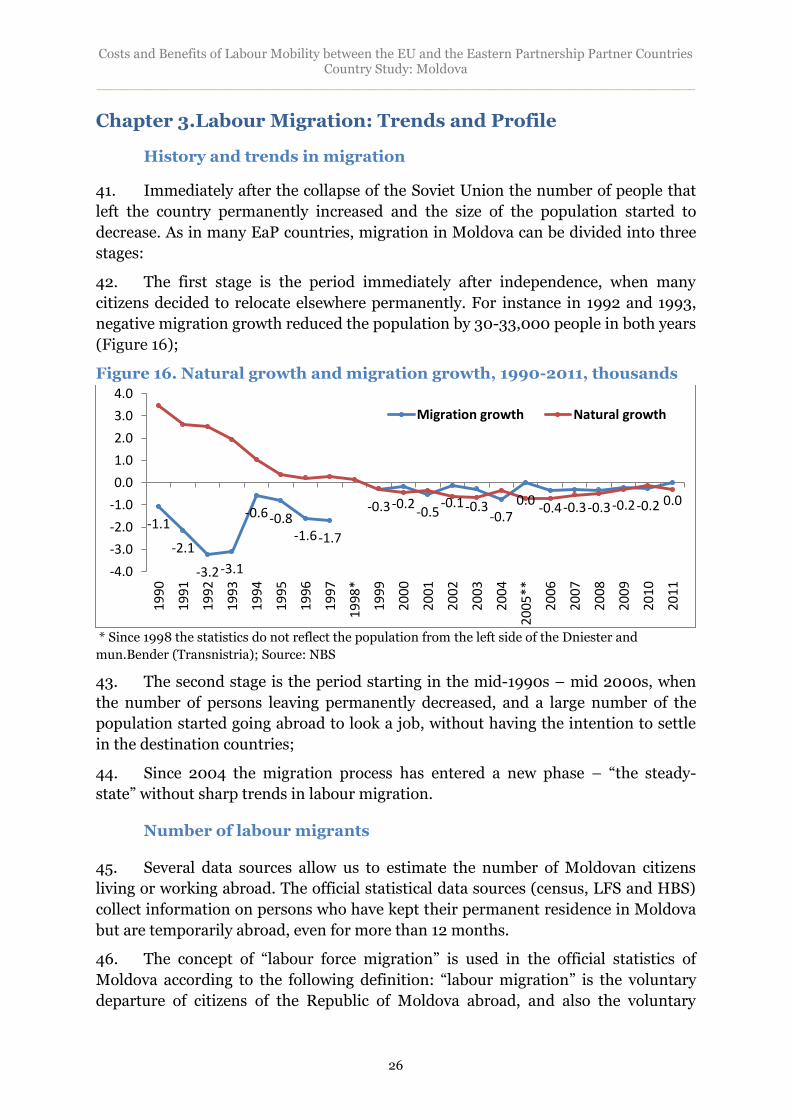
Intentions of Migrants ......................................................................................................... 37
Future Trends of Migration ................................................................................................. 38
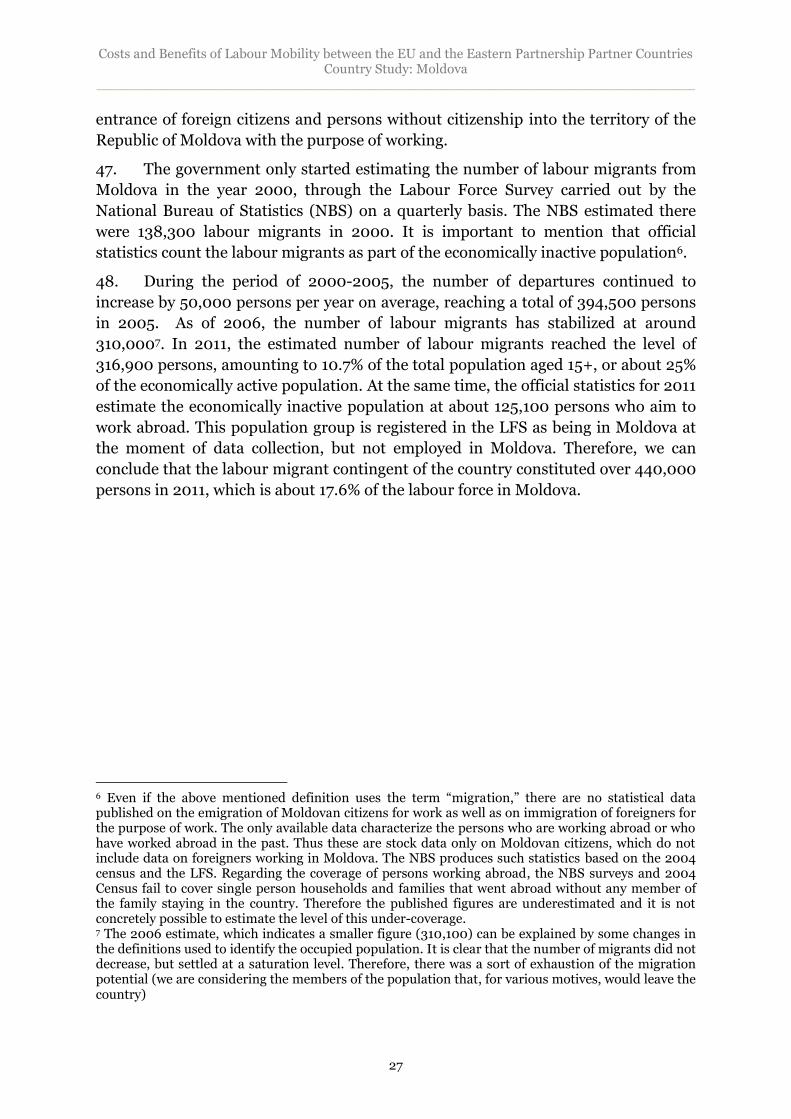
Impact of migration on the local labour market .................................................................. 39
Chapter 4. Remittances ......................................................................... 42 Trends of transfer flows by natural persons ........................................................................ 42
Remittances consumption patterns ..................................................................................... 44
Effect of remittances on income of households ................................................................... 45
Chapter 5. Costs and Benefits of Migration ...........................................48 Economic costs and benefits ................................................................................................ 48
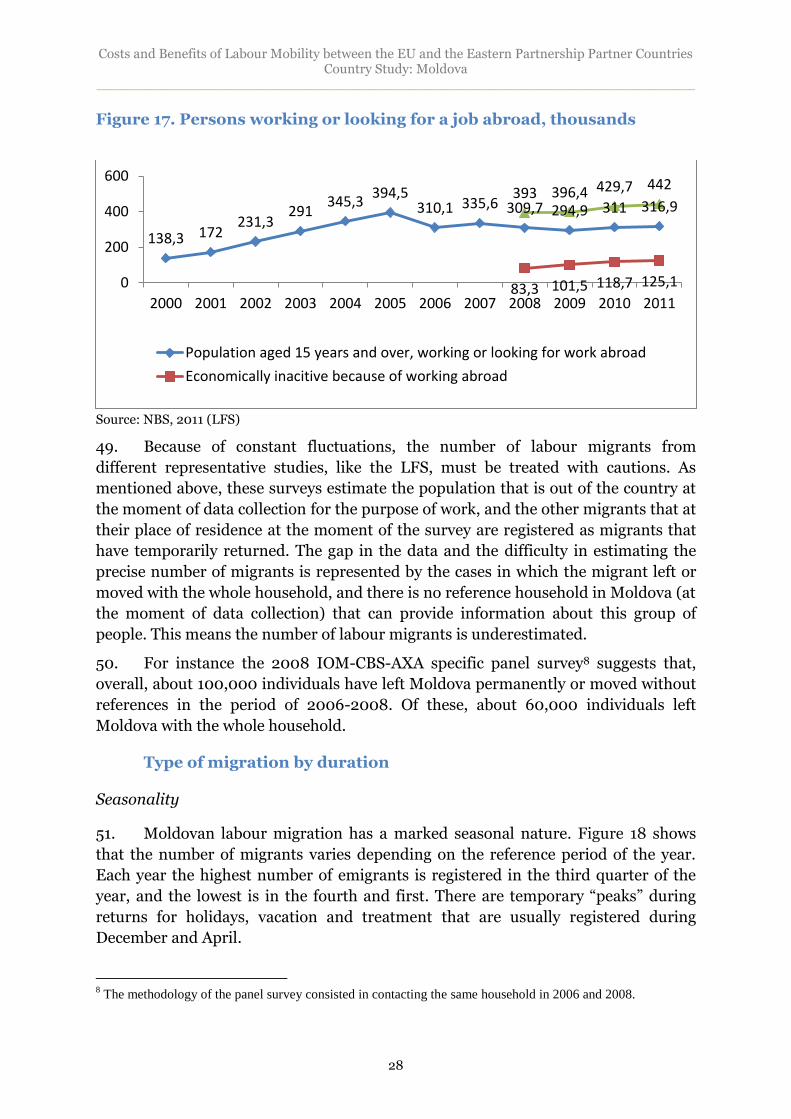
Social costs and benefits ...................................................................................................... 55
Demographic costs and consequences ................................................................................ 59
Costs and Benefits of Labour Mobility between the EU and the Eastern Partnership Partner Countries Country Study: Moldova
______________________________________________________________________
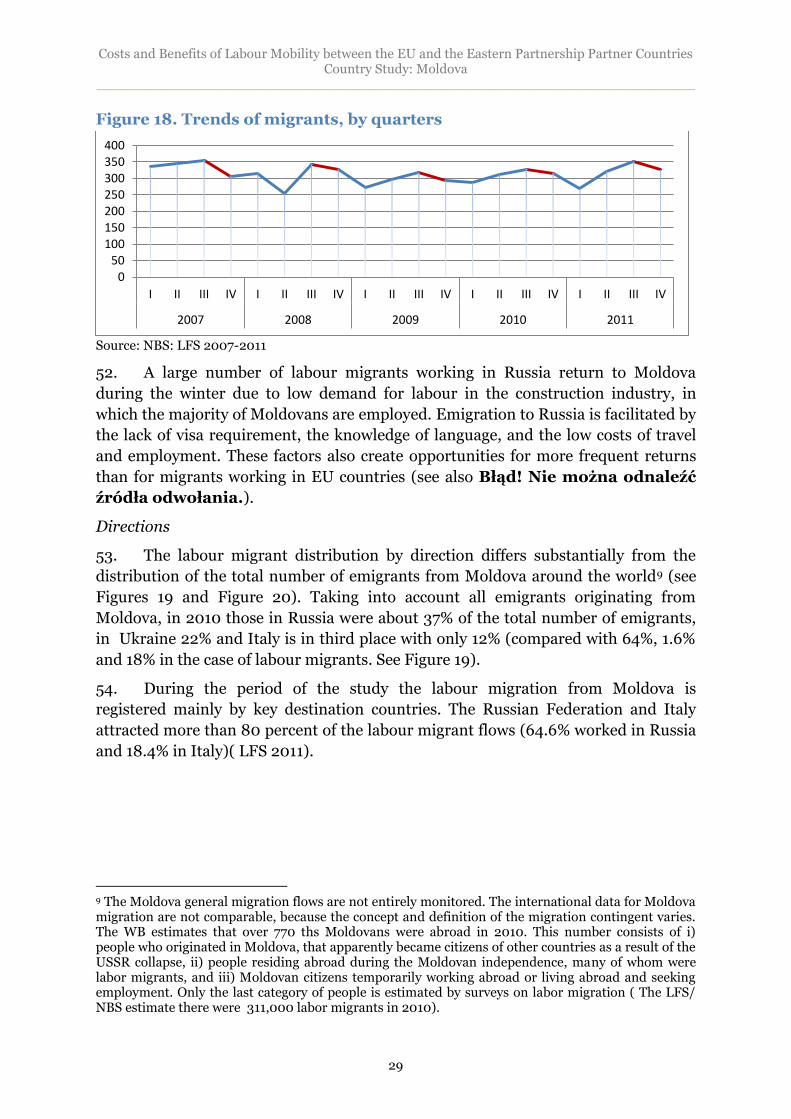
3
Chapter 6. Migration Policies in Moldova .............................................. 61 History of migration management and policies .................................................................. 61
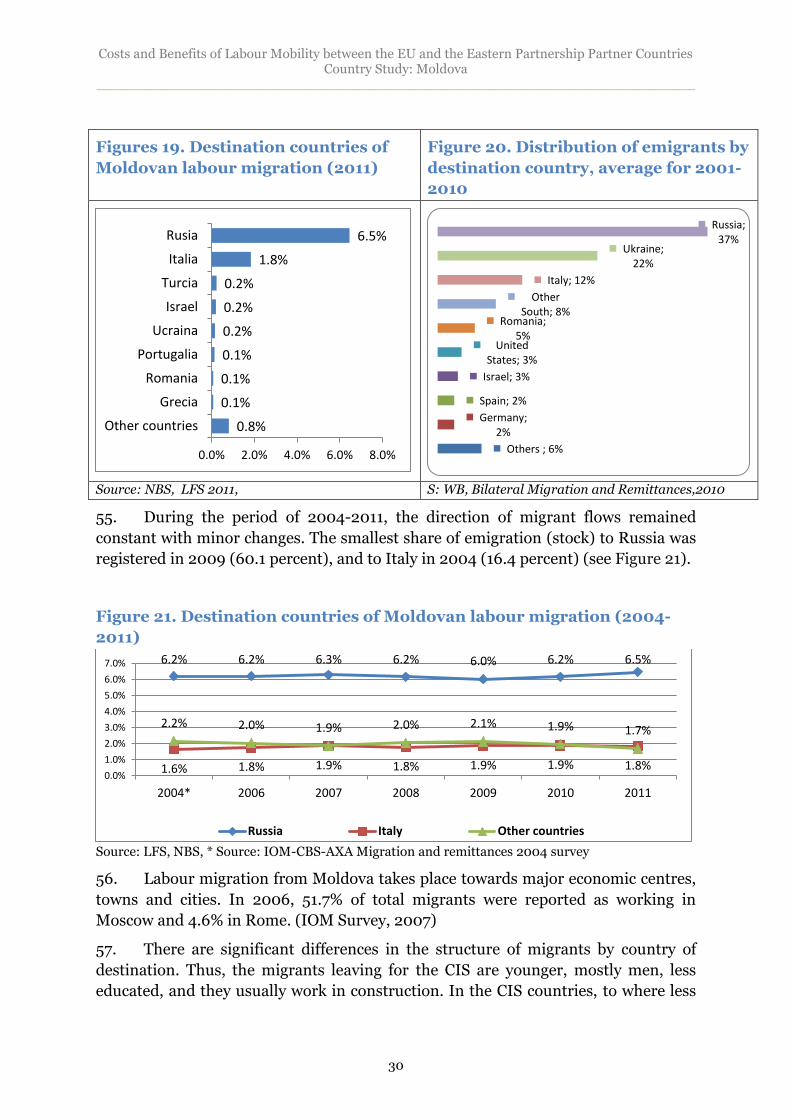
Arrangements that Moldova has in operation with the European Union ........................... 63
Arrangements that Moldova has in operation with Russia ................................................. 67
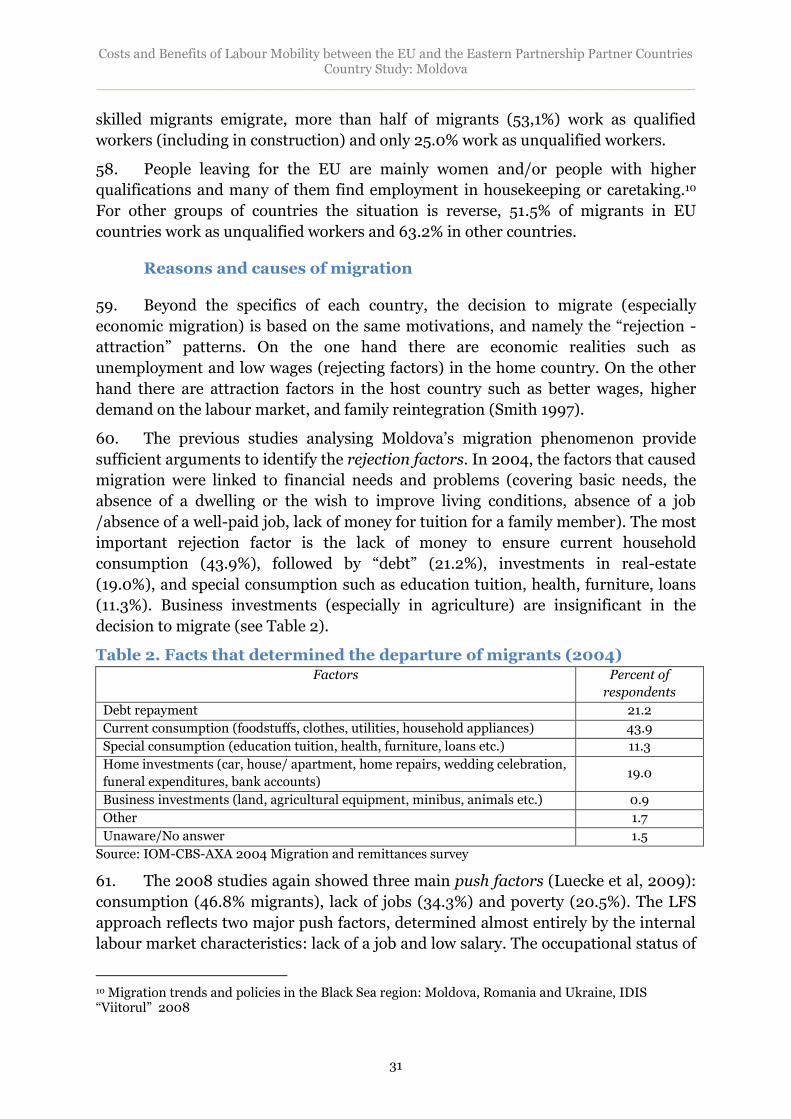
Institutional set-up for migration policies - responsibilities among government agencies 68
The role of NGOs in supporting migrants to various destinations ...................................... 69
Chapter 7. Forecasts/ Projections of Migration and Labor Market Trends ............................................................................................................. 71
Potential impact of visa liberalization on migration ........................................................... 71
Projections of potential increases in the labour force as a result of natural causes and
migration .............................................................................................................................. 72
Chapter 8. Conclusions and Recommendations .................................... 74
BIBLIOGRAPHY ................................................................................... 76
ANNEX 1. Key Data ............................................................................... 78
ANNEX 2. Legislation on Migration ...................................................... 83
ANNEX 3. Focus Groups’ Questionnaires .............................................. 85
Costs and Benefits of Labour Mobility between the EU and the Eastern Partnership Partner Countries Country Study: Moldova
______________________________________________________________________
4
List of figures
Figure 1. Evolution of industry ............................................................................................ 14
Figure 2. Evolution of agriculture ................................................................................ 14
Figure 3. Trends of GDP per capita and remittances flows (1995-2010) .................... 16
Figure 4. Poverty headcount ratio at the national poverty line (% of population) ..... 17
Figure 5. Economically active, employed and unemployed population (aged 15-60) 19
Figure 6. Unemployment rate of men, women and youth .......................................... 20
Figure 7. Trends in the number of economically inactive population ........................ 20
Figure 8. Average wage for the economy, gross income per capita and minimum subsistence level (in USD)............................................................................................ 21
Figure 9. Trends in Employment by Economic sector (2000-2011) ........................... 22
Figure 10. Unemployment, part-time employment and informal employment among youth and total ............................................................................................................. 23
Figure 11. Informal employment (%) ........................................................................... 23
Figure 12. Unemployment length (2011) ..................................................................... 23
Figure 13. Poverty headcount ratio at the national poverty rate (% of population) ... 25
Figure 14. Poverty and inequality in Moldova and region........................................... 25
Figure 15. Income distribution ..................................................................................... 25
Figure 16. Natural growth and migration growth, 1990-2011, thousands .................. 26
Figure 17. Persons working or looking for a job abroad, thousands ........................... 28
Figure 18. Trends of migrants, by quarters ................................................................. 29
Figures 19. Destination countries of Moldovan labour migration (2011) ................... 30
Figure 20. Distribution of emigrants by destination country, average for 2001-2010 ...................................................................................................................................... 30
Figure 21. Destination countries of Moldovan labour migration (2004-2011)........... 30
Figure 22. Age of migrants, 2000, 2005, 2010, 2011 .................................................. 32
Figure 23. Distribution migrants by level of education, % (2011) ............................... 34
Figure 24. Distribution of migrants by the period intended to remain abroad .......... 38
Figure 25. Labour migrant number evolution: perspectives ....................................... 39
Figure 26. Inflows of remittances, in mln. USD .......................................................... 43
Costs and Benefits of Labour Mobility between the EU and the Eastern Partnership Partner Countries Country Study: Moldova
______________________________________________________________________
5
Figure 27. Per adult equivalent incomes, MDL ........................................................... 46
Figure 28. Per adult equivalent incomes, MDL ........................................................... 46
Figure 29. Per adult equivalent incomes for migrant households only, MDL (HBS 2007) ............................................................................................................................ 47
Figure 30 Remittance inflows and other capital inflows for Moldova and Romania . 49
Figure 31. Trends of net credits in the economy and of net deposits of individuals ... 51
Figure 32. Commissioning of dwelling houses ............................................................ 52
Figure 33. Trends of number of SMEs ......................................................................... 53
Figure 34. Forecasted Moldovan population ............................................................... 59
Figure 35. Total Dependency Ratio..............................................................................60
Figure 36. Share of respondents aiming to migrate to the EU for employment reasons (current regime and potential visa-free regime) ......................................................... 72
Figure 37. Evolution of the percentage of Moldovan respondents who would vote for Moldova joining the EU (2003-2011) .......................................................................... 73
Costs and Benefits of Labour Mobility between the EU and the Eastern Partnership Partner Countries Country Study: Moldova
______________________________________________________________________
6
List of tables
Table 1. Distribution of adult population (15+) by level of education (2011) ............... 24
Table 2. Facts that determined the departure of migrants (2004) ............................. 31
Table 3. Last occupation before departure .................................................................. 35
Table 4. Migrants’ fields of activity abroad by emigration directions ......................... 36
Table 5. Distribution of migrants’ activities before emigration and activity abroad .. 36
Table 6. Average wages declared by migrants, by host countries ............................... 37
Table 7. Occupations of migrants before departure .................................................... 41
Table 8. Disposable incomes average monthly per capita in 2011 .............................. 45
Table 9. Bivariate correlation between remittances and some economic indicators (1995-2010) .................................................................................................................. 51
Table 10. Profile of Migrants before emigration and occupational status abroad ...... 54
Table 11. Evolution of the main labour indicators , 2011 - 2013 ................................. 73
List of boxes
Box 1. Outline of developments on the labour market (2000-2010) ..........................40
Box 2. The economic effects of migration and remittances on the sending country .. 48
Costs and Benefits of Labour Mobility between the EU and the Eastern Partnership Partner Countries Country Study: Moldova
______________________________________________________________________
7
Abbreviations and Acronyms
APVL Action Plan on Visa Liberalization
BOP Balance of Payments
CASE Center for Social and Economic Research
CIS Countries of Independent States
DCFTA Deep and Comprehensive Free Trade Area
EaP The Eastern Partnership
EC European Commission
ENP European Neighbourhood Policy
EU European Union
FDI Foreign Direct Investment
GD Government of Moldova Decision
GDP Gross Domestic Product
GNI Gross National Income
GoM Government of Moldova
HBS Household Budget Survey
IFI International Finance Institutions
ILO International Labour Organization
IMF International Monetary Fund
IOM International Organization for Migration
LBS Labour Force Survey
MDGs Millennium Development Goals
MDL Moldovan Leu
MLSPF Ministry of Labour, Social Protection and Family
MOE Ministry of Economy
MOF Ministry of Finance
MP Mobility Partnership
NBM National Bank of Moldova
NBS National Bureau of Statistics
NDS National Development Strategy
NGO Non-Governmental Organization
NGO Non-Governmental Organization
ODIMM Organizatia pentru Dezvoltarea Intreprinderilor Mici si Mijlocii (
Organization for SMEs Development)
PARE 1+1 Name of Remittances Program supported by the state
PPP Purchasing Power Parity
SCAs Savings and Credit Association
SME Small and Medium Enterprise
TA Technical Assistance
UN United Nations
UNDP United Nations Development Program
US$ United States Dollar
USSR Ex-Union of Soviet Socialist Republic
VAT Value-Added Tax
WB World Bank
WTO World Trade Organization
Costs and Benefits of Labour Mobility between the EU and the Eastern Partnership Partner Countries Country Study: Moldova
______________________________________________________________________
8
Executive Summary
Since Moldova’s Declaration of Independence in 1990, migration has transformed
the country in ways that were impossible to predict. With over a quarter of its labour
force now working abroad (a full ten percent of its population), Moldova has become
the epitome of a migration-dependent country, with all the costs and benefits
associated with this definition. Remittances are as high as one-third of national
income, and have helped the country raise its living standards and fuel investment in
housing and small businesses. Yet there have also been costs to the large migratory
flows, ranging from effects on the macroeconomy to the disruption of social life. All
in all, migration has been good for Moldova. This complex socio-economic
phenomenon now appears to have stabilized. Further gains for Moldova and its
partner countries could be achieved when new agreements are implemented and the
institutions dealing with the planning of migration and protection of migrants are
strengthened.
Migration as a Response to Economic Hardship
During the 1990s, Moldova was heavily struck by the crisis that followed the
dissolution of the Soviet Union, and economic opportunities rapidly deteriorated for
all its citizens. The country first sought to stabilize the economy, and then
implemented, with varying degrees of efficiency, a number of reforms. From 1994 to
1996, state property privatization was implemented in the industrial, social and
commercial sectors, while from 1998 to 2000, an agricultural reform was
implemented that resulted in massive liquidation of collective and state farms and
the final reorganization of agricultural businesses.
However, the inadequate timing of the reforms, the lack of steps to secure social
protection, the unavailability of traditional jobs and the lack of a real mechanism for
launching private businesses led to a massive outward migration of the population
from Moldova, which was particularly strong in the early 2000s.
Has migration been good for Moldova?
Migration has had profound economic and social consequences for Moldova as a
country of origin.
At the most basic macroeconomic level, migration and its benefits for development
depend on the strength of several effects, namely the impact of labour mobility on
the domestic labour market (especially the supply of a specific type of demanded
labour force), the migration effects on productivity in the domestic economy, and
finally the impacts of remittance inflows.
Since 1990, Moldova has experienced a typical migration cycle consisting of several
phases –exit, adjustment, consolidation, networking and return of migrants. The
effects of migration and remittances on poverty, economic growth, productivity and
the labour market are different in each of these phases.
Costs and Benefits of Labour Mobility between the EU and the Eastern Partnership Partner Countries Country Study: Moldova
______________________________________________________________________
9
During the exit stage, migration induced deep changes in the local labour market. It
facilitated the transfer of the labour force from agriculture to labour migration
abroad and/or the services sector in the country. Migration “absorbed” potential
unemployment, because a large portion of migrants did not have a job in Moldova
before leaving. The growth in remittances during this stage had an important effect
on poverty reduction.
During the adjustment stage the restructuring of the Moldovan economy became
more pronounced. Together with the increasing volumes of remittances, all major
economic indicators, such as GDP and investment and external trade, were deeply
affected. This was the period of maximum benefits for the main “beneficiaries” of
remittances – the banking sector, construction and higher education institutions.
At present Moldova is in transition between its consolidation stage, characterized by
the stabilization of migration flows, starting from 2004-2005, and the networking
stage. As migration continues, more information is becoming available regarding
employment opportunities in destination countries and the information and
transaction costs of migration are reduced. This encourages many households to use
emigration as a livelihood strategy. Furthermore, the possibility of migration also
encourages those left behind to invest in skills required to leave the country to seek
improved prospects abroad (constructors, welders, crane operators, hairdressers,
drivers, etc.).
The immediate effects of migration and remittances are positive, including the
reduction in poverty rates and the increase in disposable household income and
consumption, as well as the reduction of absolute poverty in Moldova as perceived by
the households themselves. Other effects include financial support to the education
system, in particular the increased number of higher education institutions and the
extensive financing of the banking and construction sectors. The increase in imports
contributed to revenues to the state budget.
Remittances helped attenuate the effects of external economic shocks that the
Republic of Moldova had to deal with such as the consistent and considerable
increase in energy prices, the 2006 embargos on wine exports, and the drought in
2007. This was not the case during the 2008 global crisis. Because of its global
character and its concentration in industries with a large Moldovan labour migration
presence, Moldova was severely affected by the crisis through a sharp fall in
remittances, exposing the risks of remittance dependency.
However, there are also other long-term effects that suggest using caution when
evaluating the effects of migration, and point to the need for mitigation policies.
Moldova’s economy now relies heavily on imports and consumption supported by the
inflow of remittances, which places local producers in difficult situations and
decreases the competitiveness of Moldovan exports due to the overvaluation of the
local currency. In addition, social costs have been incurred into, and only partially
mitigated. The loss of labour force has accentuated the demographic decline. Large
number of children are growing up without parental care because of migration and
Costs and Benefits of Labour Mobility between the EU and the Eastern Partnership Partner Countries Country Study: Moldova
______________________________________________________________________
10
children born and educated in the host countries, who may in the future have
difficulties integrating into Moldovan society. These “costs” of migration can be
addressed, and partly mitigated, by policy actions undertaken both by the Moldovan
Government as well as receiving countries. The strengthening of the institutions
dealing with migration in Moldova in the past decade provides a good basis to
continue to address the social consequence of migration.
Enhancing the development potential of migration in Moldova: an agenda
Labour migration has substantially altered Moldova’s economic and social life over
the past twenty year, and it is likely to continue to be an important force to be
reckoned with in the future. Even though we argue that the amount of labour
migrants has stabilized and might even decline, there are a number of policy
measures that can be contemplated by both the Moldovan Government and the EU,
to increase the development potential of continuing migratory flows. Such an
agenda, building on the impressive work begun in the last decade, could include:
Improving the safety and security of migrants. Many Moldovan migrants work
informally or illegally in EU countries. This has negative impacts on both
parties; the host country is affected by fiscal evasion, and the migrants lack
legal protection. It is very important that the current labour market be
approached with sensible instruments for the integration of migrants into
legal employment and the formal economy. Social protection of migrants
cannot be provided only by the national social security system, hence the need
for coordination between the host country and the migrant’s country of origin.
This could facilitate the regulation of migration in general, and specifically
circular migration, as a form more welcomed by both the host country and the
country of origin.
Visa liberalization for Moldovans entering EU countries will have positive
effects in the context of the efficient use of migration flows from Moldova. On
the one hand this may help direct some parts of migration flows from the CIS
to EU countries. On the other, the potential of high- and medium-skilled
migrants might be better off if used for the benefit and development for both
origin and host countries.
At the same time, it is also recommended that the EU and Moldova develop
programs targeting migrants with low and mid-level skills to fill labour
shortages in specific sectors of the economy, in which natives are more
reluctant to work. For Moldova, migration to the EU of workers with low and
mid-level skills would have a greater impact on poverty reduction because
unskilled workers come from lower income families and villages and tend to
send home a larger proportion of their income.
A major concern regarding the social costs of migration is the lack of
structures and expertise at the community level to tackle the problems of
migrant families. Given that migrants are part of family systems, it is
recommended that a family perspective is used when developing policies
Costs and Benefits of Labour Mobility between the EU and the Eastern Partnership Partner Countries Country Study: Moldova
______________________________________________________________________
11
regulating international migration and the migration concerns need to be
mainstreamed into national development policies. There are many ways in
which support to migrant families or returned migrants could be provided.
For example, support programs can be implemented for migrant families and
returned migrants and their children by targeting the migrants themselves,
the family left behind (spouses, children, the child-caregivers such as
grandparents), and the children born in destination countries. The relevant
stakeholders interacting on a constant basis with migrant families such as the
school system, social protection and health systems should be actively
involved in these programs and held accountable for program outcomes.
Other programs, partly already in existence, could be targeted at migrants
themselves, for example while they are preparing to leave the country in order
to increase their knowledge about the destination country and its
institutions—health and social security systems, education system and labour
market requirements. These programs increase migrants’ awareness about the
impact that migration might have on their families and children and provides
some ways in which potential challenges could be prevented. Both the EU and
some member states provide assistance in this respect: this is an investment
that pays off both in Moldova and in the receiving countries.
Finally, facilitation of labour migration is impossible outside of bilateral cooperation
between origin and destination countries. For EU member countries, the main
objectives when engaging in bilateral labour agreements with Moldova could be:
The satisfaction of labour market needs;
Prevention or reduction of irregular migration through increased possibilities
for regular migration;
The use of bilateral labour agreements to promote and support broader
economic relations with Moldova.
For the Moldovan Government, we recommend that migrants’ needs are made
central to negotiations, by focusing on the following objectives:
To offer to Moldovan workers wider, facilitated access to the international
labour market and at the same time to prevent criminal activities involving
smuggling and trafficking of human beings, exploitation, suffering and
sometimes deaths of migrants;
To promote and protect the welfare and the rights of migrant workers;
To foster provisions in the bilateral agreements that would guarantee that
migrants return to Moldova or cooperate in matters involving irregular
migration.
Costs and Benefits of Labour Mobility between the EU and the Eastern Partnership Partner Countries Country Study: Moldova
______________________________________________________________________
12
Introduction
This Report is one of six studies in the first phase of the EU project on
“Costs and Benefits of Labour Mobility between the EU and the Eastern
Partnership Partner Countries.” It aims to provide an informed view on the
potential for increased migration flows and their consequences as a result of possible
changes in the migration policies of the European Union with regard to Moldova.
The report is comprised of 7 Chapters. Chapters 1 and 2 provide a discussion of
relevant developments in the economy and labour market in the period since
independence, with an emphasis on developments over the last ten years or so.
Chapter 3 provides a detailed discussion of trends in migration and discusses the
labour migration profile. Chapter 4 analyses remittances and their impact on
income, investment and consumption. Chapter 5 provides a discussion of the
available evidence on costs and benefits of labour migration, emphasizing economic,
social and demographic costs and consequences. Chapter 6 discusses current
migration policies and institutions, while Chapter 7 discusses some factors that can
be useful in forecasting key migration trends in the future.
Methodology
This study, produced by an integrated team of one migration and one labour market
expert, is based on: (i) a review of the existing literature on migration in Moldova,
encompassing studies that have looked at overall effects of migration, the effects on
local labour markets, the effects on other important programs such as education,
health, social protection, and business development; and (ii) quantitative research of
the existing situation with respect to migratory flows—including socio-demographic
characteristics of migrants by destination, data on remittances, data on duration of
migratory spells, and paying particular attention to evolution over time of such
variables and other notable trends— performed based on publicly available data
provided by the National Bureau of Statistics.
Qualitative research, in the form of Focus groups of migrants organized under this
study, has also been used to supplement the statistical evidence and to collect
information about obstacles to migration as seen by labour force participants. These
were temporary returned migrants that have been asked about their perceptions,
opinions, beliefs, and attitudes towards the labour migration, intentions to stay
abroad or return, preferences for destination countries and other aspects related to
labour opportunities in Moldova. Questions were asked in an interactive group
setting where participants were free to talk with other group members.
Costs and Benefits of Labour Mobility between the EU and the Eastern Partnership Partner Countries Country Study: Moldova
______________________________________________________________________
13
The results of the focus groups, as well as of interviews conducted with migration
officials in relevant agencies have been integrated in the report as needed1.
The Report focuses mostly on developments since the year 2000, although to the
extent possible references to older trends (e.g., movements of population under the
Soviet Union, first flows of migration) have been provided to explain better today’s
tendencies.
Labour market developments, have also been analysed for the period 2000-10, and
where available data for 2011 was also included. The analysis has focused on the
evolution over time of the job creation and job destruction among sectors of the
economy; to the extent possible, the paper also discusses projections on potential
increases in the labour force as a result of natural causes, and dwells on wage
developments that influenced cross-sectoral labour movements and external
migration. The discussion of costs and benefits looked at macroeconomic,
microeconomic and social aspects of migration, with as much country specificity as
possible.
The study discusses the current migration policies and the institutional
arrangements applied to facilitate and regulate migratory flows during the research
period, including, in particular, the review of the arrangement that Moldova has in
operation with Russian Federation and the European Union.
1 The lists of Questions used in the focus groups inverviews are presented as an Annex to this Report.
Costs and Benefits of Labour Mobility between the EU and the Eastern Partnership Partner Countries Country Study: Moldova
______________________________________________________________________
14
Chapter 1. Background: The Moldovan Economy after
Independence
Deep Crisis and Recovery, 1990-2012
1. Following independence, Moldova experienced a difficult transition during
the last decade of the 20th century, when GDP fell by some 65% between 1990 and
2000. While the government undertook measures to start the privatization of state
ownership and agriculture land reform, economic reforms were slow because of
variety of factors, including corruption and strong political forces backing
government controls. Nevertheless, the government's primary goal of EU integration
has resulted in some market-oriented progress.
2. In spite of the economic decline, agriculture continued to play a major role in
the country's economy, as it had during the Soviet period. In 1991 agriculture
accounted for 42 percent of the net material product and employed 36% of the labour
force. At the same time, this sector was most affected by economic decline and its
importance for the national economy decreased dramatically. In 2011 agriculture
assured only 13.4% of output and in the 2000-2011 period the number of people
employed in agriculture halved (from 770,000 to 323,000).
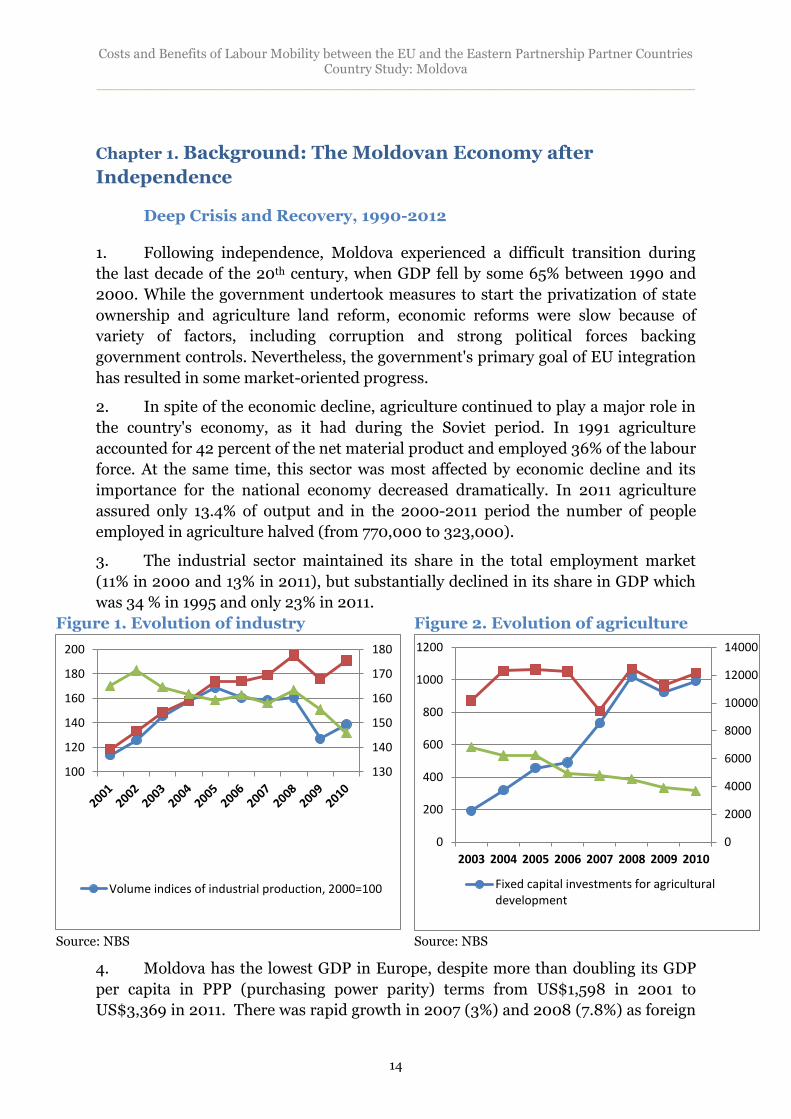
3. The industrial sector maintained its share in the total employment market
(11% in 2000 and 13% in 2011), but substantially declined in its share in GDP which
was 34 % in 1995 and only 23% in 2011.
Figure 1. Evolution of industry Figure 2. Evolution of agriculture
Source: NBS Source: NBS
4. Moldova has the lowest GDP in Europe, despite more than doubling its GDP
per capita in PPP (purchasing power parity) terms from US$1,598 in 2001 to
US$3,369 in 2011. There was rapid growth in 2007 (3%) and 2008 (7.8%) as foreign
130
140
150
160
170
180
100
120
140
160
180
200
Volume indices of industrial production, 2000=100
0
2000
4000
6000
8000
10000
12000
14000
0
200
400
600
800
1000
1200
2003 2004 2005 2006 2007 2008 2009 2010
Fixed capital investments for agriculturaldevelopment
Costs and Benefits of Labour Mobility between the EU and the Eastern Partnership Partner Countries Country Study: Moldova
______________________________________________________________________
15
remittances and inward investment fuelled the economy but in 2009, GDP fell by
6.5% due to the global downturn, which sharply reduced remittance inflows and
reduced demand for industrial goods on the external market. In 2010 – 2011, the
economy rebounded significantly, with a recorded GDP growth of 7.1 percent in 2010
and another 6.4 percent in 2011, fuelled by the recovery in external demand and the
increase in domestic consumption supported by increasing remittance flows.
5. The economy is continuing to recover vigorously. The expansion in 2011
appeared broad-based with key indicators (exports, bank credit, and industrial
production) posting strong gains, and has extended in 2012. The improved external
environment and brisk expansion of domestic demand, as well as the early fruits of
Moldovan reform efforts (macroeconomic stability, economic liberalization, and
gradual opening of the EU markets) have been driving these positive developments.
At the same time, the current account deficit of Moldova is widening due to a
combination of external shocks and expanding domestic demand. Rising
international energy prices combined with brisk growth in demand for consumer and
investment goods (which, in turn, are fuelled by higher remittances, bank credits,
and other foreign inflows) are expected to widen the current account deficit. The
substantial export growth in 2011 (over 60 percent relative to 2010) was insufficient
to offset the effect of the less buoyant import growth from a larger base2.
6. The nature of the beginning of the global financial crisis in the developed
economies of Western Europe was different than in Moldova. As developed
economies faced systemic problems in their banking systems that then spilled over
into the real economy, the financial sectors in Moldova remained largely insulated
due to a lesser degree of exposure. Banks and financial institutions in Moldova have
not been as active in the international financial arena, and Moldova’s stock markets
do not match the size of their counterparts in more developed countries.
7. However, the crisis has not completely bypassed the country and the
transmission effects, the speed, and the depth of the crisis took hold in various ways.
Many of the crisis’ effects could be seen in decreases in domestic demand and
consumption, which constricted domestic demand, which had served as one of the
principal factors of growth in recent years. Coupled with the shocks of tightened
credit markets and decreased consumption, Moldova has been negatively impacted
by downturns in many of the productive sectors of the real economy, through
slumping trade and fewer investment partners in Western Europe3.
8. During the period under consideration, remittances grew steadily to reach a
level corresponding to about a third of GDP, making Moldova one of the most
“remittances dependent” countries in the world. Remittances also appear to have
2 http://www.imf.org/external/np/loi/2011/mda/062711.pdf
3http://www.ilo.org/public/english/region/eurpro/geneva/download/ecosoc_crisisimpact_westbalkan.pdf
Costs and Benefits of Labour Mobility between the EU and the Eastern Partnership Partner Countries Country Study: Moldova
______________________________________________________________________
16
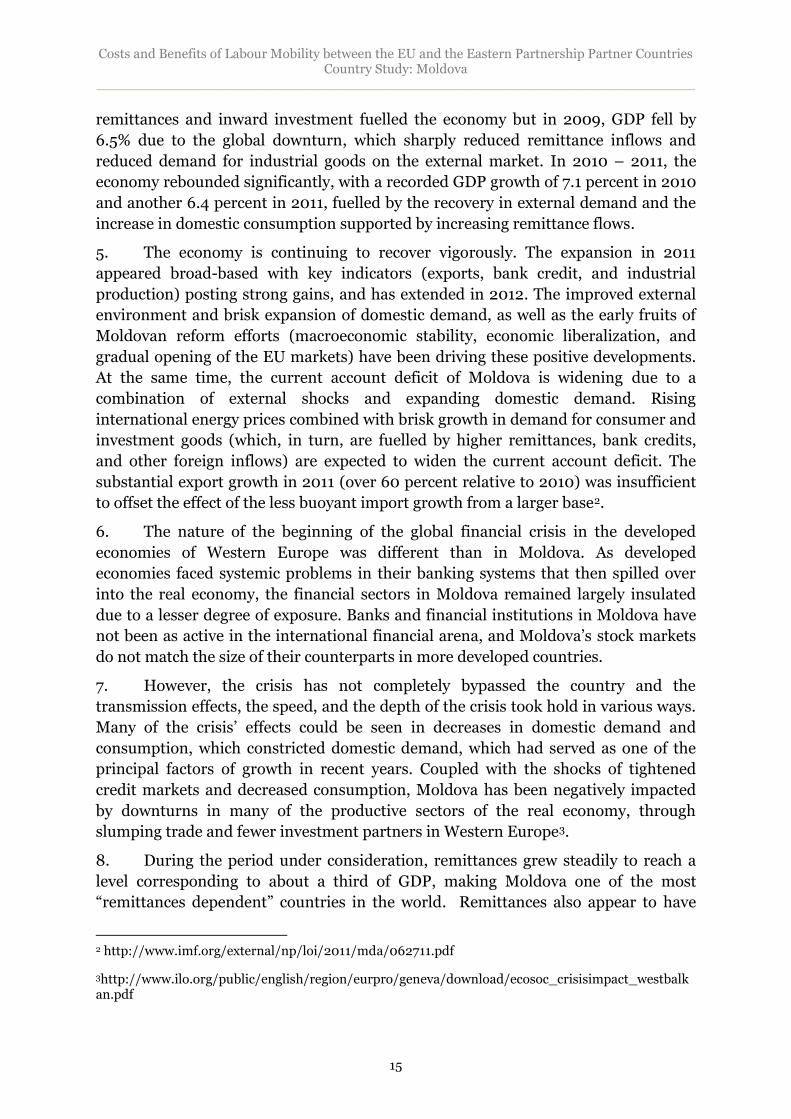
influenced the level of total fixed capital investment. Investment volumes increased
steadily from 2003 to 2008 (5 times), then a sharp reduction took place in 2009 (by
40% in comparison with 2008) with a slight recovery (this was not the case, not
surprisingly, with FDI).
Figure 3. Trends of GDP per capita and remittances flows (1995-2010)
Source: WB databases/ Country MetaData base
9. In Moldova, the decrease in remittance income contributed heavily to the GDP
contraction of 9 per cent recorded for the year 2009, as it played an important factor
in the country’s decreased domestic consumption. The IMF estimated that
consumption in Moldova contracted 7 per cent in 2009.
10. The changing economic composition of GDP growth that has characterized
Moldova in recent years has had similar effects on the state of employment
concerning the types of jobs held Moldova. Deindustrialisation has been coupled
with a small subsequent loss of jobs in the industrial sector, whereas service sector
employment has moderately risen at its expense. Business services have grown as a
source of employment in many countries in the region, including Moldova. Between
1998 and 2001, half of the population lived below the poverty level. Later the level of
poverty decreased because of the increased levels of emigration and the increased
level of received remittances. Starting in 2004, the poverty rate stabilized at around
30% with a moderated decrease up to about 20%.
0
500
1000
1500
2000
0.0
200.0
400.0
600.0
800.0
1995 2000 2001 2002 2003 2004 2005 2006 2007 2008 2009 2010
GDP per capita Remittances
Costs and Benefits of Labour Mobility between the EU and the Eastern Partnership Partner Countries Country Study: Moldova
______________________________________________________________________
17
Figure 4. Poverty headcount ratio at the national poverty line (% of
population)
Source: WB databases/ Country MetaData base
11. The economic decline in the early years of independence dramatically reduced
the welfare of the population of the country. In the 1990s, poverty was widespread; in
1998, more than half of the households in the country were estimated to be below the
poverty line. The default in August 1998, which caused a sudden depreciation of the
national currency, decreased purchasing power and poverty spread to over 70% of
households.
12. In the early years of the 21st century, the stabilization of the economy and its
growth, but also the increased volume of remittances that increased household
income led to a reduction in the level of poverty, albeit at a slow pace. In 2010, 21.9%
of households lived below the poverty line.
13. Along with structural reforms, the Moldova has mapped out the contours of
the education reform, and the government is working to ensure its successful and
timely implementation. The civil service reform entered into its second phase in
2011. Key components of the reform include new job functions and responsibilities
for staff in public administration along with a merit- and performance-based wage
system for civil servants. The on-going social assistance reform for Moldova remains
a high priority; the improved capacity of social services and continuous awareness-
raising campaigns will allow the Government to meet the target of expanding
enrolment in the means-tested social assistance scheme. Moldova is on track to put
in place a durable framework for a broader restructuring strategy in the energy
sector.
14. Initiatives to resume the privatization of public companies and to strengthen
the industrial sector as well as to change the model of economic growth from one
based on consumption to one oriented towards export are under way. Trade
liberalization efforts, as well as reforms aimed at cutting red tape, safeguarding
competitiveness, and stimulating exports are currently in progress. In 2011, the
volume of bilateral trade between the EU and the Republic of Moldova increased by
27.9%. Moldova is now conducting negotiations of a Deep and Comprehensive Free
Trade Area (DCFTA) with the EU. The EU decided to launch negotiations in
0
10
20
30
40
50
60
70
80
1998 1999 2000 2001 2002 2003 2004 2005 2006 2007 2008 2009 2010
Costs and Benefits of Labour Mobility between the EU and the Eastern Partnership Partner Countries Country Study: Moldova
______________________________________________________________________
18
December 2011. The trade in services negotiations also will address the movement of
natural persons, and the negotiations might cover the temporary movement of
natural persons for business purposes, as well as aspects related to the application of
EU national legislation and requirements regarding entry, stay, work, labour
conditions and supply of services. The DCFTA might also address and define the
framework or the general conditions for the mutual recognition agreements of
professional qualifications between the EU and Moldova.
Costs and Benefits of Labour Mobility between the EU and the Eastern Partnership Partner Countries Country Study: Moldova
______________________________________________________________________
19
Chapter 2. The Labour Market in Moldova
15. The transition to a market economy in Moldova deeply affected developments
in the labour market. Property reforms, privatization of enterprises and land,
transformation of the state sector and formation of the private sector, development
of entrepreneurship and self-employment, increased mobility of the population all
played an important role in the creation and destruction of jobs, and in the
reallocation of labour inside and outside the country. Employment outcomes have
been one of the main determinants of, and have been affected by migratory outflows,
as well as by the deep structural changes that the economy has seen since the
dissolution of the Soviet Union.
Employment and unemployment
16. From 2000 to 2011, the 15-60 age cohorts of the population grew slowly, and
they are projected to decline over the next few years. In 2011, the ratio of 15-year olds
to 60 year-olds was 1.2; in 2013 the ratio will become 1.0, and in 2015 the ratio will
be 0.8 young people per 1 aged person. In the same period the economically active
population decreased by 24 percentage points, subsequently the economically active
population decreased (from 1,514,000 in 2000 to 1,173,500 in 2011).
17. Employment growth rates in Moldova in the last decade have a uniformly
negative trend. The lack of employment growth in Moldova was accompanied by a
low degree of labour force participation and low employment rates. The activity rate
dropped from 60% in 2000 to 42% in 2011, and the occupation rate from 55% to
40%. The decrease in the general rate of occupation affected men and women in the
same measure. (see Annex 1, Table 1).
Figure 5. Economically active, employed and unemployed population
(aged 15-60)
Source: National Bureau of Statistics (NBS)
18. In all transition countries, including Moldova, the 1990s were marked by a
reduction in employment and a rise in unemployment, especially during the first
2312 2341 2373 2394 2422 2449 2475 2465 2484 2498 2508 2504
165.5 161.7 161.5 147.4 143.3 142.2 135.7 131.4 130.3 126.5 123.5 125.8
151.5 149.9 150.5 135.7 131.6 131.9 125.7 124.7 125.1 118.4 114.3 117.4
14.0 11.8 11.0 11.7 11.7 10.4 10.0 6.7 5.2 8.1 9.2 8.4
0
500
1000
1500
2000
2500
3000
2000 2001 2002 2003 2004 2005 2006 2007 2008 2009 2010 2011
15-60 aged population (th) Economically active populationEmployed population Unemployed population
Costs and Benefits of Labour Mobility between the EU and the Eastern Partnership Partner Countries Country Study: Moldova
______________________________________________________________________
20
years of the transition period. Unemployment of women is lower, at an average level
of 81% of the total unemployment rate. The unemployment in the younger age group
is 2.5 times higher (14.9 compared with 6.7) than total unemployment.
19. The number of unemployed people fluctuated on a generally declining trend,
with a small increase after the crisis. (see Figure 6.)
Figure 6. Unemployment rate of men, women and youth
Source: NBS (www.statistica.md)
20. An analysis of the flows of employment, of the labour force and of the
economically inactive population can help understand the origin of labour migration,
because the official statistics count labour migrants as part of the economically
inactive population.
21. The economically inactive population consistently increased by 1 per cent on
average yearly during the period of 2000-2011. In 2011 the economically inactive
population reached 1717.6 thousand people, which is 1.6 more than the employed
population.
Figure 7. Trends in the number of economically inactive population
Source: NBS
22. The economically inactive population consists of those people who are:
attending school or professional training, have family responsibilities, on sick leave
0
5
10
15
20
25
1993 1995 2000 2001 2002 2003 2004 2005 2006 2007 2008 2009 2010 2011
Total Men Women Young 15-24 aged
110.9
117.6
120.9
138.1
144.9
148.3
157.6
161.8
163.9
169.3
173.3
171.8
0.0
50.0
100.0
150.0
200.0
2000 2001 2002 2003 2004 2005 2006 2007 2008 2009 2010 2011
Costs and Benefits of Labour Mobility between the EU and the Eastern Partnership Partner Countries Country Study: Moldova
______________________________________________________________________
21
or pension (age limit, disability, etc.), don’t want to work, are working abroad, in the
off-season for agriculture, among others.
23. The share of women in this group is a bit higher than the number of men,
because a substantial number are housewives (see Annex 1, Table 2). Women
represent 60% of the inactive population and the men 40%.
Wages and Income
24. The Soviet currency devaluation and depreciation sharply decreased the value
of the average wage in the 1990s from about US$250 to less than US$50. Later a
slight positive trend was registered in the 2000s, with steady growth that brought the
medium wage for the economy back to just under US$200 in 2008, a value
maintained in 2009-2010 despite the global financial crisis, and then it increased
slightly in 2011 up to US$272.
25. The growth of household disposable income over the period under
consideration was more modest compared to the average wage.
Figure 8. Average wage for the economy, gross income per capita and
minimum subsistence level (in USD)
Source: NBS: Note: * wages in Soviet Ruble as against USD at the exchange rate of 1 ruble for 1 USD;
** the rate of MDL 4.5 for USD 1 was used (average exchange rate in 1995)
26. Remittances play an important role in increasing household incomes. In the
period 2000 – 2008 the share of remittances in disposable household incomes
increased steadily, reaching reach 19.1 percent of total incomes in 2008. A slight
decline (to 15.3 percent) was registered in 2011 (NBS, Household Budget
Survey(HBS)). The contribution of remittances to the welfare of the population is
important especially in rural areas, where the share of remittances in income is
typically twice as high than in urban areas.
Occupation, Industries, Sector
27. Besides the reduction in the number of economically active people, the labour
market in the Republic of Moldova has undergone significant structural changes over
0.0
10.0
20.0
30.0
40.0
50.0
19
90
*
19
91
*
19
92
*
19
93
**
19
94
**
19
95
19
96
19
97
19
98
19
99
20
00
20
01
20
02
20
03
20
04
20
05
20
06
20
07
20
08
20
09
20
10
Wages HH Income (per individum) Minimum subsistence
Costs and Benefits of Labour Mobility between the EU and the Eastern Partnership Partner Countries Country Study: Moldova
______________________________________________________________________
22
the last decade. The movements of the labour force within the occupational sectors
have been considerable.
28. About 70% of those leaving the labour market were previously employed in
the agriculture and processing industries, and the most attractive labour force
sectors were services and construction. The flows data suggest that the first wave of
migrants from Moldova consisted of excess labour force in the agricultural sector and
the unemployed from urban areas.4
29. The 2000 – 2010 period was notable for the reduction of the population
employed in the agricultural sector (from 770,000 in 2000, or almost half of the
labour force, to 323,000 in 2011).
30. Employment in the services sector increased continuously from 35.2% to
53.7% (533,700 persons in 2000 to 630,000 persons in 2011). This is the only sector
with positive trends on the labour market, caused by an increase in the number of
jobs created: on average, the services sector offered a job for about 22,000 young
job-seekers yearly in the period 2003-2008.5
31. In sum, in 2011, already more than half of the employed population in the
country was working in the sphere of services; the agricultural sector remained in
second place (27.5%), followed by industry (13.1%) and construction - 5.7%.
Figure 9. Trends in Employment by Economic sector (2000-2011)
Source: NBS
32. Employment by type of employer (private, public and other forms) remained
relatively constant in the period under consideration (2000-2011) – about 64 % were
employed by private companies, 27% by the public sector and the other 9% in joint
entities. The private sector remains the main sector supporting the labour market
and the most challenging for entering the market. (see Annex 1, Table 4)
4 NBS, Labour Force Survey, 2008
5 Piata muncii din Republica Moldova, 2008. ILO
770.4 50.9% 764,8 747,1
583,2 532,9 536,5
422,4 408,6 388,6 333,7 314,7
323 27.5% 166.1
11.0% 165,1 171,4 164,5 161,8 159,3 161,3 158,1 163,4 155,4 145,8 153.2 13.1% 44.4
2.9% 43,2 46 53,2 52 51,6 67,3 75,7 82,8 72,9 67,5
66.8 5.7%
533.8 35.2%
525,8 540,6 555,5 569,3 571,2
606,3 604,9 616,3 622,4 615,4 630.6 53.7%
0
200
400
600
800
1000
2000 2001 2002 2003 2004 2005 2006 2007 2008 2009 2010 2011
Agriculture, forestry; Fishery Industry Construction Services
Costs and Benefits of Labour Mobility between the EU and the Eastern Partnership Partner Countries Country Study: Moldova
______________________________________________________________________
23
Part-time employment
33. In Moldova, 7.3% of the employed population works part-time (2011). The
share of part-time employment in
total employment has declined
sharply from 16.5% in 2002. Most of
the part-time employment in
Moldova is in the agricultural
sector. In 2002 this percentage was
about 86.7% of all part-time
employed persons, and in 2011 it
reached 51.5% of the total part-time
employed population. A reduction
in the performance of the
agricultural sector on the labour
market, as well as the seasonal
nature of the sector propels many
agricultural workers to migrate. The
rate of part-time employment
among youth is 7.7% of total
employed persons, a bit higher than
in the total population.
Informal occupation
34. Informal employment in
Moldova remains a characteristic of
the labour market. According to the
LFS, about 38% of the employed
population in 2003 and 30% in 2011
had an informal job. Out of this
30%: 41% of workers are employed
in the informal sector, 27% in legal
economic entities and 32% in
households which produce for their
own consumption. Among young
people, the share of those employed
in the informal sector is higher
(36% compared to 30% in the total
population).
Education
35. Moldova is a country with a
high level of literacy. The literacy
Figure 10. Unemployment, part-time
employment and informal employment
among youth and total
Figure 11. Informal employment (%)
Figure 12. Unemployment length
(2011)
Source: NBS
6,7 0.7
3.1
14,9
0.8
3.6
05
10152025303540
Unemploymentrate
Part-timeemployed (% în
total)
Employed ininformal sector
(% în total)
General population Youth 15-24 aged
2.0%
2.5%
3.0%
3.5%
4.0%
2003 2004 2005 2006 2007 2008 2009 2010 2011
25%
34%
24%
26%
19%
24%
19%
13%
13%
3%
0% 20% 40% 60% 80% 100%
All unemployed
Youth 15-24 aged
less than 3 months 3-5 months
6-11 months 11-23 monts
Costs and Benefits of Labour Mobility between the EU and the Eastern Partnership Partner Countries Country Study: Moldova
______________________________________________________________________
24
rate in the adult population (15+) is equal to 98%. About 70% of the adult population
has completed secondary education.
36. In the period of 2000-2011, the level of education of the population increased
considerably because the elderly and poorly educated generation was replaced with a
younger and more educated demographic. In 2011, every seventh adult had a higher
education (15.8%, compared with 9.0% in 2000) and 31% had completed secondary
specialized or vocational education (see details in Annex 1, Table 1).
37. The highest share of the employed population in 2011 completed higher
education (23.7%) and secondary vocational education (23.1%). The economically
inactive population generally has lower educational achievements, with 31.3% of
people having a secondary education (compared to 24.2% in the total population)
and 13.7% people with a lower educational level than required (compared to 6.6%
respectively). In comparison with the total population, the migrant population is
predominantly made up of persons with general secondary (25.9%) and secondary
vocational education (24.7%).
Table 1. Distribution of adult population (15+) by level of education
(2011)
Type of education
Total population
(15+)
Employed population
Unemployed population
Economically inactive
population
Migrants At the
moment* Temporary returned **
High education 15.8% 23.7% 21.3% 10.0% 10.6% 11.3% Secondary specialized 12.9% 16.5% 12.6% 9.8% 12.7% 13.4% Secondary vocational 18.2% 23.1% 25.0% 11.8% 24.7% 24.8% General secondary, 22.3% 19.9% 23.1% 23.5% 25.9% 25.4% Secondary education 24.2% 16.1% 17.5% 31.3% 25.5% 24.4% Primary or without 6.6% 0.8% 0.6% 13.7% 0.5% 0.8%
Source: NBS, Note* People abroad at the moment of conducting the LFS, ** people at home at the
moment of conducting the LFS.
Poverty, income distribution and the working poor
38. The economic decline in the early years of independence dramatically reduced
the welfare of the population of the country. In the 1990s, poverty was widespread; in
1998 more than half of the households in the country were estimated to be below the
poverty line, which was mainly caused by the depreciation of the national currency
and a decrease in purchasing power.
39. In the early years of the 2000s, economic stabilization growth, together with
an increase in the volume of remittances increased household income, which led to a
reduction in poverty. By 2010, the share of poor households nearly halved, and
currently 21.9% of households in Moldova live below the poverty line. Those most
affected by poverty are traditional households in rural areas: in 2010, 30.3% in
villages were below the poverty line compared with 10.4% of households in cities.
Costs and Benefits of Labour Mobility between the EU and the Eastern Partnership Partner Countries Country Study: Moldova
______________________________________________________________________
25
40. Poverty is
associated with growing
inequality in income
between the different
categories of the
population. The inequality
in income expressed using
the Gini index repeated the
course of poverty, with a
peak in 1999 (39.35),
followed by a fall in 2010
to its value of 33. In 2010,
the poorest 20% of the
population still had only
7.8 of income, while the richest fifth received 41.2% of total revenues. Compared to
neighbouring countries and former Soviet republics, the Republic of Moldova is
characterized by a high level of poverty and a moderate level of inequality.
Figure 14. Poverty and inequality in
Moldova and region
Figure 15. Income distribution
Source: World Bank Source: World Bank
Albania
Armenia
Azerbaijan
Belarus
Bosnia and Herzegovina
Bulgaria
Croatia
Georgia
Kazakhstan
Kyrgyz Republic
Latvia
Macedonia, FYR
Moldova Montenegro
Poland
Romania
Russian Federation
Serbia
Tajikistan
Turkey
Ukraine
20
25
30
35
40
45
0 10 20 30 40 50
GIN
I in
de
x
Poverty headcount ratio at national poverty rate
Income share held by lowest 20%; 0.8
Income share held by second 20%; 1.2
Income share held
by third 20%; 1.7
Income share held by fourth 20%; 2.2
Income share held by highest 20%; 4.1
Figure 13. Poverty headcount ratio at the
national poverty rate (% of population)
Source: WB databases/ Country MetaData base
0
20
40
60
80
national poverty line rural poverty line
urban poverty line
Costs and Benefits of Labour Mobility between the EU and the Eastern Partnership Partner Countries Country Study: Moldova
______________________________________________________________________
26
Chapter 3.Labour Migration: Trends and Profile
History and trends in migration
41. Immediately after the collapse of the Soviet Union the number of people that
left the country permanently increased and the size of the population started to
decrease. As in many EaP countries, migration in Moldova can be divided into three
stages:
42. The first stage is the period immediately after independence, when many
citizens decided to relocate elsewhere permanently. For instance in 1992 and 1993,
negative migration growth reduced the population by 30-33,000 people in both years
(Figure 16);
Figure 16. Natural growth and migration growth, 1990-2011, thousands
* Since 1998 the statistics do not reflect the population from the left side of the Dniester and
mun.Bender (Transnistria); Source: NBS
43. The second stage is the period starting in the mid-1990s – mid 2000s, when
the number of persons leaving permanently decreased, and a large number of the
population started going abroad to look a job, without having the intention to settle
in the destination countries;
44. Since 2004 the migration process has entered a new phase – “the steady-
state” without sharp trends in labour migration.
Number of labour migrants
45. Several data sources allow us to estimate the number of Moldovan citizens
living or working abroad. The official statistical data sources (census, LFS and HBS)
collect information on persons who have kept their permanent residence in Moldova
but are temporarily abroad, even for more than 12 months.
46. The concept of “labour force migration” is used in the official statistics of
Moldova according to the following definition: “labour migration” is the voluntary
departure of citizens of the Republic of Moldova abroad, and also the voluntary
-1.1
-2.1
-3.2 -3.1
-0.6 -0.8 -1.6 -1.7
-0.3 -0.2 -0.5
-0.1 -0.3 -0.7
0.0 -0.4 -0.3 -0.3 -0.2 -0.2 0.0
-4.0
-3.0
-2.0
-1.0
0.0
1.0
2.0
3.0
4.0
19
90
19
91
19
92
19
93
19
94
19
95
19
96
19
97
19
98
*
19
99
20
00
20
01
20
02
20
03
200
4
20
05
**
20
06
20
07
20
08
20
09
20
10
20
11
Migration growth Natural growth
Costs and Benefits of Labour Mobility between the EU and the Eastern Partnership Partner Countries Country Study: Moldova
______________________________________________________________________
27
entrance of foreign citizens and persons without citizenship into the territory of the
Republic of Moldova with the purpose of working.
47. The government only started estimating the number of labour migrants from
Moldova in the year 2000, through the Labour Force Survey carried out by the
National Bureau of Statistics (NBS) on a quarterly basis. The NBS estimated there
were 138,300 labour migrants in 2000. It is important to mention that official
statistics count the labour migrants as part of the economically inactive population6.
48. During the period of 2000-2005, the number of departures continued to
increase by 50,000 persons per year on average, reaching a total of 394,500 persons
in 2005. As of 2006, the number of labour migrants has stabilized at around
310,0007. In 2011, the estimated number of labour migrants reached the level of
316,900 persons, amounting to 10.7% of the total population aged 15+, or about 25%
of the economically active population. At the same time, the official statistics for 2011
estimate the economically inactive population at about 125,100 persons who aim to
work abroad. This population group is registered in the LFS as being in Moldova at
the moment of data collection, but not employed in Moldova. Therefore, we can
conclude that the labour migrant contingent of the country constituted over 440,000
persons in 2011, which is about 17.6% of the labour force in Moldova.
6 Even if the above mentioned definition uses the term “migration,” there are no statistical data published on the emigration of Moldovan citizens for work as well as on immigration of foreigners for the purpose of work. The only available data characterize the persons who are working abroad or who have worked abroad in the past. Thus these are stock data only on Moldovan citizens, which do not include data on foreigners working in Moldova. The NBS produces such statistics based on the 2004 census and the LFS. Regarding the coverage of persons working abroad, the NBS surveys and 2004 Census fail to cover single person households and families that went abroad without any member of the family staying in the country. Therefore the published figures are underestimated and it is not concretely possible to estimate the level of this under-coverage. 7 The 2006 estimate, which indicates a smaller figure (310,100) can be explained by some changes in the definitions used to identify the occupied population. It is clear that the number of migrants did not decrease, but settled at a saturation level. Therefore, there was a sort of exhaustion of the migration potential (we are considering the members of the population that, for various motives, would leave the country)
Costs and Benefits of Labour Mobility between the EU and the Eastern Partnership Partner Countries Country Study: Moldova
______________________________________________________________________
28
Figure 17. Persons working or looking for a job abroad, thousands
Source: NBS, 2011 (LFS)
49. Because of constant fluctuations, the number of labour migrants from
different representative studies, like the LFS, must be treated with cautions. As
mentioned above, these surveys estimate the population that is out of the country at
the moment of data collection for the purpose of work, and the other migrants that at
their place of residence at the moment of the survey are registered as migrants that
have temporarily returned. The gap in the data and the difficulty in estimating the
precise number of migrants is represented by the cases in which the migrant left or
moved with the whole household, and there is no reference household in Moldova (at
the moment of data collection) that can provide information about this group of
people. This means the number of labour migrants is underestimated.
50. For instance the 2008 IOM-CBS-AXA specific panel survey8 suggests that,
overall, about 100,000 individuals have left Moldova permanently or moved without
references in the period of 2006-2008. Of these, about 60,000 individuals left
Moldova with the whole household.
Type of migration by duration
Seasonality
51. Moldovan labour migration has a marked seasonal nature. Figure 18 shows
that the number of migrants varies depending on the reference period of the year.
Each year the highest number of emigrants is registered in the third quarter of the
year, and the lowest is in the fourth and first. There are temporary “peaks” during
returns for holidays, vacation and treatment that are usually registered during
December and April.
8 The methodology of the panel survey consisted in contacting the same household in 2006 and 2008.
138,3 172 231,3
291 345,3
394,5 310,1 335,6 309,7 294,9 311 316,9
83,3 101,5 118,7 125,1
393 396,4 429,7 442
0
200
400
600
2000 2001 2002 2003 2004 2005 2006 2007 2008 2009 2010 2011
Population aged 15 years and over, working or looking for work abroad
Economically inacitive because of working abroad
Costs and Benefits of Labour Mobility between the EU and the Eastern Partnership Partner Countries Country Study: Moldova
______________________________________________________________________
29
Figure 18. Trends of migrants, by quarters
Source: NBS: LFS 2007-2011
52. A large number of labour migrants working in Russia return to Moldova
during the winter due to low demand for labour in the construction industry, in
which the majority of Moldovans are employed. Emigration to Russia is facilitated by
the lack of visa requirement, the knowledge of language, and the low costs of travel
and employment. These factors also create opportunities for more frequent returns
than for migrants working in EU countries (see also Błąd! Nie można odnaleźć
źródła odwołania.).
Directions
53. The labour migrant distribution by direction differs substantially from the
distribution of the total number of emigrants from Moldova around the world9 (see
Figures 19 and Figure 20). Taking into account all emigrants originating from
Moldova, in 2010 those in Russia were about 37% of the total number of emigrants,
in Ukraine 22% and Italy is in third place with only 12% (compared with 64%, 1.6%
and 18% in the case of labour migrants. See Figure 19).
54. During the period of the study the labour migration from Moldova is
registered mainly by key destination countries. The Russian Federation and Italy
attracted more than 80 percent of the labour migrant flows (64.6% worked in Russia
and 18.4% in Italy)( LFS 2011).
9 The Moldova general migration flows are not entirely monitored. The international data for Moldova migration are not comparable, because the concept and definition of the migration contingent varies. The WB estimates that over 770 ths Moldovans were abroad in 2010. This number consists of i) people who originated in Moldova, that apparently became citizens of other countries as a result of the USSR collapse, ii) people residing abroad during the Moldovan independence, many of whom were labor migrants, and iii) Moldovan citizens temporarily working abroad or living abroad and seeking employment. Only the last category of people is estimated by surveys on labor migration ( The LFS/ NBS estimate there were 311,000 labor migrants in 2010).
050
100150200250300350400
I II III IV I II III IV I II III IV I II III IV I II III IV
2007 2008 2009 2010 2011
Costs and Benefits of Labour Mobility between the EU and the Eastern Partnership Partner Countries Country Study: Moldova
______________________________________________________________________
30
Figures 19. Destination countries of
Moldovan labour migration (2011)
Figure 20. Distribution of emigrants by
destination country, average for 2001-
2010
Source: NBS, LFS 2011, S: WB, Bilateral Migration and Remittances,2010
55. During the period of 2004-2011, the direction of migrant flows remained
constant with minor changes. The smallest share of emigration (stock) to Russia was
registered in 2009 (60.1 percent), and to Italy in 2004 (16.4 percent) (see Figure 21).
Figure 21. Destination countries of Moldovan labour migration (2004-
2011)
Source: LFS, NBS, * Source: IOM-CBS-AXA Migration and remittances 2004 survey
56. Labour migration from Moldova takes place towards major economic centres,
towns and cities. In 2006, 51.7% of total migrants were reported as working in
Moscow and 4.6% in Rome. (IOM Survey, 2007)
57. There are significant differences in the structure of migrants by country of
destination. Thus, the migrants leaving for the CIS are younger, mostly men, less
educated, and they usually work in construction. In the CIS countries, to where less
0.8%
0.1%
0.1%
0.1%
0.2%
0.2%
0.2%
1.8%
6.5%
0.0% 2.0% 4.0% 6.0% 8.0%
Other countries
Grecia
Romania
Portugalia
Ucraina
Israel
Turcia
Italia
Rusia
Others ; 6%
Germany; 2%
Spain; 2%
Israel; 3%
United States; 3%
Romania; 5%
Other South; 8%
Italy; 12%
Ukraine; 22%
Russia; 37%
6.2% 6.2% 6.3% 6.2% 6.0% 6.2% 6.5%
1.6% 1.8% 1.9% 1.8% 1.9% 1.9% 1.8%
2.2% 2.0% 1.9% 2.0% 2.1% 1.9% 1.7%
0.0%
1.0%
2.0%
3.0%
4.0%
5.0%
6.0%
7.0%
2004* 2006 2007 2008 2009 2010 2011
Russia Italy Other countries
Costs and Benefits of Labour Mobility between the EU and the Eastern Partnership Partner Countries Country Study: Moldova
______________________________________________________________________
31
skilled migrants emigrate, more than half of migrants (53,1%) work as qualified
workers (including in construction) and only 25.0% work as unqualified workers.
58. People leaving for the EU are mainly women and/or people with higher
qualifications and many of them find employment in housekeeping or caretaking.10
For other groups of countries the situation is reverse, 51.5% of migrants in EU
countries work as unqualified workers and 63.2% in other countries.
Reasons and causes of migration
59. Beyond the specifics of each country, the decision to migrate (especially
economic migration) is based on the same motivations, and namely the “rejection -
attraction” patterns. On the one hand there are economic realities such as
unemployment and low wages (rejecting factors) in the home country. On the other
hand there are attraction factors in the host country such as better wages, higher
demand on the labour market, and family reintegration (Smith 1997).
60. The previous studies analysing Moldova’s migration phenomenon provide
sufficient arguments to identify the rejection factors. In 2004, the factors that caused
migration were linked to financial needs and problems (covering basic needs, the
absence of a dwelling or the wish to improve living conditions, absence of a job
/absence of a well-paid job, lack of money for tuition for a family member). The most
important rejection factor is the lack of money to ensure current household
consumption (43.9%), followed by “debt” (21.2%), investments in real-estate
(19.0%), and special consumption such as education tuition, health, furniture, loans
(11.3%). Business investments (especially in agriculture) are insignificant in the
decision to migrate (see Table 2).
Table 2. Facts that determined the departure of migrants (2004) Factors Percent of
respondents
Debt repayment 21.2
Current consumption (foodstuffs, clothes, utilities, household appliances) 43.9
Special consumption (education tuition, health, furniture, loans etc.) 11.3
Home investments (car, house/ apartment, home repairs, wedding celebration,
funeral expenditures, bank accounts) 19.0
Business investments (land, agricultural equipment, minibus, animals etc.) 0.9
Other 1.7
Unaware/No answer 1.5
Source: IOM-CBS-AXA 2004 Migration and remittances survey
61. The 2008 studies again showed three main push factors (Luecke et al, 2009):
consumption (46.8% migrants), lack of jobs (34.3%) and poverty (20.5%). The LFS
approach reflects two major push factors, determined almost entirely by the internal
labour market characteristics: lack of a job and low salary. The occupational status of
10 Migration trends and policies in the Black Sea region: Moldova, Romania and Ukraine, IDIS “Viitorul” 2008
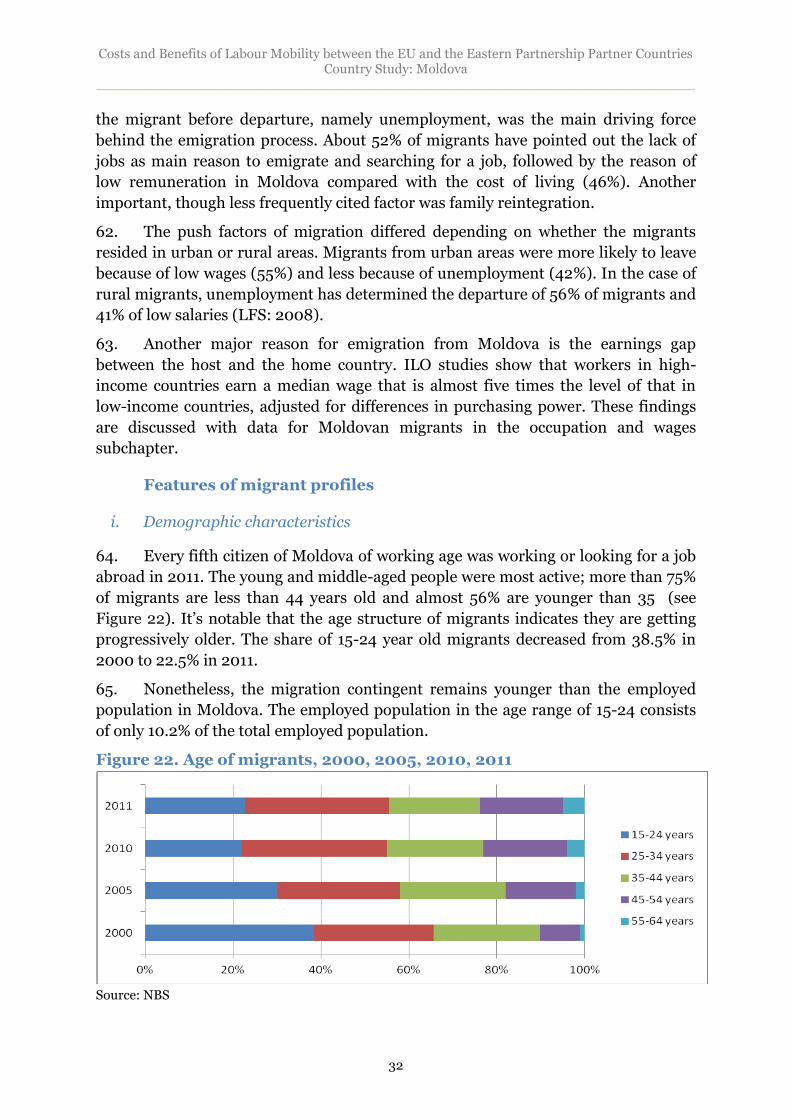
Costs and Benefits of Labour Mobility between the EU and the Eastern Partnership Partner Countries Country Study: Moldova
______________________________________________________________________
32
the migrant before departure, namely unemployment, was the main driving force
behind the emigration process. About 52% of migrants have pointed out the lack of
jobs as main reason to emigrate and searching for a job, followed by the reason of
low remuneration in Moldova compared with the cost of living (46%). Another
important, though less frequently cited factor was family reintegration.
62. The push factors of migration differed depending on whether the migrants
resided in urban or rural areas. Migrants from urban areas were more likely to leave
because of low wages (55%) and less because of unemployment (42%). In the case of
rural migrants, unemployment has determined the departure of 56% of migrants and
41% of low salaries (LFS: 2008).
63. Another major reason for emigration from Moldova is the earnings gap
between the host and the home country. ILO studies show that workers in high-
income countries earn a median wage that is almost five times the level of that in
low-income countries, adjusted for differences in purchasing power. These findings
are discussed with data for Moldovan migrants in the occupation and wages
subchapter.
Features of migrant profiles
i. Demographic characteristics
64. Every fifth citizen of Moldova of working age was working or looking for a job
abroad in 2011. The young and middle-aged people were most active; more than 75%
of migrants are less than 44 years old and almost 56% are younger than 35 (see
Figure 22). It’s notable that the age structure of migrants indicates they are getting
progressively older. The share of 15-24 year old migrants decreased from 38.5% in
2000 to 22.5% in 2011.
65. Nonetheless, the migration contingent remains younger than the employed
population in Moldova. The employed population in the age range of 15-24 consists
of only 10.2% of the total employed population.
Figure 22. Age of migrants, 2000, 2005, 2010, 2011
Source: NBS
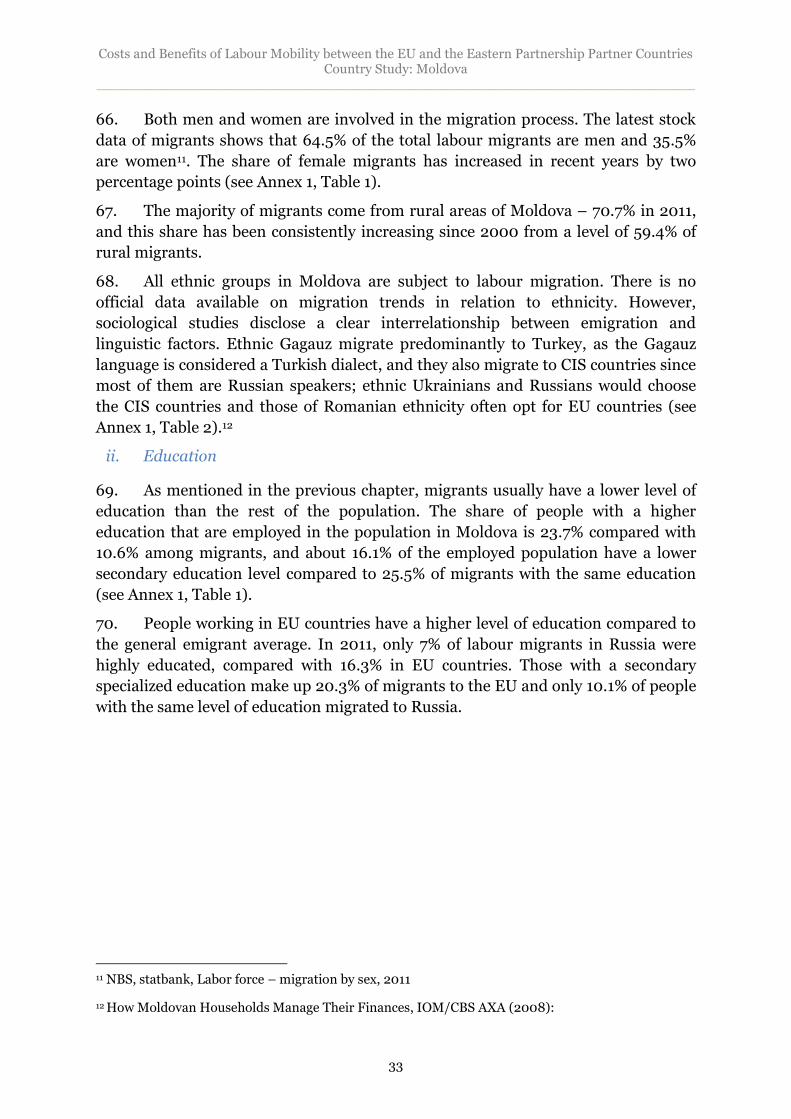
Costs and Benefits of Labour Mobility between the EU and the Eastern Partnership Partner Countries Country Study: Moldova
______________________________________________________________________
33
66. Both men and women are involved in the migration process. The latest stock
data of migrants shows that 64.5% of the total labour migrants are men and 35.5%
are women11. The share of female migrants has increased in recent years by two
percentage points (see Annex 1, Table 1).
67. The majority of migrants come from rural areas of Moldova – 70.7% in 2011,
and this share has been consistently increasing since 2000 from a level of 59.4% of
rural migrants.
68. All ethnic groups in Moldova are subject to labour migration. There is no
official data available on migration trends in relation to ethnicity. However,
sociological studies disclose a clear interrelationship between emigration and
linguistic factors. Ethnic Gagauz migrate predominantly to Turkey, as the Gagauz
language is considered a Turkish dialect, and they also migrate to CIS countries since
most of them are Russian speakers; ethnic Ukrainians and Russians would choose
the CIS countries and those of Romanian ethnicity often opt for EU countries (see
Annex 1, Table 2).12
ii. Education
69. As mentioned in the previous chapter, migrants usually have a lower level of
education than the rest of the population. The share of people with a higher
education that are employed in the population in Moldova is 23.7% compared with
10.6% among migrants, and about 16.1% of the employed population have a lower
secondary education level compared to 25.5% of migrants with the same education
(see Annex 1, Table 1).
70. People working in EU countries have a higher level of education compared to
the general emigrant average. In 2011, only 7% of labour migrants in Russia were
highly educated, compared with 16.3% in EU countries. Those with a secondary
specialized education make up 20.3% of migrants to the EU and only 10.1% of people
with the same level of education migrated to Russia.
11 NBS, statbank, Labor force – migration by sex, 2011
12 How Moldovan Households Manage Their Finances, IOM/CBS AXA (2008):
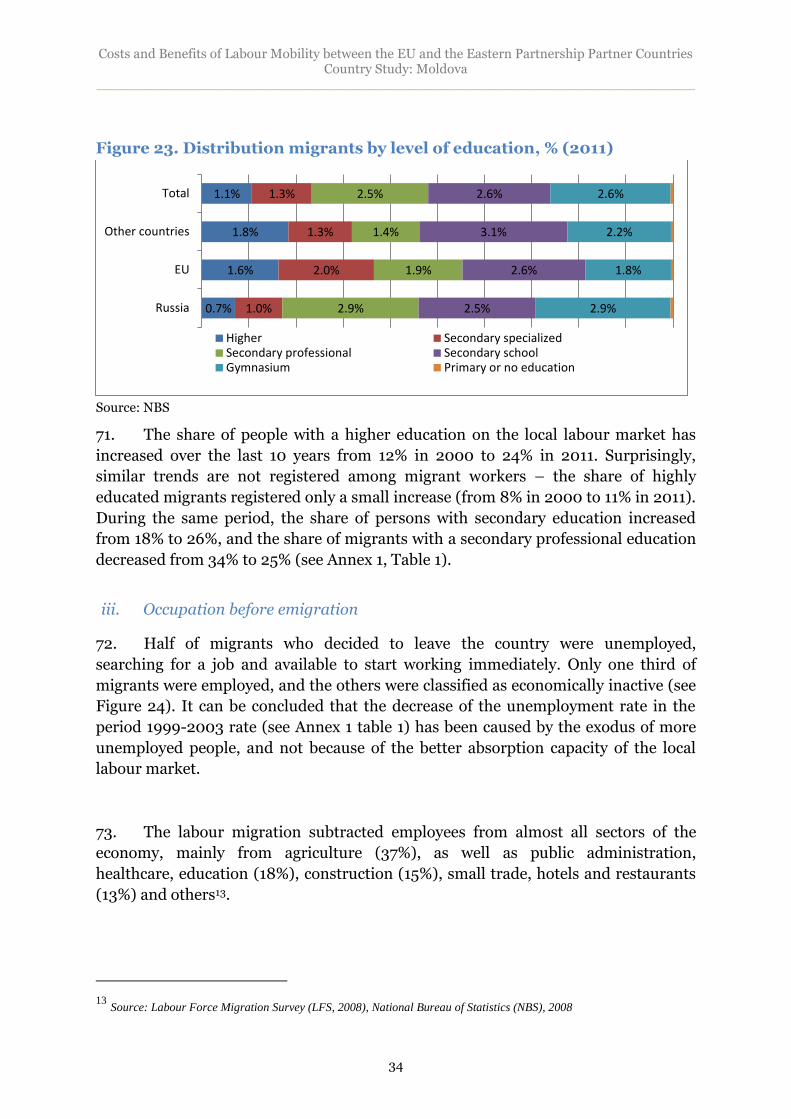
Costs and Benefits of Labour Mobility between the EU and the Eastern Partnership Partner Countries Country Study: Moldova
______________________________________________________________________
34
Figure 23. Distribution migrants by level of education, % (2011)
Source: NBS
71. The share of people with a higher education on the local labour market has
increased over the last 10 years from 12% in 2000 to 24% in 2011. Surprisingly,
similar trends are not registered among migrant workers – the share of highly
educated migrants registered only a small increase (from 8% in 2000 to 11% in 2011).
During the same period, the share of persons with secondary education increased
from 18% to 26%, and the share of migrants with a secondary professional education
decreased from 34% to 25% (see Annex 1, Table 1).
iii. Occupation before emigration
72. Half of migrants who decided to leave the country were unemployed,
searching for a job and available to start working immediately. Only one third of
migrants were employed, and the others were classified as economically inactive (see
Figure 24). It can be concluded that the decrease of the unemployment rate in the
period 1999-2003 rate (see Annex 1 table 1) has been caused by the exodus of more
unemployed people, and not because of the better absorption capacity of the local
labour market.
73. The labour migration subtracted employees from almost all sectors of the
economy, mainly from agriculture (37%), as well as public administration,
healthcare, education (18%), construction (15%), small trade, hotels and restaurants
(13%) and others13.
13 Source: Labour Force Migration Survey (LFS, 2008), National Bureau of Statistics (NBS), 2008
0.7%
1.6%
1.8%
1.1%
1.0%
2.0%
1.3%
1.3%
2.9%
1.9%
1.4%
2.5%
2.5%
2.6%
3.1%
2.6%
2.9%
1.8%
2.2%
2.6%
Russia
EU
Other countries
Total
Higher Secondary specializedSecondary professional Secondary schoolGymnasium Primary or no education
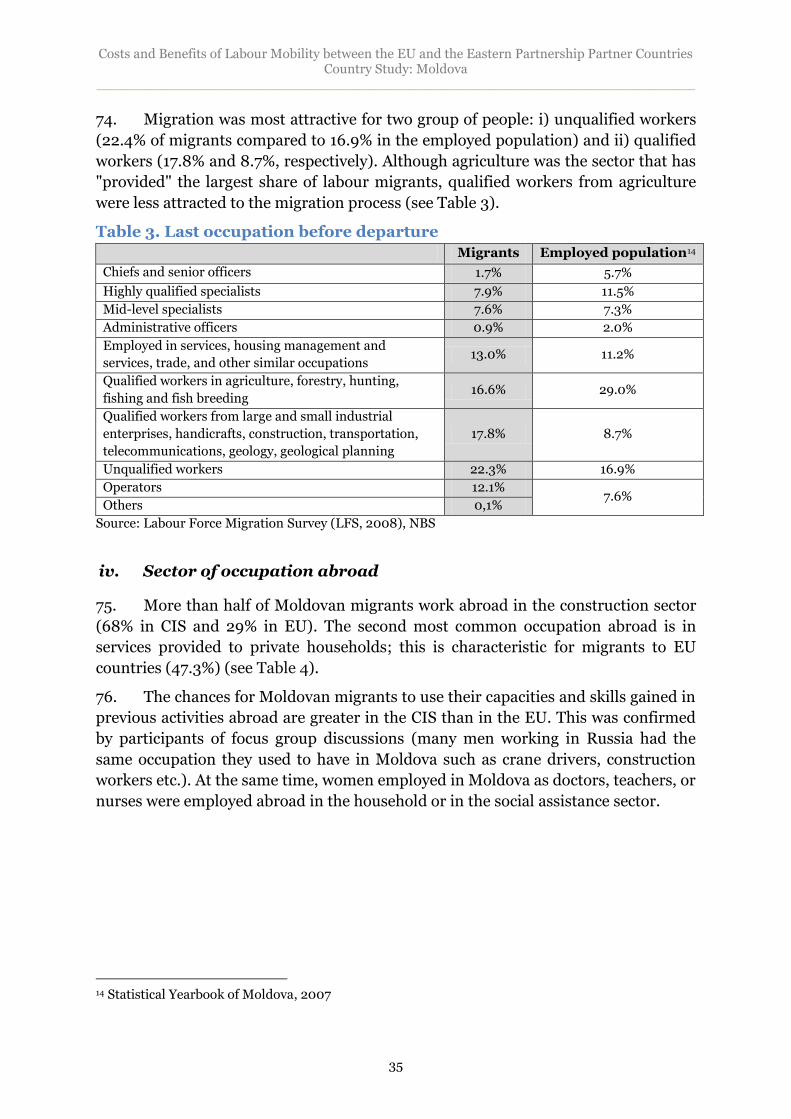
Costs and Benefits of Labour Mobility between the EU and the Eastern Partnership Partner Countries Country Study: Moldova
______________________________________________________________________
35
74. Migration was most attractive for two group of people: i) unqualified workers
(22.4% of migrants compared to 16.9% in the employed population) and ii) qualified
workers (17.8% and 8.7%, respectively). Although agriculture was the sector that has
"provided" the largest share of labour migrants, qualified workers from agriculture
were less attracted to the migration process (see Table 3).
Table 3. Last occupation before departure Migrants Employed population14
Chiefs and senior officers 1.7% 5.7%
Highly qualified specialists 7.9% 11.5%
Mid-level specialists 7.6% 7.3%
Administrative officers 0.9% 2.0%
Employed in services, housing management and
services, trade, and other similar occupations 13.0% 11.2%
Qualified workers in agriculture, forestry, hunting,
fishing and fish breeding 16.6% 29.0%
Qualified workers from large and small industrial
enterprises, handicrafts, construction, transportation,
telecommunications, geology, geological planning
17.8% 8.7%
Unqualified workers 22.3% 16.9%
Operators 12.1% 7.6%
Others 0,1%
Source: Labour Force Migration Survey (LFS, 2008), NBS
iv. Sector of occupation abroad
75. More than half of Moldovan migrants work abroad in the construction sector
(68% in CIS and 29% in EU). The second most common occupation abroad is in
services provided to private households; this is characteristic for migrants to EU
countries (47.3%) (see Table 4).
76. The chances for Moldovan migrants to use their capacities and skills gained in
previous activities abroad are greater in the CIS than in the EU. This was confirmed
by participants of focus group discussions (many men working in Russia had the
same occupation they used to have in Moldova such as crane drivers, construction
workers etc.). At the same time, women employed in Moldova as doctors, teachers, or
nurses were employed abroad in the household or in the social assistance sector.
14 Statistical Yearbook of Moldova, 2007
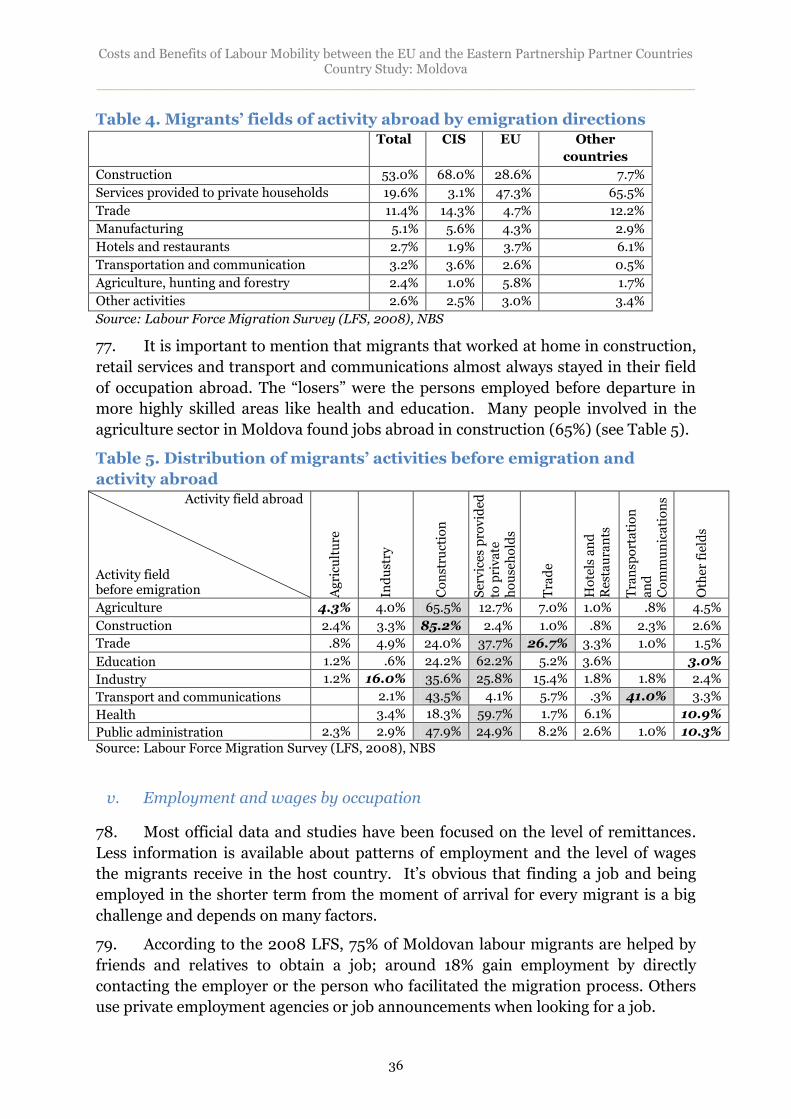
Costs and Benefits of Labour Mobility between the EU and the Eastern Partnership Partner Countries Country Study: Moldova
______________________________________________________________________
36
Table 4. Migrants’ fields of activity abroad by emigration directions Total CIS EU Other
countries
Construction 53.0% 68.0% 28.6% 7.7%
Services provided to private households 19.6% 3.1% 47.3% 65.5%
Trade 11.4% 14.3% 4.7% 12.2%
Manufacturing 5.1% 5.6% 4.3% 2.9%
Hotels and restaurants 2.7% 1.9% 3.7% 6.1%
Transportation and communication 3.2% 3.6% 2.6% 0.5%
Agriculture, hunting and forestry 2.4% 1.0% 5.8% 1.7%
Other activities 2.6% 2.5% 3.0% 3.4%
Source: Labour Force Migration Survey (LFS, 2008), NBS
77. It is important to mention that migrants that worked at home in construction,
retail services and transport and communications almost always stayed in their field
of occupation abroad. The “losers” were the persons employed before departure in
more highly skilled areas like health and education. Many people involved in the
agriculture sector in Moldova found jobs abroad in construction (65%) (see Table 5).
Table 5. Distribution of migrants’ activities before emigration and
activity abroad Activity field abroad
Activity field before emigration A
gri
cult
ure
Ind
ust
ry
Co
nst
ruct
ion
Ser
vic
es p
rov
ided
to
pri
va
te
ho
use
ho
lds
Tra
de
Ho
tels
an
d
Res
tau
ran
ts
Tra
nsp
ort
ati
on
a
nd
C
om
mu
nic
ati
on
s
Oth
er f
ield
s
Agriculture 4.3% 4.0% 65.5% 12.7% 7.0% 1.0% .8% 4.5%
Construction 2.4% 3.3% 85.2% 2.4% 1.0% .8% 2.3% 2.6%
Trade .8% 4.9% 24.0% 37.7% 26.7% 3.3% 1.0% 1.5%
Education 1.2% .6% 24.2% 62.2% 5.2% 3.6% 3.0%
Industry 1.2% 16.0% 35.6% 25.8% 15.4% 1.8% 1.8% 2.4%
Transport and communications 2.1% 43.5% 4.1% 5.7% .3% 41.0% 3.3%
Health 3.4% 18.3% 59.7% 1.7% 6.1% 10.9%
Public administration 2.3% 2.9% 47.9% 24.9% 8.2% 2.6% 1.0% 10.3%
Source: Labour Force Migration Survey (LFS, 2008), NBS
v. Employment and wages by occupation
78. Most official data and studies have been focused on the level of remittances.
Less information is available about patterns of employment and the level of wages
the migrants receive in the host country. It’s obvious that finding a job and being
employed in the shorter term from the moment of arrival for every migrant is a big
challenge and depends on many factors.
79. According to the 2008 LFS, 75% of Moldovan labour migrants are helped by
friends and relatives to obtain a job; around 18% gain employment by directly
contacting the employer or the person who facilitated the migration process. Others
use private employment agencies or job announcements when looking for a job.
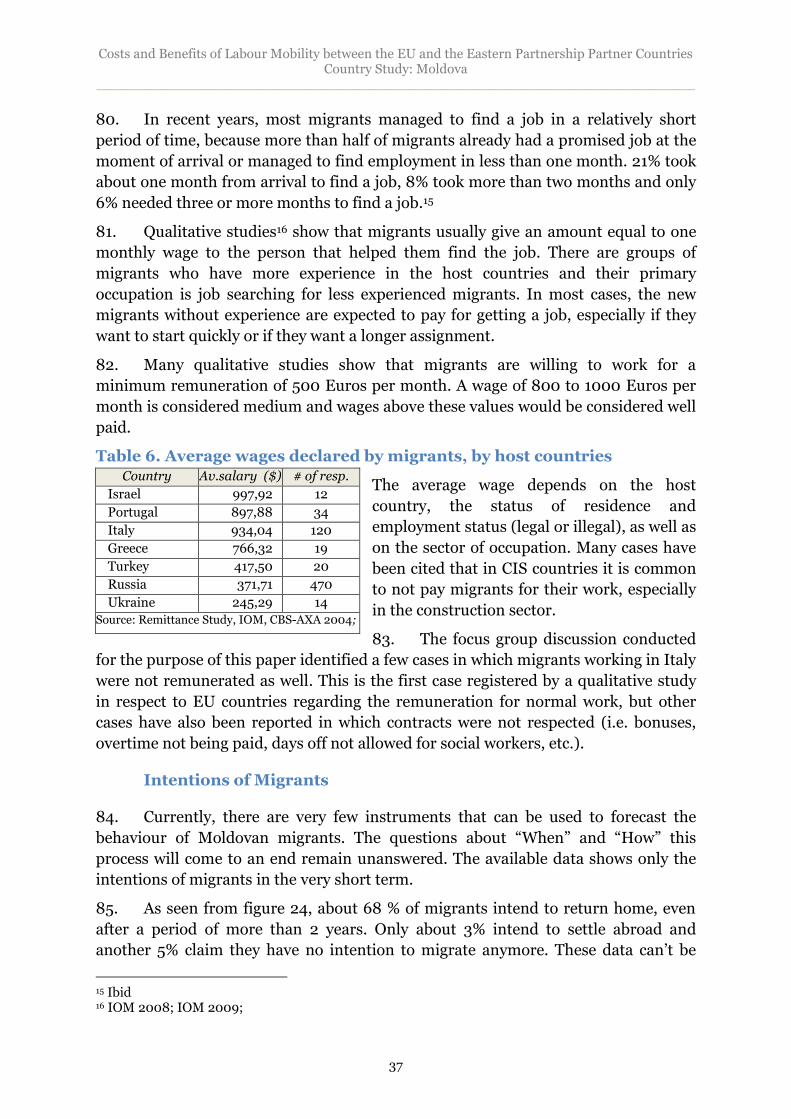
Costs and Benefits of Labour Mobility between the EU and the Eastern Partnership Partner Countries Country Study: Moldova
______________________________________________________________________
37
80. In recent years, most migrants managed to find a job in a relatively short
period of time, because more than half of migrants already had a promised job at the
moment of arrival or managed to find employment in less than one month. 21% took
about one month from arrival to find a job, 8% took more than two months and only
6% needed three or more months to find a job.15
81. Qualitative studies16 show that migrants usually give an amount equal to one
monthly wage to the person that helped them find the job. There are groups of
migrants who have more experience in the host countries and their primary
occupation is job searching for less experienced migrants. In most cases, the new
migrants without experience are expected to pay for getting a job, especially if they
want to start quickly or if they want a longer assignment.
82. Many qualitative studies show that migrants are willing to work for a
minimum remuneration of 500 Euros per month. A wage of 800 to 1000 Euros per
month is considered medium and wages above these values would be considered well
paid.
Table 6. Average wages declared by migrants, by host countries
The average wage depends on the host
country, the status of residence and
employment status (legal or illegal), as well as
on the sector of occupation. Many cases have
been cited that in CIS countries it is common
to not pay migrants for their work, especially
in the construction sector.
83. The focus group discussion conducted
for the purpose of this paper identified a few cases in which migrants working in Italy
were not remunerated as well. This is the first case registered by a qualitative study
in respect to EU countries regarding the remuneration for normal work, but other
cases have also been reported in which contracts were not respected (i.e. bonuses,
overtime not being paid, days off not allowed for social workers, etc.).
Intentions of Migrants
84. Currently, there are very few instruments that can be used to forecast the
behaviour of Moldovan migrants. The questions about “When” and “How” this
process will come to an end remain unanswered. The available data shows only the
intentions of migrants in the very short term.
85. As seen from figure 24, about 68 % of migrants intend to return home, even
after a period of more than 2 years. Only about 3% intend to settle abroad and
another 5% claim they have no intention to migrate anymore. These data can’t be
15 Ibid 16 IOM 2008; IOM 2009;
Country Av.salary ($) # of resp.
Israel 997,92 12
Portugal 897,88 34
Italy 934,04 120
Greece 766,32 19
Turkey 417,50 20
Russia 371,71 470
Ukraine 245,29 14
Source: Remittance Study, IOM, CBS-AXA 2004;
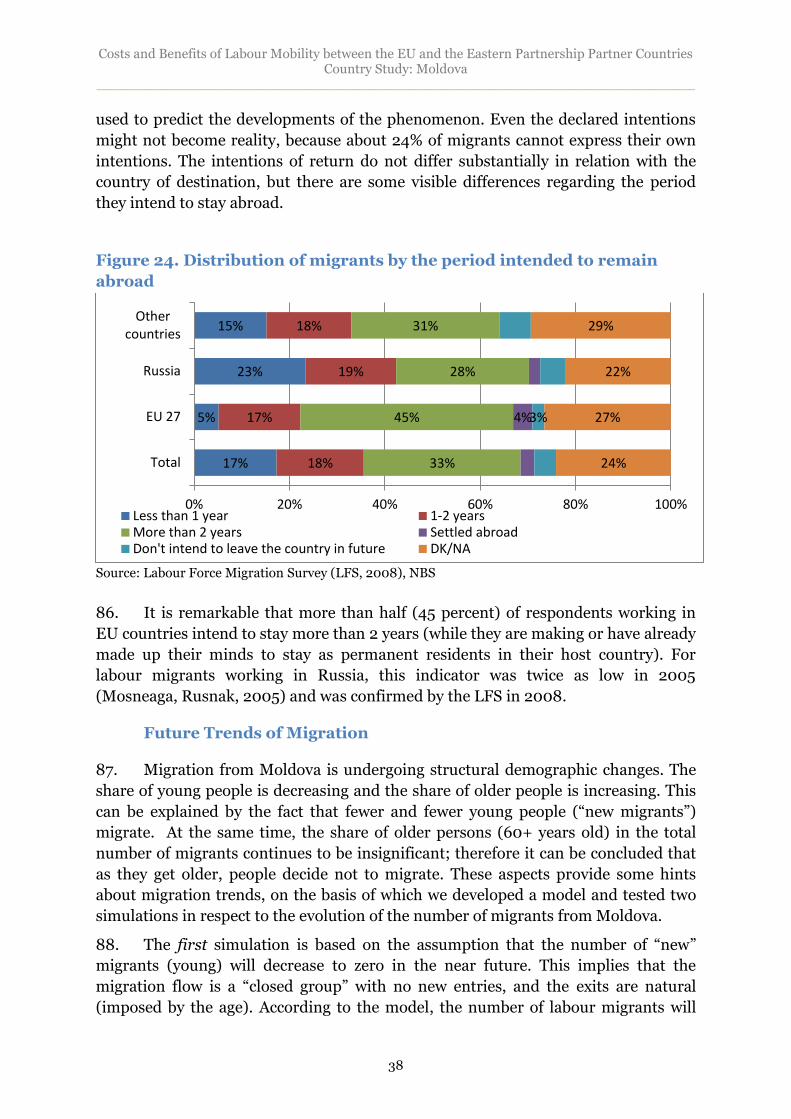
Costs and Benefits of Labour Mobility between the EU and the Eastern Partnership Partner Countries Country Study: Moldova
______________________________________________________________________
38
used to predict the developments of the phenomenon. Even the declared intentions
might not become reality, because about 24% of migrants cannot express their own
intentions. The intentions of return do not differ substantially in relation with the
country of destination, but there are some visible differences regarding the period
they intend to stay abroad.
Figure 24. Distribution of migrants by the period intended to remain
abroad
Source: Labour Force Migration Survey (LFS, 2008), NBS
86. It is remarkable that more than half (45 percent) of respondents working in
EU countries intend to stay more than 2 years (while they are making or have already
made up their minds to stay as permanent residents in their host country). For
labour migrants working in Russia, this indicator was twice as low in 2005
(Mosneaga, Rusnak, 2005) and was confirmed by the LFS in 2008.
Future Trends of Migration
87. Migration from Moldova is undergoing structural demographic changes. The
share of young people is decreasing and the share of older people is increasing. This
can be explained by the fact that fewer and fewer young people (“new migrants”)
migrate. At the same time, the share of older persons (60+ years old) in the total
number of migrants continues to be insignificant; therefore it can be concluded that
as they get older, people decide not to migrate. These aspects provide some hints
about migration trends, on the basis of which we developed a model and tested two
simulations in respect to the evolution of the number of migrants from Moldova.
88. The first simulation is based on the assumption that the number of “new”
migrants (young) will decrease to zero in the near future. This implies that the
migration flow is a “closed group” with no new entries, and the exits are natural
(imposed by the age). According to the model, the number of labour migrants will
17%
5%
23%
15%
18%
17%
19%
18%
33%
45%
28%
31%
4% 3%
24%
27%
22%
29%
0% 20% 40% 60% 80% 100%
Total
EU 27
Russia
Othercountries
Less than 1 year 1-2 yearsMore than 2 years Settled abroadDon't intend to leave the country in future DK/NA
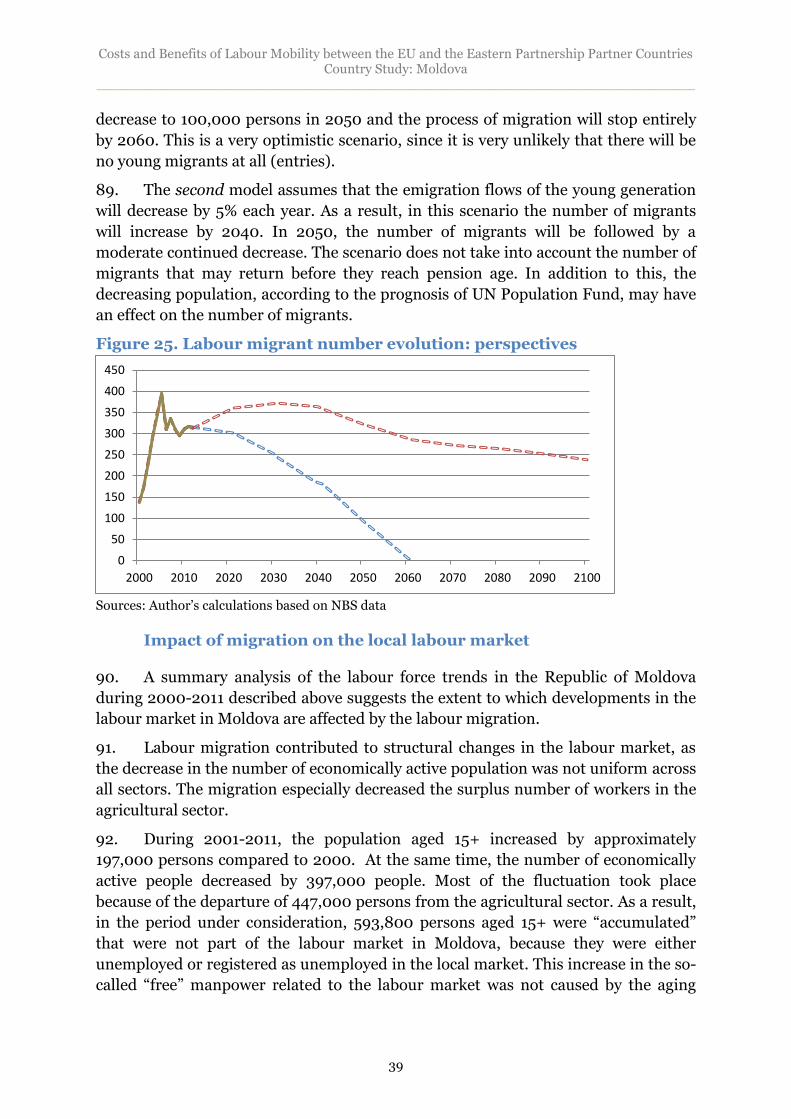
Costs and Benefits of Labour Mobility between the EU and the Eastern Partnership Partner Countries Country Study: Moldova
______________________________________________________________________
39
decrease to 100,000 persons in 2050 and the process of migration will stop entirely
by 2060. This is a very optimistic scenario, since it is very unlikely that there will be
no young migrants at all (entries).
89. The second model assumes that the emigration flows of the young generation
will decrease by 5% each year. As a result, in this scenario the number of migrants
will increase by 2040. In 2050, the number of migrants will be followed by a
moderate continued decrease. The scenario does not take into account the number of
migrants that may return before they reach pension age. In addition to this, the
decreasing population, according to the prognosis of UN Population Fund, may have
an effect on the number of migrants.
Figure 25. Labour migrant number evolution: perspectives
Sources: Author’s calculations based on NBS data
Impact of migration on the local labour market
90. A summary analysis of the labour force trends in the Republic of Moldova
during 2000-2011 described above suggests the extent to which developments in the
labour market in Moldova are affected by the labour migration.
91. Labour migration contributed to structural changes in the labour market, as
the decrease in the number of economically active population was not uniform across
all sectors. The migration especially decreased the surplus number of workers in the
agricultural sector.
92. During 2001-2011, the population aged 15+ increased by approximately
197,000 persons compared to 2000. At the same time, the number of economically
active people decreased by 397,000 people. Most of the fluctuation took place
because of the departure of 447,000 persons from the agricultural sector. As a result,
in the period under consideration, 593,800 persons aged 15+ were “accumulated”
that were not part of the labour market in Moldova, because they were either
unemployed or registered as unemployed in the local market. This increase in the so-
called “free” manpower related to the labour market was not caused by the aging
0
50
100
150
200
250
300
350
400
450
2000 2010 2020 2030 2040 2050 2060 2070 2080 2090 2100
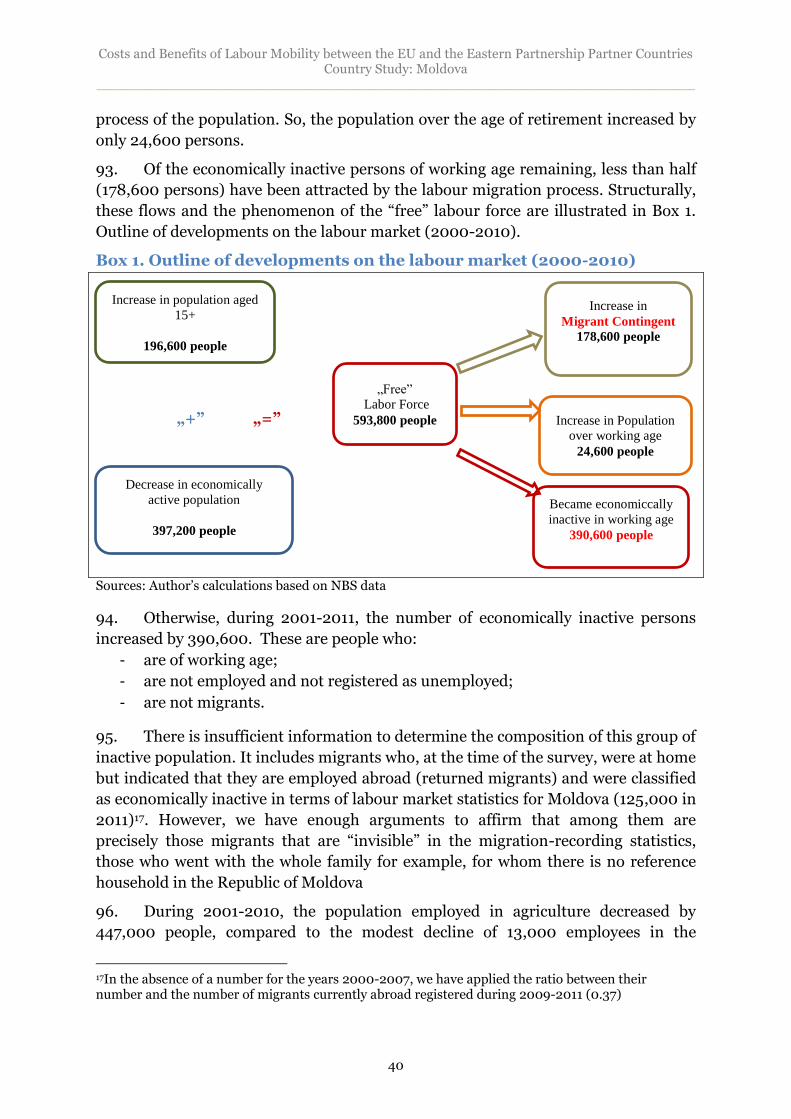
Costs and Benefits of Labour Mobility between the EU and the Eastern Partnership Partner Countries Country Study: Moldova
______________________________________________________________________
40
process of the population. So, the population over the age of retirement increased by
only 24,600 persons.
93. Of the economically inactive persons of working age remaining, less than half
(178,600 persons) have been attracted by the labour migration process. Structurally,
these flows and the phenomenon of the “free” labour force are illustrated in Box 1.
Outline of developments on the labour market (2000-2010).
Box 1. Outline of developments on the labour market (2000-2010)
„+” „=”
Sources: Author’s calculations based on NBS data
94. Otherwise, during 2001-2011, the number of economically inactive persons
increased by 390,600. These are people who:
- are of working age;
- are not employed and not registered as unemployed;
- are not migrants.
95. There is insufficient information to determine the composition of this group of
inactive population. It includes migrants who, at the time of the survey, were at home
but indicated that they are employed abroad (returned migrants) and were classified
as economically inactive in terms of labour market statistics for Moldova (125,000 in
2011)17. However, we have enough arguments to affirm that among them are
precisely those migrants that are “invisible” in the migration-recording statistics,
those who went with the whole family for example, for whom there is no reference
household in the Republic of Moldova
96. During 2001-2010, the population employed in agriculture decreased by
447,000 people, compared to the modest decline of 13,000 employees in the
17In the absence of a number for the years 2000-2007, we have applied the ratio between their number and the number of migrants currently abroad registered during 2009-2011 (0.37)
Increase in population aged
15+
196,600 people
Decrease in economically
active population
397,200 people
„Free”
Labor Force
593,800 people
Increase in
Migrant Contingent
178,600 people
Became economiccally
inactive in working age
390,600 people
196,6 mii persoane
Increase in Population
over working age
24,600 people
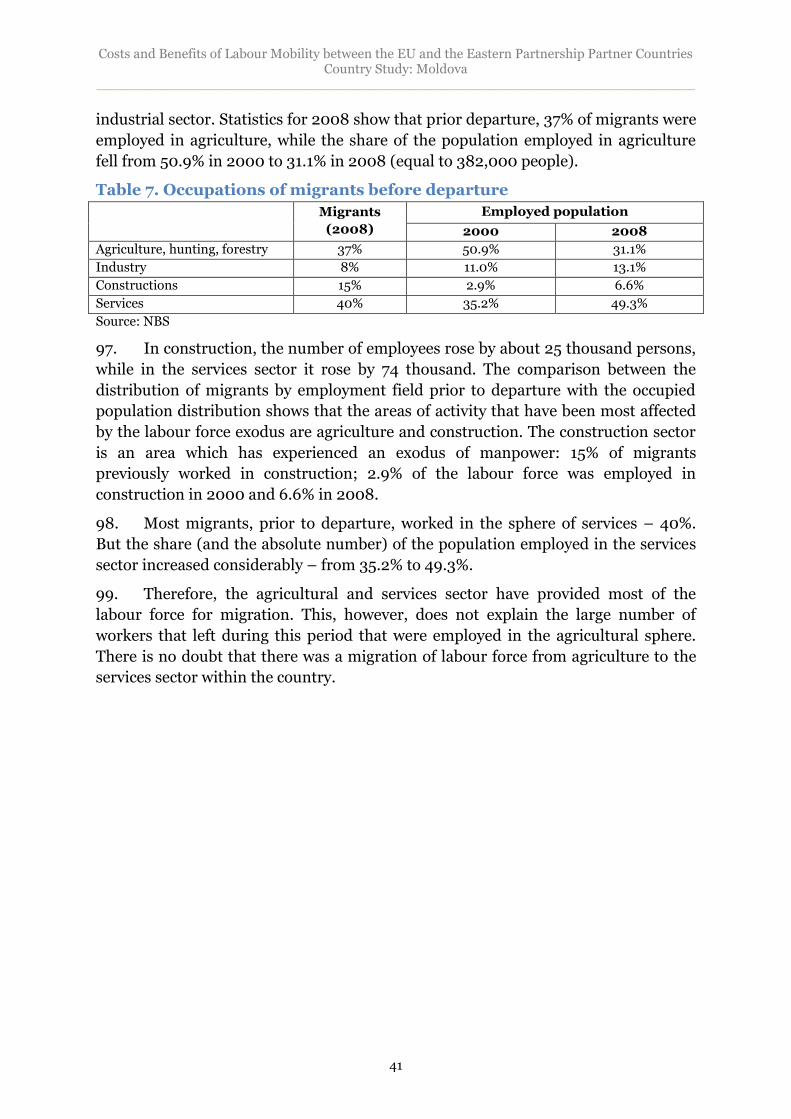
Costs and Benefits of Labour Mobility between the EU and the Eastern Partnership Partner Countries Country Study: Moldova
______________________________________________________________________
41
industrial sector. Statistics for 2008 show that prior departure, 37% of migrants were
employed in agriculture, while the share of the population employed in agriculture
fell from 50.9% in 2000 to 31.1% in 2008 (equal to 382,000 people).
Table 7. Occupations of migrants before departure
Migrants
(2008)
Employed population
2000 2008
Agriculture, hunting, forestry 37% 50.9% 31.1%
Industry 8% 11.0% 13.1%
Constructions 15% 2.9% 6.6%
Services 40% 35.2% 49.3%
Source: NBS
97. In construction, the number of employees rose by about 25 thousand persons,
while in the services sector it rose by 74 thousand. The comparison between the
distribution of migrants by employment field prior to departure with the occupied
population distribution shows that the areas of activity that have been most affected
by the labour force exodus are agriculture and construction. The construction sector
is an area which has experienced an exodus of manpower: 15% of migrants
previously worked in construction; 2.9% of the labour force was employed in
construction in 2000 and 6.6% in 2008.
98. Most migrants, prior to departure, worked in the sphere of services – 40%.
But the share (and the absolute number) of the population employed in the services
sector increased considerably – from 35.2% to 49.3%.
99. Therefore, the agricultural and services sector have provided most of the
labour force for migration. This, however, does not explain the large number of
workers that left during this period that were employed in the agricultural sphere.
There is no doubt that there was a migration of labour force from agriculture to the
services sector within the country.
Costs and Benefits of Labour Mobility between the EU and the Eastern Partnership Partner Countries Country Study: Moldova
______________________________________________________________________
42
Chapter 4. Remittances
Trends of transfer flows by natural persons
100. In Moldova, information on remittances is collected within the Household
Budget Survey (HBS) as part of household income and from the Balance of
Payments. NBS data on remittances are published in different tables under the
category of ‘other income”. Collecting data on remittances as a part of overall
household income is theoretically appropriate but generally self-declared incomes
tend to be under-reported. In the case of Moldova, these figures may also be
seriously under-estimated. This hypothesis is supported by the fact that the number
of household members who were reported to work abroad in the HBS is one fourth
smaller than similar data collected by the LFS and the 2004 Census.18
The most comprehensive time series data on remittances come from Balance of
Payments compiled by the National Bank of Moldova (NBM), which include three
items: i) Employee compensation received from abroad in the BoP income account;
ii) worker’s remittances in the transfer account, and iii) migrants’ transfers. All of
these positions are reflected as Total Remittances in the series and the figures
coincide with flows stated by the WB Migration and Remittances Factbook 2011
database (see Annex 1: Table 1). However, there are many debates around the figures
given by the balance of payments for remittances and few important clarifications
and questions without answers are presented in the next box.
Box 1: Remittances in BoP: important clarifications and questions without answers
According to BPM6 (Sixth Edition of the IMF's Balance of Payments and International Investment Position Manual), remittances represent household income from foreign economies arising mainly from the temporary or permanent movement of people to those economies. BMP 6 provides that Balance of Payment (BoP) does not reflect migration as a process. Estimation of remittances volumes is not a purpose for the BoP items, and no single item or account in the balance of payments framework capture transactions of remittances.
At the same time, the remittances could be find as part of inflows of two items, included in the BoP: 1. Compensation of employees as income earned by workers in economies where they are
not resident (or from non-resident employers).
2. Personal transfers as transfers from residents of one economy to residents of another.
It is important to mention that these items: i) does not include only transfers, generated by the process of labour migration; and ii) The BoP definitions of remittances are somewhat broader than those resulting from movement of persons, because they are not based on the concepts of migration, employment, or family relationships.
Within the discussions and debates on migration and remittances in Moldova so far figures related to remittances have been used inappropriately, being equated to total amount of transfers of money from abroad in favour of physical persons and compensation of employees, from the BoP, published by NBM19.
On the other side, studies show that a significant part of remittances come through informal channels impossible to estimate exactly. One of the ways to estimate the volume of remittances is the social studies. However, these underestimate, as a rule, the volume of remittances due to several reasons,
18 IOM Data Assessment Report
19 http://www.bnm.md/md/balance_of_payments
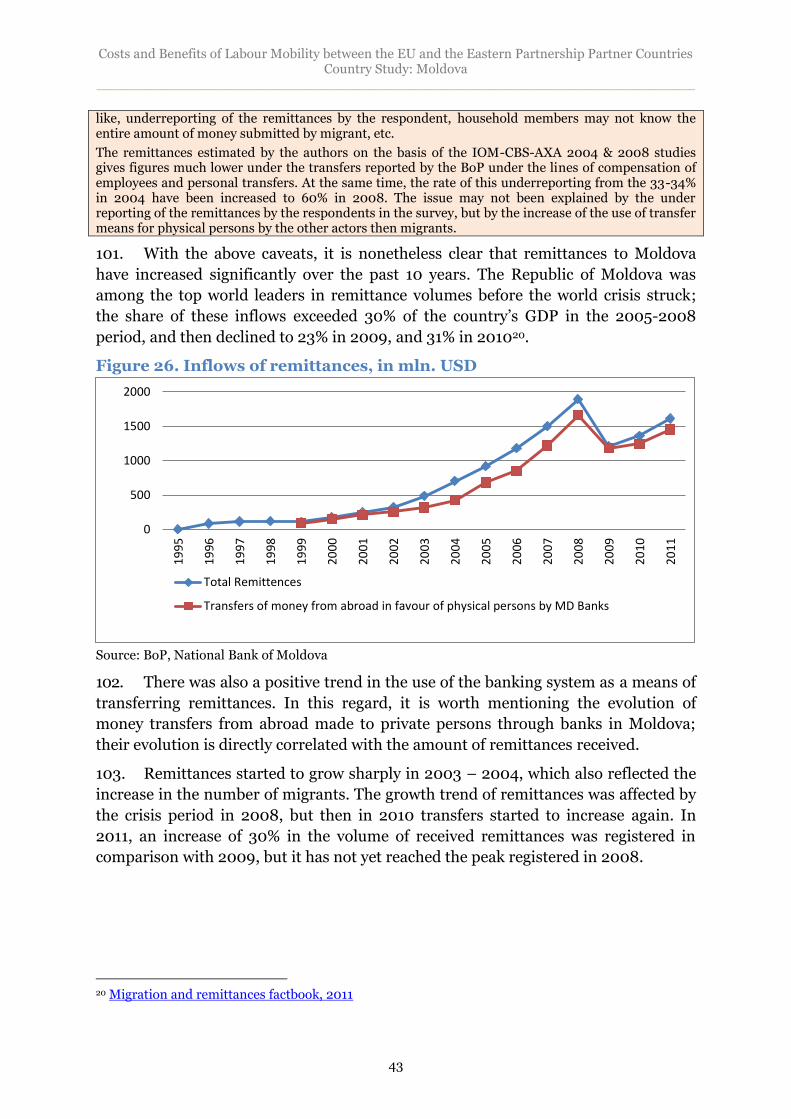
Costs and Benefits of Labour Mobility between the EU and the Eastern Partnership Partner Countries Country Study: Moldova
______________________________________________________________________
43
like, underreporting of the remittances by the respondent, household members may not know the entire amount of money submitted by migrant, etc.
The remittances estimated by the authors on the basis of the IOM-CBS-AXA 2004 & 2008 studies gives figures much lower under the transfers reported by the BoP under the lines of compensation of employees and personal transfers. At the same time, the rate of this underreporting from the 33-34% in 2004 have been increased to 60% in 2008. The issue may not been explained by the under reporting of the remittances by the respondents in the survey, but by the increase of the use of transfer means for physical persons by the other actors then migrants.
101. With the above caveats, it is nonetheless clear that remittances to Moldova
have increased significantly over the past 10 years. The Republic of Moldova was
among the top world leaders in remittance volumes before the world crisis struck;
the share of these inflows exceeded 30% of the country’s GDP in the 2005-2008
period, and then declined to 23% in 2009, and 31% in 201020.
Figure 26. Inflows of remittances, in mln. USD
Source: BoP, National Bank of Moldova
102. There was also a positive trend in the use of the banking system as a means of
transferring remittances. In this regard, it is worth mentioning the evolution of
money transfers from abroad made to private persons through banks in Moldova;
their evolution is directly correlated with the amount of remittances received.
103. Remittances started to grow sharply in 2003 – 2004, which also reflected the
increase in the number of migrants. The growth trend of remittances was affected by
the crisis period in 2008, but then in 2010 transfers started to increase again. In
2011, an increase of 30% in the volume of received remittances was registered in
comparison with 2009, but it has not yet reached the peak registered in 2008.
20 Migration and remittances factbook, 2011
0
500
1000
1500
2000
19
95
19
96
19
97
19
98
19
99
20
00
20
01
20
02
20
03
20
04
20
05
20
06
20
07
20
08
20
09
20
10
20
11
Total Remittences
Transfers of money from abroad in favour of physical persons by MD Banks
Costs and Benefits of Labour Mobility between the EU and the Eastern Partnership Partner Countries Country Study: Moldova
______________________________________________________________________
44
Remittances consumption patterns
104. Remittances have a special role in financing household consumption, and
therefore are an important element that determines the dynamics of the national
economy and directly or indirectly dominate the economic life of each family.
105. Remittance behaviour and patterns differ by profile of migrants: it is useful to
consider a variety of possible determinants, including migrant earnings, their
underlying motivation, the seasonality of migration, the costs of travel to the host
country, and the cost of living in that country21. For example the study conducted by
CBS-AXA and analysed by the Kiel Institute divided migrants into four groups based
on destination country and sector of employment: (i) workers in the construction
industry in CIS countries, (ii) other migrants in CIS countries, (iii) migrants in the
EU; and (iv) all others. These four groups of migrants differ substantially in terms of
sector of occupation, length of stay, legal status, and socioeconomic characteristics. It
is to be expected, therefore, that their remittance behaviour also differs.
106. Migrants use three principal methods to transfer remittances to Moldova:
bank transfers, express money transfer services, and cash transfers, where they may
carry their cash foreign exchange themselves on home visits or may rely on trusted
individuals as informal money couriers. The importance of these transfer channels
varies across migrant groups. Most migrants in the CIS and other non-EU countries,
many of whom were seasonal, most likely brought their earnings back themselves
before 2006-2007.
107. Several studies included in the IOM-CBS-AXA Panel Household Survey 2006-
2008 suggest that remittances transferred to Moldova through formal channels have
most likely contributed to financial sector development (Siegel, 2009). In this
respect, Moldova has made further progress since 2006. Formal channels were used
primarily by more than 60% of migrants in 2008, up from just under 50% in 2006.
The share of migrants (mostly in the EU) who primarily use informal third-party
services (maxi taxi drivers, etc.) declined from 20% in 2006 to 12% in 2008. The
share of personal transfers (through migrants themselves, friends, or relatives),
which were wide-spread among migrants in CIS countries, declined from 32% to 24%
within the 2006-2008 period.
108. Since 2004, different studies have stated that the main direction of use of
remittances is current consumption. In the 2004 IOM-CBS-AXA survey, 43.1% of
respondents mentioned that the largest amount of money was spent on foodstuffs
and clothes, 18.2% of migrant households used the money to pay for utilities etc. The
same survey suggests that in the early phase of migration, the households spent an
important share of remittances on covering debts for the departure of the migrant
(10.4%). The share of remittances used for savings was relatively small: savings “at
21 IOM Survey, 2007 - Luecke, CBS-AXA
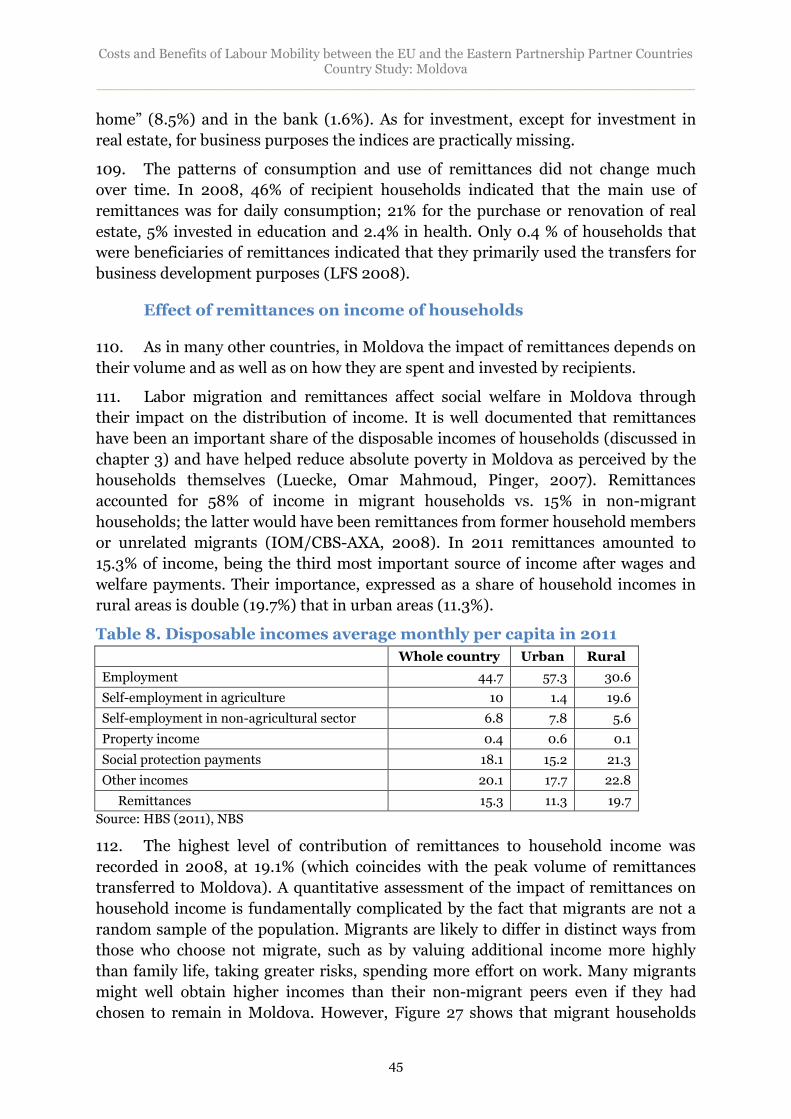
Costs and Benefits of Labour Mobility between the EU and the Eastern Partnership Partner Countries Country Study: Moldova
______________________________________________________________________
45
home” (8.5%) and in the bank (1.6%). As for investment, except for investment in
real estate, for business purposes the indices are practically missing.
109. The patterns of consumption and use of remittances did not change much
over time. In 2008, 46% of recipient households indicated that the main use of
remittances was for daily consumption; 21% for the purchase or renovation of real
estate, 5% invested in education and 2.4% in health. Only 0.4 % of households that
were beneficiaries of remittances indicated that they primarily used the transfers for
business development purposes (LFS 2008).
Effect of remittances on income of households
110. As in many other countries, in Moldova the impact of remittances depends on
their volume and as well as on how they are spent and invested by recipients.
111. Labor migration and remittances affect social welfare in Moldova through
their impact on the distribution of income. It is well documented that remittances
have been an important share of the disposable incomes of households (discussed in
chapter 3) and have helped reduce absolute poverty in Moldova as perceived by the
households themselves (Luecke, Omar Mahmoud, Pinger, 2007). Remittances
accounted for 58% of income in migrant households vs. 15% in non-migrant
households; the latter would have been remittances from former household members
or unrelated migrants (IOM/CBS-AXA, 2008). In 2011 remittances amounted to
15.3% of income, being the third most important source of income after wages and
welfare payments. Their importance, expressed as a share of household incomes in
rural areas is double (19.7%) that in urban areas (11.3%).
Table 8. Disposable incomes average monthly per capita in 2011
Whole country Urban Rural
Employment 44.7 57.3 30.6
Self-employment in agriculture 10 1.4 19.6
Self-employment in non-agricultural sector 6.8 7.8 5.6
Property income 0.4 0.6 0.1
Social protection payments 18.1 15.2 21.3
Other incomes 20.1 17.7 22.8
Remittances 15.3 11.3 19.7
Source: HBS (2011), NBS
112. The highest level of contribution of remittances to household income was
recorded in 2008, at 19.1% (which coincides with the peak volume of remittances
transferred to Moldova). A quantitative assessment of the impact of remittances on
household income is fundamentally complicated by the fact that migrants are not a
random sample of the population. Migrants are likely to differ in distinct ways from
those who choose not migrate, such as by valuing additional income more highly
than family life, taking greater risks, spending more effort on work. Many migrants
might well obtain higher incomes than their non-migrant peers even if they had
chosen to remain in Moldova. However, Figure 27 shows that migrant households
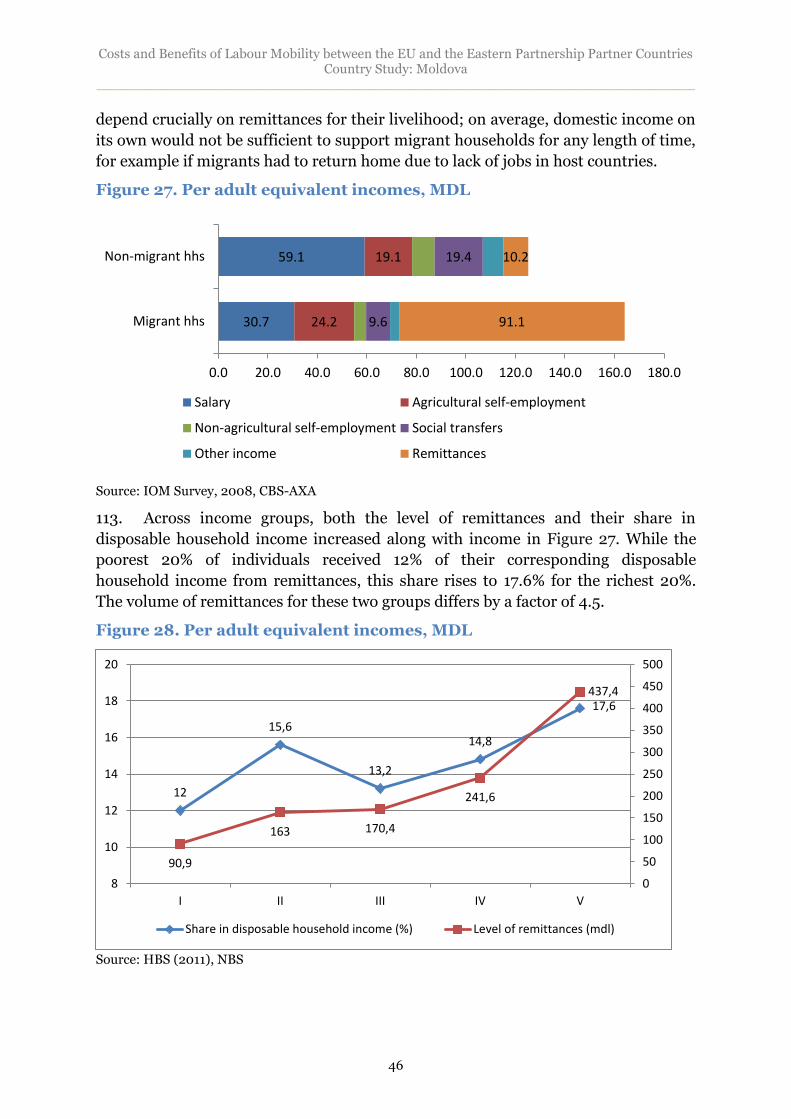
Costs and Benefits of Labour Mobility between the EU and the Eastern Partnership Partner Countries Country Study: Moldova
______________________________________________________________________
46
depend crucially on remittances for their livelihood; on average, domestic income on
its own would not be sufficient to support migrant households for any length of time,
for example if migrants had to return home due to lack of jobs in host countries.
Figure 27. Per adult equivalent incomes, MDL
Source: IOM Survey, 2008, CBS-AXA
113. Across income groups, both the level of remittances and their share in
disposable household income increased along with income in Figure 27. While the
poorest 20% of individuals received 12% of their corresponding disposable
household income from remittances, this share rises to 17.6% for the richest 20%.
The volume of remittances for these two groups differs by a factor of 4.5.
Figure 28. Per adult equivalent incomes, MDL
Source: HBS (2011), NBS
30.7
59.1
24.2
19.1
9.6
19.4
91.1
10.2
0.0 20.0 40.0 60.0 80.0 100.0 120.0 140.0 160.0 180.0
Migrant hhs
Non-migrant hhs
Salary Agricultural self-employment
Non-agricultural self-employment Social transfers
Other income Remittances
12
15,6
13,2
14,8
17,6
90,9
163 170,4
241,6
437,4
0
50
100
150
200
250
300
350
400
450
500
8
10
12
14
16
18
20
I II III IV V
Share in disposable household income (%) Level of remittances (mdl)
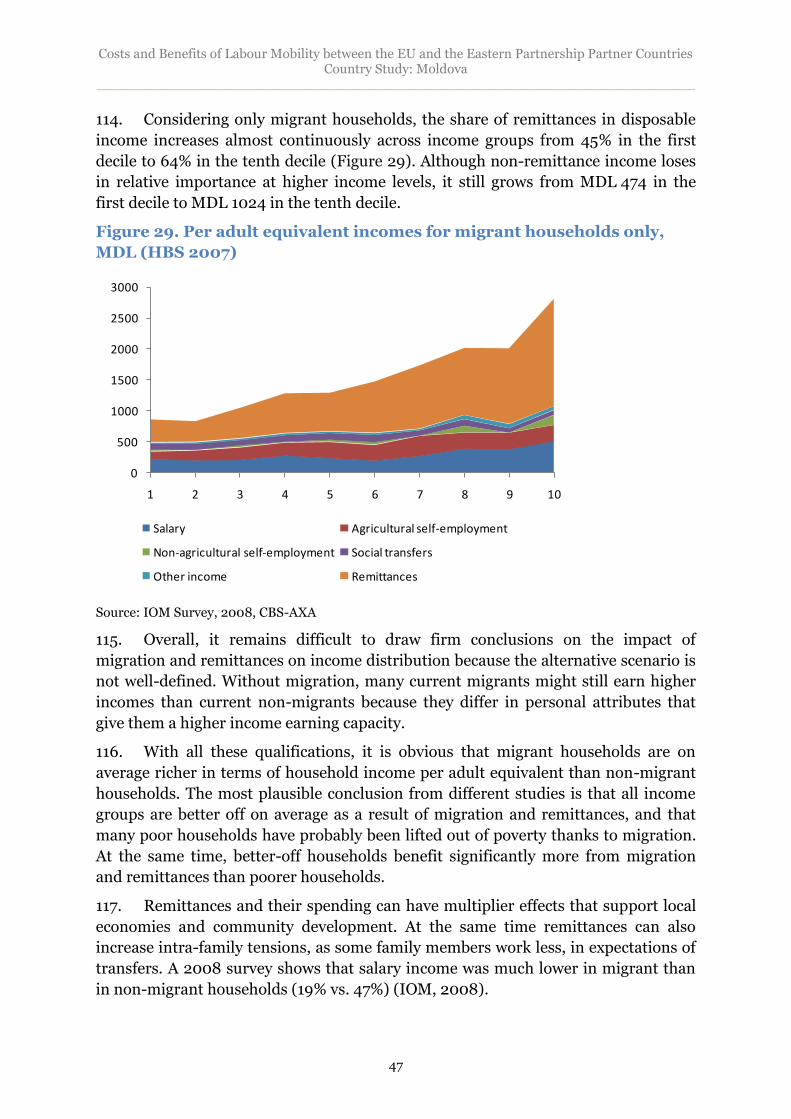
Costs and Benefits of Labour Mobility between the EU and the Eastern Partnership Partner Countries Country Study: Moldova
______________________________________________________________________
47
114. Considering only migrant households, the share of remittances in disposable
income increases almost continuously across income groups from 45% in the first
decile to 64% in the tenth decile (Figure 29). Although non-remittance income loses
in relative importance at higher income levels, it still grows from MDL 474 in the
first decile to MDL 1024 in the tenth decile.
Figure 29. Per adult equivalent incomes for migrant households only,
MDL (HBS 2007)
Source: IOM Survey, 2008, CBS-AXA
115. Overall, it remains difficult to draw firm conclusions on the impact of
migration and remittances on income distribution because the alternative scenario is
not well-defined. Without migration, many current migrants might still earn higher
incomes than current non-migrants because they differ in personal attributes that
give them a higher income earning capacity.
116. With all these qualifications, it is obvious that migrant households are on
average richer in terms of household income per adult equivalent than non-migrant
households. The most plausible conclusion from different studies is that all income
groups are better off on average as a result of migration and remittances, and that
many poor households have probably been lifted out of poverty thanks to migration.
At the same time, better-off households benefit significantly more from migration
and remittances than poorer households.
117. Remittances and their spending can have multiplier effects that support local
economies and community development. At the same time remittances can also
increase intra-family tensions, as some family members work less, in expectations of
transfers. A 2008 survey shows that salary income was much lower in migrant than
in non-migrant households (19% vs. 47%) (IOM, 2008).
0
500
1000
1500
2000
2500
3000
1 2 3 4 5 6 7 8 9 10
Salary Agricultural self-employment
Non-agricultural self-employment Social transfers
Other income Remittances
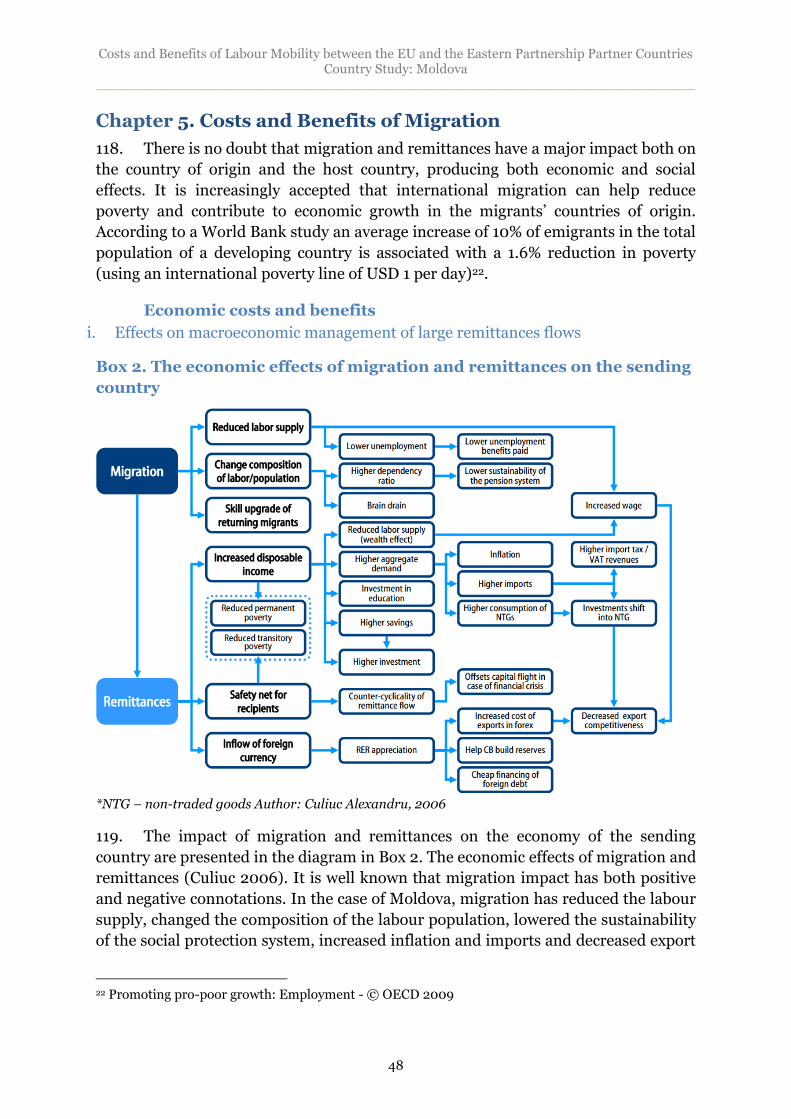
Costs and Benefits of Labour Mobility between the EU and the Eastern Partnership Partner Countries Country Study: Moldova
______________________________________________________________________
48
Chapter 5. Costs and Benefits of Migration
118. There is no doubt that migration and remittances have a major impact both on
the country of origin and the host country, producing both economic and social
effects. It is increasingly accepted that international migration can help reduce
poverty and contribute to economic growth in the migrants’ countries of origin.
According to a World Bank study an average increase of 10% of emigrants in the total
population of a developing country is associated with a 1.6% reduction in poverty
(using an international poverty line of USD 1 per day)22.
Economic costs and benefits
i. Effects on macroeconomic management of large remittances flows
Box 2. The economic effects of migration and remittances on the sending
country
*NTG – non-traded goods Author: Culiuc Alexandru, 2006
119. The impact of migration and remittances on the economy of the sending
country are presented in the diagram in Box 2. The economic effects of migration and
remittances (Culiuc 2006). It is well known that migration impact has both positive
and negative connotations. In the case of Moldova, migration has reduced the labour
supply, changed the composition of the labour population, lowered the sustainability
of the social protection system, increased inflation and imports and decreased export
22 Promoting pro-poor growth: Employment - © OECD 2009
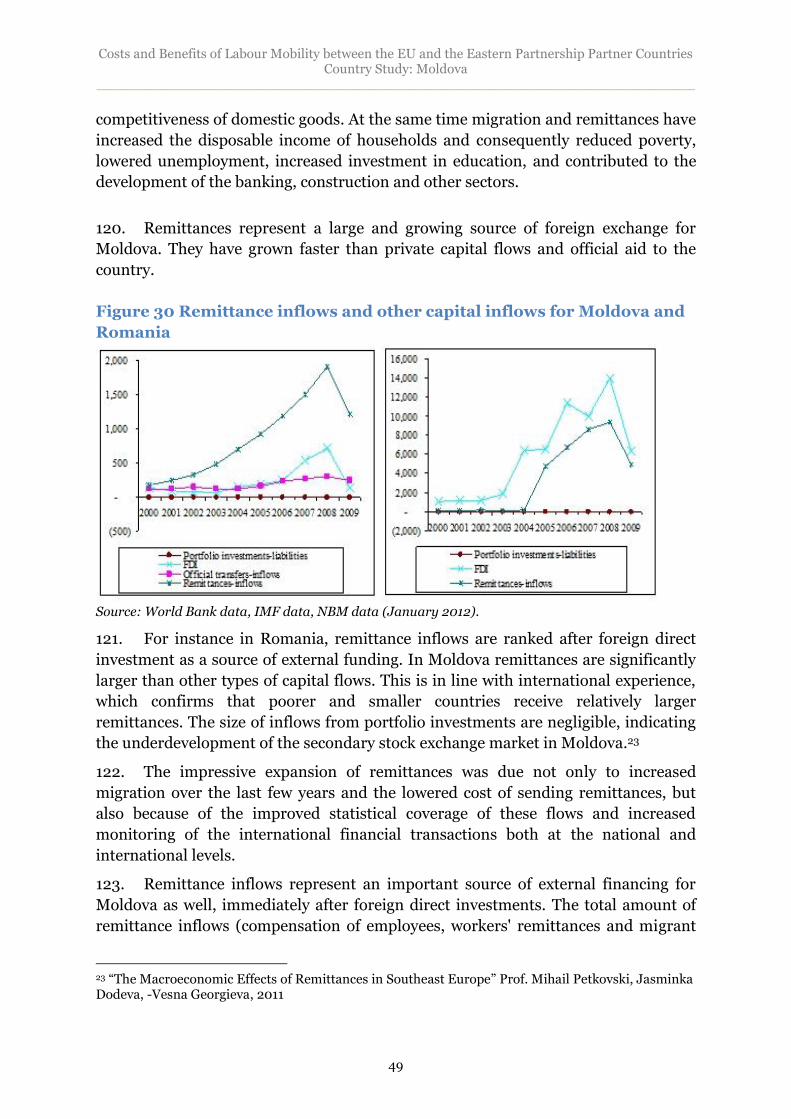
Costs and Benefits of Labour Mobility between the EU and the Eastern Partnership Partner Countries Country Study: Moldova
______________________________________________________________________
49
competitiveness of domestic goods. At the same time migration and remittances have
increased the disposable income of households and consequently reduced poverty,
lowered unemployment, increased investment in education, and contributed to the
development of the banking, construction and other sectors.
120. Remittances represent a large and growing source of foreign exchange for
Moldova. They have grown faster than private capital flows and official aid to the
country.
Figure 30 Remittance inflows and other capital inflows for Moldova and
Romania
Source: World Bank data, IMF data, NBM data (January 2012).
121. For instance in Romania, remittance inflows are ranked after foreign direct
investment as a source of external funding. In Moldova remittances are significantly
larger than other types of capital flows. This is in line with international experience,
which confirms that poorer and smaller countries receive relatively larger
remittances. The size of inflows from portfolio investments are negligible, indicating
the underdevelopment of the secondary stock exchange market in Moldova.23
122. The impressive expansion of remittances was due not only to increased
migration over the last few years and the lowered cost of sending remittances, but
also because of the improved statistical coverage of these flows and increased
monitoring of the international financial transactions both at the national and
international levels.
123. Remittance inflows represent an important source of external financing for
Moldova as well, immediately after foreign direct investments. The total amount of
remittance inflows (compensation of employees, workers' remittances and migrant
23 “The Macroeconomic Effects of Remittances in Southeast Europe” Prof. Mihail Petkovski, Jasminka Dodeva, -Vesna Georgieva, 2011
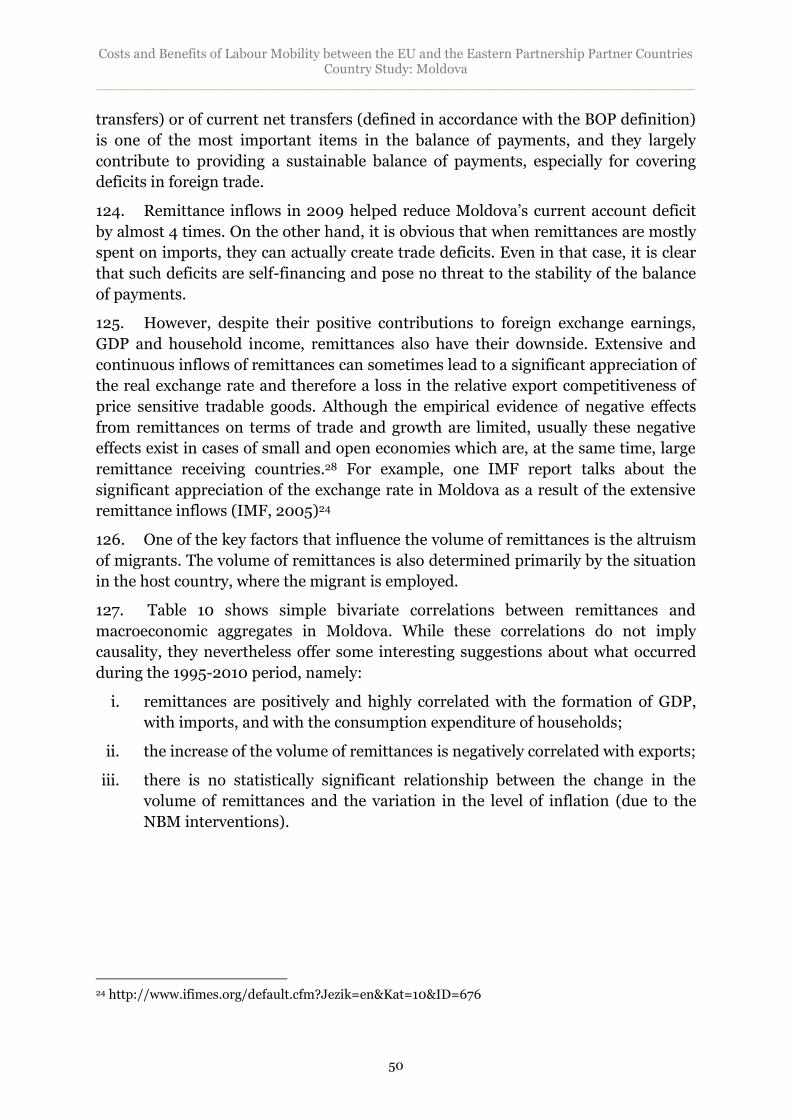
Costs and Benefits of Labour Mobility between the EU and the Eastern Partnership Partner Countries Country Study: Moldova
______________________________________________________________________
50
transfers) or of current net transfers (defined in accordance with the BOP definition)
is one of the most important items in the balance of payments, and they largely
contribute to providing a sustainable balance of payments, especially for covering
deficits in foreign trade.
124. Remittance inflows in 2009 helped reduce Moldova’s current account deficit
by almost 4 times. On the other hand, it is obvious that when remittances are mostly
spent on imports, they can actually create trade deficits. Even in that case, it is clear
that such deficits are self-financing and pose no threat to the stability of the balance
of payments.
125. However, despite their positive contributions to foreign exchange earnings,
GDP and household income, remittances also have their downside. Extensive and
continuous inflows of remittances can sometimes lead to a significant appreciation of
the real exchange rate and therefore a loss in the relative export competitiveness of
price sensitive tradable goods. Although the empirical evidence of negative effects
from remittances on terms of trade and growth are limited, usually these negative
effects exist in cases of small and open economies which are, at the same time, large
remittance receiving countries.28 For example, one IMF report talks about the
significant appreciation of the exchange rate in Moldova as a result of the extensive
remittance inflows (IMF, 2005)24
126. One of the key factors that influence the volume of remittances is the altruism
of migrants. The volume of remittances is also determined primarily by the situation
in the host country, where the migrant is employed.
127. Table 10 shows simple bivariate correlations between remittances and
macroeconomic aggregates in Moldova. While these correlations do not imply
causality, they nevertheless offer some interesting suggestions about what occurred
during the 1995-2010 period, namely:
i. remittances are positively and highly correlated with the formation of GDP,
with imports, and with the consumption expenditure of households;
ii. the increase of the volume of remittances is negatively correlated with exports;
iii. there is no statistically significant relationship between the change in the
volume of remittances and the variation in the level of inflation (due to the
NBM interventions).
24 http://www.ifimes.org/default.cfm?Jezik=en&Kat=10&ID=676
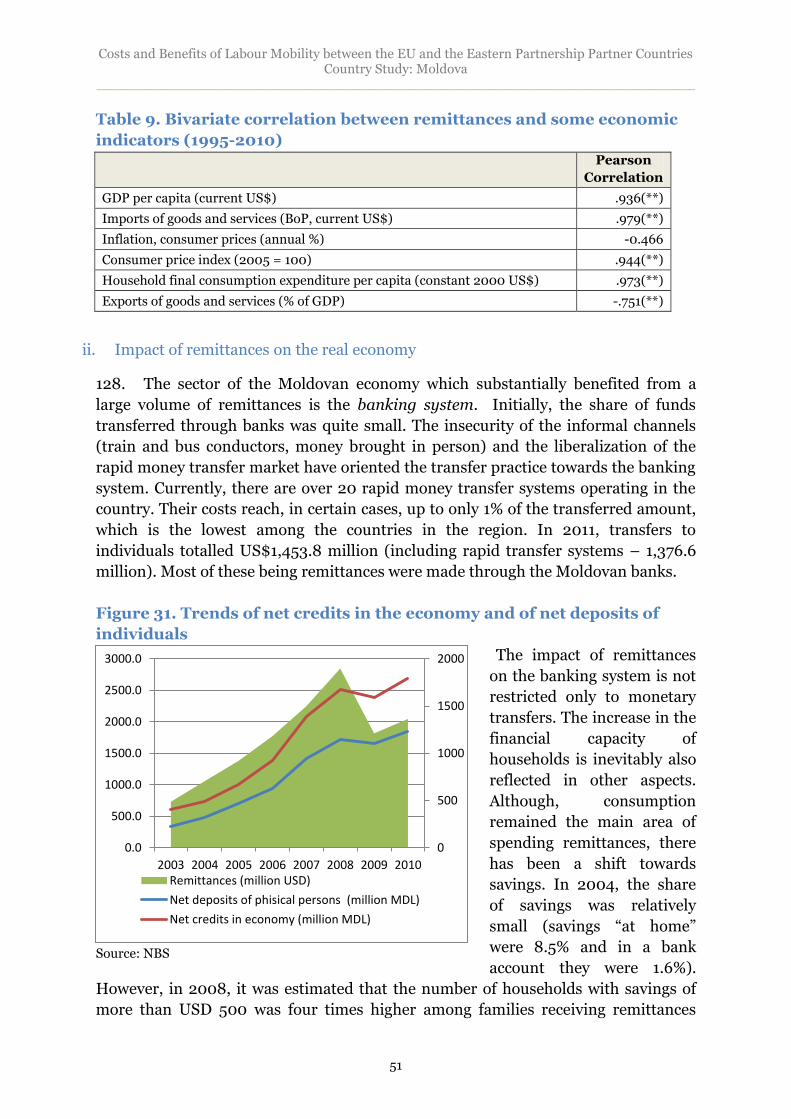
Costs and Benefits of Labour Mobility between the EU and the Eastern Partnership Partner Countries Country Study: Moldova
______________________________________________________________________
51
Table 9. Bivariate correlation between remittances and some economic
indicators (1995-2010)
Pearson
Correlation
GDP per capita (current US$) .936(**)
Imports of goods and services (BoP, current US$) .979(**)
Inflation, consumer prices (annual %) -0.466
Consumer price index (2005 = 100) .944(**)
Household final consumption expenditure per capita (constant 2000 US$) .973(**)
Exports of goods and services (% of GDP) -.751(**)
ii. Impact of remittances on the real economy
128. The sector of the Moldovan economy which substantially benefited from a
large volume of remittances is the banking system. Initially, the share of funds
transferred through banks was quite small. The insecurity of the informal channels
(train and bus conductors, money brought in person) and the liberalization of the
rapid money transfer market have oriented the transfer practice towards the banking
system. Currently, there are over 20 rapid money transfer systems operating in the
country. Their costs reach, in certain cases, up to only 1% of the transferred amount,
which is the lowest among the countries in the region. In 2011, transfers to
individuals totalled US$1,453.8 million (including rapid transfer systems – 1,376.6
million). Most of these being remittances were made through the Moldovan banks.
Figure 31. Trends of net credits in the economy and of net deposits of
individuals
The impact of remittances
on the banking system is not
restricted only to monetary
transfers. The increase in the
financial capacity of
households is inevitably also
reflected in other aspects.
Although, consumption
remained the main area of
spending remittances, there
has been a shift towards
savings. In 2004, the share
of savings was relatively
small (savings “at home”
were 8.5% and in a bank
account they were 1.6%).
However, in 2008, it was estimated that the number of households with savings of
more than USD 500 was four times higher among families receiving remittances
Source: NBS
0
500
1000
1500
2000
0.0
500.0
1000.0
1500.0
2000.0
2500.0
3000.0
2003 2004 2005 2006 2007 2008 2009 2010Remittances (million USD)
Net deposits of phisical persons (million MDL)
Net credits in economy (million MDL)
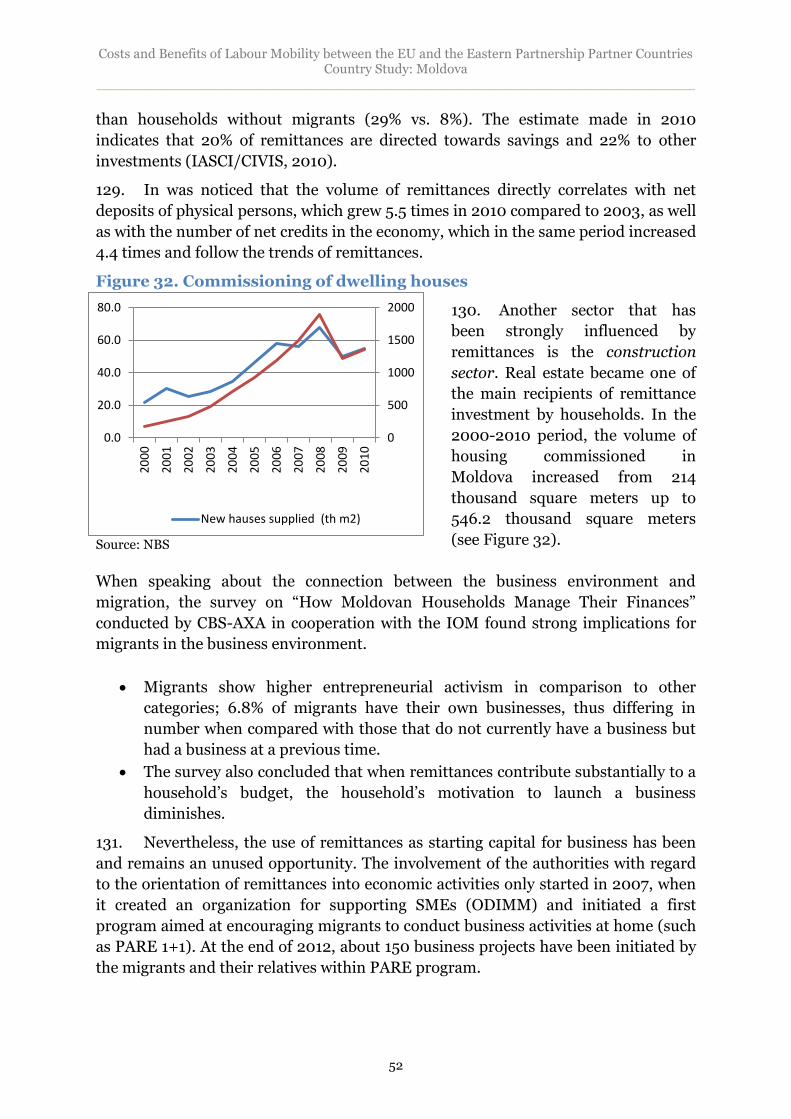
Costs and Benefits of Labour Mobility between the EU and the Eastern Partnership Partner Countries Country Study: Moldova
______________________________________________________________________
52
than households without migrants (29% vs. 8%). The estimate made in 2010
indicates that 20% of remittances are directed towards savings and 22% to other
investments (IASCI/CIVIS, 2010).
129. In was noticed that the volume of remittances directly correlates with net
deposits of physical persons, which grew 5.5 times in 2010 compared to 2003, as well
as with the number of net credits in the economy, which in the same period increased
4.4 times and follow the trends of remittances.
Figure 32. Commissioning of dwelling houses
130. Another sector that has
been strongly influenced by
remittances is the construction
sector. Real estate became one of
the main recipients of remittance
investment by households. In the
2000-2010 period, the volume of
housing commissioned in
Moldova increased from 214
thousand square meters up to
546.2 thousand square meters
(see Figure 32).
When speaking about the connection between the business environment and
migration, the survey on “How Moldovan Households Manage Their Finances”
conducted by CBS-AXA in cooperation with the IOM found strong implications for
migrants in the business environment.
Migrants show higher entrepreneurial activism in comparison to other
categories; 6.8% of migrants have their own businesses, thus differing in
number when compared with those that do not currently have a business but
had a business at a previous time.
The survey also concluded that when remittances contribute substantially to a
household’s budget, the household’s motivation to launch a business
diminishes.
131. Nevertheless, the use of remittances as starting capital for business has been
and remains an unused opportunity. The involvement of the authorities with regard
to the orientation of remittances into economic activities only started in 2007, when
it created an organization for supporting SMEs (ODIMM) and initiated a first
program aimed at encouraging migrants to conduct business activities at home (such
as PARE 1+1). At the end of 2012, about 150 business projects have been initiated by
the migrants and their relatives within PARE program.
Source: NBS
0
500
1000
1500
2000
0.0
20.0
40.0
60.0
80.0
20
00
20
01
20
02
20
03
20
04
20
05
20
06
20
07
20
08
20
09
20
10
New hauses supplied (th m2)
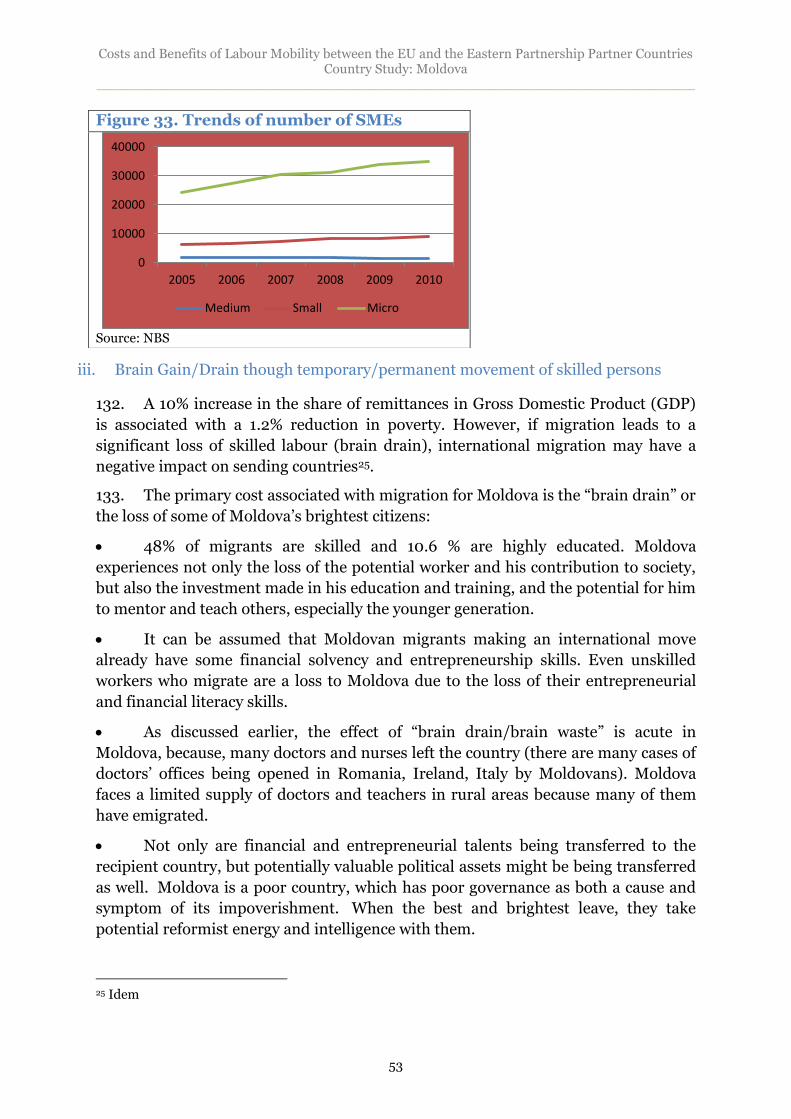
Costs and Benefits of Labour Mobility between the EU and the Eastern Partnership Partner Countries Country Study: Moldova
______________________________________________________________________
53
iii. Brain Gain/Drain though temporary/permanent movement of skilled persons
132. A 10% increase in the share of remittances in Gross Domestic Product (GDP)
is associated with a 1.2% reduction in poverty. However, if migration leads to a
significant loss of skilled labour (brain drain), international migration may have a
negative impact on sending countries25.
133. The primary cost associated with migration for Moldova is the “brain drain” or
the loss of some of Moldova’s brightest citizens:
48% of migrants are skilled and 10.6 % are highly educated. Moldova
experiences not only the loss of the potential worker and his contribution to society,
but also the investment made in his education and training, and the potential for him
to mentor and teach others, especially the younger generation.
It can be assumed that Moldovan migrants making an international move
already have some financial solvency and entrepreneurship skills. Even unskilled
workers who migrate are a loss to Moldova due to the loss of their entrepreneurial
and financial literacy skills.
As discussed earlier, the effect of “brain drain/brain waste” is acute in
Moldova, because, many doctors and nurses left the country (there are many cases of
doctors’ offices being opened in Romania, Ireland, Italy by Moldovans). Moldova
faces a limited supply of doctors and teachers in rural areas because many of them
have emigrated.
Not only are financial and entrepreneurial talents being transferred to the
recipient country, but potentially valuable political assets might be being transferred
as well. Moldova is a poor country, which has poor governance as both a cause and
symptom of its impoverishment. When the best and brightest leave, they take
potential reformist energy and intelligence with them.
25 Idem
Figure 33. Trends of number of SMEs
Source: NBS
0
10000
20000
30000
40000
2005 2006 2007 2008 2009 2010
Medium Small Micro
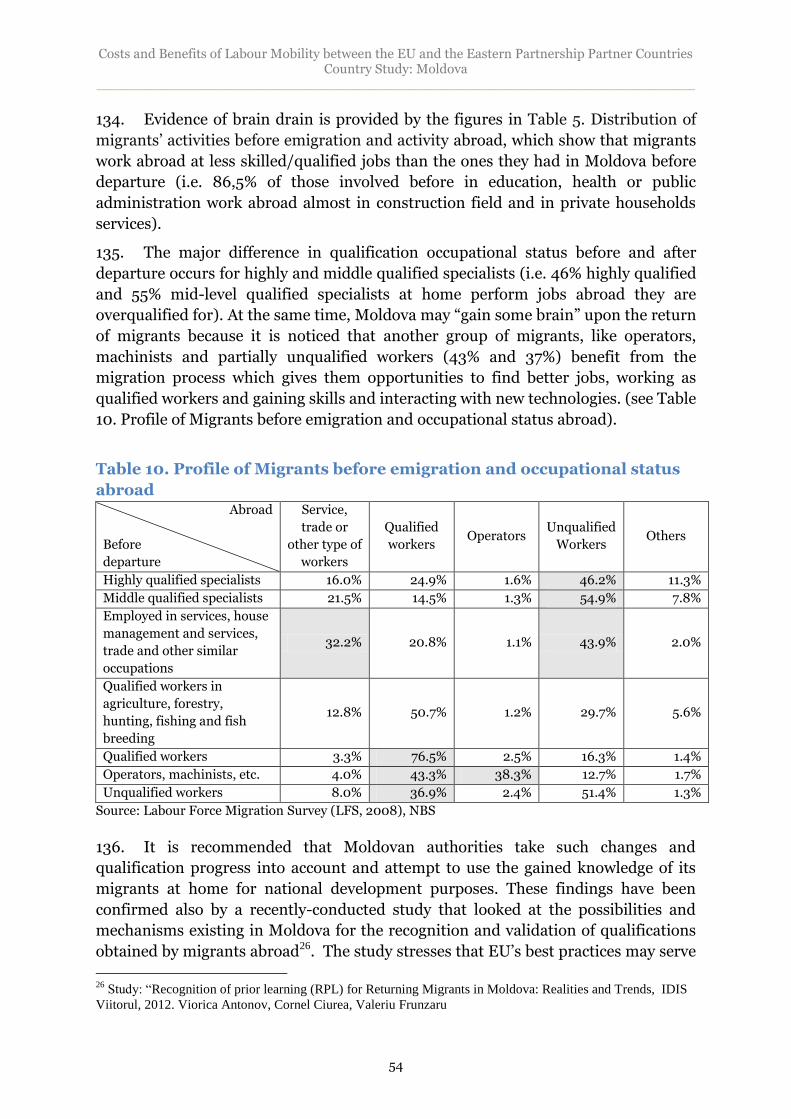
Costs and Benefits of Labour Mobility between the EU and the Eastern Partnership Partner Countries Country Study: Moldova
______________________________________________________________________
54
134. Evidence of brain drain is provided by the figures in Table 5. Distribution of
migrants’ activities before emigration and activity abroad, which show that migrants
work abroad at less skilled/qualified jobs than the ones they had in Moldova before
departure (i.e. 86,5% of those involved before in education, health or public
administration work abroad almost in construction field and in private households
services).
135. The major difference in qualification occupational status before and after
departure occurs for highly and middle qualified specialists (i.e. 46% highly qualified
and 55% mid-level qualified specialists at home perform jobs abroad they are
overqualified for). At the same time, Moldova may “gain some brain” upon the return
of migrants because it is noticed that another group of migrants, like operators,
machinists and partially unqualified workers (43% and 37%) benefit from the
migration process which gives them opportunities to find better jobs, working as
qualified workers and gaining skills and interacting with new technologies. (see Table
10. Profile of Migrants before emigration and occupational status abroad).
Table 10. Profile of Migrants before emigration and occupational status
abroad Abroad
Before
departure
Service,
trade or
other type of
workers
Qualified
workers Operators
Unqualified
Workers Others
Highly qualified specialists 16.0% 24.9% 1.6% 46.2% 11.3%
Middle qualified specialists 21.5% 14.5% 1.3% 54.9% 7.8%
Employed in services, house
management and services,
trade and other similar
occupations
32.2% 20.8% 1.1% 43.9% 2.0%
Qualified workers in
agriculture, forestry,
hunting, fishing and fish
breeding
12.8% 50.7% 1.2% 29.7% 5.6%
Qualified workers 3.3% 76.5% 2.5% 16.3% 1.4%
Operators, machinists, etc. 4.0% 43.3% 38.3% 12.7% 1.7%
Unqualified workers 8.0% 36.9% 2.4% 51.4% 1.3%
Source: Labour Force Migration Survey (LFS, 2008), NBS
136. It is recommended that Moldovan authorities take such changes and
qualification progress into account and attempt to use the gained knowledge of its
migrants at home for national development purposes. These findings have been
confirmed also by a recently-conducted study that looked at the possibilities and
mechanisms existing in Moldova for the recognition and validation of qualifications
obtained by migrants abroad26. The study stresses that EU’s best practices may serve
26
Study: “Recognition of prior learning (RPL) for Returning Migrants in Moldova: Realities and Trends, IDIS
Viitorul, 2012. Viorica Antonov, Cornel Ciurea, Valeriu Frunzaru
Costs and Benefits of Labour Mobility between the EU and the Eastern Partnership Partner Countries Country Study: Moldova
______________________________________________________________________
55
as a solid foundation for creating in Moldova similar functional mechanisms for
recognition and certification of (non-formal and informal) prior learning to ensure
dynamic labour mobility within Moldova, as well as to facilitate the circular
migration within EU countries.
Social costs and benefits
Costs and benefits of migration on family members
137. About 14% of households have at least one member abroad.27 A sociological
study estimated that about 30% of households benefit from remittances 28 and about
1.5 million people live in households that receive remittances. It also revealed that
22% of households benefiting from remittances depend on them, as over 80% of
these households' income is represented by the money received from abroad29.
138. Transfers from abroad represent a reliable source of income for these families
and the improvement in the welfare level of the entire household is obvious due to
the changes observed in households before and after emigration. For example, only
14.1% of the total number of migrant households with children are included in the
least insured category (Quintile I), compared with 26.2% households with children
and without migrants. Remittances play a major positive role in the increase of
access of recipients to education services, health services, entertainment, etc.
139. The negative impacts of migration and the significant social and psychological
costs are registered by qualitative studies on the children left behind without
parental care. The issue has become one of the more publicly debated subjects in
Moldova and is being tackled by various international development organizations
active in Moldova, as well by the local public administration. Preliminary results of
the 2012 Study on the Effects of migration on children and the elderly estimates that
about 155 children have one or both parents abroad (130,000 have one parent;
25,000 children have both parents abroad) 30.
140. The governmental Social Report for 2010 confirmed that the situation of
children left without parental care was perceived by 45.7% of population as being the
most difficult problem caused by emigration. In this year on average, every fifth
family with children had at least one member working abroad.31 Other 2010 official
27 Social Report, 2010, Ministry of Labour, Social Protection and Family
28 29,3% households - IOM study, 2009 (nationally representative sample, 2027 persons, the data collection period: 10 – 28 March 2009); 31,4% - IOM study, 2008 29 IOM study, The Socio-Economic Impact of the Economic Crisis on Migration and Remittances in the Republic of Moldova, 2009 (nationally representative sample, 2027 persons, the data collection period: 10 – 28 March 2009)
30 Impact of migration on achieving the rights of children and the elderly, Sociological survey, UNICEF Moldova/Help Age International Moldova, 2010.
31 Social Report, 2010, Ministry of Labour, Social Protection and Family
Costs and Benefits of Labour Mobility between the EU and the Eastern Partnership Partner Countries Country Study: Moldova
______________________________________________________________________
56
data estimated the number of children left without parental care at 91,802, of which
28,863 children had both parents working abroad.32
141. The Ministry of Social Protection and Family conducted a census on children
with parent/s working abroad during the period of March-April, 2012. The data will
contain the number and the status of children affected by migration and shall be the
basis for future child protection policies. This group of children, regardless of age, is
psycho-emotionally affected by their parents' departure, particularly if the mother
leaves. Young children often become attached to their new caregivers and/or feel
abandoned by their parents and become distant from the people around them, as
well as more introverted and depressive. To a great extent, these children have less
healthy nutrition, their school achievements are lower,33 and they risk getting into
conflict with the law and are more vulnerable to the negative influence of marginal
groups.
142. The mother's departure contributes significantly to the "loss" of her role in the
family34; some tasks are taken over by adult family members and others by children.
The separation of children from parents affects children's stress, safety, and
satisfaction of emotional needs35. In many situations, the migrant parents working
abroad for a long time lose emotional contact with their children, their main concern
being sending money for their needs, which results in a gap and lack of
communication on important psychological issues36.
143. Other negative impacts registered by specific studies among the group are
sexual abuse, cases of violence and child abuse, negligence, and the most dangerous
fact on social effects is that many cases remain without the intervention from the
local authorities.37
144. Migration has an impact on the family relationship. Relationships between
spouses are affected by mistrust, jealousy and other conflicting issues related to
money management, responsibility for education and health of children etc..
Although relations between partners are considered affected, it seems that they are
not reflected in the official status of the families. The divorce rate in the last 10 years
remained constant, and is much higher in urban than in rural areas (7 out of 10
32 INFORMATION NOTE on the state of juvenile delinquency and the activity of services for minor of the field units during nine months of 2010) http://www.mai.md/content/6251 (accessed on 25.11.2010) 33 The Impact of Migration and Remittances on Communities, Families and Children UNICEF/CBS-AXA, Chisinau 2007 34 Ibidem
35 Specific needs of children and aging individuals left with no care from the family members who left to work abroad, IOM/UNFPA Chisinau 2011. 36 Aspect elucidate în mai multe studii calitative, confirmat şi de discuţia de grup realizată în cadrul acestui studio.
37 The Impact of Migration and Remittances on Communities, Families and Children Sociological Study, CBS UNICEF/CBS-AXA, Chisnau 2007 and Specific needs of children and aging individuals left with no care from the family members who left to work abroad, IOM/UNFPA Chisinau 2011.
Costs and Benefits of Labour Mobility between the EU and the Eastern Partnership Partner Countries Country Study: Moldova
______________________________________________________________________
57
migrants are from rural areas)38. Although some of the migrants have a parallel life,
their family in Moldova is their formal one. Sometimes they have a co-partner in the
destination country, and in some cases even children.
145. Women who remain at home whose husbands left to work abroad easily take
over the role of men. At the same time in many situations, women have financial
constraints, because the husbands impose extremely severe financial control.
Women are often constrained by their partners in terms of leaving their jobs or not
getting employed, because of the low salary in Moldova. According to some studies39,
men left behind due to migration are also affected psychologically; they are
traditionally used to playing the role of financial supplier to the family and the
woman deals with the care and education of the children. Thus it is difficult for men
to accept the “female” family responsibilities. Many husbands whose wives work in
EU countries (and who come home usually once or twice a year) suffer from feelings
of abandonment and fall prey to alcohol.
146. Migration also has a certain impact on the elderly population. The elderly play
an important role in migrant households by taking care of the children whose parents
have emigrated. Different studies estimate that when both parents migrate, children
remain in the care of the elderly in about 90% of cases, and when one parent
migrates in one third of the cases40. Both groups form a category of vulnerable
population from various points of view. In both cases they, themselves, need support
from the society and state, because they are left without the care of their own
children who left to work abroad, and for them it is often quite difficult to look after
the new challenging generation.
147. For many grandparents the migration of grandchildren together with their
families has a specific impact on their behaviour. Many of them cannot communicate
with grandchildren born and educated in the host countries because of language
barriers. It is important to mention the fact that the chances for these children to
integrate smoothly into Moldovan society diminish with age.
148. Migration also has an indirect impact on households that have no members
working abroad. They benefit from remittances through occasional financial aid,
loans from the migrants, gifts, etc. The migrant households employ workers for some
agricultural work or construction and in such a way they increase the income of other
households in the community (without migrants).
38 NBS, www.statistica.md
39Social works, family doctors, policemen, the representatives of mass-media and NGO interviewed in the frame of the studies: Violence against Women in the Family UNFPA 201 and The Impact of Migration and Remittances on Communities, Families and Children Sociological Study, UNICEF/CBS-AXA, 40 Impact of migration on achieving the rights of children and the elderly, Sociological survey, UNICEF Moldova/Help Age International Moldova, 2010.
Costs and Benefits of Labour Mobility between the EU and the Eastern Partnership Partner Countries Country Study: Moldova
______________________________________________________________________
58
Social security of migrants
149. In addition to the demographic problems that are putting pressure on the
social security system of Moldova, the migration phenomenon will impose new
challenges in the near future. These challenges will respond to the questions about
the possibilities for migrants to be part of the social security system and their
eligibility for benefiting from social protection in the future. These questions have
not been cleared up as of yet in terms of the political visions and policies of Moldova
and substantial efforts should be made towards the adoption of appropriate
measures and actions.
150. The social insurance system of the Republic of Moldova is based exclusively on
the principle of solidarity between generations. Social protection is provided only for
insured persons. An insured person is someone who pays contributions to a social
protection fund for at least 15 years while working in country.41 As a result, persons
who are currently working abroad, upon return will be able to claim a pension only
based on the contributions paid, or, if it is too small, a minimum pension.
151. It was estimated that the public budget of the state social insurance will be
threatened if the number of pensioners who will claim a minimal pension without
contributing to the pension system is too large. According to LFS 2008, only one
third of migrants contributed to the social security system before departure. At the
same time, the same survey estimated that only 6.8% of people working abroad
contributed to the social insurance system in host countries.
152. Efforts are being made by the government of Moldova, which has developed
alternative forms of individual contracting for becoming part of social insurance
system, however this practice is not used much (there were only about 1300
contracts in 2010). In spite of efforts made by the authorities to ensure, through
bilateral agreements, the connection of migrants to social protection systems in host
countries and the connection of these systems between both countries, migrants
remain almost entirely disconnected from social protection services in host
countries.
153. In addition to signed bilateral agreements in the field of social insurance, in
December 2006 amendments were made to the Law on state social insurance
pensions which introduced the individual insurance contract, which is concluded
directly with the National Social Insurance House, although few migrants use this
opportunity to ensure their old-age pension. However, a large portion of the active
population actually working abroad are not contributing to the social insurance
system. On the one hand, this affects the current situation by increasing the burden
41 A large number of migrants returning in old age, who will not be eligible for assistance under the social insurance system, may claim social aid in accordance with the law on social aid. Social aid is granted on the basis of the difference between overall income and guaranteed minimum monthly income. The social assistance system is currently having difficulties providing social aid because of a lack of monitoring of the income from remittances.
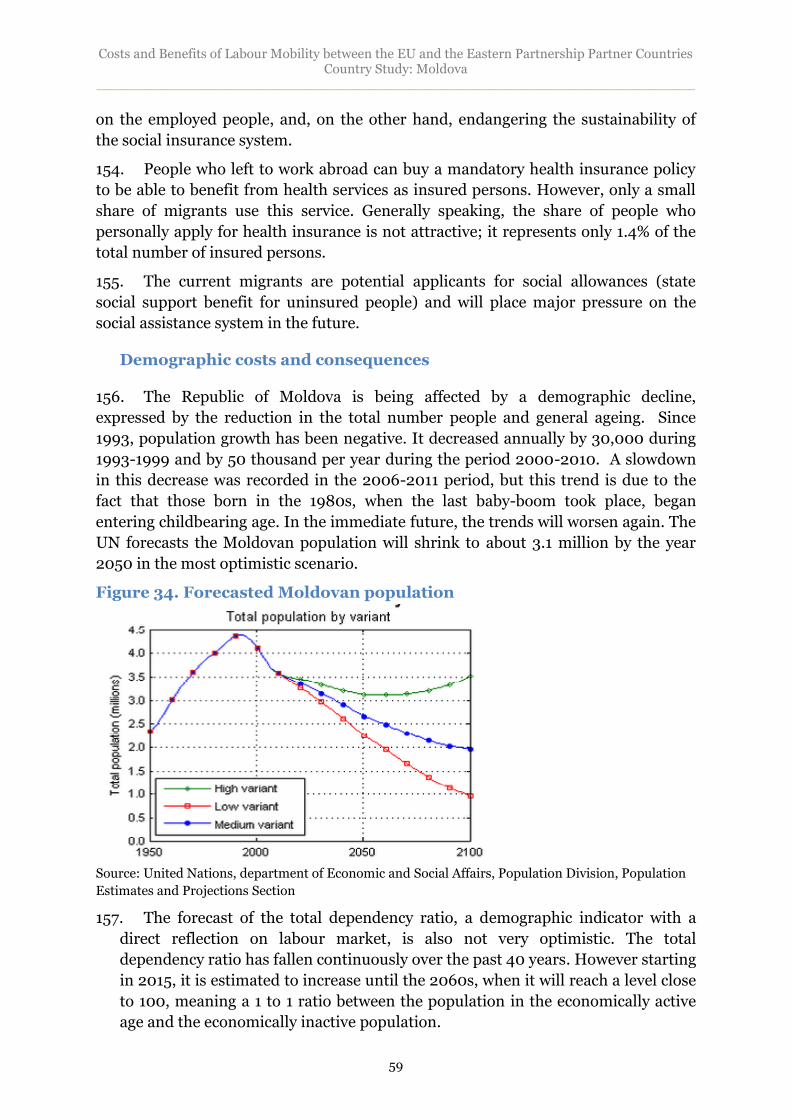
Costs and Benefits of Labour Mobility between the EU and the Eastern Partnership Partner Countries Country Study: Moldova
______________________________________________________________________
59
on the employed people, and, on the other hand, endangering the sustainability of
the social insurance system.
154. People who left to work abroad can buy a mandatory health insurance policy
to be able to benefit from health services as insured persons. However, only a small
share of migrants use this service. Generally speaking, the share of people who
personally apply for health insurance is not attractive; it represents only 1.4% of the
total number of insured persons.
155. The current migrants are potential applicants for social allowances (state
social support benefit for uninsured people) and will place major pressure on the
social assistance system in the future.
Demographic costs and consequences
156. The Republic of Moldova is being affected by a demographic decline,
expressed by the reduction in the total number people and general ageing. Since
1993, population growth has been negative. It decreased annually by 30,000 during
1993-1999 and by 50 thousand per year during the period 2000-2010. A slowdown
in this decrease was recorded in the 2006-2011 period, but this trend is due to the
fact that those born in the 1980s, when the last baby-boom took place, began
entering childbearing age. In the immediate future, the trends will worsen again. The
UN forecasts the Moldovan population will shrink to about 3.1 million by the year
2050 in the most optimistic scenario.
Figure 34. Forecasted Moldovan population
Source: United Nations, department of Economic and Social Affairs, Population Division, Population
Estimates and Projections Section
157. The forecast of the total dependency ratio, a demographic indicator with a
direct reflection on labour market, is also not very optimistic. The total
dependency ratio has fallen continuously over the past 40 years. However starting
in 2015, it is estimated to increase until the 2060s, when it will reach a level close
to 100, meaning a 1 to 1 ratio between the population in the economically active
age and the economically inactive population.
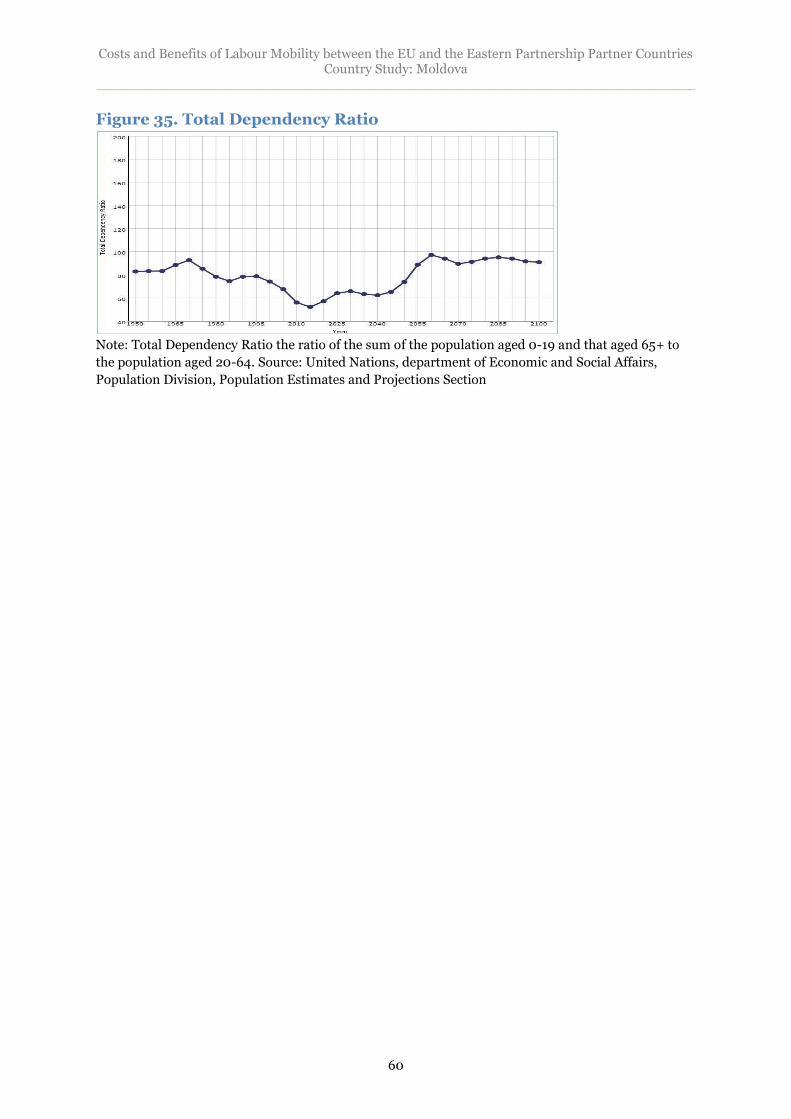
Costs and Benefits of Labour Mobility between the EU and the Eastern Partnership Partner Countries Country Study: Moldova
______________________________________________________________________
60
Figure 35. Total Dependency Ratio
Note: Total Dependency Ratio the ratio of the sum of the population aged 0-19 and that aged 65+ to
the population aged 20-64. Source: United Nations, department of Economic and Social Affairs,
Population Division, Population Estimates and Projections Section
Costs and Benefits of Labour Mobility between the EU and the Eastern Partnership Partner Countries Country Study: Moldova
______________________________________________________________________
61
Chapter 6. Migration Policies in Moldova
History of migration management and policies
158. Following its independence, Moldova adopted its first Law on Migration in
1990. However, it should be noted that a more comprehensive approach to the
management of migration had not been taken until the adoption of the Migration
Policy Concept of Moldova in October 2002.
1990-2000: Before 1990 (the Declaration of Independence in 1990) the
migration process was not regulated at all at the national level in Moldova. All
issues related to the registration of foreigners and their place of residence
were within the competence of the Ministry of Foreign Affairs through the
comprehensive Soviet Union legislative acts, duplicated in the legislation of
the Moldovan Soviet Socialist Republic (M.S.S.R). In 1990, the M.S.S.R. Law
on Migration was adopted. From an institutional point of view, the Ministry of
Labour and Social Protection was authorized to deal with all the issues related
to migration, except emigration.42 From 1994 to 2000, Moldova developed its
legal framework for migration which includes a number of laws on citizenship,
refugee status, and on preventing trafficking in human beings. (see Annex 2).
In August 2000, the President issued Decree no.1638-II for supporting
persons originating from Moldova who reside abroad and cooperating with
them.
In December 2000, the Government adopted a decision on measures to
support persons originating from Moldova residing abroad. The decision
included measures in four areas: on the human rights, culture, education and
social protection of Moldovans abroad. (GD no 1322 dated 29.12.2000). The
decision also established a Coordination Council for supporting people
originating from Moldova and residing abroad.
159. 2001-2012: Building on the initial steps just outlined, the Moldovan
authorities started to address issues related to migration through a series of policy
papers and institutional reforms.
In 2001, a State Service for Migration was established to replace the
Department of Migration within the Ministry of Labour and Social Protection,
In 2002, the Parliament adopted the Concept of the Migration policy of the
Republic of Moldova in order to improve the migration situation through
legislative means (Resolution no. 1386- XXV of 11 October 2002),
In December 2002, the new Law on Migration was adopted (Law 1518/2002)
which established a National Migration Bureau with the overall responsibility
for both emigration and immigration.
42 IOM Migration management assessment
Costs and Benefits of Labour Mobility between the EU and the Eastern Partnership Partner Countries Country Study: Moldova
______________________________________________________________________
62
In 2003, the government of Moldova made one of the most significant
developments, from an institutional point of view, by establishing the
Migration Department (GD 970/2003). This Department was given the
relevant functions from the Ministry of Justice, the Ministry of Foreign Affairs
and the Information Technologies Department; this has helped move towards
a unified approach to migration issues in Moldova.
In 2006, as part of a wider reform of the central public administration, the
functions of this Bureau were divided into i) a smaller bureau responsible for
immigration and asylum, as part of the Ministry of Internal Affairs, and ii)
emigration, namely labour migration becoming the responsibility of the
Ministry of Economy and Trade,
Also in 2006, a Committee for the Coordination of the Migration Process was
formed, led by Deputy Prime Minister, the Minister of Foreign Affairs and EU
Integration,
In 2008, the Government adopted a Plan of Actions in order to motivate
Moldovan migrant workers to return from abroad (GD 1133/2008),
In 2010, a new Law on the status of foreigners replaced the law on migration
(L200/2010 – Legea “privind regimul străinilor în Republica Moldova”)
In 2011, the government changed the name of the Coordination Council
established in December 2000 to “the Coordination Council of persons
originating from the Republic of Moldova – the Moldovan Diaspora”. At
latest count, the membership of the Council consisted of 49 representatives of
Diaspora organizations abroad and 3 members of the Government of
Moldova, led by the Prime Minister.
160. While the Government has undoubtedly taken several steps to deal with the
regulation of migration, the main goal of legalising Moldovan labour migrants
abroad and their legal and social protection has not yet been fully accomplished. The
tendencies to unify the regulation of Moldova’s migration system with the migration
process managing system which is typical in EU countries have changed the nature
and functions of the specialized migration structure.
161. The National Bureau of Migration has been subordinated in different periods
between Ministry of Economy and Trade, the Ministry of Internal Affairs (National
Bureau for Migration and Refugees) and the National Employment Agency. The
President, the Parliament, the Ministry of Foreign Affairs and European Integration,
the Ministry of Internal Affairs, the Customs Service and the Interethnic Relations
Department (National Bureau) were also involved in regulating the migration
process at different stages.
162. At the time of this study, the most important strategic documents for
regulation of migration addressing issues related to emigrants, immigrants, refugees
and repatriates, counteraction of human trafficking, illegal/uncontrolled and transit
migration and provision of asylum to refugees are the following: National Strategy on
migration and asylum (2011-2020); National Strategy for labour force policies for
Costs and Benefits of Labour Mobility between the EU and the Eastern Partnership Partner Countries Country Study: Moldova
______________________________________________________________________
63
2007-2015; Action Plan for 2011-2015 on implementation of the Migration and
Asylum Strategy; EU – Moldova Mobility Partnership Agreement; EU – Moldova
Action Plan (cooperation in justice and home affairs: migration issues); EU –
Moldova Action Plan on Visa Liberalization; Action Plan for preparation and
negotiations of EU- Moldova DCFTA define framework for the mutual recognition
agreements of professional qualifications between the EU and Moldova cover
commitments on social and labour issues (ILO core labour standards and
conventions, promotion of Decent Work Agenda) and National Return Action Plan,
National SMEs Development Programme and others.
Arrangements that Moldova has in operation with the European
Union
163. The European Union is currently negotiating an Association Agreement (AA)
with the Republic of Moldova, which aims to strengthen relations with its Eastern
neighbour. The negotiations for the Association Agreement started in January 2010.
Both parties agreed that the EU will offer Moldova assistance and financial support
for promoting structural, administrative and political reforms. By December 2012,
thirteen rounds of negotiations of the Association Agreement were held, the last took
place in Brussels. Twenty-three out of twenty-five chapters of the AA have been
provisionally closed. The “Justice, Freedom and Security” Chapter is very close to an
interim agreement.
164. The last EU – Moldova Action Plan was signed in 2005 for a three-year
period, and extended by one year. Further steps were subsequently taken for greater
EU involvement in the country: a Special EU Representative was appointed for
Moldova, the European Commission opened its Delegation in Chisinau in October
2005, and an EU border control mission was launched in December 2005 for
Transnistria region - EU Mission for Borders Assistance (EUBAM), In 2010,
significant support to the Government of Moldova has been launched through the EU
High Level Policy Advice Mission. This Mission is the response to the Government
request addressed to the EU for provision of assistance for democratic reforms and
acceleration of association and further economic integration between EU and
Moldova. It deploys of a group of high level policy advisers to the main public
institutions (including BMA) and supporting them in designing, implementing and
monitoring relevant policies and measures (www.euhlpam.org).
165. Within the context of the preparation for negotiations of the Association
Agreement, was adopted the EU-Moldova Visa Liberalization Action Plan (AVPL) in
December 2010. The visa regime is a highly sensitive issue on Moldova’s political and
public agenda that is highly related to the migration process and the subject of this
study. The visa requirements have dramatic impacts on Moldova, because 12% of its
the population are labour migrants. Fully aware of the difficulty to obtain a clear
membership perspective from the EU, the Government of Moldova is now making it
a priority to lifting visa requirements and expects the EU to make a good will gesture
on this issue.
Costs and Benefits of Labour Mobility between the EU and the Eastern Partnership Partner Countries Country Study: Moldova
______________________________________________________________________
64
166. The APVL includes a separate block of actions on addressing the Irregular
immigration, including readmission (Block 2). The actions are planned for two
phases and two areas – border management and migration management.
167. For the migration management sub-chapter the APVL includes the following
legislative and policy framework actions:
- for the 1st phase: Consolidation of the legal framework for migration policy,
including measures for the reintegration of Moldovan citizens (returning voluntarily
or under the EU-Republic of Moldova readmission agreement) and the fight against
irregular migration (including efforts to conclude readmission agreements with main
countries of origin and inland detection of irregular migrants); Adoption of a
National Migration Management Strategy for the effective implementation of the
legal framework for migration policy and an Action Plan, containing a timeframe,
specific objectives, activities, results, performance indicators and sufficient human
and financial resources; Establishment of a mechanism for the monitoring of
migration stocks and flows, defining a regularly updated migration profile for the
Republic of Moldova, with data both on irregular and legal migration, and
establishing bodies responsible for the collection and analysis of data on migration
stocks and flows.
- for the 2nd phase: Continued effective implementation of the EU-Republic of
Moldova readmission agreement and measures for the reintegration of Moldovan
citizens (returning voluntarily or being readmitted); Effective implementation of a
legal framework for migration management, including the provision of
administrative structures with adequate human resources with clear and relevant
competences for all aspects of migration management, as well as effective
cooperation between relevant agencies; Migration profile established and regularly
updated and effective analysis of data on migration stocks and flows; Consistent
implementation of an effective methodology on inland detection of irregular
migration, risk analysis (including the reporting of relevant agencies and analysis on
each administrative level e.g. local, central), and investigation of cases of organised
facilitated irregular migration, including effective cooperation between relevant
agencies; Provision of adequate infrastructure (including detention centres) and
strengthening responsible bodies to ensure effective expulsion of illegally residing
and/or transiting third country nationals from the territory of the Republic of
Moldova.
168. The EU Commission’s Evaluation Report on the implementation of the first
phase of the Action Plan on Visa Liberalization (APVL) notes good progress
(especially in terms of document security, border management and migration), but
also the need for additional efforts towards progress in public policy (cooperation
between relevant authorities) and the implementation of anti-discrimination
standards areas43.
43 By mid-May 2012, Moldova has fulfilled 86% of the conditions required in the first phase of the implementation of the APVL. Most of the legislative framework is in place. The National Strategy in
Costs and Benefits of Labour Mobility between the EU and the Eastern Partnership Partner Countries Country Study: Moldova
______________________________________________________________________
65
169. On the economic side, the EU is ready to offer Moldova a new Deep and
Comprehensive Free Trade Area agreement (DCFTA) which may further consolidate
the integration of Moldova in the European economic zone. Three rounds of DCFTA
negotiations already took place, the last one in September 2012. The agreement will
aim at liberalising Trade in Goods and Services beyond Moldova's WTO
commitments.
170. The migration policies will be affected by the DCFTA Chapter on Trade in
Services that in fact address provisions related to temporary presence of persons for
business purposes, which will cover movements of natural persons, requirements
regarding entry, stay, work, labour conditions and supply of services. The DCFTA
might also address and define the framework or the general conditions for the
mutual recognition agreements of professional qualifications between the EU and
Moldova. The agreement will cover commitments on social and labour issues,
including the ILO 1998 Declaration on Fundamental Rights and Principles at Work,
the more recent 2008 ILO Declaration on Social Justice for Fair Globalization, the
ILO core labour standards, and other ILO conventions that promote the Decent
Work Agenda.
171. The current Moldovan migration policy was developed in the context of the
EU-Moldova plans and migration initiatives mentioned above mentioned. The
Republic of Moldova intends to increase the number of states to regulate its relations
in the field of social insurance.
172. In this context, in 2007 the Government approved a template of an
intergovernmental Agreement on Social Insurance, developed based on the
European Convention of Social Insurance and according to general laws set by
Regulation nr. 1408/71/CEE on the coordination of the social insurance system for
employed persons, independent workers, and their family members which have
moved to the European Union. The intergovernmental agreement contains un-
discriminatory provisions for citizenship or residence principle. The entitled person
would benefit from payments regardless of citizenship and even if he or she resides
in another contracting state. The draft of this agreement applies to national
legislations of contracting states in regards to the following social insurance
payments: payments in the case of maternity and sickness, accidents at work and
professional diseases, disability payments (pensions and allowances), old age
pensions, survivor pensions, aids in case of death, unemployment aids. As a basic
the field of migration and asylum and its implementation Action Plan was adopted. Good progress has been achieved in adopting migration related legislation. Law on integration of foreigners adopted. High Level Meeting on 24November praised the good implementation of the EU-Moldova Mobility Partnership. Extended Migration Profile is developed. The Bureau for Migration and Asylum, the Centre for the Temporary Accommodation of Foreigners and the Accommodation Center for Asylum seekers are fully operational. All necessary legislation in the area of asylum is in place. Smooth implementation of the EU-Moldova Readmission Agreements was ensured. 14 Implementation Protocols have been concluded (Austria, Belgium, Denmark, Estonia, Hungary, Germany, Latvia, Lithuania, Luxemburg, Malta, Netherlands, Romania and Slovakia, as well with Switzerland).
Costs and Benefits of Labour Mobility between the EU and the Eastern Partnership Partner Countries Country Study: Moldova
______________________________________________________________________
66
principle, the agreement requires the payment of social insurance contributions in
one contracting state – namely, in the state where the migrant worker undertakes his
activity. Other agreement principles are: (i) equal treatment of citizens of each party;
(ii) determination of applicable legislation; (iii) sum of social insurance periods; and
(iv) the export of payments entitles a migrant worker to benefit from payments
gained in the states where he or she worked, on the territory of his or her own
country (maintenance of gained rights).
173. The Government of Moldova has negotiated and signed bilateral agreements
in the field of social security and insurance of migrants with Bulgaria (2008),
Portugal (2008), Romania (April 2010), Luxembourg (June 2010), Austria
(September 2011), Estonia (September 2011), Czech Republic (November 2011),
Italia (2011 on labour migration); Belgium (September, 2012). Many states, among
which are Greece, Latvia, Austria, Poland, Turkey, and Lithuania, have expressed
their will to regulate their relations in the field of social insurance and to sign
bilateral agreements with Moldova (http://mpsfc.gov.md/md/acorduri/).
174. In 2008, within EU Mobility Partnership initiative Moldova was chosen to
implement a pilot project in the area of circular migration. The empirical analysis of
the content of the Mobility Partnership with Moldova shows that the Partnership
barely includes circular migration schemes44. Nonetheless, Luxembourg, Bulgaria,
Portugal and the Veneto region in Italy have all set up such schemes. The most
overarching project within the MP has been implemented by the Swedish Public
Employment Service, involving eleven EU Member States. The project deals with the
strengthening of Moldova’s capacity to manage labour and return migration45.
175. A unified EU Visa-Centre opened in 2007 and allowed for the simplification of
the situation with receiving a visa from EU countries without the involvement of
representatives of embassies in Moldova. Since January 1st, 2008, the “Simplified
Visa-Regime between Moldova and EU countries” has been in place. Thus, short-
term visa registration has been simplified and so has the procedure. Fees for visa
issues have been lowered, and the categories of persons who may receive free, multi-
purpose and long term visas have been established.
176. The visa regime for transit through Romania and Bulgaria has been simplified
by certain measures. Since July 11th, 2008, Moldovan citizens have been allowed to
transit the territory of Romania without a transit-visa, for no longer than a 5 days
period, if they have a visa or a residence permit an EU country.
177. In September 2012, an EU-financed project in the area of Labour Market
Migration was launched: “Consolidation of migration management capacities in the
44 http://www.easternpartnership.org/publication/mobility-and-migration/2011-08-23/assessing-mobility-partnerships-between-eu-and-moldova#_ftn9
45 For more information on the project, see http://www.legal-in.eu
Costs and Benefits of Labour Mobility between the EU and the Eastern Partnership Partner Countries Country Study: Moldova
______________________________________________________________________
67
Republic of Moldova”46. The project envisage support for capacity building activities
for the National Employment Agency (NEA) and Ministry of Labor, Social Protection
and Family for mainstreaming migration dimension in labour market and VET
policies; for improving the labour market situation by strengthening the relations
with employers, improving the cooperation with private employment agencies and
increasing the level of quality of services provided by NEA; Developing the Social
Dialogue on labour market of Moldova; and negotiating and implementing bilateral
agreements on migration of labour force.
Arrangements that Moldova has in operation with Russia
178. During the 1990s, the Republic of Moldova signed agreements in the field of
pensions with some states from the post-soviet area as Russian Federation (1995),
Belarus (1995), Ukraine (1995), Uzbekistan (1995) and Azerbaijan (1997). One of the
basic principles of the above-mentioned agreements and of the agreement signed
between ex-USSR with Romania and Bulgaria (terminated on January 1st, 2005) is
the principle of territoriality, according to which pensions are established and paid
by the state on which territory the person lives, regardless of his or her contribution
to the public system of social insurance of the resident state. The principles are
outdated due to changes in the political and financial-economic relations with these
countries.47
179. The are two key elements in the new Russian legislation that have a direct
impact on the regulation of labour migration in Russia and respectively in Moldova:
(1) the introduction of a simplified registration procedure – encompassing all
foreigners, including Moldovans, who come to Russia on short visit; and (2) the
simplification of the procedures for obtaining work permits, which include migrants
originating from Moldova that benefit from visa-free arrangements. The new
legislative provisions introduce the simplified procedure, according to which
temporary migrant workers may register their stay in Russia. It is now also possible
for migrant workers to register at their place of employment, thus addressing an
important objective, namely that of retaining the existing pattern of predominantly
circular or temporary labour migration, which is considered by many to be the
preferred type of labour migration for Russia. Finally, the legislation intends to lay
the foundation for a migration registration scheme on which to base an official
system for the collection of immigration statistics48.
180. Russia recently implemented a set of laws to facilitate the legalization of CIS
workers. The procedures for obtaining a work permit for temporary migrants have
46 http://www.legal-in.eu/en/archive/131-eu-migration-project-launching-
47 N.Vladicescu: social Impact of Migration, 2012 Social Impact of Emigration and Rural-Urban Migration in Central and Eastern Europe , Country Report, Republic of Moldova
48 World Migration Report, 2008
Costs and Benefits of Labour Mobility between the EU and the Eastern Partnership Partner Countries Country Study: Moldova
______________________________________________________________________
68
been simplified and are now more time-efficient. Migrants from Moldova benefiting
from the visa-free regime can now apply for a work permit themselves (previously
only the employer could do so) and are issued a work permit within a 10-day period
(the only basis for the authorities to refuse the permit, if all the papers are in order,
would be the exhaustion of quotas). By allowing Moldovan migrants to apply for the
work permit themselves, this provision also has the effect of protecting migrant
workers against exploitative working conditions as it enables them to choose and
change employers and encourages them to take their rights into consideration. The
legislation can therefore be seen as contributing to the ongoing efforts to combat
human trafficking and forced labour.
181. The progressive nature of the new legislation is also demonstrated by the
granting of significant privileges to foreign workers from countries with which the
Russian Federation has concluded visa-free entry agreements, viz. Moldova,
Armenia, Azerbaijan, Belarus, Kazakhstan, Kyrgyzstan, , Tajikistan, Ukraine and
Uzbekistan.
182. Moreover, employers of temporary workers from the CIS do not have to
comply with the general requirement to obtain a permit to employ foreign workers,
an arrangement which in effect promotes closer cooperation with CIS countries
which is in line with the idea to eventually create a common CIS-wide labour market.
This approach was supported by the massive 2007 quota of six million work permits
for visa-free migrants. This quota was considered to be more than enough to cover
the entire labour migration flow from those countries and it helped legalize the
employment of irregular migrants already in Russia before the new legislation came
into force.
Institutional set-up for migration policies - responsibilities among
government agencies
183. Currently, about six ministries and departments in Moldova deal with various
migration issues. In addition, most of the local delegations of international
institutions, numerous NGOs and several foreign embassies are involved in
programs where international migration is a major component.
184. The key role in migration management is played by the Bureau for Migration
and Asylum (BMA) as a unit of the Ministry of Internal Affairs that was created in
July 2006. The main competences of BMA within the ministry are: to elaborate,
promote and implement national policies and strategies, draft laws and decisions in
the field of migration, to control and monitor the implementation of the national
legislation in field of migration and asylum, to elaborate and develop strategies of
reform, to collect and process data on migrants, fight against illegal migration and
illegal staying of foreigners, to ensure the detention of irregular migrants in special.
185. Other authorities with competences in the field of migration are ii) the
Ministry of Labour, Social Protection and Family - responsible for Labor migration
policies (both emigration & immigration), social insurance issues of migrant workers,
Costs and Benefits of Labour Mobility between the EU and the Eastern Partnership Partner Countries Country Study: Moldova
______________________________________________________________________
69
development of pre and post-departure policies and reintegration of migrants as well
as grants the labour permits for migrants; iii) - the Ministry of Informational
Technology and Communications – print and issue residence permits for migrants,
including travel documents for stateless persons, for refugees and beneficiaries of
humanitarian protection; iv) The Ministry of Foreign Affairs and European
Integration is responsible for protection of Moldovan citizens abroad, visa policies
and issue entry visas for foreigners; v) Border Service ensures the control and checks
of foreigners on the border and vi) the Ministry of Education deals with recognition
of migrant education and children with migrant parents.
186. In December, 2012 in Moldova has been created a Bureau for relations with
Diaspora which is part of the State Chancellery of the Government of Moldova and
reports directly to the Prime Minister. The Bureau will work closely to develop
diaspora capacities, analyse the diaspora aspects, and will be responsible for design
and implementation of social programs for diaspora, as well as for the coordination
of all diaspora events at national level.
187. The GoM approved an Action Plan (2011-2015) for the Implementation of the
National Strategy on Migration and Asylum (2011-2020). The general objectives of
the strategy are: Strengthening the national management of migration; Promoting
joint initiatives with destination countries on the facilitation of the return of
migrants, including the EU – Moldova Mobility Partnership; Participating in the
implementation of the Extended Migration Profile as a tool for data collection and
evaluation on migration and Promoting returns and supporting the reintegration of
returned migrants.
188. The specific objectives of the strategy will focus on: i) Developing capacities
for negotiating labour migration agreements with some destination countries; ii)
Actively participating in projects initiated by international development
organizations and local NGOs; iii) Extending cooperation on labour migration within
the EU-Moldova Mobility Partnership by launching new projects and initiatives and
iv) Initiating and carrying out joint activities with destination states aimed at the
facilitation of the return and reintegration of migrant workers
The role of NGOs in supporting migrants to various destinations
189. The Government of Moldova works on consolidating links with the diaspora
abroad through the recently created Bureau for relations with diaspora. These
activities include: distribution of information about migration trends and progress in
the country, investment opportunities for return migrants as well as possibilities for
reintegration in Moldova through Information Centres at Moldova’s diplomatic
missions abroad; negotiations with the EU or other destinations on the provision of
legal assistance and logistics for the return of Moldovan citizens; the involvement of
all stakeholders, the coordination and efficient implementation of actions included in
the national plans for the return of citizens of the Republic of Moldova from abroad.
Costs and Benefits of Labour Mobility between the EU and the Eastern Partnership Partner Countries Country Study: Moldova
______________________________________________________________________
70
In the last few years, with state and donors’ support, the agencies of the Government
of Moldova together with local and international NGO have been implementing
different programs in supporting migrants and the consolidation of relations with the
diaspora. The programs were targeted to increase capacity building in the Moldovan
diaspora associations abroad; to create a network of diasporas from different
countries and enhance of the interrelationship between them. Special attention is
given to the implementation of the PARE 1+1 government program aimed at
stimulating the set-up of SMEs businesses by migrant workers and their relatives49.
The program is based on the 1+1 rule, meaning that each invested MDL from
remittances shall be complemented by a MDL in the form of a grant. Other programs
are under implementation aiming at creating temporary internship placements for
young Moldovan graduates of foreign educational institutions who wish to come back
to Moldova and to be employed in the public or private sector50. Many government
programs as well as civil society projects focus on assisting children left in the
country without parental care due to migration.
49 http://www.odimm.md/index.php?option=com_k2&view=item&id=32:124-contracte-de-finan%C5%A3are-%C5%9Fi-peste-76-mil-de-lei-investi%C5%A3ii-%C3%AEn-economia-na%C5%A3ional%C4%83-%E2%80%93-acestea-sunt-rezultatele-la-moment-ale-programului-%E2%80%9Epare-1%201%E2%80%9D&lang=en&Itemid=
50 http://migratie.md/en/testimonial/young-overseas-graduates-are-coming-back-moldova-support-their-country
Costs and Benefits of Labour Mobility between the EU and the Eastern Partnership Partner Countries Country Study: Moldova
______________________________________________________________________
71
Chapter 7. Forecasts/ Projections of Migration and Labor Market Trends
Potential impact of visa liberalization on migration
190. Increased migration has often been identified as one of the major
consequences of the visa liberalization, which is believed to provide additional pull
factors for Moldovan job-seekers on the EU labour market, even though according to
EU regulations, visa-free travel does not involve any additional labour rights for
foreign job seekers.
191. This perception is fuelled by Moldovans’ relatively high propensity to migrate,
which is expected to increase after the implementation of a more liberal visa regime.
This was confirmed by a recent nationwide survey (see Fig. 37): while under the
current circumstances, the likelihood of migrating to the EU for employment reasons
in the next 12 months is quite high or very high for 15% of total respondents, under
the visa-free regime this share may increase up to 30%51. Intentions to go to the EU
for employment purposes are similar to present categories among the labour
migrants, but they are stronger (i.e. highest for males, persons aged 18-44 and
persons with a low level of education).
192. The liberalization of the visa regime also increases the desire to emigrate
among women (from 11% to 27%), persons from rural areas (from 12% to 35%), and
persons with medium and high levels of education.
193. The visa-free regime is going to significantly boost the propensity to migrate
for only about 30% of the respondents of the barometer of public opinion which
points out that one consequence of the visa-free regime will be an increase in
migration for short-term employment in the EU. The increase in migration should
not be very significant and might stabilise in the nearest future52, because many
Moldovan nationals, especially the current and potential migrants have or will soon
obtain Romanian citizenship, meaning that the visa-free regime will not have any
additional impact on their decisions to migrate.
51 Barometer of Public Opinion, November 2011, Institute of Public Policies, http://ipp.md/public/files/Barometru/Brosura_BOP_05.2011_prima_parte.pdf 52 A. Weinar, O. Korneev, S. Makaryan, S. Mananashvili, “Consequences of Schengen Visa Liberalisation for the Citizens of Ukraine and the Republic of Moldova”, Migration Policy Center, January, 2012.
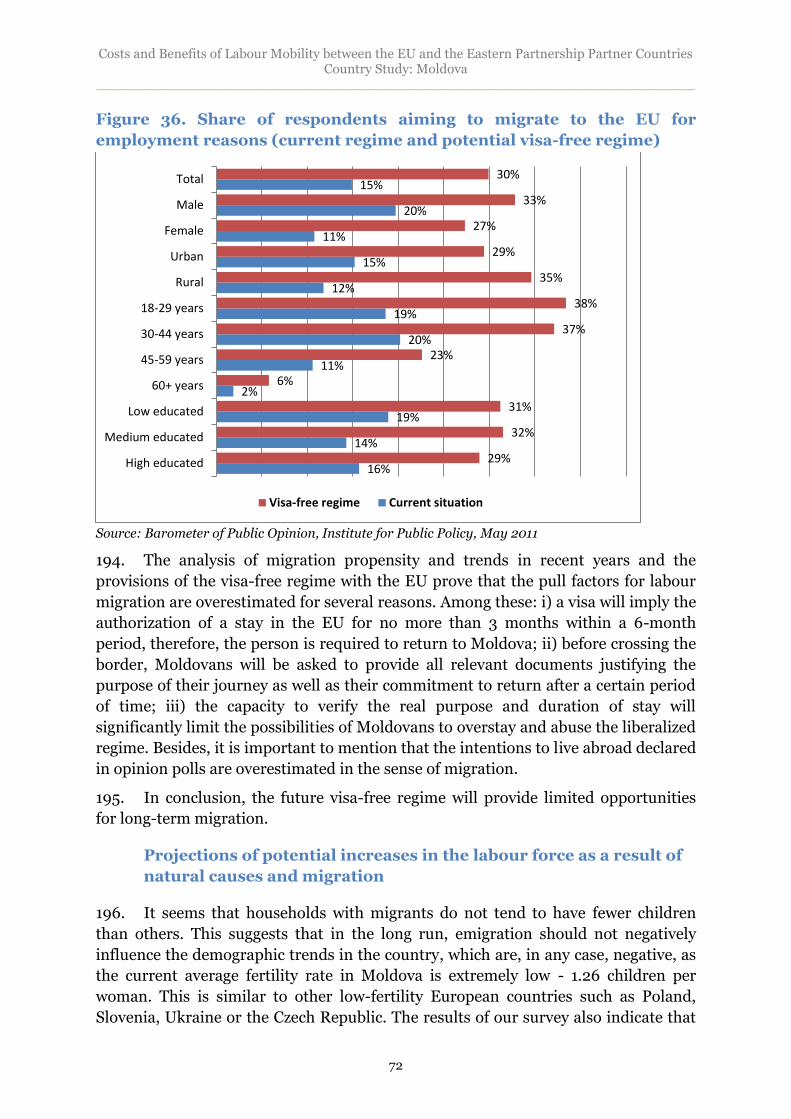
Costs and Benefits of Labour Mobility between the EU and the Eastern Partnership Partner Countries Country Study: Moldova
______________________________________________________________________
72
Figure 36. Share of respondents aiming to migrate to the EU for
employment reasons (current regime and potential visa-free regime)
Source: Barometer of Public Opinion, Institute for Public Policy, May 2011
194. The analysis of migration propensity and trends in recent years and the
provisions of the visa-free regime with the EU prove that the pull factors for labour
migration are overestimated for several reasons. Among these: i) a visa will imply the
authorization of a stay in the EU for no more than 3 months within a 6-month
period, therefore, the person is required to return to Moldova; ii) before crossing the
border, Moldovans will be asked to provide all relevant documents justifying the
purpose of their journey as well as their commitment to return after a certain period
of time; iii) the capacity to verify the real purpose and duration of stay will
significantly limit the possibilities of Moldovans to overstay and abuse the liberalized
regime. Besides, it is important to mention that the intentions to live abroad declared
in opinion polls are overestimated in the sense of migration.
195. In conclusion, the future visa-free regime will provide limited opportunities
for long-term migration.
Projections of potential increases in the labour force as a result of
natural causes and migration
196. It seems that households with migrants do not tend to have fewer children
than others. This suggests that in the long run, emigration should not negatively
influence the demographic trends in the country, which are, in any case, negative, as
the current average fertility rate in Moldova is extremely low - 1.26 children per
woman. This is similar to other low-fertility European countries such as Poland,
Slovenia, Ukraine or the Czech Republic. The results of our survey also indicate that
16%
14%
19%
2%
11%
20%
19%
12%
15%
11%
20%
15%
29%
32%
31%
6%
23%
37%
38%
35%
29%
27%
33%
30%
High educated
Medium educated
Low educated
60+ years
45-59 years
30-44 years
18-29 years
Rural
Urban
Female
Male
Total
Visa-free regime Current situation
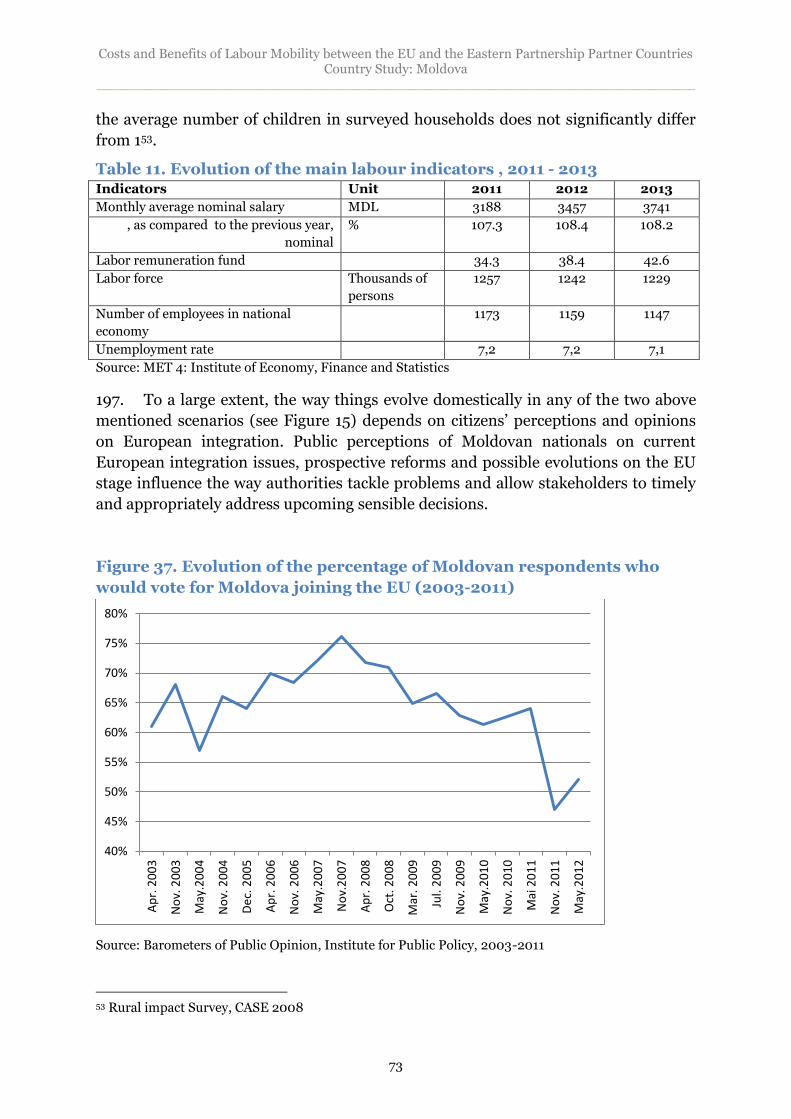
Costs and Benefits of Labour Mobility between the EU and the Eastern Partnership Partner Countries Country Study: Moldova
______________________________________________________________________
73
the average number of children in surveyed households does not significantly differ
from 153.
Table 11. Evolution of the main labour indicators , 2011 - 2013 Indicators Unit 2011 2012 2013
Monthly average nominal salary MDL 3188 3457 3741
, as compared to the previous year,
nominal
% 107.3 108.4 108.2
Labor remuneration fund 34.3 38.4 42.6
Labor force Thousands of
persons
1257 1242 1229
Number of employees in national
economy
1173 1159 1147
Unemployment rate 7,2 7,2 7,1
Source: MET 4: Institute of Economy, Finance and Statistics
197. To a large extent, the way things evolve domestically in any of the two above
mentioned scenarios (see Figure 15) depends on citizens’ perceptions and opinions
on European integration. Public perceptions of Moldovan nationals on current
European integration issues, prospective reforms and possible evolutions on the EU
stage influence the way authorities tackle problems and allow stakeholders to timely
and appropriately address upcoming sensible decisions.
Figure 37. Evolution of the percentage of Moldovan respondents who
would vote for Moldova joining the EU (2003-2011)
Source: Barometers of Public Opinion, Institute for Public Policy, 2003-2011
53 Rural impact Survey, CASE 2008
40%
45%
50%
55%
60%
65%
70%
75%
80%
Ap
r. 2
00
3
No
v. 2
00
3
May
.20
04
No
v. 2
00
4
De
c. 2
00
5
Ap
r. 2
00
6
No
v. 2
00
6
May
.20
07
No
v.2
00
7
Ap
r. 2
00
8
Oct
. 20
08
Mar
. 20
09
Jul.
20
09
No
v. 2
00
9
May
.20
10
No
v. 2
01
0
Mai
20
11
No
v. 2
01
1
May
.20
12
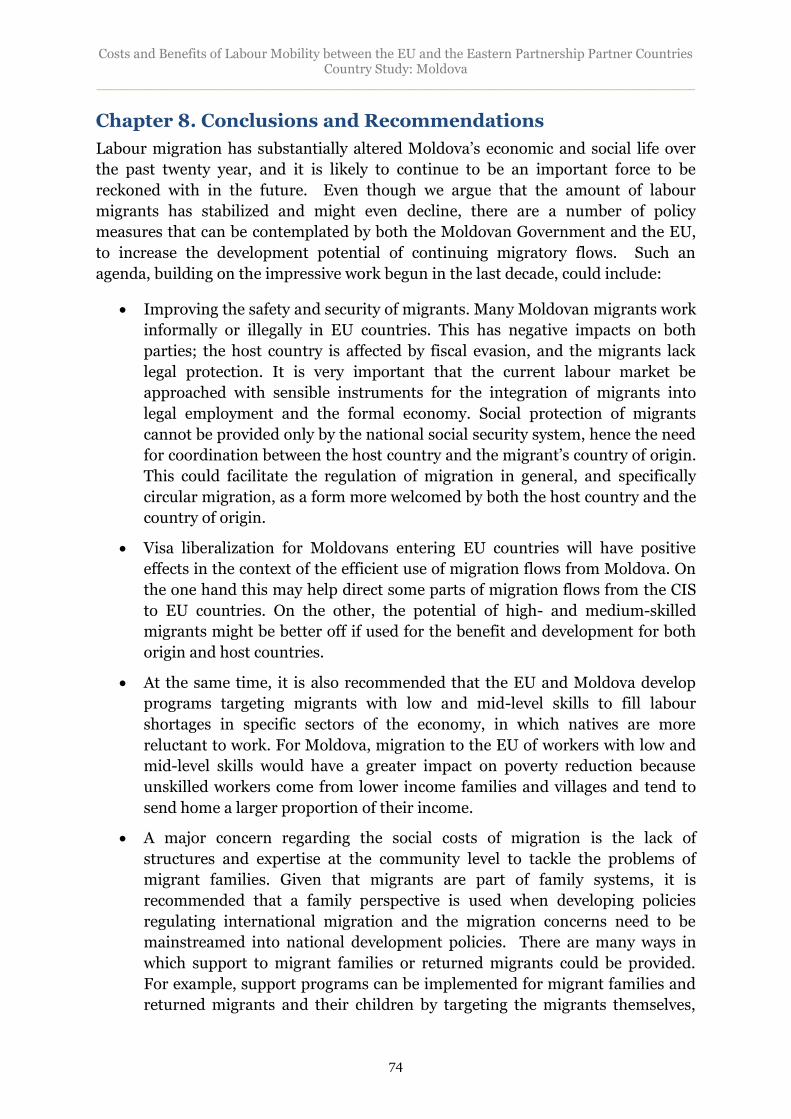
Costs and Benefits of Labour Mobility between the EU and the Eastern Partnership Partner Countries Country Study: Moldova
______________________________________________________________________
74
Chapter 8. Conclusions and Recommendations
Labour migration has substantially altered Moldova’s economic and social life over
the past twenty year, and it is likely to continue to be an important force to be
reckoned with in the future. Even though we argue that the amount of labour
migrants has stabilized and might even decline, there are a number of policy
measures that can be contemplated by both the Moldovan Government and the EU,
to increase the development potential of continuing migratory flows. Such an
agenda, building on the impressive work begun in the last decade, could include:
Improving the safety and security of migrants. Many Moldovan migrants work
informally or illegally in EU countries. This has negative impacts on both
parties; the host country is affected by fiscal evasion, and the migrants lack
legal protection. It is very important that the current labour market be
approached with sensible instruments for the integration of migrants into
legal employment and the formal economy. Social protection of migrants
cannot be provided only by the national social security system, hence the need
for coordination between the host country and the migrant’s country of origin.
This could facilitate the regulation of migration in general, and specifically
circular migration, as a form more welcomed by both the host country and the
country of origin.
Visa liberalization for Moldovans entering EU countries will have positive
effects in the context of the efficient use of migration flows from Moldova. On
the one hand this may help direct some parts of migration flows from the CIS
to EU countries. On the other, the potential of high- and medium-skilled
migrants might be better off if used for the benefit and development for both
origin and host countries.
At the same time, it is also recommended that the EU and Moldova develop
programs targeting migrants with low and mid-level skills to fill labour
shortages in specific sectors of the economy, in which natives are more
reluctant to work. For Moldova, migration to the EU of workers with low and
mid-level skills would have a greater impact on poverty reduction because
unskilled workers come from lower income families and villages and tend to
send home a larger proportion of their income.
A major concern regarding the social costs of migration is the lack of
structures and expertise at the community level to tackle the problems of
migrant families. Given that migrants are part of family systems, it is
recommended that a family perspective is used when developing policies
regulating international migration and the migration concerns need to be
mainstreamed into national development policies. There are many ways in
which support to migrant families or returned migrants could be provided.
For example, support programs can be implemented for migrant families and
returned migrants and their children by targeting the migrants themselves,
Costs and Benefits of Labour Mobility between the EU and the Eastern Partnership Partner Countries Country Study: Moldova
______________________________________________________________________
75
the family left behind (spouses, children, the child-caregivers such as
grandparents), and the children born in destination countries. The relevant
stakeholders interacting on a constant basis with migrant families such as the
school system, social protection and health systems should be actively
involved in these programs and held accountable for program outcomes.
Other programs, partly already in existence, could be targeted at migrants
themselves, for example while they are preparing to leave the country in order
to increase their knowledge about the destination country and its
institutions—health and social security systems, education system and labour
market requirements. These programs increase migrants’ awareness about the
impact that migration might have on their families and children and provides
some ways in which potential challenges could be prevented. Both the EU and
some member states provide assistance in this respect: this is an investment
that pays off both in Moldova and in the receiving countries.
Finally, facilitation of labour migration is impossible outside of bilateral cooperation
between origin and destination countries. For EU member countries, the main
objectives when engaging in bilateral labour agreements with Moldova could be:
The satisfaction of labour market needs;
Prevention or reduction of irregular migration through increased possibilities
for regular migration;
The use of bilateral labour agreements to promote and support broader
economic relations with Moldova.
For the Moldovan Government, we recommend that migrants’ needs are made
central to negotiations, by focusing on the following objectives:
To offer to Moldovan workers wider, facilitated access to the international
labour market and at the same time to prevent criminal activities involving
smuggling and trafficking of human beings, exploitation, suffering and
sometimes deaths of migrants;
To promote and protect the welfare and the rights of migrant workers;
To foster provisions in the bilateral agreements that would guarantee that
migrants return to Moldova or cooperate in matters involving irregular
migration.
Costs and Benefits of Labour Mobility between the EU and the Eastern Partnership Partner Countries Country Study: Moldova
______________________________________________________________________
76
BIBLIOGRAPHY
Government Reports and Reports by Other Organizations
Moldova country report: Social Impact of Emigration and Rural-Urban Migration
in Central and Eastern Europe (2012)
Study: “Recognition of prior learning (RPL) for Returning Migrants in Moldova:
Realities and Trends, IDIS Viitorul, Viorica Antonov, Cornel Ciurea, Valeriu
Frunzaru (2012);
Data Assessment Report for Moldova, Michel Poulain, Anne Herm, Maria Vremis
And Viorica Craievschi Toarta, IOM, 2011
Migration July, 2007: Reaping the fruits of Migration and Development, special
edition. IOM
R. Schwartz: O analiza a legaturilor existente intre comunitatile moldovenesti de
peste hotare si partia lor, IOM, 2008
M.Luecke, et.. Patterns and Trends of Migration and Remittances in Moldova,
June 2007, The Kiel Institute for the World Economy (www.ifw-kiel.de)
CBS-AXA (2005) Migration and Remittances in Moldova. Report prepared by
CBS-AXA Consulting for International Organization of Migration mission in
Moldova, European Commission Food Security Programme Office in Moldova
and International Monetary Fund Office in Moldova.
Ghencea, B. and Gudumac, I. (2004) Labour Migration and Remittances in the
Republic of Moldova. Moldova Microfinance Alliance and Soros Foundation in
Moldova.
Perspectivele privind includerea in Dezvoltare: oportunitati de utilizare eficienta
a remitentelor pentru Moldova, IOM. 2008
Migration, Development and Povery Reduction, IOM, Dakar Workshop Report,
2006
The linkage between Migration and Development. DG EuropeAid, July 2007.
ARS Progetti srl.
Oportunitati de Afaceri pentru Beneficiarii de Remitente, 2010
Evaluarea rapida a necesitatilor de angajare in regiunile Balti si Cahul din
Moldova. December 2006, CRS, CIVIS, Moldova Employment and Training
Alliance, 421 pages
Working Paper, C10, Migration and Poverty Reduction in Moldova, Maria
Cristina Pantiru, Richard Black, and Rachel Sabates-Wheeler, Sussex Centre for
Migration Research, Institute for Development Studies, February 2007
ADE (2006) FSP 2004: Study on Remittances and Social Protection in Moldova.
Report prepared by ADE at the request of the European Commission.
BNS (Biroul National de Statistica al Republicii Moldova) (2003) ‘Tinerii
Republicii Moldova’. Biroul National de Statistica al Republicii Moldova.
http://www.statistica.md/statistics/dat/331/ro/TineriiRM_11noiem03.htm
Costs and Benefits of Labour Mobility between the EU and the Eastern Partnership Partner Countries Country Study: Moldova
______________________________________________________________________
77
Cuc, M., Lundbäck, E. and Ruggiero, E. (2005) Migration and Remittances in
Moldova. Washington DC: International Monetary Fund.
Ellerman, D. (2003) 'Policy Research on Migration and Development'.
Washington DC: The World Bank. Policy
Research Working Paper, 3117. Euractiv.com (2006) ‘The EU's New Neighbours’
(http://www.euractiv.com/en/enlargement/eu-newneighbours/article-129625).
European Commission (2004) European Neighbourhood Policy – Moldova
Country Report. Brussels.
IMF (2006a) Republic of Moldova: Poverty Reduction Strategy Annual
Evaluation report 2005. IMF Washington.
IMF (2006b) Republic of Moldova: Poverty Reduction Strategy Paper. Annual
Evaluation Report 2005—Joint Staff Advisory Note. IMF Country Report No.
06/186.
IOM (2004) 'Trafficking in Human Beings in South Eastern Europe: 2004 -
Focus on Prevention in: Albania, Bosnia and Herzegovina, Bulgaria, Croatia, the
former Yugoslav Republic of Macedonia, Moldova, Romania,
Prohnitchi, V. (2006) Poverty of the Children of the Moldovan Migrants.
Chisinau: EXPERT-GROUP.
Sander, C., Nistor, D. Bat, A., Petrov, V. and Seymour, V. (2005) Migrant
Remittances and the Financial Market in Moldova. Report prepared for USAID.
Tamas, K. (2006) Moldovan Migration – Not Quite the Saviour: A Migration for
Development Analysis. A study commissioned by the Sida office in Chisinau,
Moldova.
Tomiuc, E. (2004) 'Moldova: Mass Migration Threatens Country's Future'. At
http://www.rferl.org/featuresarticle/2004/10/e5121611-5370-4d9c-bfa3-
a3310e3efa39.html
US Department of State (2006). Trafficking in Persons Report 2006. At
http://www.state.gov/g/tip/rls/tiprpt/2006/
World Bank (2006) Moldova: Poverty Update. World Bank Human Development
Sector Unit Report no. 35618-MD, Washington DC.
Legal and institutional documents
Detailed list of legislation on migration subjects are provided in Annex 2
Articles and internet links:
Governance and democracy in Moldova, ADEPT e-journal, year IX, issue 176,
October 1-31, 2011
http://econ.worldbank.org/wbsite/external/extdec/extdecprospects/0,,conte
ntMDK:22759429~pagePK:64165401~piPK:64165026~theSitePK:476883,00
.html
http://kilm.ilo.org/kilmnet/
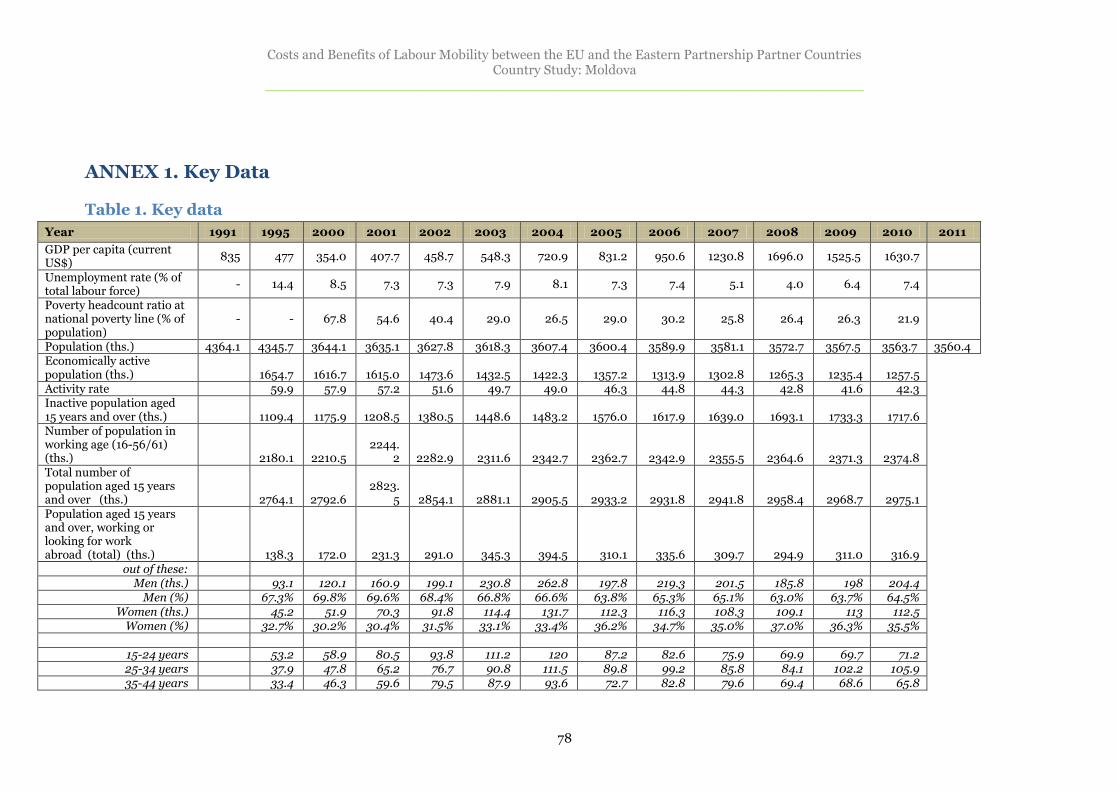
Costs and Benefits of Labour Mobility between the EU and the Eastern Partnership Partner Countries Country Study: Moldova
______________________________________________________________________
78
ANNEX 1. Key Data Table 1. Key data
Year 1991 1995 2000 2001 2002 2003 2004 2005 2006 2007 2008 2009 2010 2011
GDP per capita (current US$)
835 477 354.0 407.7 458.7 548.3 720.9 831.2 950.6 1230.8 1696.0 1525.5 1630.7
Unemployment rate (% of total labour force)
- 14.4 8.5 7.3 7.3 7.9 8.1 7.3 7.4 5.1 4.0 6.4 7.4
Poverty headcount ratio at national poverty line (% of population)
- - 67.8 54.6 40.4 29.0 26.5 29.0 30.2 25.8 26.4 26.3 21.9
Population (ths.) 4364.1 4345.7 3644.1 3635.1 3627.8 3618.3 3607.4 3600.4 3589.9 3581.1 3572.7 3567.5 3563.7 3560.4 Economically active population (ths.)
1654.7 1616.7 1615.0 1473.6 1432.5 1422.3 1357.2 1313.9 1302.8 1265.3 1235.4 1257.5
Activity rate 59.9 57.9 57.2 51.6 49.7 49.0 46.3 44.8 44.3 42.8 41.6 42.3 Inactive population aged 15 years and over (ths.)
1109.4 1175.9 1208.5 1380.5 1448.6 1483.2 1576.0 1617.9 1639.0 1693.1 1733.3 1717.6
Number of population in working age (16-56/61) (ths.)
2180.1 2210.5
2244.2 2282.9 2311.6 2342.7 2362.7 2342.9 2355.5 2364.6 2371.3 2374.8
Total number of population aged 15 years and over (ths.)
2764.1 2792.6
2823.5 2854.1 2881.1 2905.5 2933.2 2931.8 2941.8 2958.4 2968.7 2975.1
Population aged 15 years and over, working or looking for work abroad (total) (ths.)
138.3 172.0 231.3 291.0 345.3 394.5 310.1 335.6 309.7 294.9 311.0 316.9 out of these:
Men (ths.) 93.1 120.1 160.9 199.1 230.8 262.8 197.8 219.3 201.5 185.8 198 204.4 Men (%) 67.3% 69.8% 69.6% 68.4% 66.8% 66.6% 63.8% 65.3% 65.1% 63.0% 63.7% 64.5%
Women (ths.) 45.2 51.9 70.3 91.8 114.4 131.7 112.3 116.3 108.3 109.1 113 112.5 Women (%) 32.7% 30.2% 30.4% 31.5% 33.1% 33.4% 36.2% 34.7% 35.0% 37.0% 36.3% 35.5%
15-24 years 53.2 58.9 80.5 93.8 111.2 120 87.2 82.6 75.9 69.9 69.7 71.2 25-34 years 37.9 47.8 65.2 76.7 90.8 111.5 89.8 99.2 85.8 84.1 102.2 105.9 35-44 years 33.4 46.3 59.6 79.5 87.9 93.6 72.7 82.8 79.6 69.4 68.6 65.8
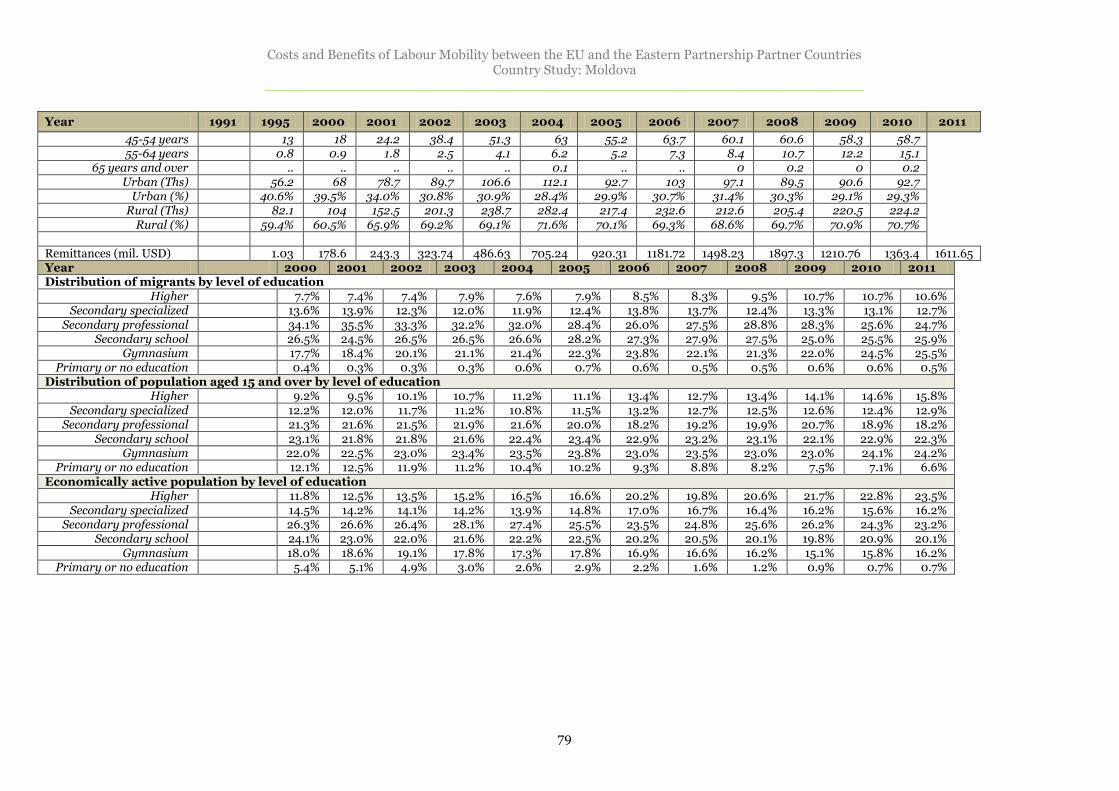
Costs and Benefits of Labour Mobility between the EU and the Eastern Partnership Partner Countries Country Study: Moldova
______________________________________________________________________
79
Year 1991 1995 2000 2001 2002 2003 2004 2005 2006 2007 2008 2009 2010 2011
45-54 years 13 18 24.2 38.4 51.3 63 55.2 63.7 60.1 60.6 58.3 58.7 55-64 years 0.8 0.9 1.8 2.5 4.1 6.2 5.2 7.3 8.4 10.7 12.2 15.1
65 years and over .. .. .. .. .. 0.1 .. .. 0 0.2 0 0.2 Urban (Ths) 56.2 68 78.7 89.7 106.6 112.1 92.7 103 97.1 89.5 90.6 92.7
Urban (%) 40.6% 39.5% 34.0% 30.8% 30.9% 28.4% 29.9% 30.7% 31.4% 30.3% 29.1% 29.3% Rural (Ths) 82.1 104 152.5 201.3 238.7 282.4 217.4 232.6 212.6 205.4 220.5 224.2
Rural (%) 59.4% 60.5% 65.9% 69.2% 69.1% 71.6% 70.1% 69.3% 68.6% 69.7% 70.9% 70.7%
Remittances (mil. USD) 1.03 178.6 243.3 323.74 486.63 705.24 920.31 1181.72 1498.23 1897.3 1210.76 1363.4 1611.65 Year 2000 2001 2002 2003 2004 2005 2006 2007 2008 2009 2010 2011 Distribution of migrants by level of education
Higher 7.7% 7.4% 7.4% 7.9% 7.6% 7.9% 8.5% 8.3% 9.5% 10.7% 10.7% 10.6% Secondary specialized 13.6% 13.9% 12.3% 12.0% 11.9% 12.4% 13.8% 13.7% 12.4% 13.3% 13.1% 12.7%
Secondary professional 34.1% 35.5% 33.3% 32.2% 32.0% 28.4% 26.0% 27.5% 28.8% 28.3% 25.6% 24.7% Secondary school 26.5% 24.5% 26.5% 26.5% 26.6% 28.2% 27.3% 27.9% 27.5% 25.0% 25.5% 25.9%
Gymnasium 17.7% 18.4% 20.1% 21.1% 21.4% 22.3% 23.8% 22.1% 21.3% 22.0% 24.5% 25.5% Primary or no education 0.4% 0.3% 0.3% 0.3% 0.6% 0.7% 0.6% 0.5% 0.5% 0.6% 0.6% 0.5%
Distribution of population aged 15 and over by level of education Higher 9.2% 9.5% 10.1% 10.7% 11.2% 11.1% 13.4% 12.7% 13.4% 14.1% 14.6% 15.8%
Secondary specialized 12.2% 12.0% 11.7% 11.2% 10.8% 11.5% 13.2% 12.7% 12.5% 12.6% 12.4% 12.9% Secondary professional 21.3% 21.6% 21.5% 21.9% 21.6% 20.0% 18.2% 19.2% 19.9% 20.7% 18.9% 18.2%
Secondary school 23.1% 21.8% 21.8% 21.6% 22.4% 23.4% 22.9% 23.2% 23.1% 22.1% 22.9% 22.3% Gymnasium 22.0% 22.5% 23.0% 23.4% 23.5% 23.8% 23.0% 23.5% 23.0% 23.0% 24.1% 24.2%
Primary or no education 12.1% 12.5% 11.9% 11.2% 10.4% 10.2% 9.3% 8.8% 8.2% 7.5% 7.1% 6.6% Economically active population by level of education
Higher 11.8% 12.5% 13.5% 15.2% 16.5% 16.6% 20.2% 19.8% 20.6% 21.7% 22.8% 23.5% Secondary specialized 14.5% 14.2% 14.1% 14.2% 13.9% 14.8% 17.0% 16.7% 16.4% 16.2% 15.6% 16.2%
Secondary professional 26.3% 26.6% 26.4% 28.1% 27.4% 25.5% 23.5% 24.8% 25.6% 26.2% 24.3% 23.2% Secondary school 24.1% 23.0% 22.0% 21.6% 22.2% 22.5% 20.2% 20.5% 20.1% 19.8% 20.9% 20.1%
Gymnasium 18.0% 18.6% 19.1% 17.8% 17.3% 17.8% 16.9% 16.6% 16.2% 15.1% 15.8% 16.2% Primary or no education 5.4% 5.1% 4.9% 3.0% 2.6% 2.9% 2.2% 1.6% 1.2% 0.9% 0.7% 0.7%
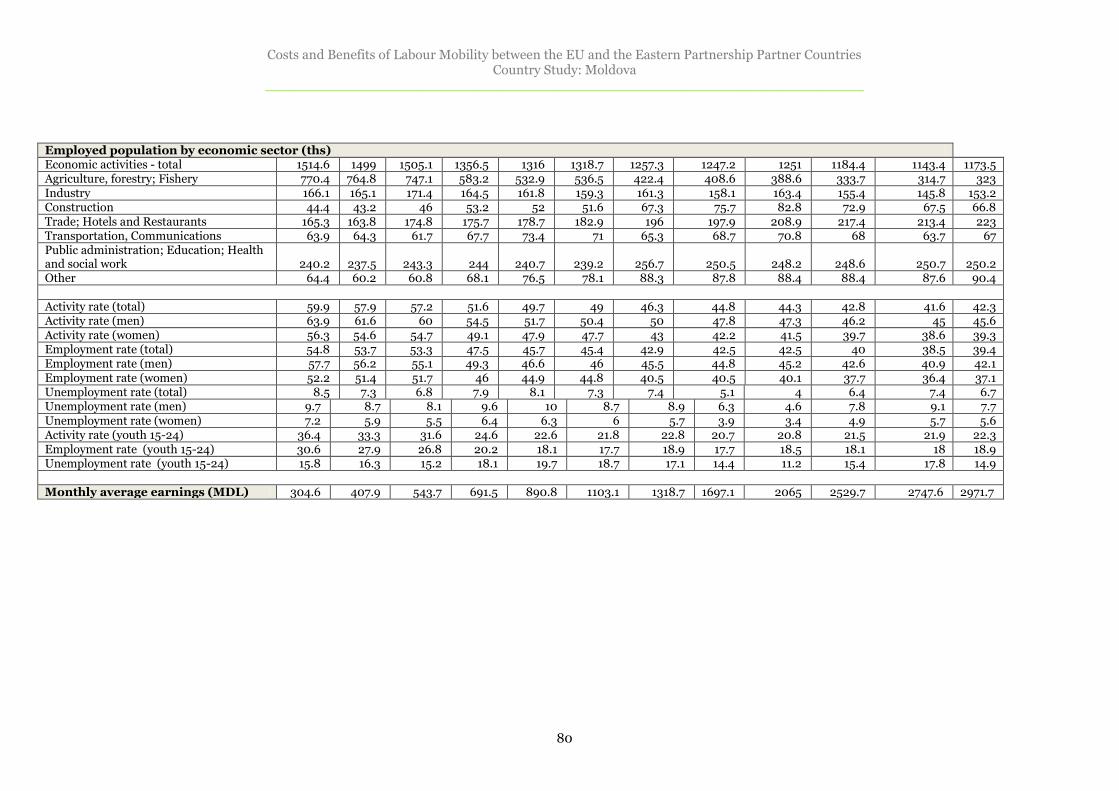
Costs and Benefits of Labour Mobility between the EU and the Eastern Partnership Partner Countries Country Study: Moldova
______________________________________________________________________
80
Employed population by economic sector (ths) Economic activities - total 1514.6 1499 1505.1 1356.5 1316 1318.7 1257.3 1247.2 1251 1184.4 1143.4 1173.5 Agriculture, forestry; Fishery 770.4 764.8 747.1 583.2 532.9 536.5 422.4 408.6 388.6 333.7 314.7 323 Industry 166.1 165.1 171.4 164.5 161.8 159.3 161.3 158.1 163.4 155.4 145.8 153.2 Construction 44.4 43.2 46 53.2 52 51.6 67.3 75.7 82.8 72.9 67.5 66.8 Trade; Hotels and Restaurants 165.3 163.8 174.8 175.7 178.7 182.9 196 197.9 208.9 217.4 213.4 223 Transportation, Communications 63.9 64.3 61.7 67.7 73.4 71 65.3 68.7 70.8 68 63.7 67 Public administration; Education; Health and social work 240.2 237.5 243.3 244 240.7 239.2 256.7 250.5 248.2 248.6 250.7 250.2 Other 64.4 60.2 60.8 68.1 76.5 78.1 88.3 87.8 88.4 88.4 87.6 90.4 Activity rate (total) 59.9 57.9 57.2 51.6 49.7 49 46.3 44.8 44.3 42.8 41.6 42.3 Activity rate (men) 63.9 61.6 60 54.5 51.7 50.4 50 47.8 47.3 46.2 45 45.6 Activity rate (women) 56.3 54.6 54.7 49.1 47.9 47.7 43 42.2 41.5 39.7 38.6 39.3 Employment rate (total) 54.8 53.7 53.3 47.5 45.7 45.4 42.9 42.5 42.5 40 38.5 39.4 Employment rate (men) 57.7 56.2 55.1 49.3 46.6 46 45.5 44.8 45.2 42.6 40.9 42.1 Employment rate (women) 52.2 51.4 51.7 46 44.9 44.8 40.5 40.5 40.1 37.7 36.4 37.1 Unemployment rate (total) 8.5 7.3 6.8 7.9 8.1 7.3 7.4 5.1 4 6.4 7.4 6.7 Unemployment rate (men) 9.7 8.7 8.1 9.6 10 8.7 8.9 6.3 4.6 7.8 9.1 7.7 Unemployment rate (women) 7.2 5.9 5.5 6.4 6.3 6 5.7 3.9 3.4 4.9 5.7 5.6 Activity rate (youth 15-24) 36.4 33.3 31.6 24.6 22.6 21.8 22.8 20.7 20.8 21.5 21.9 22.3 Employment rate (youth 15-24) 30.6 27.9 26.8 20.2 18.1 17.7 18.9 17.7 18.5 18.1 18 18.9 Unemployment rate (youth 15-24) 15.8 16.3 15.2 18.1 19.7 18.7 17.1 14.4 11.2 15.4 17.8 14.9
Monthly average earnings (MDL) 304.6 407.9 543.7 691.5 890.8 1103.1 1318.7 1697.1 2065 2529.7 2747.6 2971.7
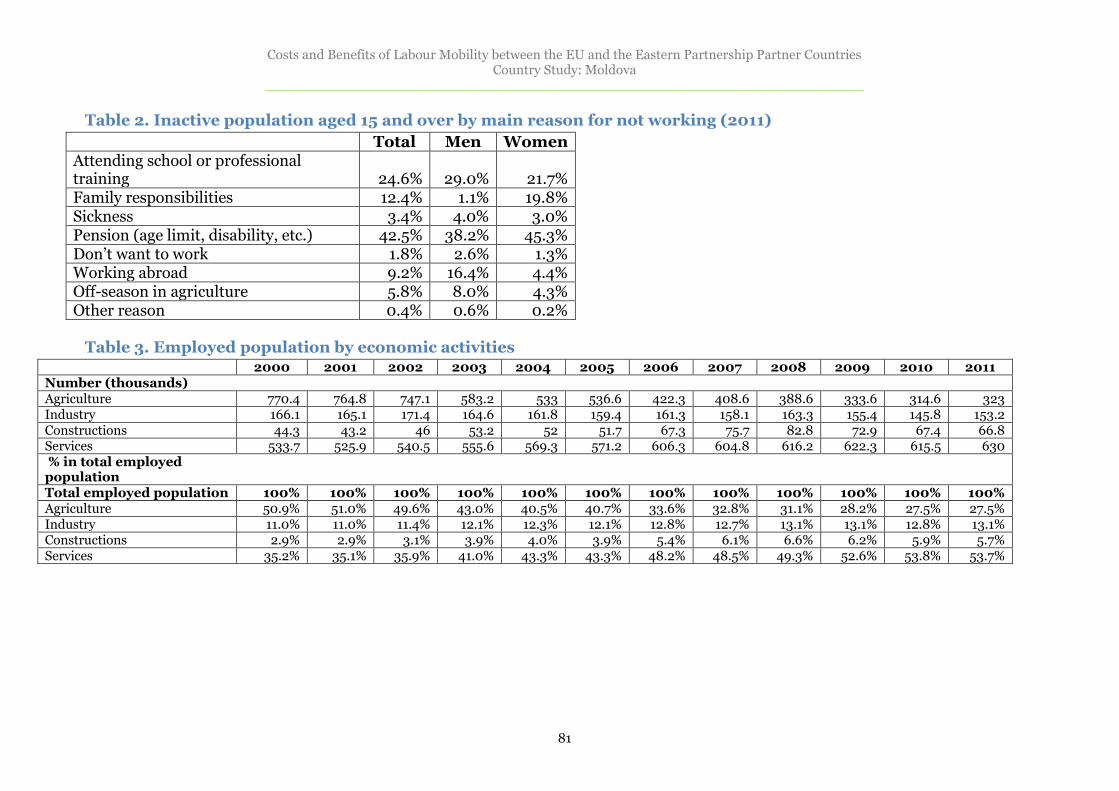
Costs and Benefits of Labour Mobility between the EU and the Eastern Partnership Partner Countries Country Study: Moldova
______________________________________________________________________
81
Table 2. Inactive population aged 15 and over by main reason for not working (2011)
Total Men Women Attending school or professional training 24.6% 29.0% 21.7% Family responsibilities 12.4% 1.1% 19.8% Sickness 3.4% 4.0% 3.0% Pension (age limit, disability, etc.) 42.5% 38.2% 45.3% Don’t want to work 1.8% 2.6% 1.3% Working abroad 9.2% 16.4% 4.4% Off-season in agriculture 5.8% 8.0% 4.3% Other reason 0.4% 0.6% 0.2%
Table 3. Employed population by economic activities
2000 2001 2002 2003 2004 2005 2006 2007 2008 2009 2010 2011
Number (thousands) Agriculture 770.4 764.8 747.1 583.2 533 536.6 422.3 408.6 388.6 333.6 314.6 323 Industry 166.1 165.1 171.4 164.6 161.8 159.4 161.3 158.1 163.3 155.4 145.8 153.2 Constructions 44.3 43.2 46 53.2 52 51.7 67.3 75.7 82.8 72.9 67.4 66.8 Services 533.7 525.9 540.5 555.6 569.3 571.2 606.3 604.8 616.2 622.3 615.5 630 % in total employed population Total employed population 100% 100% 100% 100% 100% 100% 100% 100% 100% 100% 100% 100% Agriculture 50.9% 51.0% 49.6% 43.0% 40.5% 40.7% 33.6% 32.8% 31.1% 28.2% 27.5% 27.5% Industry 11.0% 11.0% 11.4% 12.1% 12.3% 12.1% 12.8% 12.7% 13.1% 13.1% 12.8% 13.1% Constructions 2.9% 2.9% 3.1% 3.9% 4.0% 3.9% 5.4% 6.1% 6.6% 6.2% 5.9% 5.7% Services 35.2% 35.1% 35.9% 41.0% 43.3% 43.3% 48.2% 48.5% 49.3% 52.6% 53.8% 53.7%
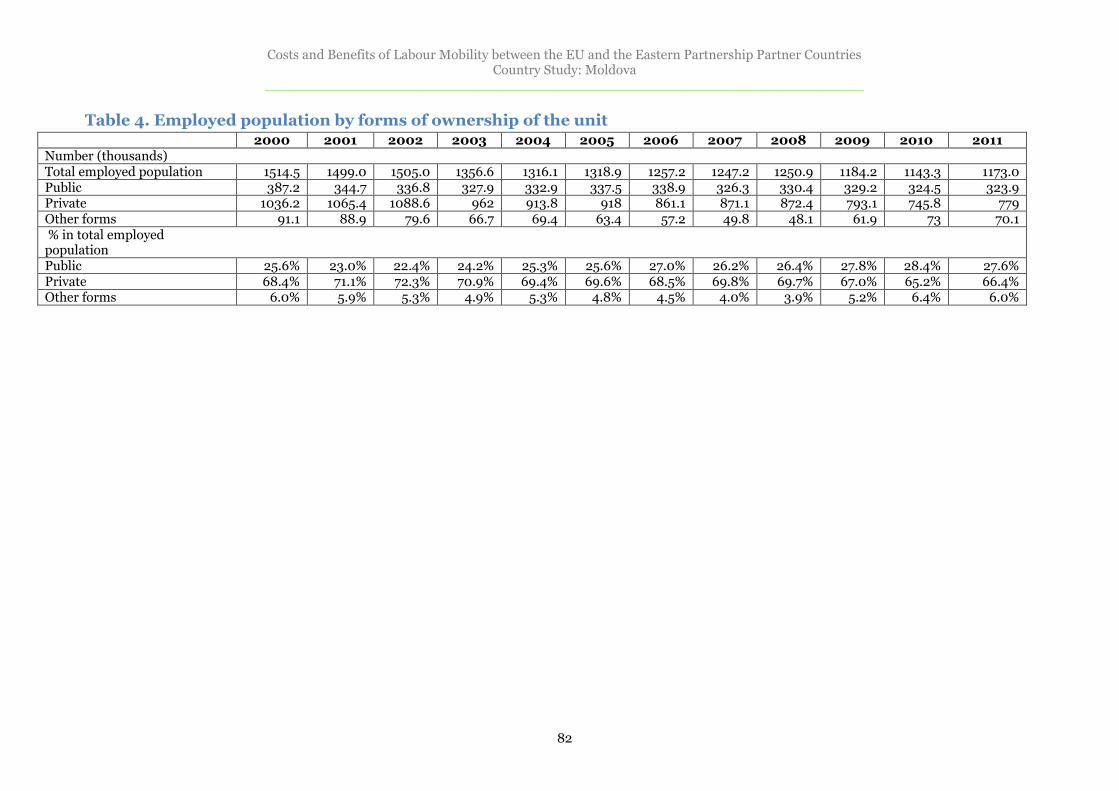
Costs and Benefits of Labour Mobility between the EU and the Eastern Partnership Partner Countries Country Study: Moldova
______________________________________________________________________
82
Table 4. Employed population by forms of ownership of the unit
2000 2001 2002 2003 2004 2005 2006 2007 2008 2009 2010 2011
Number (thousands) Total employed population 1514.5 1499.0 1505.0 1356.6 1316.1 1318.9 1257.2 1247.2 1250.9 1184.2 1143.3 1173.0 Public 387.2 344.7 336.8 327.9 332.9 337.5 338.9 326.3 330.4 329.2 324.5 323.9 Private 1036.2 1065.4 1088.6 962 913.8 918 861.1 871.1 872.4 793.1 745.8 779 Other forms 91.1 88.9 79.6 66.7 69.4 63.4 57.2 49.8 48.1 61.9 73 70.1 % in total employed population Public 25.6% 23.0% 22.4% 24.2% 25.3% 25.6% 27.0% 26.2% 26.4% 27.8% 28.4% 27.6% Private 68.4% 71.1% 72.3% 70.9% 69.4% 69.6% 68.5% 69.8% 69.7% 67.0% 65.2% 66.4% Other forms 6.0% 5.9% 5.3% 4.9% 5.3% 4.8% 4.5% 4.0% 3.9% 5.2% 6.4% 6.0%
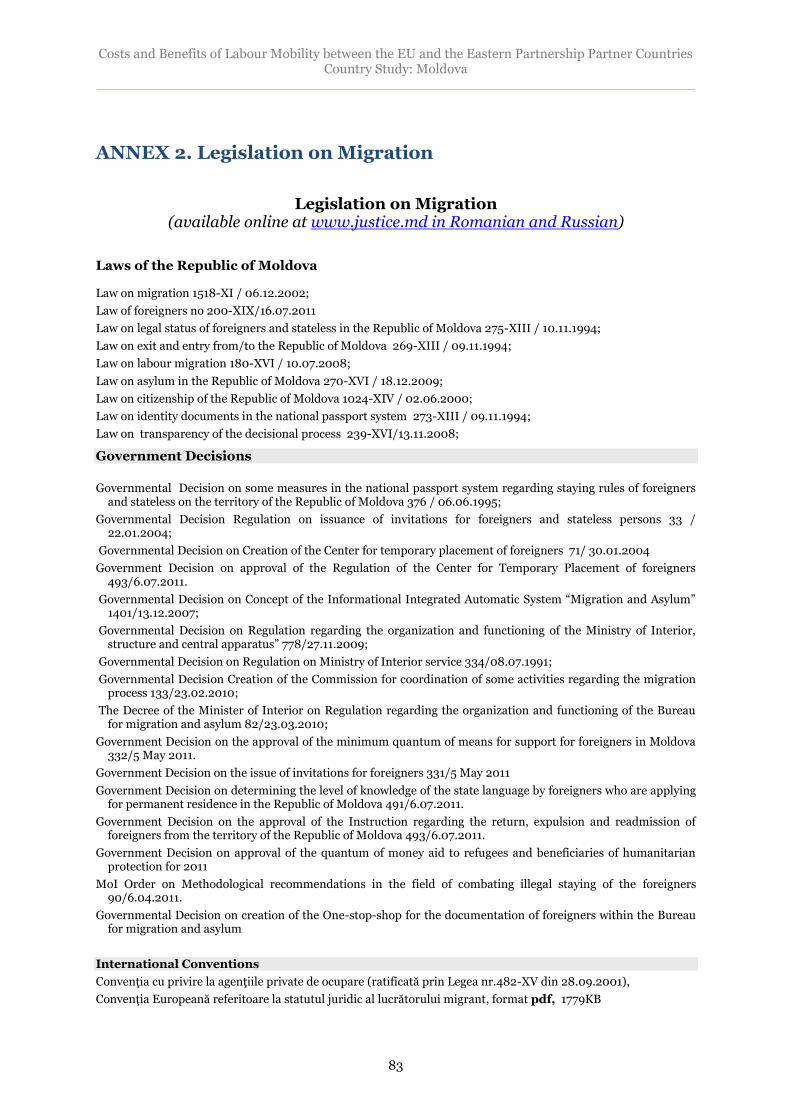
Costs and Benefits of Labour Mobility between the EU and the Eastern Partnership Partner Countries Country Study: Moldova
______________________________________________________________________
83
ANNEX 2. Legislation on Migration
Legislation on Migration (available online at www.justice.md in Romanian and Russian)
Laws of the Republic of Moldova
Law on migration 1518-XI / 06.12.2002;
Law of foreigners no 200-XIX/16.07.2011
Law on legal status of foreigners and stateless in the Republic of Moldova 275-XIII / 10.11.1994;
Law on exit and entry from/to the Republic of Moldova 269-XIII / 09.11.1994;
Law on labour migration 180-XVI / 10.07.2008;
Law on asylum in the Republic of Moldova 270-XVI / 18.12.2009;
Law on citizenship of the Republic of Moldova 1024-XIV / 02.06.2000;
Law on identity documents in the national passport system 273-XIII / 09.11.1994;
Law on transparency of the decisional process 239-XVI/13.11.2008;
Government Decisions
Governmental Decision on some measures in the national passport system regarding staying rules of foreigners and stateless on the territory of the Republic of Moldova 376 / 06.06.1995;
Governmental Decision Regulation on issuance of invitations for foreigners and stateless persons 33 / 22.01.2004;
Governmental Decision on Creation of the Center for temporary placement of foreigners 71/ 30.01.2004
Government Decision on approval of the Regulation of the Center for Temporary Placement of foreigners 493/6.07.2011.
Governmental Decision on Concept of the Informational Integrated Automatic System “Migration and Asylum” 1401/13.12.2007;
Governmental Decision on Regulation regarding the organization and functioning of the Ministry of Interior, structure and central apparatus” 778/27.11.2009;
Governmental Decision on Regulation on Ministry of Interior service 334/08.07.1991;
Governmental Decision Creation of the Commission for coordination of some activities regarding the migration process 133/23.02.2010;
The Decree of the Minister of Interior on Regulation regarding the organization and functioning of the Bureau for migration and asylum 82/23.03.2010;
Government Decision on the approval of the minimum quantum of means for support for foreigners in Moldova 332/5 May 2011.
Government Decision on the issue of invitations for foreigners 331/5 May 2011
Government Decision on determining the level of knowledge of the state language by foreigners who are applying for permanent residence in the Republic of Moldova 491/6.07.2011.
Government Decision on the approval of the Instruction regarding the return, expulsion and readmission of foreigners from the territory of the Republic of Moldova 493/6.07.2011.
Government Decision on approval of the quantum of money aid to refugees and beneficiaries of humanitarian protection for 2011
MoI Order on Methodological recommendations in the field of combating illegal staying of the foreigners 90/6.04.2011.
Governmental Decision on creation of the One-stop-shop for the documentation of foreigners within the Bureau for migration and asylum
International Conventions
Convenţia cu privire la agenţiile private de ocupare (ratificată prin Legea nr.482-XV din 28.09.2001),
Convenţia Europeană referitoare la statutul juridic al lucrătorului migrant, format pdf, 1779KB
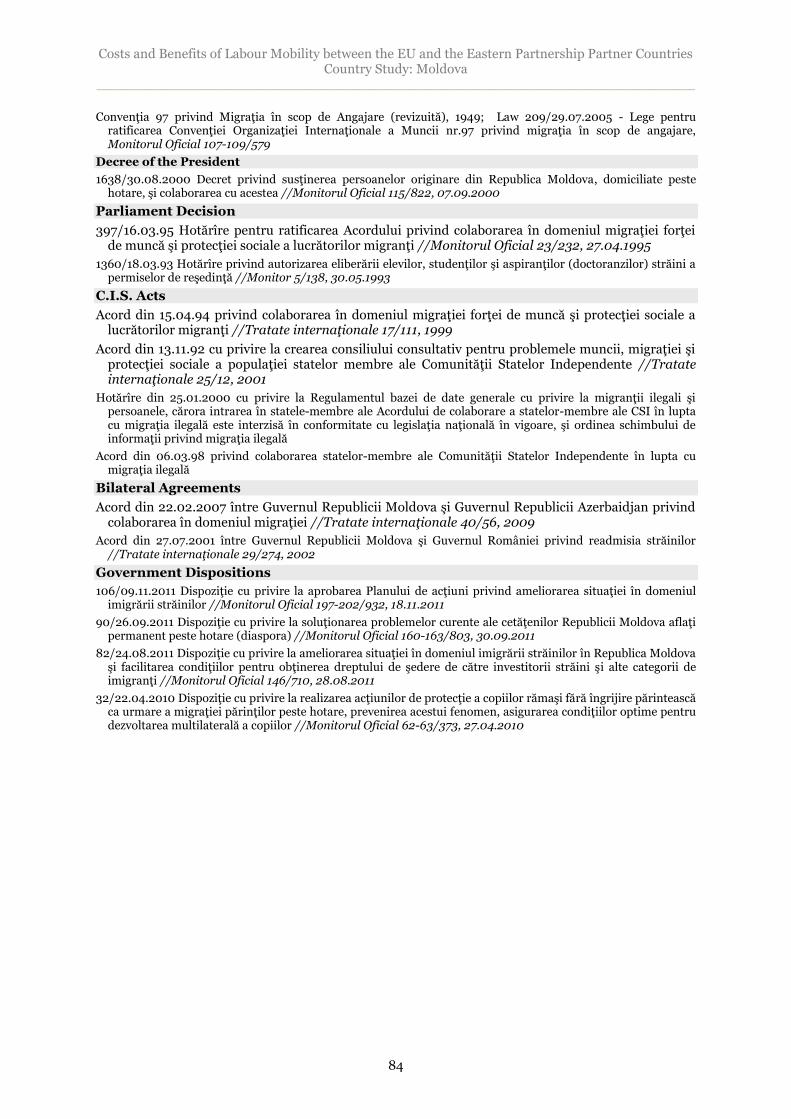
Costs and Benefits of Labour Mobility between the EU and the Eastern Partnership Partner Countries Country Study: Moldova
______________________________________________________________________
84
Convenţia 97 privind Migraţia în scop de Angajare (revizuită), 1949; Law 209/29.07.2005 - Lege pentru ratificarea Convenţiei Organizaţiei Internaţionale a Muncii nr.97 privind migraţia în scop de angajare, Monitorul Oficial 107-109/579
Decree of the President
1638/30.08.2000 Decret privind susţinerea persoanelor originare din Republica Moldova, domiciliate peste hotare, şi colaborarea cu acestea //Monitorul Oficial 115/822, 07.09.2000
Parliament Decision
397/16.03.95 Hotărîre pentru ratificarea Acordului privind colaborarea în domeniul migraţiei forţei de muncă şi protecţiei sociale a lucrătorilor migranţi //Monitorul Oficial 23/232, 27.04.1995
1360/18.03.93 Hotărîre privind autorizarea eliberării elevilor, studenţilor şi aspiranţilor (doctoranzilor) străini a permiselor de reşedinţă //Monitor 5/138, 30.05.1993
C.I.S. Acts
Acord din 15.04.94 privind colaborarea în domeniul migraţiei forţei de muncă şi protecţiei sociale a lucrătorilor migranţi //Tratate internaţionale 17/111, 1999
Acord din 13.11.92 cu privire la crearea consiliului consultativ pentru problemele muncii, migraţiei şi protecţiei sociale a populaţiei statelor membre ale Comunităţii Statelor Independente //Tratate internaţionale 25/12, 2001
Hotărîre din 25.01.2000 cu privire la Regulamentul bazei de date generale cu privire la migranţii ilegali şi persoanele, cărora intrarea în statele-membre ale Acordului de colaborare a statelor-membre ale CSI în lupta cu migraţia ilegală este interzisă în conformitate cu legislaţia naţională în vigoare, şi ordinea schimbului de informaţii privind migraţia ilegală
Acord din 06.03.98 privind colaborarea statelor-membre ale Comunităţii Statelor Independente în lupta cu migraţia ilegală
Bilateral Agreements
Acord din 22.02.2007 între Guvernul Republicii Moldova şi Guvernul Republicii Azerbaidjan privind colaborarea în domeniul migraţiei //Tratate internaţionale 40/56, 2009
Acord din 27.07.2001 între Guvernul Republicii Moldova şi Guvernul României privind readmisia străinilor //Tratate internaţionale 29/274, 2002
Government Dispositions
106/09.11.2011 Dispoziţie cu privire la aprobarea Planului de acţiuni privind ameliorarea situaţiei în domeniul imigrării străinilor //Monitorul Oficial 197-202/932, 18.11.2011
90/26.09.2011 Dispoziţie cu privire la soluţionarea problemelor curente ale cetăţenilor Republicii Moldova aflaţi permanent peste hotare (diaspora) //Monitorul Oficial 160-163/803, 30.09.2011
82/24.08.2011 Dispoziţie cu privire la ameliorarea situaţiei în domeniul imigrării străinilor în Republica Moldova şi facilitarea condiţiilor pentru obţinerea dreptului de şedere de către investitorii străini şi alte categorii de imigranţi //Monitorul Oficial 146/710, 28.08.2011
32/22.04.2010 Dispoziţie cu privire la realizarea acţiunilor de protecţie a copiilor rămaşi fără îngrijire părintească ca urmare a migraţiei părinţilor peste hotare, prevenirea acestui fenomen, asigurarea condiţiilor optime pentru dezvoltarea multilaterală a copiilor //Monitorul Oficial 62-63/373, 27.04.2010
Costs and Benefits of Labour Mobility between the EU and the Eastern Partnership Partner Countries Country Study: Moldova
______________________________________________________________________
85
ANNEX 3. Focus Groups’ Questionnaires
Questionnaire/Guide to Discussion for Migrants’ Focus Group
(Questions for individual migrants) Q. 1: How long have you been a migrant? What were the main reasons that led you to go to a specific destination? Have you migrated to different countries for work purposes? Q. 2: What is your level of education? What kinds of jobs have you held, and have they provided you with use of your skills? Q. 3: What have been the main problems encountered in each of the country destinations you have been to? List them in order of importance. How have they affected your inclination to migrate again to that country? Q. 4: What kind of visa/work permit have you obtained, if any? How difficult was it to get? Q. 5: How have you gone about the practicalities of life (housing, bank accounts, transportation, food)? Have you obtained assistance from your employer(s)? From local authorities? Q. 6: What kind of support/assistance has been provided by the embassy or other office of your country? Have you worked with NGOs/migrant organizations? Q. 7: How have you taken care of your family at the times you have been working abroad? Are there any specific problems/experiences you would like to share? Q. 8: (for migrants mainly to Russia) How likely would you be to migrate to a European Union if the visa regime were made less strict? Would you consider temporary migration contracts? Would you be likely to try and migrate on a permanent basis? Q. 9: (for migrants mainly to EU countries): Are you considering returning to a EU country? How likely would it be if the work permits were to become (Questions for migrants’ associations/NGOs) Q. 1: What types of migrants do you work with/represent? What specific destinations do you deal with? Q. 2: What are the typical problems related to labor migration you have encountered in your work? Are there any differences according to destination? Q. 3: Do you work with migrants’ families, and if so what kind of problems do you address?
Costs and Benefits of Labour Mobility between the EU and the Eastern Partnership Partner Countries Country Study: Moldova
______________________________________________________________________
86
Q. 4: How likely do you think it is that migration towards European Union countries might increase if easier rules were implemented? What about temporary migration schemes? What about schemes targeted to professional migrants?
Costs and Benefits of Labour Mobility between the EU and the Eastern Partnership Partner Countries Country Study: Moldova
______________________________________________________________________
87
Questionnaire/Guide to Discussion for Migrants Officials
Q. 1: Please describe the role of your agency in the migration process. Q. 2: Are there mechanisms of coordination among government entities dealing with migration, and how effective, in your opinion, have they been in the past? Q. 3: What are the stated objectives (if any) of migration policies in Moldova with respect to (i) Outmigration; and (ii) Immigration? Q. 4: How would you describe your cooperation with migration officials in the most important countries of destination of migrants from Moldova? In particular, can you comment on avenues for discussion with the Russian Federation, with the European Union (as an entity) and with individual European Union member states? Q. 5: What are the most important problems that you presently see with respect to migration flows with the European Union? Can you break this down into categories, for instance (i) business travelers; (ii) students and higher education migrants; (iii) migration of skilled workers; (iv) Migration of unskilled workers. Q. 6: Are you aware of backlogs in applications for migration to the EU by residents of your country? If so, have these backlogs been discussed with EU officials? Q. 7: What changes in EU policies for migration you think would be most desirable for Moldova? Are there any ongoing negotiations with the EU and with individual member countries, pointing to an agenda for change in these policy areas? What is your impression of the EaP framework for migration issues? Q. 8: We are asking here to speculate (without commitment, of course). What do you think would be potentially the results of (i) complete liberalization of migration to the EU; (ii) institution of “quotas” for selected categories of migrants (for instance, skilled health workers) Q. 9: (for statistical officials) How well are you able to monitor migration flow in and out of Moldova? Do you have any programs for improvement of statistical coverage? Are you collaborating with official agencies, including those in the most important recipient countries? Q. 10: (for officials dealing with remittances, if any): What are the top priorities in dealing with migrant’s remittances at this point in time? Are you seeking collaboration from EU counterparts in this respect?