Embed Size (px)
Citation preview

VAT Survey 2006 Smooth transition, unfinished agenda*
*connectedthinking

VAT Survey 2006
PricewaterhouseCoopers 2
Contents Preface ……………………………………………………………………………...
3
Executive Summary …………………………..…………………………………...
4
Methodology & Respondents’ Profile ……………………………………………
5
Survey Findings ……………………………………………………………….…...
7
Structure of VAT …………………………………………………………....
7
Transition to VAT ……………………………………………………………
11
VAT Compliance ………………………………………………………….....
15
Conclusions and Expectations ………………………………………….………..
18
Abbreviations …………………………………………….……………….……….
20
PwC Indirect Tax Services ……………………………………………….……….
21
Contact Offices …………...……………………………………………….………. 22

VAT Survey 2006
PricewaterhouseCoopers 3
Preface
The Value Added Tax (VAT) that has been introduced in a majority of the Indian States with effect
from April 1, 2005, in lieu of the erstwhile Sales Tax, has been the single most significant fiscal
reform in the past fifty years. The stated intent of both the Government of India and the
Empowered Committee of the State Finance Ministers, in introducing this measure, has been the
reduction in aggregate taxes, introduction of a common market and the facilitation of bringing into
being of an integrated Goods and Services Tax.
On the eve of completion of one year under the VAT regime, it was felt necessary to take stock of
the implications of VAT on trade and industry, as perceived by them. In this background,
PricewaterhouseCoopers (‘PwC’) conducted a comprehensive VAT Survey in order to document
the experience of businesses across various industrial sectors, on both the policy and operational
aspects of the VAT. The Survey was intended to assess the experience of businesses in
switching over to the VAT regime and to identify their continuing concerns with regard thereto.
The Survey was conducted by using a focused and structured questionnaire which was
administered to more than a hundred companies having all India operations. We take this
opportunity to thank each one of the respondents for having spared their valuable time to provide
their viewpoints on the aforesaid aspects of their VAT experience.
We are happy to present this report summarizing the key findings of the Survey. The results
provide useful insights on how the VAT has come about and how it has impacted prices in
general and business efficiencies in particular. It also highlights the manner in which both industry
and the State Governments have handled the transition.
We are confident that the findings of the Survey will enable the State Governments to better
understand the issues and concerns of trade and industry, especially in view of the recent
introduction of VAT in several additional States, and to consequently further refine the VAT
legislation and rules so as to bring about a simplified, uniform and tax payer friendly VAT.
Rathin Datta
Chairman & CEO
PricewaterhouseCoopers Pvt. Ltd.
18th April 2006
VAT Survey 2006
PricewaterhouseCoopers 4
Executive Summary
Value Added Tax – This much awaited tax reform finally happened in April 2005. Each of the
stakeholders viz. State Governments, Trade and Industry and Consumers had different
experiences to share. The survey was designed to document the experience of the respondent
companies and to identify the unfinished agenda for making the VAT regime more industry
friendly.
It was heartening to note that fully 84% of the respondents believed that the overall experience of
transitioning from the sales tax regime to the VAT regime was smooth.
As to the preparedness of the State Governments in addressing the transition, only a small
percentage of the respondents felt that the State Governments were fully prepared for the switch
over to VAT. The survey respondents also indicated the areas where further improvements in the
VAT regime were required. These were as follows:-
• Introduction of uniform product classifications
• Extension of input tax credits to Central Sales Taxes paid on procurement
• Adoption of a practical approach to VAT audits of assessees
• Introduction of single window assessment processes for all State taxes
• Change in the mindset of VAT administrators
Only 25% of the respondents felt that the VAT had a significant impact on their business model.
The impact of VAT on prices was more or less neutral insofar as industry as a whole was
concerned. The self assessment system, which is the highlight of the VAT, in contrast to the
erstwhile sales tax, has cast a huge responsibility on businesses since 100% compliance with the
VAT rules and regulations is a pre-requisite for self assessment.
The results of the survey are expected to be very revealing for the State Governments and other
stakeholders to gain an insight as to where we are on VAT implementation today, the further
changes that are required in the VAT regime and the manner of realization of the integrated GST,
in line with the statement made by the Finance Minister in his Budget Speech.
S Madhavan Prashant Deshpande
Executive Director & Head- Indirect Tax Practice Executive Director
PricewaterhouseCoopers Pvt. Ltd PricewaterhouseCoopers Pvt. Ltd

VAT Survey 2006
PricewaterhouseCoopers 5
Methodology & Respondents’ Profile VAT Survey 2006 is a detailed analysis documenting the experiences that Trade and Industry
have had in switching over from the erstwhile sales tax to the VAT regime.
PricewaterhouseCoopers carried out this survey entirely with regard to companies having all India
operations. The survey covers all aspects of VAT, from design to implementation and to further
expectations that the Industry has in this regard.
The survey questionnaire was distributed to the participating companies. This was followed up by
telephonic calls to the CFOs in these companies to bring about seriousness to the entire effort.
Special care was taken to ensure that all types of industries and all types of businesses were
appropriately represented in the survey so that the results emerging out of it were representative.
The survey process was completed in a record time of two months and the response rate was
very encouraging. The survey response covered all sectors of business from manufacturing to
trading. The survey also evoked goods response from all industry segments.
Nature of business
2%
44%
15%
2%
3%
1%
1%4%
21%
5%
All
Manu/Trade
Manu/Trade/WorksContractor
Manu/Works Contractor
Manufacturing
Trading
Trading/Works Contractor
Works Contractor
Hotelier services
Others
Most of the respondents were from the manufacturing sector. As to the industrial segments who
have responded, the main respondents were from FMCG, Auto/Auto ancillary and telecom
sectors.
Industry response
10% 7%
8%
21%16%
5%
16%
7%
2% 9%
Auto / Auto ancillary
Construction
Consumer DurablesFMCG
Industrial products
IT hardwareOthers
Pharma & Healthcare
Retail
Telecom

VAT Survey 2006
PricewaterhouseCoopers 6
There was adequate representation from big, medium and low sized companies to this survey.
The profile of the participating companies is depicted below:
Respondent organisation turnover (INR crore)
1 - 99, 22%1000 and above,
35%
500 - 999, 12%
100 - 499, 31%
More than 75% of the respondents were companies with turnover of over Rs 100 crores per
annum.
(Space intentionally left blank)

VAT Survey 2006
PricewaterhouseCoopers 7
Survey Findings Structure of VAT Internationally, VAT is levied on both goods and services. In India, the VAT on manufacture of
goods (CENVAT) and the tax on services are levied by the Central Government whereas the
States levy VAT on sale of goods. The co-existence of the powers of taxation between the
Central and State Governments is typical in a federal country such as India.
The CENVAT regime has stabilized over a period of time. The broad principles adopted by the
Centre in the CENVAT Scheme have been followed while formulating the design of the State
level VAT as well. The major highlights of the White Paper on VAT issued by the Empowered
Committee of State Finance Ministers in January 2005 on the design of the State level VAT
were:-
• Availability of input tax credit of tax paid on purchases
• Zero-rating of exports
• Uniformity in tax rates across the States
• Two basic rates of VAT viz. 4% & 12.5 %
• Gradual phase out of CST
VAT Rates
Under the sales tax regime, the States were operating the following base rates – 4%, 8% and
12%. Whereas the commodities under the erstwhile 4% and 12% rates have been classified
under the 4% and 12.5% rates respectively under the VAT regime, the commodities under the 8%
category have been classified either under the 4% or the 12.5% rate under VAT.
It was thus expected that post VAT implementation, the rates of most commodities would change.
79% of the respondents have confirmed that the rates had indeed changed with regard to their
products due to the switch over to VAT.
Rates comparision - VAT vis-a-vis Sales Tax
43%
36%
21%
0% 10% 20% 30% 40% 50%
Increase
Decrease
No Change

VAT Survey 2006
PricewaterhouseCoopers 8
The Empowered Committee of State Finance Ministers had endeavoured to bring in uniformity in
the VAT structure of the States. As VAT is a State subject, the States have the liberty to prescribe
the rates of sales tax for a particular commodity. As high as 76 % of the respondents felt that the
States have not been successful in bringing about uniformity in the structure of VAT. The
Empowered Committee needs to take note of this very important fact as one of the main
objectives of VAT implementation does not seem to have been met.
Uniformity in state VAT structure
24%
76%
Yes
No
Non uniformity in the VAT rates across the States has adversely impacted companies with all
India operations as they have had to reckon with varying rates in different States.
Impact on prices and margins
The survey indicates that 57% of the respondents did not feel the impact of VAT on their product
prices. However, 22% of the respondents indicated an increase in the product prices while the
balance respondents indicated a decrease in the prices.
Further, an analysis of the responses shows that the auto and auto ancillary as also the
consumer durable sectors together comprise a significant proportion of the respondents who had
indicated that the introduction of the VAT did not impact prices. As regards respondents indicating
a decrease in prices, post introduction of VAT, the industrial goods and construction sectors
formed a significant percentage. Finally, the telecom and FMCG sectors were adversely impacted
as a result of the VAT, in that they have reported an increase in prices, post its introduction.
These findings are interesting and contrary to popular perception that the VAT has contributed to
a price rise in most manufacturing sectors. This appears not to be the case.

VAT Survey 2006
PricewaterhouseCoopers 9
As regards the corollary implications on margins, 44% of the respondents had indicated no
impact on the margins while 29% of the respondent indicated a positive impact on the margins.
The balance 27% indicated a negative impact. Further on analysis it is seem that the IT
hardware, telecom and construction sectors have reported a nil impact on margins as a result of
the switchover. This would mean that for the telecom sector for instance, where there has been a
price increase as a result of VAT, the impact has been passed on through price increase and
margins have consequently been protected. On the other hand, the industrial and pharma sectors
appear to have gained as they have reported a positive impact on margins as a result of the
switchover. Finally, as commonly and correctly understood, the FMCG and retail sectors have
reported a negative impact on margins as a result of the VAT, thereby indicating an inability to
pass on the increased tax cost through price increases.
Benefits under Incentive Schemes
The White Paper on VAT had indicated that the States would continue the benefits granted to
units in backward areas, provided the VAT chain was not affected. The options available to these
units post VAT implementation were therefore limited. The States have followed different
practices. While some States have converted the exemption schemes to deferments others have
chose to continue the exemption schemes for the balance period, although not in conformity with
the White Paper. 56% of the participating companies were satisfied with the manner in which
benefits under the incentive schemes have been continued in the VAT regime.
Satisfied with incentive schemes under VAT
56%
44% Yes
No
VAT Survey 2006
PricewaterhouseCoopers 10
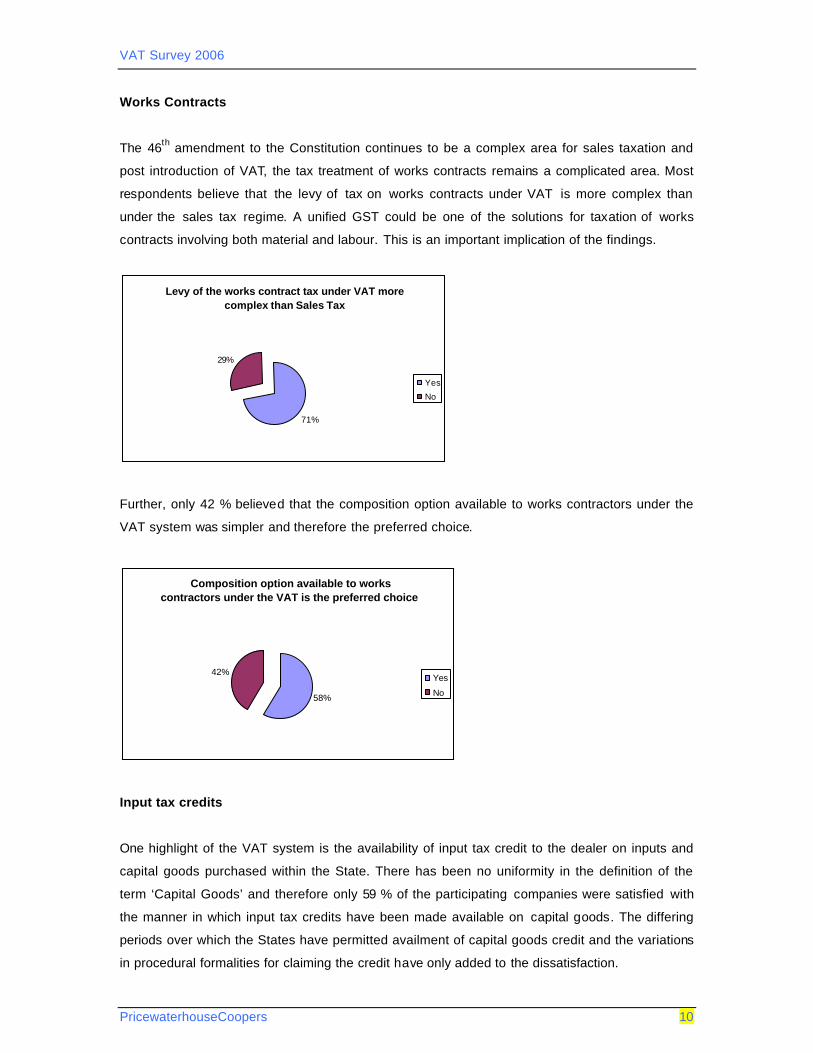
Works Contracts
The 46th amendment to the Constitution continues to be a complex area for sales taxation and
post introduction of VAT, the tax treatment of works contracts remains a complicated area. Most
respondents believe that the levy of tax on works contracts under VAT is more complex than
under the sales tax regime. A unified GST could be one of the solutions for taxation of works
contracts involving both material and labour. This is an important implication of the findings.
Levy of the works contract tax under VAT more complex than Sales Tax
71%
29%
Yes
No
Further, only 42 % believed that the composition option available to works contractors under the
VAT system was simpler and therefore the preferred choice.
Composition option available to works contractors under the VAT is the preferred choice
58%
42%Yes
No
Input tax credits
One highlight of the VAT system is the availability of input tax credit to the dealer on inputs and
capital goods purchased within the State. There has been no uniformity in the definition of the
term ‘Capital Goods’ and therefore only 59 % of the participating companies were satisfied with
the manner in which input tax credits have been made available on capital goods. The differing
periods over which the States have permitted availment of capital goods credit and the variations
in procedural formalities for claiming the credit have only added to the dissatisfaction.

VAT Survey 2006
PricewaterhouseCoopers 11
Satisfied over availability of input tax credits on capital goods
59%
41%Yes
No
A very significant proportion of the auto, auto ancillary, construction, pharma and healthcare and
consumer durable sectors express satisfaction at the manner of availability of input tax credits on
capital goods. However, respondents in the telecom, retail, IT hardware and FMCG sectors were
equally split in their assessment of ease of eligibility to such tax credits.
As regards availment of credit on transition stocks, only 55 % of the participating companies were
able to avail the input tax credit on the transition stocks without difficulty. Once again, the
procedural formalities, which has differed from State to State, and the lack of clarity on the
transition date seem to have played a part in their inability to avail credits without trouble.
Availed input tax credit on transition stocks without difficulty
55%45% Yes
No
Almost all of the participating companies felt that the co-existence of Entry Tax & Special Entry
Tax together with VAT was unnecessary and a cumbersome reality.
Transition to VAT
The transition to VAT was a challenging task for both, the State Governments as well as Trade &
Industry. Both stakeholders were required to do a significant amount of preparatory work so as to

VAT Survey 2006
PricewaterhouseCoopers 12
ensure, a smooth transition from the erstwhile sales tax regime to the fundamentally different
VAT.
However, fully 84 % of the participating companies felt that the overall transition to VAT was
nevertheless smooth. This was probably due to the fact that most of the participating companies
(97%) had either dedicated teams or had appointed consultants to assist them in the transition
phase. This finding is very encouraging but is also due to the fact that the VAT has been a long
time coming and hence companies have been preparing for it for quite a while.
Transition to VAT
84%
16%
Smooth
Difficult
Further, the States that had implemented VAT had also done preparatory work for the switch over
to VAT. This included not only extensive communication campaigns run both by the Central
Government as well as the State Governments but also reorganisation of the tax administration,
extensive computerisation of processes etc. However, 75% of the respondents felt that the State
Governments were only partly prepared in meeting the transitional requirements.

VAT Survey 2006
PricewaterhouseCoopers 13
Preparedness of Sales Tax Department
18%
75%
8%
0% 10% 20% 30% 40% 50% 60% 70% 80%
Fully Prepared
Partially Prepared
Unprepared
As regards the effectiveness of the communications campaigns run by the State Sales Tax
Departments, 63 % felt that the campaigns were effective.
Communication effectiveness
5%
58%
37%Very effective
Effective
Not effective
The communications strategy adopted by the States have obviously helped in the process of
transition and this needs to be vigoursly pursued in the future as well.
Impact on prices
One of the key apprehensions raised by certain stakeholders was the likely increase in prices of
products as a result of the introduction of VAT.
Impact on Prices
22%
20%
57%
0% 10% 20% 30% 40% 50% 60% 70%
Increase in price
Decrease in price
No Change

VAT Survey 2006
PricewaterhouseCoopers 14
The results indicate that there was no change in prices, due to VAT, in the case of 56% of the
participants. It is interesting to note that 22% of the respondents increased the prices of their
products while 20% decreased prices. It would therefore be reasonable to conclude that the
introduction of VAT has been largely price neutral on an overall basis.
Impact on Margins
44% of the respondents indicated that they maintained margins post VAT whereas 28%
experienced a positive impact thereon.
For those industries that experienced a positive impact on margins, the input tax credit
optimisation seems to have played a major part.
Impact on margins
27%
29%
44%
0% 10% 20% 30% 40% 50%
Negative
Positive
No Change
Effect on business model
Only 25 % of the participating companies felt that the introduction of VAT had significantly
impacted their business models.
VAT impact on business model
18%
25%
57%
0% 10% 20% 30% 40% 50% 60%
Insignificant
Significant
Moderate

VAT Survey 2006
PricewaterhouseCoopers 15
This important question as to the impact on business models has had a variety of differing
responses. The telecom, consumer durables, auto and auto ancillary, construction and IT
hardware sectors have all indicated that there has been an insignificant impact of the switchover
to the VAT on their business models. On the other hand, respondents in the retail, industrial
products, FMCG, pharma and healthcare sectors have reported a significant impact on their
business models as a result of the introduction of the VAT. There has thus been a varied and
uneven impact of the VAT across different industrial sectors, perhaps unintended but a reality
nevertheless. As a result, businesses have had to adopt differing responses in order to cope with
these implications.
VAT Compliance
Since the VAT envisages a self assessment process, it requires the highest level of compliance.
The dealers are expected to be fully compliant with the VAT laws and procedures. Further, the
VAT system envisages a trail of transactions to be recorded and consequently maintenance of
proper books and accounts becomes an essential business imperative.
The self assessment system has its own advantages. The dealers are relieved of the burden of
getting the assessments done while the tax administrators concentrate only on major dealers on
an exception basis. In order to achieve 100 % tax compliance, awareness of VAT in an
organisation is a pre requisite. Further, the organisation needs to keep abreast of the frequent
changes that are announced by the State Governments in relation to VAT. These changes are
expected to be high in the initial years of VAT implementation as it will take time for the new
system to stabilise.
Level of awareness of VAT
58%
41%
1%
Good
Moderate
Low

VAT Survey 2006
PricewaterhouseCoopers 16
Keeping abreast of developments in VAT
2%
9%
21%
68%
0% 10% 20% 30% 40% 50% 60% 70% 80%
In house Team
State Govt websites
Briefings fromconsultants
Combination of all
The introduction of VAT is expected to bring about a change in the tax administration as
assessments will now need to be audited as an exception rather than as a rule, as was the case
in the erstwhile sales tax regime. This paradigm shift is expected to result in large scale charges
in procudures and processes. The tax authorities are now expected to play a consultative role
and guide the tax payers in complying with the VAT rules and regulations.
VAT compared to Sales Tax with regard to administrative and procedural matters
4%
25%
29%
42%
0% 10% 20% 30% 40% 50%
Significantimprovement
More cumbersome
No change
Improvement
Are Officials more responsive in dealing with queries under the VAT ?
44%
56%
Yes
No

VAT Survey 2006
PricewaterhouseCoopers 17
The recording and accounting of transactions is of utmost importance in the VAT regime and
organisations will now be required to be vigilant in maintaining full and complete books of
accounts with comprehensive documentation.
Accounting and book keeping requirements in VAT as compared to Sales Tax
20%
31%
49%
0% 10% 20% 30% 40% 50% 60%
Simpler
More difficult
Same as before
80 % of the participating companies were of the opinion that the introduction of VAT Audit by
professional accountants was a helpful measure and could assist the Sales Tax / Commercial
Tax Departments to expedite their validation and verification processes and procedures.
Will the VAT audit by professional accountants assist the Tax Department in concluding the assessment process expeditiously
80%
20%
YesNo
(Space intentionally left blank)

VAT Survey 2006
PricewaterhouseCoopers 18
Conclusions and Expectations
The VAT system is in force for a year now. Apart from its initial resistance, Trade and Industry
has welcomed the implementation of VAT as the pros clearly out number the cons. However,
there are still some areas where businesses feel that much needs to be done.
The respondents were asked to rate the VAT regime, on a scale of 1-10(1 being Poor and 10
being Excellent), the VAT regime on parameters such as simplicity, transparency and
effectiveness.
Rating VAT Regime
1
0
2
4
21
37
24
11
0 10 20 30 40
1
3
5
7
Rat
ing
Percentage
%
The participating companies were also asked to identify the areas where they wished to see
improvements / changes so as to make the VAT more industry friendly. They were also asked to
give suggestions. The broad areas identified for improvement were: -
• Rates of taxes
• Classification of Industrial inputs
• Compliance Procedures
• Refund Procedures
Some of the suggestions received were:-
• Introduction of uniform product classifications
• Extension of input tax credits to Central Sales Taxes paid on procurement
• Adoption of a practical approach to VAT audits of assessees
• Introduction of single window assessment processes for all State taxes

VAT Survey 2006
PricewaterhouseCoopers 19
• Change in the mindset of VAT administrators
Phasing out of CST
28 % of the participating Companies were of the view that the CST should be gradually reduced
to nil with continuation of statutory forms such as C, F etc. However, 58 % chose to opt for CST
rate being equal to local VAT rate coupled with abolition of all statutory forms and full input tax
credit of CST paid to the eligible purchasers. Only 14 % of the participating companies opted for
the option of levy of entry tax / VAT by the importing State at the point of entry of goods into the
State.
Best option for phasing out of CST
28%
58%
14%
Gradual reduction
Continuation of CST rateequal to local VAT rate
Levy of entry tax/ VAT
Interestingly, the respondents in the consumer durable and retail sectors were in favour of entry
tax in lieu of CST, whereas a significant proportion of respondents in the pharma, telecom,
FMCG, auto, auto ancillary and construction sectors favoured a continuation of CST, equivalent
to the local VAT rate.
Switch over to GST
All the participating Companies were unanimous that it was time for India to begin the process of
switch over to a unified Goods and Services Tax. Most of them were of the view that it should
happen in the next five years. This seems to be entirely in line with the Government of India’s
intention to introduce the GST with effect from April 1, 2010.
(Space intentionally left blank)

VAT Survey 2006
PricewaterhouseCoopers 20
Abbreviations
CENVAT Central Value Added Tax
CEO Chief Executive Officer
CFO Chief Financial Officer
CST Central Sales Tax
FMCG Fast Moving Consumer Goods
GST Goods and Services Tax
LTU Large Taxpayer Unit
PwC PricewaterhouseCoopers
TIN Taxpayer Identification Number
VAT Value Added Tax

VAT Survey 2006
PricewaterhouseCoopers 21
PwC Indirect Tax Services
Indirect Taxes pervade every area of a company’s business across various industry sectors.
Their impact on material & product costs, prices, cash flow, profitability and, ultimately on
shareholder value is being increasingly recognised as an important element in national and global
competitiveness. However, unlike their corporate tax sibling, indirect taxes are often poorly
understood and rarely actively managed or even measured. Typically, responsibility for indirect
taxes falls between diverse departments such as operations, finance, procurement, tax and legal,
with no central co-ordination or overall strategy. Yet, indirect taxes often represent the biggest
element of a company’s tax costs.
PwC’s Indirect Tax Practice addresses the above challenge through the core value proposition of
the strategic management of indirect taxes. We offer comprehensive advice and assistance in all
areas of indirect taxes from customs to central excise from service tax to works contract tax and
sales tax and, now, the VAT. All this is backed by litigation support at every stage. We also offer
expertise on all aspects of trade policy, including on free trade agreements, anti dumping duties
and cross border supply chains.
The practice is an all India one and is represented in seven India cities viz. New Delhi, Mumbai,
Kolkatta, Chennai, Bangalore, Hyderabad and Pune. The Indirect tax teams in each of these
locations consist of well qualified and experienced professionals with expertise in all areas of
indirect tax law. We also have industry specialists who are able to synthesise their industry and
tax knowledge so as to offer optimal and tax efficient solutions to our clients.
VAT Survey 2006
PricewaterhouseCoopers 22
Contact Offices Bangalore PricewaterhouseCoopers Pvt. Ltd 14th Floor, Mittal Tower B- Wing, 47/6 M. G. Road Tel - 080- 2558 6362 / 2558 6365 Fax - 080- 2558 6354 Chennai PricewaterhouseCoopers Pvt. Ltd PwC Centre #32, Khader Nawaz Khan Road Nungambakkam Chennai – 600 006 Tel - 044- 4228 5000 Fax - 044- 4228 5100 Delhi PricewaterhouseCoopers Pvt. Ltd Sucheta Bhawan, ( Gate No. 2) 11- A, Vishnu Digambar Marg New Delhi – 110 002 Tel - 011-4115 0000 / 2321 0890 – 99 Fax - 011-232 10594 / 96 Hyderabad PricewaterhouseCoopers Pvt. Ltd 6-3-550, 4th Floor, L B Bhawan Somajiguda Hyderabad – 500 087 Tel - 040- 5566 6081 / 5566 6082 Fax - 040 – 5566 6080 Kolkatta PricewaterhouseCoopers Pvt. Ltd Plot No. Y 14, Block EP Sector V, Salt Lake Electronics Complex, Bidhan Nagar Kolkatta – 700 091 Tel - 033- 2357 9100 / 2357 3384 – 3390 Fax - 033-2357 3394 / 2357 3395

VAT Survey 2006
PricewaterhouseCoopers 23
Mumbai PricewaterhouseCoopers Pvt. Ltd 252, Veer Savarkar Marg Shivaji Park, Dadar Mumbai – 400 028 Tel - 022- 5669 1500 Fax - 022 - 5654 7804 / 5654 7805 Pune PricewaterhouseCoopers Pvt. Ltd 401, Century Arcade 243 – 244, B/2, Narangi Baug Road Off Bund Garden Road Pune – 411 001 Tel - 020- 2612 3787 / 2612 3271 Fax - 020 – 2612 1131