Embed Size (px)
Citation preview
Table of Grade Distribution by Gender
Grade UG E E+ D D+ C C+ B B+ A A+ NR Total
Male n 106 60 204 1,073 1,582 1,935 2,039 2,479 2,032 1,890 1,720 0 15,120
% 0.7 0.4 1.3 7.1 10.5 12.8 13.5 16.4 13.4 12.5 11.4 0.0 100.0
Female n 61 33 164 1,139 1,706 2,101 2,437 2,996 2,452 2,165 1,664 0 16,918
% 0.4 0.2 1.0 6.7 10.1 12.4 14.4 17.7 14.5 12.8 9.8 0.0 100.0
Gender X n 0 0 0 1 2 1 3 4 1 1 3 0 16
% 0.0 0.0 0.0 6.3 12.5 6.3 18.8 25.0 6.3 6.3 18.8 0.0 100.0
Total n 167 93 368 2,213 3,290 4,037 4,479 5,479 4,485 4,056 3,387 0 32,054
% 0.5 0.3 1.1 6.9 10.3 12.6 14.0 17.1 14.0 12.7 10.6 0.0 100.0
Score Ranges 0-9 10-12 13-20 21-37 38-47 48-55 56-63 64-73 74-82 83-91 92-100 N/A Max 100
Mean 65.3
Std Dev 20.2
Median B
986
680
2
1,668
16,105
17,598
18
33,721
Gender X
Total
Gender X numbers are too low for a graph to be meaningful
© Victorian Curriculum and Assessment Authority, 2019
Male
Female
Gender X
Total
Total Enrolments incl.
Not Assessed:
Male
Female
Further Mathematics
Graded Assessment 1COURSEWORK UNIT 3/4
2018
Not Assessed:
Summary Statistics:
For privacy reasons, a gender with less than 5 students assessed has been assigned to the category of NR (Not Reported).
No graph is supplied for this GA as student numbers are too small for a graph to be meaningfull.
The above 2018 information includes students from both the 2018 Victorian academic calendar year and the 2019 Northern Hemisphere Timetable (academic year from July to June). The NHT academic year results are subject to equating to ensure comparability with the results of the cohort assessed in the preceding calendar year.
0
2
4
6
8
10
12
14
16
18
20
UG E E+ D D+ C C+ B B+ A A+
%
Grade DistributionMale Female Total
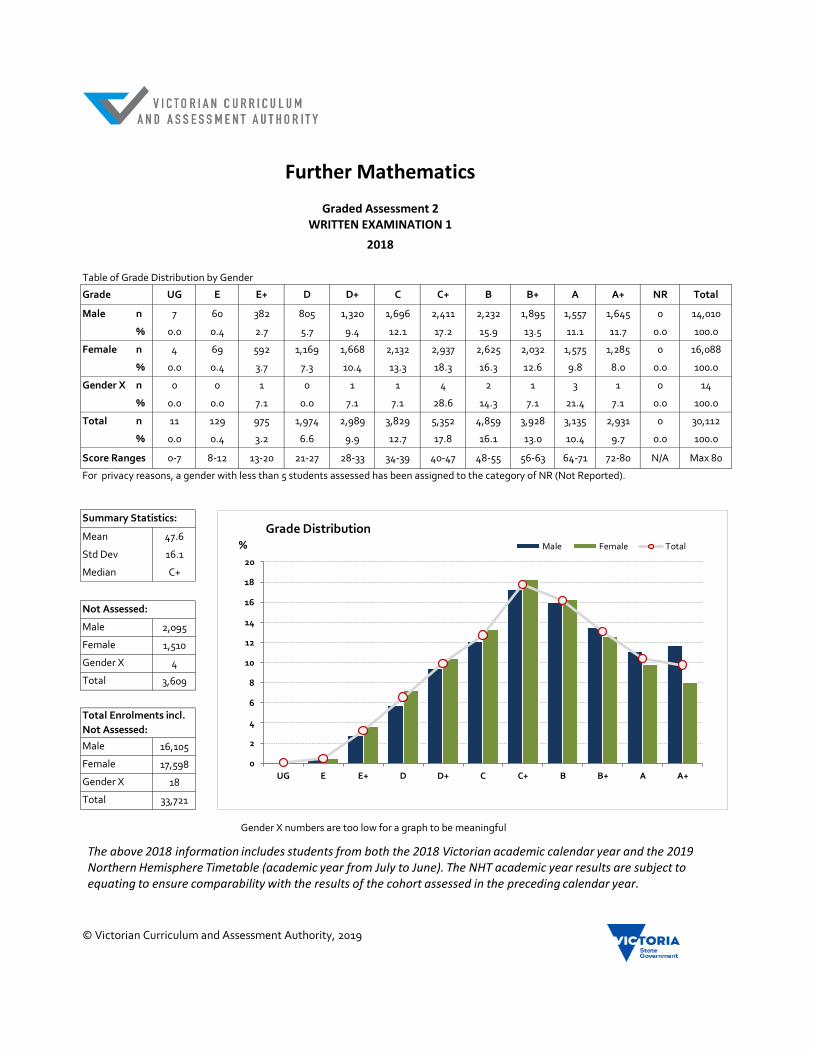
Table of Grade Distribution by Gender
Grade UG E E+ D D+ C C+ B B+ A A+ NR Total
Male n 7 60 382 805 1,320 1,696 2,411 2,232 1,895 1,557 1,645 0 14,010
% 0.0 0.4 2.7 5.7 9.4 12.1 17.2 15.9 13.5 11.1 11.7 0.0 100.0
Female n 4 69 592 1,169 1,668 2,132 2,937 2,625 2,032 1,575 1,285 0 16,088
% 0.0 0.4 3.7 7.3 10.4 13.3 18.3 16.3 12.6 9.8 8.0 0.0 100.0
Gender X n 0 0 1 0 1 1 4 2 1 3 1 0 14
% 0.0 0.0 7.1 0.0 7.1 7.1 28.6 14.3 7.1 21.4 7.1 0.0 100.0
Total n 11 129 975 1,974 2,989 3,829 5,352 4,859 3,928 3,135 2,931 0 30,112
% 0.0 0.4 3.2 6.6 9.9 12.7 17.8 16.1 13.0 10.4 9.7 0.0 100.0
Score Ranges 0-7 8-12 13-20 21-27 28-33 34-39 40-47 48-55 56-63 64-71 72-80 N/A Max 80
Mean 47.6
Std Dev 16.1
Median C+
2,095
1,510
4
3,609
16,105
17,598
18
33,721
Gender X
Total
Gender X numbers are too low for a graph to be meaningful
© Victorian Curriculum and Assessment Authority, 2019
Male
Female
Gender X
Total
Total Enrolments incl.
Not Assessed:
Male
Female
Further Mathematics
Graded Assessment 2WRITTEN EXAMINATION 1
2018
Not Assessed:
Summary Statistics:
For privacy reasons, a gender with less than 5 students assessed has been assigned to the category of NR (Not Reported).
No graph is supplied for this GA as student numbers are too small for a graph to be meaningfull.
The above 2018 information includes students from both the 2018 Victorian academic calendar year and the 2019 Northern Hemisphere Timetable (academic year from July to June). The NHT academic year results are subject to equating to ensure comparability with the results of the cohort assessed in the preceding calendar year.
0
2
4
6
8
10
12
14
16
18
20
UG E E+ D D+ C C+ B B+ A A+
%
Grade DistributionMale Female Total
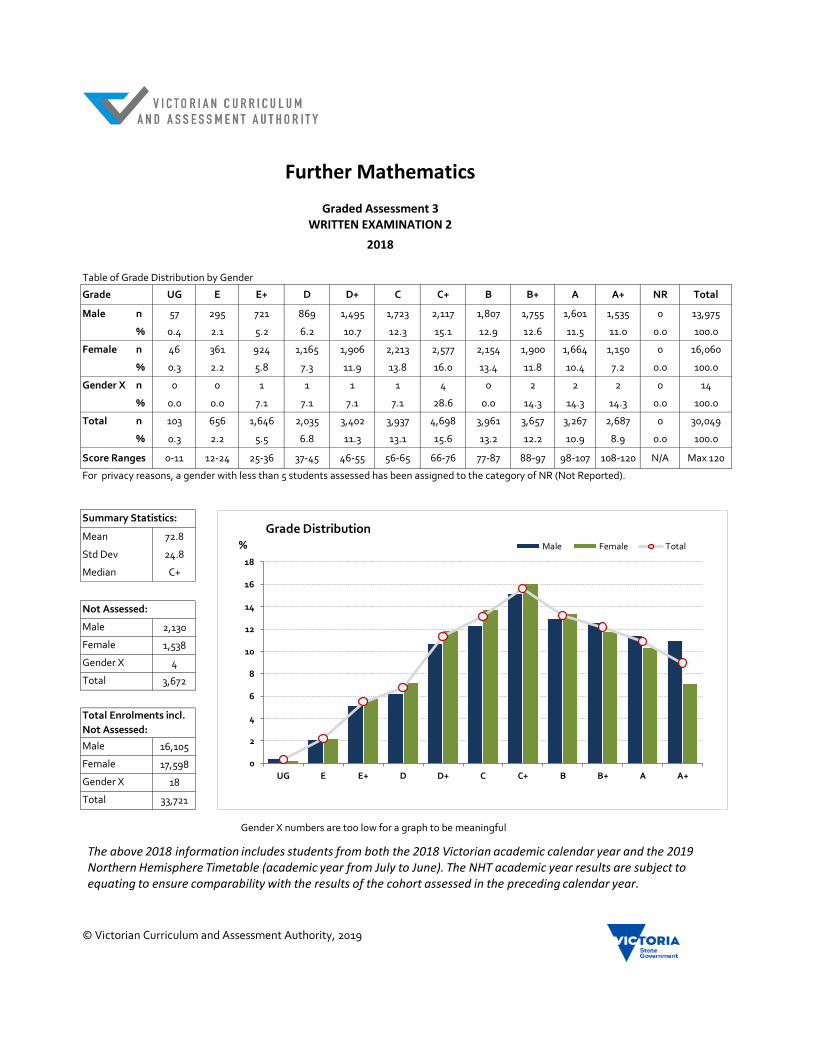
Table of Grade Distribution by Gender
Grade UG E E+ D D+ C C+ B B+ A A+ NR Total
Male n 57 295 721 869 1,495 1,723 2,117 1,807 1,755 1,601 1,535 0 13,975
% 0.4 2.1 5.2 6.2 10.7 12.3 15.1 12.9 12.6 11.5 11.0 0.0 100.0
Female n 46 361 924 1,165 1,906 2,213 2,577 2,154 1,900 1,664 1,150 0 16,060
% 0.3 2.2 5.8 7.3 11.9 13.8 16.0 13.4 11.8 10.4 7.2 0.0 100.0
Gender X n 0 0 1 1 1 1 4 0 2 2 2 0 14
% 0.0 0.0 7.1 7.1 7.1 7.1 28.6 0.0 14.3 14.3 14.3 0.0 100.0
Total n 103 656 1,646 2,035 3,402 3,937 4,698 3,961 3,657 3,267 2,687 0 30,049
% 0.3 2.2 5.5 6.8 11.3 13.1 15.6 13.2 12.2 10.9 8.9 0.0 100.0
Score Ranges 0-11 12-24 25-36 37-45 46-55 56-65 66-76 77-87 88-97 98-107 108-120 N/A Max 120
Mean 72.8
Std Dev 24.8
Median C+
2,130
1,538
4
3,672
16,105
17,598
18
33,721
Gender X
Total
Gender X numbers are too low for a graph to be meaningful
© Victorian Curriculum and Assessment Authority, 2019
Male
Female
Gender X
Total
Total Enrolments incl.
Not Assessed:
Male
Female
Further Mathematics
Graded Assessment 3WRITTEN EXAMINATION 2
2018
Not Assessed:
Summary Statistics:
For privacy reasons, a gender with less than 5 students assessed has been assigned to the category of NR (Not Reported).
No graph is supplied for this GA as student numbers are too small for a graph to be meaningfull.
The above 2018 information includes students from both the 2018 Victorian academic calendar year and the 2019 Northern Hemisphere Timetable (academic year from July to June). The NHT academic year results are subject to equating to ensure comparability with the results of the cohort assessed in the preceding calendar year.
0
2
4
6
8
10
12
14
16
18
UG E E+ D D+ C C+ B B+ A A+
%
Grade DistributionMale Female Total


![Hums: VCE Lessons and assessmentsteenberg.weebly.com/uploads/2/0/1/4/20143603/steenberg_-_vce... · [HUMS: VCE LESSONS AND ASSESSMENT] Development of a sequence of VCE activities](https://img.pdfslide.net/doc/110x75/5acf1b9d7f8b9ac1478c67d3/hums-vce-lessons-and-hums-vce-lessons-and-assessment-development-of-a-sequence.jpg)