Embed Size (px)
Citation preview
170 Nonlinear Analysis: Modelling and Control, 2011, Vol. 16, No. 2, 170–180
Vectorization of human pelvis objects in X-ray images
Algimantas Juozapavicius, Ramunas MarkauskasFaculty of Mathematics and Informatics of Vilnius UniversityNaugarduko str. 24, LT-03225 Vilnius, [email protected]; [email protected]
Received: 20 January 2011 / Revised: 14 April 2011 / Published online: 30 May 2011
Abstract. In medical diagnostics visual evaluation of an object or its image is necessary but timeconsuming operation. Well-known computer vision algorithms or their compilation, or even somenew methods should be the right tool in increasing the speed and reliability of this process. Thispaper introduces situation in this domain and some experiments and their results in extractionof biomechanical parameters of human pelvis from x-ray images using combination of Houghtransform for a line, for a circle (arc) and Canny edge detector. The main idea of an algorithm, whichwas created during this experiment, is to use different levels of noise filter thus making a balancebetween leaving too much noise and removing too much actual data. The basic steps would be: filterout most of noise and noisy objects using high filter’s threshold value; find sharp and clear objects;narrow the set of possible parameters of noisy objects; apply noise filter with lower threshold valueto the original image; find noisy objects. Experiment shows that algorithm works but it needs tobe tested on reliability and some bindings with actual biomechanical parameters should be done(see [1–6]).
Keywords: Hough transform, human pelvis, biomechanical parameters.
1 Introduction
Contemporary medical diagnostics explores intensively visual evaluation of medical im-ages, signals or other complicated objects. In some cases visual diagnostics is relativelysimple (for example, in case of non-complicated bone fracture), however, in many othercases mere visual inspection is not sufficient and detailed diagnosis requires complexmeasurements, as well as extraction of biomechanical parameters of an object. Theextraction of biomechanical parameters is a time-consuming process often prone to mis-takes. One of the ways to reduce costs of this process and increase its reliability is touse computer vision algorithms, which can accelerate and unify the process, thus leavingto a physician just a function of interpretation, i.e. assessment of a medical condition,selection of an appropriate treatment method and evaluation of its efficiency. Differentdysfunctions of an acetabulofemoral joint which result in pain and/or motility restrictionsare important factors determining a person’s quality of life. Such dysfunction may becongenital, caused by trauma or joint operation conditions (such as long-term joint strain
c© Vilnius University, 2011
Vectorization of human pelvis objects in X-ray images 171
exceeding joint stress limits due to obesity, hard physical work, uncomfortable bodyposition or repeated movements), natural wear on joints or may be a result of otherpathologies. Around 10% of patients over 85 years of age suffer from a degenerative ac-etabulofemoral joint disease and according to the data of different studies, the occurrenceof congenital joint dislocation among newborns due to insufficient development rangesfrom 3% to 7.5% of all cases. Modern medicine can help all patients suffering from thesetypes of joint dysfunctions, however, treatment resources are not sufficient. Establishmentof pathological diagnoses in the pelvic area (such as dysplasia, arthrosis, dislocationor fracture) and selection of treatment methods relies on a number of methods basedon calculations involving biomechanical parameters of objects under analysis. Theseparameters can be conveyed in geometrical expressions: points, distances among objects,positions of objects to each other and angle formations. Currently all measurements aremade manually using a protractor ruler or vector graphics applications. In general, thediagnostic process involves the following steps (see [4, 7]):
1. Pain diagnostics;2. Anamnesis;3. Patient examination (temperature, visual changes, palpation, pace, stand, move-
ment extent);4. Radiology test and extraction of biomechanical parameters;5. Additional diagnostic methods, if necessary (computed tomography, radioisotope
bone scan, ultrasound testing, magnetic resonance imaging, arthroscopy).
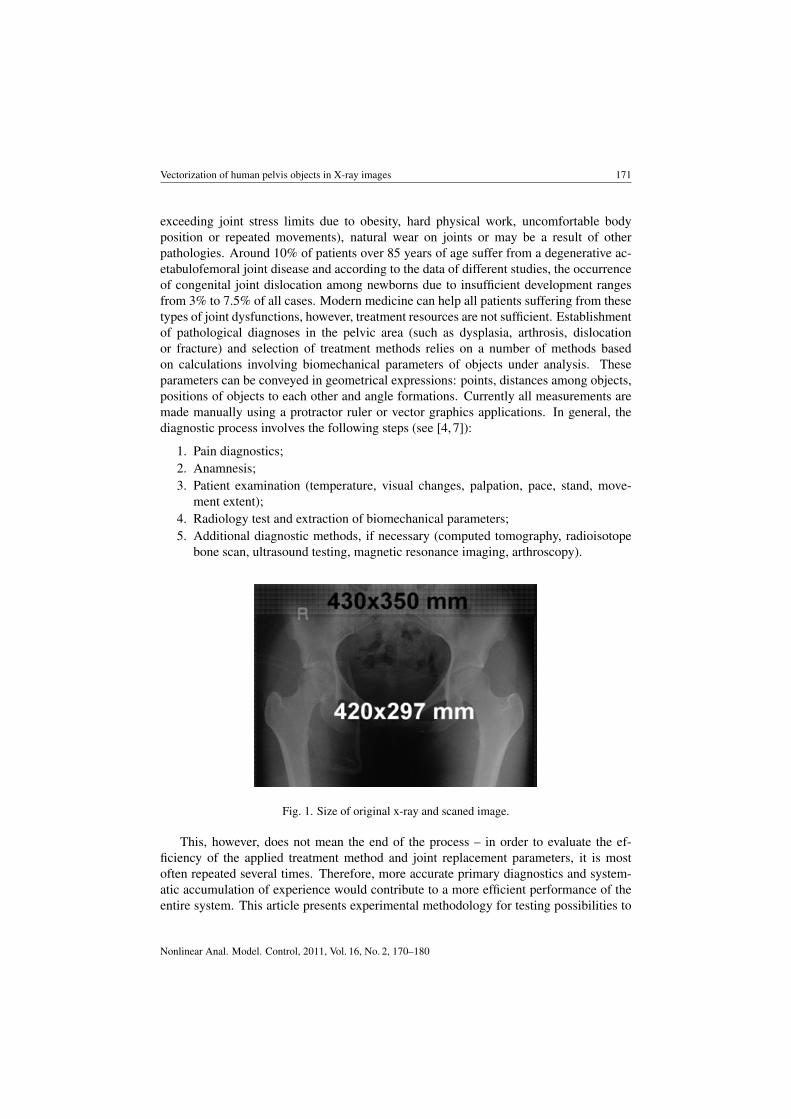
Fig. 1. Size of original x-ray and scaned image.
This, however, does not mean the end of the process – in order to evaluate the ef-ficiency of the applied treatment method and joint replacement parameters, it is mostoften repeated several times. Therefore, more accurate primary diagnostics and system-atic accumulation of experience would contribute to a more efficient performance of theentire system. This article presents experimental methodology for testing possibilities to
Nonlinear Anal. Model. Control, 2011, Vol. 16, No. 2, 170–180
172 A. Juozapavicius, R. Markauskas
develop automatic tools used for extraction of biomechanical parameters in the diagnosticprocess. There are a number of medical methods for extracting biomechanical parame-ters. Some methods are used in primary diagnostics, certain calculations are made whenobserving the course of treatment, while other methods are employed only in exceptionalcases when standard methods fail to provide enough information. The article presentsa simulation of an automatic analysis of an x-ray image aimed at extracting differentobjects of a human structure, such as bone structures, the parameterisation of which wouldallow calculating biomechanical parameters used in the most commonly applied standarddiagnostic methods. Moreover, the research has also produced a method for digitisingx-ray images with the use of available means.
2 Digitisation of x-ray images
The main obstacle for digitisation of x-ray images is that in contrast to paper objects, x-rayimages are relatively transparent, therefore, they reflect a smaller quantity of light emittedby scanning equipment and are less visible to an optical device of a scanner. The idea ofthe new method is to use an additional source of light thus making an x-ray image betterrecognisable to an optical device of a conventional scanner. X-rays of the pelvic bone areaof an adult are usually done using two size formats: 350 × 350 mm and 350 × 430 mm.Each of these formats exceeds maximum sizes of originals accepted by a scanner by atleast one dimension but objects under analysis fit within scanner dimensions, thus, at theexpense of margins of the original image we retain relevant data. The steps of the scanningprocess are as follows: at first, a radiograph is placed on the scanner glass and coveredwith a sheet of paper which serves as a filter for even distribution of light and reduction ofnoises in the digitized image. Then, an additional source of light is prepared, switched onand scanning is started. During scanning, the original scanner equipment moves along theobject being scanned and the operator follows its movement with the additional source oflight and illuminates the spot being scanned. Digital images obtained using this methodshow real images of a radiograph and thus can be used for further analysis.
3 Research object
Objects under analysis are x-ray images of human pelvic bone area. The aim of the re-search is to separate objects which could be linked with biomechanical parameters or usedas a basis for their calculation. Some possible links among objects and biomechanicalparameters are presented in Table 1 (see [4]).
Table 1. X-ray objects and biomechanical parameters.
Object Biomechanical parameterFemoral ridges Direction of a femur, femoral axis, femoral thickness, position
of femurs to each otherFemoral head Centre of the head, distance of the head from the femoral axisPelvic arches Angle between the arches, angle between pelvic bones and femurs
www.mii.lt/NA
Vectorization of human pelvis objects in X-ray images 173
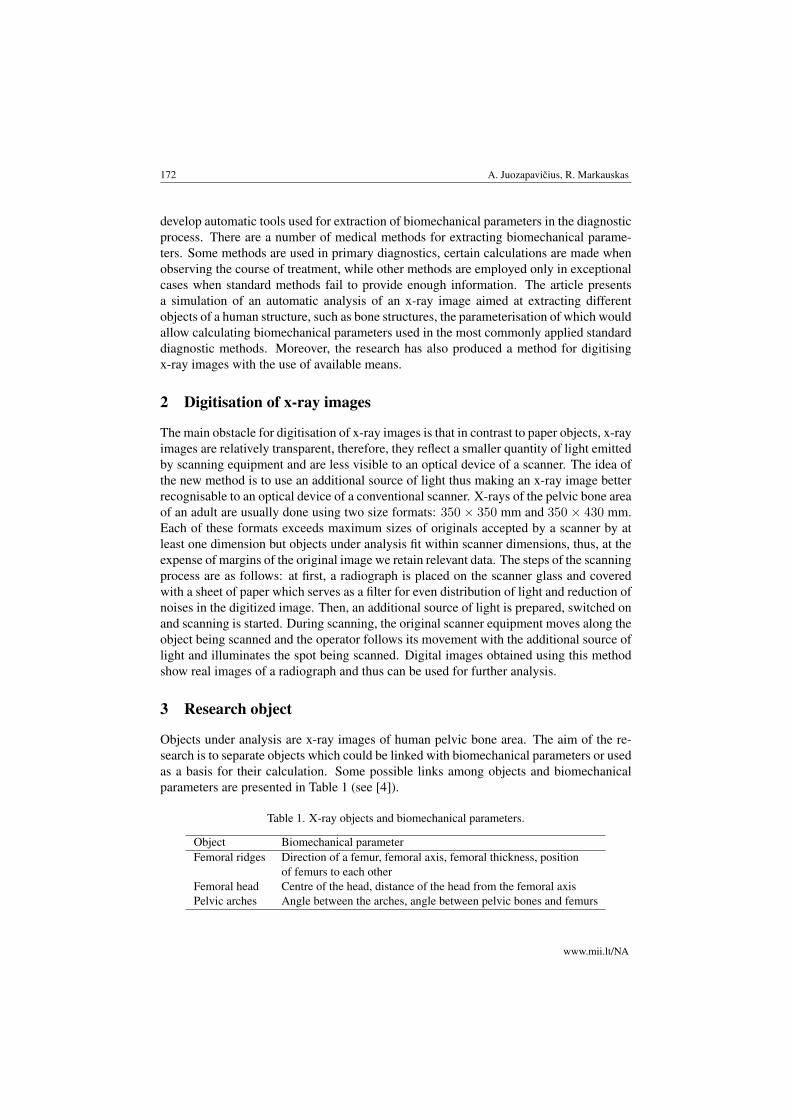
Fig. 2. A – femoral ridges; B – pelvic arches; C – femoral heads.
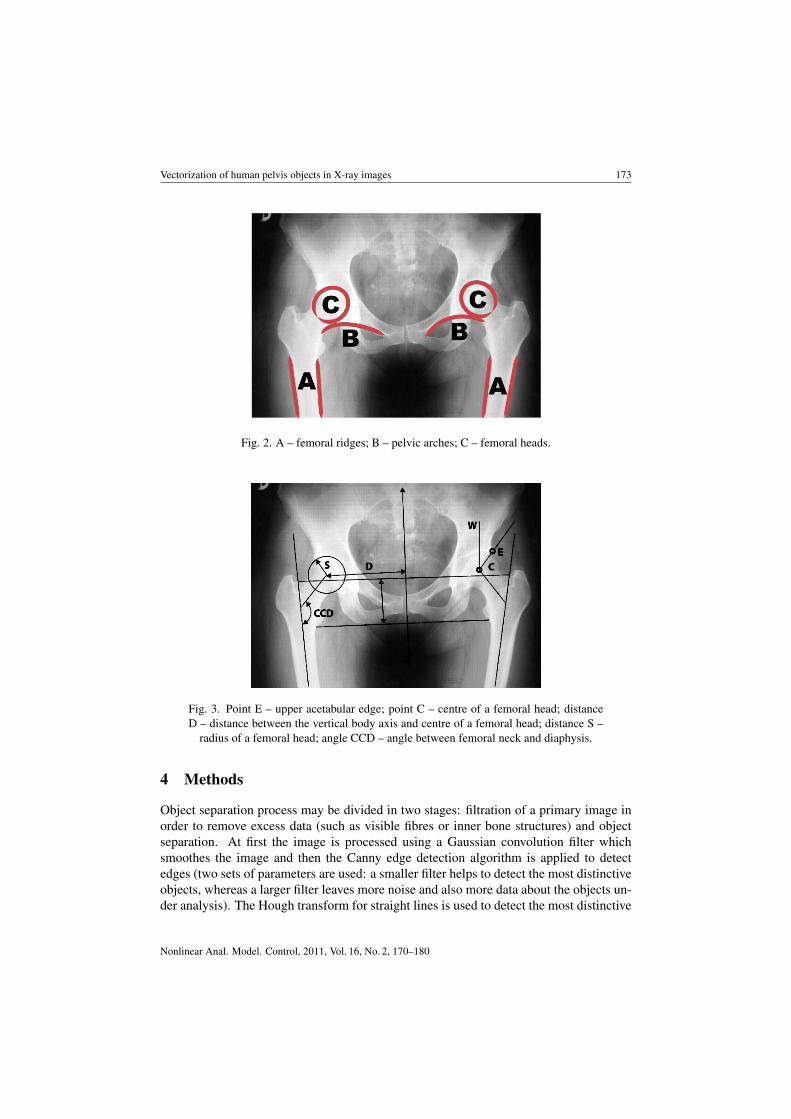
Fig. 3. Point E – upper acetabular edge; point C – centre of a femoral head; distanceD – distance between the vertical body axis and centre of a femoral head; distance S –
radius of a femoral head; angle CCD – angle between femoral neck and diaphysis.
4 Methods
Object separation process may be divided in two stages: filtration of a primary image inorder to remove excess data (such as visible fibres or inner bone structures) and objectseparation. At first the image is processed using a Gaussian convolution filter whichsmoothes the image and then the Canny edge detection algorithm is applied to detectedges (two sets of parameters are used: a smaller filter helps to detect the most distinctiveobjects, whereas a larger filter leaves more noise and also more data about the objects un-der analysis). The Hough transform for straight lines is used to detect the most distinctive
Nonlinear Anal. Model. Control, 2011, Vol. 16, No. 2, 170–180
174 A. Juozapavicius, R. Markauskas
objects, such as femur edges, whereas the Hough transform for circles, i.e. the Houghtransform for curves, is used to find femoral heads and pelvic arches.
5 Object separation
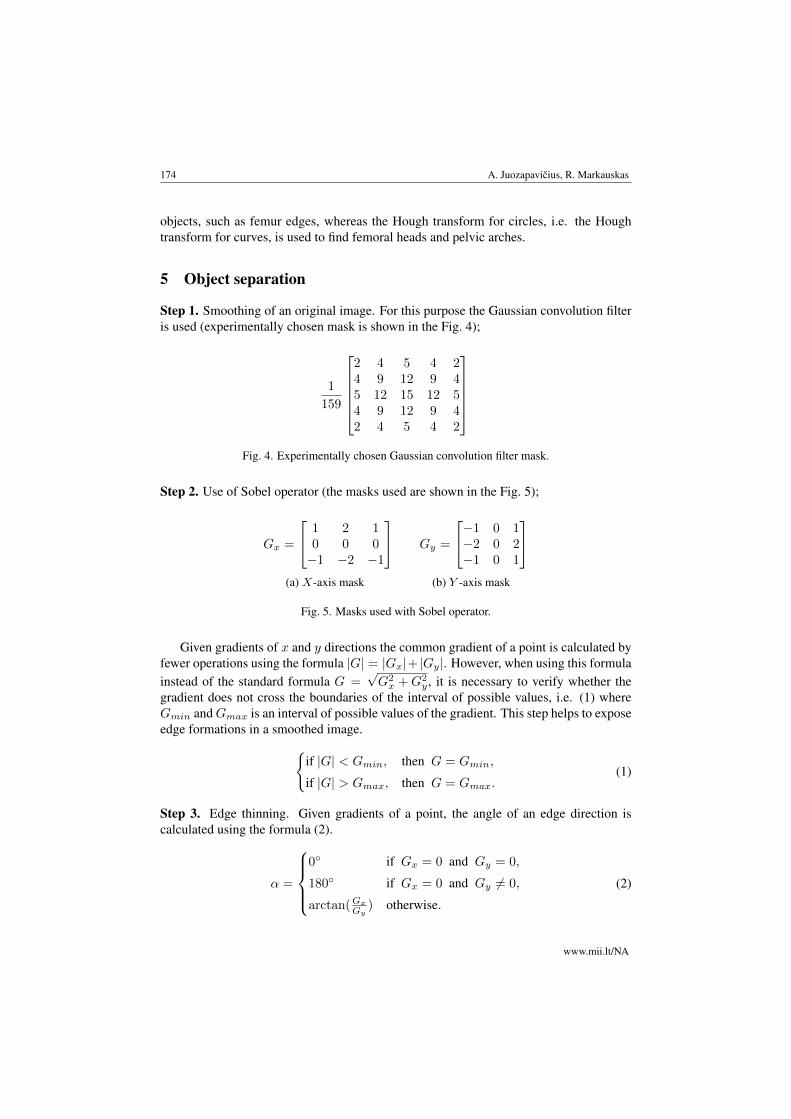
Step 1. Smoothing of an original image. For this purpose the Gaussian convolution filteris used (experimentally chosen mask is shown in the Fig. 4);
1
159
2 4 5 4 24 9 12 9 45 12 15 12 54 9 12 9 42 4 5 4 2
Fig. 4. Experimentally chosen Gaussian convolution filter mask.
Step 2. Use of Sobel operator (the masks used are shown in the Fig. 5);
Gx =
1 2 10 0 0−1 −2 −1
Gy =
−1 0 1−2 0 2−1 0 1
(a) X-axis mask (b) Y -axis mask
Fig. 5. Masks used with Sobel operator.
Given gradients of x and y directions the common gradient of a point is calculated byfewer operations using the formula |G| = |Gx|+ |Gy|. However, when using this formulainstead of the standard formula G =
√G2x +G2
y , it is necessary to verify whether thegradient does not cross the boundaries of the interval of possible values, i.e. (1) whereGmin andGmax is an interval of possible values of the gradient. This step helps to exposeedge formations in a smoothed image.{
if |G| < Gmin, then G = Gmin,
if |G| > Gmax, then G = Gmax.(1)
Step 3. Edge thinning. Given gradients of a point, the angle of an edge direction iscalculated using the formula (2).
α =
0◦ if Gx = 0 and Gy = 0,
180◦ if Gx = 0 and Gy 6= 0,
arctan(Gx
Gy) otherwise.
(2)
www.mii.lt/NA
Vectorization of human pelvis objects in X-ray images 175
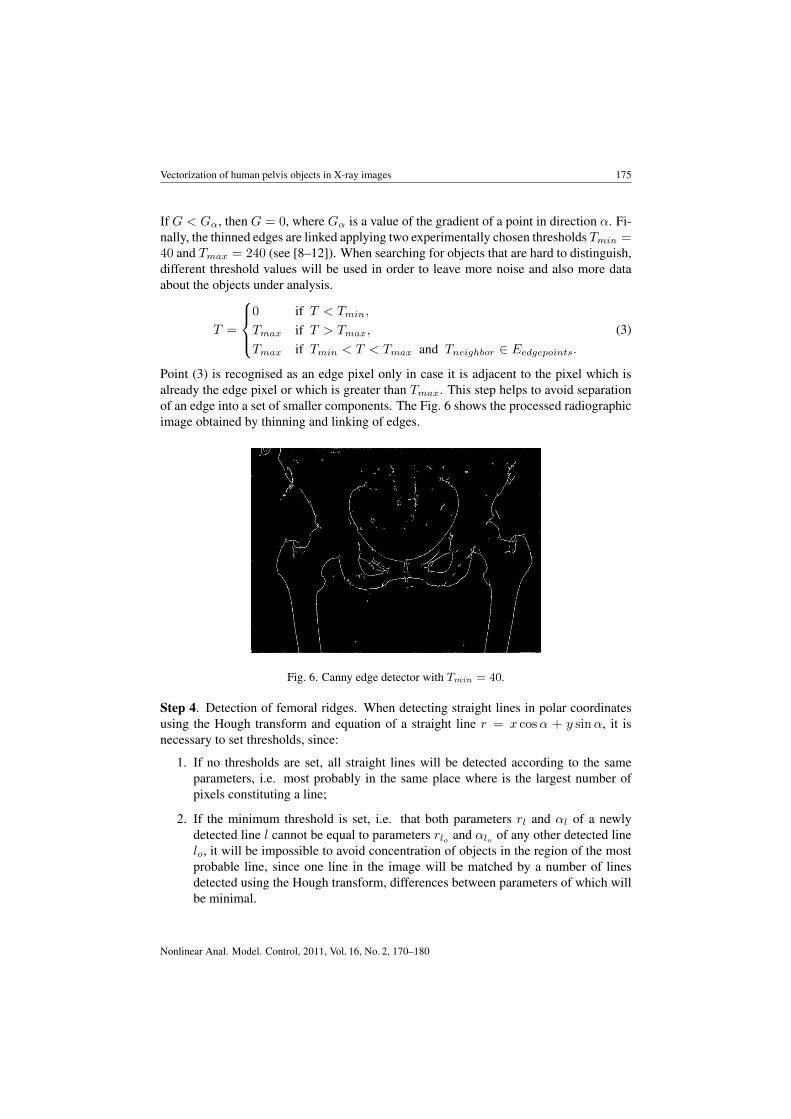
If G < Gα, then G = 0, where Gα is a value of the gradient of a point in direction α. Fi-nally, the thinned edges are linked applying two experimentally chosen thresholds Tmin =40 and Tmax = 240 (see [8–12]). When searching for objects that are hard to distinguish,different threshold values will be used in order to leave more noise and also more dataabout the objects under analysis.
T =
0 if T < Tmin,
Tmax if T > Tmax,
Tmax if Tmin < T < Tmax and Tneighbor ∈ Eedgepoints.(3)
Point (3) is recognised as an edge pixel only in case it is adjacent to the pixel which isalready the edge pixel or which is greater than Tmax. This step helps to avoid separationof an edge into a set of smaller components. The Fig. 6 shows the processed radiographicimage obtained by thinning and linking of edges.
Fig. 6. Canny edge detector with Tmin = 40.
Step 4. Detection of femoral ridges. When detecting straight lines in polar coordinatesusing the Hough transform and equation of a straight line r = x cosα + y sinα, it isnecessary to set thresholds, since:
1. If no thresholds are set, all straight lines will be detected according to the sameparameters, i.e. most probably in the same place where is the largest number ofpixels constituting a line;
2. If the minimum threshold is set, i.e. that both parameters rl and αl of a newlydetected line l cannot be equal to parameters rlo and αlo of any other detected linelo, it will be impossible to avoid concentration of objects in the region of the mostprobable line, since one line in the image will be matched by a number of linesdetected using the Hough transform, differences between parameters of which willbe minimal.
Nonlinear Anal. Model. Control, 2011, Vol. 16, No. 2, 170–180
176 A. Juozapavicius, R. Markauskas
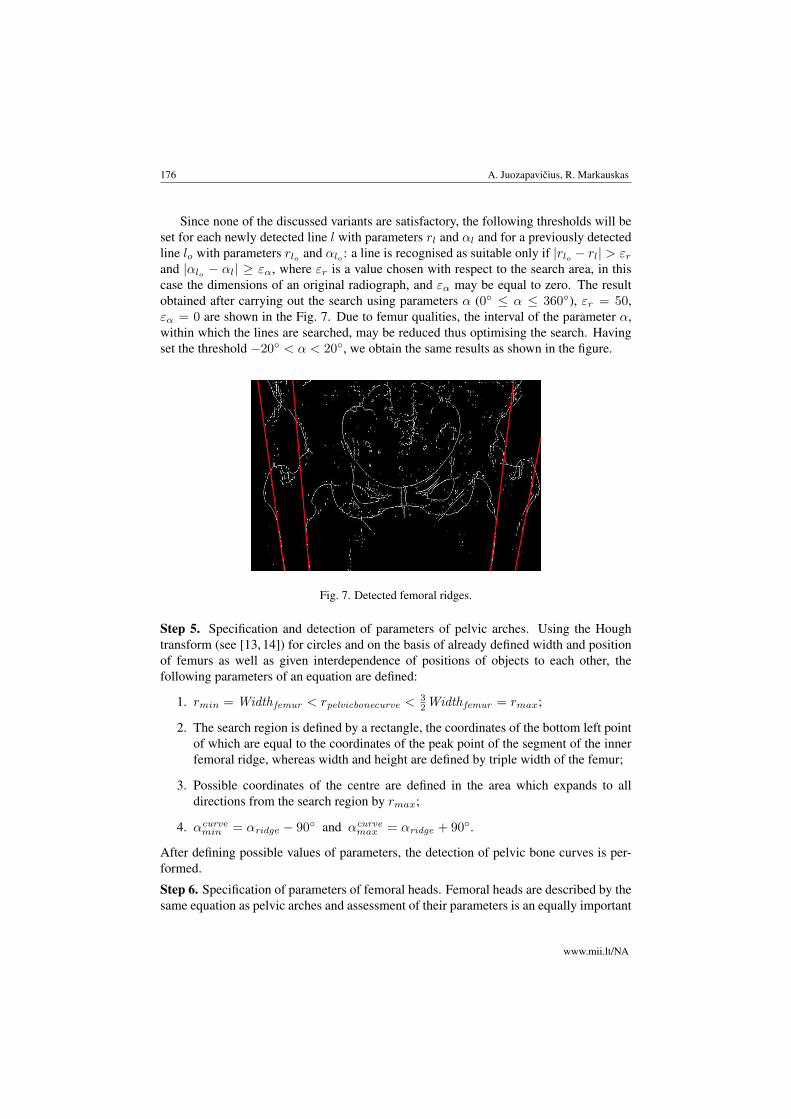
Since none of the discussed variants are satisfactory, the following thresholds will beset for each newly detected line l with parameters rl and αl and for a previously detectedline lo with parameters rlo and αlo : a line is recognised as suitable only if |rlo − rl| > εrand |αlo − αl| ≥ εα, where εr is a value chosen with respect to the search area, in thiscase the dimensions of an original radiograph, and εα may be equal to zero. The resultobtained after carrying out the search using parameters α (0◦ ≤ α ≤ 360◦), εr = 50,εα = 0 are shown in the Fig. 7. Due to femur qualities, the interval of the parameter α,within which the lines are searched, may be reduced thus optimising the search. Havingset the threshold −20◦ < α < 20◦, we obtain the same results as shown in the figure.
Fig. 7. Detected femoral ridges.
Step 5. Specification and detection of parameters of pelvic arches. Using the Houghtransform (see [13, 14]) for circles and on the basis of already defined width and positionof femurs as well as given interdependence of positions of objects to each other, thefollowing parameters of an equation are defined:
1. rmin = Widthfemur < rpelvicbonecurve <32Widthfemur = rmax;
2. The search region is defined by a rectangle, the coordinates of the bottom left pointof which are equal to the coordinates of the peak point of the segment of the innerfemoral ridge, whereas width and height are defined by triple width of the femur;
3. Possible coordinates of the centre are defined in the area which expands to alldirections from the search region by rmax;
4. αcurvemin = αridge − 90◦ and αcurve
max = αridge + 90◦.
After defining possible values of parameters, the detection of pelvic bone curves is per-formed.
Step 6. Specification of parameters of femoral heads. Femoral heads are described by thesame equation as pelvic arches and assessment of their parameters is an equally important
www.mii.lt/NA
Vectorization of human pelvis objects in X-ray images 177
task. However, as in the case described above, these parameters can be set only takinginto account data about the already detected objects, i.e. data about the femoral and pelvicarches:
1. rmin = 0, 55 ∗Widthfemur < rhead < 0, 65 ∗Widthfemur = rmax;
2. The search region is defined by a rectangle, the coordinates of the bottom left angleof which are equal to the centre of the pelvic arch, whereas width and height areequal to rmax;
3. Coordinates of a possible centre are defined in the above search region;
4. αcurvemin = 9
2 ∗αinnerridge+αouterridge
2 , αcurvemax = 9
2 ∗αinnerridge+αouterridge
2 + 190◦.
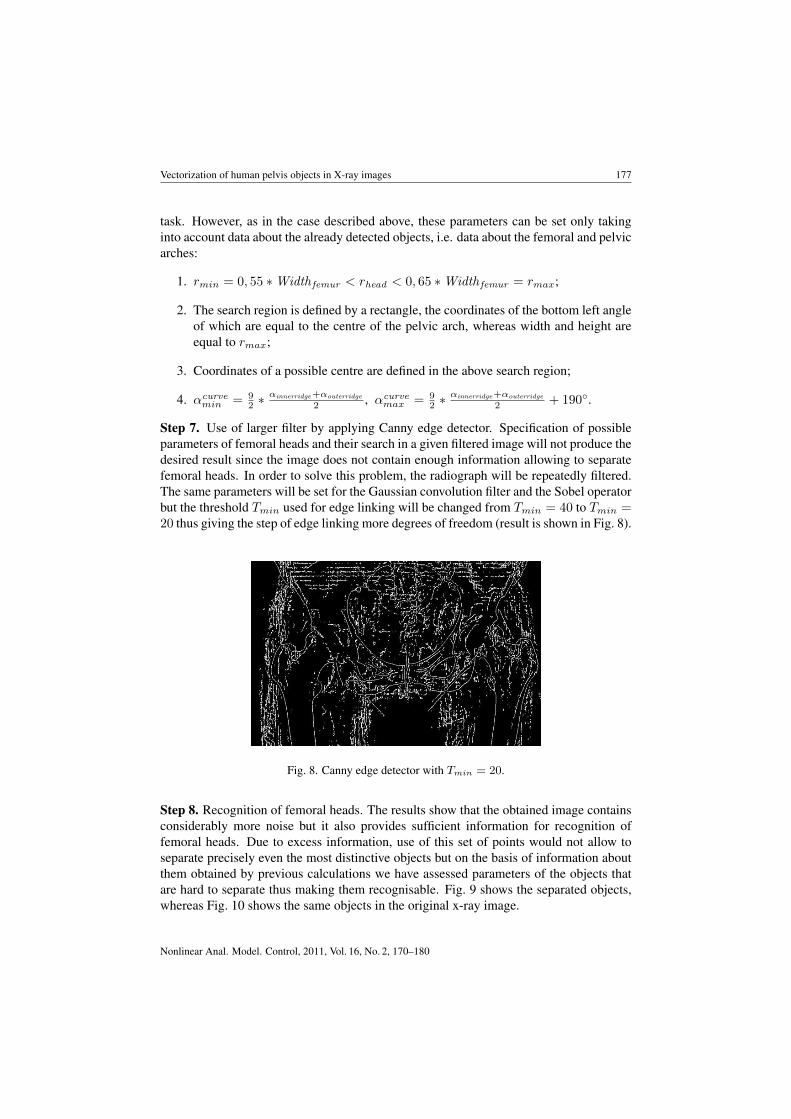
Step 7. Use of larger filter by applying Canny edge detector. Specification of possibleparameters of femoral heads and their search in a given filtered image will not produce thedesired result since the image does not contain enough information allowing to separatefemoral heads. In order to solve this problem, the radiograph will be repeatedly filtered.The same parameters will be set for the Gaussian convolution filter and the Sobel operatorbut the threshold Tmin used for edge linking will be changed from Tmin = 40 to Tmin =20 thus giving the step of edge linking more degrees of freedom (result is shown in Fig. 8).
Fig. 8. Canny edge detector with Tmin = 20.
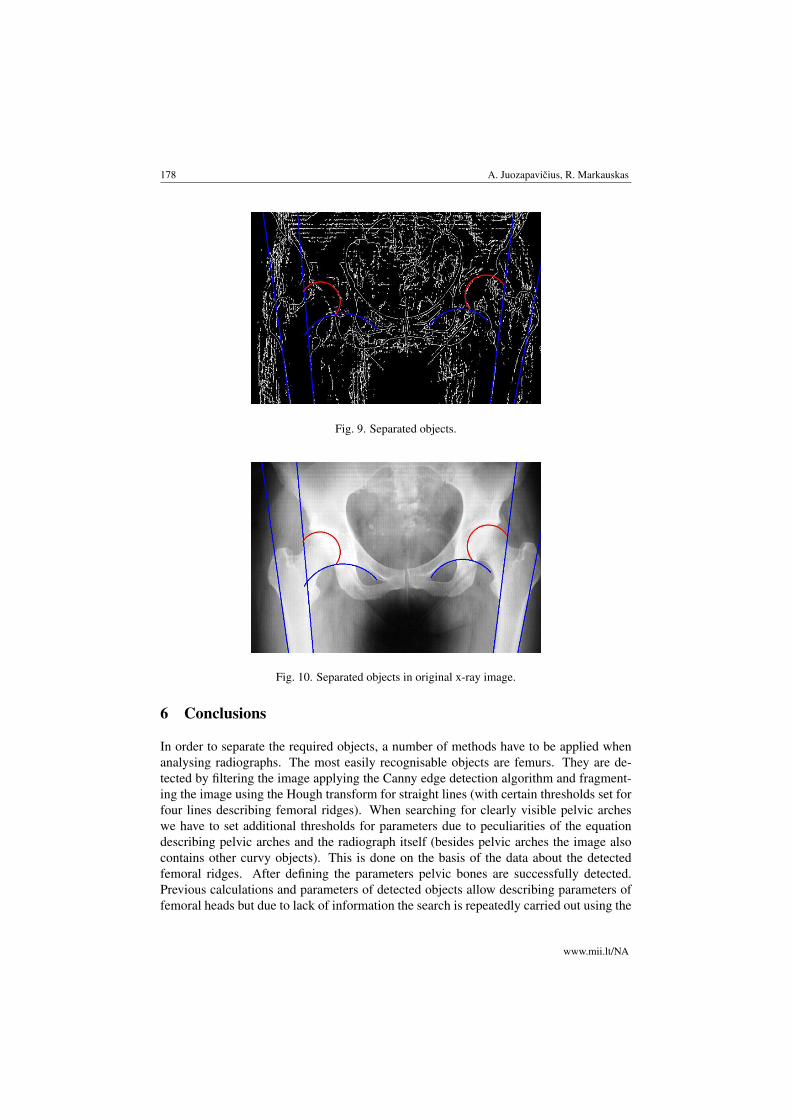
Step 8. Recognition of femoral heads. The results show that the obtained image containsconsiderably more noise but it also provides sufficient information for recognition offemoral heads. Due to excess information, use of this set of points would not allow toseparate precisely even the most distinctive objects but on the basis of information aboutthem obtained by previous calculations we have assessed parameters of the objects thatare hard to separate thus making them recognisable. Fig. 9 shows the separated objects,whereas Fig. 10 shows the same objects in the original x-ray image.
Nonlinear Anal. Model. Control, 2011, Vol. 16, No. 2, 170–180
178 A. Juozapavicius, R. Markauskas
Fig. 9. Separated objects.
Fig. 10. Separated objects in original x-ray image.
6 Conclusions
In order to separate the required objects, a number of methods have to be applied whenanalysing radiographs. The most easily recognisable objects are femurs. They are de-tected by filtering the image applying the Canny edge detection algorithm and fragment-ing the image using the Hough transform for straight lines (with certain thresholds set forfour lines describing femoral ridges). When searching for clearly visible pelvic archeswe have to set additional thresholds for parameters due to peculiarities of the equationdescribing pelvic arches and the radiograph itself (besides pelvic arches the image alsocontains other curvy objects). This is done on the basis of the data about the detectedfemoral ridges. After defining the parameters pelvic bones are successfully detected.Previous calculations and parameters of detected objects allow describing parameters offemoral heads but due to lack of information the search is repeatedly carried out using the
www.mii.lt/NA
Vectorization of human pelvis objects in X-ray images 179
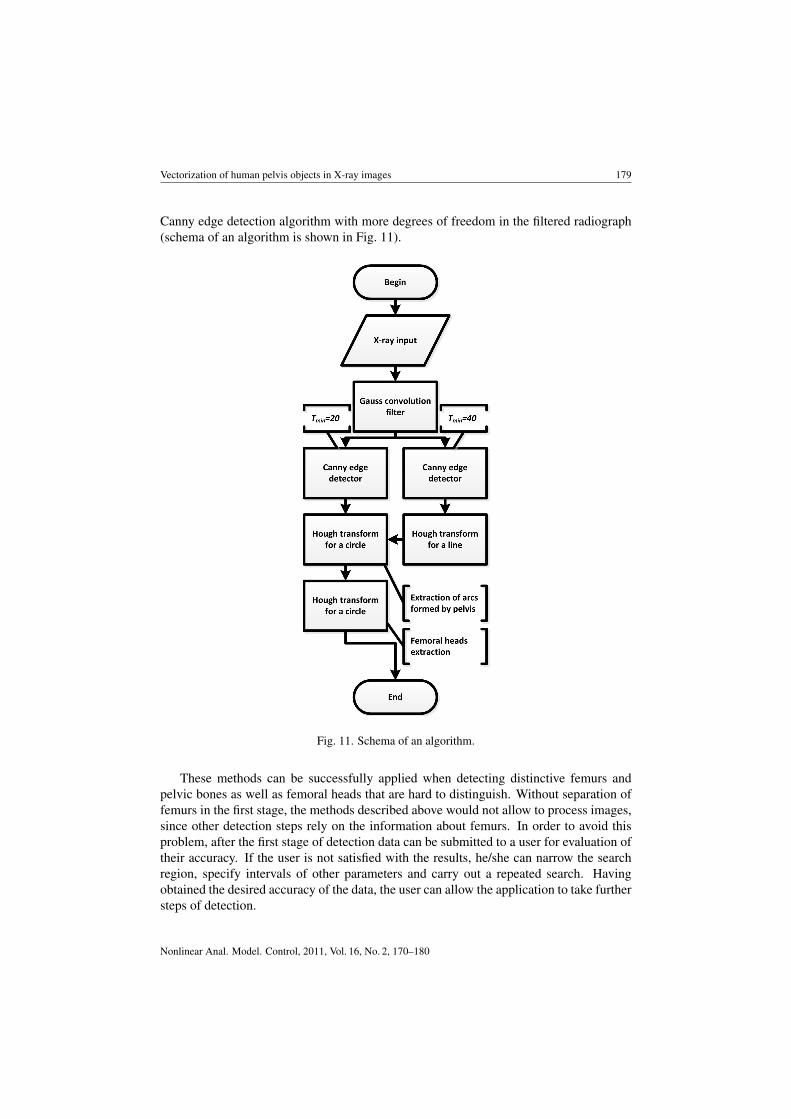
Canny edge detection algorithm with more degrees of freedom in the filtered radiograph(schema of an algorithm is shown in Fig. 11).
Fig. 11. Schema of an algorithm.
These methods can be successfully applied when detecting distinctive femurs andpelvic bones as well as femoral heads that are hard to distinguish. Without separation offemurs in the first stage, the methods described above would not allow to process images,since other detection steps rely on the information about femurs. In order to avoid thisproblem, after the first stage of detection data can be submitted to a user for evaluation oftheir accuracy. If the user is not satisfied with the results, he/she can narrow the searchregion, specify intervals of other parameters and carry out a repeated search. Havingobtained the desired accuracy of the data, the user can allow the application to take furthersteps of detection.
Nonlinear Anal. Model. Control, 2011, Vol. 16, No. 2, 170–180

180 A. Juozapavicius, R. Markauskas
7 Further research
In further stages the researcher plans to:1. Specify a set of recognisable objects and calculate/separate biomechanical param-
eters;
2. Examine the adaptability of the developed methods for diagnostics of other bodyareas which is based on the analysis of bone structures visible in x-ray images;
3. Examine the adaptability of the developed methods for diagnostics of other areaswhich is based on the visual analysis of objects in 3D images.
References
1. N. L. Frederiksen, Diagnostic imaging in dental implantology, Oral Surg. Oral Med. O., 80(5),pp. 540–554, 1995.
2. D. Manning, Evaluation of diagnostic performance in radiography, Radiography, 4(1),pp. 49–60, 1998.
3. C. J. Martin, P. F. Sharp, D. G. Sutton, Measurement of image quality in diagnostic radiology.Appl. Radiat. Isotopes, 50(1), pp. 21–38, 1999.
4. N. Porvaneckas, Total Hip Arthroplasty, Vilnius Univ. Press, Vilnius, 2008 (in Lithuanian).
5. M. D. Sewell, K. Rosendahl, D. M. Eastwood, Developmental dysplasia of the hip, Brit.Med. J., 339(7732), pp. 1242–1248, 2009.
6. P. Suetens, E. Bellon, D. Vandermeulen, M. Smet, G. Marchal, J. Nuyts, L. Mortelmans, Imagesegmentation: methods and applications in diagnostic radiology and nuclear medicine, Eur. J.Radiol., 17(1), pp. 14–21, 1993.
7. N. Porvaneckas, G. Kvederas. Hip biomechanics assessment before and after replacementsurgery. Medicina, 35, pp. 1212–1220, 1999 (in Lithuanian).
8. L. Ding, A. Goshtasby, On the canny edge detector, Pattern Recognition, 34(3), pp. 721–725,2001.
9. M. A. Fischler, O. Firchein, Readings in Computer Vision: Issues, Problems, Principles, andParadigms, Morgan Kaufmann Publishers Inc., 1987.
10. M. Heath, S. Sarkar, T. Sanocki, K. Bowyer, Comparison of edge detectors: a methodologyand initial study, Comput. Vis. Image Und., 69(1), pp. 38–54, 1998.
11. M. Sharifi, M. Fathy, M. Mahmoudi, A classified and comparative study of edge detectionalgorithms, in: Proceedings of the International Conference on Information Technology:Coding and Computing, IEEE Computer Society Washington, DC, USA, pp. 117–120, 2002.
12. R. Wang, Canny Edge Detection, 2004.
13. D. Ballard, Generalizing the hough transform to detect arbitrary shapes, Pattern Recognition,13(2), pp. 111–122, 1981.
14. J. Illingworth, J. Kittler, A survey of the hough transform, Computer Vision, Graphics, andImage Processing, 44(1), pp. 87–116, 1988.
www.mii.lt/NA