Embed Size (px)
Citation preview
Michigan Rotational Survey
Vegetable Inventory 2005-06
USDA, NASS, MichiganField Office
MichiganDepartment ofAgriculture

Michigan Rotational Survey Vegetable Inventory 2005-2006 USDA, NASS, Michigan Field Office David D. Kleweno – Director Vince Matthews – Deputy Director
Issued cooperatively by: United States Department of Agriculture Michigan Department of Agriculture National Agricultural Statistics Service Executive Office Ron Bosecker, Administrator Mitch Irwin, Director

Office Telephone EnumeratorsFlo Hill, Day SupervisorVena Hutton, Night SupervisorCarol CatlowDiane ClarkOlive GoedertCarol GriffithsLucy Hunley
Debra JonesJill LeachVirginia LudlowRyan McIntyreMike McManusNeva MillerJane Mosier
Linda NewcombRaefield PerteetDebra RichardsonJoAnn RobertsPaula ScottDelores TaborNorma Wilde
North Michigan and Upper PeninsulaHerb Hemmes, Supervisor, Harbor SpringsCathy Collins, Traverse CityJim Cranick, Harbor SpringsJames Gray, Traverse CityGordon McDonald, MunisingBob Venable, LuzerneKitty Venable, Luzerne
Field Enumerators
National Association of State Departments of Agriculture (NASDA) enumerators collectdata for the USDA, NASS, Michigan Field Office. NASDA workers who gatheredinformation for this publication were:
Office StaffMarian BakerDenise Bowman Sam BrunerChad Cloos
Esmerelda DicksonNathan EliasJohn GibbonsChris Gottschall
Diane HutchinsLisa JonesGene KenyonDan Ledbury
Trudy LeitzNicole NorrisJulie PalmerRenee Raboin
Marty SaffellJoe SamsonLynn Spisak
Telephone: (517) 324-5300Fax: (517) 324-5299
E-mail: [email protected]: www.nass.usda.gov
USDA, NASS, Michigan Field Office P.O. Box 26248Lansing, Michigan 48909-6248
East Central MichiganMona Kaczuk, Supervisor, Bad AxeM. Keith Corlew, FlintDiane McPhee, KindeJim Sparks, Fenton
West Central MichiganCarl DeKleine, Supervisor, Grand HavenDoris Bastian, Grand HavenBabette Burmeister, ShelbyByron Carpenter, Grand HavenBill Dukes, ShelbyKathy Smith, WaylandBeverly Vincent, Grand Haven
Southwest MichiganCindra Mikel, Supervisor, CassopolisSandy Dorer, QuincySteve Lamberton, NilesBruce Landis, HomerJoyce Landis, HomerBob Larsen, ColomaKathleen Little, NilesRosie Nimtz, Eau ClaireDon Trull, Buchanan
Central MichiganKen Kralik, Supervisor, RiverdaleLeah Billiau, AlmaPat Bitler, HerseyRon Feher, Sr., LansingPeter Nellis, Rodney
Southeast MichiganRachel Bakowski, Supervisor, Ottawa LakeKeith Brown, JonesvilleGlenn Diesing, PetersburgDeann Falkenberg, MaybeeSue Parisi, RayRex Smith, Waldron
Contents
General Information ...............................................................................................................1 Asparagus ...............................................................................................................................6 Beans, Snap ............................................................................................................................8 Cabbage ..................................................................................................................................9 Cantaloups ..............................................................................................................................9 Carrots ....................................................................................................................................9 Celery ...................................................................................................................................12 Corn, sweet ...........................................................................................................................13 Cucumbers............................................................................................................................14 Mint ......................................................................................................................................15 Onions, dry ...........................................................................................................................15 Peas, green............................................................................................................................16 Peppers, bell .........................................................................................................................17 Peppers, other .......................................................................................................................18 Potatoes ................................................................................................................................19 Pumpkins ..............................................................................................................................21 Squash, summer....................................................................................................................22 Squash, winter ......................................................................................................................22 Tomatoes ..............................................................................................................................23 Survey methods ....................................................................................................................25 Questionnaire........................................................................................................................27
Graphs and Maps
Top Vegetable Counties .........................................................................................................3 Top Vegetable Counties (excluding potatoes)........................................................................3 Asparagus by Variety/Hybrid.................................................................................................6 Fresh Market Vegetables Harvested, 2005...........................................................................10 Fresh Market Vegetables Harvested by Size of Farm ..........................................................10 Fresh Market Vegetables......................................................................................................11 Processing Vegetables Harvested, 2005...............................................................................16 Processing Vegetables Harvested by Size of Farm ..............................................................16 Processing Vegetables ..........................................................................................................20
1
3 2
4 5 6
7 8 9
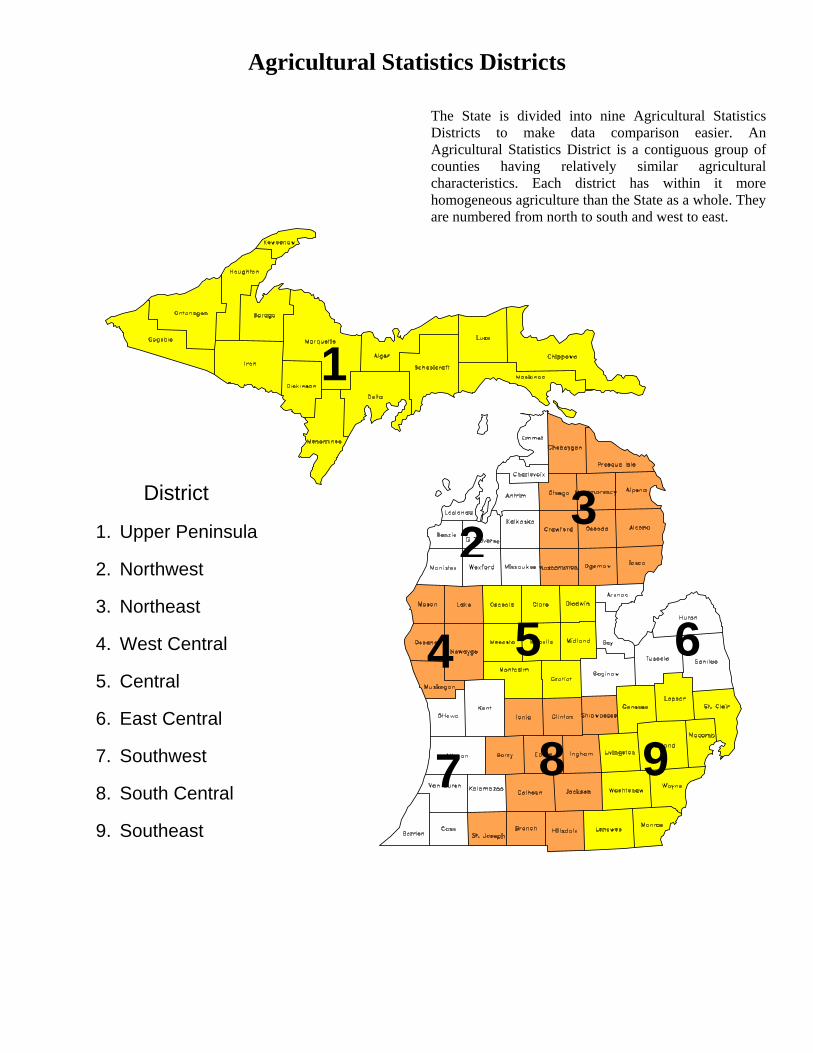
Agricultural Statistics Districts
The State is divided into nine Agricultural Statistics Districts to make data comparison easier. An Agricultural Statistics District is a contiguous group of counties having relatively similar agricultural characteristics. Each district has within it more homogeneous agriculture than the State as a whole. They are numbered from north to south and west to east.
District
1. Upper Peninsula
2. Northwest
3. Northeast
4. West Central
5. Central
6. East Central
7. Southwest
8. South Central
9. Southeast
MICHIGAN VEGETABLE INVENTORY 2005-2006 1
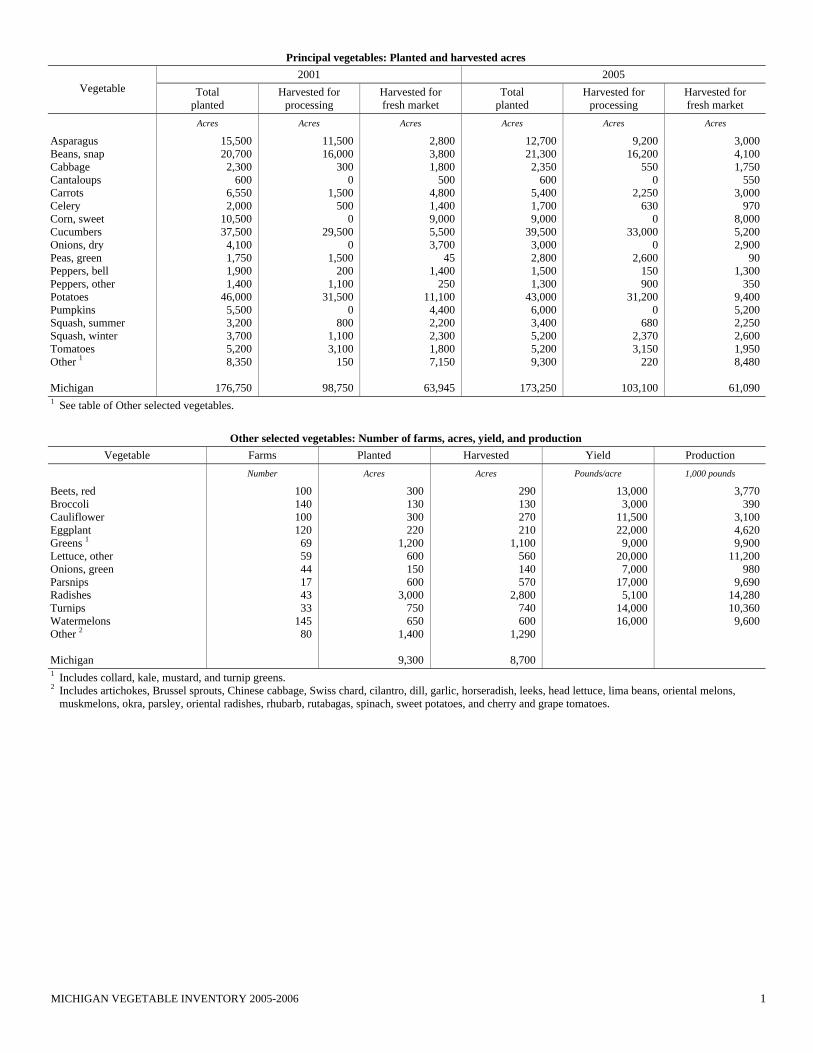
Principal vegetables: Planted and harvested acres 2001 2005
Vegetable Total planted
Harvested for processing
Harvested for fresh market
Total planted
Harvested for processing
Harvested for fresh market
Acres Acres Acres Acres Acres Acres
Asparagus Beans, snap Cabbage Cantaloups Carrots Celery Corn, sweet Cucumbers Onions, dry Peas, green Peppers, bell Peppers, other Potatoes Pumpkins Squash, summer Squash, winter Tomatoes Other 1 Michigan
15,500 20,700 2,300
600 6,550 2,000
10,500 37,500 4,100 1,750 1,900 1,400
46,000 5,500 3,200 3,700 5,200 8,350
176,750
11,500 16,000
300 0
1,500 500
0 29,500
0 1,500
200 1,100
31,500 0
800 1,100 3,100
150
98,750
2,800 3,800 1,800
500 4,800 1,400 9,000 5,500 3,700
45 1,400
250 11,100
4,400 2,200 2,300 1,800 7,150
63,945
12,700 21,300
2,350 600
5,400 1,700 9,000
39,500 3,000 2,800 1,500 1,300
43,000 6,000 3,400 5,200 5,200 9,300
173,250
9,200 16,200
550 0
2,250 630
0 33,000
0 2,600
150 900
31,200 0
680 2,370 3,150
220
103,100
3,000 4,100 1,750
550 3,000
970 8,000 5,200 2,900
90 1,300
350 9,400 5,200 2,250 2,600 1,950 8,480
61,090
1 See table of Other selected vegetables.
Other selected vegetables: Number of farms, acres, yield, and production Vegetable Farms Planted Harvested Yield Production
Number Acres Acres Pounds/acre 1,000 pounds
Beets, red Broccoli Cauliflower Eggplant Greens 1 Lettuce, other Onions, green Parsnips Radishes Turnips Watermelons Other 2 Michigan
100 140 100 120 69 59 44 17 43 33
145 80
300 130 300 220
1,200 600 150 600
3,000 750 650
1,400
9,300
290 130 270 210
1,100 560 140 570
2,800 740 600
1,290
8,700
13,000 3,000
11,500 22,000
9,000 20,000
7,000 17,000
5,100 14,000 16,000
3,770 390
3,100 4,620 9,900
11,200 980
9,690 14,280 10,360
9,600
1 Includes collard, kale, mustard, and turnip greens. 2 Includes artichokes, Brussel sprouts, Chinese cabbage, Swiss chard, cilantro, dill, garlic, horseradish, leeks, head lettuce, lima beans, oriental melons,
muskmelons, okra, parsley, oriental radishes, rhubarb, rutabagas, spinach, sweet potatoes, and cherry and grape tomatoes.
2 MICHIGAN VEGETABLE INVENTORY 2005-2006
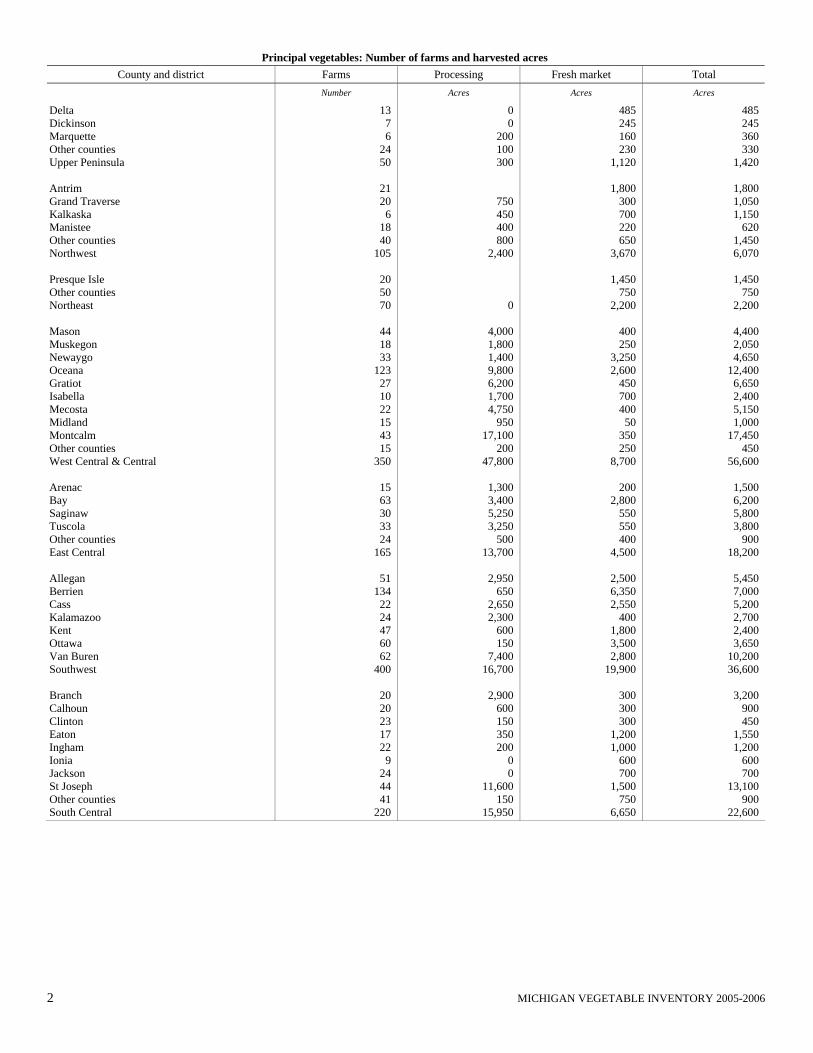
Principal vegetables: Number of farms and harvested acres County and district Farms Processing Fresh market Total
Number Acres Acres Acres
Delta Dickinson Marquette Other counties Upper Peninsula Antrim Grand Traverse Kalkaska Manistee Other counties Northwest Presque Isle Other counties Northeast Mason Muskegon Newaygo Oceana Gratiot Isabella Mecosta Midland Montcalm Other counties West Central & Central Arenac Bay Saginaw Tuscola Other counties East Central Allegan Berrien Cass Kalamazoo Kent Ottawa Van Buren Southwest Branch Calhoun Clinton Eaton Ingham Ionia Jackson St Joseph Other counties South Central
13 7 6
24 50
21 20
6 18 40
105
20 50 70
44 18 33
123 27 10 22 15 43 15
350
15 63 30 33 24
165
51 134
22 24 47 60 62
400
20 20 23 17 22
9 24 44 41
220
0 0
200 100 300
750 450 400 800
2,400
0
4,000 1,800 1,400 9,800 6,200 1,700 4,750
950 17,100
200 47,800
1,300 3,400 5,250 3,250
500 13,700
2,950
650 2,650 2,300
600 150
7,400 16,700
2,900
600 150 350 200
0 0
11,600 150
15,950
485 245 160 230
1,120
1,800 300 700 220 650
3,670
1,450 750
2,200
400 250
3,250 2,600
450 700 400
50 350 250
8,700
200 2,800
550 550 400
4,500
2,500 6,350 2,550
400 1,800 3,500 2,800
19,900
300 300 300
1,200 1,000
600 700
1,500 750
6,650
485 245 360 330
1,420
1,800 1,050 1,150
620 1,450 6,070
1,450
750 2,200
4,400 2,050 4,650
12,400 6,650 2,400 5,150 1,000
17,450 450
56,600
1,500 6,200 5,800 3,800
900 18,200
5,450 7,000 5,200 2,700 2,400 3,650
10,200 36,600
3,200
900 450
1,550 1,200
600 700
13,100 900
22,600
MICHIGAN VEGETABLE INVENTORY 2005-2006 3
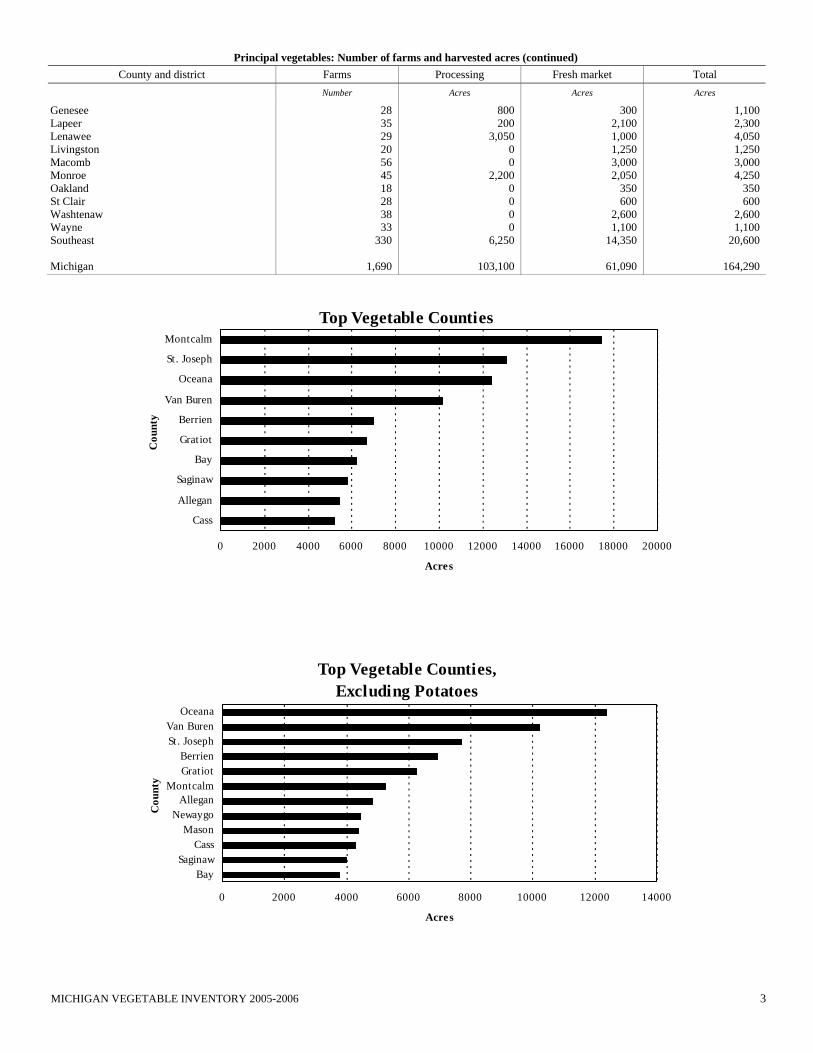
Principal vegetables: Number of farms and harvested acres (continued) County and district Farms Processing Fresh market Total
Number Acres Acres Acres
Genesee Lapeer Lenawee Livingston Macomb Monroe Oakland St Clair Washtenaw Wayne Southeast Michigan
28 35 29 20 56 45 18 28 38 33
330
1,690
800 200
3,050 0 0
2,200 0 0 0 0
6,250
103,100
300 2,100 1,000 1,250 3,000 2,050
350 600
2,600 1,100
14,350
61,090
1,100 2,300 4,050 1,250 3,000 4,250
350 600
2,600 1,100
20,600
164,290
Top Vegetable Counties
0 2000 4000 6000 8000 10000 12000 14000 16000 18000 20000
Cass
Allegan
Saginaw
Bay
Gratiot
Berrien
Van Buren
Oceana
St. Joseph
Montcalm
Cou
nty
Acres
Top Vegetable Counties,Excluding Potatoes
0 2000 4000 6000 8000 10000 12000 14000
BaySaginaw
CassMason
NewaygoAllegan
MontcalmGratiotBerrien
St. JosephVan Buren
Oceana
Cou
nty
Acres
4 MICHIGAN VEGETABLE INVENTORY 2005-2006
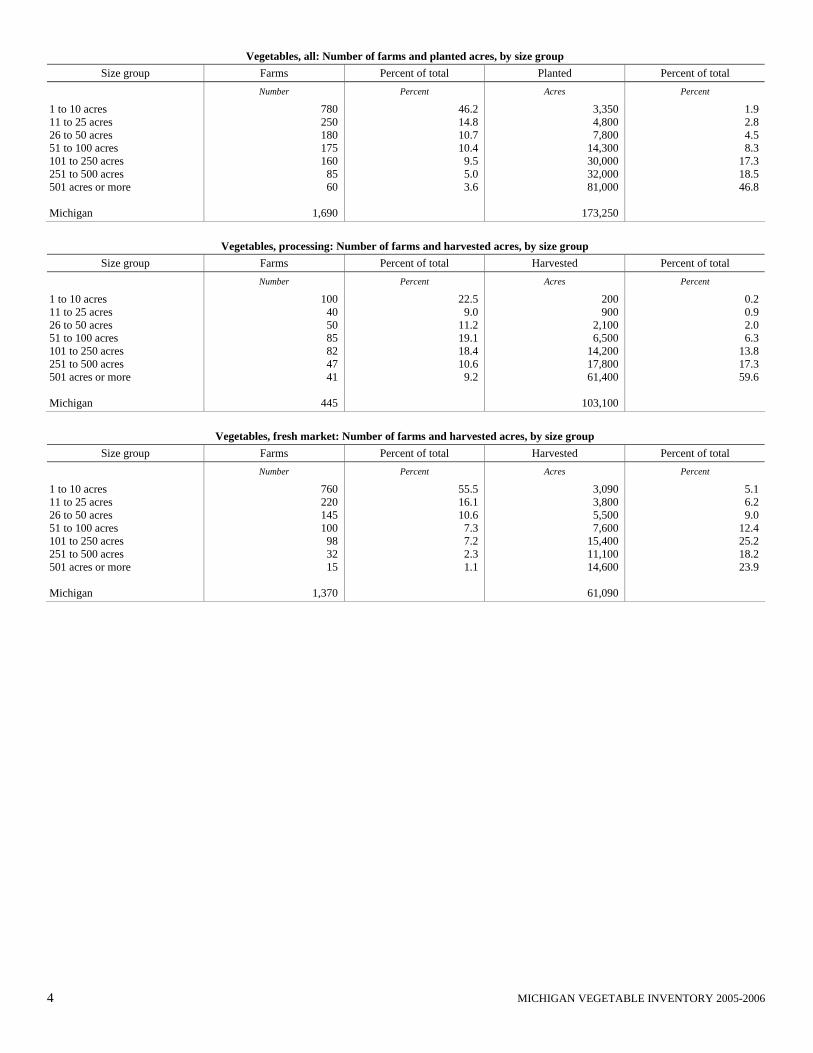
Vegetables, all: Number of farms and planted acres, by size group Size group Farms Percent of total Planted Percent of total
Number Percent Acres Percent
1 to 10 acres 11 to 25 acres 26 to 50 acres 51 to 100 acres 101 to 250 acres 251 to 500 acres 501 acres or more Michigan
780 250 180 175 160 85 60
1,690
46.2 14.8 10.7 10.4
9.5 5.0 3.6
3,350 4,800 7,800
14,300 30,000 32,000 81,000
173,250
1.9 2.8 4.5 8.3
17.3 18.5 46.8
Vegetables, processing: Number of farms and harvested acres, by size group
Size group Farms Percent of total Harvested Percent of total
Number Percent Acres Percent
1 to 10 acres 11 to 25 acres 26 to 50 acres 51 to 100 acres 101 to 250 acres 251 to 500 acres 501 acres or more Michigan
100 40 50 85 82 47 41
445
22.5 9.0
11.2 19.1 18.4 10.6
9.2
200 900
2,100 6,500
14,200 17,800 61,400
103,100
0.2 0.9 2.0 6.3
13.8 17.3 59.6
Vegetables, fresh market: Number of farms and harvested acres, by size group
Size group Farms Percent of total Harvested Percent of total
Number Percent Acres Percent
1 to 10 acres 11 to 25 acres 26 to 50 acres 51 to 100 acres 101 to 250 acres 251 to 500 acres 501 acres or more Michigan
760 220 145 100 98 32 15
1,370
55.5 16.1 10.6
7.3 7.2 2.3 1.1
3,090 3,800 5,500 7,600
15,400 11,100 14,600
61,090
5.1 6.2 9.0
12.4 25.2 18.2 23.9
MICHIGAN VEGETABLE INVENTORY 2005-2006 5
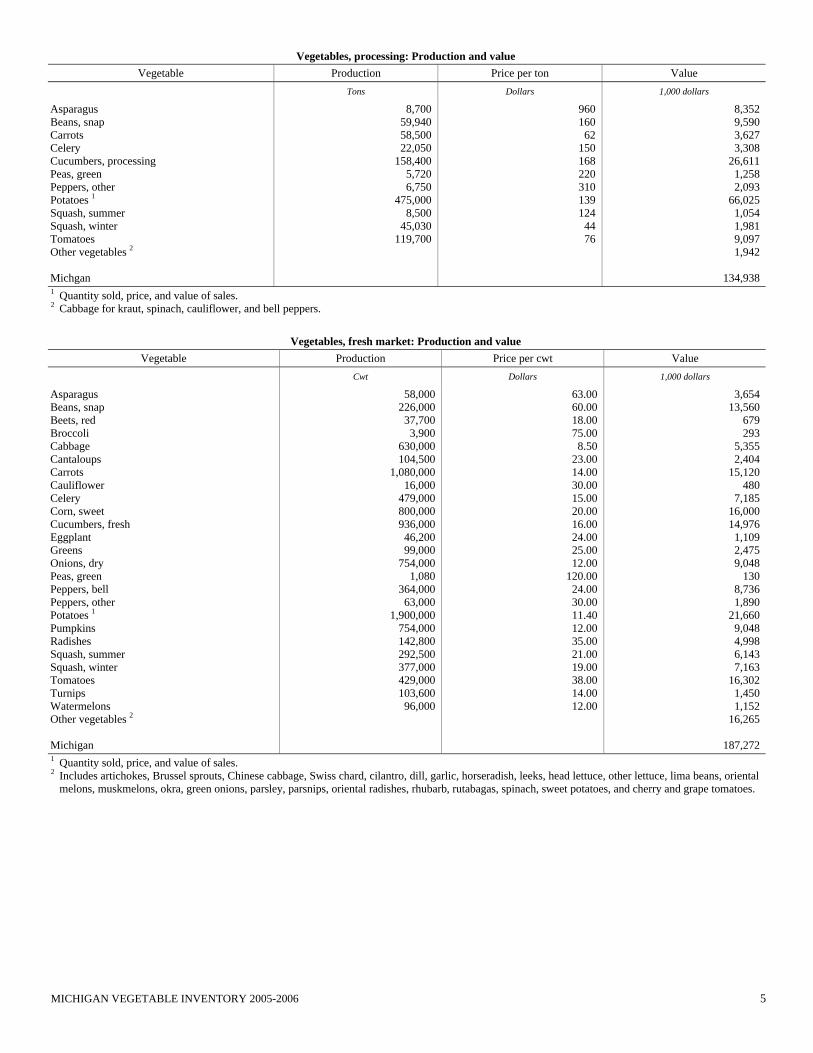
Vegetables, processing: Production and value Vegetable Production Price per ton Value
Tons Dollars 1,000 dollars
Asparagus Beans, snap Carrots Celery Cucumbers, processing Peas, green Peppers, other Potatoes 1 Squash, summer Squash, winter Tomatoes Other vegetables 2 Michgan
8,700 59,940 58,500 22,050
158,400 5,720 6,750
475,000 8,500
45,030 119,700
960 160
62 150 168 220 310 139 124
44 76
8,352 9,590 3,627 3,308
26,611 1,258 2,093
66,025 1,054 1,981 9,097 1,942
134,938
1 Quantity sold, price, and value of sales. 2 Cabbage for kraut, spinach, cauliflower, and bell peppers.
Vegetables, fresh market: Production and value Vegetable Production Price per cwt Value
Cwt Dollars 1,000 dollars
Asparagus Beans, snap Beets, red Broccoli Cabbage Cantaloups Carrots Cauliflower Celery Corn, sweet Cucumbers, fresh Eggplant Greens Onions, dry Peas, green Peppers, bell Peppers, other Potatoes 1 Pumpkins Radishes Squash, summer Squash, winter Tomatoes Turnips Watermelons Other vegetables 2 Michigan
58,000 226,000 37,700
3,900 630,000 104,500
1,080,000 16,000
479,000 800,000 936,000 46,200 99,000
754,000 1,080
364,000 63,000
1,900,000 754,000 142,800 292,500 377,000 429,000 103,600 96,000
63.00 60.00 18.00 75.00
8.50 23.00 14.00 30.00 15.00 20.00 16.00 24.00 25.00 12.00
120.00 24.00 30.00 11.40 12.00 35.00 21.00 19.00 38.00 14.00 12.00
3,654 13,560
679 293
5,355 2,404
15,120 480
7,185 16,000 14,976
1,109 2,475 9,048
130 8,736 1,890
21,660 9,048 4,998 6,143 7,163
16,302 1,450 1,152
16,265
187,272 1 Quantity sold, price, and value of sales. 2 Includes artichokes, Brussel sprouts, Chinese cabbage, Swiss chard, cilantro, dill, garlic, horseradish, leeks, head lettuce, other lettuce, lima beans, oriental
melons, muskmelons, okra, green onions, parsley, parsnips, oriental radishes, rhubarb, rutabagas, spinach, sweet potatoes, and cherry and grape tomatoes.
6 MICHIGAN VEGETABLE INVENTORY 2005-2006
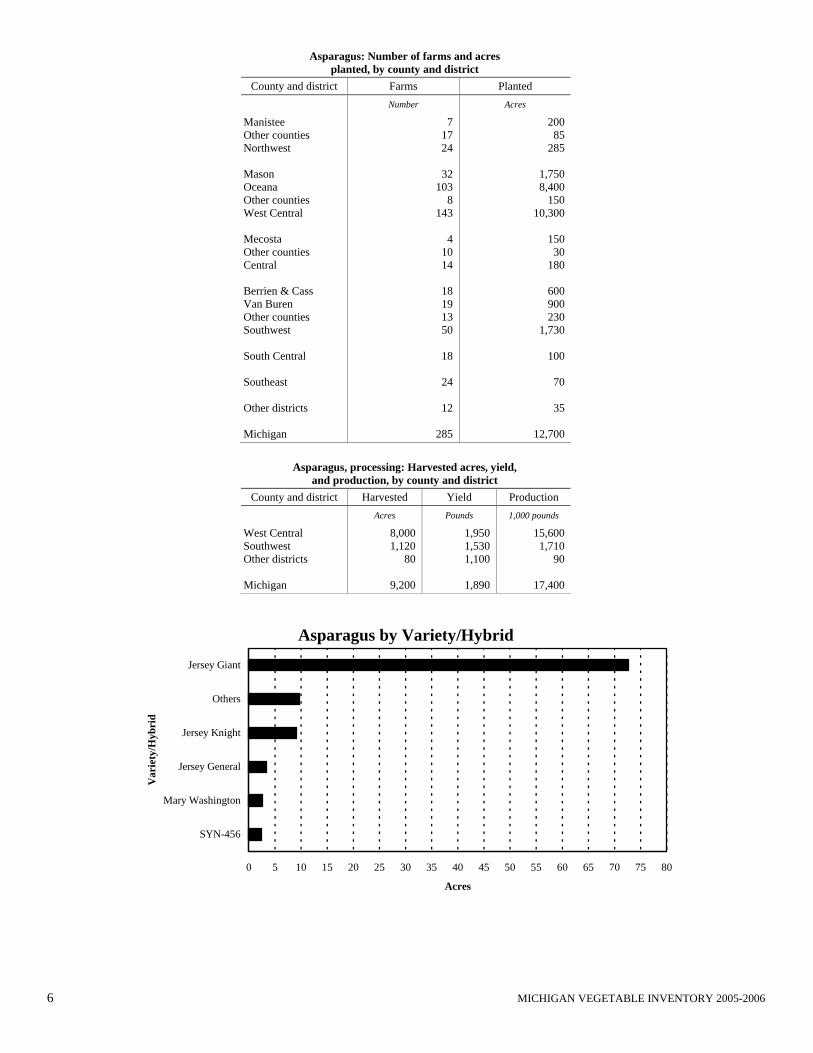
Asparagus: Number of farms and acres planted, by county and district
County and district Farms Planted
Number Acres
Manistee Other counties Northwest Mason Oceana Other counties West Central Mecosta Other counties Central Berrien & Cass Van Buren Other counties Southwest South Central Southeast Other districts Michigan
7 17 24
32
103 8
143
4 10 14
18 19 13 50
18
24
12
285
200 85
285
1,750 8,400
150 10,300
150
30 180
600 900 230
1,730
100
70
35
12,700
Asparagus, processing: Harvested acres, yield, and production, by county and district
County and district Harvested Yield Production
Acres Pounds 1,000 pounds
West Central Southwest Other districts Michigan
8,000 1,120
80
9,200
1,950 1,530 1,100
1,890
15,600 1,710
90
17,400
Asparagus by Variety/Hybrid
0 5 10 15 20 25 30 35 40 45 50 55 60 65 70 75 80
SYN-456
Mary Washington
Jersey General
Jersey Knight
Others
Jersey Giant
Var
iety
/Hyb
rid
Acres
MICHIGAN VEGETABLE INVENTORY 2005-2006 7
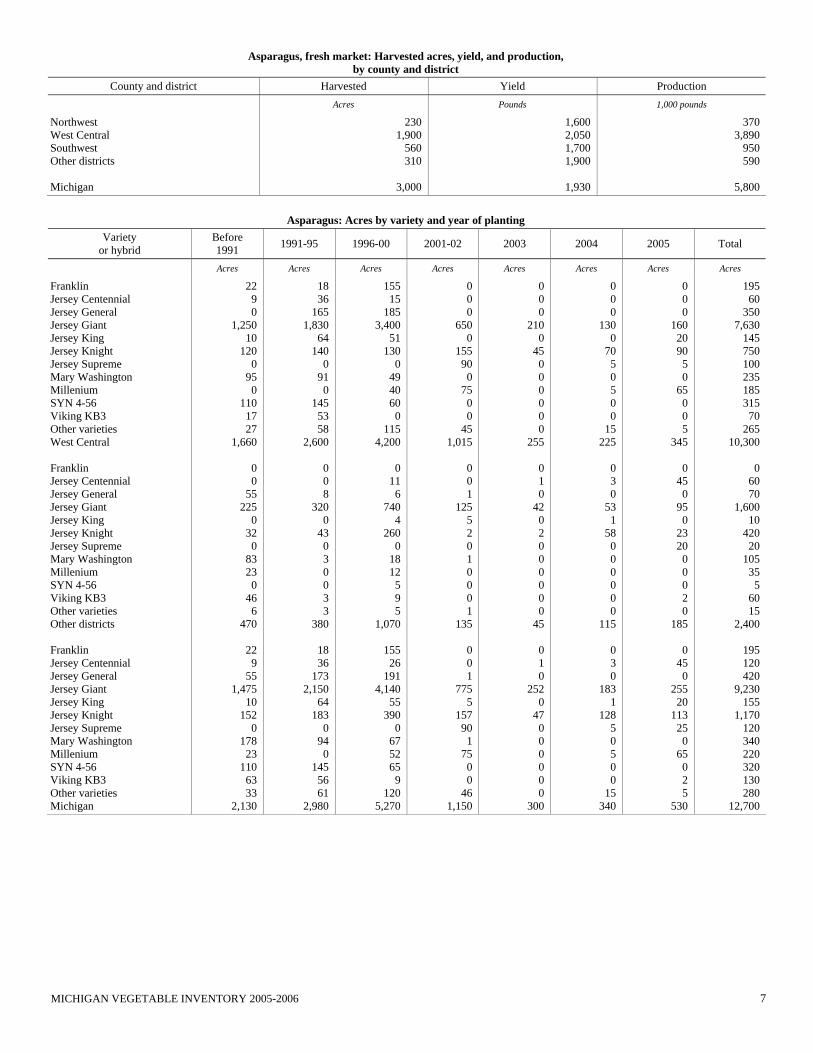
Asparagus, fresh market: Harvested acres, yield, and production, by county and district
County and district Harvested Yield Production
Acres Pounds 1,000 pounds
Northwest West Central Southwest Other districts Michigan
230 1,900
560 310
3,000
1,600 2,050 1,700 1,900
1,930
370 3,890
950 590
5,800
Asparagus: Acres by variety and year of planting
Variety or hybrid
Before 1991 1991-95 1996-00 2001-02 2003 2004 2005 Total
Acres Acres Acres Acres Acres Acres Acres Acres
Franklin Jersey Centennial Jersey General Jersey Giant Jersey King Jersey Knight Jersey Supreme Mary Washington Millenium SYN 4-56 Viking KB3 Other varieties West Central Franklin Jersey Centennial Jersey General Jersey Giant Jersey King Jersey Knight Jersey Supreme Mary Washington Millenium SYN 4-56 Viking KB3 Other varieties Other districts Franklin Jersey Centennial Jersey General Jersey Giant Jersey King Jersey Knight Jersey Supreme Mary Washington Millenium SYN 4-56 Viking KB3 Other varieties Michigan
22 9 0
1,250 10
120 0
95 0
110 17 27
1,660
0 0
55 225
0 32 0
83 23 0
46 6
470
22 9
55 1,475
10 152
0 178 23
110 63 33
2,130
18 36
165 1,830
64 140
0 91 0
145 53 58
2,600
0 0 8
320 0
43 0 3 0 0 3 3
380
18 36
173 2,150
64 183
0 94 0
145 56 61
2,980
155 15
185 3,400
51 130
0 49 40 60
0 115
4,200
0 11
6 740
4 260
0 18 12
5 9 5
1,070
155 26
191 4,140
55 390
0 67 52 65
9 120
5,270
0 0 0
650 0
155 90
0 75
0 0
45 1,015
0 0 1
125 5 2 0 1 0 0 0 1
135
0 0 1
775 5
157 90
1 75
0 0
46 1,150
0 0 0
210 0
45 0 0 0 0 0 0
255
0 1 0
42 0 2 0 0 0 0 0 0
45
0 1 0
252 0
47 0 0 0 0 0 0
300
0 0 0
130 0
70 5 0 5 0 0
15 225
0 3 0
53 1
58 0 0 0 0 0 0
115
0 3 0
183 1
128 5 0 5 0 0
15 340
0 0 0
160 20 90 5 0
65 0 0 5
345
0 45
0 95
0 23 20
0 0 0 2 0
185
0 45
0 255
20 113
25 0
65 0 2 5
530
195 60
350 7,630
145 750 100 235 185 315
70 265
10,300
0 60 70
1,600 10
420 20
105 35
5 60 15
2,400
195 120 420
9,230 155
1,170 120 340 220 320 130 280
12,700
8 MICHIGAN VEGETABLE INVENTORY 2005-2006
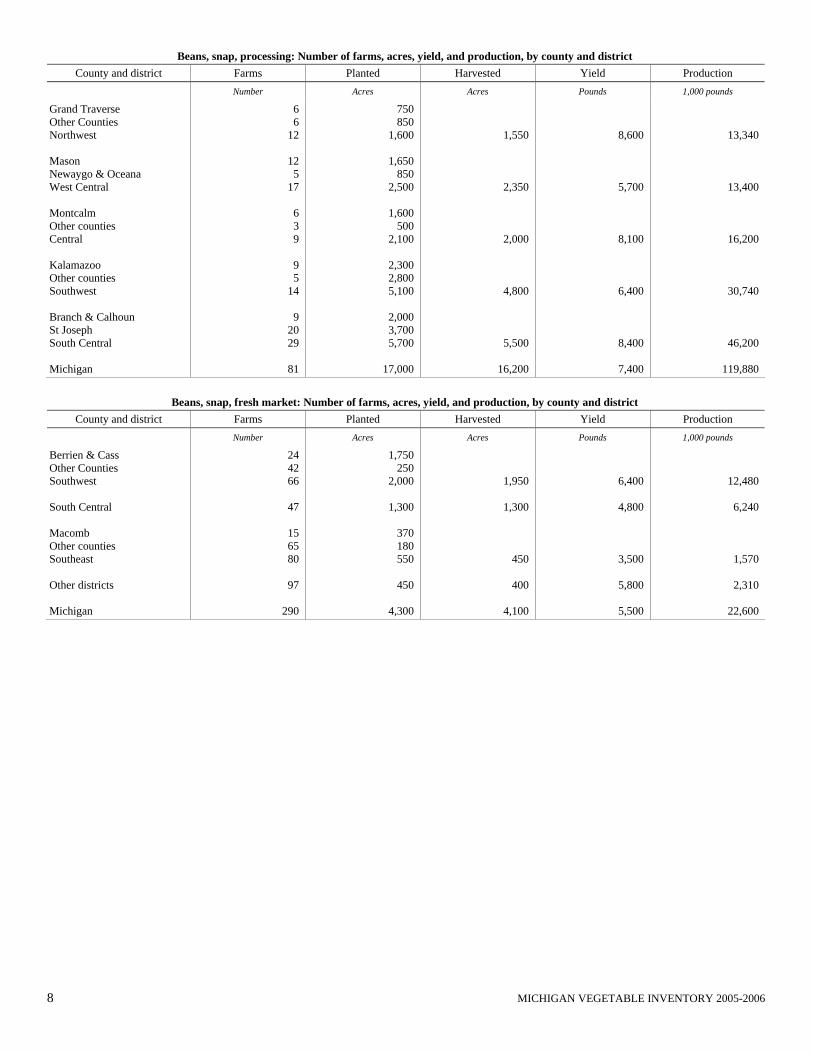
Beans, snap, processing: Number of farms, acres, yield, and production, by county and district County and district Farms Planted Harvested Yield Production
Number Acres Acres Pounds 1,000 pounds
Grand Traverse Other Counties Northwest Mason Newaygo & Oceana West Central Montcalm Other counties Central Kalamazoo Other counties Southwest Branch & Calhoun St Joseph South Central Michigan
6 6
12
12 5
17
6 3 9
9 5
14
9 20 29
81
750 850
1,600
1,650 850
2,500
1,600 500
2,100
2,300 2,800 5,100
2,000 3,700 5,700
17,000
1,550
2,350
2,000
4,800
5,500
16,200
8,600
5,700
8,100
6,400
8,400
7,400
13,340
13,400
16,200
30,740
46,200
119,880
Beans, snap, fresh market: Number of farms, acres, yield, and production, by county and district County and district Farms Planted Harvested Yield Production
Number Acres Acres Pounds 1,000 pounds
Berrien & Cass Other Counties Southwest South Central Macomb Other counties Southeast Other districts Michigan
24 42 66
47
15 65 80
97
290
1,750 250
2,000
1,300
370 180 550
450
4,300
1,950
1,300
450
400
4,100
6,400
4,800
3,500
5,800
5,500
12,480
6,240
1,570
2,310
22,600
MICHIGAN VEGETABLE INVENTORY 2005-2006 9
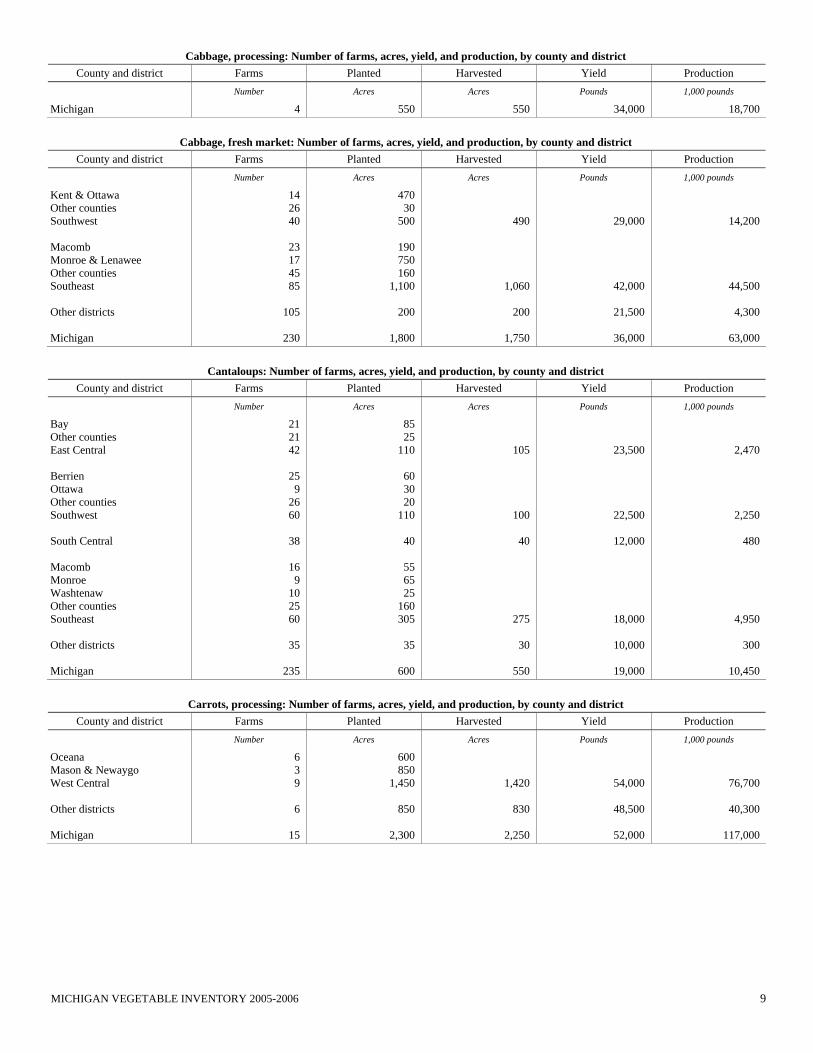
Cabbage, processing: Number of farms, acres, yield, and production, by county and district County and district Farms Planted Harvested Yield Production
Number Acres Acres Pounds 1,000 pounds
Michigan 4 550 550 34,000 18,700
Cabbage, fresh market: Number of farms, acres, yield, and production, by county and district County and district Farms Planted Harvested Yield Production
Number Acres Acres Pounds 1,000 pounds
Kent & Ottawa Other counties Southwest Macomb Monroe & Lenawee Other counties Southeast Other districts Michigan
14 26 40
23 17 45 85
105
230
470 30
500
190 750 160
1,100
200
1,800
490
1,060
200
1,750
29,000
42,000
21,500
36,000
14,200
44,500
4,300
63,000
Cantaloups: Number of farms, acres, yield, and production, by county and district County and district Farms Planted Harvested Yield Production
Number Acres Acres Pounds 1,000 pounds
Bay Other counties East Central Berrien Ottawa Other counties Southwest South Central Macomb Monroe Washtenaw Other counties Southeast Other districts Michigan
21 21 42
25 9
26 60
38
16 9
10 25 60
35
235
85 25
110
60 30 20
110
40
55 65 25
160 305
35
600
105
100
40
275
30
550
23,500
22,500
12,000
18,000
10,000
19,000
2,470
2,250
480
4,950
300
10,450
Carrots, processing: Number of farms, acres, yield, and production, by county and district County and district Farms Planted Harvested Yield Production
Number Acres Acres Pounds 1,000 pounds
Oceana Mason & Newaygo West Central Other districts Michigan
6 3 9
6
15
600 850
1,450
850
2,300
1,420
830
2,250
54,000
48,500
52,000
76,700
40,300
117,000
10 MICHIGAN VEGETABLE INVENTORY 2005-2006
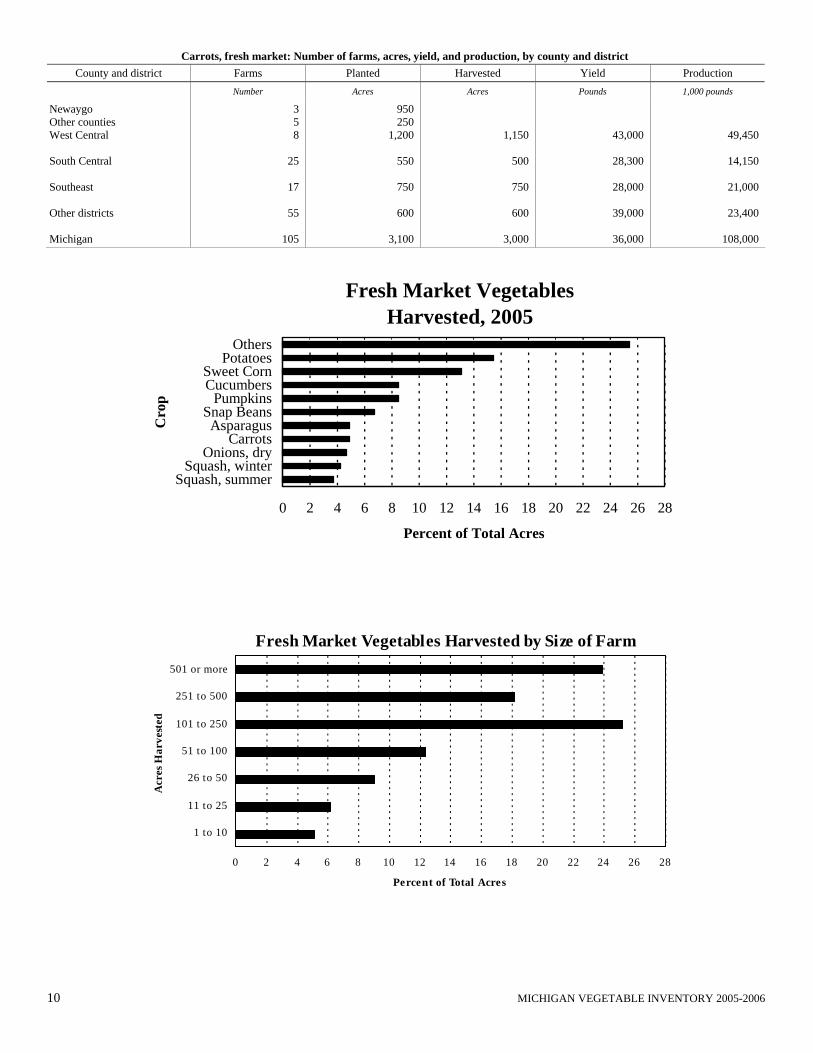
Carrots, fresh market: Number of farms, acres, yield, and production, by county and district County and district Farms Planted Harvested Yield Production
Number Acres Acres Pounds 1,000 pounds
Newaygo Other counties West Central South Central Southeast Other districts Michigan
3 5 8
25
17
55
105
950 250
1,200
550
750
600
3,100
1,150
500
750
600
3,000
43,000
28,300
28,000
39,000
36,000
49,450
14,150
21,000
23,400
108,000
Fresh Market VegetablesHarvested, 2005
0 2 4 6 8 10 12 14 16 18 20 22 24 26 28
Squash, summerSquash, winter
Onions, dryCarrots
AsparagusSnap Beans
PumpkinsCucumbersSweet Corn
PotatoesOthers
Cro
p
Percent of Total Acres
Fresh Market Vegetables Harvested by Size of Farm
0 2 4 6 8 10 12 14 16 18 20 22 24 26 28
1 to 10
11 to 25
26 to 50
51 to 100
101 to 250
251 to 500
501 or more
Acr
es H
arve
sted
Percent of Total Acres
MICHIGAN VEGETABLE INVENTORY 2005-2006 11
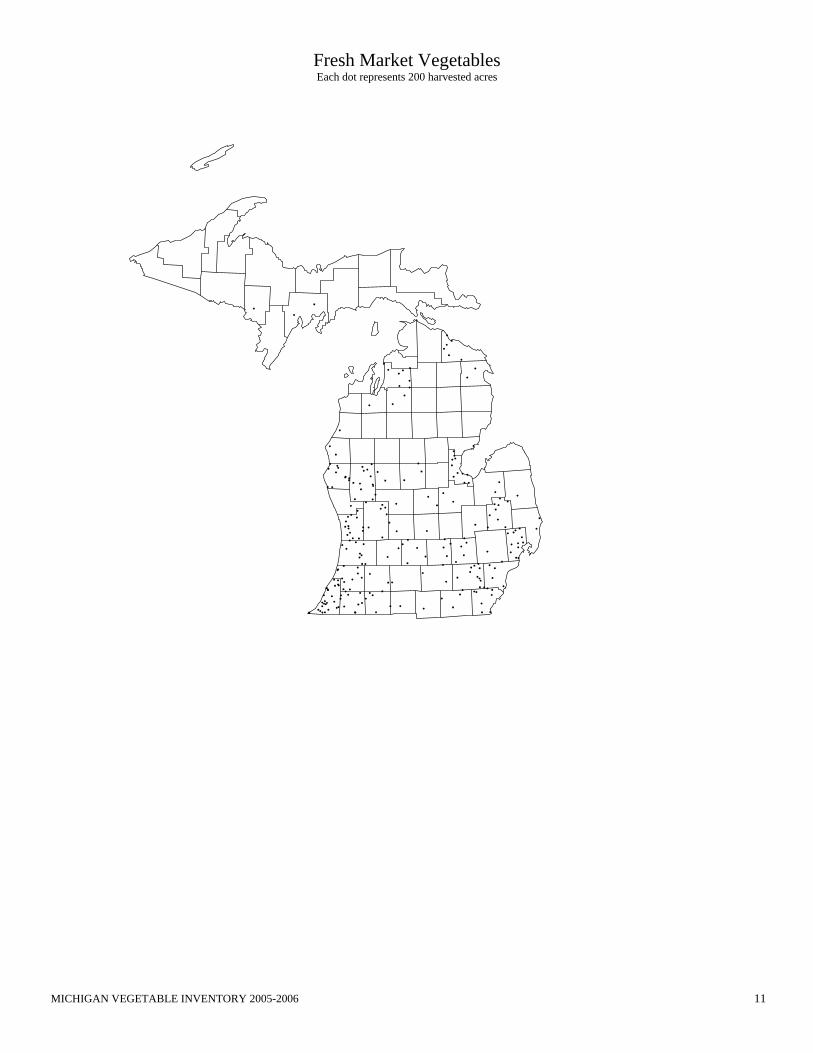
Fresh Market Vegetables Each dot represents 200 harvested acres
12 MICHIGAN VEGETABLE INVENTORY 2005-2006
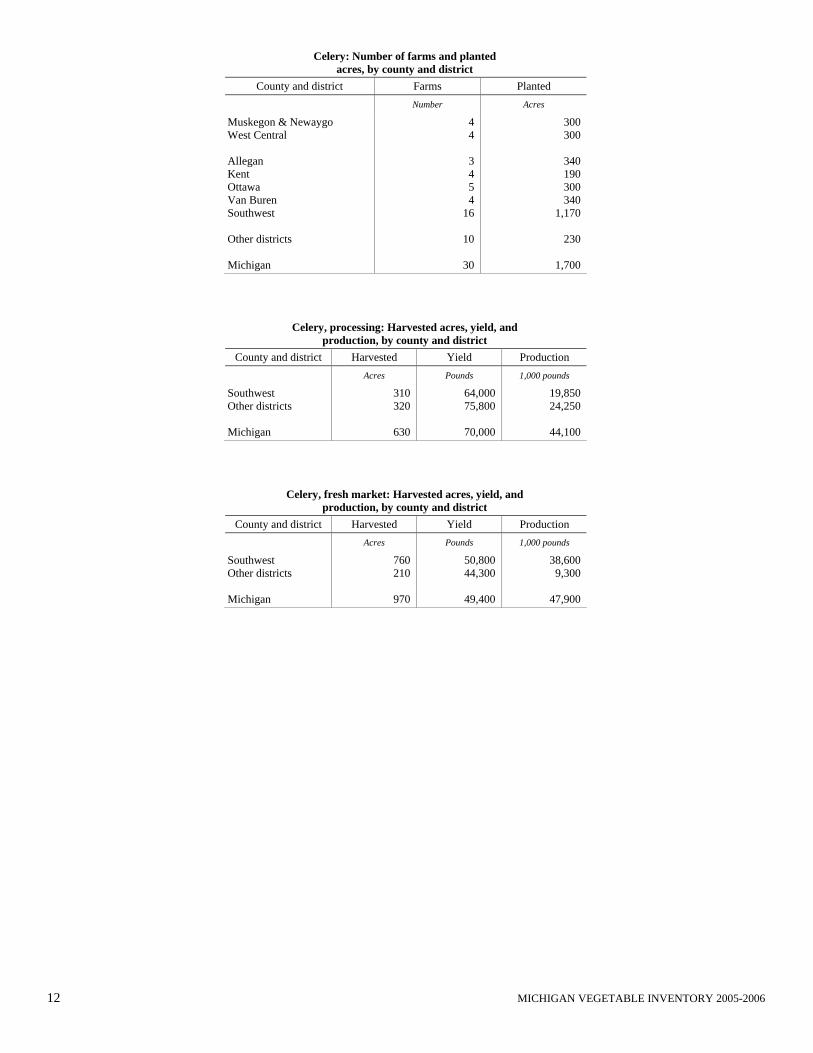
Celery: Number of farms and planted acres, by county and district
County and district Farms Planted
Number Acres
Muskegon & Newaygo West Central Allegan Kent Ottawa Van Buren Southwest Other districts Michigan
4 4
3 4 5 4
16
10
30
300 300
340 190 300 340
1,170
230
1,700
Celery, processing: Harvested acres, yield, and production, by county and district
County and district Harvested Yield Production
Acres Pounds 1,000 pounds
Southwest Other districts Michigan
310 320
630
64,000 75,800
70,000
19,850 24,250
44,100
Celery, fresh market: Harvested acres, yield, and production, by county and district
County and district Harvested Yield Production
Acres Pounds 1,000 pounds
Southwest Other districts Michigan
760 210
970
50,800 44,300
49,400
38,600 9,300
47,900
MICHIGAN VEGETABLE INVENTORY 2005-2006 13
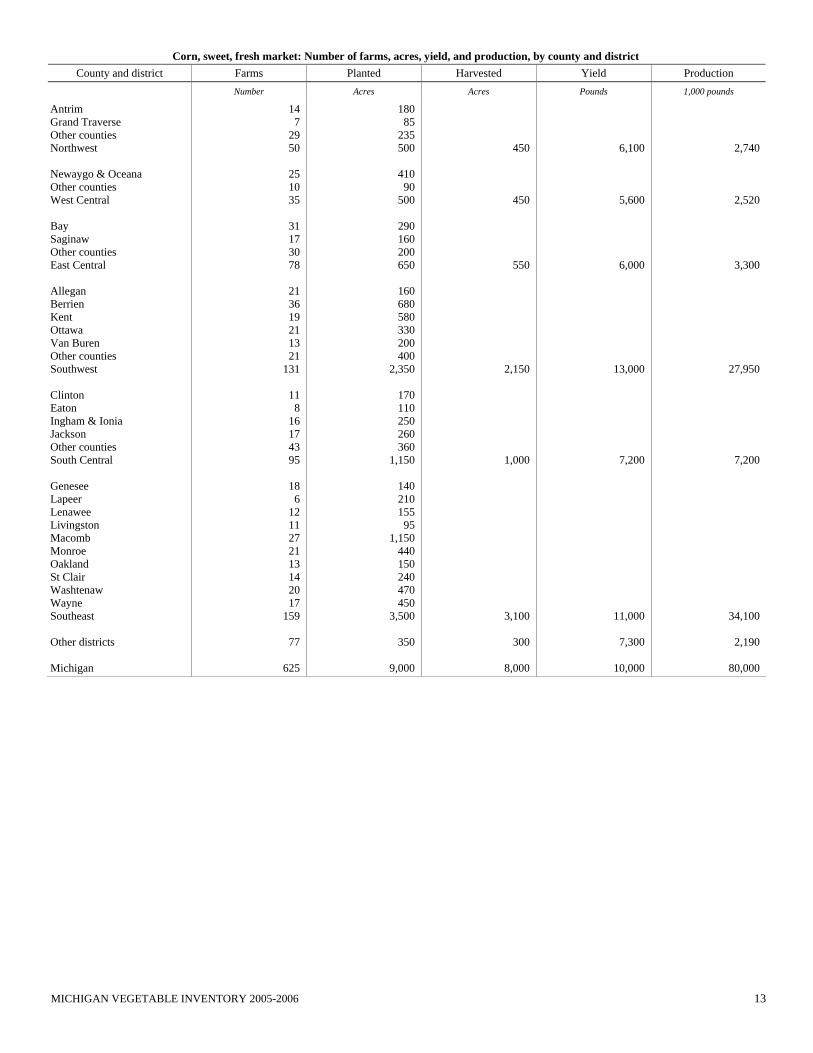
Corn, sweet, fresh market: Number of farms, acres, yield, and production, by county and district County and district Farms Planted Harvested Yield Production
Number Acres Acres Pounds 1,000 pounds
Antrim Grand Traverse Other counties Northwest Newaygo & Oceana Other counties West Central Bay Saginaw Other counties East Central Allegan Berrien Kent Ottawa Van Buren Other counties Southwest Clinton Eaton Ingham & Ionia Jackson Other counties South Central Genesee Lapeer Lenawee Livingston Macomb Monroe Oakland St Clair Washtenaw Wayne Southeast Other districts Michigan
14 7
29 50
25 10 35
31 17 30 78
21 36 19 21 13 21
131
11 8
16 17 43 95
18 6
12 11 27 21 13 14 20 17
159
77
625
180 85
235 500
410
90 500
290 160 200 650
160 680 580 330 200 400
2,350
170 110 250 260 360
1,150
140 210 155
95 1,150
440 150 240 470 450
3,500
350
9,000
450
450
550
2,150
1,000
3,100
300
8,000
6,100
5,600
6,000
13,000
7,200
11,000
7,300
10,000
2,740
2,520
3,300
27,950
7,200
34,100
2,190
80,000
14 MICHIGAN VEGETABLE INVENTORY 2005-2006
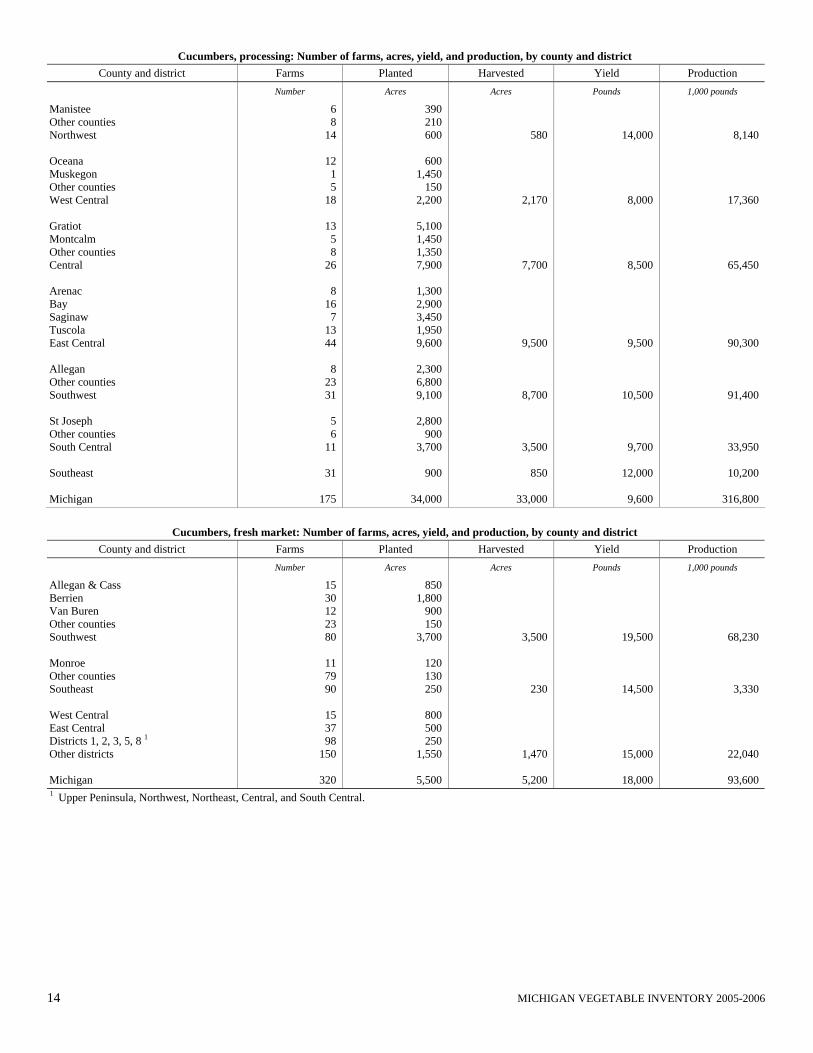
Cucumbers, processing: Number of farms, acres, yield, and production, by county and district County and district Farms Planted Harvested Yield Production
Number Acres Acres Pounds 1,000 pounds
Manistee Other counties Northwest Oceana Muskegon Other counties West Central Gratiot Montcalm Other counties Central Arenac Bay Saginaw Tuscola East Central Allegan Other counties Southwest St Joseph Other counties South Central Southeast Michigan
6 8
14
12 1 5
18
13 5 8
26
8 16 7
13 44
8
23 31
5 6
11
31
175
390 210 600
600
1,450 150
2,200
5,100 1,450 1,350 7,900
1,300 2,900 3,450 1,950 9,600
2,300 6,800 9,100
2,800
900 3,700
900
34,000
580
2,170
7,700
9,500
8,700
3,500
850
33,000
14,000
8,000
8,500
9,500
10,500
9,700
12,000
9,600
8,140
17,360
65,450
90,300
91,400
33,950
10,200
316,800
Cucumbers, fresh market: Number of farms, acres, yield, and production, by county and district County and district Farms Planted Harvested Yield Production
Number Acres Acres Pounds 1,000 pounds
Allegan & Cass Berrien Van Buren Other counties Southwest Monroe Other counties Southeast West Central East Central Districts 1, 2, 3, 5, 8 1 Other districts Michigan
15 30 12 23 80
11 79 90
15 37 98
150
320
850 1,800
900 150
3,700
120 130 250
800 500 250
1,550
5,500
3,500
230
1,470
5,200
19,500
14,500
15,000
18,000
68,230
3,330
22,040
93,600 1 Upper Peninsula, Northwest, Northeast, Central, and South Central.
MICHIGAN VEGETABLE INVENTORY 2005-2006 15
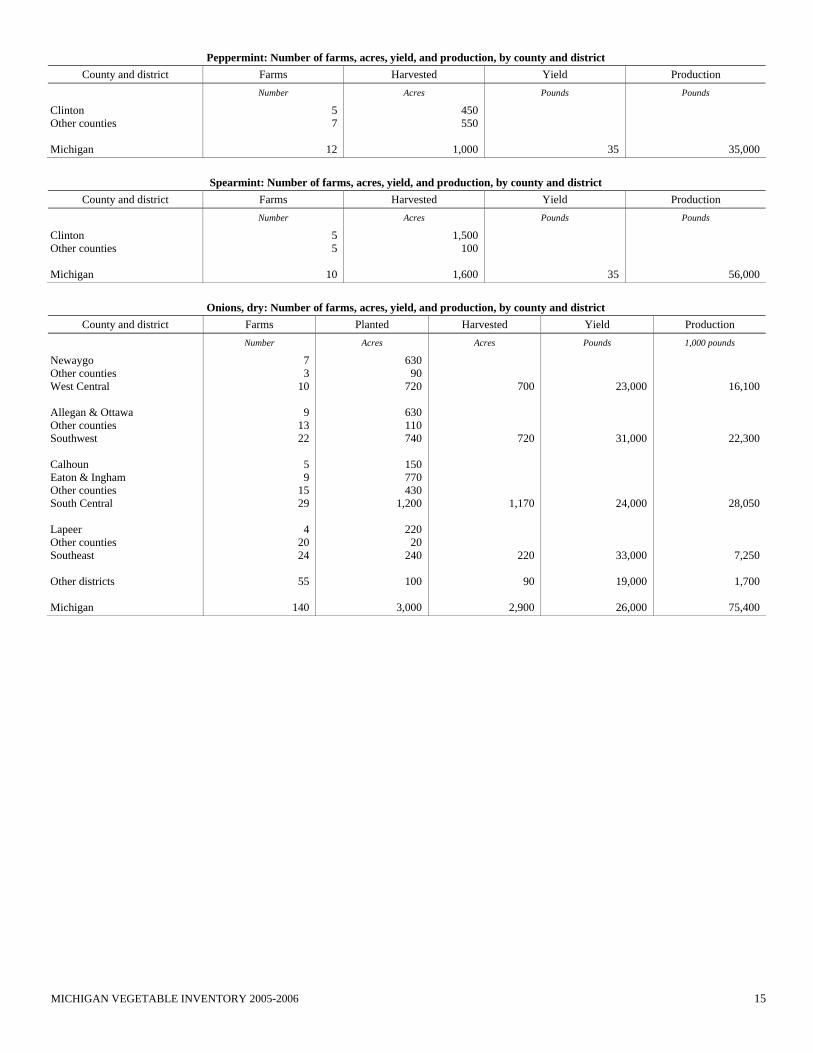
Peppermint: Number of farms, acres, yield, and production, by county and district County and district Farms Harvested Yield Production
Number Acres Pounds Pounds
Clinton Other counties Michigan
5 7
12
450 550
1,000
35
35,000
Spearmint: Number of farms, acres, yield, and production, by county and district County and district Farms Harvested Yield Production
Number Acres Pounds Pounds
Clinton Other counties Michigan
5 5
10
1,500 100
1,600
35
56,000
Onions, dry: Number of farms, acres, yield, and production, by county and district County and district Farms Planted Harvested Yield Production
Number Acres Acres Pounds 1,000 pounds
Newaygo Other counties West Central Allegan & Ottawa Other counties Southwest Calhoun Eaton & Ingham Other counties South Central Lapeer Other counties Southeast Other districts Michigan
7 3
10
9 13 22
5 9
15 29
4
20 24
55
140
630 90
720
630 110 740
150 770 430
1,200
220 20
240
100
3,000
700
720
1,170
220
90
2,900
23,000
31,000
24,000
33,000
19,000
26,000
16,100
22,300
28,050
7,250
1,700
75,400
16 MICHIGAN VEGETABLE INVENTORY 2005-2006
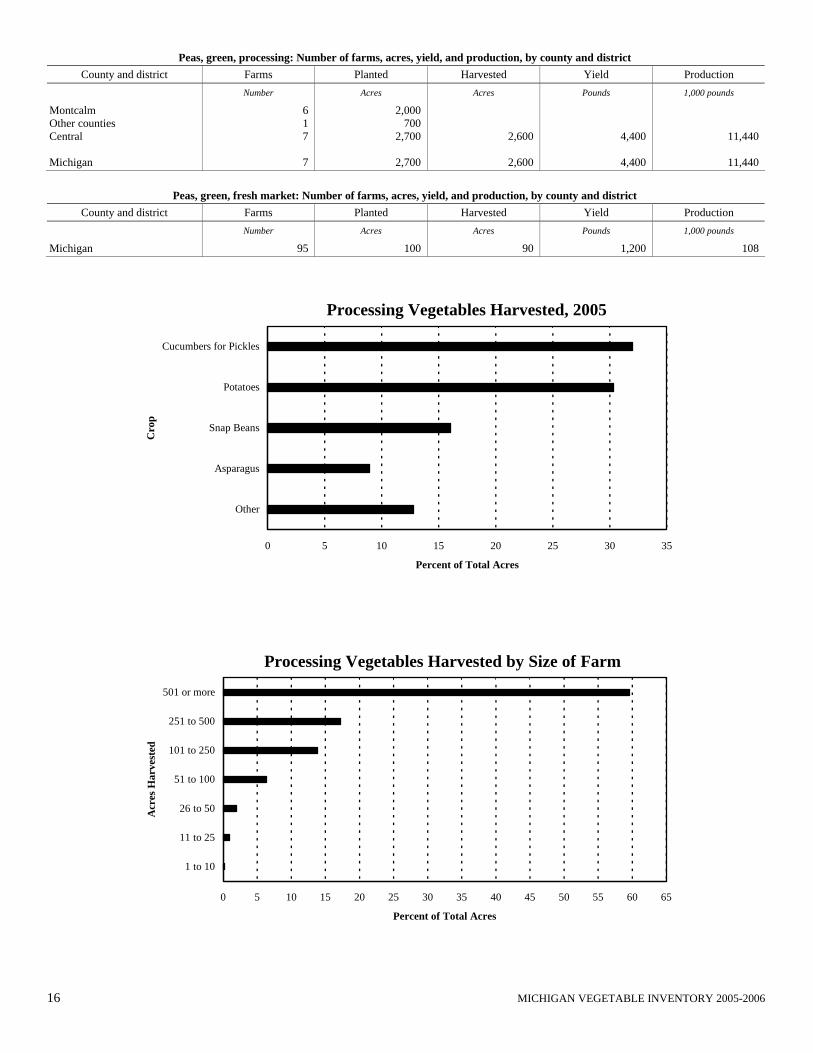
Peas, green, processing: Number of farms, acres, yield, and production, by county and district County and district Farms Planted Harvested Yield Production
Number Acres Acres Pounds 1,000 pounds
Montcalm Other counties Central Michigan
6 1 7
7
2,000 700
2,700
2,700
2,600
2,600
4,400
4,400
11,440
11,440
Peas, green, fresh market: Number of farms, acres, yield, and production, by county and district County and district Farms Planted Harvested Yield Production
Number Acres Acres Pounds 1,000 pounds
Michigan 95 100 90 1,200 108
Processing Vegetables Harvested, 2005
0 5 10 15 20 25 30 35
Other
Asparagus
Snap Beans
Potatoes
Cucumbers for Pickles
Cro
p
Percent of Total Acres
Processing Vegetables Harvested by Size of Farm
0 5 10 15 20 25 30 35 40 45 50 55 60 65
1 to 10
11 to 25
26 to 50
51 to 100
101 to 250
251 to 500
501 or more
Acr
es H
arve
sted
Percent of Total Acres
MICHIGAN VEGETABLE INVENTORY 2005-2006 17
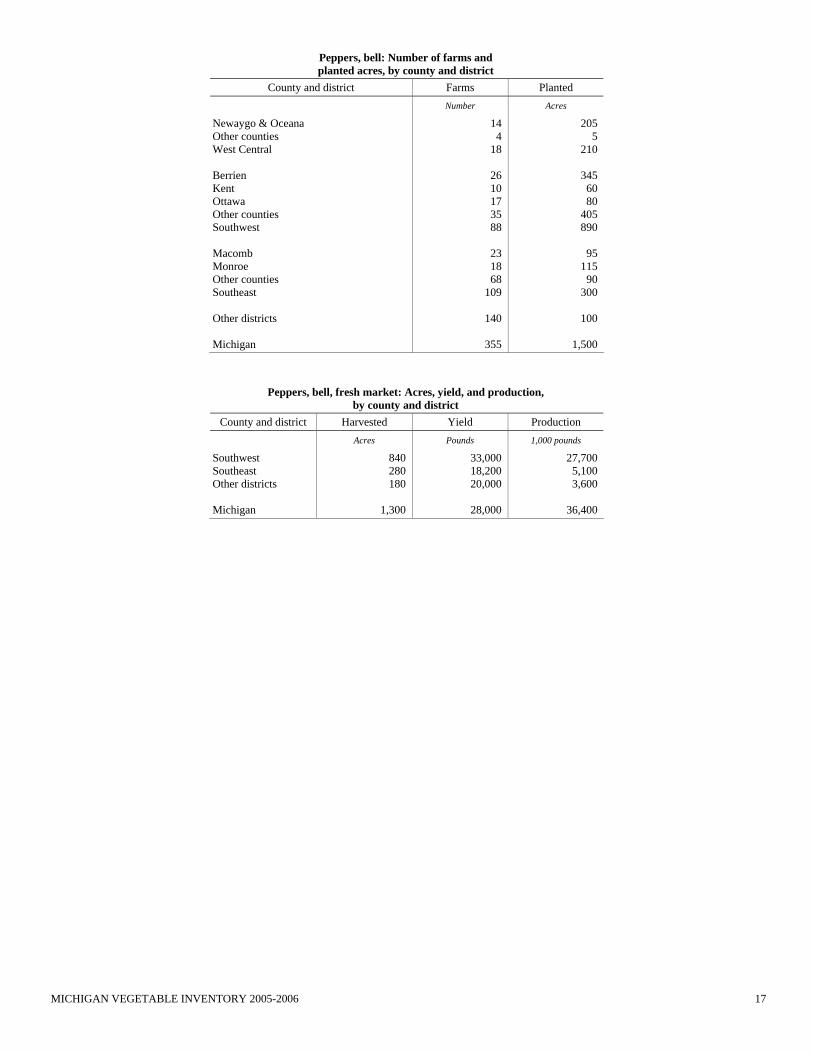
Peppers, bell: Number of farms and planted acres, by county and district
County and district Farms Planted
Number Acres
Newaygo & Oceana Other counties West Central Berrien Kent Ottawa Other counties Southwest Macomb Monroe Other counties Southeast Other districts Michigan
14 4
18
26 10 17 35 88
23 18 68
109
140
355
205 5
210
345 60 80
405 890
95
115 90
300
100
1,500
Peppers, bell, fresh market: Acres, yield, and production, by county and district
County and district Harvested Yield Production
Acres Pounds 1,000 pounds
Southwest Southeast Other districts Michigan
840 280 180
1,300
33,000 18,200 20,000
28,000
27,700 5,100 3,600
36,400
18 MICHIGAN VEGETABLE INVENTORY 2005-2006
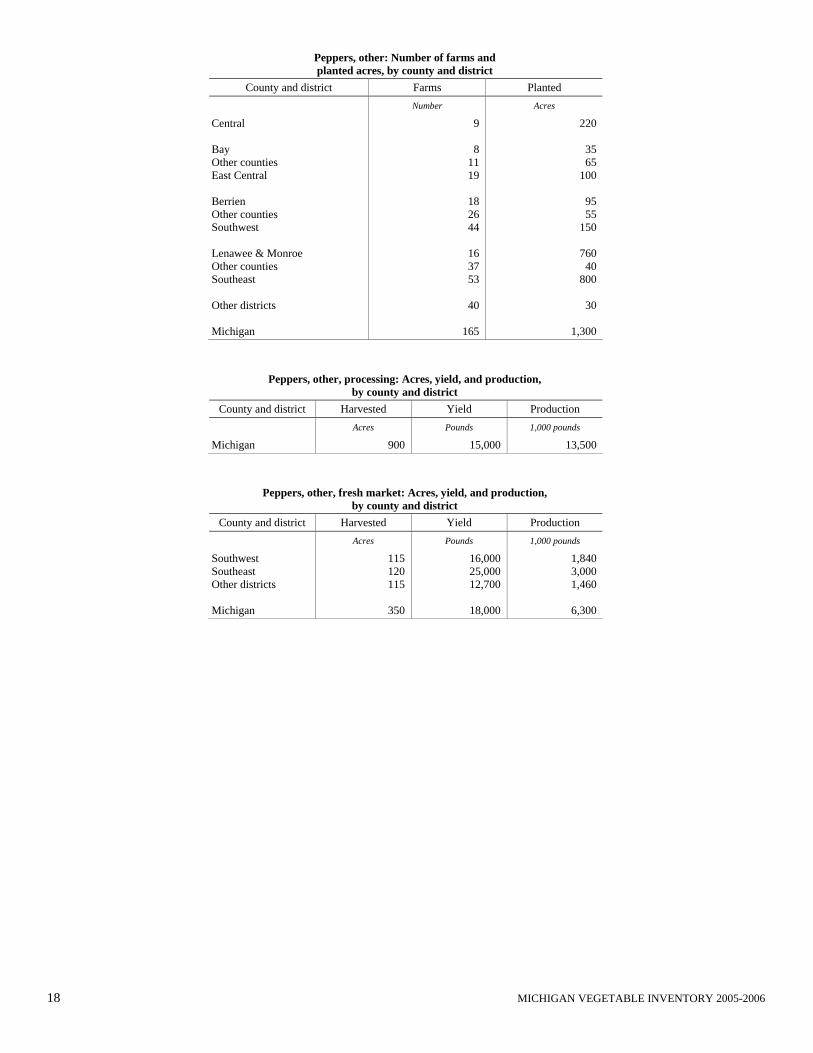
Peppers, other: Number of farms and planted acres, by county and district
County and district Farms Planted
Number Acres
Central Bay Other counties East Central Berrien Other counties Southwest Lenawee & Monroe Other counties Southeast Other districts Michigan
9
8 11 19
18 26 44
16 37 53
40
165
220
35 65
100
95 55
150
760 40
800
30
1,300
Peppers, other, processing: Acres, yield, and production, by county and district
County and district Harvested Yield Production
Acres Pounds 1,000 pounds
Michigan 900 15,000 13,500
Peppers, other, fresh market: Acres, yield, and production, by county and district
County and district Harvested Yield Production
Acres Pounds 1,000 pounds
Southwest Southeast Other districts Michigan
115 120 115
350
16,000 25,000 12,700
18,000
1,840 3,000 1,460
6,300
MICHIGAN VEGETABLE INVENTORY 2005-2006 19
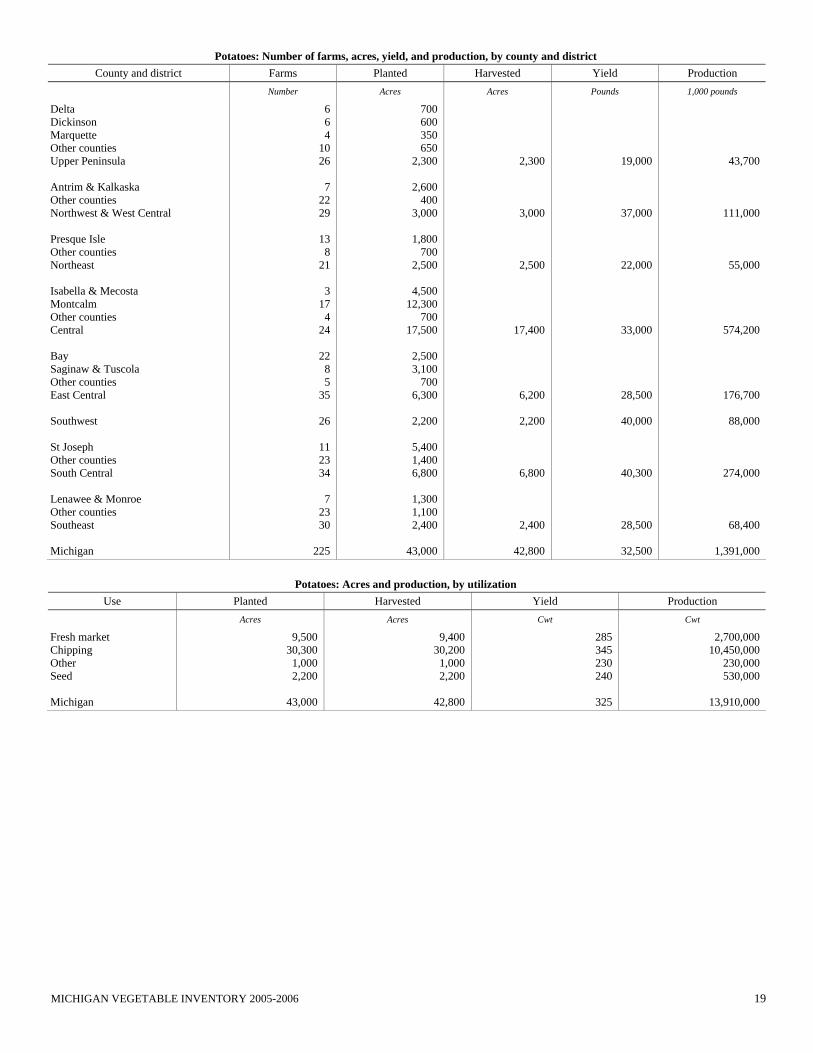
Potatoes: Number of farms, acres, yield, and production, by county and district County and district Farms Planted Harvested Yield Production
Number Acres Acres Pounds 1,000 pounds
Delta Dickinson Marquette Other counties Upper Peninsula Antrim & Kalkaska Other counties Northwest & West Central Presque Isle Other counties Northeast Isabella & Mecosta Montcalm Other counties Central Bay Saginaw & Tuscola Other counties East Central Southwest St Joseph Other counties South Central Lenawee & Monroe Other counties Southeast Michigan
6 6 4
10 26
7
22 29
13 8
21
3 17 4
24
22 8 5
35
26
11 23 34
7
23 30
225
700 600 350 650
2,300
2,600 400
3,000
1,800 700
2,500
4,500 12,300
700 17,500
2,500 3,100
700 6,300
2,200
5,400 1,400 6,800
1,300 1,100 2,400
43,000
2,300
3,000
2,500
17,400
6,200
2,200
6,800
2,400
42,800
19,000
37,000
22,000
33,000
28,500
40,000
40,300
28,500
32,500
43,700
111,000
55,000
574,200
176,700
88,000
274,000
68,400
1,391,000
Potatoes: Acres and production, by utilization Use Planted Harvested Yield Production
Acres Acres Cwt Cwt
Fresh market Chipping Other Seed Michigan
9,500 30,300 1,000 2,200
43,000
9,400 30,200
1,000 2,200
42,800
285 345 230 240
325
2,700,000 10,450,000
230,000 530,000
13,910,000
20 MICHIGAN VEGETABLE INVENTORY 2005-2006
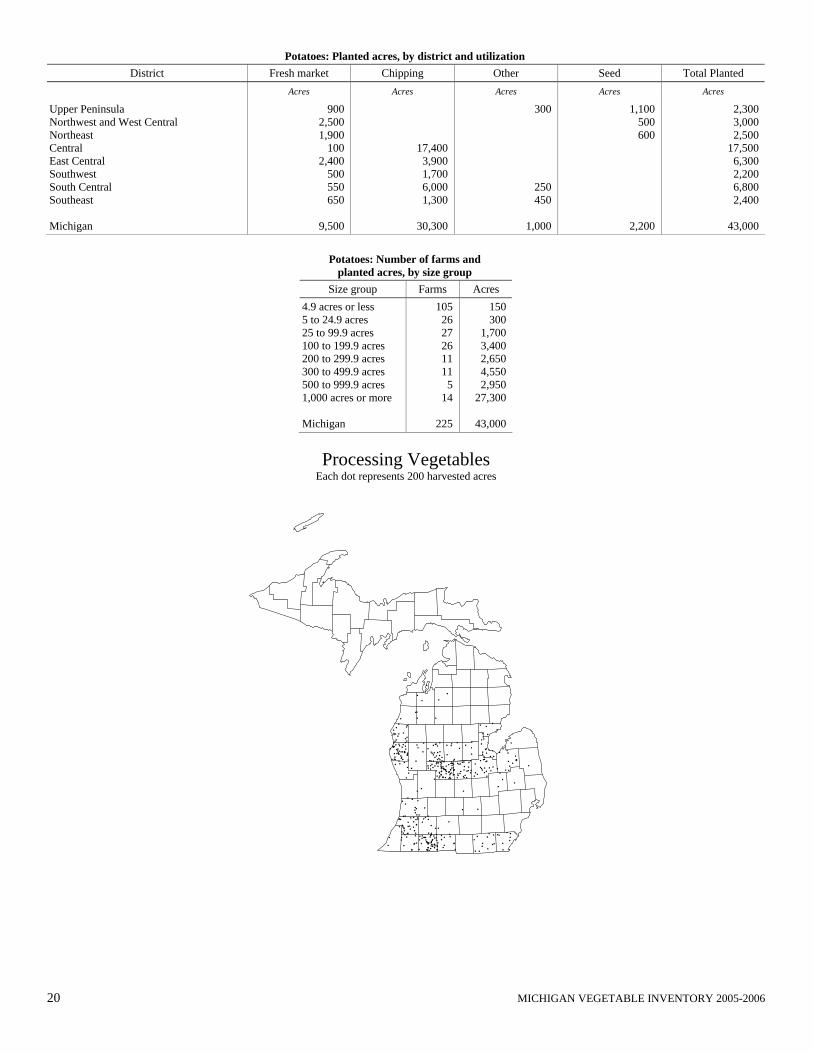
Potatoes: Planted acres, by district and utilization District Fresh market Chipping Other Seed Total Planted
Acres Acres Acres Acres Acres
Upper Peninsula Northwest and West Central Northeast Central East Central Southwest South Central Southeast Michigan
900 2,500 1,900
100 2,400
500 550 650
9,500
17,400 3,900 1,700 6,000 1,300
30,300
300
250 450
1,000
1,100 500 600
2,200
2,300 3,000 2,500
17,500 6,300 2,200 6,800 2,400
43,000
Potatoes: Number of farms and
planted acres, by size group Size group Farms Acres
4.9 acres or less 5 to 24.9 acres 25 to 99.9 acres 100 to 199.9 acres 200 to 299.9 acres 300 to 499.9 acres 500 to 999.9 acres 1,000 acres or more Michigan
105 26 27 26 11 11
5 14
225
150 300
1,700 3,400 2,650 4,550 2,950
27,300
43,000
Processing Vegetables Each dot represents 200 harvested acres
MICHIGAN VEGETABLE INVENTORY 2005-2006 21
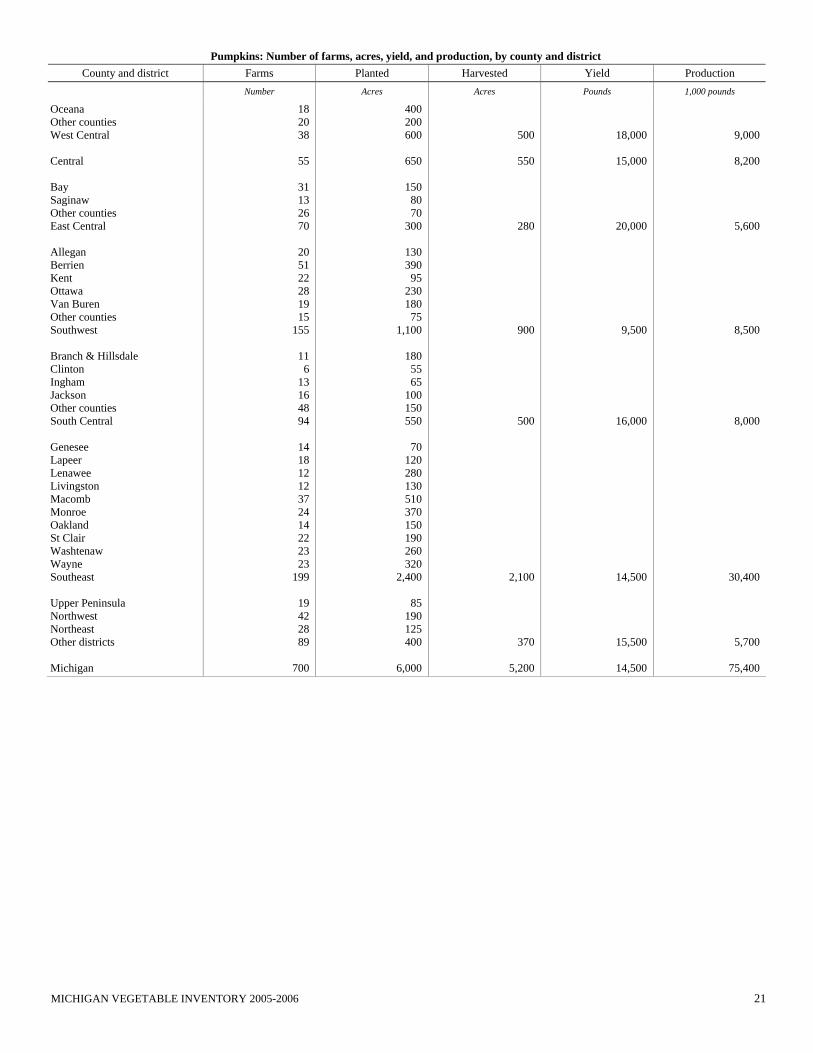
Pumpkins: Number of farms, acres, yield, and production, by county and district County and district Farms Planted Harvested Yield Production
Number Acres Acres Pounds 1,000 pounds
Oceana Other counties West Central Central Bay Saginaw Other counties East Central Allegan Berrien Kent Ottawa Van Buren Other counties Southwest Branch & Hillsdale Clinton Ingham Jackson Other counties South Central Genesee Lapeer Lenawee Livingston Macomb Monroe Oakland St Clair Washtenaw Wayne Southeast Upper Peninsula Northwest Northeast Other districts Michigan
18 20 38
55
31 13 26 70
20 51 22 28 19 15
155
11 6
13 16 48 94
14 18 12 12 37 24 14 22 23 23
199
19 42 28 89
700
400 200 600
650
150
80 70
300
130 390
95 230 180
75 1,100
180
55 65
100 150 550
70
120 280 130 510 370 150 190 260 320
2,400
85 190 125 400
6,000
500
550
280
900
500
2,100
370
5,200
18,000
15,000
20,000
9,500
16,000
14,500
15,500
14,500
9,000
8,200
5,600
8,500
8,000
30,400
5,700
75,400

22 MICHIGAN VEGETABLE INVENTORY 2005-2006
Squash, summer, processing: Number of farms, acres, yield, and production, by County and district
County and district Farms Planted Harvested Yield Production
Number Acres Acres Pounds 1,000 pounds
Oceana Other counties West Central Michigan
8 2
10
10
500 200 700
700
680
680
25,000
17,000
Squash, summer, fresh market: Number of farms, acres, yield, and production, by County and district
County and district Farms Planted Harvested Yield Production
Number Acres Acres Pounds 1,000 pounds
Oceana Other counties West Central Central Berrien Van Buren Other counties Southwest Lapeer Macomb Other counties Southeast Other districts Michigan
4 13 17
22
53 12 38
103
7 20 66 93
125
360
120 40
160
150
1,260 470 270
2,000
85 85
100 270
120
2,700
140
140
1,650
220
100
2,250
14,000
25,000
12,000
12,000
13,500
13,000
1,960
3,500
19,800
2,640
1,350
29,250
Squash, winter, processing: Number of farms, acres, yield, and production, by County and district
County and district Farms Planted Harvested Yield Production
Number Acres Acres Pounds 1,000 pounds
Mason Newaygo Oceana West Central Other districts Michigan
11 5
10 26
2
28
820 480 850
2,150
250
2,400
2,120
250
2,370
38,000
90,060
MICHIGAN VEGETABLE INVENTORY 2005-2006 23
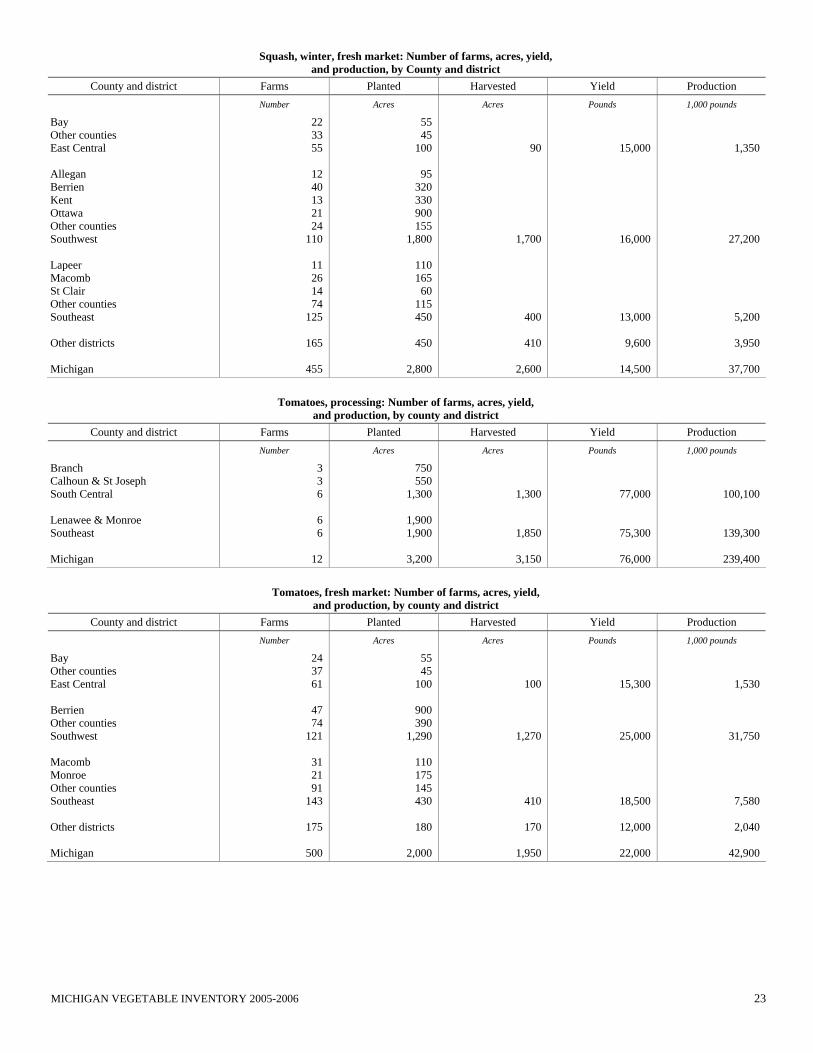
Squash, winter, fresh market: Number of farms, acres, yield, and production, by County and district
County and district Farms Planted Harvested Yield Production
Number Acres Acres Pounds 1,000 pounds
Bay Other counties East Central Allegan Berrien Kent Ottawa Other counties Southwest Lapeer Macomb St Clair Other counties Southeast Other districts Michigan
22 33 55
12 40 13 21 24
110
11 26 14 74
125
165
455
55 45
100
95 320 330 900 155
1,800
110 165
60 115 450
450
2,800
90
1,700
400
410
2,600
15,000
16,000
13,000
9,600
14,500
1,350
27,200
5,200
3,950
37,700
Tomatoes, processing: Number of farms, acres, yield, and production, by county and district
County and district Farms Planted Harvested Yield Production
Number Acres Acres Pounds 1,000 pounds
Branch Calhoun & St Joseph South Central Lenawee & Monroe Southeast Michigan
3 3 6
6 6
12
750 550
1,300
1,900 1,900
3,200
1,300
1,850
3,150
77,000
75,300
76,000
100,100
139,300
239,400
Tomatoes, fresh market: Number of farms, acres, yield, and production, by county and district
County and district Farms Planted Harvested Yield Production
Number Acres Acres Pounds 1,000 pounds
Bay Other counties East Central Berrien Other counties Southwest Macomb Monroe Other counties Southeast Other districts Michigan
24 37 61
47 74
121
31 21 91
143
175
500
55 45
100
900 390
1,290
110 175 145 430
180
2,000
100
1,270
410
170
1,950
15,300
25,000
18,500
12,000
22,000
1,530
31,750
7,580
2,040
42,900
24 MICHIGAN VEGETABLE INVENTORY 2005-2006
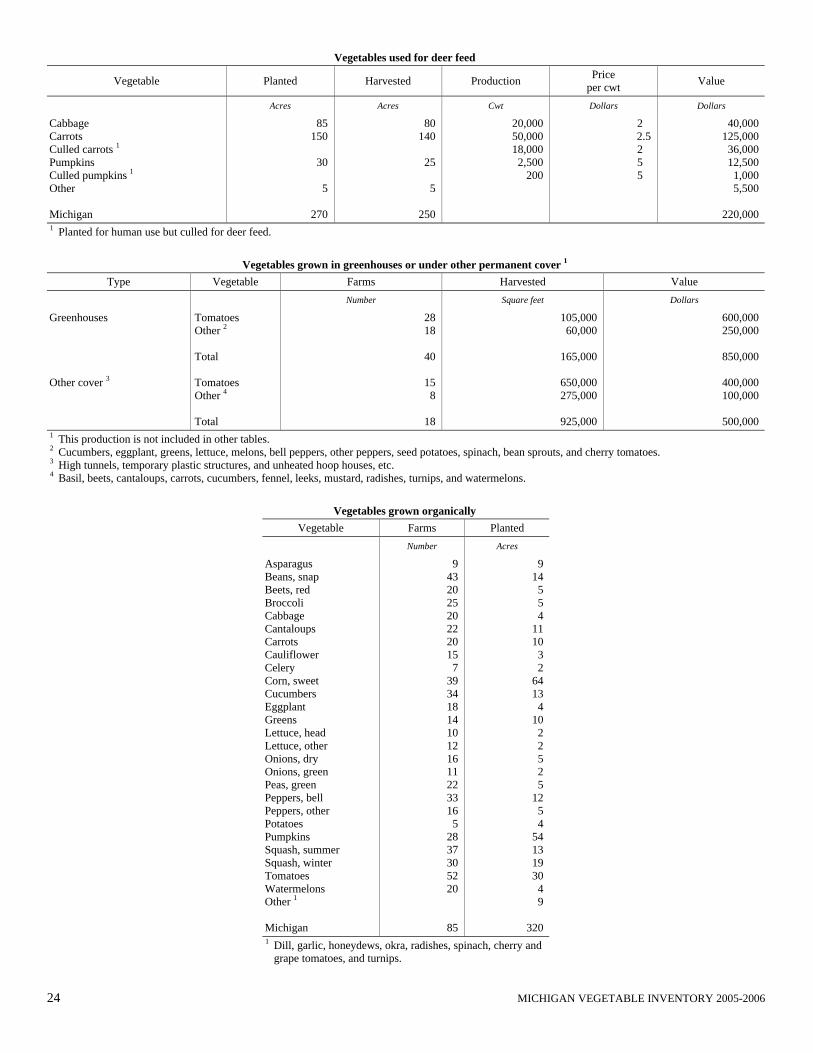
Vegetables used for deer feed
Vegetable Planted Harvested Production Price per cwt Value
Acres Acres Cwt Dollars Dollars
Cabbage Carrots Culled carrots 1 Pumpkins Culled pumpkins 1 Other Michigan
85 150
30
5
270
80 140
25
5
250
20,000 50,000 18,000
2,500 200
2 2.5 2 5 5
40,000 125,000 36,000 12,500
1,000 5,500
220,000
1 Planted for human use but culled for deer feed.
Vegetables grown in greenhouses or under other permanent cover 1 Type Vegetable Farms Harvested Value
Number Square feet Dollars
Greenhouses Other cover 3
Tomatoes Other 2 Total Tomatoes Other 4 Total
28 18
40
15
8
18
105,000 60,000
165,000
650,000 275,000
925,000
600,000 250,000
850,000
400,000 100,000
500,000
1 This production is not included in other tables. 2 Cucumbers, eggplant, greens, lettuce, melons, bell peppers, other peppers, seed potatoes, spinach, bean sprouts, and cherry tomatoes. 3 High tunnels, temporary plastic structures, and unheated hoop houses, etc. 4 Basil, beets, cantaloups, carrots, cucumbers, fennel, leeks, mustard, radishes, turnips, and watermelons.
Vegetables grown organically Vegetable Farms Planted
Number Acres
Asparagus Beans, snap Beets, red Broccoli Cabbage Cantaloups Carrots Cauliflower Celery Corn, sweet Cucumbers Eggplant Greens Lettuce, head Lettuce, other Onions, dry Onions, green Peas, green Peppers, bell Peppers, other Potatoes Pumpkins Squash, summer Squash, winter Tomatoes Watermelons Other 1 Michigan
9 43 20 25 20 22 20 15
7 39 34 18 14 10 12 16 11 22 33 16
5 28 37 30 52 20
85
9 14
5 5 4
11 10
3 2
64 13
4 10
2 2 5 2 5
12 5 4
54 13 19 30
4 9
320
1 Dill, garlic, honeydews, okra, radishes, spinach, cherry and grape tomatoes, and turnips.
MICHIGAN VEGETABLE INVENTORY 2005-2006 25
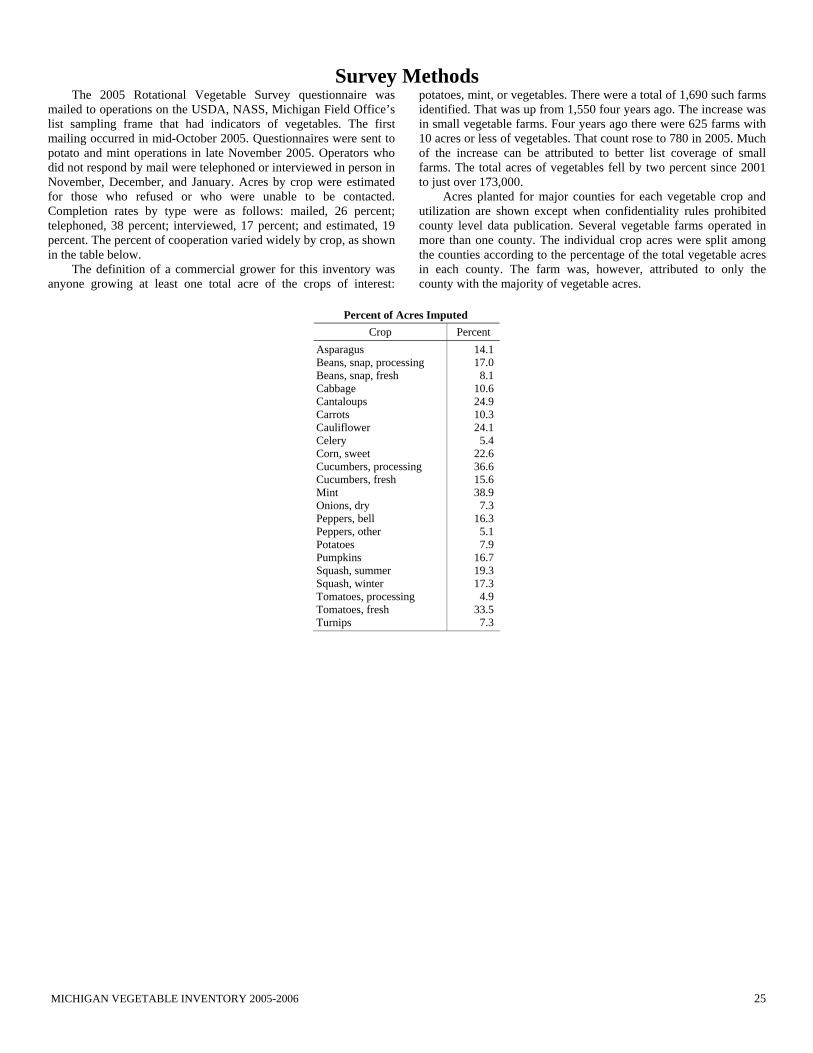
Survey Methods The 2005 Rotational Vegetable Survey questionnaire was mailed to operations on the USDA, NASS, Michigan Field Office’s list sampling frame that had indicators of vegetables. The first mailing occurred in mid-October 2005. Questionnaires were sent to potato and mint operations in late November 2005. Operators who did not respond by mail were telephoned or interviewed in person in November, December, and January. Acres by crop were estimated for those who refused or who were unable to be contacted. Completion rates by type were as follows: mailed, 26 percent; telephoned, 38 percent; interviewed, 17 percent; and estimated, 19 percent. The percent of cooperation varied widely by crop, as shown in the table below. The definition of a commercial grower for this inventory was anyone growing at least one total acre of the crops of interest:
potatoes, mint, or vegetables. There were a total of 1,690 such farms identified. That was up from 1,550 four years ago. The increase was in small vegetable farms. Four years ago there were 625 farms with 10 acres or less of vegetables. That count rose to 780 in 2005. Much of the increase can be attributed to better list coverage of small farms. The total acres of vegetables fell by two percent since 2001 to just over 173,000. Acres planted for major counties for each vegetable crop and utilization are shown except when confidentiality rules prohibited county level data publication. Several vegetable farms operated in more than one county. The individual crop acres were split among the counties according to the percentage of the total vegetable acres in each county. The farm was, however, attributed to only the county with the majority of vegetable acres.
Percent of Acres Imputed
Crop Percent Asparagus Beans, snap, processing Beans, snap, fresh Cabbage Cantaloups Carrots Cauliflower Celery Corn, sweet Cucumbers, processing Cucumbers, fresh Mint Onions, dry Peppers, bell Peppers, other Potatoes Pumpkins Squash, summer Squash, winter Tomatoes, processing Tomatoes, fresh Turnips
14.1 17.0
8.1 10.6 24.9 10.3 24.1
5.4 22.6 36.6 15.6 38.9
7.3 16.3
5.1 7.9
16.7 19.3 17.3
4.9 33.5
7.3

SAMPLE
USDA, NASS, Michigan Field Office3001 Coolidge Road, Suite 400East Lansing, Michigan 48823Telephone: (517) 324-5300Facsimile: (517) 324-5299
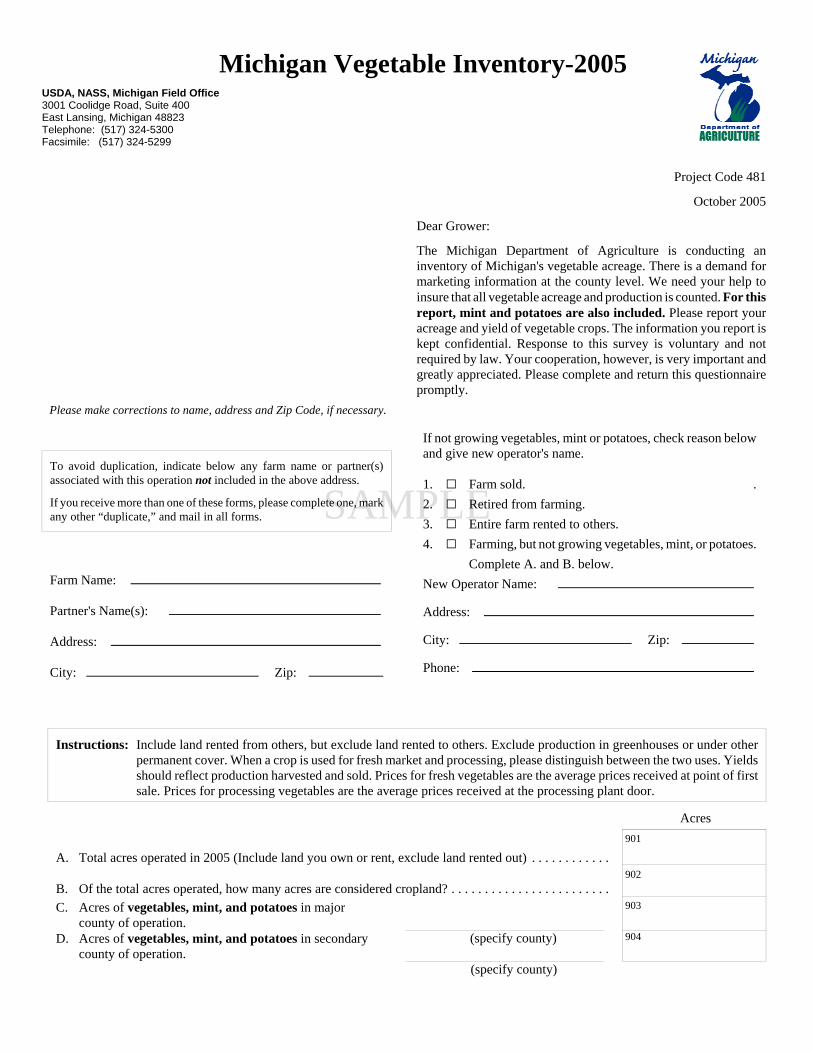
Michigan Vegetable Inventory-2005
Instructions: Include land rented from others, but exclude land rented to others. Exclude production in greenhouses or under otherpermanent cover. When a crop is used for fresh market and processing, please distinguish between the two uses. Yieldsshould reflect production harvested and sold. Prices for fresh vegetables are the average prices received at point of firstsale. Prices for processing vegetables are the average prices received at the processing plant door.
Acres
A. Total acres operated in 2005 (Include land you own or rent, exclude land rented out) . . . . . . . . . . . .901
B. Of the total acres operated, how many acres are considered cropland? . . . . . . . . . . . . . . . . . . . . . . . .902
C. Acres of vegetables, mint, and potatoes in majorcounty of operation.
903
D. Acres of vegetables, mint, and potatoes in secondarycounty of operation.
(specify county) 904
(specify county)
Farm Name:
Partner's Name(s):
Address:
City: Zip:
To avoid duplication, indicate below any farm name or partner(s)associated with this operation not included in the above address.
If you receive more than one of these forms, please complete one, markany other “duplicate,” and mail in all forms.
Please make corrections to name, address and Zip Code, if necessary.
Project Code 481
October 2005
Dear Grower:
The Michigan Department of Agriculture is conducting aninventory of Michigan's vegetable acreage. There is a demand formarketing information at the county level. We need your help toinsure that all vegetable acreage and production is counted. For thisreport, mint and potatoes are also included. Please report youracreage and yield of vegetable crops. The information you report iskept confidential. Response to this survey is voluntary and notrequired by law. Your cooperation, however, is very important andgreatly appreciated. Please complete and return this questionnairepromptly.
If not growing vegetables, mint or potatoes, check reason belowand give new operator's name.
1. G Farm sold. .2. G Retired from farming.3. G Entire farm rented to others.4. G Farming, but not growing vegetables, mint, or potatoes.
Complete A. and B. below.New Operator Name:
Address:
City: Zip:
Phone:
SAMPLE
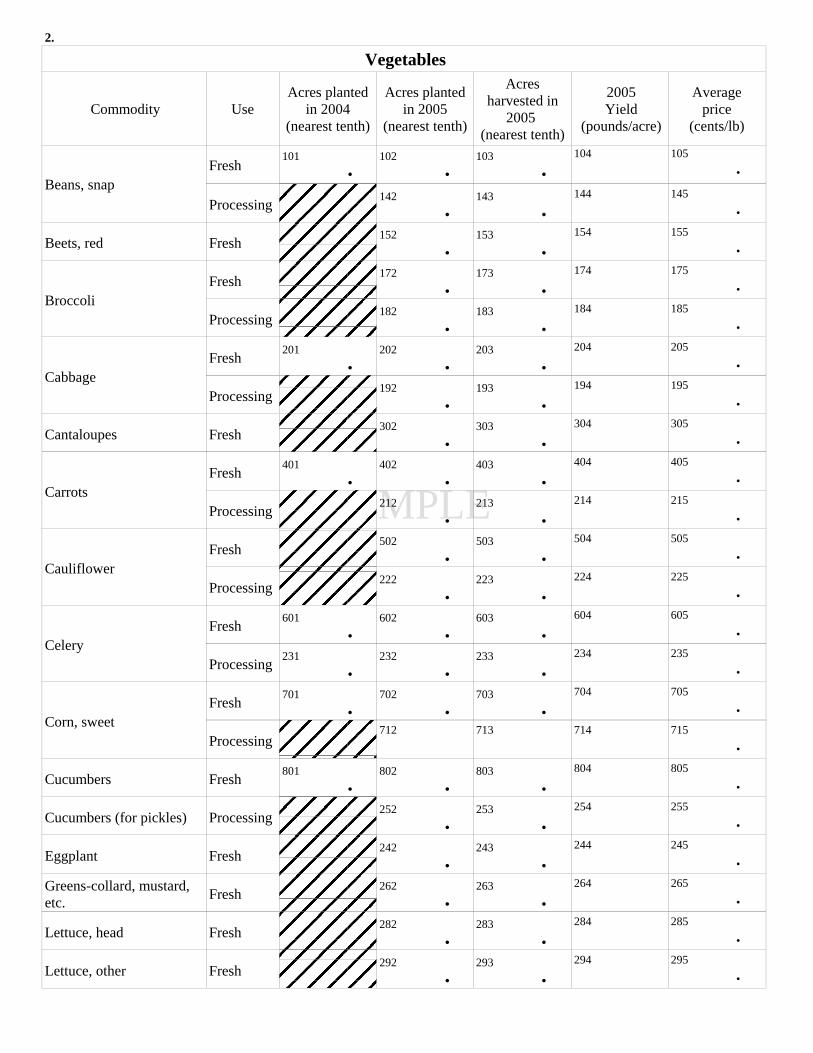
2.
Vegetables
Commodity UseAcres planted
in 2004(nearest tenth)
Acres plantedin 2005
(nearest tenth)
Acresharvested in
2005 (nearest tenth)
2005Yield
(pounds/acre)
Averageprice
(cents/lb)
Beans, snapFresh
101
•102
•103
•104 105
•
Processing 142
•143
•144 145
•
Beets, red Fresh 152
•153
•154 155
•
BroccoliFresh 172
•173
•174 175
•
Processing 182
•183
•184 185
•
CabbageFresh 201
•202
•203
•204 205
•
Processing 192
•193
•194 195
•
Cantaloupes Fresh 302
•303
•304 305
•
CarrotsFresh 401
•402
• 403
•404 405
•
Processing 212
•213
•214 215
•
CauliflowerFresh 502
•503
•504 505
•
Processing 222
•223
•224 225
•
CeleryFresh 601
•602
•603
•604 605
•
Processing 231
•232
•233
•234 235
•
Corn, sweetFresh 701
•702
•703
•704 705
•
Processing712 713 714 715
•
Cucumbers Fresh 801
•802
•803
•804 805
•
Cucumbers (for pickles) Processing 252
•253
•254 255
•
Eggplant Fresh 242
•243
•244 245
•
Greens-collard, mustard,etc. Fresh 262
•263
•264 265
•
Lettuce, head Fresh 282
•283
•284 285
•
Lettuce, other Fresh 292
•293
•294 295
•
SAMPLE
3.
Notes and Calculations

SAMPLE
4.
Vegetables (continued)
Commodity UseAcres planted
in 2004(nearest tenth)
Acres plantedin 2005
(nearest tenth)
Acresharvested in
2005 (nearest tenth)
2005Yield
(pounds/acre)
Averageprice
(cents/lb)
Onions, dry Fresh 111
•112
•113
•114 115
•
Onions, green Fresh 322
•323
•324 325
•
Parsnips Fresh 372
•373
•374 375
•
Peas, greenFresh 482
•483
•484 485
•
Processing 492
•493
•494 495
•
Peppers, bellFresh 121
•122
•123
•124 125
•
Processing 332
•333
•334 335
•
Peppers, otherFresh 342
•343
•344 345
•
Processing 352
•353
•354 355
•
Pumpkins Fresh 361
•362
•363
•364 365
•
Radishes Fresh 382
•383
•384 385
•
Squash, summerFresh 391
•392
•393
•394 395
•
Processing 411
•412
•413
•414 415
•
Squash, winterFresh 421
•422
•423
•424 425
•
Processing 431
•432
•433
•434 435
•
Tomatoes (exclude cherryand grape tomatoes)
Fresh 131
•132
•133
•134 135
•
Processing 442
•443
•444 445
•
Turnips Fresh 452
•453
•454 455
•
Watermelons Fresh 472
•473
•474 475
•
Other* Fresh 512
•513
•514 515
•
(specify) Processing 522
•523
•524 525
•
*Other vegetables may include cherry and grape tomatoes, kale, parsley, rhubarb, spinach and any other vegetable not listed.

SAMPLE
5.
Notes and Calculations
SAMPLE
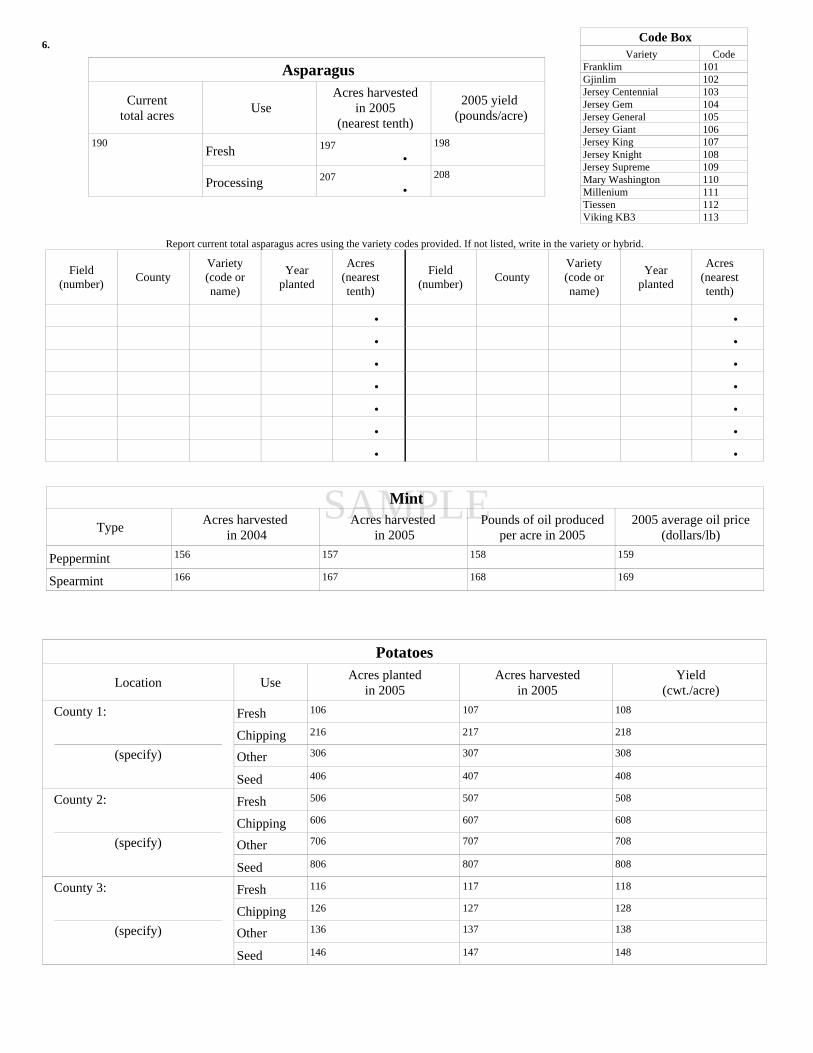
Code BoxVariety Code
Franklim 101Gjinlim 102Jersey Centennial 103Jersey Gem 104Jersey General 105Jersey Giant 106Jersey King 107Jersey Knight 108Jersey Supreme 109Mary Washington 110Millenium 111Tiessen 112Viking KB3 113
Asparagus
Currenttotal acres Use
Acres harvestedin 2005
(nearest tenth)
2005 yield (pounds/acre)
190Fresh 197
•198
Processing 207•
208
Report current total asparagus acres using the variety codes provided. If not listed, write in the variety or hybrid.
Field(number) County
Variety(code orname)
Yearplanted
Acres(nearesttenth)
Field(number) County
Variety(code orname)
Yearplanted
Acres(nearesttenth)
• •
• •
• •
• •
• •
• •
• •
Mint
Type Acres harvested in 2004
Acres harvested in 2005
Pounds of oil producedper acre in 2005
2005 average oil price(dollars/lb)
Peppermint 156 157 158 159
Spearmint 166 167 168 169
Potatoes
Location Use Acres plantedin 2005
Acres harvestedin 2005
Yield(cwt./acre)
County 1: Fresh 106 107 108
Chipping 216 217 218
(specify) Other 306 307 308
Seed 406 407 408
County 2: Fresh 506 507 508
Chipping 606 607 608
(specify) Other 706 707 708
Seed 806 807 808
County 3: Fresh 116 117 118
Chipping 126 127 128
(specify) Other 136 137 138
Seed 146 147 148
6.
SAMPLE
7.
Notes and Calculations
SAMPLE
Office Use Only Respondent Response Code Enum. Eval.
Respondent’s Name 1-Op/Ptnr2-Sp3-Acct/Bkpr4-Oth5-Est R6-Est NR
001 2-Tel3-Int7-TR8-IR9-Inac
910 098 100
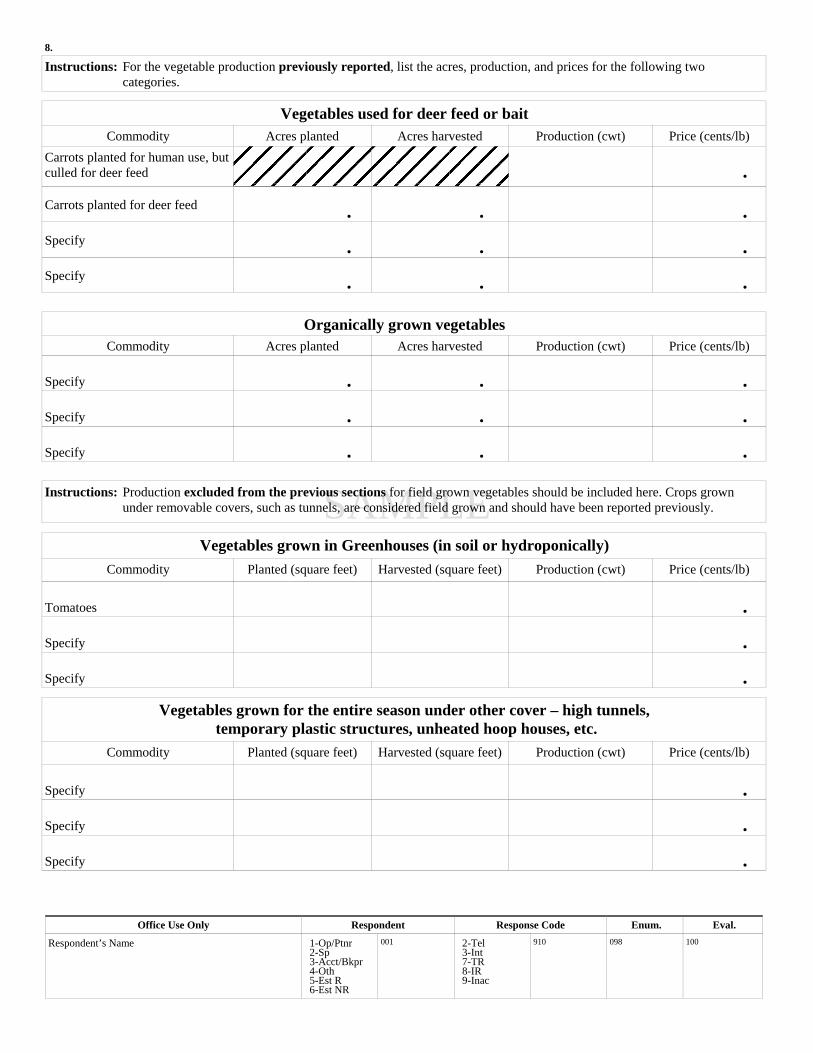
8.
Instructions: For the vegetable production previously reported, list the acres, production, and prices for the following twocategories.
Vegetables used for deer feed or baitCommodity Acres planted Acres harvested Production (cwt) Price (cents/lb)
Carrots planted for human use, butculled for deer feed •
Carrots planted for deer feed• • •
Specify • • •
Specify• • •
Organically grown vegetablesCommodity Acres planted Acres harvested Production (cwt) Price (cents/lb)
Specify • • •
Specify • • •
Specify • • •
Instructions: Production excluded from the previous sections for field grown vegetables should be included here. Crops grownunder removable covers, such as tunnels, are considered field grown and should have been reported previously.
Vegetables grown in Greenhouses (in soil or hydroponically)Commodity Planted (square feet) Harvested (square feet) Production (cwt) Price (cents/lb)
Tomatoes •
Specify •
Specify •
Vegetables grown for the entire season under other cover – high tunnels, temporary plastic structures, unheated hoop houses, etc.
Commodity Planted (square feet) Harvested (square feet) Production (cwt) Price (cents/lb)
Specify •
Specify •
Specify •
INTERNET ACCESS Reports, data products, and services published by the USDA, NASS, Michigan Field Office, Michigan Department of Agriculture, and National Agricultural Statistics Service of the United States Department of Agriculture are available on the Worldwide Web. There is no charge for connecting to these Internet addresses: $ Michigan Department of Agriculture (MDA)
MDA home page at: www.michigan.gov/mda
$ USDA, NASS, Michigan Field Office
From the NASS home page, www.nass.usda.gov, click on the Statistics by State dropdown to access the Michigan Internet page.
On the Michigan Internet page, you will find up-to-date data such as Crop-Weather releases, press releases, Agriculture Across Michigan, and county estimates.
$ National Agricultural Statistics Service (NASS)
NASS home page at: www.nass.usda.gov
You can access national releases, 2002 Census of Agriculture data, and home pages of NASS Field Offices including Michigan from this web site. Michigan Crop Weather and national releases by free e-mail subscription are available from this site.
AUTOFAX ACCESS
NASSFax service is available for some reports from your fax machine. Please call 202-720-2000, using the handset attached to your fax. Respond to the voice prompts.
PRINTED REPORTS OR DATA PRODUCTS
CALL OUR TOLL-FREE ORDER DESK: 1-800-999-6779 (U.S. and Canada) Other areas, please call l-703-834-0125 FAX: 1-703-834-0110
(Visa, MasterCard, check, or money order acceptable for payment).
ASSISTANCE
For assistance or questions regarding Michigan agriculture, call 1-800-453-7501. Further information about NASS or its products or services can be obtained by contacting the Agricultural Statistics HOTLINE at 1-800-727-9540, 7:30 a.m. to 4:30 p.m. ET or e-mail: [email protected].

USDA, NASS, Michigan Field Office P.O. Box 26248 Lansing, MI 48909-2648 in cooperation with the Michigan Department of Agriculture OFFICIAL BUSINESS
NASS FACT FINDERS FOR AGRICULTURE United States Department of Agriculture