Embed Size (px)
Citation preview
Vehicle Description FormHuman Powered Vehicle Challenge 2011 (HPVC Form 6)
East Event Host: Rose Hulman Institute of Technology, Indianapolis, IN.Apr 29 May 1, 2011West Event Host: Montana State University, Bozeman, MT. May 13 15
http://www.asme.org/hpv
*** This is a required document for all teams. Please incorporate it into your Design Report ******
Please Observe Your Due Dates
Vehicle Description
Competition Location:School name:Vehicle name:Vehicle number
Vehicle type Unrestricted Speed_______
Vehicle configurationUpright Semi recumbentProne Other (specify)
Frame materialFairing material(s)Number of wheelsVehicle Dimensions (please use inches, pounds)
Length WidthHeight Wheelbase
Weight Distribution Front Rear TotalWheel Size Front RearFrontal areaSteering Front RearBraking Front Rear BothEstimated Cd
Vehicle history (e.g., has it competed before? where? when?)________________________
EASTMarch 28, 2011
WESTApril 11, 2011
Indianapolis, INUniversity of TorontoVortex5
✔
✔
Carbon-fiber composite & structural foamCarbon-fiber composite2
94.2 19.640.4 45.1
19.6 13.1 32.7ISO406ISO406
503.8 sq.in.
✔✔
0.071
Vehicle has not competed previously, and is a new construction for the 2011 competition.
Unlimited-Class Human-Powered Vehicle
University of Toronto
Human-Powered Vehicle Design Team
ASME Human-Powered Vehicle Challenge
Indianapolis Motor Speedway
April 29 - May 1, 2011
1
Contents
1 Innovation and Design 3
1.1 Design Objective and Product Specifications . . . . . . . . . . . . . . . . . . . . . . 3
1.2 Evaluation of the current state of the art . . . . . . . . . . . . . . . . . . . . . . . . . 4
1.3 Evaluation of design alternatives . . . . . . . . . . . . . . . . . . . . . . . . . . . . . 5
1.4 Innovation . . . . . . . . . . . . . . . . . . . . . . . . . . . . . . . . . . . . . . . . . . 6
2 Analysis 8
2.1 Vehicle Handling . . . . . . . . . . . . . . . . . . . . . . . . . . . . . . . . . . . . . . 8
2.2 Aerodynamic Design . . . . . . . . . . . . . . . . . . . . . . . . . . . . . . . . . . . . 9
2.3 Structural Design . . . . . . . . . . . . . . . . . . . . . . . . . . . . . . . . . . . . . . 13
2.4 Cost Analysis . . . . . . . . . . . . . . . . . . . . . . . . . . . . . . . . . . . . . . . . 16
3 Testing 18
3.1 Rollover and side protection system . . . . . . . . . . . . . . . . . . . . . . . . . . . 18
3.2 Composite Materials Properties Testing . . . . . . . . . . . . . . . . . . . . . . . . . 18
3.3 Rider Configuration . . . . . . . . . . . . . . . . . . . . . . . . . . . . . . . . . . . . 20
3.4 Landing gear . . . . . . . . . . . . . . . . . . . . . . . . . . . . . . . . . . . . . . . . 20
3.5 Aerodynamic Testing . . . . . . . . . . . . . . . . . . . . . . . . . . . . . . . . . . . . 21
3.6 Steering damper . . . . . . . . . . . . . . . . . . . . . . . . . . . . . . . . . . . . . . 23
4 Practicality 25
4.1 Objective . . . . . . . . . . . . . . . . . . . . . . . . . . . . . . . . . . . . . . . . . . 25
4.2 Environment . . . . . . . . . . . . . . . . . . . . . . . . . . . . . . . . . . . . . . . . 25
4.3 Ridable Hours per Day . . . . . . . . . . . . . . . . . . . . . . . . . . . . . . . . . . . 25
4.4 Weather and Thermal days per year . . . . . . . . . . . . . . . . . . . . . . . . . . . 25
4.5 Design Solutions . . . . . . . . . . . . . . . . . . . . . . . . . . . . . . . . . . . . . . 26
5 Safety 29
5.1 Normal operation . . . . . . . . . . . . . . . . . . . . . . . . . . . . . . . . . . . . . . 29
5.2 Impact scenarios . . . . . . . . . . . . . . . . . . . . . . . . . . . . . . . . . . . . . . 29
2
Abstract
The University of Toronto Human-Powered Vehicle Design Team will be submitting the V ortex
as an entry to compete in the Unlimited Class of this year’s ASME HPV Challenge. The team’s
goal is to design, build and test a high-performance race vehicle that is also functional as a form
of transportation. Specifically, the team has laid out three highly ambitious quantitative goals: to
improve each of the weight, aerodynamic drag and handling quality rating by a factor of 2 over last
year’s highly-successful entry.
The configuration of choice is a front-wheel drive, monocoque-shell, similar to that of the previ-
ous year. However, a variety of innovative design features make the new V ortex a vastly different
vehicle. These include a body designed for 50% laminar flow with a simple and robust entry/exit
method, a 3-point removable drive train for ease of maintenance and increased stiffness, an aero-
dynamically sealed cabin, a modular cargo system, a retractable landing gear, a roll-cage that is
fully integrated into the aerodynamic shell, as well as lights, aerodynamic mirrors and a multitude
of features for increased utility.
In depth analysis was performed on the handling of the vehicle as well as the aerodynamic design
and the structural design of the monocoque shell. Testing was performed to determine rider con-
figuration, material properties of various carbon fibre samples, the drag reduction obtained using
several new aerodynamic features, and the best configuration for the landing gear. Construction
of the vehicle is well under way, with the monocoque shell nearly complete and ready for final
assembly. The combination of analysis and testing demonstrates a high probability that the team
will achieve its stated objective of half the weight, half the drag, twice the handling, and infinitely
more utility.
1 Innovation and Design
1.1 Design Objective and Product Specifications
Design Objective
Vortex is designed as a modular system that can be configured for both high-performance racing
and as a practical form of transportation. It’s race circuit includes top-speed, endurance and utility
events at the ASME HPV Challenge, Human-Powered Race America series and the Human-Powered
Speed Challenge at Battle Mountain. Its practical transport applications include urban commuting
and longer-distance inter-city travel. Given the described scope, the team’s 2011 mission statement
is:
To design, construct and test a high-performance human-powered race vehicle that, when appropriately modi-
fied, can also be used for practical transportation. As an improvement over the 2010 ACE, the specific design
objectives are to achieve half the weight (M < 17kg), half the aerodynamic drag (CDA < 0.027), and half the
Cooper-Harper Handling Qualities Rating (HQR < 3), while adding a variety of functional utility features.
Due to the wide range of applications, the team’s primary focus will be on innovative design solutions that
3
do not compromise the vehicle’s race performance, safety or utility.
Design criteria and product design specifications
Success of the design will be evaluated based on three quantitative criteria: weight, which is easily
measured; aerodynamic drag, measured using deceleration testing described in section 3.5; and
handling qualities, measured using the NASA-developed Cooper-Harper Handling Qualities Rating
[7]. Additionally, success will be measured by its ability to meet utility and safety goals, encapsu-
lated in the design constraints below, and evaluated on a pass-fail basis.
Solo Operation Easy ingress and egress
Free-standing when parked, starting and stopping
Safety Rollover and side protection (top load > 600 lbs, side load > 300 lbs)
4-point safety harness
Safe internal environment
Rider skid protection
Manoeuvrability Turn radius < 25 ft
Brake from 15 to 0 mph in < 20 ft
Two independent braking systems
Visibility 180◦ field of view
Adequate front view
Mirrors for adequate rear view
Utility Storage for 1 gallon container and 15”h × 13”w × 8”d grocery bag
Head/tail light, bell or horn, front/rear/side reflectors
Mudguards or spray protection
Theft protection
Power Delivery Uninhibited pedal stroke
1.2 Evaluation of the current state of the art
Extensive background research was performed on the current state of the art in the four categories
that correspond to team’s primary design goals. In each category the top bikes were sought out,
as in most cases, direct contact was made with the designers in order to gain greater insight into
specific design and construction details.
Most aerodynamic: Currently the fastest bike in the world, the Varna Diablo boasts superb
aerodynamics, primarily through smooth flowing curves and an extremely tight fit to the rider,
made possible by meticulous placement and customization of internal components[6, 21]. Even
more advanced aerodynamic concepts are found in Matt Weaver’s series of speedbikes, including
an accoustically-damped 70% laminar flow fairing and pressure-sealed cabin[20].
Lightest: The lightest production bike frame, the Cervelo R5ca (675 g), achieves it’s required
strength from directionally-optimized carbon layup[1]. The Amanita Virosa is the lightest fully
faired recumbent at 11.5 kg, achieved through meticulous attention to weight at every step, a va-
riety of custom carbon-fibre parts and a monocoque carbon shell[14, 17].
Best handling qualities: Both the Raptobike [10] and the M5 city racer [11] have been described
4
as good beginner recumbents. Built to maneuver in a city environement, they achieve their han-
dling qualities through effective choice of centre-of-gravity location, head-tube angle, wheelbase
and trail.
Most functional: One of the best selling velomobiles is the Quest, with ample cargo space, easy
entry and exit and full-body suspension[9]. The configuration is designed to simplify common tasks
such as loading, backing up and free-standing.
1.3 Evaluation of design alternatives
General Configuration
Last year an extensive study was conducted on the benefits of various configurations, including
front-wheel vs. rear-wheel drive, front-wheel vs. rear-wheel steering and tubular frame vs. integrated
monocoque structure. It was concluded that a front-wheel drive, monocoque structure resulted in
the lightest, most durable and most efficient design. This year the team decided to keep with the
same general configuration knowing that there is still room for extensive design innovations and
improvements.
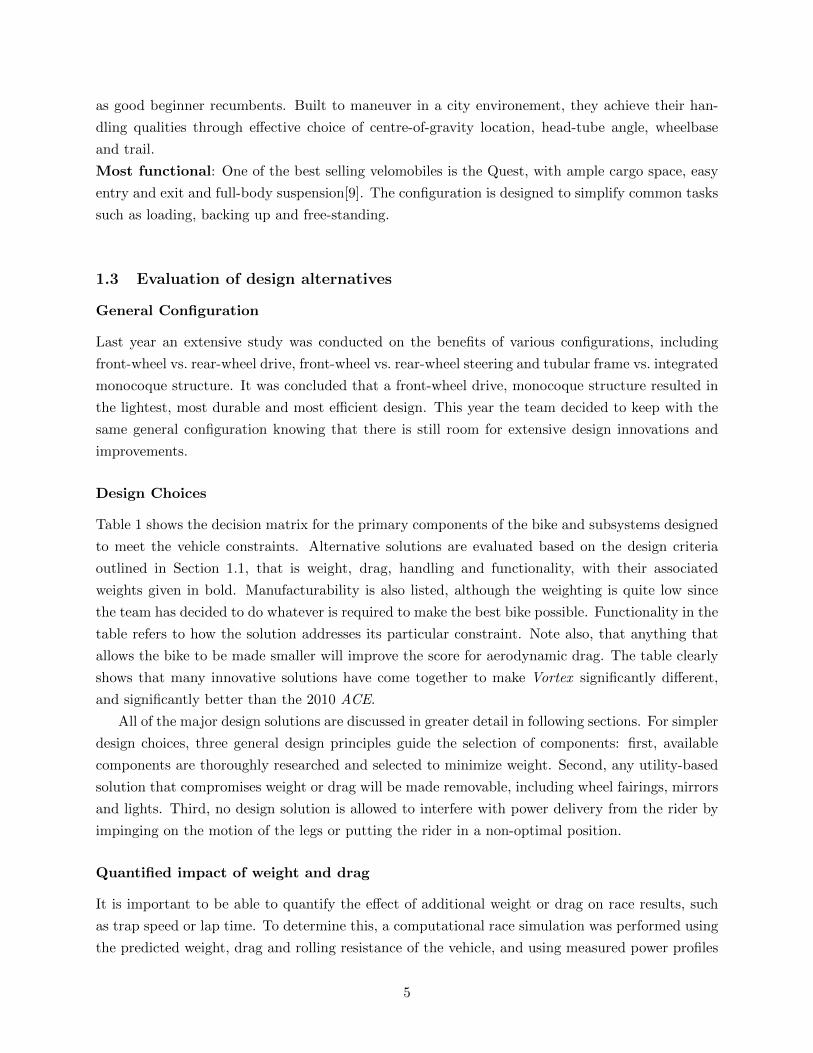
Design Choices
Table 1 shows the decision matrix for the primary components of the bike and subsystems designed
to meet the vehicle constraints. Alternative solutions are evaluated based on the design criteria
outlined in Section 1.1, that is weight, drag, handling and functionality, with their associated
weights given in bold. Manufacturability is also listed, although the weighting is quite low since
the team has decided to do whatever is required to make the best bike possible. Functionality in the
table refers to how the solution addresses its particular constraint. Note also, that anything that
allows the bike to be made smaller will improve the score for aerodynamic drag. The table clearly
shows that many innovative solutions have come together to make Vortex significantly different,
and significantly better than the 2010 ACE.
All of the major design solutions are discussed in greater detail in following sections. For simpler
design choices, three general design principles guide the selection of components: first, available
components are thoroughly researched and selected to minimize weight. Second, any utility-based
solution that compromises weight or drag will be made removable, including wheel fairings, mirrors
and lights. Third, no design solution is allowed to interfere with power delivery from the rider by
impinging on the motion of the legs or putting the rider in a non-optimal position.
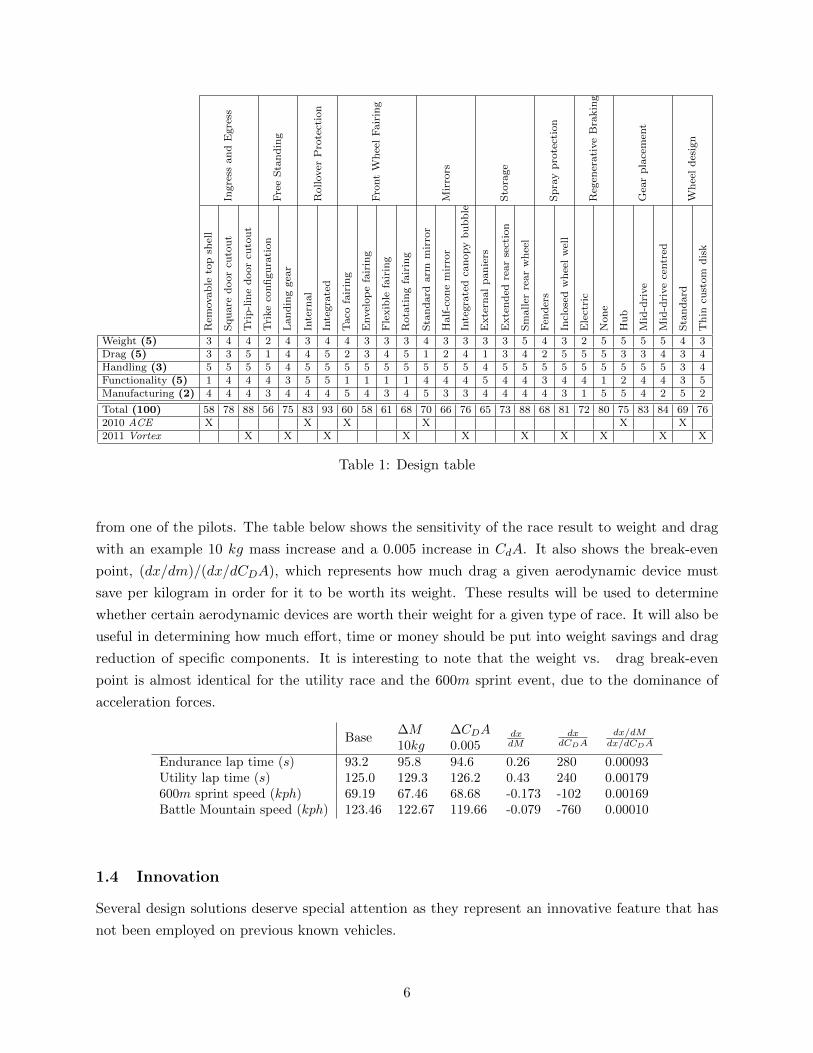
Quantified impact of weight and drag
It is important to be able to quantify the effect of additional weight or drag on race results, such
as trap speed or lap time. To determine this, a computational race simulation was performed using
the predicted weight, drag and rolling resistance of the vehicle, and using measured power profiles
5
IngressandEgress
FreeStanding
RolloverProtection
FrontW
heelFairing
Mirrors
Storage
Sprayprotection
RegenerativeBraking
Gearplacement
Wheeldesign
Removable
topshell
Squaredoorcutout
Trip-linedoorcutout
Trikeconfiguration
Landinggear
Internal
Integrated
Tacofairing
Envelopefairing
Flexible
fairing
Rotatingfairing
Standardarm
mirror
Half-conemirror
Integratedcanopybubble
Externalpaniers
Extendedrearsection
Smallerrearwheel
Fenders
Inclosedwheelwell
Electric
None
Hub
Mid-drive
Mid-drivecentred
Standard
Thin
custom
disk
Weight (5) 3 4 4 2 4 3 4 4 3 3 3 4 3 3 3 3 5 4 3 2 5 5 5 5 4 3
Drag (5) 3 3 5 1 4 4 5 2 3 4 5 1 2 4 1 3 4 2 5 5 5 3 3 4 3 4
Handling (3) 5 5 5 5 4 5 5 5 5 5 5 5 5 5 4 5 5 5 5 5 5 5 5 5 3 4
Functionality (5) 1 4 4 4 3 5 5 1 1 1 1 4 4 4 5 4 4 3 4 4 1 2 4 4 3 5
Manufacturing (2) 4 4 4 3 4 4 4 5 4 3 4 5 3 3 4 4 4 4 3 1 5 5 4 2 5 2
Total (100) 58 78 88 56 75 83 93 60 58 61 68 70 66 76 65 73 88 68 81 72 80 75 83 84 69 76
2010 ACE X X X X X X
2011 Vortex X X X X X X X X X X
Table 1: Design table
from one of the pilots. The table below shows the sensitivity of the race result to weight and drag
with an example 10 kg mass increase and a 0.005 increase in CdA. It also shows the break-even
point, (dx/dm)/(dx/dCDA), which represents how much drag a given aerodynamic device must
save per kilogram in order for it to be worth its weight. These results will be used to determine
whether certain aerodynamic devices are worth their weight for a given type of race. It will also be
useful in determining how much effort, time or money should be put into weight savings and drag
reduction of specific components. It is interesting to note that the weight vs. drag break-even
point is almost identical for the utility race and the 600m sprint event, due to the dominance of
acceleration forces.
Base∆M ∆CDA dx
dMdx
dCDAdx/dM
dx/dCDA10kg 0.005Endurance lap time (s) 93.2 95.8 94.6 0.26 280 0.00093Utility lap time (s) 125.0 129.3 126.2 0.43 240 0.00179600m sprint speed (kph) 69.19 67.46 68.68 -0.173 -102 0.00169Battle Mountain speed (kph) 123.46 122.67 119.66 -0.079 -760 0.00010
1.4 Innovation
Several design solutions deserve special attention as they represent an innovative feature that has
not been employed on previous known vehicles.
6
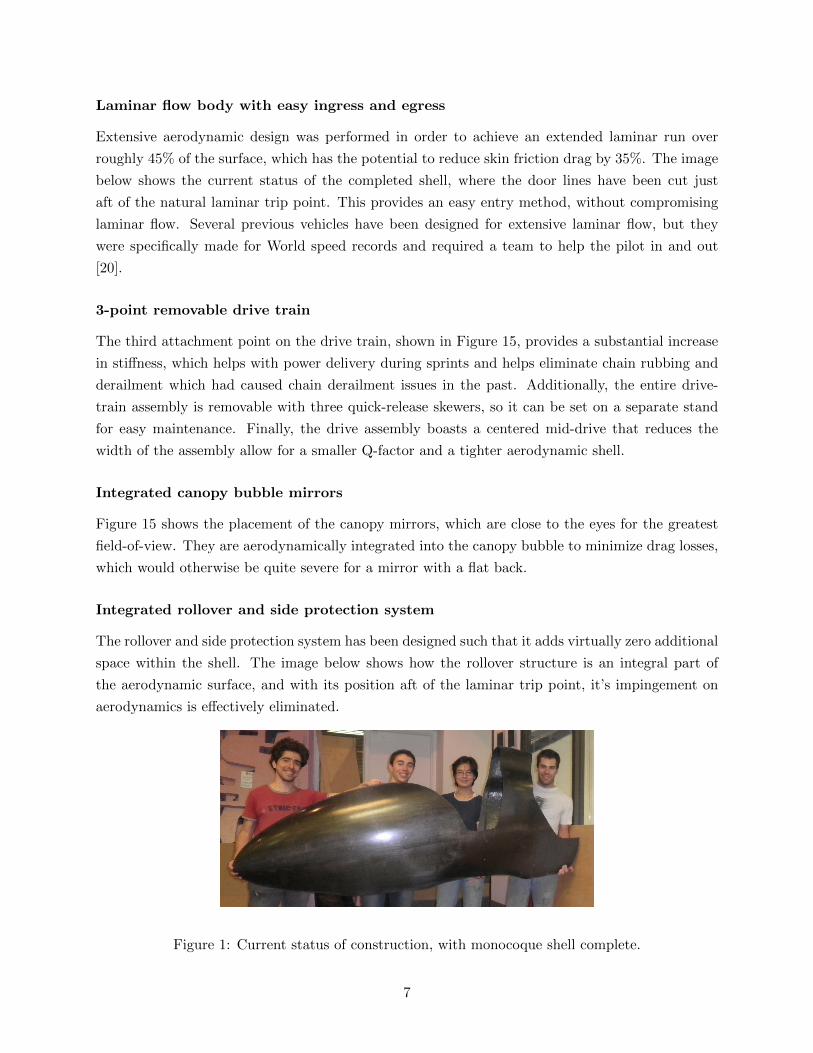
Laminar flow body with easy ingress and egress
Extensive aerodynamic design was performed in order to achieve an extended laminar run over
roughly 45% of the surface, which has the potential to reduce skin friction drag by 35%. The image
below shows the current status of the completed shell, where the door lines have been cut just
aft of the natural laminar trip point. This provides an easy entry method, without compromising
laminar flow. Several previous vehicles have been designed for extensive laminar flow, but they
were specifically made for World speed records and required a team to help the pilot in and out
[20].
3-point removable drive train
The third attachment point on the drive train, shown in Figure 15, provides a substantial increase
in stiffness, which helps with power delivery during sprints and helps eliminate chain rubbing and
derailment which had caused chain derailment issues in the past. Additionally, the entire drive-
train assembly is removable with three quick-release skewers, so it can be set on a separate stand
for easy maintenance. Finally, the drive assembly boasts a centered mid-drive that reduces the
width of the assembly allow for a smaller Q-factor and a tighter aerodynamic shell.
Integrated canopy bubble mirrors
Figure 15 shows the placement of the canopy mirrors, which are close to the eyes for the greatest
field-of-view. They are aerodynamically integrated into the canopy bubble to minimize drag losses,
which would otherwise be quite severe for a mirror with a flat back.
Integrated rollover and side protection system
The rollover and side protection system has been designed such that it adds virtually zero additional
space within the shell. The image below shows how the rollover structure is an integral part of
the aerodynamic surface, and with its position aft of the laminar trip point, it’s impingement on
aerodynamics is effectively eliminated.
Figure 1: Current status of construction, with monocoque shell complete.
7
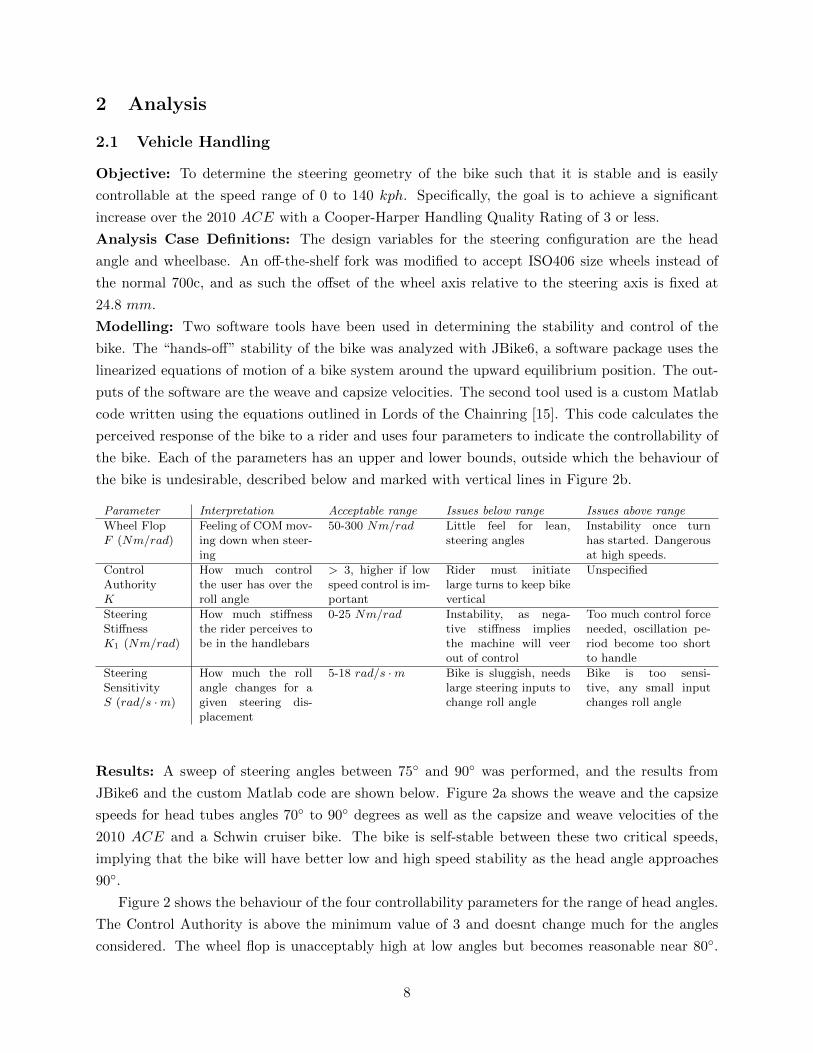
2 Analysis
2.1 Vehicle Handling
Objective: To determine the steering geometry of the bike such that it is stable and is easily
controllable at the speed range of 0 to 140 kph. Specifically, the goal is to achieve a significant
increase over the 2010 ACE with a Cooper-Harper Handling Quality Rating of 3 or less.
Analysis Case Definitions: The design variables for the steering configuration are the head
angle and wheelbase. An off-the-shelf fork was modified to accept ISO406 size wheels instead of
the normal 700c, and as such the offset of the wheel axis relative to the steering axis is fixed at
24.8 mm.
Modelling: Two software tools have been used in determining the stability and control of the
bike. The “hands-off” stability of the bike was analyzed with JBike6, a software package uses the
linearized equations of motion of a bike system around the upward equilibrium position. The out-
puts of the software are the weave and capsize velocities. The second tool used is a custom Matlab
code written using the equations outlined in Lords of the Chainring [15]. This code calculates the
perceived response of the bike to a rider and uses four parameters to indicate the controllability of
the bike. Each of the parameters has an upper and lower bounds, outside which the behaviour of
the bike is undesirable, described below and marked with vertical lines in Figure 2b.
Parameter Interpretation Acceptable range Issues below range Issues above range
Wheel FlopF (Nm/rad)
Feeling of COM mov-ing down when steer-ing
50-300 Nm/rad Little feel for lean,steering angles
Instability once turnhas started. Dangerousat high speeds.
ControlAuthorityK
How much controlthe user has over theroll angle
> 3, higher if lowspeed control is im-portant
Rider must initiatelarge turns to keep bikevertical
Unspecified
SteeringStiffnessK1 (Nm/rad)
How much stiffnessthe rider perceives tobe in the handlebars
0-25 Nm/rad Instability, as nega-tive stiffness impliesthe machine will veerout of control
Too much control forceneeded, oscillation pe-riod become too shortto handle
SteeringSensitivityS (rad/s ·m)
How much the rollangle changes for agiven steering dis-placement
5-18 rad/s ·m Bike is sluggish, needslarge steering inputs tochange roll angle
Bike is too sensi-tive, any small inputchanges roll angle
Results: A sweep of steering angles between 75◦ and 90◦ was performed, and the results from
JBike6 and the custom Matlab code are shown below. Figure 2a shows the weave and the capsize
speeds for head tubes angles 70◦ to 90◦ degrees as well as the capsize and weave velocities of the
2010 ACE and a Schwin cruiser bike. The bike is self-stable between these two critical speeds,
implying that the bike will have better low and high speed stability as the head angle approaches
90◦.
Figure 2 shows the behaviour of the four controllability parameters for the range of head angles.
The Control Authority is above the minimum value of 3 and doesnt change much for the angles
considered. The wheel flop is unacceptably high at low angles but becomes reasonable near 80◦.
8
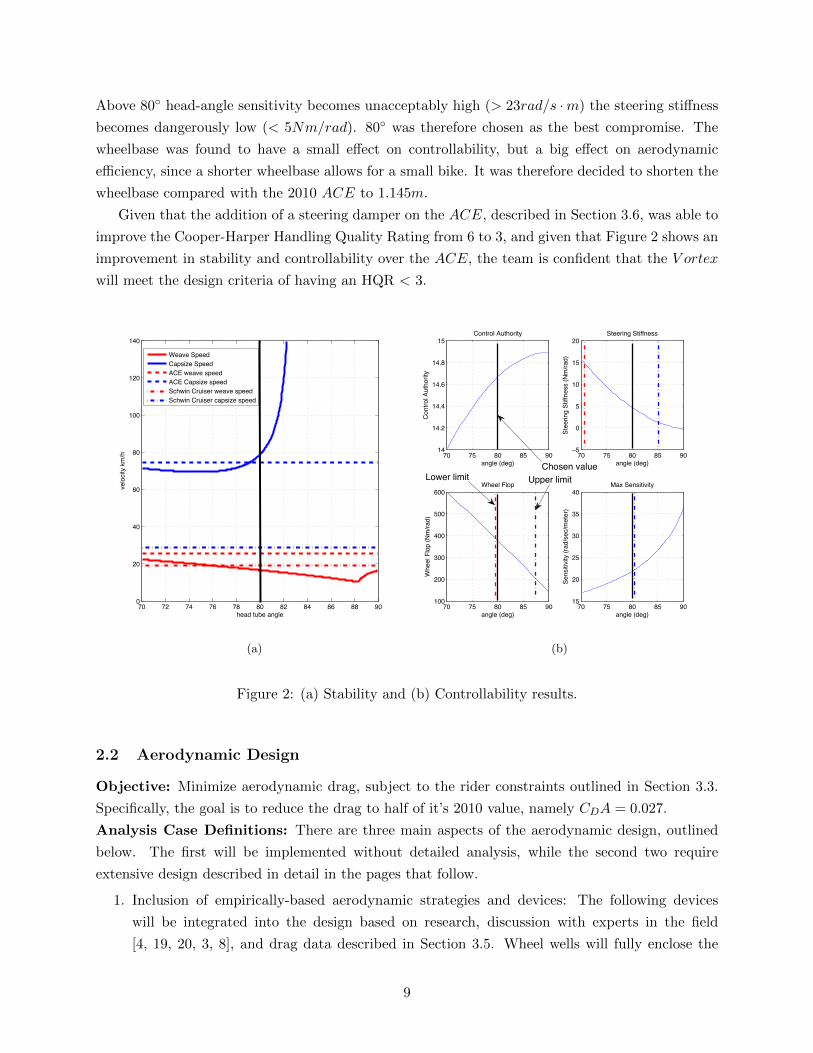
Above 80◦ head-angle sensitivity becomes unacceptably high (> 23rad/s ·m) the steering stiffness
becomes dangerously low (< 5Nm/rad). 80◦ was therefore chosen as the best compromise. The
wheelbase was found to have a small effect on controllability, but a big effect on aerodynamic
efficiency, since a shorter wheelbase allows for a small bike. It was therefore decided to shorten the
wheelbase compared with the 2010 ACE to 1.145m.
Given that the addition of a steering damper on the ACE, described in Section 3.6, was able to
improve the Cooper-Harper Handling Quality Rating from 6 to 3, and given that Figure 2 shows an
improvement in stability and controllability over the ACE, the team is confident that the V ortex
will meet the design criteria of having an HQR < 3.
70 72 74 76 78 80 82 84 86 88 900
20
40
60
80
100
120
140
velo
city
km
/h
head tube angle
Weave SpeedCapsize SpeedACE weave speedACE Capsize speedSchwin Cruiser weave speedSchwin Cruiser capsize speed
(a)
70 75 80 85 9014
14.2
14.4
14.6
14.8
15
angle (deg)
Con
trol A
utho
rity
Control Authority
70 75 80 85 905
0
5
10
15
20
angle (deg)
Ste
erin
g S
tiffn
ess
(Nm
/rad)
Steering Stiffness
70 75 80 85 90100
200
300
400
500
600
angle (deg)
Whe
el F
lop
(Nm
/rad)
Wheel Flop
70 75 80 85 9015
20
25
30
35
40
angle (deg)
Sen
sitiv
ity (r
ad/s
ec/m
eter
)
Max SensitivityUpper limitLower limit
Chosen value
(b)
Figure 2: (a) Stability and (b) Controllability results.
2.2 Aerodynamic Design
Objective: Minimize aerodynamic drag, subject to the rider constraints outlined in Section 3.3.
Specifically, the goal is to reduce the drag to half of it’s 2010 value, namely CDA = 0.027.
Analysis Case Definitions: There are three main aspects of the aerodynamic design, outlined
below. The first will be implemented without detailed analysis, while the second two require
extensive design described in detail in the pages that follow.
1. Inclusion of empirically-based aerodynamic strategies and devices: The following devices
will be integrated into the design based on research, discussion with experts in the field
[4, 19, 20, 3, 8], and drag data described in Section 3.5. Wheel wells will fully enclose the
9
wheels to reduce centrifugal pump losses; wheel fairings with an appropriate leading-edge
fillet will eliminate horse-shoe separation; filleted corners will reduce junction drag; smooth
changes in curvature will reduce flow overspeeds; a fully sealed cabin will reduce internal
flows; ventilation entry at the high-pressure canopy region and exit at low-pressure trailing
edge, with appropriate divergence and convergence nozzles, will minimize ventilation drag.
2. Design of a robust, laminar boundary layer: Given that laminar boundary layer has 90%
less drag than a turbulent one [8, 19], pressure profiles on the front half of the vehicle will be
designed to support an extended laminar run that is robust to cross-winds and road vibration.
3. Design of a minimum-drag pressure recovery curve: In the pressure recovery region, beyond
the rider’s shoulders, the curvature should be designed to allow for the shortest possible tail,
while preventing flow separation.
Modelling: FlowWorks is a low-level CFD package that is fully integrated into SolidWorks, the
team’s choice of CAD software. It can be used to generate pressure profiles along the streamlines,
but as a low-level package it is not accurate in resolving boundary-layer transition or flow separation.
Knowing the pressure profile along various streamlines, however, XFOIL, a highly-accurate low-
speed 2D flow solver, will be used to predict transition and adjust the pressure profiles appropriately.
Separation on the aft portion of the vehicle will be predicted with the Stratford turbulent separation
criteria, which states that separation will occur when Cp�x�dCp/dx
��1/2 �10−6
Re�−1/10
> 0.35,
where x is the distance along the chord, Re is the Reynolds number and Cp = (Cp − Cp,min) / (1− Cp,min)
is the canonical pressure coefficient [18]. The Stratford criteria is extremely useful in designing the
pressure recovery because it determines exactly how close the flow is to separating at any given
point. The ideal Stratford recovery curve is one where the flow is equally close to separating along
the entire pressure recovery region, which leads to the shortest possible tail and the lowest theo-
retical drag.
Robust natural boundary layer design and results: Based on the aerodynamic strategies
outlined above and an intuitive understanding of how the pressure profile affects boundary layer
transition, a first iteration fairing shape was created. The pressure profile along the side of the
vehicle was used to create an “equivalent” 2D airfoil in XFOIL, which could then be modified to
produce a profile that extends the laminar run while being resistant to road vibrations and cross-
winds. A value of Ncrit = 0.25 was used in XFOIL to simulate bypass transition caused by road
vibration or surface imperfections [5], and the Reynolds number was set to the highest conceiv-
able value of 6x10⁶, in order to simulate the most challenging scenario for maintaining a laminar
boundary layer.
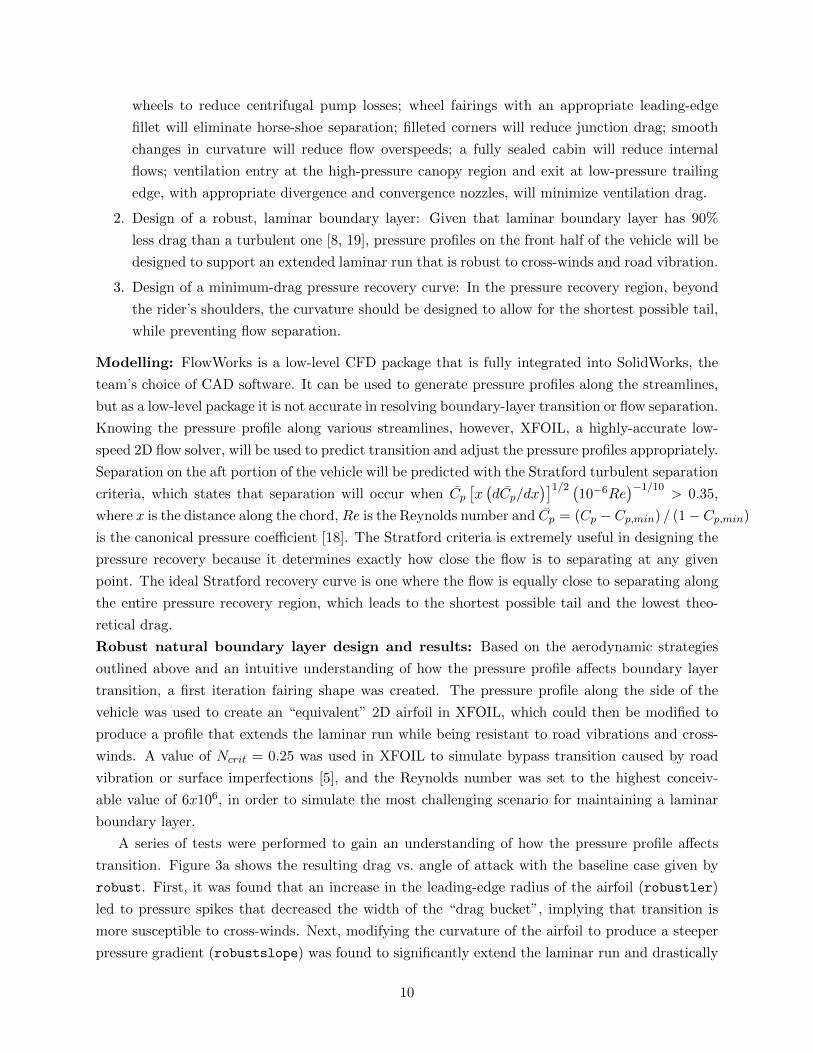
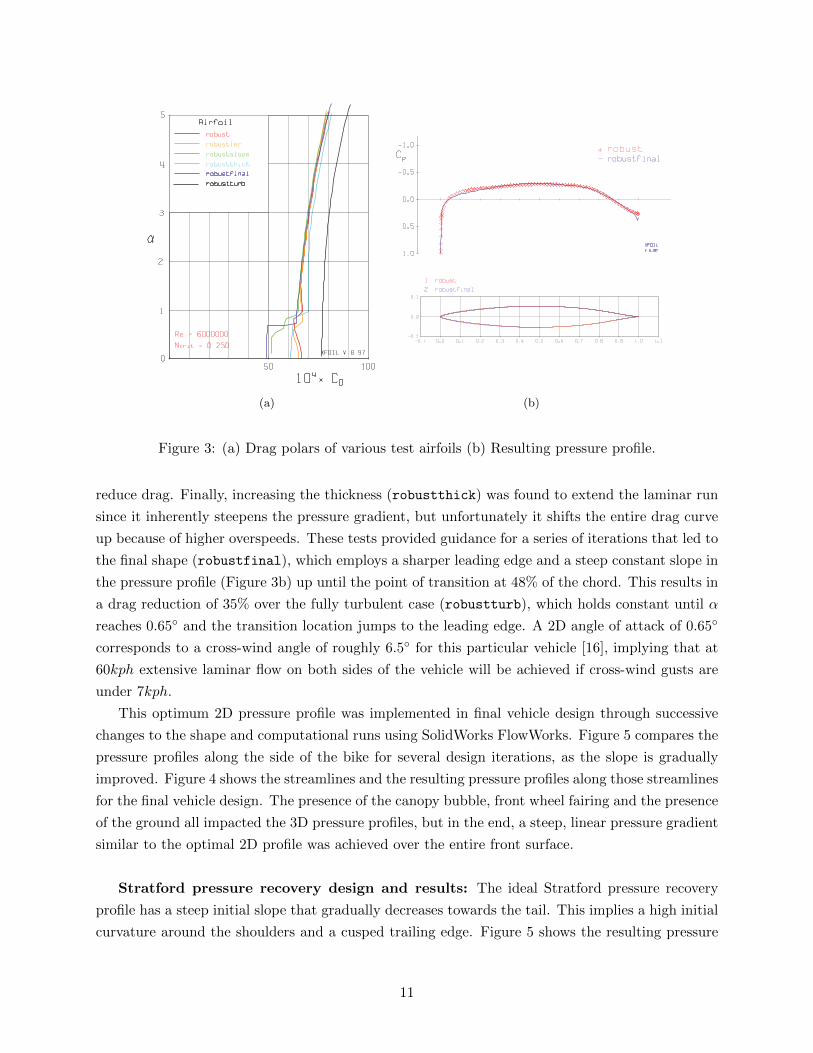
A series of tests were performed to gain an understanding of how the pressure profile affects
transition. Figure 3a shows the resulting drag vs. angle of attack with the baseline case given by
robust. First, it was found that an increase in the leading-edge radius of the airfoil (robustler)
led to pressure spikes that decreased the width of the “drag bucket”, implying that transition is
more susceptible to cross-winds. Next, modifying the curvature of the airfoil to produce a steeper
pressure gradient (robustslope) was found to significantly extend the laminar run and drastically
10
(a) (b)
Figure 3: (a) Drag polars of various test airfoils (b) Resulting pressure profile.
reduce drag. Finally, increasing the thickness (robustthick) was found to extend the laminar run
since it inherently steepens the pressure gradient, but unfortunately it shifts the entire drag curve
up because of higher overspeeds. These tests provided guidance for a series of iterations that led to
the final shape (robustfinal), which employs a sharper leading edge and a steep constant slope in
the pressure profile (Figure 3b) up until the point of transition at 48% of the chord. This results in
a drag reduction of 35% over the fully turbulent case (robustturb), which holds constant until α
reaches 0.65◦ and the transition location jumps to the leading edge. A 2D angle of attack of 0.65◦
corresponds to a cross-wind angle of roughly 6.5◦ for this particular vehicle [16], implying that at
60kph extensive laminar flow on both sides of the vehicle will be achieved if cross-wind gusts are
under 7kph.
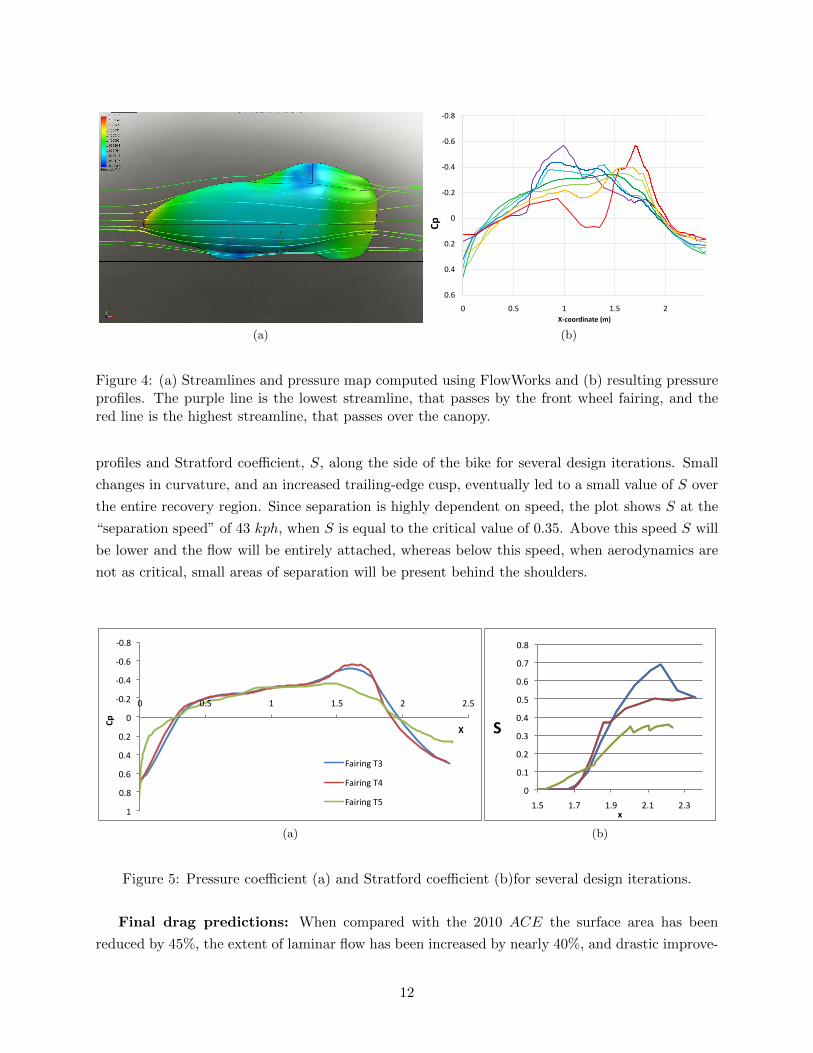
This optimum 2D pressure profile was implemented in final vehicle design through successive
changes to the shape and computational runs using SolidWorks FlowWorks. Figure 5 compares the
pressure profiles along the side of the bike for several design iterations, as the slope is gradually
improved. Figure 4 shows the streamlines and the resulting pressure profiles along those streamlines
for the final vehicle design. The presence of the canopy bubble, front wheel fairing and the presence
of the ground all impacted the 3D pressure profiles, but in the end, a steep, linear pressure gradient
similar to the optimal 2D profile was achieved over the entire front surface.
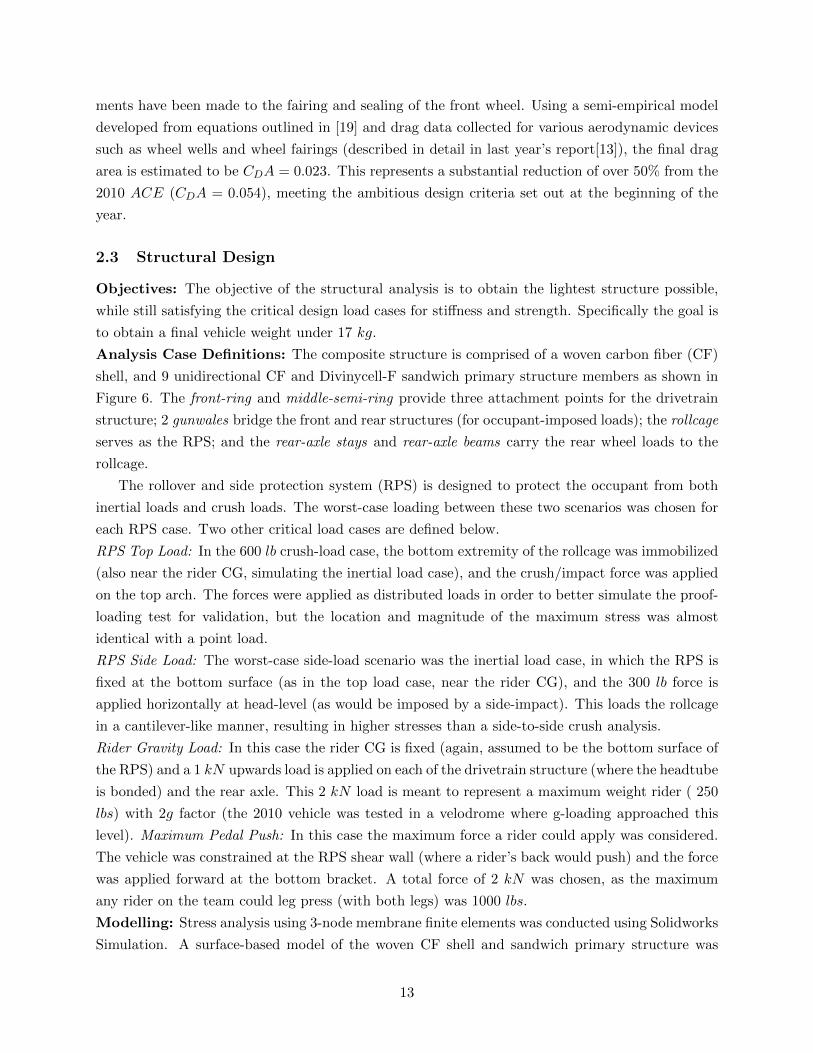
Stratford pressure recovery design and results: The ideal Stratford pressure recovery
profile has a steep initial slope that gradually decreases towards the tail. This implies a high initial
curvature around the shoulders and a cusped trailing edge. Figure 5 shows the resulting pressure
11
(a)
-‐0.8
-‐0.6
-‐0.4
-‐0.2
0
0.2
0.4
0.6
0 0.5 1 1.5 2
Cp
X-‐coordinate (m)
(b)
Figure 4: (a) Streamlines and pressure map computed using FlowWorks and (b) resulting pressureprofiles. The purple line is the lowest streamline, that passes by the front wheel fairing, and thered line is the highest streamline, that passes over the canopy.
profiles and Stratford coefficient, S, along the side of the bike for several design iterations. Small
changes in curvature, and an increased trailing-edge cusp, eventually led to a small value of S over
the entire recovery region. Since separation is highly dependent on speed, the plot shows S at the
“separation speed” of 43 kph, when S is equal to the critical value of 0.35. Above this speed S will
be lower and the flow will be entirely attached, whereas below this speed, when aerodynamics are
not as critical, small areas of separation will be present behind the shoulders.
!"#$%
!"#&%
!"#'%
!"#(%
"%
"#(%
"#'%
"#&%
"#$%
)%
"% "#*% )% )#*% (% (#*%
!"#
$#
+,-.-/0%12%
+,-.-/0%1'%
+,-.-/0%1*%
(a)
!"
!#$"
!#%"
!#&"
!#'"
!#("
!#)"
!#*"
!#+"
$#(" $#*" $#," %#$" %#&"!"
#"
(b)
Figure 5: Pressure coefficient (a) and Stratford coefficient (b)for several design iterations.
Final drag predictions: When compared with the 2010 ACE the surface area has been
reduced by 45%, the extent of laminar flow has been increased by nearly 40%, and drastic improve-
12
ments have been made to the fairing and sealing of the front wheel. Using a semi-empirical model
developed from equations outlined in [19] and drag data collected for various aerodynamic devices
such as wheel wells and wheel fairings (described in detail in last year’s report[13]), the final drag
area is estimated to be CDA = 0.023. This represents a substantial reduction of over 50% from the
2010 ACE (CDA = 0.054), meeting the ambitious design criteria set out at the beginning of the
year.
2.3 Structural Design
Objectives: The objective of the structural analysis is to obtain the lightest structure possible,
while still satisfying the critical design load cases for stiffness and strength. Specifically the goal is
to obtain a final vehicle weight under 17 kg.
Analysis Case Definitions: The composite structure is comprised of a woven carbon fiber (CF)
shell, and 9 unidirectional CF and Divinycell-F sandwich primary structure members as shown in
Figure 6. The front-ring and middle-semi-ring provide three attachment points for the drivetrain
structure; 2 gunwales bridge the front and rear structures (for occupant-imposed loads); the rollcage
serves as the RPS; and the rear-axle stays and rear-axle beams carry the rear wheel loads to the
rollcage.
The rollover and side protection system (RPS) is designed to protect the occupant from both
inertial loads and crush loads. The worst-case loading between these two scenarios was chosen for
each RPS case. Two other critical load cases are defined below.
RPS Top Load: In the 600 lb crush-load case, the bottom extremity of the rollcage was immobilized
(also near the rider CG, simulating the inertial load case), and the crush/impact force was applied
on the top arch. The forces were applied as distributed loads in order to better simulate the proof-
loading test for validation, but the location and magnitude of the maximum stress was almost
identical with a point load.
RPS Side Load: The worst-case side-load scenario was the inertial load case, in which the RPS is
fixed at the bottom surface (as in the top load case, near the rider CG), and the 300 lb force is
applied horizontally at head-level (as would be imposed by a side-impact). This loads the rollcage
in a cantilever-like manner, resulting in higher stresses than a side-to-side crush analysis.
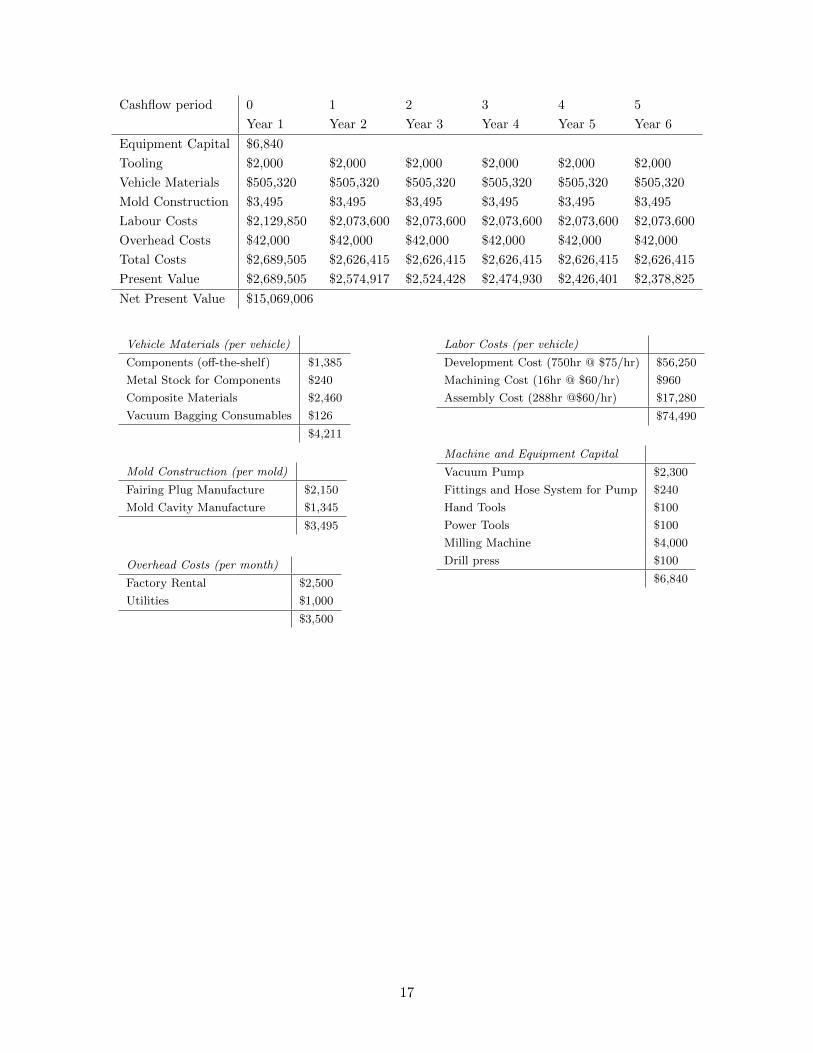
Rider Gravity Load: In this case the rider CG is fixed (again, assumed to be the bottom surface of
the RPS) and a 1 kN upwards load is applied on each of the drivetrain structure (where the headtube
is bonded) and the rear axle. This 2 kN load is meant to represent a maximum weight rider ( 250
lbs) with 2g factor (the 2010 vehicle was tested in a velodrome where g-loading approached this
level). Maximum Pedal Push: In this case the maximum force a rider could apply was considered.
The vehicle was constrained at the RPS shear wall (where a rider’s back would push) and the force
was applied forward at the bottom bracket. A total force of 2 kN was chosen, as the maximum
any rider on the team could leg press (with both legs) was 1000 lbs.
Modelling: Stress analysis using 3-node membrane finite elements was conducted using Solidworks
Simulation. A surface-based model of the woven CF shell and sandwich primary structure was
13
generated, located as determined by the human model, wheel hardpoints, and drivetrain attachment
locations. A surface model allows for the most accurate composite laminate definition in Simulation.
The laminate properties were anisotropic, with the 0-direction (i.e. primary fiber direction) being
aligned with a) long-axis of the vehicle for the woven laminate, b) along the circumferential direction
of each of the three-hoop/semi-hoop structural reinforcements, and c) along the primary load
direction for the gunwale and rear axle truss. The material properties assigned were determined
from material testing data described in Section 3.2 and manufacturer testing properties. Fixed-
displacement constraints were applied to appropriate surface patches for each analysis, indicated
by green arrows in the resulting figures. Forces were applied as distributed loads on the appropriate
surfaces, indicated by purple arrows.
Design Modifications: The design was modified iteratively using the stress analysis (results
provided are with final structural design). The thicknesses of structural laminates were modified in
discrete plies: the woven material was a 5.0oz/yd2 plain-style CF with ply-thickness of .15mm, and
the unidirectional material was a 4.7oz/yd2 uni-tape with ply-thickness of .3mm. The sandwich-core
thickness was fixed at .5in, for maximum specific performance without intruding on the occupant
envelope in key areas. The baseline thickness for each member was based on the 2010 vehicle,
and optimized as follows. The woven shell laminate was initially reduced by 50% (to 2 plies), to
provide only aerodynamic fairing and structural stabilization. This resulted in FOSs being less
than 2 in some cases, whereas a shell thickness of 3 plies was sufficient. For primary structural
members, the laminate thickness was adjusted to optimize the worst-case FOS (3 in general for
manufacturing variability, but 5 for the RPS for maximum safety). A special case was the rider
gravity load case, which has a high FOS for the static load, but provides margin for the wheel
shock encountered in everyday riding. The drivetrain structure, floorboard, and RPS shear-wall
were each fabricated from aircraft sandwich panel (.4” honeycomb core with .014” woven CF faces)
for ease of manufacture. The shear wall is one panel thick (determined by load testing in 2010) and
the drivetrain structure varying between 2 and 4 layers as required for stiffness of the transmission
(to prevent chain-derailment). The floorboard is two panels thick to accommodate drivetrain
mounting hardware. The final material thicknesses were as follows (per sandwich face): the front
ring, gunwale, rear axle triangle-stay, and rear axle triangle-beam were all 3 plies, the RPS rollcage
was 4 plies, and the middle semi-ring was 2 plies.
Results: The stress field results were mapped as the worst-case von Mises stress across all plies of
the laminate. In each load case, the unidirectional sandwich primary structure and shell structure
were viewed for worst-case stress independently to ease identification of the highest-stress and
calculation of the Factor-of-Safety. See table 2 for results of finite-element analysis on the composite
shell and primary structure, with both stresses and FOSs compiled. Also, see figures 6, 7, 8, and
9 for primary structure and shell stress-maps for the RPS top load & side load, rider gravity load,
and max drive push cases respectively. The primary structure described above has recently been
completed at a total weight of 9.8 kg. The estimate for the remainder of the components based
on last year’s vehicle is 5 kg. This puts the total predicted weight at 14.8 kg, well below half the
14
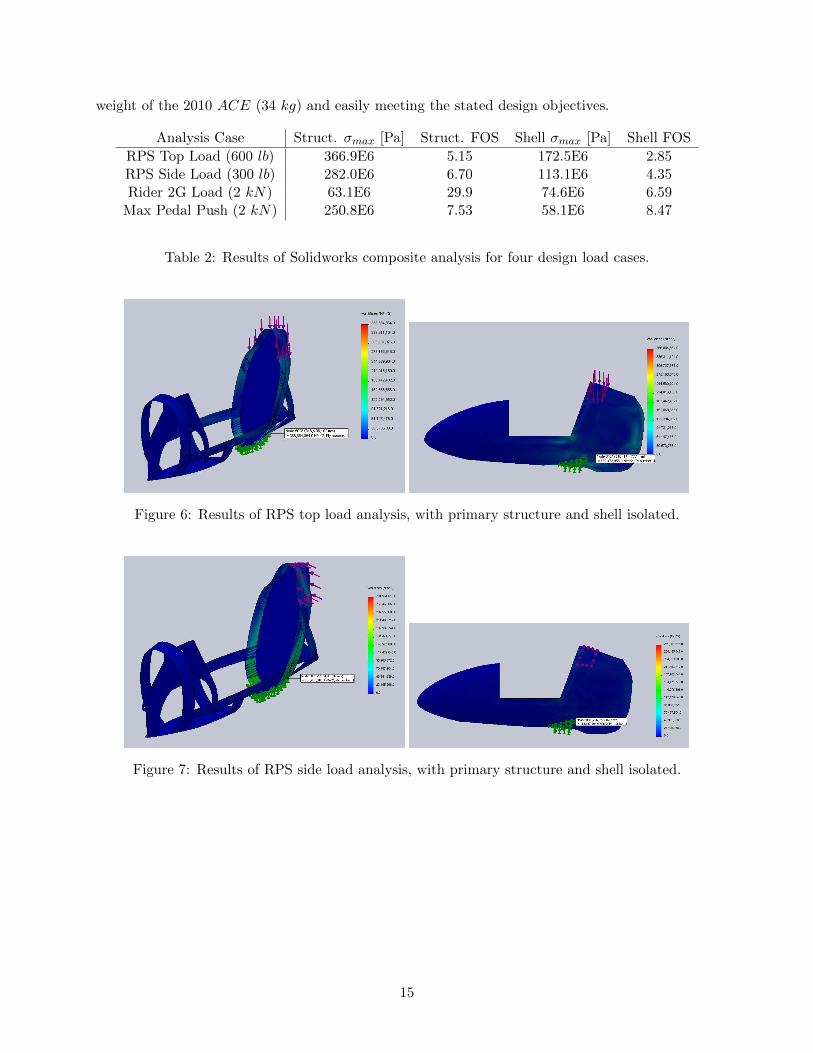
weight of the 2010 ACE (34 kg) and easily meeting the stated design objectives.
Analysis Case Struct. σmax [Pa] Struct. FOS Shell σmax [Pa] Shell FOSRPS Top Load (600 lb) 366.9E6 5.15 172.5E6 2.85RPS Side Load (300 lb) 282.0E6 6.70 113.1E6 4.35Rider 2G Load (2 kN) 63.1E6 29.9 74.6E6 6.59Max Pedal Push (2 kN) 250.8E6 7.53 58.1E6 8.47
Table 2: Results of Solidworks composite analysis for four design load cases.
Figure 6: Results of RPS top load analysis, with primary structure and shell isolated.
Figure 7: Results of RPS side load analysis, with primary structure and shell isolated.
15
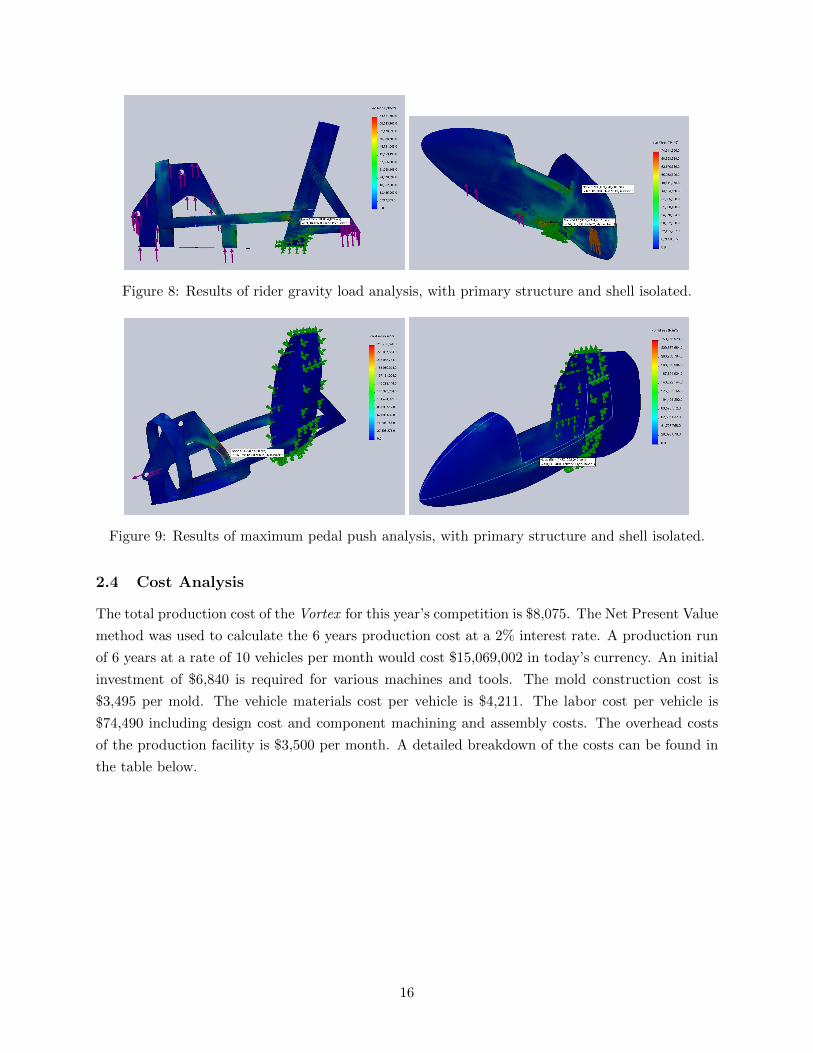
Figure 8: Results of rider gravity load analysis, with primary structure and shell isolated.
Figure 9: Results of maximum pedal push analysis, with primary structure and shell isolated.
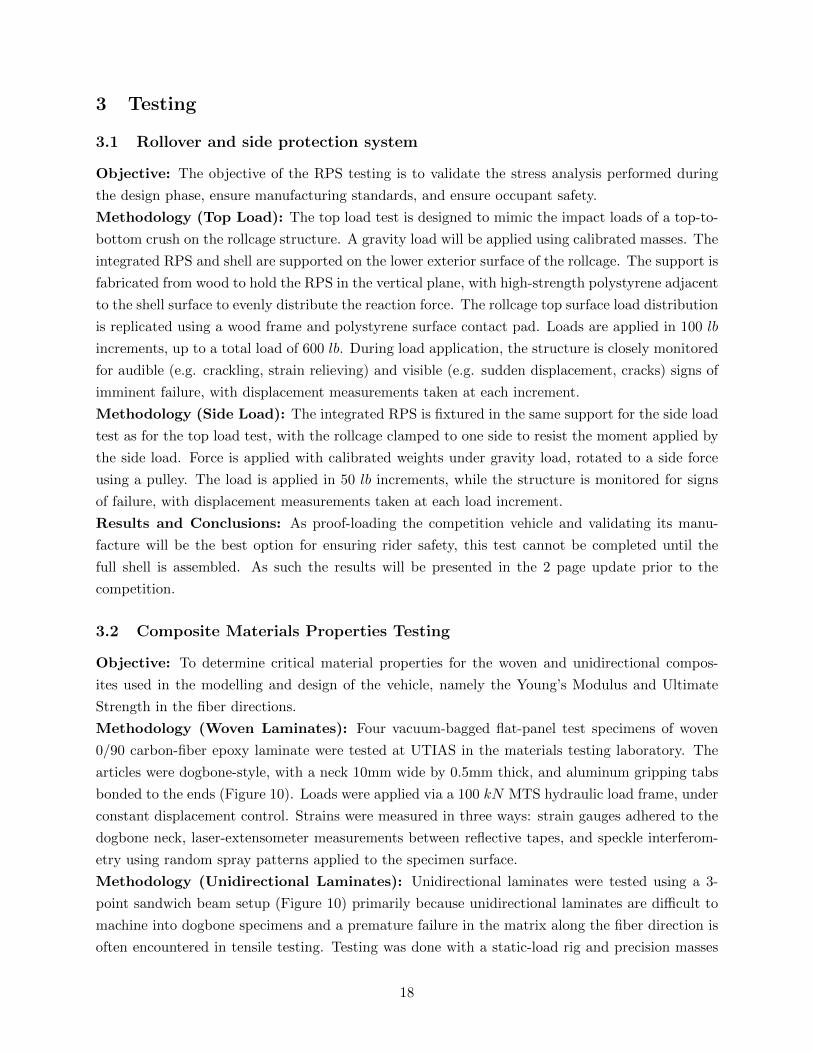
2.4 Cost Analysis
The total production cost of the Vortex for this year’s competition is $8,075. The Net Present Value
method was used to calculate the 6 years production cost at a 2% interest rate. A production run
of 6 years at a rate of 10 vehicles per month would cost $15,069,002 in today’s currency. An initial
investment of $6,840 is required for various machines and tools. The mold construction cost is
$3,495 per mold. The vehicle materials cost per vehicle is $4,211. The labor cost per vehicle is
$74,490 including design cost and component machining and assembly costs. The overhead costs
of the production facility is $3,500 per month. A detailed breakdown of the costs can be found in
the table below.
16
Cashflow period 0 1 2 3 4 5
Year 1 Year 2 Year 3 Year 4 Year 5 Year 6
Equipment Capital $6,840
Tooling $2,000 $2,000 $2,000 $2,000 $2,000 $2,000
Vehicle Materials $505,320 $505,320 $505,320 $505,320 $505,320 $505,320
Mold Construction $3,495 $3,495 $3,495 $3,495 $3,495 $3,495
Labour Costs $2,129,850 $2,073,600 $2,073,600 $2,073,600 $2,073,600 $2,073,600
Overhead Costs $42,000 $42,000 $42,000 $42,000 $42,000 $42,000
Total Costs $2,689,505 $2,626,415 $2,626,415 $2,626,415 $2,626,415 $2,626,415
Present Value $2,689,505 $2,574,917 $2,524,428 $2,474,930 $2,426,401 $2,378,825
Net Present Value $15,069,006
Vehicle Materials (per vehicle)
Components (off-the-shelf) $1,385
Metal Stock for Components $240
Composite Materials $2,460
Vacuum Bagging Consumables $126
$4,211
Mold Construction (per mold)
Fairing Plug Manufacture $2,150
Mold Cavity Manufacture $1,345
$3,495
Overhead Costs (per month)
Factory Rental $2,500
Utilities $1,000
$3,500
Labor Costs (per vehicle)
Development Cost (750hr @ $75/hr) $56,250
Machining Cost (16hr @ $60/hr) $960
Assembly Cost (288hr @$60/hr) $17,280
$74,490
Machine and Equipment Capital
Vacuum Pump $2,300
Fittings and Hose System for Pump $240
Hand Tools $100
Power Tools $100
Milling Machine $4,000
Drill press $100
$6,840
17
3 Testing
3.1 Rollover and side protection system
Objective: The objective of the RPS testing is to validate the stress analysis performed during
the design phase, ensure manufacturing standards, and ensure occupant safety.
Methodology (Top Load): The top load test is designed to mimic the impact loads of a top-to-
bottom crush on the rollcage structure. A gravity load will be applied using calibrated masses. The
integrated RPS and shell are supported on the lower exterior surface of the rollcage. The support is
fabricated from wood to hold the RPS in the vertical plane, with high-strength polystyrene adjacent
to the shell surface to evenly distribute the reaction force. The rollcage top surface load distribution
is replicated using a wood frame and polystyrene surface contact pad. Loads are applied in 100 lb
increments, up to a total load of 600 lb. During load application, the structure is closely monitored
for audible (e.g. crackling, strain relieving) and visible (e.g. sudden displacement, cracks) signs of
imminent failure, with displacement measurements taken at each increment.
Methodology (Side Load): The integrated RPS is fixtured in the same support for the side load
test as for the top load test, with the rollcage clamped to one side to resist the moment applied by
the side load. Force is applied with calibrated weights under gravity load, rotated to a side force
using a pulley. The load is applied in 50 lb increments, while the structure is monitored for signs
of failure, with displacement measurements taken at each load increment.
Results and Conclusions: As proof-loading the competition vehicle and validating its manu-
facture will be the best option for ensuring rider safety, this test cannot be completed until the
full shell is assembled. As such the results will be presented in the 2 page update prior to the
competition.
3.2 Composite Materials Properties Testing
Objective: To determine critical material properties for the woven and unidirectional compos-
ites used in the modelling and design of the vehicle, namely the Young’s Modulus and Ultimate
Strength in the fiber directions.
Methodology (Woven Laminates): Four vacuum-bagged flat-panel test specimens of woven
0/90 carbon-fiber epoxy laminate were tested at UTIAS in the materials testing laboratory. The
articles were dogbone-style, with a neck 10mm wide by 0.5mm thick, and aluminum gripping tabs
bonded to the ends (Figure 10). Loads were applied via a 100 kN MTS hydraulic load frame, under
constant displacement control. Strains were measured in three ways: strain gauges adhered to the
dogbone neck, laser-extensometer measurements between reflective tapes, and speckle interferom-
etry using random spray patterns applied to the specimen surface.
Methodology (Unidirectional Laminates): Unidirectional laminates were tested using a 3-
point sandwich beam setup (Figure 10) primarily because unidirectional laminates are difficult to
machine into dogbone specimens and a premature failure in the matrix along the fiber direction is
often encountered in tensile testing. Testing was done with a static-load rig and precision masses
18
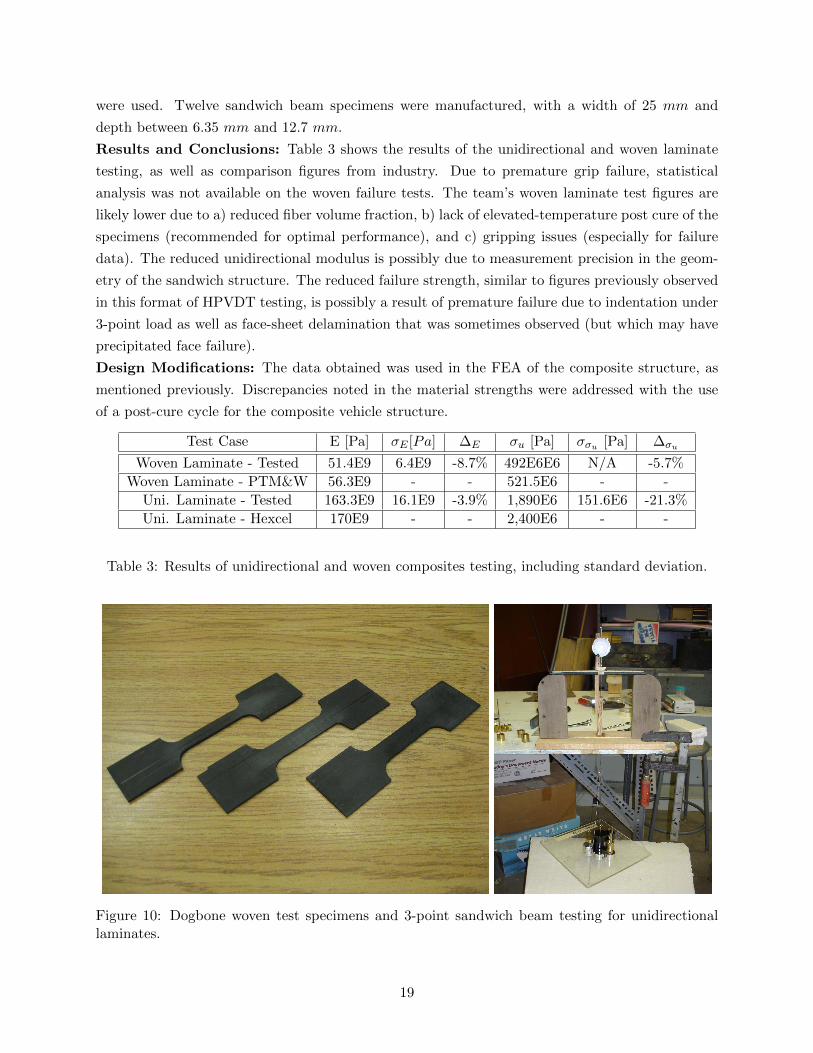
were used. Twelve sandwich beam specimens were manufactured, with a width of 25 mm and
depth between 6.35 mm and 12.7 mm.
Results and Conclusions: Table 3 shows the results of the unidirectional and woven laminate
testing, as well as comparison figures from industry. Due to premature grip failure, statistical
analysis was not available on the woven failure tests. The team’s woven laminate test figures are
likely lower due to a) reduced fiber volume fraction, b) lack of elevated-temperature post cure of the
specimens (recommended for optimal performance), and c) gripping issues (especially for failure
data). The reduced unidirectional modulus is possibly due to measurement precision in the geom-
etry of the sandwich structure. The reduced failure strength, similar to figures previously observed
in this format of HPVDT testing, is possibly a result of premature failure due to indentation under
3-point load as well as face-sheet delamination that was sometimes observed (but which may have
precipitated face failure).
Design Modifications: The data obtained was used in the FEA of the composite structure, as
mentioned previously. Discrepancies noted in the material strengths were addressed with the use
of a post-cure cycle for the composite vehicle structure.
Test Case E [Pa] σE [Pa] ∆E σu [Pa] σσu [Pa] ∆σu
Woven Laminate - Tested 51.4E9 6.4E9 -8.7% 492E6E6 N/A -5.7%Woven Laminate - PTM&W 56.3E9 - - 521.5E6 - -
Uni. Laminate - Tested 163.3E9 16.1E9 -3.9% 1,890E6 151.6E6 -21.3%Uni. Laminate - Hexcel 170E9 - - 2,400E6 - -
Table 3: Results of unidirectional and woven composites testing, including standard deviation.
Figure 10: Dogbone woven test specimens and 3-point sandwich beam testing for unidirectionallaminates.
19
3.3 Rider Configuration
Objective: To determine the optimal position for the rider, considering aerodynamic, structural
and performance constraints.
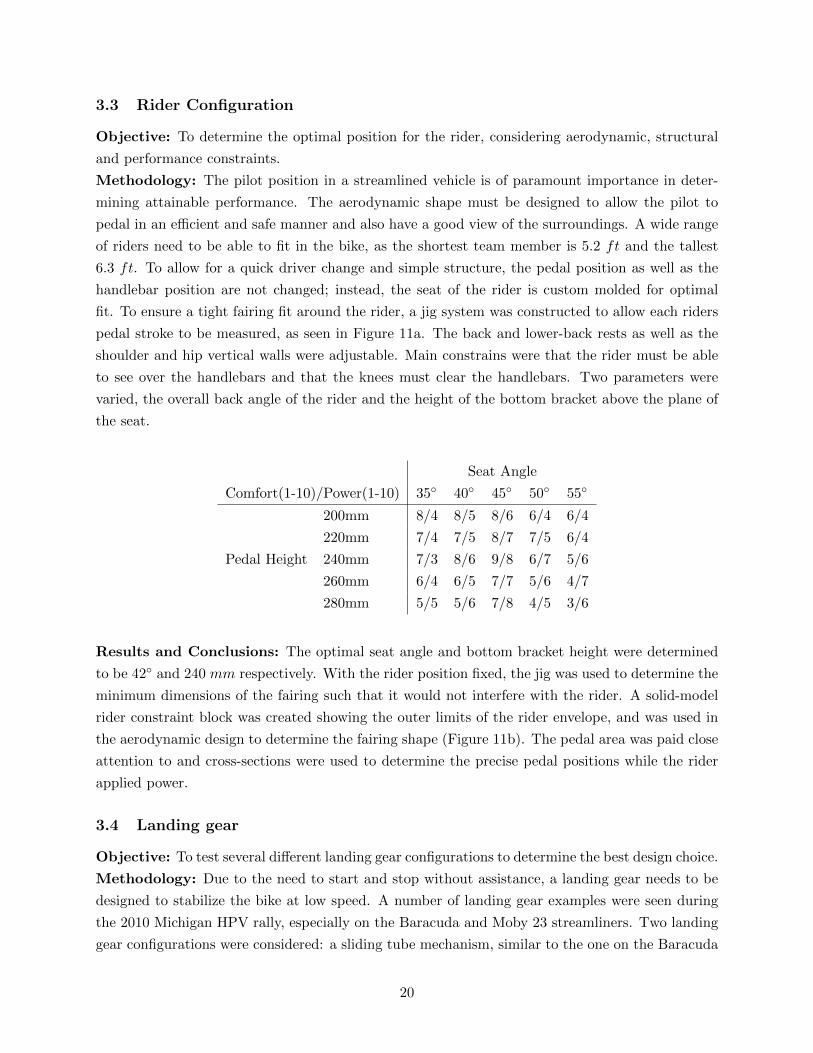
Methodology: The pilot position in a streamlined vehicle is of paramount importance in deter-
mining attainable performance. The aerodynamic shape must be designed to allow the pilot to
pedal in an efficient and safe manner and also have a good view of the surroundings. A wide range
of riders need to be able to fit in the bike, as the shortest team member is 5.2 ft and the tallest
6.3 ft. To allow for a quick driver change and simple structure, the pedal position as well as the
handlebar position are not changed; instead, the seat of the rider is custom molded for optimal
fit. To ensure a tight fairing fit around the rider, a jig system was constructed to allow each riders
pedal stroke to be measured, as seen in Figure 11a. The back and lower-back rests as well as the
shoulder and hip vertical walls were adjustable. Main constrains were that the rider must be able
to see over the handlebars and that the knees must clear the handlebars. Two parameters were
varied, the overall back angle of the rider and the height of the bottom bracket above the plane of
the seat.
Seat Angle
Comfort(1-10)/Power(1-10) 35◦ 40◦ 45◦ 50◦ 55◦
Pedal Height
200mm 8/4 8/5 8/6 6/4 6/4
220mm 7/4 7/5 8/7 7/5 6/4
240mm 7/3 8/6 9/8 6/7 5/6
260mm 6/4 6/5 7/7 5/6 4/7
280mm 5/5 5/6 7/8 4/5 3/6
Results and Conclusions: The optimal seat angle and bottom bracket height were determined
to be 42◦ and 240 mm respectively. With the rider position fixed, the jig was used to determine the
minimum dimensions of the fairing such that it would not interfere with the rider. A solid-model
rider constraint block was created showing the outer limits of the rider envelope, and was used in
the aerodynamic design to determine the fairing shape (Figure 11b). The pedal area was paid close
attention to and cross-sections were used to determine the precise pedal positions while the rider
applied power.
3.4 Landing gear
Objective: To test several different landing gear configurations to determine the best design choice.
Methodology: Due to the need to start and stop without assistance, a landing gear needs to be
designed to stabilize the bike at low speed. A number of landing gear examples were seen during
the 2010 Michigan HPV rally, especially on the Baracuda and Moby 23 streamliners. Two landing
gear configurations were considered: a sliding tube mechanism, similar to the one on the Baracuda
20
(a) (b)
Figure 11: (a) Test rig and (b) rider constraint block.
and Moby 23, as well as a pivoting arm configuration, similar to the landing gear on airplanes. A
prototype of each was built and attached to a low-racer recumbent.
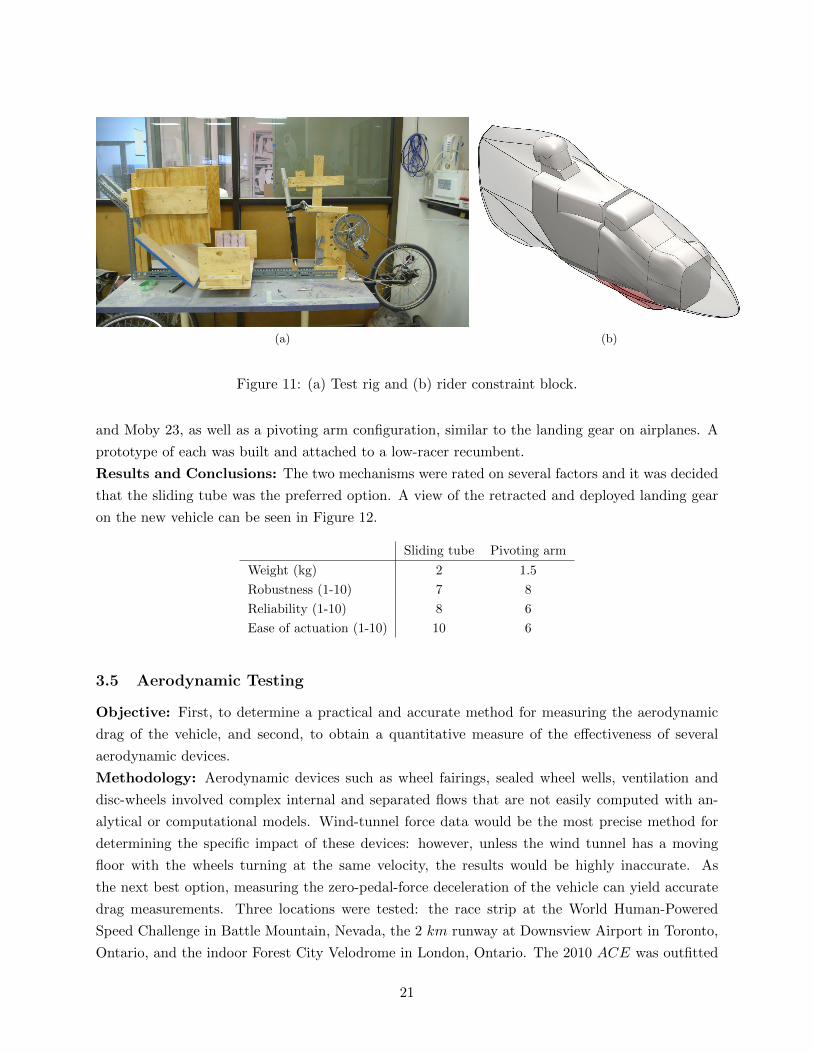
Results and Conclusions: The two mechanisms were rated on several factors and it was decided
that the sliding tube was the preferred option. A view of the retracted and deployed landing gear
on the new vehicle can be seen in Figure 12.
Sliding tube Pivoting arm
Weight (kg) 2 1.5
Robustness (1-10) 7 8
Reliability (1-10) 8 6
Ease of actuation (1-10) 10 6
3.5 Aerodynamic Testing
Objective: First, to determine a practical and accurate method for measuring the aerodynamic
drag of the vehicle, and second, to obtain a quantitative measure of the effectiveness of several
aerodynamic devices.
Methodology: Aerodynamic devices such as wheel fairings, sealed wheel wells, ventilation and
disc-wheels involved complex internal and separated flows that are not easily computed with an-
alytical or computational models. Wind-tunnel force data would be the most precise method for
determining the specific impact of these devices: however, unless the wind tunnel has a moving
floor with the wheels turning at the same velocity, the results would be highly inaccurate. As
the next best option, measuring the zero-pedal-force deceleration of the vehicle can yield accurate
drag measurements. Three locations were tested: the race strip at the World Human-Powered
Speed Challenge in Battle Mountain, Nevada, the 2 km runway at Downsview Airport in Toronto,
Ontario, and the indoor Forest City Velodrome in London, Ontario. The 2010 ACE was outfitted
21
Figure 12: Final landing gear design.
with three new aerodynamic devices (not used at the 2010 ASME race): a front wheel fairing that
fully enclosed the wheel, a rear wheel well that sealed of the rear wheel with approx. 2 cm of clear-
ance, and discs that could be mounted on the wheels to simulate a disc-wheel. Measurements were
taken with an onboard Eagletree Flight Data Recorder equipped with GPS speed, rpm-determined
ground speed, wind speed, and temperature recording devices. Speeds were recorded as the vehicle
decelerated from its top speed and the acceleration was plotted against velocity. Fitting the curve
to the equation below results in an estimate for the drag area CD [19].
U =Crr1mg + Crr2mgU + 0.5ρCDAU
2
m+ I/r2
where U is the velocity, m the mass, I the wheel inertia, r the wheel radius, g the gravitational
acceleration, A the frontal area, and Crr1 and Crr2 the rolling coefficients. For details of the coef-
ficients and values used see [22].
Results and Conclusions: It was concluded that outdoor testing could not be sufficiently
accurate due to wind forces, even if they were quite small. Even with wind speed measurement
using a pitot tube and accurate ground slope data, measurement error was far too great. Indoor
testing proved to be repeatable as long as all factors such as tire pressure, vehicle and rider weight,
temperature and air density are accurately measured. The results from the indoor velodrome test-
ing are shown in the table below:
22
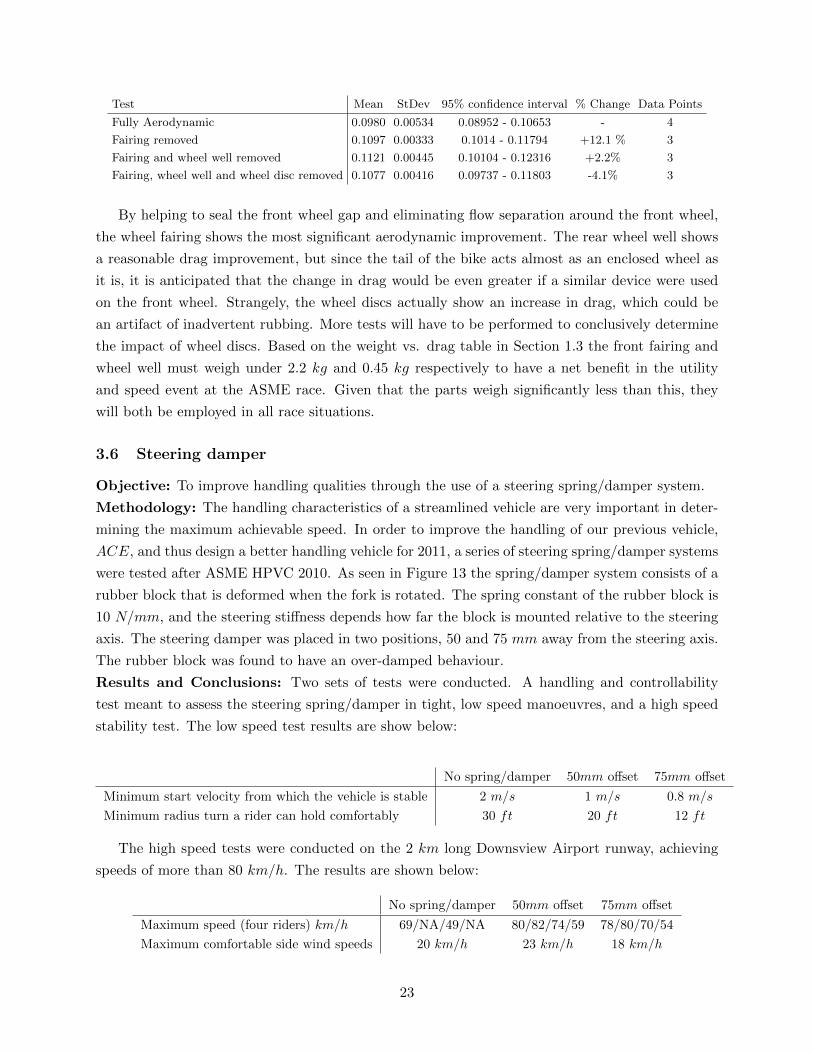
Test Mean StDev 95% confidence interval % Change Data Points
Fully Aerodynamic 0.0980 0.00534 0.08952 - 0.10653 - 4
Fairing removed 0.1097 0.00333 0.1014 - 0.11794 +12.1 % 3
Fairing and wheel well removed 0.1121 0.00445 0.10104 - 0.12316 +2.2% 3
Fairing, wheel well and wheel disc removed 0.1077 0.00416 0.09737 - 0.11803 -4.1% 3
By helping to seal the front wheel gap and eliminating flow separation around the front wheel,
the wheel fairing shows the most significant aerodynamic improvement. The rear wheel well shows
a reasonable drag improvement, but since the tail of the bike acts almost as an enclosed wheel as
it is, it is anticipated that the change in drag would be even greater if a similar device were used
on the front wheel. Strangely, the wheel discs actually show an increase in drag, which could be
an artifact of inadvertent rubbing. More tests will have to be performed to conclusively determine
the impact of wheel discs. Based on the weight vs. drag table in Section 1.3 the front fairing and
wheel well must weigh under 2.2 kg and 0.45 kg respectively to have a net benefit in the utility
and speed event at the ASME race. Given that the parts weigh significantly less than this, they
will both be employed in all race situations.
3.6 Steering damper
Objective: To improve handling qualities through the use of a steering spring/damper system.
Methodology: The handling characteristics of a streamlined vehicle are very important in deter-
mining the maximum achievable speed. In order to improve the handling of our previous vehicle,
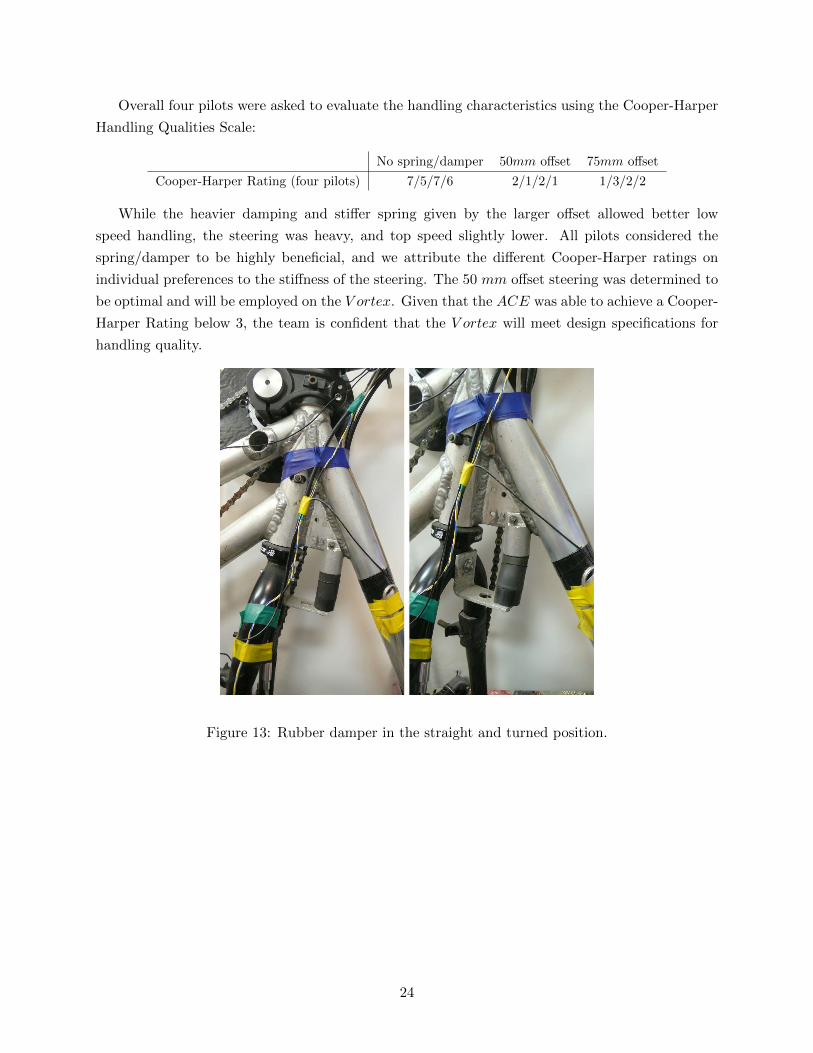
ACE, and thus design a better handling vehicle for 2011, a series of steering spring/damper systems
were tested after ASME HPVC 2010. As seen in Figure 13 the spring/damper system consists of a
rubber block that is deformed when the fork is rotated. The spring constant of the rubber block is
10 N/mm, and the steering stiffness depends how far the block is mounted relative to the steering
axis. The steering damper was placed in two positions, 50 and 75 mm away from the steering axis.
The rubber block was found to have an over-damped behaviour.
Results and Conclusions: Two sets of tests were conducted. A handling and controllability
test meant to assess the steering spring/damper in tight, low speed manoeuvres, and a high speed
stability test. The low speed test results are show below:
No spring/damper 50mm offset 75mm offset
Minimum start velocity from which the vehicle is stable 2 m/s 1 m/s 0.8 m/s
Minimum radius turn a rider can hold comfortably 30 ft 20 ft 12 ft
The high speed tests were conducted on the 2 km long Downsview Airport runway, achieving
speeds of more than 80 km/h. The results are shown below:
No spring/damper 50mm offset 75mm offset
Maximum speed (four riders) km/h 69/NA/49/NA 80/82/74/59 78/80/70/54
Maximum comfortable side wind speeds 20 km/h 23 km/h 18 km/h
23
Overall four pilots were asked to evaluate the handling characteristics using the Cooper-Harper
Handling Qualities Scale:
No spring/damper 50mm offset 75mm offset
Cooper-Harper Rating (four pilots) 7/5/7/6 2/1/2/1 1/3/2/2
While the heavier damping and stiffer spring given by the larger offset allowed better low
speed handling, the steering was heavy, and top speed slightly lower. All pilots considered the
spring/damper to be highly beneficial, and we attribute the different Cooper-Harper ratings on
individual preferences to the stiffness of the steering. The 50 mm offset steering was determined to
be optimal and will be employed on the V ortex. Given that the ACE was able to achieve a Cooper-
Harper Rating below 3, the team is confident that the V ortex will meet design specifications for
handling quality.
Figure 13: Rubber damper in the straight and turned position.
24
4 Practicality
4.1 Objective
The goal of the vehicle is to provide practical long range transportation, with no compromises made
to its potential for high speeds. The specific utility objectives are: 24 hour riding, safe awareness of
surroundings, ability to carry a varied amount of cargo, ease of transportation, ease of serviceability,
the ability to ride in incremental weather, free-standing capability and protection against theft.
4.2 Environment
The vehicle is designed for Southern Ontario area around Toronto, where the University of Toronto
is located. The city of Toronto is located in the province of Ontario, in the Great Lakes Lowland
region of Canada (43◦40-N, 79◦24-W/O). It has one of the mildest climates in Canada[12]. Toronto
is composed of a downtown core area, surrounded by boroughs. The population of Toronto is 2.48
million, and that of the Greater Toronto Area is 5.5 million. A diverse public transportation system
exists (the Toronto Transit Commission), and is composed of an underground subway system, buses,
streetcars, and light rail transit. During the busiest commuting times, 7-9am and 4-6pm, the system
is quite crowded, making alternate commuting options desirable. A network of lit bicycle paths
runs through Toronto and the Greater Toronto Area. These paths connect public parks and provide
a safer, faster way for bicycles to move around. Many major streets also incorporate bicycle lanes
or shared lanes in which drivers are made aware of bicycle traffic. These lanes are plowed and
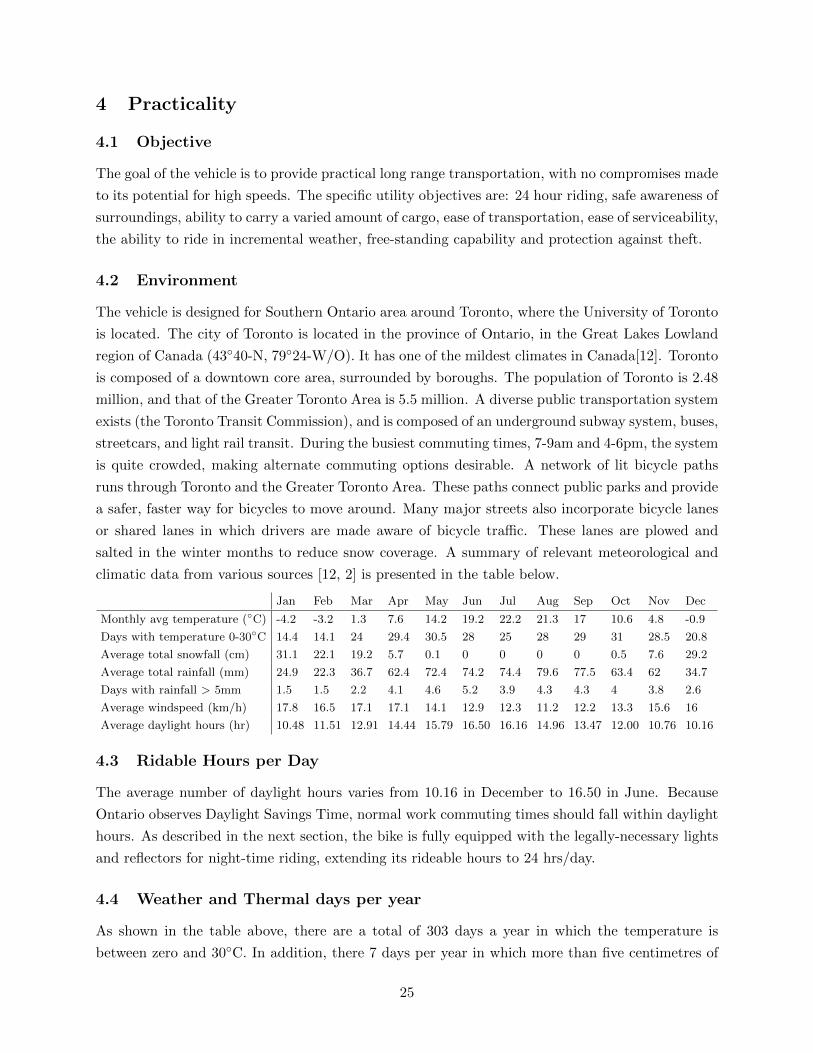
salted in the winter months to reduce snow coverage. A summary of relevant meteorological and
climatic data from various sources [12, 2] is presented in the table below.
Jan Feb Mar Apr May Jun Jul Aug Sep Oct Nov Dec
Monthly avg temperature (◦C) -4.2 -3.2 1.3 7.6 14.2 19.2 22.2 21.3 17 10.6 4.8 -0.9
Days with temperature 0-30◦C 14.4 14.1 24 29.4 30.5 28 25 28 29 31 28.5 20.8
Average total snowfall (cm) 31.1 22.1 19.2 5.7 0.1 0 0 0 0 0.5 7.6 29.2
Average total rainfall (mm) 24.9 22.3 36.7 62.4 72.4 74.2 74.4 79.6 77.5 63.4 62 34.7
Days with rainfall > 5mm 1.5 1.5 2.2 4.1 4.6 5.2 3.9 4.3 4.3 4 3.8 2.6
Average windspeed (km/h) 17.8 16.5 17.1 17.1 14.1 12.9 12.3 11.2 12.2 13.3 15.6 16
Average daylight hours (hr) 10.48 11.51 12.91 14.44 15.79 16.50 16.16 14.96 13.47 12.00 10.76 10.16
4.3 Ridable Hours per Day
The average number of daylight hours varies from 10.16 in December to 16.50 in June. Because
Ontario observes Daylight Savings Time, normal work commuting times should fall within daylight
hours. As described in the next section, the bike is fully equipped with the legally-necessary lights
and reflectors for night-time riding, extending its rideable hours to 24 hrs/day.
4.4 Weather and Thermal days per year
As shown in the table above, there are a total of 303 days a year in which the temperature is
between zero and 30◦C. In addition, there 7 days per year in which more than five centimetres of
25
snow falls. Snow plows clear the snow from streets within a day, meaning that while it would be
impossible to ride in fresh snow, it would be possible to ride the following day. Therefore, given
that the temperature inside the cockpit generally stabilizes at 5◦ above the external temperature
(see section on incremental weather), the total number of ridable days is 296.
4.5 Design Solutions
24 Hour Riding
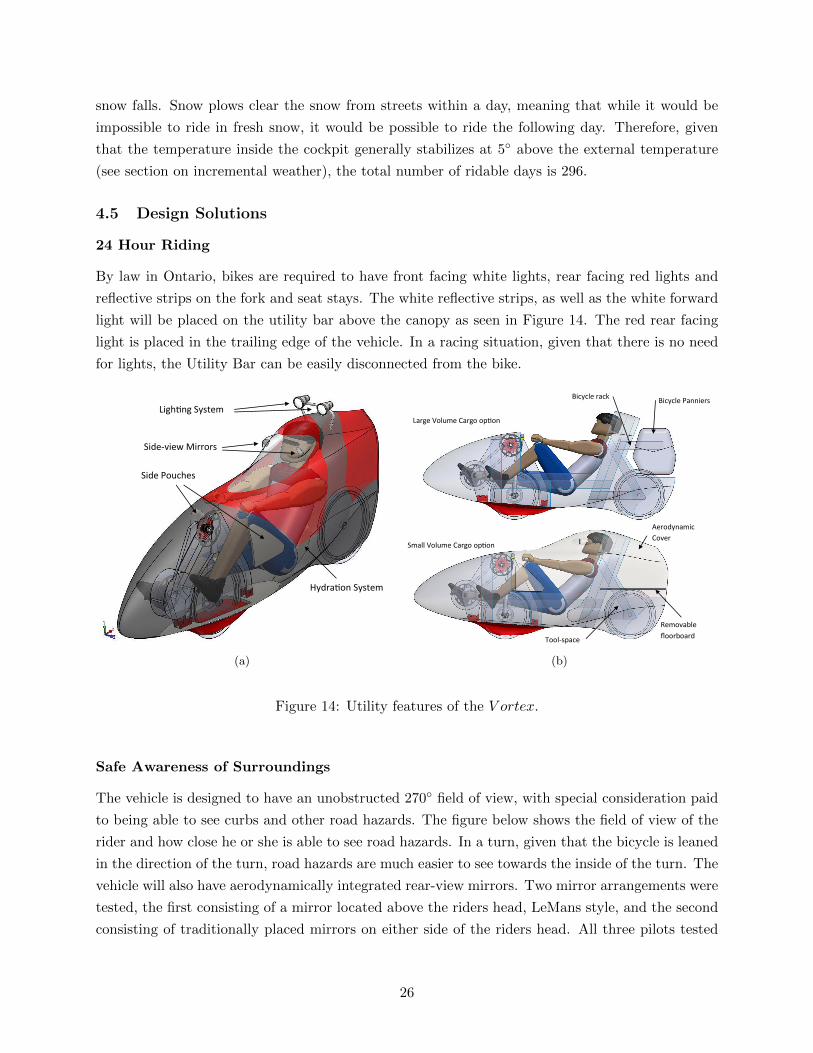
By law in Ontario, bikes are required to have front facing white lights, rear facing red lights and
reflective strips on the fork and seat stays. The white reflective strips, as well as the white forward
light will be placed on the utility bar above the canopy as seen in Figure 14. The red rear facing
light is placed in the trailing edge of the vehicle. In a racing situation, given that there is no need
for lights, the Utility Bar can be easily disconnected from the bike.
Side Pouches
Hyd on System
Ligh ng System
Side-‐view Mirrors
(a)
Bicycle rack
Large Volume Cargo op on
Small Volume Cargo op on
Aerodynamic
Cover
Removable
oorboard Tool-‐space
Bicycle Panniers
(b)
Figure 14: Utility features of the V ortex.
Safe Awareness of Surroundings
The vehicle is designed to have an unobstructed 270◦ field of view, with special consideration paid
to being able to see curbs and other road hazards. The figure below shows the field of view of the
rider and how close he or she is able to see road hazards. In a turn, given that the bicycle is leaned
in the direction of the turn, road hazards are much easier to see towards the inside of the turn. The
vehicle will also have aerodynamically integrated rear-view mirrors. Two mirror arrangements were
tested, the first consisting of a mirror located above the riders head, LeMans style, and the second
consisting of traditionally placed mirrors on either side of the riders head. All three pilots tested
26
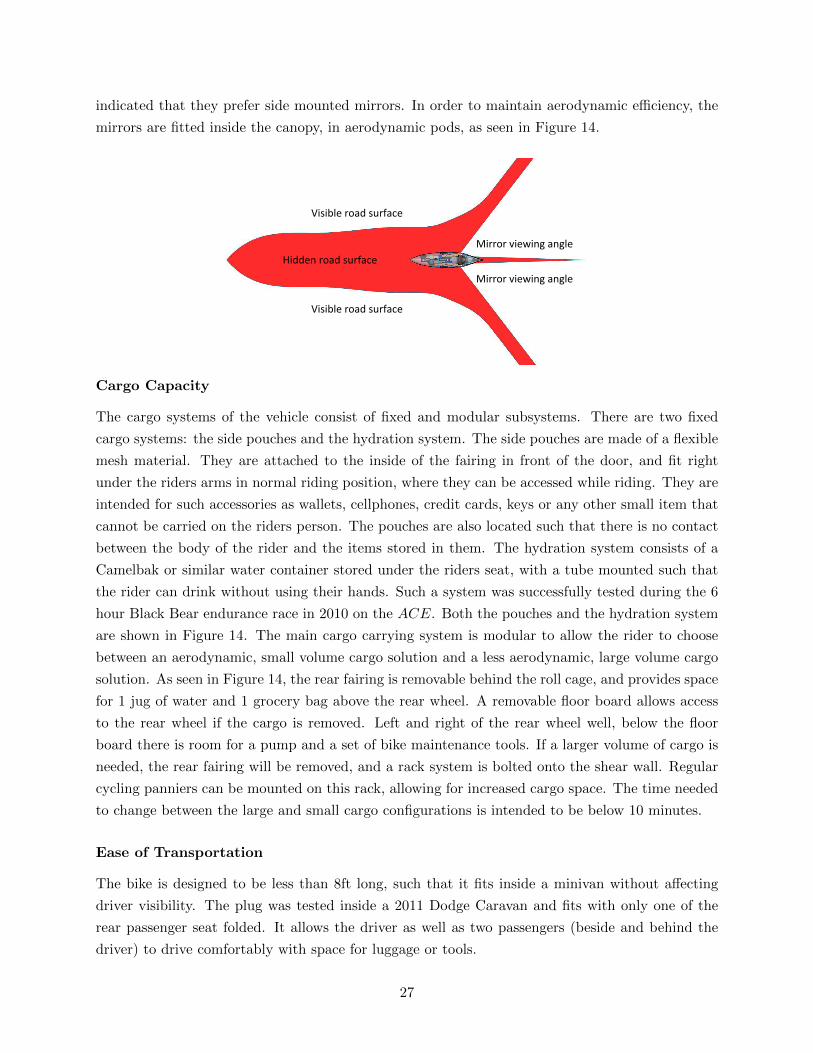
indicated that they prefer side mounted mirrors. In order to maintain aerodynamic efficiency, the
mirrors are fitted inside the canopy, in aerodynamic pods, as seen in Figure 14.
Visible road surface
Visible road surface
Hidden road surface
Mirror viewing angle
Mirror viewing angle
Cargo Capacity
The cargo systems of the vehicle consist of fixed and modular subsystems. There are two fixed
cargo systems: the side pouches and the hydration system. The side pouches are made of a flexible
mesh material. They are attached to the inside of the fairing in front of the door, and fit right
under the riders arms in normal riding position, where they can be accessed while riding. They are
intended for such accessories as wallets, cellphones, credit cards, keys or any other small item that
cannot be carried on the riders person. The pouches are also located such that there is no contact
between the body of the rider and the items stored in them. The hydration system consists of a
Camelbak or similar water container stored under the riders seat, with a tube mounted such that
the rider can drink without using their hands. Such a system was successfully tested during the 6
hour Black Bear endurance race in 2010 on the ACE. Both the pouches and the hydration system
are shown in Figure 14. The main cargo carrying system is modular to allow the rider to choose
between an aerodynamic, small volume cargo solution and a less aerodynamic, large volume cargo
solution. As seen in Figure 14, the rear fairing is removable behind the roll cage, and provides space
for 1 jug of water and 1 grocery bag above the rear wheel. A removable floor board allows access
to the rear wheel if the cargo is removed. Left and right of the rear wheel well, below the floor
board there is room for a pump and a set of bike maintenance tools. If a larger volume of cargo is
needed, the rear fairing will be removed, and a rack system is bolted onto the shear wall. Regular
cycling panniers can be mounted on this rack, allowing for increased cargo space. The time needed
to change between the large and small cargo configurations is intended to be below 10 minutes.
Ease of Transportation
The bike is designed to be less than 8ft long, such that it fits inside a minivan without affecting
driver visibility. The plug was tested inside a 2011 Dodge Caravan and fits with only one of the
rear passenger seat folded. It allows the driver as well as two passengers (beside and behind the
driver) to drive comfortably with space for luggage or tools.
27
Ease of Serviceability
All the mechanical systems of the bike, with the exception of the rear wheel and brake system, come
attached to the Drivetrain Structure (see Figure 15). This structure can be removed entirely in
several minutes with the quick release skewers, such that drive train maintenance can be performed
outside the vehicle.
Incremental Weather Riding
The ability to ride in incremental weather depends on two issues: Water must be kept out of the
bike and the temperature inside the bike must be maintained within acceptable ranges. The door of
the vehicle has a flange system meant to ensure the correct alignment and rigidity of the structure.
This system is also intended to seal the inside of the bike against rain or cold wind. Both wheels
have wheel wells, to protect the rider from water sprayed by the tires. Additionally, the front wheel
fairing protects the rider from cold air or water entering the wheel cut-out at most angles, and the
remaining openings are sealed by a velcroed material. Finally, the ventilation system can be closed
off from inside the vehicle, preventing water from coming in. All these features point to a very well
insulated vehicle against rain and cold wind.
To regulate internal temperature an adjustable ventilation system is used, which was tested on
the 2010 ACE as an addition for the World Human Powered Speed Championships. A screw is
used to vary the opening of a NACA duct placed in front of the canopy, allowing it to be closed or
opened as much as needed. With the NACA duct closed, temperature was measured inside ACE,
with the rider pedalling inside. With an outside temperature of -1◦C the temperature rose and
stabilized at 5◦C after roughly 10 minutes.
To allow the vehicle operation in hot weather, the air intake is very close to the riders face,
enhancing breathing. Additionally, two cut-outs in the shear wall direct the air to the trailing edge
openings, passing by the large veins in the riders neck, allowing for maximum cooling effect.
Free Standing Ability
In order to stop, start, enter, exit and park the vehicle without the help of additional personnel the
V ortex is equipped with a landing gear system, described in more detail in Section 3.4.
Theft Protection
Theft protection includes two aspects: the vehicle should be easy to lock and the vehicle should be
easy to find in case of theft. Due to the shape of the vehicle, locking it to a common bike locking
post is considered impractical, as it would block the sidewalk. The self contained locking system
prevents the front wheel from turning with a skewer through the assembly. The key, as well as the
removed skewer can be stored in the side pouches.
28
5 Safety
5.1 Normal operation
Safety systems designed for normal operation consider hazards that may be encountered by the
rider in everyday situations. The following hazards were considered in the design:
• Pinch points: the chain is aligned along the centreline of the drivetrain assembly (far from the
riders legs) and chain guards are installed on both sides of each sprocket. Chain guards prevent
accidental pinching as well as chain derailment. Pinch points on the wheel are completely
eliminated by using wheel wells which completely encapsulate the wheel.
• Sharp edges: interior features, including storage pockets, have been smoothed. Care has been
taken in machining parts with smooth transitions. The steering tube ends are plugged to
avoid injury to the rider while entering and exiting the vehicle.
• Visibility: 270 degrees of visibility is important in navigating traffic. Details of mirror place-
ment used to achieve this are included in Section 4.5.
• Ventilation and hydration: rider comfort is key to safely handling the vehicle over long periods
of time. Details of ventilation and hydration systems are included in Section 4.5.
• Night riding: a system of nighttime illumination has been developed to ensure visibility of
the bike by other traffic after dark.
• Communication: a push-to-talk radio system allows riders to communicate during race situ-
ations. A cell phone can also be easily stored in the inside pockets and the vehicle has been
tested to ensure that it is permeable to cellular signals.
• Steering system: the steering is directly bolted to the steerer using off the shelf components,
thus ensuring proper installation.
5.2 Impact scenarios
Additional safety systems for racing and impact scenarios have been developed. The following
systems have been incorporated for crash scenarios:
• Rollover/side protection system: The RPS is designed to fully protect the rider from crush
and inertial forces imposed in crash situations. The rollcage can resist a 600 lb topload and
300lb sideload.
• Seat belt: a 4-point Sparco racing harness with a quick release buckle allows the rider to exit
the vehicle quickly. If the rider is incapacitated, emergency personnel can also easily remove
the harness.
• Door locking mechanism: in the case of a crash, the door will stay closed, protecting the rider
inside. It is secured by two latches: one on each side of the rider. These latches are accessible
from the outside of the bike as well, to access the rider if they become incapacitated.
29
References
[1] S. Black. Designing bicyclings lightest pro racing frame.
http://www.compositesworld.com/articles/designing-bicyclings-lightest-pro-racing-frame, 2011.
[2] National Climate Data and Information Archive. Canadian climate normals 1971-2000, toronto,
ontario. http://www.climate.weatheroffice.gc.ca/climate normals/, 2011.
[3] M. Drela. Mark drela’s quoted rules of thumb.
www.recumbents.com/WISIL/barracuda/barracudafairingdesign.htm.
[4] M. Drela. Personal conversations with prof. drela. 2011.
[5] M. Drela and H. Youngren. XFOIL 6.9 user primer.
http://web.mit.edu/drela/Public/web/xfoil/xfoil doc.txt, Nov, 2001.
[6] G. Georgiev. Varna innovation and research corporation. www.varnahandcycles.com.
[7] P. Grant. Course Notes: Human Control of Aerospace Systems. University of Toronto, 2009.
[8] S. F. Hoerner. Fluid-Dynamic Drag. Hoerner Fluid Dynamics, Brick Town, N. J., USA, 1965.
[9] A. Jacobs. Velomobiel. en.velomobiel.nl/quest/technische gegevens.php, 2011.
[10] A. Ligtvoet. Raptobike. www.raptobike.nl/, 2011.
[11] B. Moens. M5 ligfietsen and handbikes. www.m5-ligfietsen.nl/site/EN/Models/City Racer/, 2011.
[12] National Research Council of Canada. Sunrise and sunset calculator.
www.nrc-cnrc.gc.ca/eng/services/hia/sunrise-sunset.html, 2011.
[13] University of Toronto Human-Powered Vehicle Design Team. Design report: ACE human-powered
speed vehicle. 2010.
[14] T. Ollinger. Streamliner scale sizing project.
www.recumbents.com/wisil/scale project/streamliners.htm, 2009.
[15] B. Patterson. Lords of the Chainring, 5th Ed. Cal Poly University, San Luis Obispo, CA, 2010.
[16] T. Reichert. Aerodynamic design of the vortex human-powered land-speed vehicle. 2011.
[17] S. Sanderson. Project sanderson. av-acg.
http://www.flickr.com/photos/bhpclub/sets/72157604828238682/?page=1, 2009.
[18] A. Smith. Stratford’s turbulent separation criteria for axially symmetric flows. Journal of Applied
Mathematics and Physics, 28, 1977.
[19] G. Tamai. The Leading Edge: Aerodynamic Design of Ultra-Streamlined Land Vehicles. Bently
Publishers, Cambridge, MA, USA, 1999.
[20] M. Weaver. Speed 101. www.speed101.com, 2003.
[21] D. Wielemaker. Varnowski aerodynamic data.
www.recumbents.com/forums/topic.asp?TOPIC ID=3672, 2010.
[22] D. Zolyniak. Aerodynamic testing of the ACE human-powered land vehicle. University of Toronto
BASc Thesis, Ontario, Canada, 2011.
30
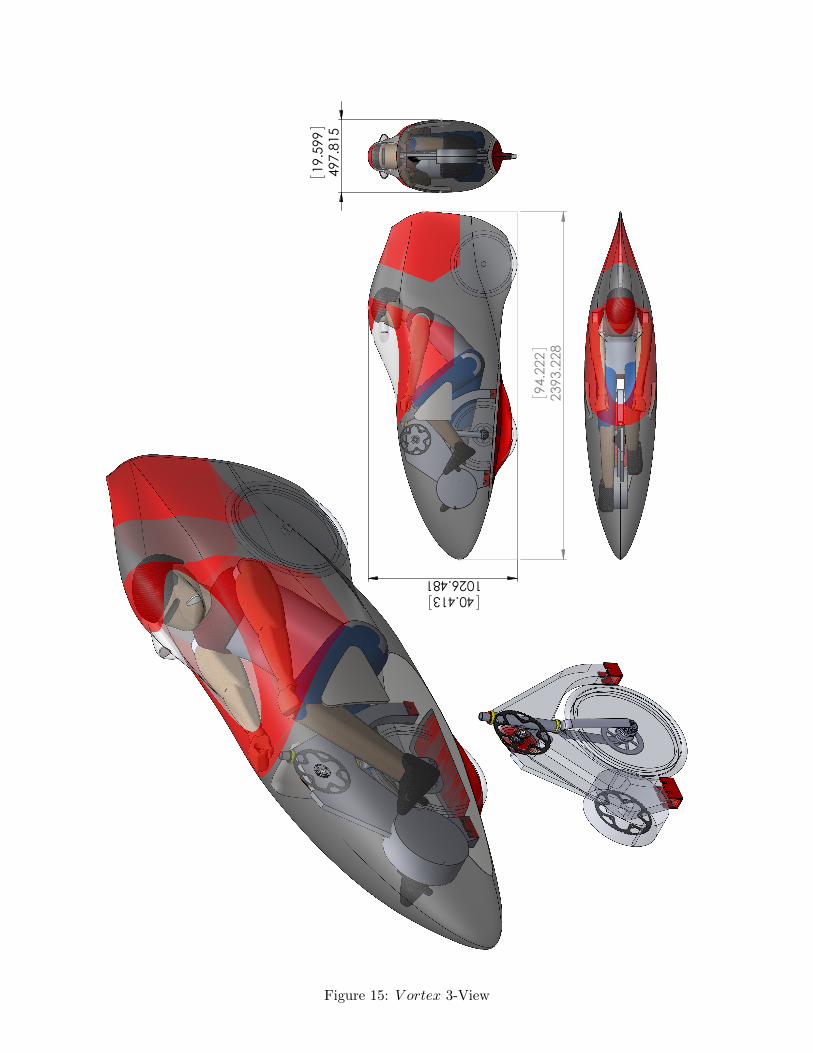
Figure 15: V ortex 3-View