Embed Size (px)
Citation preview

i
VEHICLE LICENSING AND TOLLING APPLICATION
MABHENA ANOLD
(R142723E)

ii
VEHICLE LICENSING AND TOLLING APPLICATION
BY
Mabhena Anold
(R142723E)
Submitted in partial fulfilment of the requirements for the degree of
BSc Honours in Information Systems
Department of Computer science and Information Systems
Faculty of science and technology at the
Midlands State University
Gweru
October 2017
SUPERVISOR: MR. M Giyane

iii
ABSTRACT
This document provides a comprehensive overview of the Vehicle licensing and tolling
application with the main aim of gathering and summarising facts, identifying as well as
analysing alternatives thereby solving the problems faced at Zimbabwe National Roads
Administration (ZINARA). Data gathering methodologies which include interviews,
observations and questionnaires were used in identifying the problems currently being faced by
the organisation. These included human errors and fraud as well as the poor handling of motorist
inquiries. Their traditional way of issuing licenses was less effective since there was a limited
motorist contribution in their system. The ever changing technology also led to the need for the
android application to assist motorists and enhance their inquiry handling. Therefore the
objectives of this research were to develop a system which allow the motorists to calculate their
license fees on the application, remind the motorist when the motor vehicle is due for licensing
and to create a platform that enable the motorists to make a calculation for the total fees required
from a certain destination to the next. Android and MySQL technologies were used to develop
the system meeting the objectives with the user requirements. In implementing the system
several testing strategies were also used so as to mirror the user requirements and the system.
User training was also done to the ZINARA employees and motorist so as to give them the
understanding of the system. Maintenance schedules were also put in place after user training.
Recommendations were also documented for further or future developments and this then will
give an opportunity and ideas to the organisation in the future to improve the application.

iv
DECLARATION
I, Anold Mabhena, hereby declare that I am the sole author of this dissertation. I authorize the
Midlands State University to lend this dissertation to other institutions or individuals for the
purpose of scholarly research.
Signature: ……………………………………………. Date: ………………………………..

v
APPROVAL
This dissertation entitled “Vehicle Licensing and Tolling Application” by Anold Mabhena
meets the regulations governing the award of the degree of BSc Honours Information Systems
of the Midlands State University, and is approved for its contribution to knowledge and literary
presentation.
Supervisor’s Signature: ……………………………………………….
Date: …………………………………………………………………..

vi
ACKNOWLEDGEMENTS
Glory and honour be to God, who has led me this far. My gratitude is also extended to my
supervisor Mr. M. Giyane under whose supervision I am excelling. Thank you for your support
may the good Lord richly blesses you. My appreciation also goes to the Department of Computer
Science and Information Systems for the opportunity to build a foundation for my career. My
heartfelt gratitude will never be complete without mentioning my family, thank you for the
support both financially and emotionally, I’m sure this good work you have started in me will
always be a source of encouragement. Finally, I wish to thank my friends Francis Bhembenene,
Clarence Terera, Nyasha Chiweshe, Morgan Matereke, Request Musekwa, Arthur Mbirimi and
Eric Maridza whose suggestions helped in improving my ideas.

vii
DEDICATION
This dissertation is dedicated to my family, my supervisor and all my lovely friends whose
unyielding love, support and encouragement have enriched my soul and inspired me to pursue
and complete this research.

viii
Table of Contents
ABSTRACT............................................................................................................................... i
DECLARATION ..................................................................................................................... iv
APPROVAL ..............................................................................................................................v
ACKNOWLEDGEMENTS .................................................................................................... vi
DEDICATION ....................................................................................................................... vii
LIST OF ACRONYMS ......................................................................................................... xiii
LIST OF FIGURES ...............................................................................................................xiv
LIST OF TABLES ............................................................................................................... xvii
LIST OF APPENDICES ..................................................................................................... xviii
CHAPTER ONE: INTRODUCTION ......................................................................................1
1.1 Introduction .......................................................................................................................1
1.2 Background of the study ....................................................................................................1
1.2.1 Background of the organisation ...................................................................................1
1.2.2 Organisational structure ...............................................................................................2
1.2.3 Vision .........................................................................................................................3
1.2.4 Mission .......................................................................................................................4
1.3 Problem definition .............................................................................................................4
1.4 Aim ...................................................................................................................................5
1.5 Objectives ..........................................................................................................................5
1.6 Instruments and methods ...................................................................................................5
1.7 Justification .....................................................................................................................7
1.8 Conclusion .......................................................................................................................8
CHAPTER TWO: PLANNING PHASE ..................................................................................9
2.1 Introduction .......................................................................................................................9

ix
2.2 Business value ...................................................................................................................9
2.3 Feasibility Study .............................................................................................................. 10
2.3.1 Technical Feasibility ................................................................................................. 11
2.3.2 Economic Feasibility ................................................................................................. 12
2.3.3 Social Feasibility ....................................................................................................... 18
2.3.4 Operational Feasibility .............................................................................................. 19
2.4 Risk Analysis ................................................................................................................... 19
2.5 Stakeholder analysis ........................................................................................................ 20
2.5.1 Motorists ................................................................................................................... 21
2.5.2 Employees ................................................................................................................. 21
2.5.3 ZINARA management ............................................................................................... 21
2.5.4 Potential Investors ..................................................................................................... 21
2.6 Project Work plan ............................................................................................................ 21
2.6.1 Gantt Chart ................................................................................................................ 22
2.7 Conclusion ....................................................................................................................... 23
CHAPTER THREE: ANALYSIS PHASE ............................................................................. 24
3.1 Introduction ..................................................................................................................... 24
3.2 Data gathering methodologies .......................................................................................... 24
3.2.1 Interviews.................................................................................................................. 24
3.2.2 Questionnaires ........................................................................................................... 26
3.2.3 Observations ............................................................................................................. 27
3.3 Analysis of the existing system ........................................................................................ 28
3.3.1 Advantages of the existing system ............................................................................. 28
3.3.2 Disadvantages of the current system .......................................................................... 28
3.3.3 Description of current system. ................................................................................... 29

x
3.4 Process analysis ............................................................................................................... 29
3.5 Data analysis.................................................................................................................... 31
3.5. 1 Context diagram ....................................................................................................... 31
3.5.2 Dataflow diagram ...................................................................................................... 32
3.6 Weaknesses of the current system .................................................................................... 34
3.7 Evaluation of alternatives ................................................................................................. 35
3.7.1 Improving the existing system ................................................................................... 35
3.7.2 Outsourcing ............................................................................................................... 36
3.7.3 In-house development ............................................................................................... 37
3.8 Requirements Analysis .................................................................................................... 38
3.8.1 Functional requirements ............................................................................................ 38
3.8.2 Non-functional requirements ..................................................................................... 39
3.8.3 Constraints of the success of the system development ................................................ 40
3.9 Conclusion ....................................................................................................................... 41
CHAPTER FOUR: DESIGN PHASE .................................................................................... 42
4.1 Introduction ..................................................................................................................... 42
4.2 System design .................................................................................................................. 42
4.2.1 Description of the proposed system ........................................................................... 42
4.2.2 Context diagram and Dataflow diagram ..................................................................... 43
4.2.3 Dataflow diagram of the proposed system ................................................................. 45
4.3 Architectural design ......................................................................................................... 48
4.4 Physical design ................................................................................................................ 49
4.4.1 Hardware requirements for the proposed system ........................................................ 50
4.4.2 Software requirements ............................................................................................... 51
4.5 Database design ............................................................................................................... 52

xi
4.5.1 Database architectural design .................................................................................... 52
4.5.2 Logical design ........................................................................................................... 54
4.5.3 Entity Relationship Diagram...................................................................................... 58
4.6 Program Design ............................................................................................................... 61
4.6.1 Package Diagram....................................................................................................... 61
4.6.2 Class Diagram ........................................................................................................... 62
4.6.3 Sequence Diagram ..................................................................................................... 64
4.7 Interface design ............................................................................................................... 65
4.7.1 Input design ............................................................................................................... 65
4.7.2 Main menu ................................................................................................................ 72
4.7.3 Output design ............................................................................................................ 78
4.8 Pseudo code ..................................................................................................................... 80
4.9 Security design ................................................................................................................ 82
4.9.1 Physical Security ....................................................................................................... 82
4.9.2 Network security ....................................................................................................... 83
4.9.3 Operational security .................................................................................................. 83
4.10 Conclusion ..................................................................................................................... 84
CHAPTER FIVE: IMPLEMENTATION PHASE ................................................................ 85
5.1 Introduction ..................................................................................................................... 85
5.2 Coding ............................................................................................................................. 85
5.3 Testing ............................................................................................................................. 85
5.3.1 Unit testing ................................................................................................................ 86
5.3.2 Module testing........................................................................................................... 87
5.3.3 Integration Testing .................................................................................................... 87
5.3.4 System Testing .......................................................................................................... 87

xii
5.3.5 Acceptance Testing ................................................................................................... 88
5.3.6 System security testing .............................................................................................. 89
5.3.7 Validation ................................................................................................................. 89
5.3.8 Verification ................................................................................................................... 95
5.4 Installation ....................................................................................................................... 95
5.4.1 User Training ............................................................................................................ 95
5.4.2 System Changeover ................................................................................................... 95
5.5 Maintenance .................................................................................................................... 98
5.6 Recommendations to stakeholders ................................................................................... 99
5.7 Recommendations for further/ future developments ....................................................... 100
5.8 Conclusion ..................................................................................................................... 101
Reference list ......................................................................................................................... 102
Appendices ............................................................................................................................ 105

xiii
LIST OF ACRONYMS
CBA Cost Benefit Analysis
CCC Customs Clearance Certificate
DBMS Database Management System
DFD Dataflow Diagram
EER Enhanced Entity Relationship Diagram
EMAIL Electronic Mail
GUI Graphical User Interface
ID Identity Number
ROI Return On Investment
SQL Structured Query Language
VID Vehicle Inspection Department
WIMP Windows Icons Menus Pointers
ZINARA Zimbabwe National Roads Administration

xiv
LIST OF FIGURES
Fig 1.1 Organisational Structure ..................................................................................................3
Fig 3.1: Activity diagram for the current vehicle licensing system ............................................. 30
Fig 3.2: Context diagram for the current system ....................................................................... 32
Fig 3.3: Dataflow diagram for the current system ...................................................................... 33
Fig 3.4: Use Case diagram......................................................................................................... 39
Fig 4.1: Context diagram for the ZINARA vehicle Registration and Tolling new system........... 44
Fig 4.2: Dataflow diagram one for the proposed system ............................................................ 46
Fig 4.3: Dataflow diagram two for the proposed system ............................................................ 47
Fig 4.4: Architectural design of the new system. ....................................................................... 49
Fig 4.5 Network diagram for the proposed system ..................................................................... 51
Fig 4.6: Database architecture ................................................................................................... 52
Fig 4.7: Enhanced entity relationship diagram for the new system ............................................. 60
Fig 4.8: Package diagram for the proposed system .................................................................... 62
Fig 4.9: Class diagram for the new system................................................................................. 63
Fig 4.10: Sequence diagram for the proposed system ................................................................ 64
Fig 4.11: Client sign up form ..................................................................................................... 66
Fig 4.12: Client login form ........................................................................................................ 67
Fig 4.13: Vehicle license application form................................................................................. 68
Fig 4.14: Toll fees calculation form ........................................................................................... 69
Fig 4.15: Account creation ........................................................................................................ 70
Fig 4.16: Staff login form .......................................................................................................... 71
Fig 4.17: Administrator login form ............................................................................................ 72

xv
Fig 4.18: Staff main menu ......................................................................................................... 73
Fig 4.19: Client main menu ....................................................................................................... 74
Fig 4.20: Administrator main menu ........................................................................................... 75
Fig 4.21: Licenses sub-menu ..................................................................................................... 76
Fig 4.22: Pending applications sub-menu .................................................................................. 77
Fig 4.23: Administrator sub-menu ............................................................................................. 78
Fig 4.24: Vehicle License form ................................................................................................. 79
Fig 4.25: Vehicle toll fees statement .......................................................................................... 80
Fig 5.1: Stages in system Testing .............................................................................................. 86
Fig 5.2 black box testing .......................................................................................................... 88
Fig 5.3: Data type validation screenshot .................................................................................... 90
Fig 5.4: Login security screenshot ............................................................................................. 91
Fig 5.5: Password match validation screenshot .......................................................................... 92
Fig 5.6: Omission validation screenshot .................................................................................... 93
Fig 5.7: Input type validation screenshot ................................................................................... 94
Fig A1: Registration page ........................................................................................................ 106
Fig A2: Login page ................................................................................................................. 107
Fig A3: Welcome page ............................................................................................................ 108
Fig A4: Main menu ................................................................................................................. 109
Fig A5: Calculator ................................................................................................................... 110
Fig A6: License fees calculator ............................................................................................... 111
Fig A7: Toll fees calculator ..................................................................................................... 112
Fig A8: Report case ................................................................................................................. 113

xvi
Fig A9: Reminders .................................................................................................................. 114

xvii
LIST OF TABLES
Table 2.1: Hardware requirements ............................................................................................. 11
Table 2.2: Software requirements .............................................................................................. 12
Table 2.3: Development costs.................................................................................................... 13
Table 2.4: Operational Costs ..................................................................................................... 14
Table 2.5: Tangible Benefits ..................................................................................................... 15
Table 2.6: Cost benefit analysis ................................................................................................. 16
Table 2.7: Net Present Value ..................................................................................................... 17
Table 2.8: Risk analysis table .................................................................................................... 20
Table 2.9: Timing project schedule............................................................................................ 22
Table 2.10: Project Gantt chart .................................................................................................. 23
Table 4.1: Motorist table ........................................................................................................... 55
Table 4.2: Administrator table ................................................................................................... 55
Table 4.3: Licensing officer table .............................................................................................. 56
Table 4.4: Police officer table .................................................................................................... 56
Table 4.5: Tollgate officer table ................................................................................................ 57
Table 4.6: Vehicle license ......................................................................................................... 57
Table 4.7: Vehicle license application table ............................................................................... 58
Table 4.8: Vehicle license renewal table .................................................................................... 58
Table D1: Observation Scoresheet ........................................................................................... 118

xviii
LIST OF APPENDICES
Appendix A: User manual ....................................................................................................... 105
Appendix B: Interviews........................................................................................................... 115
Appendix C: Observations ...................................................................................................... 118
Appendix D: Questionnaire ..................................................................................................... 119
Appendix E: Code Snippets ..................................................................................................... 120

1
CHAPTER ONE: INTRODUCTION
1.1 Introduction
This chapter mainly focuses on the application of Zimbabwe National Roads Administration
(ZINARA) vehicle licensing and the tolling application. This modern world is characterised by
the rapid change in technology that is being used, it is therefore vital for the motorists to harness
the new ways of managing their vehicles as well as planning their road budgets. Technology has
improved the various sectors of the motor industry from the online buying of vehicles to the
tolling system which has led to efficiency in those lines of operation. This calls for an application
that helps the motorists to be able to manage their vehicle licensing and tolling fees on the go.
The main focus of this section is to show the background overview of the organisation, identify
problems that led to the need of a vehicle licensing and tolling application, identify objectives of
the system, clarify the system requirements, system instruments and to give the brief description
of the system.
1.2 Background of the study
The increasing number of tollgates and the complexity of the vehicle registration process it
provided the need for several advancements in the motor industry. After experiencing a budget
misunderstanding with the truck driver on the exact amount of toll fees required from Beitbridge
to Harare for a truck this brought out the idea for a tolling system for motorists. This raised
debate since the actual number of tollgates along the way was not known. Therefore this brought
out the need for the vehicle licensing and tolling application to assist motorists vying the long
distances and those who would use a certain route for the first time to sort out the budget since it
will be providing all the information one would require on the road.
1.2.1 Background of the organisation
ZINARA falls under the Ministry of Transport, Communication and Infrastructural
Development. ZINARA is a body corporate established in terms of the road act (chapter 13:18).
The body which was established in 2002 has prioritised the enhancement of good road network
system throughout the country.

2
Its core business, in consultations with the minister of transport, communication and
infrastructural development is fixing road user charges and collect such charges or any other
revenue of the road fund. ZINARA is also responsible for auditing the use of the funds from the
road fund by road authorities and ensure that disbursed funds are utilised for the purpose which
they are intended in accordance with the rules prescribed by ZINARA.
It also monitors the implementation of road maintenance works by road authorities, and assists
the Minister in setting maintenance, design, construction and technical standards and to monitor
adherence to such standards by Road Authorities. Zinara.inc
1.2.2 Organisational structure
Morgan (2006) defines an organisational structure as a structure which shows the activities and
tasks that include supervision, task allocation as well as the coordination of activities are aligned
towards the achievement of organisational objectives. Different types of organisational structures
exist and these include the traditional hierarchy, the flatter as well as the flat organisational
structure.
The hierarchy is the most common structure adopted by many organisations. This is a structure
whereby communication flows from the top to the bottom of the organisation and those at the top
are considered to possess all the information as well as the power to do the decisions.
The flatter organisational structure is similar to the hierarchy in the sense that it has got layers.
However this structure has fewer layers as compared to the hierarchy as it seeks to open up more
lines of communication as well as enhancing collaboration. This model seeks to clarify to the
management that they exist to provide support to the employees and not vice versa as the case
with the traditional hierarchy.
The flat structure is an emerging organisational structure whereby everyone in the organisation is
at the same level. It is considered as the self- managed organisational structure. This is the case
with the Valve Gaming Company. In this case no one is assigned a job title and therefore there is
no description attached to any employee and no one tells the other employee what to work on. In
this structure employees identify projects to work on and one choses any project that suits his
ability.

3
Fig 1.1 is the hierarchy type of an organisational structure adopted by ZINARA. The board of the
company is the one at the top holding all the authority and the final decisions on some of the
issues affecting the organisation. The company’s Chief Executive Officer is the one who reports
to the Board and behind him lay the Directors and the departmental Managers are the ones who
report to the Directors. The job titles depicted in this are centred in the maintenance of the status
quo of the company and this is experienced in the hierarchy organisational structure.
Fig 1.1 Organisational Structure
1.2.3 Vision
This business vision refers to the business organisation’s declaration of the mid-term as well as
its long term organisational objectives (Mccuen, 1996). The ZINARA’s organisational vision is
defined below:
To become the leading road fund manager for the development of a world class road network.
BOARD
Director
Operations Technical
Director
Finance
Director Company
Secretary
Public
Relations and
Marketing
Executive
Tolling
Manager ICT
Manager
Projects
Manager
Engineering
Audit
Manager
Human
Resource Manager
Admin
Manager
CEO

4
1.2.4 Mission
The business mission refers to the business statement that outline the organisation’s core purpose
and this remain unchanged over time (Abrahams, 1995). The ZINARA’s organisational mission
is defined below:
To effectively collect funds for road development by road authorities
1.3 Problem definition
ZINARA is a gradually growing company and therefore the introduction of the tollgates as well
as their increasing number has prompted the need of improved systems. ZINARA is responsible
for the collection of all the vehicle registration fees in the country with their system. On payment
of the registration fees, the motorists are provided with a license disk after the capturing of the
details. The system should then be responsible for creating a continuing relationship with the
motorists after the registration for example proving reminders to the motorists on the expiry
dates of their licenses they have purchased since the company would have captured all the
details. On the tolling side the current system is used by the ZINARA staff members only and the
motorist’s contribution is generally low if any. Therefore the system should further include
motorist input in the system by allowing input from owners of vehicles to report a car hijacking
incident to the tolling agents on his mobile application. This will be aimed at reducing the theft
of cars since when the stolen vehicle passes through the tollgate the system should provide a
warning to the cashiers and therefore the vehicle can be recovered easily. The current system is
providing restrictive platforms for the motorists to actually view the necessary information
concerning the tolling stations or the tollgates along the routes in the country. This then calls for
a more informative platform providing a map and locations of all the tollgates. This therefore
helps the organisation in the achievement of the company vision of being the leading fund
manager of a world class road network which is not only friendly to motorists but also secure.

5
1.4 Aim
To develop a system that will help motorists manage their road budget through developing an
application that calculates total amount of tollgate fees and license fees for their vehicles.
1.5 Objectives
To develop a platform that will allow the motorists to calculate their license fees on the
vehicle licensing and tolling application.
To develop application that will be able to remind the motorist when the motor vehicle is due
for licensing.
To create a platform that will enable the motorists to make a calculation for the total fees
required from a certain destination to the next through multiplying the vehicle class fee with
the number of tollgates along the way.
To design an application that will provide a platform for motorists to report a car hijack or
theft incident in their mobile application by providing location and registration number to the
Central Vehicle Registry.
To develop a system that will enable the management to view the number of users of the
application so as to make decisions for managerial purposes.
1.6 Instruments and methods
To gather information so as to identify the problems being faced the data gathering
methodologies were used. Therefore there is also a description of the software development
tools to be used to develop the system.
1.6.1 Data gathering methodologies
The identification of the problems of the current system a pilot study was carried out using the
data gathering techniques which include the interviews, observations as well as the
questionnaires.

6
a) Interviews
This was done with the truck drivers who drive over long distances passing through
several tollgates. Therefore the findings proved that they encounter challenges when
they drive over long distances or use a certain route for the first time. This is due to the
fact that some of the GPS technologies is not functional in the country hence to view the
map of all the tollgates and then budget for the toll fees will then become a nightmare.
b) Observation
This was done on the sprinters vying the Gweru-Shurugwi route. The problem in this
case could be encountered on the side of the those taxi owners who would require a
report on the number of times the sprinter passed through the tollgate so as to estimate
the daily income to be expected from his workers. Therefore after gathering all the
information the need for the tolling application which could provide a report on the
number of times the vehicle could have passed through a certain tollgate was needed.
c) Questionnaires
This was given to the ZINARA staff since the direct interviews could not be successful
with them since they were busy with the clients and therefore questionnaires were given
to them so that they complete them on their spare time. This then brought the need of the
application since they further added to the questionnaire that a system capable of
enabling motorists to report car hijacking incidents to tolling points as soon as it happens
on their mobile applications will increase the reputation of the organisation in assisting
the motorists to be secure when on the go.
1.6.2 Software development tools
These are the tools that are required in the development of the system and are outlined below:
a) Programming language (Android)
David (2007) defines the Android Studio as an IDE from Google providing all the
necessary tools that are required in the development of applications that run on the
Android Operating system platform. This will be used as a development platform to
produce the Vehicle Registration and tolling application.

7
b) Server: (Xampp Application server ).
David (2007) defines Xampp as a free and an open source cross platform web server
solution package which interprets scripts written in PHP as well as the Perl programming
languages. This will be used in the interpretation of the scripts on the admin side of the
Vehicle Registration application written in PHP programming languages.
c) Database: (MySQL Database ).
McCormack (2012) defines the MySQL database as an open source relational database
management system (RDBMS) that is based on the structured query language (SQL).
This will be used in the storage of the motorist’s vehicle data as well as the management
of the data. It is most compatible with the web based applications.
d) Photoshop software - is used for editing, and creating images. It is a graphic editor for
manipulating high quality images.
1.7 Justification
The introduction of the vehicle licensing and tolling application using android technology in
mobile phones can be of paramount importance to the organisation. Some of the motorists after
acquiring a motor vehicle for the first time tend not to be aware of the procedures they should
take in the registration and licensing process. Therefore the implementation of the vehicle
licensing and tolling app will enable them to have all the procedures in the palm of their hands.
The implementation of the vehicle licensing application will eliminate the issue of under budget
in the amount of cash one would want to spend in the road for tolling fees as one will be able to
calculate before the journey. The implementation of the application will also make it easier for
the ZINARA staff in the enquiries from motorist since most of the information will be provided
on the application thereby reduction in queues at their offices. The implementation of the system
will reduce the theft of cars since when the stolen vehicle passes through the tollgate the system
should provide a warning to the cashiers and therefore the vehicle can be recovered easily.
License related fines are also being incurred by motorists in tollgates after their expiry and this
has been usually due to the fact that the motorists would have forgotten, and hence the

8
introduction of the tolling application through its reminder function will reduce such
inconveniences.
1.8 Conclusion
The chapter managed to introduce the topic under study by first identifying the need for a new
system and this was arrived at after undertaking the data collection exercise. This then brought
out the need of the system as well as what is expected of the proposed system. This includes the
objectives of the proposed system which were then stated .The chapter also identified and
described the software tools required in the development of that proposed system. The system
justification also showed that the implementation of the vehicle registration and tolling
application is vital. The planning phase that follows analyses the proposed system in terms of its
feasibility to further justify the need of the vehicle licensing system.

9
CHAPTER TWO: PLANNING PHASE
2.1 Introduction
According to Richman (2002), the planning phase is the second stage in the system development
life cycle which is concerned about creating a set of plans to be followed by the development
team in the execution and development of the stages of the project. The benefits which will be
brought by the introduction of the system will be analysed. This weighing process will be done
through feasibility study which will be comparing the costs to its associated benefits that will be
brought about by the system. The planning phase also takes into account the resources that are
required in the development of the system. After the assessment of the feasibility studies then
there is the drafting of a work plan. The work plan will be showing all the activities to be carried
out as well as the associated period for each activity to be completed. This work plan or schedule
should be adhered to so as to avoid project slacking.
2.2 Business value
According to Jewel (2004), the business value refers to the benefits which are gained from the
development of a system so as to escalate the goodwill of the organisation on its effectiveness
and efficiency of carrying out the business. The system will bring value and more benefits to
ZINARA as an organisation through increasing the revenue collection on tollgates and
increasing efficiency in the collection of vehicle registration fees. The proposed system will
bring an increased value to the organisation as well as stakeholders of ZINARA. The benefits to
each stakeholder are outlined below:
Stakeholder value: The introduction of the Vehicle licensing and tolling application
will bring more benefits to the organisation’s shareholders since it will likely to
increase the profits of the firm thereby increasing the shareholder value. The system
will ensure that motorists are reminded to pay their license fees on time thereby
increasing revenue of the organisation.
Customer value: Customer value will increase among motorists as they will value their
toll fees they pay on the tollgates. This will be due to ability of the system to recover
stolen vehicles through the application. Therefore customers will feel that their toll fees
are being used wisely in the creation of a world class road network.

10
Employee knowledge: The system will increase the employee knowledge as well as
their way of serving clients in the organisation. This will be achieved through the
system by providing the necessary details concerning the tollgate fees as well as the
criterion in which vehicle license is calculated so as to provide assistance to clients who
would be encountering problems in licensing their tollgate fees.
Managerial value: The implementation of the vehicle licensing and tolling application
will likely to further increase managerial value as it will reduce the risks in the decision
making process. The system will increase the way in which managerial decisions will
be carried since it will provide reports on the reported cases of vehicle theft on a
specific area and therefore giving the management with the required statistics to come
with decisions.
Societal value: The society is an important stakeholder in a business organisation and
therefore every change that will be made should be assessed so as to identify its effect
to the society. Motorists are also the part of the society and hence the introduction of
the vehicle licensing and tolling application will ensure that their grievances are
directed towards the management and hence they will then feel part and parcel of the
organisation.
The implementation of this application will likely to bring more value to the organisation across
its stakeholders. Therefore the implementation of the system will be of benefit to the
organisation.
2.3 Feasibility Study
Davis (1998) defines the feasibility study as an analysis of how successful a project can be
completed considering factors that affect it such as economic, social, technical as well as
operational factors. To determine the worthiness of the project to the organisation the system
developers has to undergo the feasibility study so as to come up with a decision whether to
implement or discard the project. There a number of feasibility studies are carried so as to
determine the worthiness and these include economic feasibility, technical feasibility, operational
feasibility as well as the social feasibility. Stimpson (2004) identifies the following feasibility
studies that have to be analysed so as to identify the worthiness of a project under study.

11
2.3.1 Technical Feasibility
Technical feasibility is the assessment of the technical equipment or resources of an organisation
taking into account their applicability to the expected needs of the proposed system requirements
(Rodger, 2005). This feasibility aims to identify all the equipment that will be required in the
development of the Vehicle licensing and tolling application assessing all the equipment that will
be required to successfully implement the system without problems.
The software as well as the hardware requirements are outlined on table 2.1 to check on the
expected equipment and their availability in specified quantities.
2.3.1.1 Hardware requirements
Table 2.1: Hardware requirements
Quantity Component Specifications Status
1 Hp Client Server 1TB Hardrive.
4 GB RAM.
Core i5 Processor.
Speed of 2.7 GHz.
This component is
available in the
organisation.
1 Backup Server 1TB Hardrive.
4 GB RAM.
Core i5 Processor.
Speed of 2.7 GHz.
This component is
currently not available
and needs to be
acquired.
1 Laptop 500 GB Hardrive.
4 GB RAM.
Core i3 processor or
better.
Speed of 2.3 GHz.
The laptop is available
meeting the minimum
specifications but
needs a RAM upgrade
1 CISCO router 2.4 to 2.5 GHz frequency
range
4 dB1 peak gain
The router is not
available and needs to
be acquired
2 Tablet 9.7 Inch screen or better
16 GB memory or better
The tablet is currently
not available and
needs to be acquired.
1 CISCO switch 24 port
Multi-mode fibre
This also needs to be
acquired.

12
2.3.1.2 Software requirements
Table 2.2: Software requirements
Quantity Component Specifications Status
1 Android Studio Android
Studio 3.0
CANARY 9
This is free for
download on the
internet.
2 Operating System 64-bit
Windows 7 or
better
Red Hat Linux
64-bit
operating
system
These have to be
acquired for
installation on client
server and backup
machines.
1 Dreamweaver Adobe dreamweaver
preferably version
CS6
This is available for
free download the
latest version on the
internet.
1 Xampp Xampp version 5.6 or
better
This is available for
free download the
latest version on the
internet.
2.3.1.3 Technical expertise
This involves the identification of the technical abilities of the available employees to be able to
use the proposed system. ZINARA has got employees capable enough to operate and debug the
application in the event of an error through its ICT department. Therefore the system will be
directed implemented in the organisation since there will be little training required so as to able
to put the proposed system into full operation. Hence the organisation is rich in technical
expertise and hence implementing the system will not bring problems to the organisation as a
whole.
2.3.2 Economic Feasibility
Economic feasibility is concerned about the economic benefits which will be brought by the

13
implementation of the system. Kendal (2006) states that the economic feasibility puts much
focus on the costs that are incurred in the development of the system and making sure they are
kept at minimum. The costs of the proposed system should be brought into light and be weighed
against the possible benefits to be enjoyed after the implementation of the system. The benefits
should outweigh the associated costs. Therefore if this condition is met then the system can then
be developed. When the proposed system becomes functional the system benefits will outweigh
the costs since the operational costs are likely to be low. The costs of acquiring the hardware and
software is low since most of the equipment is readily available which is also compatible and can
accommodate the requirements of the proposed system.
2.3.2.1 Development Costs
According to Jewell (2000), the development costs are the total expenses that are incurred in the
development of the project. Development costs are the costs ZINARA is to incur in the
development of the vehicle licensing and tolling application. Table 2.3 indicate the development
costs to be incurred in developing the licensing system.
Table 2.3: Development costs
Component Quantity Costs
Hp backup Server 1 $700
CISCO switch 1 $544
Tablet 1 $250
RAM upgrade 1 $45
Windows 7 operating
system
1 $150
Red hat Linux OS 1 $500
CISCO router 1 $1,100
Total developments costs $3289

14
2.3.2.2 Operational Costs
The operation costs are the costs which are incurred and associated with the day to day running
of the developed system (Cadle and Yeats, 2008). The costs incurred in the day to day running of
the system can be grouped into fixed and variable costs. Fixed costs can be in form of all the
costs incurred in the licensing of all the software to be used. Variable costs on the other hand can
be in form all the electricity bills. Table 2.4 outlines the operational costs to be incurred when
using the system:
Table 2.4: Operational Costs
Operational Cost Description 2018 2019 2020 2021 Total
Hardware maintenance $500 $200 $100 $50 $850
Software maintenance $1000 $900 $500 $100 $2500
Training and consultation $300 $150 $20 $20 $490
IT services and Networking $500 $250 $100 $70 $920
Total Operational costs $2300 $1500 $720 $240 $4760
2.3.2.3 Benefits
According to Lucey (2002), benefits are the favourable circumstances or advantages that are
obtained from the implementation of the proposed system. These benefits can be grouped into
tangible and intangible benefits. This implies that these some can be associated with a value that
is tangible, and some cannot be assigned with a value that is intangible.
a) Tangible benefits
According to Lucey (2002), tangible benefits are the favourable circumstances that can
be expressed in figurative terms or in monetary terms. These benefits can be further
explained on table 2.5.

15
Table 2.5: Tangible Benefits
Description 2018 2019 2020 2021 Total
Reduced recurring costs $800 $1000 $1100 $1500 $4,400
Time enquiries reduction $750 $900 $1000 $1200 $3,850
Reduced labour $900 $1000 $1100 $1250 $4,250
Total tangible benefits $2,450 $2,900 $3,200 $3950 $12,500
b) Intangible benefits
These are the favourable circumstances that are enjoyed by an organisation but these
cannot be quantifiable, measured or assigned a monetary value (Lucey, 2002). Therefore
no one can touch or feel these benefits. The non-tangible benefits likely to be enjoyed are
outlined below:
Reduced employee workload on handling motorists’ queries.
Customer satisfaction will be increased.
Reduced risk in the management’s decision making process since the system will
provide reports on a specific subject.
Increased motorist morale and that of employees as well.
2.3.2.4 Cost Benefit Analysis (CBA)
According to Cadle and Yeats (2008), the cost benefit analysis is a technique used in the
business to analyse the benefits of a certain course of action, whereby the benefits are summed
up against the associated costs of that particular action. To undertake this action the list of all the
benefits and the costs should be listed. The benefits in this case should include all the direct
benefits, indirect benefits that are for example increased customer satisfaction. Table 2.6 shows
the cost benefit analysis table which bring out all the benefits to be enjoyed after the
implementation of the proposed system:

16
Table 2.6: Cost benefit analysis
Description 2018 2019 2020 2021 Total
Benefits ($) ($) ($) ($) ($)
Tangible benefits 2,450 2,900 3,200 3,950 8,500
Total benefits 2,450 2,900 3,200 3,950 12,500
Costs
Operational Costs 2,300 1500 720 240 4760
Total costs (2,300) (1500) (720) (240) (4760)
Net Benefits 105 1,400 2,480 3,710 7,740
2.3.2.6 Net Present Value
Net present value refers to an investment evaluation technique which takes into account the
profitability of the project as well as the timing of the cash flows that are produced (Lucey,
2002). In the development of the project a 15% Discount rate was used as shown on table 2.7.
Net Present Value = Total benefits – Total costs
(1 + r) n
Whereby N: number of years and r: interest rate.

17
Table 2.7: Net Present Value
Year Net Cash flow
US $
Discount Factor
US $
N.P.V
US $
0 (3,289) 1,000 (3,289)
1 105 0.870 91.35
2 1400 0.756 1058.4
3 2480 0.658 1631.84
4 3710 0.572 2122.12
N.P.V 1614.71
The net present value of $1,614.71 shows that the system is viable enough to be implemented
and hence a feasible project.
2.3.2.6 Return On Investment (ROI)
According to Randall (1996), Return on Investment refers to a profitability measure, calculated
through dividing profit or income by the investment required in obtaining that income. ROI is
expressed as a percentage of the total investment benefits divided by its associated costs.
Return On Investment = Average Annual Profit * 100
Development Costs
$1,935 * 100
$3,289 =59%
The positive Return on Investment implies that the project being undertaken is viable and fruitful
hence the 59% result calculated above shows that the project is worthwhile to implement.

18
Economic feasibility brought out the monetary analysis of the implementation of the vehicle
licensing and tolling application. The analysis showed that the application will bring more
benefits than costs to ZINARA as an organisation through the cost benefit analysis. Therefore
the implementation of the system will be of benefit to the organisation considering the economic
feasibility.
2.3.3 Social Feasibility
Social feasibility is the assessment of the proposed system to determine the positive and negative
impacts of the proposed system to the people and the organisation and how it is accepted
(Kendal, 2006). The implementation of the vehicle licensing and tolling application will lessen
the workload among the ZINARA employees resulting in more time with their families thereby
enhancing their social life. The introduction of features like the one which enables motorists to
manage their fleet of cars also create some form of loyalty as well as transparency to the
employees since there will be a report to the owner of the vehicle if one of his cars pass through
the tollgate.
The development of the application will reduce the motorist’s grievances and bias towards
ZINARA as an organisation as the majority of the motorists always feel they are always robbed
of their hard earned cash in paying tolling fees. The development of the vehicle licensing and
tolling application however brought out some panic among the ZINARA employees who had
insecurities over their jobs. This on the other hand was tackled by explaining to them the
functionalities of the application since it did not replace their capabilities, but could be a useful
tool in making their work much easier through reducing number of client enquiries.
However the system will have a negative impact on the side of the ZINARA employees since the
number of employees required in handling customer request will be reduced. This will have a
negative impact in their social life since some will be retrenched and hence the system will be a
threat to their jobs.
Therefore the social feasibility highlighted issues which had to be addressed but however this
showed that the application would be useful to many in their workplaces, hence its
implementation will be a good decision.

19
2.3.4 Operational Feasibility
According to Rodger (2005), operational feasibility refers to the measure in which the proposed
system is going to tackle and eliminate the problems currently being faced by the organisation.
The problems to be addressed are the ones identified in the problem definition. This feasibility
study also measures the extent or the way in which is going to be used if it is to be successfully
implemented in the organisation. The ZINARA employees accepted the idea of the system
thereby contributing towards their perceived ease of use of the application since throughout the
development they all provided their input. Therefore no resistance could be encountered among
the workforce and hence the stakeholders of the organisation supported the initiative. This is due
to the following reasons:
The implementation of the vehicle licensing and tolling application could improve the
workload among the ZINARA employees in handling customers’ enquiries.
It will bring about transparency between the owners of large fleet of cars with their
drivers since a notification will be sent to the owner when his vehicle passes through a
tollgate.
2.4 Risk Analysis
Chavas (2004) defines risk analysis as the threats that can be encountered in the implementation
of the system and finding ways or techniques to react to those risks in a proficient viable way. In
the development of any project several risks are always a threat. However some of the risks
outlined are those that are likely to be encountered and the ways to mitigate them. Table 2.8
outlines the risks with their associated probabilities of occurrence as well as the ways to mitigate
them if they arise along the way.

20
Table 2.8: Risk analysis table
Risk Description Probability Of occurrence Prevention strategy
Resistance among
the employees to use
the system.
Medium This was avoided in the initial
development of the system whereby the
employees were involved in the
development process so as to avoid future
resistance.
Failure to finish the
project according to
the schedule.
High This could be tackled through drafting a
work plan with the associated activities
and completion times. These were to be
adhered to so as to avoid project slacking.
Lack of resources Medium A project budget was communicated to the
organisation so as to try and avoid such
occurrences since the expected equipment
required was well drafted with their
associated market prices.
Virus and malicious
software attack
High The ZINARA workstations are to be
installed with the Avira antivirus software
to be updated regularly so as to minimise
such an occurrence.
2.5 Stakeholder analysis
According to Chavas (2004), stakeholder refers to a forensic study and identification of the
various stakeholders and their reactions to the system. The stakeholder interests that affect the
system under development should be taken into consideration so to identify how one influences
the development. The stakeholders include several stakeholders who include the motorists,
ZINARA employees and management and the potential investors. Therefore the reactions of
these is analysed next.

21
2.5.1 Motorists
These are the important stakeholders to ZINARA since they are their main source of revenue.
The introduction of the vehicle licensing and tolling application will increase their conveniences.
The system addresses the problems they are currently facing in getting their services and by so
doing their interests are catered for to a greater extent.
2.5.2 Employees
The service delivery will be increased through the introduction of the vehicle licensing
application will increase their throughput. This lightens up their job in serving the clients even
when operating from a remote location. Therefore the amount of work load is reduced by the
system and hence addressing the employee concerns.
2.5.3 ZINARA management
The management through the introduction of the application can benefit largely through its use
by making use of reports facilities rather than collecting a lot of paperwork. Therefore the
easiness to arrive to crucial decision is further simplified. Therefore the application caters for the
management interests of making decision making easier.
2.5.4 Potential Investors
The application is available on the company website being available for anyone to use further
attracts other investors in the organisation who would envy to be part of the successful and
transparent organisation.
2.6 Project Work plan
Richman (2002) defines a project work plan as a summary that outlines the objectives of the
project refined giving a summary of the schedule that includes the tasks that are to be completed
so as to achieve the stated goals. The waterfall model was adopted in this research due to the way
in which its activities are undertaken that is its successive approach in completing the activities.
The time allocation to each activity is shown below through the use of the project work plan as
well as the Gantt chart. Table 2.9 shows the project work plan to be adhered to.

22
Table 2.9: Timing project schedule
Phase Start End Duration (weeks)
Introduction 20/02/17 06/03/17 3
Planning 06/03/17 03/04/17 5
Analysis 03/04/17 17/04/17 2
Design 17/04/17 15/05/17 5
Coding 15/05/17 03/07/17 7
Testing 03/07/17 07/08/17 5
Implementation 07/08/17 11/09/17 5
Maintenance 11/09/17 15/10/17 4
2.6.1 Gantt Chart
A Gantt chart is a horizontal chart which depicts the task and their associated time frames
(Richman, 2002). The assignments on the Gantt chart are recorded on its left side and the weeks
are the time scales on the top depicting the time frames for the project to be completed. Table
2.10 shows the Gantt chart depicting the activities to be done and time.

23
Table 2.10: Project Gantt chart
Months 1 2 3 4 5 6 7 8 9 10 11
Introduction
Planning
Analysis
Design
Coding
Testing
Implementation
Maintenance
Documentation
2.7 Conclusion
The chapter managed to analyse the system through the use of several evaluation techniques
which include the feasibility study and risk analysis. The feasibility analysis showed that the
benefits of the system outweigh the costs through the cost benefit analysis. The projects benefits
outweighed its associated costs and as a result this shows that the implementation of the system
will bring more good than harm financially to the organisation. There is also lower risk
associated with the system as the risk analysis suggest. The chapter also moves on to the work
plan which then outlines the schedule of the tasks to be completed. The analysis phase that
follows analyses the current system as the work plan suggest.

24
CHAPTER THREE: ANALYSIS PHASE
3.1 Introduction
This chapter is aimed at the analysis of the existing vehicle licensing system at ZINARA and
thereby exposing the shortcomings with the use of the system. This will thereby bring the need to
justify the importance of implementing the proposed system. In analysing the system several data
gathering methodologies are used in this chapter in gathering the required information so as to
come up with the solutions of the current system. After coming up with the weaknesses of the
system, the chapter further evaluates the alternatives so as to address the weaknesses of the
current system. These include the improvement of the current system, outsourcing and in-house
development and thereby the best alternative is then selected. The functional requirements are
also evaluated before the chapter end.
3.2 Data gathering methodologies
In a bid to obtain more accurate information or results, fact findings strategies were undertaken.
To investigate the actual operation of the current so as to gather all the data requirements which
might be of use in the development of the proposed system, techniques which include
observations, questionnaires as well as interviews were carried out. The three most common fact
finding techniques include observations, questionnaires and interviews (Shelly and Rosenblatt,
2010). An understanding of the current system was achieved through the use of these three most
common fact finding strategies and the findings helped in coming up with solutions to the
constraints of the existing system.
3.2.1 Interviews
Seidman (2013) defines an interview as a fact finding methodology that is intended to attain
information from a person’s oral reaction or requests. An interview is the most appropriate fact
finding methodology and in most cases in a research bring out most information and clarity as
compared to other fact finding strategies. The interviews were directed to the licensing officers
who use the system daily as well as the motorists who will be using the proposed application.
The interview questions which were directed to each stakeholder are attached to the appendix
section of this system documentation. The findings as well as the advantages and the associated
disadvantages of carrying out the fact finding using the interviews are discussed next:

25
3.2.1.1 Advantages
There was direct interaction with the ZINARA employees who are the daily users of the
existing system.
Some of the facts which could be difficult to be put into writing were discussed and this
further widened the discussion.
Gestures as well as emotions were also captured during the interviews and this proved
useful in mining some information relevant to the research.
The use of interviews as a fact finding was not taken seriously by the respondents and
therefore they brought out their views freely while also attending to the clients.
3.2.1.2 Disadvantages
There was danger of capturing incorrect information since the interviewee was attending
clients while at the same time responding to the interview questions.
Time was wasted in conducting the interview since there was some clarification needed
in some instances from both sides of the interviewer and the interviewee.
3.2.1.3 Findings from Interviews
The interviews were conducted targeting the ZINARA employees which are the Licensing
officers who use the existing system frequently. The interviewer discovered that some of these
employees were resistant to change. These employees in general sense thought of a new
workplace after the proposed system has been implemented. The system in reality would
enhance their productivity in giving out the licensing as well as making their job much easier
which was then an issue in which the interviewer addressed during the interview so as to bring to
bed all the fear among the employees such retrenchment issues. The interviews were also done
with the truck drivers who drive over long distances passing through several tollgates. Therefore
the findings proved that they encounter challenges when they drive over long distances or use a
certain route for the first time. This is due to the fact that some of the GPS technologies is not
functional in the country hence to view the map of all the tollgates and then budget for the toll
fees will then become a nightmare

26
3.2.2 Questionnaires
According to Kimberly (2006), questionnaires are a set of prepared questions answered by a
predefined order by a selected population so as to obtain information for a certain research. This
is a fact finding technique which is mostly suited when the targeted population is large and
therefore the views gathered will be large.
3.2.2.1 Advantages
Respondents attended to the questionnaires at their free time.
Information which was given by the responded was mostly direct and specific and
therefore easy to analyse.
Unbiased information was obtained since the methodology eliminates the fear of
victimisation.
3.2.2.2 Disadvantages
Some respondents decided against responding to certain questions which were the most
crucial areas in the research.
The respondents needed follow up in submitting back the questionnaires since some
threw them away since they were commuting.
The other respondents were biased towards pleasing and some responses were
disappointing.
3.2.2.3 Findings from Questionnaires
Different motorists were issued questionnaires at different points. These were issued out at
different intervals only to a restricted number of motorists. This was done so as to curb the
danger of obtaining similar results as one can influence the answer of the other motorists if
issued at the same time. This was done so as to eliminate the chances of acquiring similar
responses thereby obtain similar information which lacks variety of ideas and opinions.
The questionnaires also provided an optional option for one to fill in the personal details on the
questionnaire. This was done so as to curb the fear of victimisation among the responded since
their information was to be kept anonymous. The answers obtained by the investigator
undoubtedly contributed a larger extent to the successful progression of the proposed vehicle

27
licensing and tolling application. The specimen of the issued out questionnaire is attached to the
Appendix section of this documentation.
3.2.3 Observations
An observation is a fact finding technique where one gathers data by watching a certain
procedure or a routine being performed (Seidman, 2013). The fundamental objective in
observing the routine was to find if there is a problem existing within the procedures taken in the
process.
3.2.3.1 Advantages
First-hand information without bias was obtained since nothing was hidden from the
interviewer.
No disturbances to the operations of the organisations since the information will be
obtained by observation.
3.2.3.2 Disadvantages
There is no direct contact with the users of the system therefore limited facts are
obtained.
There is risk of misinterpretation of the situation since there is no room for clarification
from the users of the system.
3.2.3.3 Findings from Observations
This was done at the ZINARA office viewing the day to day operations of the current system of
vehicle licensing. The general morale was very high in the early hours of work and this reduced
with time and queues started moving slowly. This also helped as the information obtained was
not biased as the employees were not aware that they were operating under surveillance. The
observation was also done to the sprinters vying the Gweru-Shurugwi route. The problem in this
case could be encountered on the side of the those taxi owners who would require a report on the
number of times the sprinter passed through the tollgate so as to estimate the daily income to be
expected from his workers. Therefore after gathering all the information the need for the tolling
application which could provide a report on the number of times the vehicle could have passed
through a certain tollgate was needed.

28
3.3 Analysis of the existing system
Stair and Reynolds (2012) argue that analysis of the existing system is done to expose
weaknesses and strengths of the current system so that areas that need to be improved or added
are discovered. To develop a meaningful system, there is need to fully understand the system that
is currently in use. Jumping into developing the new ZINARA system can be equated to a doctor
who jumps into treating a patient without diagnosing the disease first. According to Gupta
(2005), analysis of the existing system is done with a finished goal of exposing weaknesses and
strengths of the current system. The current manual ZINARA license application and tolling
system has more disadvantages than advantages. These advantages and disadvantages are listed
below.
3.3.1 Advantages of the existing system
The current system is easy to use and anyone can use without much training and thus on-
job training is possible.
The system in place is easy to maintain and operate.
It is easy to understand how the current system works.
3.3.2 Disadvantages of the current system
The current system is slow in processing vehicle licenses to the point of taking twenty
minutes from the moments an applicant submits an application and the moment the
license is granted.
The current system lacks security, for example at one time a client sneaked into the
ZINARA offices and issued a license for himself resulting in the organisation losing
revenue.
It is current difficult for any motorists to determine the number of tollgates along their
routes and hence they cannot budget their toll fees. For example, a tourist who is touring
the country for the first time may need information regarding the number of toll gates
along a certain route and such information is currently not available.
The current system does not address data security issues since all data such as vehicle
license details is stored in flat files which are prone to any form of physical damage.

29
It is costly to maintain the current system since it requires huge spending in stationary
costs. And, it is costly for applicants to travel to the organisational premises.
Application and approval of licenses process is restricted to business hours only, thus
applicants who may be tied by work during the day cannot make applications outside
business hours.
Nepotism and corruption is rampant since the current system promotes face to face
interaction between clients and the ZINARA employees.
3.3.3 Description of current system.
After buying a vehicle by import or buying from local dealers, the vehicle owner will be issued a
Customs Clearance Certificate (CCC) and a temporary number plate that contains vehicle and
personal details by the Zimbabwe Revenue Authority. The vehicle owner is given a maximum
period of 14days from the date of issue of these documents for the owner to fully register and
license the vehicle. The owner will have to get the vehicle cleared by the Zimbabwe Republic
Police VTS Department. After the vehicle has been cleared the owner will proceed to the Vehicle
Inspection Department (VID) to get the vehicle weighed and inspected. The owner will be issued
with a document that contains vehicle chassis number, engine number, colour, type, weight and
its model. After acquiring these documents the vehicle owner will have to visit the nearest
ZINARA, Zimpost or ZIMRA to apply for number plates. After getting the vehicle number
plates, the owner will proceed to the nearest ZINARA offices or Agents to get the vehicle
licenced. Upon being issued a license the vehicle details which include the vehicle class, type
and colour are captured in the ZINARA licensing system. This information will then be used by
the tolling officers when the vehicle passes through a tollgate to assign charges based on the
vehicle class and to check on the expiry of the vehicle licenses.
3.4 Process analysis
Dixit (2010) defines a process as managed periods of a process that have been broken down, that
are used to communicate inputs together with outputs and operations that take place at each
stage. The upgrade of knowledge on the capacities of a process, and the potential system's
centres that can change and extending adequacy can all be identified through process
investigation. An activity diagram was utilised to demonstrate how information flows from one

30
stage to another. An activity diagram is a tool for modelling business process independent of
objects (Stair and Reynolds, 2012). Activity diagrams are almost similar to a dataflow diagrams
but they are used to model concurrent processes and the disregard data stores. Fig 3.1 shows the
activity diagram for the current system.
Fig 3.1: Activity diagram for the current vehicle licensing system

31
Key
Process Flow of data Decision Start node
End node
3.5 Data analysis
According to Bentley and Whitten (2007), data analysis is a tool that seeks to enhance the
representation of organisational data when there is need to implement the business database.
Data analysis promotes clarity on what data flows within the organisation and how it flows from
one process to another. According to Berthold and Land (2007), data analysis is carefully taken
into consideration and is a key facet in decision making upon deciding the most useful and
important data that must be taken not of. In short, data analysis can be loosely viewed as an
activity that includes the modelling, inspection and transformation of data into useful
information. Data analysis uses other tools in data representation and these are data flow
diagrams and context diagrams. These tools are discussed next.
3.5. 1 Context diagram
Grady (2006) states that a system is represented as it is blended in its operating environment in a
context diagram. Dixit (2010) add that the context diagram displays all the information relevant
to the system in the environment in which it operates. Fig 3.2 shows the context diagram for the
ZINARA current licensing system.

32
Fig 3.2: Context diagram for the current system
3.5.2 Dataflow diagram
Dataflow diagrams are another tool for data analysis and they also help in understanding how
data flows within an organisation. Dixit (2010) argues that dataflow diagrams demonstrate the
system’s most important features. Rajaraman (2016) also defines a dataflow diagram as a
diagrammatic tool that represents how data flows into and out of a system. A dataflow diagram is
an illustration of connected activities of functional requirements that are identified for a system
(Dixit, 2010). From an abstract point of view a dataflow diagram contains entities on the left-

33
hand side and processes in the middle and data stores on the far-right hand side. The arrows will
be pointing the direction in which data is flowing. The current system being used by ZINARA
has three entities as shown in fig 3.3.
Fig 3.3: Dataflow diagram for the current system
Accountant License
price

34
3.6 Weaknesses of the current system
The current system is prone to forgery since records are kept in cabinet where anyone can
get access to whenever he gets the keys.
The system is tiresome to use since it cannot compute any statistical data for decision
making. For example, calculating monthly collections from issue of licenses.
The current system does not offer a 24/7 service for motorists.
Clients cannot trace the progress of their applications.
The system in not cost effective due to large spending in stationary.
It is current difficult for any motorists to determine the number of tollgates along their
routes and hence they cannot budget their toll fees. For example, a tourist who is touring
the country for the first time may need information regarding the number of toll gates
along a certain route and such information is currently not available.
The current system does not address data security issues since all data such as vehicle
license details is stored in flat files which are prone to termites’ attack, fire and any form
of physical damage.
Nepotism and corruption is rampant since the current system promotes face to face
interaction between clients and the ZINARA employees.
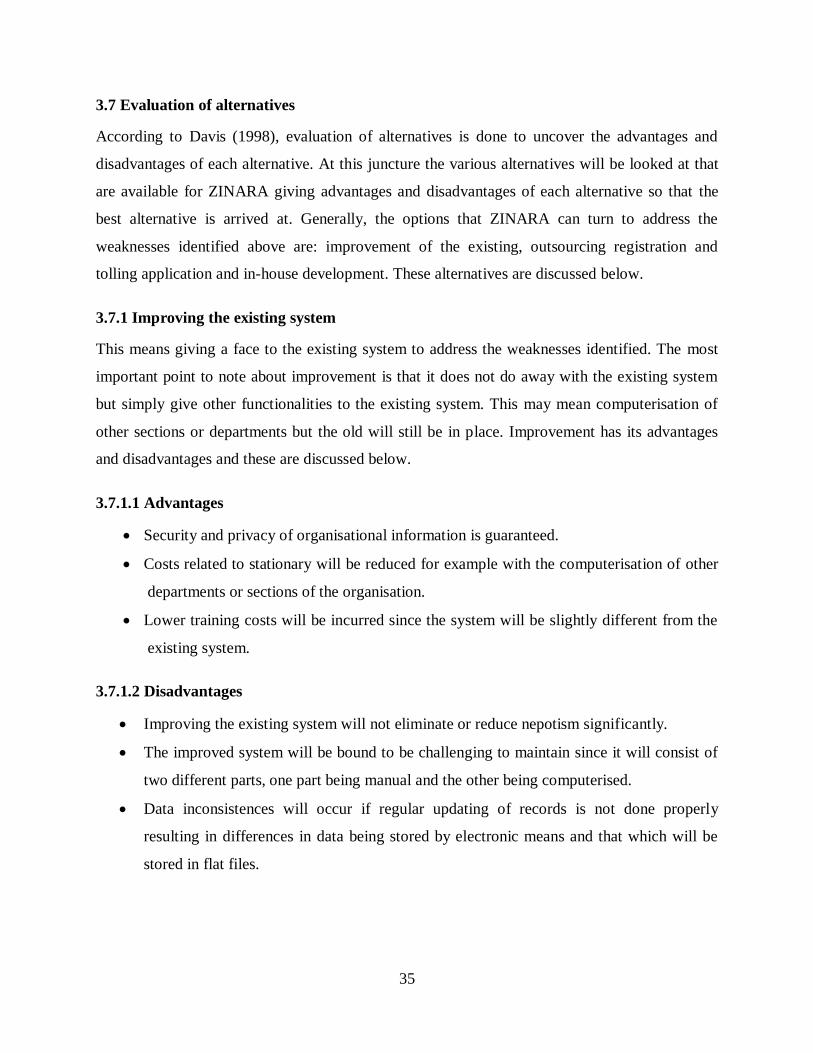
35
3.7 Evaluation of alternatives
According to Davis (1998), evaluation of alternatives is done to uncover the advantages and
disadvantages of each alternative. At this juncture the various alternatives will be looked at that
are available for ZINARA giving advantages and disadvantages of each alternative so that the
best alternative is arrived at. Generally, the options that ZINARA can turn to address the
weaknesses identified above are: improvement of the existing, outsourcing registration and
tolling application and in-house development. These alternatives are discussed below.
3.7.1 Improving the existing system
This means giving a face to the existing system to address the weaknesses identified. The most
important point to note about improvement is that it does not do away with the existing system
but simply give other functionalities to the existing system. This may mean computerisation of
other sections or departments but the old will still be in place. Improvement has its advantages
and disadvantages and these are discussed below.
3.7.1.1 Advantages
Security and privacy of organisational information is guaranteed.
Costs related to stationary will be reduced for example with the computerisation of other
departments or sections of the organisation.
Lower training costs will be incurred since the system will be slightly different from the
existing system.
3.7.1.2 Disadvantages
Improving the existing system will not eliminate or reduce nepotism significantly.
The improved system will be bound to be challenging to maintain since it will consist of
two different parts, one part being manual and the other being computerised.
Data inconsistences will occur if regular updating of records is not done properly
resulting in differences in data being stored by electronic means and that which will be
stored in flat files.

36
3.7.2 Outsourcing
According to Cadle and Yeats (2008), outsourcing is the process of surrendering the
organisation’s internal activities and decision rights to an external service provider. In this case
the ZINARA will buy already made licensing software and the organisation will be highly reliant
to the external service provider. Shelly and Rosenblatt (2010) argue that outsourcing is the act of
acquiring a software product from an external organisation and the organisation that supplies the
software can customise the software to suit the needs of the customer organisation or the
company can buy already made software that has similar functions that address the business
needs. Gupta (2005) best defines outsourcing as the acquisition from an external source of
software services that are similar to those that the organisation could have provided for itself.
3.7.2.1 Advantages
New ways of doing business can be shipped into the organisation (Seidman, 2013), for
example if the ZINARA licensing software is outsourced from a country like South
Africa it means South African licensing technology would have been shipped into
Zimbabwe and the organisation will embrace it.
Requirements of technical personnel will be lower. This means the IT department will
have time to prepare the organisation so that it can support the new technology, for
example buying servers, switches and installing them.
Organisational daily activities are not affected by the software development as the
employees will be attending to their day to day activities unlike in-house development.
3.7.2.2 Disadvantages
The system will be costly to maintain for example all upgrades will require the service
provider’s service and this will attract some charges. In the event that the organisation
wants some modifications to be applied to the system for example when the license fees
go up, this again will attract some charges.
Organisation’s information security can be compromised during the requirements
gathering stage and the information can end up in the wrong hands and used for
malicious purposes.

37
The source code provided may be vague and difficult to understand so as to make it
difficult to upgrade the system.
The move can demotivate the ICT department since it may insinuate their incapacity it
software development.
3.7.3 In-house development
According to Shelly and Rosenblatt (2010), in-house development refers to the development of
software internally by the ICT department in order to address the organisation needs. The option
of in-house development has become increasingly more viable and common due to expansion of
the software industry and the coming of open source software development tools such as android
studio and PHP.
3.7.3.1 Advantages
The software product usually meets the requirements of the organisation since it highly
involves user involvement during software development
The organisation will incur lower maintenance costs since the system upgrades will be
undertaken by the ICT department unlike by the external entity.
A comprehensive documentation will be kept for references purposes.
Lower development costs will be incurred by the organisation since the personnel will be
readily available.
In-house development also motivates the ICT department personnel since they will be
trusted by the users they support and supporting the users will be easy since the ICT staff
will be highly vested with the system’s operations.
Organisation’s security is guaranteed since data gathered during data gathering stage will
be kept and used internally by the ICT department.
3.7.3.2 Disadvantages
Software development process usually takes longer since the ICT department does not
specialise in software development.
This shuts thee door for new innovations and new ways of doing business which could be
shipped into the organisation by outsourcing process.

38
From the above information one may not be far away from the truth to conclude that in-house
development is the best option. This is so because it has a lot of crucial advantages and also the
development costs of US$3289 calculated in chapter 2 of this document. Outsourcing the
software can also be a tempting option with a price of US$1900 for the licensing software on the
Amazon website. However this option is not viable due to the fact that the organisation will incur
costs such as maintenance and upgrading costs in the long term. Improving the system can leave
can also lead to higher costs since costs such as stationery with the other part being a manual
system will remain. This will cost the organisation close to US$1300 a year in stationery and
maintenance and hence can cost the organisation in the long run. Therefore we can conclude that
the in-house development can be afforded by the organisation and the benefits that will be
enjoyed by the organisation can justify this option.
3.8 Requirements Analysis
Grady (2006) insists that the analysis of the user requirements should be done properly so as to
match or tally during the design phase with the development concepts. According to Kendal
(2006), requirements analysis involves scrutinizing the whole system’s domain which
incorporates the hardware, software and the human resources in terms of how they interact and
depend on each other. These requirements are grouped into functional and non-functional
requirements. These will be discussed separately starting with the functional requirements.
3.8.1 Functional requirements
According to Thompson (2013), functional requirements are the targets of the real design of the
system. During the system development at the design phase, the functional requirements may be
ascertained as the requirements that are initially identified and are difficult to identify (Dufresne,
2008). In short, functional requirements are specific functionalities that describe what the system
is supposed to accomplish. The new ZINARA vehicle licensing and tolling application will
enable the following key functions:
Concurrent access to the information and usage of the system
24/7 service will be provided
Online tracking of applications and calculation of toll fees.

39
The new system will also support uploading and downloading of files for example,
downloading a license form.
Fig 3.4: Use Case diagram
3.8.2 Non-functional requirements
Kasse (2008) argues that the way in which a system will work is ignored by the non-functional
requirements. More so, according to Rozanski and Woods (2012), it is easy to identify non-
functional requirements during the survey of the functional requirements because the pair is
interconnected. After carrying out a detailed analysis of the existing system the non-functional
requirements for the ZINARA new system were found which include:
Security- Access control methods such as the use of strong onetime passwords and
usernames will restrict those without necessary privileges to gain unauthorised access to
the system will be enforced.

40
Reliability- the system will be highly reliable since a backup server will be installed so
that if that if one fails the other will take over. This will not affect the user information
since there will be hard disk mappings such that every transaction that takes place in one
server will be simultaneously duplicated in another server.
Supportability- the proposed system shall be easy to install, configure and maintain.
Operation- the new ZINARA vehicle licensing and tolling system will be accessible both
in the intranet and through the World Wide Web (www) and anyone can access the
services from any part of the country as long they have internet connection.
Usability- the new system will be efficient to use for example it will take about a
minute for the applicant to make an application and submit online. The author took his
time in addressing user perceived ease of use and systems perceived usefulness and he
managed to balance the two aspects to ensure easy task accomplishment. The system will
also be easy to use.
3.8.3 Constraints of the success of the system development
Along the way from the system development through its implementation to its usage, a handful
of drawbacks can be expected and this calls for a lot of measures so as to manage the severity of
these constraints. In any case, the challenges perhaps are experienced in the midst of various
motivations behind the improvement procedure of the new system. The users of the system may
be resistant to change due to fear of loss of jobs. Some of the constraints are as follows:
The implementation process will require some considerable amount of time since the
organisation has a lot of branches and agents scattered throughout the country.
Also resources constraints will come as a major blow to the organisation since it is
currently facing liquidity crisis.
The accomplishment of the new system is not flawless in any case since programming
errors and also the generation of the required algorithms may present itself as a challenge.
Time- it is a challenging task to develop a system that meets all the user requirements
within the stipulated time.

41
3.9 Conclusion
This chapter concentrated of the analysis of the existing system with the help of several data
gathering tools such as interviews, questionnaires and observation. Other tools such as data flow
diagrams were also of great use in acquiring the detailed information about the existing system.
The chapter also articulated several options that are available for grab by the ZINARA. The
chapter consequently concluded that in-house development is the best after considering the
advantages of in-house and also the affordability of developing the system in-house. After
making this conclusion the project will now have to go straight to the next chapter which is the
design phase where the proposed system functionality on how the system is going to work since
the proposed system will be developed internally.

42
CHAPTER FOUR: DESIGN PHASE
4.1 Introduction
With all the information gathered and conclusion being made that there is need for a new system,
concentration is now being put on designing the new system. This chapter covers the system
design of the system, database design and architectural design. Use will be made of graphical
and tabular presentation to show how the new system will work. Input and output forms will also
be shown and by the end of this chapter the reader will have a clear picture of the system and a
detailed knowledge of the security issues that will be addressed and the reader will be left with
no doubt that the new system addresses the needs of the ZINARA and its stake holders. The
author begins the chapter by looking at system design as part of the design phase.
4.2 System design
According to Stair and Reynolds (2012), system design can be loosely defined as a system
development phase that concentrate on how the proposed system is going to work with the
objective of addressing a particular problem(s). System design is most regarded by most authors
as the summary of the dataflow diagram and the context diagram. This part of the design phase
also outlines the sequence of execution of tasks or the sequence of processes one after the other.
User needs should be met, however it should be noted and observed that these needs should not
conflict with the system’s objectives that were stated in chapter one. For example users may need
a system that is easy to use, a system that has very little authentication whilst exposing the
system to network threats such as hacking and other forms of harm.
4.2.1 Description of the proposed system
After fully understanding the problems of the current system whereby motorists fail to know in
advance their budgets for tollgates proposal is now being made for a new system whereby
motorists will download the ZINARA licensing and tolling android application that will be
readily available for download. After downloading and installing the application, motorists will
be required to sign up for an account with the ZINARA. The application will contain options for
registering a new vehicle, application for a vehicle license and vehicle tracking option. Motorists
will be able to calculate the total bill for tollgates on the application by simply selecting the route
that they would wish to use, for example a tourist in Victoria may wish to complete his tour by

43
visiting the Matopo hills and there would need to know how much money to spare for tollgates.
In addition to that, motorists can also register their vehicles on the application and the application
will notify the owner each time the vehicle passes any of the country’s tollgates.
This will help those commuter omnibus owners to monitor the movement of their fleet. The
application functions will also give the vehicle owners option to view a report of the number of
tollgates that their vehicles would have passed and the total amount that they would have spent
within a certain time interval. This will allow transport owners to plan well. Furthermore, the
application enables the motorists to track their vehicles and help them recover them. When a
motorist loses a vehicle, he will simply notify the ZINARA through the application and the lost
vehicle will be put on the wanted vehicles and upon passing any of Zimbabwean tollgates the
tolling system will give a signal to the officials that the vehicle is on the wanted list before it
passes the tollgate. This will be made by using the vehicle registration number as the primary
key. With the growing importation of vehicles from Japan it has become a challenge for
ZINARA to register and issue vehicle licenses hence to alleviate this challenge the new
application will also allow motorist to apply for vehicle license and renew their vehicle licenses.
This feature will also reduce the congestion of vehicle owners at ZINARA offices at the end of
quarter periods when vehicle licenses expire. The ZINARA officials will also be able to issue
and disburse vehicle licenses right into the account of the license applicant.
4.2.2 Context diagram and Dataflow diagram
According to Barnes (2001), a context diagram is a diagram that gives system boundaries and
shows what data is entered into the system and what data is extracted from the system each user
or entity. Shelly and Rosenblatt (2011) summarize the definition of a context diagram to simply a
diagram that gives an aerial view of an organisation’s business scope and limits. In order to
equip the reader with an abstract picture of the proposed system, a context diagram was
constructed for the ZINARA’s new system and is shown in fig 4.1. The new system consists of
five entities namely the licensing officer, the motorist, tollgate officer, police officer and the
system administrator.

44
Fig 4.1: Context diagram for the ZINARA vehicle Registration and Tolling new system
Key

45
4.2.3 Dataflow diagram of the proposed system
The new system’s most fundamental areas were shown by the context diagram drawn so far
however the context diagram did not show how exactly the information flows within the
proposed system. This calls for use of the dataflow diagram to show the flow of information
inside this new. Gupta (2005) denotes that a dataflow diagram is a tool that is used for
representing how data flows within a system. Barnes (2001) highlights that a dataflow diagram
are a tool used by analysts to understand how data moves in and out of a system in order to get
an appreciation of how a system works. According to Hartley and Pirbhai (1987), a dataflow
diagrams is an illustration of interconnected activities of functional requirements that are
identified for a certain system. A dataflow diagram contains entities to the left side and processes
in the middle and lastly data stores on the right side. Processes are numbered from number one
going on in ascending order showing the order in which data moves in the system. Dataflow
diagrams demonstrate the system’s most fundamental features or functions graphically through
the use of well-defined or organized symbols. Fig 4.2 shows the dataflow diagram for the new
ZINARA system.
The application is in two parts that is the vehicle licensing section and the tolling section.
Therefore the first dataflow diagram on fig 4.2 outlines the processes that occur in the vehicle
licensing section. The second dataflow diagram on fig 4.3 also indicates the process that takes
place in the tolling section which includes reporting a car hijack.

46
Fig 4.2: Dataflow diagram one for the proposed system

47
Fig 4.3: Dataflow diagram two for the proposed system
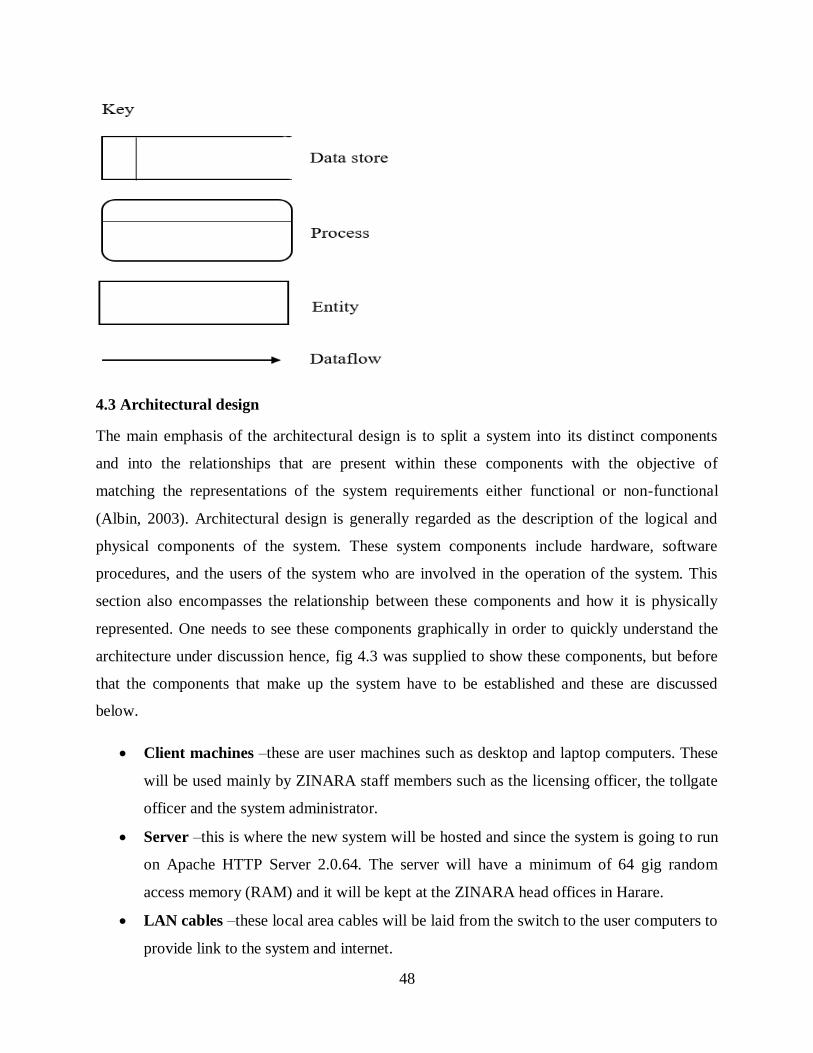
48
4.3 Architectural design
The main emphasis of the architectural design is to split a system into its distinct components
and into the relationships that are present within these components with the objective of
matching the representations of the system requirements either functional or non-functional
(Albin, 2003). Architectural design is generally regarded as the description of the logical and
physical components of the system. These system components include hardware, software
procedures, and the users of the system who are involved in the operation of the system. This
section also encompasses the relationship between these components and how it is physically
represented. One needs to see these components graphically in order to quickly understand the
architecture under discussion hence, fig 4.3 was supplied to show these components, but before
that the components that make up the system have to be established and these are discussed
below.
Client machines –these are user machines such as desktop and laptop computers. These
will be used mainly by ZINARA staff members such as the licensing officer, the tollgate
officer and the system administrator.
Server –this is where the new system will be hosted and since the system is going to run
on Apache HTTP Server 2.0.64. The server will have a minimum of 64 gig random
access memory (RAM) and it will be kept at the ZINARA head offices in Harare.
LAN cables –these local area cables will be laid from the switch to the user computers to
provide link to the system and internet.

49
2 ruckus Wi-Fi routers –these will be used to offer internet access to the users who will
be using tablets, other mobile devices and laptop users can connect on this device.
Internet proxy server –to enable users to connect to the internet. The proxy server will
have 16 gig RAM and 1 TB hard drive.
The architectural design of the ZINARA proposed system.
Fig 4.4: Architectural design of the new system.
Source: Dixit (2007)
4.4 Physical design
When one hears the word ‘physical’ what comes into mind is the word tangible. Hence the
physical design mostly touches hardware components and not software components. Gupta
(2005) states that systems analysts make use of the physical design to successfully design a
system. Other leading proponents in system design, Stair and Reynolds (2012), define physical
design as the description of hardware components that are required to develop a system. The new
system will need an environment where it will operate and this calls for other components such
as the servers, network. ZINARA is an organisation that has some of its operations computerized
XAMPP
MySQL

50
and for that reason it is pleasing that some of the hardware components are already in place and
there is no need to buy them what is only required is to buy the remainder that facilitates the
operation of the system. One of the biggest tasks that are left is the installation of one more
router and another 24 port switch. Below are the physical design requirements that are necessary
for the operation of the new system.
4.4.1 Hardware requirements for the proposed system
One laptop computer and a backup server all with the following specifications
- 8gb RAM
- 500 HDD
- Corei5 microprocessors
These will be used by the licensing officer to issue licenses and by the systems administrator to
create user accounts and for general systems administration such as monitoring network quality
and troubleshooting networking problems.
Server –this is where the new system will be hosted and since the system is going to run
on Apache HTTP Server 2.0.64. The server will have a minimum random access memory
of 16 gigabytes and a Hard Disk Drive of 1 Terabytes.
CISCO router –this will be responsible for assigning Internet Protocol addresses to user
computers and network printers so that they can connect to the network. It is from this
device that an uplink cable will be run to the switch.
A 24 port CISCO switch– this switch will be used to link all client computers to the
internet and or intranet. All network cables will be constructed from this switch to user
computers.
LAN cables- these will be used to link the users to the network. Cables will be laid from
the server room where the switch will be installed to the user offices.
Internet proxy server- the proxy server will be there to link users to the internet and also
monitor and control sites what sites users should visit and restricting them to some of
them.
One LaserJet printer- the printer will be configured on the network so that all the
printers will be able to print on this printer via network. This will save resources such as

51
costs involved in buying other printers and printer cartridge costs. The printer will be
used to print any necessary documents.
4.4.2 Software requirements
MySQL version 5.3 or better
Android studio- for developing the ZINARA android application
System center endpoint protection- software for protecting machines against computer
virus.
Windows 7 or better- this will act as platform on which the system will run and other
supporting applications.
PHP scripting language –for development of web
application
Fig 4.5 Network diagram for the proposed system
Source: Rajaraman (2006).
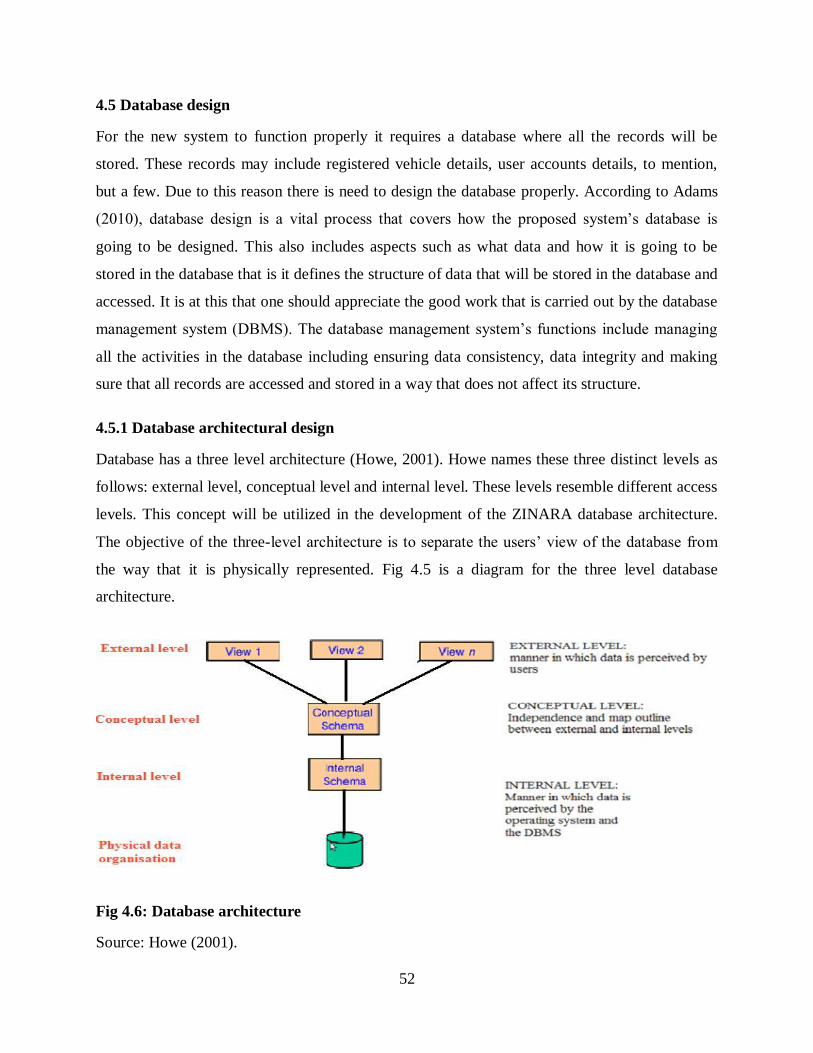
52
4.5 Database design
For the new system to function properly it requires a database where all the records will be
stored. These records may include registered vehicle details, user accounts details, to mention,
but a few. Due to this reason there is need to design the database properly. According to Adams
(2010), database design is a vital process that covers how the proposed system’s database is
going to be designed. This also includes aspects such as what data and how it is going to be
stored in the database that is it defines the structure of data that will be stored in the database and
accessed. It is at this that one should appreciate the good work that is carried out by the database
management system (DBMS). The database management system’s functions include managing
all the activities in the database including ensuring data consistency, data integrity and making
sure that all records are accessed and stored in a way that does not affect its structure.
4.5.1 Database architectural design
Database has a three level architecture (Howe, 2001). Howe names these three distinct levels as
follows: external level, conceptual level and internal level. These levels resemble different access
levels. This concept will be utilized in the development of the ZINARA database architecture.
The objective of the three-level architecture is to separate the users’ view of the database from
the way that it is physically represented. Fig 4.5 is a diagram for the three level database
architecture.
Fig 4.6: Database architecture
Source: Howe (2001).

53
a) External level
According to Howe (2001), external level of a database is the local representation of the
database that any database application might desire. This level gives a customer’s view of the
database through indexing information or data which is relevant only to a particular user
(Coronel and Morris, 2014). This means that each user gets a customized view of the
database. External level of a database also includes graphical representation of information
such as interfaces. This helps to ensure data security as each user will get only information
that is relevant to him/her. For instance each applicant will only view applications that he has
made and he cannot view applications made by others or track other applicants’ applications.
This also describes part of the database that is particular to a certain user. For instance a large
organisation like ZINARA contains many departments and users in one department will need
different user interface of the information stored in the database. Some views may require
derived of calculated data. For example a licensing officer may see payments paid at tollgates
by motorists but the vehicle will see the total of the too fees that he would have paid in a
specific time interval.
b) Conceptual level
According to Coronel and Morris (2014), entities, data types, relationships and client limitations
are the core areas of the conceptual view. Howe (2001) also supports this idea and adds that data
that an organisation may be interested in storing is described by the conceptual level. This level
also shows the entities, attributes and relationships that exist between entities for example the
relation between the motorist and the licensing officer. This level is also represents constraints
on data, security and integrity information.
c) The internal view
The internal level covers the physical representation of the database on the computer and may be
specified in some programming language. It describes how data is physically stored in terms of
file organisation and data structures. Howe (2001) states that the internal view shows how data
that has been stored in a database is diffused into that database at the level of storage. Thus the
internal level addresses how the machine interacts with data as supported by Coronel and Morris
(2014) who argue that the internal level has its own distinct mechanism that defines the actual

54
physical structure of storage of the database. The internal level is also concerned with the
allocation of memory spaces for data and indexes and describing the forms that will be taken by
records when stored. Data compression and encryption, assembling records into files also take
place in this level.
4.5.2 Logical design
Stair and Reynolds (2012) define logical design as the description of functional requirement of
an information system. The entity relationship diagram for the new system was constructed with
the goal of making the reader understand the relationship between entities for example the
relationship between the applicant and economist. Bearing in mind that the new system is simply
a modified version of the existing, no much challenges were encountered in coming up with the
entity relationship diagrams since information of the existing system was used. Entity
relationship diagrams are used when an analyst wants to bring several views of different views
together (Mylopoulos and Brodie, 1989). Two techniques were employed in the representation
of the structure of the ZIMRA’s proposed system’s database. Tables were first and entity
relationship diagram was constructed later. Table 4.1 to table 4.8 shows tables and their data
types and description of several fields.
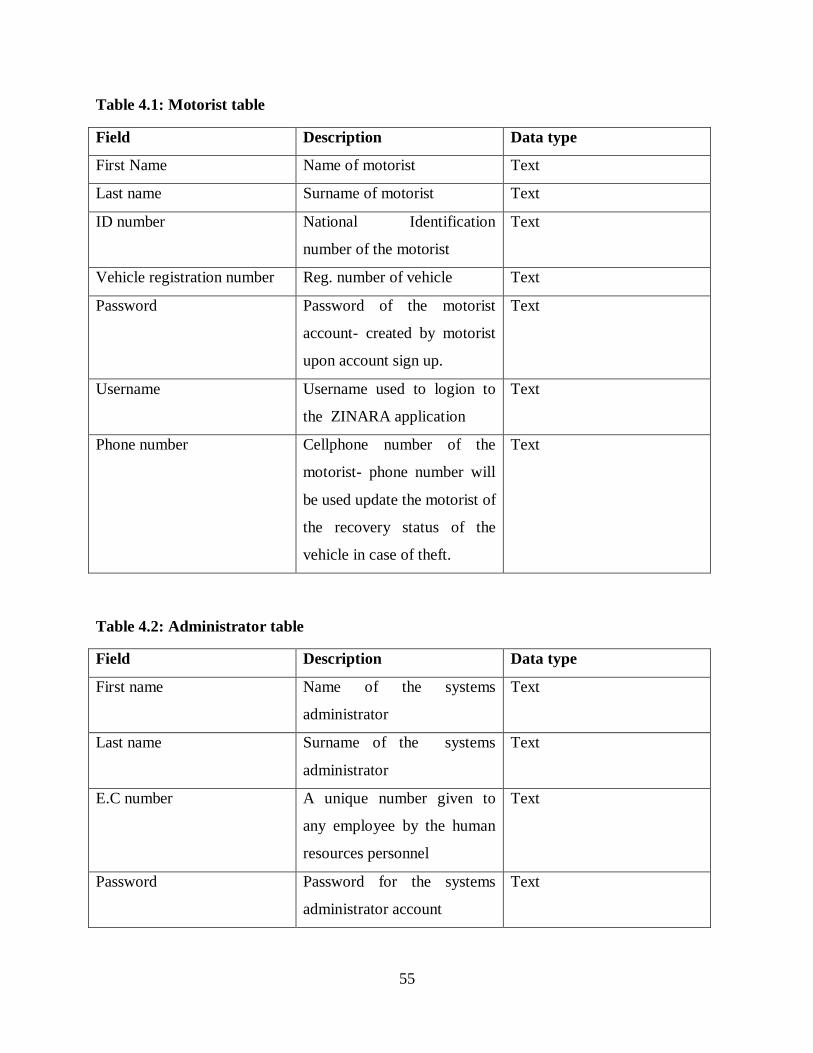
55
Table 4.1: Motorist table
Field Description Data type
First Name Name of motorist Text
Last name Surname of motorist Text
ID number National Identification
number of the motorist
Text
Vehicle registration number Reg. number of vehicle Text
Password Password of the motorist
account- created by motorist
upon account sign up.
Text
Username Username used to logion to
the ZINARA application
Text
Phone number Cellphone number of the
motorist- phone number will
be used update the motorist of
the recovery status of the
vehicle in case of theft.
Text
Table 4.2: Administrator table
Field Description Data type
First name Name of the systems
administrator
Text
Last name Surname of the systems
administrator
Text
E.C number A unique number given to
any employee by the human
resources personnel
Text
Password Password for the systems
administrator account
Text

56
Table 4.3: Licensing officer table
Field Description Data type
First name Name of the licensing officer Text
Last name Surname of the licensing
officer
Text
E.C number A unique number given to
any employee by the human
resources personnel
Text
Password Password used by the
licensing officer to log into
the ZINARA system.
Text
Access level Licensing officer’s system
privileges
Text
Table 4.4: Police officer table
Field Description Data type
First name Name of the police officer Text
Last name Surname of the police officer Text
E.C number A unique number given to
any employee by the human
resources personnel
Text
Password Password used by the police
officer to log into the
ZINARA system.
Text
Location The police camp address for
the police officer
Text
Phone number Name of the police officer Text

57
Table 4.5: Tollgate officer table
Field Description Data type
First name Name of the tollgate officer Text
Last name Surname of the tollgate
officer
Text
E.C number A unique number given to
any employee by the human
resources personnel
Text
Password Password used by the tollgate
officer to log into the
ZINARA system.
Text
Access level Tollgate officer’s system
privileges
Text
Table 4.6: Vehicle license
Field Description Data type
License number Unique number given to a
vehicle license by the system
Text
Holder name Name of the owner of the
vehicle license
Text
ID number National identification
number of the license holder.
Text
Date of issue Date on which the vehicle
license was issued or renewed
Date
Expiry date Date on which the vehicle
license expires
Date
Amount paid Amount of money paid for
the license.
Integer

58
Table 4.7: Vehicle license application table
Field Description Data type
Applicant First name Name of the applicant Text
Applicant second name Surname of the applicant Text
ID number National identification
number of the applicant.
Text
Vehicle category The size of the vehicle,
classed as light vehicle and
heavy vehicle
Text
Table 4.8: Vehicle license renewal table
Field Description Data type
Applicant First name Name of the applicant Text
Applicant second name Surname of the applicant Text
ID number National identification
number of the applicant.
Text
Vehicle registration number Registration number of the
vehicle
Text
Vehicle category The size of the vehicle,
classed as light vehicle and
heavy vehicle
Text
4.5.3 Entity Relationship Diagram
Database architectural design also encompasses entity relationship diagrams. This technique
allows us to show all the entities shown in the dataflow diagram graphically to enhance deeper
understanding of how one entity is related to another and the type of relationship that exist
among them. Several authors have written works on entity relationships. Although they
explained entity relationship diagrams in different wording, it was noted that all these authors
tend to agree that the entity relationship diagram is an important tool in developing database

59
architecture or a new system’s database. According to Conger (1994), an entity relationship
diagram is the graphical representation of the relationships between entities and is an important
facet when developing a new system for an organisation. Excellent identification of entities and
relationship ensures development of a system’s database. Entity relationship diagrams are high
level data models for higher level description of the conceptual schema of the database.
Enhanced Entity relationship diagrams use entities, relationships and attributes and their
cardinalities to show important information about a system’s database. Fig 4.6 shows the
enhanced entity relationship diagram for the new system.

60
Fig 4.7: Enhanced entity relationship diagram for the new system

61
4.6 Program Design
A program is a set of instructions that tell a computer what to do. Hence, Ulrich (2000) argue
that program design covers program modules, classes, and functions of a system that are
interfaced to the users of the system. In the context of the ZINARA new system program design
will thus include all processes involved from the moment an applicant applies for a vehicle
license until he is granted the license, all the sequence of processes from the moment the
motorist or vehicle owner reports theft of a vehicle until it is recovered are all covered under this
section. Studies have shown that users prefer systems that are easy to use to those that are
complex although they may accomplish their tasks. The system’s Ease of Use affects its
acceptability. In this regard, a Graphical User interface was preferred in the interface design to
facilitate communication between the users and the new ZINARA application. Hence, it is now
clear that the new system will be easy to implement. Each and every component will be looked at
separately starting with the package diagram.
4.6.1 Package Diagram
According to Conger (1994), a package diagram is a unique diagrammatical representation of the
whole system highlighting the main composition of the system modules and how they are
connected to one another. The new ZINARA android system offers vehicle license applications
facility to apply for vehicle license and receive license on the application in the comfort of their
home. Fig 4.7 shows the package diagram for the ZINARA’s new system.

62
Fig 4.8: Package diagram for the proposed system
4.6.2 Class Diagram
According to Conger (1994), a class diagram is a graphical representation of the system by
showing all the classes found within a system, their attributes and their relationships. Generally,
the total number of entities in a system equals the total number of classes hence all the entities
identified in fig 4.2 will be represented in class diagram below. Two ways are used to show
classes and these are association and inheritance. Instances within each class are connected
relationships called association whilst inheritance is the relationship between super classes and

63
subclasses. Fig 4.9 shows the class diagram for the ZINARA’s vehicle registration and tolling
system.
Fig 4.9: Class diagram for the new system

64
Key
4.6.3 Sequence Diagram
A sequence diagram can be imagined as an x-ray of the system showing the internal composition
of the internal composition of the system so that a detailed picture of the overall system can be
drawn about the logic behind the design of the system. To enlighten the reader about the logic of
the ZINARA’s internal system, a sequence diagram for the ZINARA’s new system was included
and it is shown in fig 4.9.
Fig 4.10: Sequence diagram for the proposed system

65
4.7 Interface design
According to Galitz (2000), several practices have been put in place pertaining interface design.
The everyday use of computers is largely dependent of the interface design in the first place
(Stone, 2005). Stone’s idea clearly suggests that a system’s interface design has a greater effect
on the users’ attitude towards use. Users usually prefer systems that are ease to and that require
less effort to use that is systems that have less processes and procedures. To counter this, the
ZINARA’s interfaces were designed in such a way that it will be difficult to spell one’s name
than to use the new system. Given two forms of communication between the computer and the
user, the GUI was chosen compared to the command based that is more daunting and strenuous
to the users which requires the user to known the commands by heart. A graphical user interface
(GUI) is a form of communication between the user and the computer through windows, icons,
and menus and pointers (WIMP). This minimizes errors since the user will be required not to
know the commands by heart. Bearing in mind that the most important part of the system is the
interaction between the system and its users, adequate time was set aside for interface design to
allow accurate presentation of ideas and system functionalities by showing how data will be fed
into the system and the format of the output that users get. Interface design will be looked at first
before moving on to menus, submenus and output design later.
4.7.1 Input design
Perfection should be ensured at the input design stage to reduce errors by users (Rajaraman,
2006). The ZINARA’s proposed system will contain several input forms for data input by users
for example vehicle license application form, login form, user creation forms, to mention a few.
The most important aspect in the design phase is probably the input design (Teixeira & Iradley,
2003). To ensure that input from users will be accurate and less erroneous use will m made of
data validation and verification. The system will accept only input that is relevant in the field it
will be entered and of correct data type. For example, the system will not accept integers where
text is needed.

66
a) Applicant sign up form.
For the motorists to start using the organisation’s system they have to sign up for an account
and login later after successful signing up. Fig 4.11 shows the layout and the corresponding
details upon client signing up
Fig 4.11: Client sign up form
b) Applicant Login form
After successful signup the user will be redirected to the client login page so that he can login
for the first time. And also so that he can test his credentials and start to enjoy the
organisation’s unlimited services. Fig 4.12 is the client login.

67
Fig 4.12: Client login form
c) Vehicle license application form
Generally, clients will not take time before applying for a vehicle license since it is the main
reason for signing although there are some functions. Fig 4.13 is the vehicle license
application form.
ZINARA Vehicle Licensing and Tolling
Application
Username
Password
Login Cancel
Client login

68
Fig 4.13: Vehicle license application form
ZINARA Vehicle Licensing and Tolling
Application
Applicant name
Surname
National ID no
Cancel
Vehicle type
I have read and l agree to the terms and conditions
Engine number
Application no.
Vehicle colour
Submit

69
d) Toll fees calculation form
As mention in the description of the proposed system, the new ZINARA system will help
tourist and motorist to ascertain their toll fees budget when travelling from one point to
another, below is a diagram showing the form that assists users in making calculations. The
information that the user needs to know is the destination and the route. Fig 4.14 shows the
toll fees calculation form.
Fig 4.14: Toll fees calculation form
ZINARA Vehicle Licensing and Tolling
Application
From To
Total Toll fees (USD)
Cancel
Harare
Toll fees
calculation
Calculate
(Current town) (Destination town)
Vehicle size Heavy
vehicle
Light vehicle
No. of tollgates

70
e) Administrator staff account creation form
The systems administrator is will be responsible for staff account creation. This is because
the staff members will be having higher privileges in the system hence their accounts should
be created by the systems administrator who will in turn monitor their actions since they can
be tracked if anything goes wrong. Only those staff members who have a direct role in the
vehicle registration and tracking system will have their accounts created by the systems
administrator. Fig 4.15 shows the account creation form.
Fig 4.15: Account creation
ZINARA Vehicle Licensing and Tolling
Application
Designation
Cancel
Password
Add New User
Create account
Last Name
First name
Login Details
E.C number
Access level
Ordinary user
Global administrator
Administrator

71
f) Staff login form
After all the staff accounts have been created staff members can login on the following form.
The licensing officer, the police officer and the tollgate officer can login on this page. Fig
4.16 shows staff login page.
4.7.1.1
4.7.2
4.8
4.9
4.9.1
4.9.2
4.9.3
4.10
Fig 4.16: Staff login form
g) Administrator login form
The systems administrator logs in from a different login page. This was done with a finished
objective of eliminating confusion and also the login page index and the static IP address for
the systems administrator’s computer will be defined in the hub hence restricting access to
the administrator login page. The systems administrator uses his/her E.C number and
password to login into the system and his access level is defined in the system. Fig 4.17
shows administrator login page.
ZINARA Vehicle Licensing and Tolling
Application
E.C number
Password
Login Cancel
Staff login

72
Fig 4.17: Administrator login form
4.7.2 Main menu
The main menu of a system refers to the main page or home page that contains all the necessary
links to other sub-menus or pages. The ZINARA new system home page was developed with the
main intention to give users a simplified but yet comprehensive home page with all links leading
to other pages.
a) Staff main menu
Since the ZINARA new system contains an android application and the PHP system that
will be used mainly by the ZINARA staff, the menus and sub-menus will be shown
differently in order not to confuse the reader on these menus. The main menu for clients, for
the administrator and for the staff members (licensing officer, tollgate officer and police
officer) will be shown separately. Fig 4.18 shows main menu for ZINARA staff.
ZINARA Vehicle Licensing and Tolling
Application
E.C number
Password
Login Cancel
Administrator Login

73
Fig 4.18: Staff main menu
Client main menu
Applicant or client after logging in will be directed to the home page where he will be presented
with several options ranging from license application to vehicle tracking among other options.
Fig 4.19 shows the client main menu.

74
Fig 4.19: Client main menu
Administrator main menu
The systems administrator has a simple main menu with few options since the systems
administrator role in the system is account creation and to monitor user actions. Fig 4.18 shows
the systems administrator main menu.
ZINARA Vehicle Licensing and Tolling
Application
Calculate toll fees
Logout
Track vehicle
Messages
Report car hijack
Quick links
Calculate license
fees
Contact the ICT
Notices
Online chat
Help
Vehicle toll fees
report License expiry
date date
......................................
......................................
......................................
......................................
......................................
......................................
..................
……………………………………
……………………………………
……………………………………
…………………………..
……………………………………
……………………………………
……………………….
News feed

75
Fig 4.20: Administrator main menu
4.7.2.1 Sub-menus
Sub-menus are options that pop up upon clicking an option or link on the home page. Submenus
vary from user to user, with some users having many sub-menus whilst others have few sub-
menus.
a) Staff sub-menus
On the main menu each and every staff member will select an option that is relevant to him.
The option will redirect him to other options, for example the button ‘Licenses’ will direct to
a submenu where the licensing officer will be splashed with actions that one can take on
licenses.
ZINARA Vehicle Licensing and Tolling
Application
Track user
actions
Logout
Messages
Quick links
Manage users
Post notice
Post news
Reset user password
Create new user

76
1) Licenses sub-menu
Fig 4.21: Licenses sub-menu
2) Pending applications sub-menu
Upon clicking the pending applications button the following interface will appear. This is where
the licensing officer will approve and issue vehicle licenses. Fig 4.22 shows the sub-menu.
ZINARA Vehicle Licensing and
Tolling Application
Issued licenses
Logout
Chat
Quick links
Expired licenses
Search license
Messages
Chat
Home
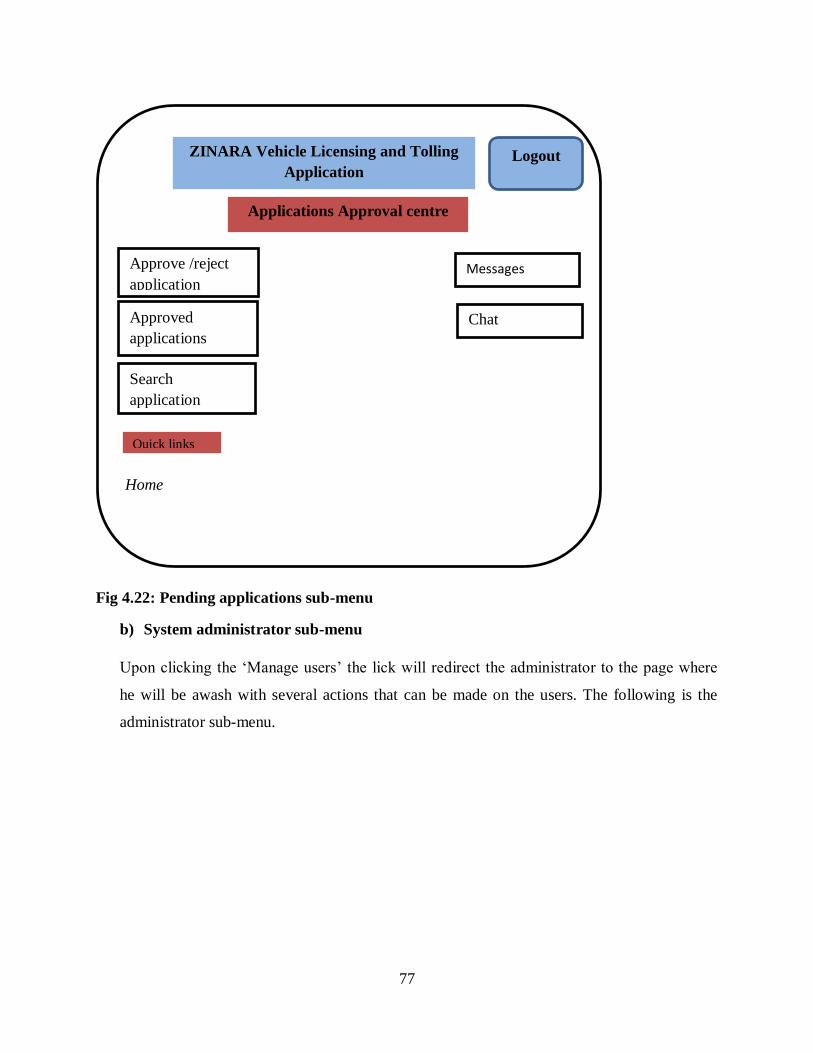
77
Fig 4.22: Pending applications sub-menu
b) System administrator sub-menu
Upon clicking the ‘Manage users’ the lick will redirect the administrator to the page where
he will be awash with several actions that can be made on the users. The following is the
administrator sub-menu.
ZINARA Vehicle Licensing and Tolling
Application
Approved
applications
Logout
Chat
Quick links
Approve /reject
application
Search
application
Messages
Home
Applications Approval centre

78
Fig 4.23: Administrator sub-menu
4.7.3 Output design
Output design is represents the format of the results that users get from the system after
processing of the input. At this point in time the reader can now be shown the format and type of
the output that the users will get from the system.
a) Vehicle license
After approval of a vehicle license application, the licensing officer will issue a vehicle
license and dispatch it into the inbox of the applicant. Fig 4.24 shows how the vehicle license
will look like.
ZINARA Vehicle Licensing and Tolling
Application
Block user
Logout
Chat
Quick links
Create new user
Search user
Delete user account
Home
User management centre

79
Fig 4.24: Vehicle License form
Vehicle toll fees statement
A client can get a report from the system showing the number of tollgates his vehicle passed
within a certain time interval and the total amount of money charged. This helps the motorist to
plan their budget for toll fees. Fig 4.25 shows the toll fees statement for ZINARA new system.
License number
Vehicle type
Expiry date
ZINARA Vehicle Licensing and
Tolling Application
Vehicle colour
Issued by
Vehicle registration
number
Date of issue

80
Fig 4.25: Vehicle toll fees statement
4.8 Pseudo code
Admin login
Enter login details
License number
Vehicle type
Expiry date
ZINARA Vehicle Licensing and
Tolling Application
Search period
No. of tollgates
passed
Vehicle reg.
number
Total toll fees (USD)
From
To

81
IF username and password are correct THEN
{
Go To admin home page
}
Else
{
Return to login page and error reporting
}
Staff Login
Enter staff login details
IF login credentials are correct THEN
{
Go To staff home page
}
Else
{
Error reporting
}
Updating a record
Check if entered record exists
If it does exist then

82
{
Validate information and update record
}
Else
{
Error reporting
}
4.9 Security design
The design could not be complete without looking at the security issues of the new ZINARA
vehicle licensing and tolling android application system. At this juncture focus is now put on the
security design of the new system. A security threat or danger is any activity or occasion that can
cause harm or loss of software, hardware, information, data or the normal operation of the
system. According to Pierce (1992), security design is a process within hardware and software
development that seeks to reduce the vulnerability to security threats of a system through several
measures and techniques that include authentication, backup and encryption to mention, but a
few. This will be achieved by ensuring that access to the Information Technology infrastructure
and its functionalities will be strictly granted to those who deserve privileges. Several access
control methods will be enforced and these include one-time passwords, view controls and other
access control methods. Security design encompasses aspects such as physical security, network
security and operational security and these will be discussed separately.
4.9.1 Physical Security
Physical security mainly focuses on physical threats. Physical threats are those threats that harm
the system physically and they include burglary, theft of IT infrastructures, vandalism and
natural disasters. The new ZINARA licensing and tolling system’s physical security will be
guaranteed by making sure that the server room is burglar barred and kept locked all the time.
Physical security will be strengthened more through the use of biometric systems such as figure
print, access cards and facial recognition. Access cards will be configured and given to the
systems administrator and his immediate subordinates only. The same will be done with figure
prints and facial recognition. Whilst physical security is widely underestimated with much

83
priority being given to other more specialized and sensational issues such as hacking and viral
attack security issues will be addressed with equal importance in the development of the
ZINARA’s new system. There are two principle segments to physical security that will be put in
place by the ZINARA to protect the vehicle licensing and tolling system. To begin with, such
measures can incorporate various locks, fencing, dividers, flame resistant safes, and water
sprinklers. Second, reconnaissance and notifying systems can be set up, for example, lighting,
heat sensors, smoke detectors, intrusion detection systems, cautions, and cameras.
4.9.2 Network security
According to Pierce (1992), physical and software measures all facilitate the shielding of basic
systems networking foundation from unapproved access, abuse, breakdown modification and
breakdowns. The evaluating procedure for the security of a network requires a check back on
authorization measures to identify how well they have adjusted to the security arrangement.
Auditing or evaluation promotes nonstop change by obliging organisations to consider the usage
of their approach on a continuous basis. Network security also involves the threats that are
paused by the internet such as virus attack, denial of service and system hacking. If these viruses
are allowed enter the organisation they could cause data loss, and also case machines to
malfunction. To reduce these network threats a firewall is going to be installed as indicated in fig
4.4. The firewall will scan all material from the internet before it creeps into the organisation’s
network. Frantic efforts will be made to ensure that the ZINARA new system will be safe from
computer hackers by assigning static IP addresses to each and every machine in the organisation
and a router will work alongside the hub such that only machines with the defined IP addresses
will be allowed to access the staff login page.
4.9.3 Operational security
This is a procedure of distinguishing basic data and consequently examining cordial activities
specialist to network improvement and vehicle license issuing and different exercises to: (a)
choose and execute measures that take out or decrease to a worthy level the vulnerabilities of
neighbourly activities to foe misuse (b) recognize those activities that can be seen by different
intelligence systems.(c) decide markers that threatening intelligent systems may acquire that
could be deciphered or sorted out to determine basic data so as to be helpful to other different
systems (Langer, 2013).

84
4.10 Conclusion
A more practical approach was used in the design phase to give a more detailed view of the
system. Several data representation tools were used such as dataflow diagrams, tables, entity
relationship diagrams. Also all the input forms and output forms and menus were shown and
gave a clear picture of what the new system will look like and how it is going to work. At this
point in time it can be concluded, without doubt, that the reader is now curious to see how the
system will be implemented. Implementation of the ZINARA’s new system is going to be
covered in chapter five which is the next and last chapter in this research.

85
CHAPTER FIVE: IMPLEMENTATION PHASE
5.1 Introduction
After the system has passed through the design phase there is need to test the designed system
for errors. This will be done through validation and verification and the detected errors should be
corrected before the system is implemented. User training is to be undertaken to maximize the
use of the system to its maximum capacity. The implementation phase is the last stage in the
system development and this is the stage where the developed system is introduced to the users
of the system (Dennis et al., 2012). Objectives stated in the first chapter of this documented are
also tested so as to determine if they tally with the needs of the targeted users. According to Stair
and Reynolds (2013), the implementation is the procedure by which the issues which have to do
with the technical, workforce and issues with administration are attended to.
5.2 Coding
Coding is the process which involves the conversion of a plane text into syntax that a fixed
channel or a medium can be used to transmit the code (Reynolds, 2013). This implies that the
process of coding refers to the conversion of the system design phase into a sequence of
structured code syntaxes that can be implemented as a suite to produce a functional system and
this involves the creation of a pseudo code. A pseudo code is a structured-English or program-
design- language that is created in programming so as to imitate or simulate the instructions in
real programming code (Craig and Jaskiel, 2002). The use of the pseudo code has got the
advantage in the sense that it is easier to understand and also enables one to use any
programming language one can wish to use.
5.3 Testing
System testing assures or makes sure that processes such as validation and verification, quality
assurance and estimation of reliability are all achieved (Fujita and Zualkerman, 2008). System
testing should be confined to the specifications of that particular system hence revisiting the
needs of the users is vital in testing the system. Thereby the verification and validation processes
are done in order to ensure that the user specifications are being me by the developed system.
This will make the system run smoothly eliminating all the negative deviations which could have

86
been encountered in the actual operation of the system and hence minimise system errors.
Testing follows a sequence of steps and fig 5.1 illustrates the steps.
Fig 5.1: Stages in system Testing
Source: Craig and Jaskiel (2002).
5.3.1 Unit testing
According to Whitten (2013), unit testing involves the trying and testing the small bits of
software that can be composed to produce software. This implies that unit testing involves the
validation and the verification of the smallest component of a software module. Independent
testing was carried out on the individual system components so as to determine their
functionality when being implemented independently. Upon carrying the unit testing
independent forms were tested to determine whether the inputted information was being stored in
the database. The system went through this process successfully as the Motorist information was
successfully added into the MySQL database. Several other units were tested for error in the
system with various user inputs provided by the ZINARA employees as well as selected
motorists and errors encountered were corrected.
Unit testing
Module Testing
Sub system testing
System testing
Acceptance Testing

87
5.3.2 Module testing
Module testing strategy combines the linked software abilities or units and is examined to
authenticate whether the different dependent units are functioning hand in hand as this is
important to the system (Saleh, 2009).
5.3.3 Integration Testing
According to Shelly and Rosenblatt (2011), integration testing combines the software elements
and the hardware elements and is tested up until the application software has been integrated.
The objective of integration testing is to make sure that the design objectives are met and they
comply with the operational and user requirements. Integration testing tests the individual units
that are to be later integrated or combined are functioning without errors. Modules in the
ZINARA licensing application which include the licensing and tolling units were tested and all
the errors detected were corrected. This process was done repeatedly as illustrated in Fig 5.1,
where the diagram illustrates the stage being done repeatedly.
5.3.4 System Testing
System testing technique evaluates the execution of the combined system by combining the
different sub-systems (Limaye, 2009). This is the stage where the productivity of the system is
measured that is the system will be assessed or measured against the user requirements. The
system will be tested so as to identify those errors that arise due to the fusion of the different
modules. System testing includes the two types of testing which includes white box and black
box testing.
a) Black box Testing
Black box testing includes the usage of tests whereby the inner structures of the
developed or the system source code are unclear to the analyser (Saleh, 2009). The black
box testing strategy includes the analysis of the different sections of the system
conduction for assessing the relations between inputs, output and its functionality as per
customer requirements. It is a programming testing technique whereby the inputs are
controlled and yields are then seen to check whether the resulting outputs are the ones
anticipated.

88
Fig 5.2 black box testing
Source: Rozanski and Woods (2012).
b) White Box Testing
White box testing refers to the software testing technique whereby the internal structure, the
design as well as the implementation of the items being tested are known to the tester (Limaye,
2009). In this case the tester chooses the path that exists in the code as well as determining the
suitable outputs. White box testing mechanism took into account the internal or inner
architecture of the system or the system components. It is also known as the glass box testing or
the structural testing indicating that there is transparency in the inner workings of the system that
is the logic and the structure of the code.
5.3.5 Acceptance Testing
Acceptance testing is a formal software testing technique which is undertaken so as to determine
if the developed system satisfies the acceptance criteria and at the same time determining the
customers to choose to use the system or not (Agarwal, Tayal and Gupta, 2010). This technique
is used in determining whether the system met all the user specifications and that all the
objectives are met. This is the final stage of testing which will determine the success factor of the
system since it is the stage where the users of the system chose whether to use it or not.
Acceptance testing involves the use of the two sorts of tests which include:
Input Output
Executable
Program
Black Box Testing

89
a) Alpha Testing
According to Craig and Jaskiel (2002), alpha testing is a sort of acceptance testing that is
carried out at the site for development. The technique involves the use of past
information obtained from the old system so as to compare and evaluate the effectiveness
of the new system in error handling. This is where any abnormal system behavior is
identified and rectified so as to eliminate errors.
b) Beta Testing
The site of the targeted client environment is where the system is tested (Agarwal et al.,
2010). The organisation in which the system is designed for is given the system so that
the users of the system familiarize with the developed system. This is done so as to allow
them to get a feel of the system with the objective of finding errors which might still exist
in the system. These identified errors are then brought up so that they can be corrected.
5.3.6 System security testing
After the successful completion of integration testing the system was tested for security.
According to Bentley and Whitten (1995), system security testing is one of the most crucial areas
in system development and also added that secure software is highly unlikely to fail. Thus the
system should have highly secure mechanisms so that they guard against unauthorised access
into the system. The ZINARA licensing and tolling application was developed and the use of
user authentication as well as access levels was implemented and thereby guarding against
unauthorised access. Therefore the several testing mechanisms were implemented and the system
yielded positive results through those stages.
5.3.7 Validation
According to Bentley and Whitten (1995), validation refers to the process of ensuring that the
input is correct and can be accepted by the system. The data entered in the system should be
consistent as well as being correct and any errors made should not be entered in the system. The
system will therefore validate all the input parameters entered in the system through various
techniques which include the following.

90
Screenshots of the various test cases
Fig 5.3 illustrates the data type validation screenshot. This is when the user has to provide the
correct data type for example the user has to provide the correct format of a vehicle registration
number. The vehicle registration number should start with the letter A. this is shown on fig 5.3.
Fig 5.3: Data type validation screenshot

91
Fig 5.4 illustrates the user is authenticated before being allowed to gain access to the system.
Therefore the correct details must be provided by the user so as to be granted access into the
system that is the correct username and password must be provided. Fig 5.4 illustrates a situation
where the user entered incorrect car registration number, username and password upon login into
the system and therefore an error message was generated.
Fig 5.4: Login security screenshot

92
Fig 5.5 shows the password match validation screenshot. After entering the correct login details
the motorist is allowed to gain access to the main modules of the licensing and tolling system.
The following interface will include the sections where one calculates the license cost as well as
the tollgate fees. Fig 5.5 illustrates the interface where the Motorists view the main options of
the system.
Fig 5.5: Password match validation screenshot

93
Fig 5.6 shows the omission validation screenshot where the user has to fill in all the required
fields in the form. It is important otherwise the system will not submit the details and the user
has to fill in everything. This illustrated in fig 5.6 whereby the Motorist has to first fill in the
fields so as to be able to register the vehicle in the system.
Fig 5.6: Omission validation screenshot

94
Fig 5.7 is an input type validation screenshot whereby the user has to provide the correct format
of the vehicle registration number. In this case all the Registration numbers start with the letter A
and therefore the error should appear in the event that a Motorist punches in anything other than
that as shown in fig 5.7.
Fig 5.7: Input type validation screenshot

95
5.3.8 Verification
According to Limaye (2009), verification refers to a process of inspecting and ensuring that the
system meets its expectations and the expected use. It ensures that the system performs the
functions that it is claimed to be performing.
5.4 Installation
According to Rozanski and Woods (2012), installation refers to a process of establishing or
introducing the developed system to the organisation so that it starts its intended purpose. This
implies that the users of the old ZINARA licensing system will now be required to utilise the
introduced licensing application. The system installation process is done on the production site
where the system is supposed to be operating on that is its operational environment. This process
is done after the final system has been produced and all the errors are attended to and corrected.
The installation process consists of the following strategies to be carried out that are system
changeover and user training.
5.4.1 User Training
According to Limaye (2009), user training involves the introduction of the developed system to
the endorser so as to allow and promote familiarisation. This implies that the users of the system
are shown the system so that they can make use of the modules and the programs that are
relevant to them. The daily operations of the organisation are not supposed to be disturbed and
therefore user training is vital so as to improve the productivity of the proposed system. In the
development of the vehicle licensing and tolling application, the user training exercise arranged
by the ZINARA Human resource department. The elements as well as the combined modules
were discussed and explained making it clear to the user how the modules actually function so as
to avoid error in using the system.
5.4.2 System Changeover
After the system has gone through the testing stages and all the errors found in the testing stages
were identified the system moves next to the installation process. system changeover has got four
alternate strategies which follows.

96
a) Direct Changeover
According to Shelly and Rosenblatt (2011), the direct changeover technique in which the
old system is stopped and the new system starts to work. This approach involves phasing
out the current system so as to pave way for the developed system when it is ready for
use.
Assessment of direct changeover
The immediate seizure of the current ZINARA licensing system might possess risk since
the old system and its data will be abandoned. This is so because in the event that the
developed system fails reverting back to the old licensing system will be impossible and
hence the organisation’s operations will be stopped. The direct changeover strategy
however tend to be a cheaper option since only one system will have to be implemented
and therefore all the efforts will be directed on system which is a cheaper option. Due to
the high risk possessed by the direct changeover strategy it is not a recommended
technique since we can risk organisational operations as well as losing important motorist
information.
b) Pilot changeover
According to Lancaster (2001), pilot changeover refers to a technique whereby the
developed system is implemented on a lower scale that is implementing the system only
to a certain part of the organisation and also the modules that are relevant to that section.
This technique just like the direct changeover, switches to the new system but only on the
selected section of the organisation. That is the old system is totally phased out due to the
introduction of the new system.
Assessment of Pilot changeover
The pilot technique is less risk as compared to the direct changeover strategy but however
this also has got its own limitations. The pilot changeover will imply that the developed
system will only be installed in the tollgates. This will not be recommended since the
Licensing system will equally require the information from the licensing department and

97
therefore there can be loss of information in the event that the tolling application fails.
Therefore the pilot changeover strategy is not recommended in this case.
c) Phased changeover
This refers to a step by step technique whereby the developed system substitutes the old
system module by module at any given time (Shelly and Rosenblatt, 2011). This
approach is the slowest but it tends to be a safer approach. The phased changeover
strategy in the event of a failure only affects that specific module and the whole system
operations is not crippled as seen in the direct changeover strategy.
Assessment of the Phased changeover
The phased changeover also has got a risk of data loss since the system will be a specific
module and in the event of a failure that module data is lost since we cannot revert back
to the old manual system. Installation costs will be higher in this strategy since the
ZINARA staff will require step by step training and this can end up being a lengthy
process which can then exceed the budget of the system. Therefore the ZINARA
licensing and tolling application cannot be implemented with this strategy since it can
lead to higher costs and that the system will require to be installed as a whole and
therefore it is not recommended.
d) Parallel changeover
Parallel changeover implies that the new system is introduced to the environment and
works simultaneously with the old system for a certain period of time (Shelly and
Rosenblatt, 2011). This strategy is done so as to compare the results produced by both
systems and also as a counter measure in the event the new system fails. Therefore the
parallel changeover is the less risk of all the other changeover strategies.
Assessment of the Parallel changeover (Recommended).
The parallel changeover is the most expensive of all the other changeover strategies. This
is so because the two systems will be both in use meaning that there is duplication of
effort and data and therefore more workload for the employees. On the other hand it is
the least risky of all the strategies and since we cannot afford to lose any data in
98
implementing the ZINARA licensing and tolling application. This also allows a period of
time where there can be a comparison of the systems in terms of results produced. The
users can then choose between the two eliminating any risk of resistance among users in
using the system. Therefore despite the costs of the parallel changeover it is the
recommended technique due to the fact that data loss is not an option in implementing
this system. Therefore running the two up until to stage where the new system is error
free.
5.5 Maintenance
According to Ramesh and Bhattiprolu (2006), maintenance is a stage where the system is
regularly monitored and tested for errors. The main objective of this strategy is to find and
correct these errors so that the system functions as intended. The maintenance process can be
done in four ways include corrective, adaptive, perfective and preventive maintenance.
a) Corrective maintenance
Saleh (2009) states that corrective maintenance as the process of attending to errors faced
by users as they occur and the measures to mitigate them or reduce these errors are put
into place. The corrective maintenance technique is usually done just after the system is
implemented. Errors in this case are reported through feedback from clients and they are
attended to instantly before the bugs complicate the whole operation of the system. This
is recommended in the implementation of the ZINARA licensing and tolling application
correcting all the errors which could have been omitted in the testing stages.
b) Adaptive maintenance
Saleh (2009) states adaptive maintenance involves the integration of the system with the
current software and hardware so that there is continuity in the operation of the system in
its environment. Therefore in adaptive maintenance makes sure that the system is
changed so as to suit the ever changing trends in the operating environment. Adaptive
maintenance is the most suitable technique in the industry where there is a rapid change
in the software and hardware equipment. Hence to maintain the relevance and continuity
in the operation of the system, the system has to adapt to those changes.

99
c) Perfective maintenance
Perfective maintenance is done on the functional and the non-functional areas of the
system making changes so as to maximize performance in a flexible way (Saleh, 2009).
Therefore this approach involves changing the system so that it continuously meets the
user needs. That is it has to be changed to be user friendly as well as changing selected
functions so that the system can be more effective and efficient. The system should
justify its existence through having positive impacts in the organisation and this can be
achieved through continuously perfecting the system in terms of its efficiency and user
friendliness.
d) Preventive Maintenance
Preventive maintenance refers to a pro-active technique whereby the system is improved
as a counter measure to avoid errors which can be encountered in the future before they
can occur in real time. Therefore the system is patched so as to eliminate any future
threats to the system. The system has to be pro- active other than re-active so as to avoid
inconveniences in its operations. Preventive maintenance is the safest of all the other
types of maintenance but also the most difficult of them all. This is so because the future
errors are very difficult to predict and therefore to make a counter measure of the
unknown can be a nightmare. Therefore it is recommended that the ZINARA’s ICT
department to be proactive so as to eliminate other future that that can cripple the
operation of the whole system.
5.6 Recommendations to stakeholders
The implementation of the vehicle licensing and tolling application will bring more good than
harm to all the ZINARA stakeholders. Therefore each of the stakeholders is recommended next
on the importance of the developed ZINARA vehicle licensing and tolling application when put
into good use.
a) Motorists
This application is recommended for all the motorists due to the services that it offers and
therefore one is recommended to install and this will surely be of good use. All
calculations are made easy on the go and therefore to improve efficiency as well as the

100
drafting of the road budget the vehicle licensing and tolling application assist the
motorists to a larger extent.
b) Employees
The service delivery will be increased through the introduction of the vehicle licensing
application will increase their throughput. This lightens up their job in serving the clients
even when operating from a remote location. Therefore the employees have to harness
the use of the application at the same time finding other ways to further improve the
application since they use on a daily basis.
c) Management
The management being responsible for the entire decision making should also promote
the further development at same time harnessing its use in the organisation. The
application further speeds up revenue collection through use of the application and hence
the management has to allocate more financial resources toward the further development
of the vehicle licensing and tolling application.
5.7 Recommendations for further/ future developments
The systems development is an iterative process whereby the system has to be continuously
improve and thereby keeping in track with the gradually changing operating environment.
Therefore enough resource has to be allocated in the continuous development or improvement of
the system. Therefore it is recommended that the ZINARA licensing and tolling application
should be integrated with the Tollgate prepayment system so as to increase the functionalities to
increase efficiency and reduce the risk of inconveniences in the road for the motorists. Also
additional features can be added on the application which includes payment the vehicle license,
vehicle insurance as well as the radio through the Ecocash platform. This can further reduce
customer requests as well as queues at the ZINARA offices. This can at the same time reduce
the workload on the employees thereby they will focus on other specifications

101
5.8 Conclusion
This was the last chapter which also demonstrated the success factors of the ZINARA licensing
and tolling application. The vital techniques all necessary to determine the viability of the system
were carried out. Other techniques like testing were also carried out to determine the usefulness
of the system to the users. After successfully going through the testing phases the system
maintenance also takes over this will be done so as to ensure that the system continuously
operates smoothly eliminating errors. The system also has to be adaptive to the environment it is
operating on so as to ensure its continuous relevance in the industry. With all the techniques
implemented in this document the system will be a success mission and the system is also ready
for use as well.

102
Reference list
Agarwal, B.B. Tayal, S.P.and Gupta, M. (2010) Software Engineering and Testing, Jones &
Bartlett Publishers, LLC: USA
Albin, S.T. (2003). The Art of Software Architecture: Design Methods and Techniques, Wiley
Publishing, Inc.: Indianapolis
Barnes, J. and Xu, M. (2001). Systems and Project Management, Viva Books Private limited:
India
Bentley and Whitten, (2007). System Analysis and Design, McGraw-Hill Company
Berthold, M. and Land, D.J (2007). Intelligent Data Analysis: An Introduction, 2nd Ed,
SpingerVerlag Berlin Heidelberg: New York
Cadle, J. and Yeates, D. (2008). Project management for information systems. 5th ed. Pearson
Education Limited: Harlow.
Craig, R.D. and Jaskiel, S.P. (2002). Systematic Software Testing, Artech House Publishers:
Norwood
Chavas, J.P. (2004. Risk analysis in theory & practice, Elsevier Academic Press: London
Davis, W. S. (1998). The Information System Consultant`s handbook: System Analysis and
Design. CRC Press: New York
Dennis, A. Haley, B. Wixom. Roberta, M. Roth (2014). Systems Analysis and Design: An
Object-Oriented Approach with UML. John Wiley & Sons: NewYork
Dixit, J. B (2008). Structured System Analysis and Design, Laxmi Publications
Dufresne, S. (2008). A Hierarchical Modelling Methodology for the Definition and Selection
ProQuest LLC: Ann Arbor
Fujita, H. and Zualkernan, I. (2008). New Trends in Software Methodologies, Tools and
Techniques, IOS Press: Amsterdam

103
Galitz, W.O. (2007). The Essential Guide to User Interface Design: An Introduction to GUI
Design, Wiley Publishing, Inc.: Indianapolis
Grady, J.O. (200). System Requirements Analysis, Elsevier Inc.: Burlington
Gupta, P. (2005). Structured System Analysis and Design, Firewall Media: New Delhi
Howe, D.R. (2001). Data Analysis for Database Design, 3rd Ed, Butterworth-Heinemann:
Woburn
Jewell, B. R. (2000). Business management, 4th Ed, Longman: London
Kasse, T. (2008). Practical Insight Into CMMI, 2nd Ed, Artech House, Inc.: Norwood
Kendal, B. (2006). Management of Information Systems, New Delhi: India
Kimberly L. (2006). Experience research social change: Methods beyond the mainstream.
Broadview, Toronto
Lancaster, G. (2001). Excel HSC Software Design & Development + Cards SG, Pascal Press:
Sydney
Limaye, M.G. (2009). Software Testing: Principles, Techniques & Tools, Tata McGraw-Hill
Education Private Ltd: New Delhi
Lucey, T. (2006). Introduction to e-commerce, McGraw-Hill: London
Mccuen, R.H (1996). The Elements of Academic Research, Library of Congress: USA
Morgan, J. (2006). Future of work, Longman: London.
Mylopoulos, J. and Brodie, M.L. (1989). Readings in Artificial Intelligence and Databases,
Morgan Kaufmann Publishers, Inc.: San Mateo
Rajaraman, V. (2006). Analysis and Design of Information Systems, 2nd Ed, Prentice Hall of
India Pvt Ltd: New Delhi

104
Ramesh, G. and Bhattiprolu, R. (2006). Software Maintenance: Effective Practices for
Geographically Distributed Environments, Tata McGraw-Hill Publishing Company Ltd: New
Delhi
Randall, H. (1996). Advanced level accounting. 2nd Ed, Camb Int: United Kingdom
Richman, P. (2002). Project management Step-by-step. AMACOM Div, America.
Rodger, R. (2005). Software Engineering 6th Ed, Library of Congress: England
Rozanski, N. and Woods, E. (2012). Software Systems Architecture: Working with Stakeholders
Using Viewpoints & Perspectives, Pearson Education, Inc.: Westford
Saleh, K.A. (2009) Software Engineering, J. Ross Publishing, Inc.: Lauderdale
Seidman, I. (2013). Interviewing as qualitative research: a guide for researchers in education and
the social sciences, 4th Ed, TC Press: NY
Shelly, G. and Rosenblatt, H.J. (2011). Systems Analysis and Design. 8th Ed: Video Enhanced,
Cengage Learning, Inc.: Boston
Stimpson, P. and Hunger, J. D. (1998). Strategic management, 6th Ed, LC: United Kingdom
Stone, D. (2005). User Interface Design and Evaluation, Elsevier, Inc.: San Francisco
Teixeira, M.B. (2003). Design Controls for the Medical Device Industry, Marcel Dekker, Inc.:
NYC
Thompson, M.K. (2013). Proceedings of the 7th international conference on axiomatic design,
Worcester Polytechnic Institute.

105
Appendices
Appendix A: User manual
Vehicle licensing and tolling application
a) Introduction
The user manual has been written so as to assist the users to navigate and use the different
functionalities of the modules in the vehicle licensing and tolling application.
Mandatory requirements:
The internal users of the licensing and tolling application have to undergo a training exercise to
familiarise with the functions of the system since the changes they make in the system will be
permanent. User accounts are then created for these users by the systems administrator. Login
details are provided for each therefore they have to be provided correctly upon login
For a better view of the application a 9.7 inch tablet computer with a 4.2 or better of android
version is recommended.
b) Getting started
Accessing the system
The motorists can obtain the application on the ZINARA website (www.zinara.co.zw)
c) Registration page
This is the initial stage whereby the motorist is required to create an account with the system.
The car registration number is required as well as the username and password of the motorist in
order to create an account.

106
Fig A1: Registration page
The
motorist is
prompted
to enter
name and
surname
Car
registration
number
Preferred
User
password
Click user has to click to
register after filling the
correct information
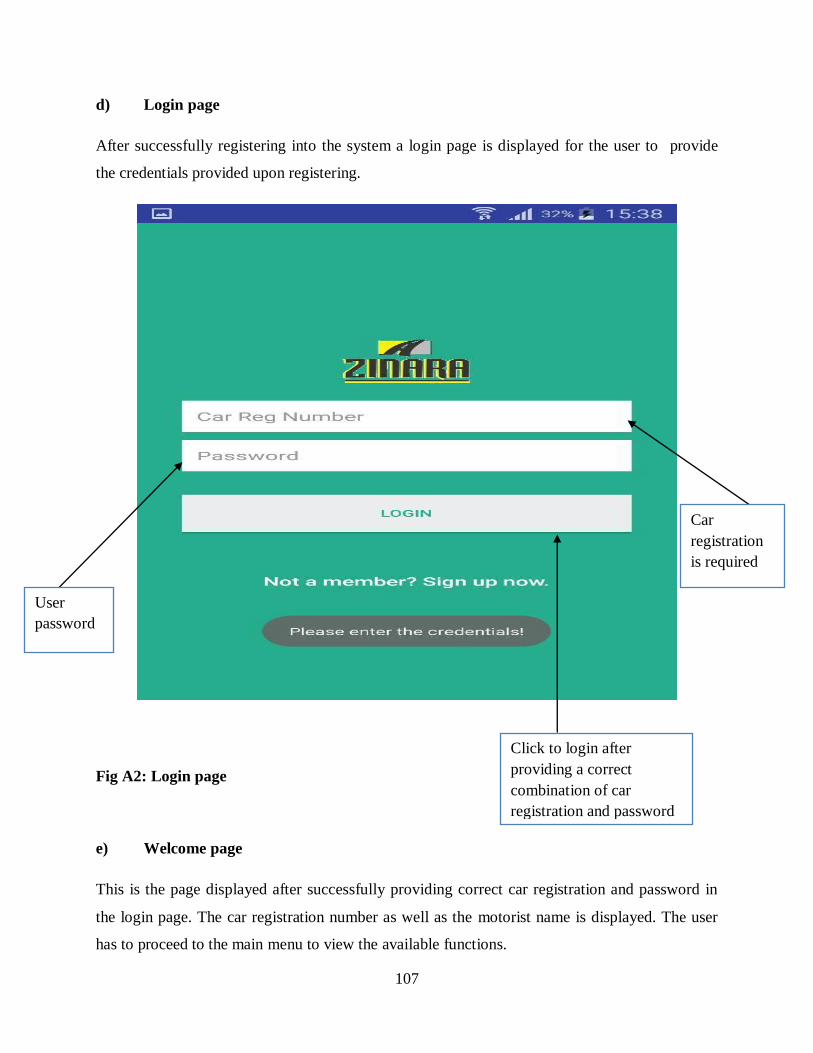
107
d) Login page
After successfully registering into the system a login page is displayed for the user to provide
the credentials provided upon registering.
Fig A2: Login page
e) Welcome page
This is the page displayed after successfully providing correct car registration and password in
the login page. The car registration number as well as the motorist name is displayed. The user
has to proceed to the main menu to view the available functions.
User
password
Click to login after
providing a correct
combination of car
registration and password
Car
registration
is required

108
Fig A3: Welcome page
f) Main Menu
Upon clicking proceed button in the welcome page the main menu is displayed which contains
the functions that are performed by the application. The user can then select the preferred option
in the main menu.
Motorist’s
username and
vehicle
provided upon
registration is
provided here
User click here
to proceed to the
main menu
The user can
opt to logout
by clicking
here

109
Fig A4: Main menu
g) Calculator
When the user clicks on the calculator the two options to calculate the vehicle license fee as well
as that to calculate the total tollgate fees required from one destination to the next.
Motorist click
to report
vehicle hijack
User click
here to
calculate
license fees
and tollgate
fees
User click to
view the
vehicle license
expiry
reminders
The motorists
post vehicle
related adverts
Receives news
on the
application

110
Fig A5: Calculator
h) Vehicle license calculator
This is where the user provides vehicle details which includes the vehicle details, net mass as
well the license expiry date. Therefore the license amount to be for that vehicle will be displayed.
User clicks
to calculate
total fees
User click
to calculate
license
fees

111
Fig A6: License fees calculator
The user
provides vehicle
net mass
Vehicle
registration
number is
required here

112
Fig A7: Toll fees calculator
i) Report case
This is where the motorist report the vehicle hijacks cases to the tolling officers. Therefore a
username and password is required to login and report a case.
The user
selects the
destination
here The user then
click here to
generate the total
fees required
Place of
departure
Vehicle
class
Vehicle
registration
number is
entered

113
Fig A8: Report case
j) Reminders
This is the page whereby the motorists are reminded of the vehicle license expiry dates that is
due.
The
username
is required User
password is
required
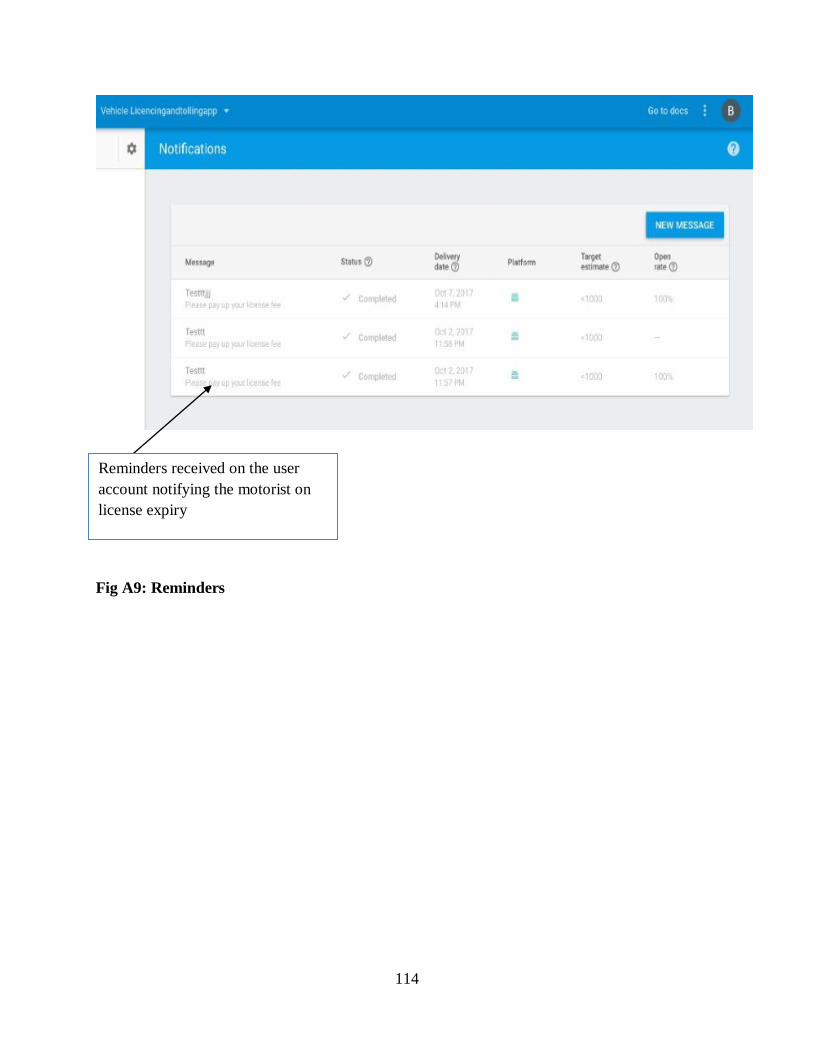
114
Fig A9: Reminders
Reminders received on the user
account notifying the motorist on
license expiry

115
Appendix B: Interviews
Interview Checklist
The following are a set of the interview questions that were asked to the ZINARA employees
that is the Licensing officer.
1. Approximately how long does it takes to process a vehicle license request and issue back
a license or quotation?
………………………………………………………………………………………………
………………………………………………………………………………………………
………………………………………………………………………………………………
2. In your own opinion do you think the current ZINARA licensing system should be
improved through the use of information technology?
………………………………………………………………………………………………
………………………………………………………………………………………………
………………………………………………………………………………………………
3. From your own perspective what areas do you think should be improved in the current
licensing system?
………………………………………………………………………………………………
………………………………………………………………………………………………
………………………………………………………………………………………….....
4. In your system besides the expiry date on the license disk is there any other means of
notifying the motorist when the license is due for licensing?
………………………………………………………………………………………………
………………………………………………………………………………………………
………………………………………………………………………………………….....

116
5. Have you ever recently faced difficulties in accepting or adopting any new technology
that was brought into the organisation? If so, please state when and the type of the
technology?
………………………………………………………………………………………………
………………………………………………………………………………………………
………………………………………………………………………………………………
Date………………………………….
Signature……………………………..

117
Interview Checklist for Motorists
The following are a sample of interview questions asked to random motorists
1. With the current means of communication which includes visiting any nearby ZINARA
office for clarity, is it convenient, accurate or time conscious?
………………………………………………………………………………………………
………………………………………………………………………………………………
…………………………………………………………………………………………….
2. Approximately how long does it takes for your various requests to be responded to when
you visit the ZINARA offices?
………………………………………………………………………………………………
………………………………………………………………………………………………
…………………………………………………………………………………………….
3. If there is any chance that there can be an introduction of the new technology are you
willing to accept that new technology? If no, please state your reason(s).
………………………………………………………………………………………………
………………………………………………………………………………………………
………………………………………………………………………………………………
…….…
4. What effect do you think the introduction of the new licensing system will have on the
relationship between ZINARA and the Motorists?
………………………………………………………………………………………………
………………………………………………………………………………………………
…………………………………………………………………………………………….

118
Appendix C: Observations
Table D1: Observation Scoresheet
Observation Scoresheet
Date………../…………../………..
Time………………………………….
Observations
……………………………………………………………………………………………………………………………………………………………………
……………………………………………………………………………………………………………………………………………………………………
……………………………………………………………………………………………………………………………………………………………………
……………………………………………………………………………………………………………………………………………………………………
……………………………………………………………………………………………………………………………………………………………………
……………………………………………………………………………………………………………………………………………………………………
……………………………………………………………………………………………………………………………………………………………………
……………………………………………………………………………………………………………………………………………………………………
……………………………………………………………………………………………………………………………………………………………………
……………………………………………………………………………………………………………………………………………………………………
……………………………………………………………………………………………………………………………………………………………………
……………………………………………………………………………………………………………………………………………………………………
Conclusion…………………………………………………………………………………………………………………………………………………
……………………………………………………………………………………………………………………………………………………………………
……………………………………………………………………………………………………………………………………………………………………
……………………………………………………………………………………………………………………………………………………………………
……………………………………………………………………………………………………………………………………………………………………
……………………………………………………………………………………………………………………………………………………………………
……………………………………………………………………………………………………………………………………………………………………
Vehicle Licensing and Tolling Application

119
Appendix D: Questionnaire
This questionnaire with a list of questions intended for the randomly selected motorists
SECTION A: Please draw a circle around your answer to indicate your choice
1. On average, how long does it take for your inquiries to be responded to after making
inquiries?
a) 10 minutes b) 20 minutes c) 30 minutes d) one hour
2. Based on your above answer, how do you rate the current manual system?
a) Good b) average c) below average d) poor
3. What effect do you think the introduction of a computerised system will have on the current
process of issuing licenses?
a) Negative b) positive c) no effect d) not sure
4. How would you rate the computer literacy rate of the users of the current manual system in
your organisation?
a) Good b) average c) below average d) poor
SECTION B: Please tick the box to indicate your choice
1. Do you think the current manual system should be improved?
Yes No
2. Do you believe the use of information and technology will improve the current manual
system?
Yes No
3. Basing on your experience and exposure into the organisation, do you think that a new
computerised system is going to be accepted by the users?
Yes No
4. Do you possess any knowledge on the basic use of information and technology?
Yes No

120
Appendix E: Code Snippets
package anoe.mabhena.vehiclelicencingandtollingapp;
import android.content.Context;
import android.content.DialogInterface;
import android.os.Bundle;
import android.support.v7.app.AlertDialog;
import android.support.v7.app.AppCompatActivity;
import android.view.LayoutInflater;
import android.view.View;
import android.widget.ArrayAdapter;
import android.widget.Button;
import android.widget.EditText;
import android.widget.Spinner;
public class Calculator extends AppCompatActivity {
final Context mContext = this;
Button license_calc, tollgate_calc;
int licenseFee;
@Override
protected void onCreate(Bundle savedInstanceState) {
super.onCreate(savedInstanceState);
setContentView(R.layout.activity_calculator);
license_calc = (Button)findViewById(R.id.license_calculator);

121
tollgate_calc = (Button)findViewById(R.id.tollgate_calculator);
license_calc.setOnClickListener(new View.OnClickListener() {
@Override
public void onClick(View v) {
LayoutInflater li = LayoutInflater.from(mContext);
View dialogView = li.inflate(R.layout.custom_dialog, null);
AlertDialog.Builder alertDialogBuilder = new AlertDialog.Builder(mContext);
//set title
alertDialogBuilder.setTitle("Please enter the following information");
alertDialogBuilder.setIcon(R.mipmap.iconn);
alertDialogBuilder.setView(dialogView);
final EditText registrationNo = (EditText) dialogView.findViewById(R.id.reg_no);
final EditText netMass = (EditText) dialogView.findViewById(R.id.net_mass);
final EditText arrears = (EditText) dialogView.findViewById(R.id.net_mass);
final EditText penalties = (EditText) dialogView.findViewById(R.id.net_mass);
final EditText months = (EditText) dialogView.findViewById(R.id.net_mass);
final EditText currentLicense = (EditText) dialogView.findViewById(R.id.net_mass);
final EditText expiryDate = (EditText) dialogView.findViewById(R.id.expiry_date);
// {[(arrears+penalties)*months]+$5}+CURRENT LICENCE
String netMasss = netMass.getText().toString();
String arrearss = arrears.getText().toString();

122
String penaltiess = penalties.getText().toString();
String monthss = months.getText().toString();
String currentLicenses = currentLicense.getText().toString();
licenseFee = ((Integer.parseInt(arrearss) + Integer.parseInt(penaltiess))*
Integer.parseInt(monthss) + 5) + Integer.parseInt(currentLicenses);
alertDialogBuilder
.setCancelable(false)
.setPositiveButton("Calculate Fee",
new DialogInterface.OnClickListener() {
@Override
public void onClick(DialogInterface dialog, int which) {
}
})
.setNegativeButton("Cancel",
new DialogInterface.OnClickListener() {
@Override
public void onClick(DialogInterface dialog, int which) {
}
});
//create alert dialog

123
AlertDialog alertDialog = alertDialogBuilder.create();
//show it
alertDialog.show();
}
});
tollgate_calc.setOnClickListener(new View.OnClickListener() {
@Override
public void onClick(View v) {
LayoutInflater li2 = LayoutInflater.from(mContext);
View dialogView2 = li2.inflate(R.layout.custom_dialog2, null);
AlertDialog.Builder alertDialogBuilder = new AlertDialog.Builder(mContext);
//set title
alertDialogBuilder.setTitle("Please enter the following information");
alertDialogBuilder.setIcon(R.mipmap.iconn);
alertDialogBuilder.setView(dialogView2);
final EditText registrationNo2 = (EditText) dialogView2.findViewById(R.id.reg2_no);
final Spinner vehicleClass = (Spinner)
dialogView2.findViewById(R.id.vehicle_class);
final Spinner departure = (Spinner) dialogView2.findViewById(R.id.departure);
final Spinner destination = (Spinner) dialogView2.findViewById(R.id.destination);
//populating the spinners

124
String[] vehcleClass = new String[]{"Select Class", "Motor bikes", "light motor
vehicles", "Commuter omnibus", "Buses", "Heavy Vehicles, lorry (UD trucks)", "Haulage
Trucks"};
ArrayAdapter<String> adapterVehicleClass = new
ArrayAdapter<String>(getApplicationContext(),
android.R.layout.simple_spinner_dropdown_item, vehcleClass);
vehicleClass.setAdapter(adapterVehicleClass);
String[] deprtr = new String[]{"Select Departure","Harare", "Norton", "Chegutu",
"Kadoma", "Kwekwe", "Gweru", "Bulawayo", "Plumtree", "Beatrice", "Chivhu", "Mvuma",
"Masvingo", "Ngundu",
"Rutenga", "Beitbidge", "Shurugwi", "Zvishavane", "Marondera", "Murehwa",
"Mazowe", "Chinhoyi", "Macheke", "Rusape", "Nyazura", "Mutare", "Chimanimani",
"Chipinge",
"Chiredzi", "Hwange", "Victoria Falls", "Binga","Kariba", "Muzarabani",
"Nyamapanda", "Mt Darwin", "Nyanga", "Mutoko"};
ArrayAdapter<String> adapterDeparture = new
ArrayAdapter<String>(getApplicationContext(),
android.R.layout.simple_spinner_dropdown_item, deprtr);
departure.setAdapter(adapterDeparture);
String[] destntin = new String[]{"Select Destination", "Harare", "Norton", "Chegutu",
"Kadoma", "Kwekwe", "Gweru", "Bulawayo", "Plumtree", "Beatrice", "Chivhu", "Mvuma",
"Masvingo", "Ngundu",
"Rutenga", "Beitbidge", "Shurugwi", "Zvishavane", "Marondera", "Murehwa",
"Mazowe", "Chinhoyi", "Macheke", "Rusape", "Nyazura", "Mutare", "Chimanimani",
"Chipinge",

125
"Chiredzi", "Hwange", "Victoria Falls", "Binga","Kariba", "Muzarabani",
"Nyamapanda", "Mt Darwin", "Nyanga", "Mutoko"};
ArrayAdapter<String> adapterDestination = new
ArrayAdapter<String>(getApplicationContext(),
android.R.layout.simple_spinner_dropdown_item, destntin);
destination.setAdapter(adapterDestination);
alertDialogBuilder
.setCancelable(false)
.setPositiveButton("Calculate fee",
new DialogInterface.OnClickListener() {
@Override
public void onClick(DialogInterface dialog, int which) {
}
})
.setNegativeButton("Cancel",
new DialogInterface.OnClickListener() {
@Override
public void onClick(DialogInterface dialog, int which) {
}

126
});
//create alert dialog
AlertDialog alertDialog = alertDialogBuilder.create();
//show it
alertDialog.show();
}
});
}
public double calcLicense(){
//double totalFee =
return 0;