Embed Size (px)
Citation preview
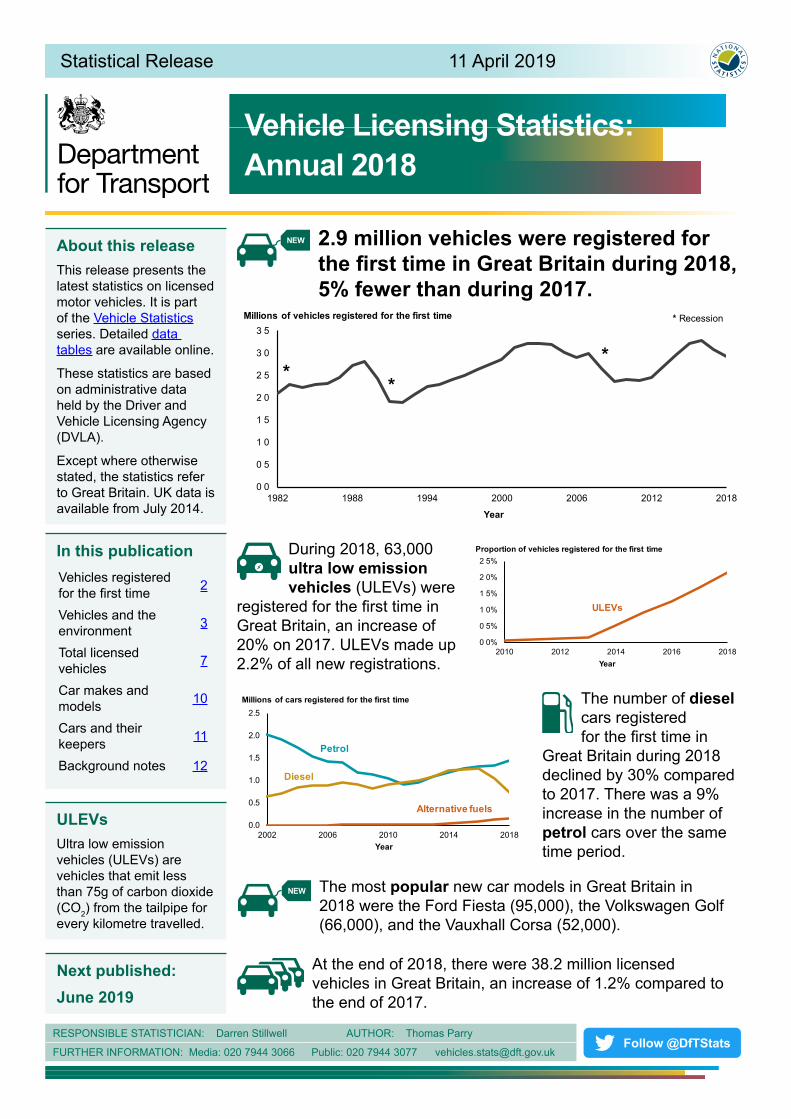
Statistical Release 11 April 2019
Vehicle Licensing Statistics:Annual 2018
2.9 million vehicles were registered for the first time in Great Britain during 2018, 5% fewer than during 2017.
0 0
0 5
1 0
1 5
2 0
2 5
3 0
3 5
1982 1988 1994 2000 2006 2012 2018
Millions of vehicles registered for the first time
Year
***
* Recession
During 2018, 63,000 ultra low emission vehicles (ULEVs) were
registered for the first time in Great Britain, an increase of 20% on 2017. ULEVs made up 2.2% of all new registrations.
0 0%
0 5%
1 0%
1 5%
2 0%
2 5%
2010 2012 2014 2016 2018Year
ULEVs
Proportion of vehicles registered for the first time
The number of diesel cars registered for the first time in
Great Britain during 2018 declined by 30% compared to 2017. There was a 9% increase in the number of petrol cars over the same time period.
0.0
0.5
1.0
1.5
2.0
2.5
2002 2006 2010 2014 2018
Millions of cars registered for the first time
Year
Petrol
Diesel
Alternative fuels
The most popular new car models in Great Britain in 2018 were the Ford Fiesta (95,000), the Volkswagen Golf (66,000), and the Vauxhall Corsa (52,000).
At the end of 2018, there were 38.2 million licensed vehicles in Great Britain, an increase of 1.2% compared to the end of 2017.
RESPONSIBLE STATISTICIAN: Darren Stillwell AUTHOR: Thomas Parry
FURTHER INFORMATION: Media: 020 7944 3066 Public: 020 7944 3077 [email protected]
NEW
NEW
About this releaseThis release presents the latest statistics on licensed motor vehicles. It is part of the Vehicle Statistics series. Detailed data tables are available online.
These statistics are based on administrative data held by the Driver and Vehicle Licensing Agency (DVLA).
Except where otherwise stated, the statistics refer to Great Britain. UK data is available from July 2014.
In this publicationVehicles registered for the first time 2
Vehicles and the environment 3
Total licensed vehicles 7
Car makes and models 10
Cars and their keepers 11
Background notes 12
ULEVsUltra low emission vehicles (ULEVs) are vehicles that emit less than 75g of carbon dioxide (CO2) from the tailpipe for every kilometre travelled.
Next published:June 2019
Follow @DfTStats
Vehicle Licensing Statistics: Annual 2018 - Page 2
Vehicles registered for the first timeDuring 2018, 2.9 million vehicles were registered for the first time in Great Britain. This was 5.5% lower than during 2017 and 11.0% lower than during 2016. However, it was similar to 2014 new registrations and still 23.7% higher than the recession trough during 2009.
Several factors contributed to the second year of decline in new vehicle registrations. Two key factors were that new diesel car registrations have been declining since April 2017 (see page 3), and that the introduction of the Worldwide Harmonised Light Vehicle Test Procedure (WLTP) affected car registrations from September 2018 onwards. This was because new cars needed additional testing before they could be sold, which limited the supply of available cars in the market.
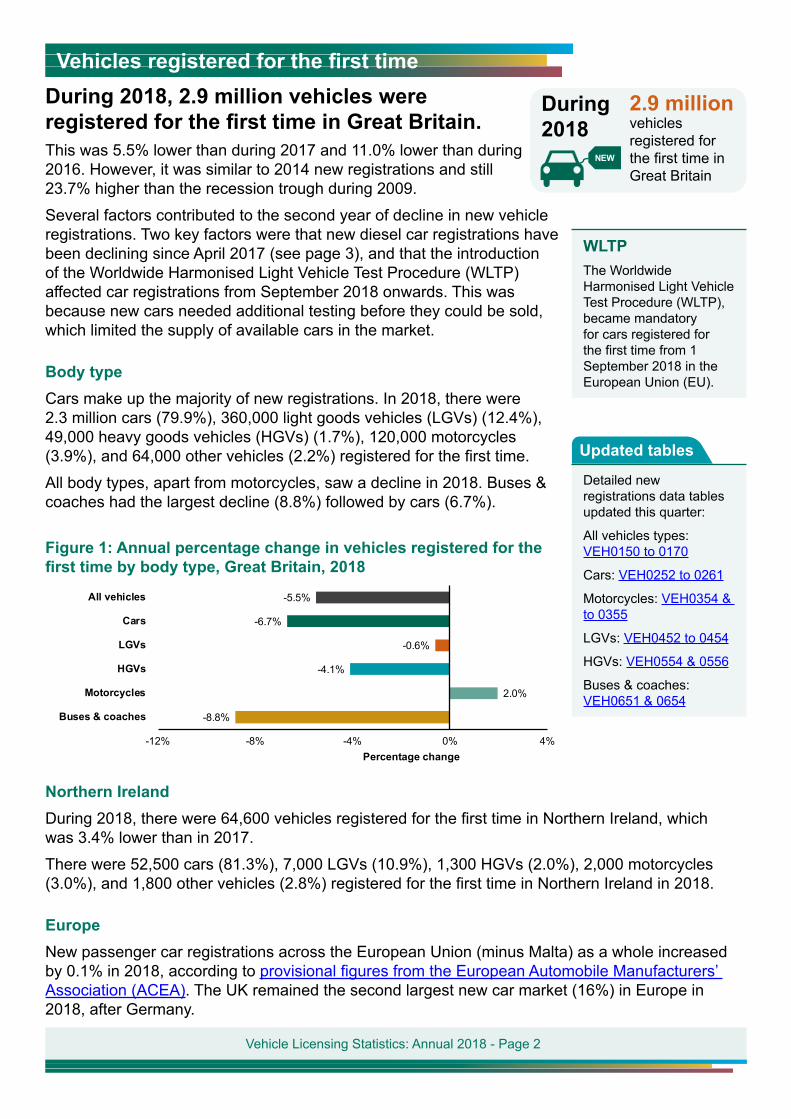
Body typeCars make up the majority of new registrations. In 2018, there were 2.3 million cars (79.9%), 360,000 light goods vehicles (LGVs) (12.4%), 49,000 heavy goods vehicles (HGVs) (1.7%), 120,000 motorcycles (3.9%), and 64,000 other vehicles (2.2%) registered for the first time.
All body types, apart from motorcycles, saw a decline in 2018. Buses & coaches had the largest decline (8.8%) followed by cars (6.7%).
Figure 1: Annual percentage change in vehicles registered for the first time by body type, Great Britain, 2018
-5.5%
-6.7%
-0.6%
-4.1%
2.0%
-8.8%
-12% -8% -4% 0% 4%
All vehicles
Cars
LGVs
HGVs
Motorcycles
Buses & coaches
Percentage change
Northern IrelandDuring 2018, there were 64,600 vehicles registered for the first time in Northern Ireland, which was 3.4% lower than in 2017.
There were 52,500 cars (81.3%), 7,000 LGVs (10.9%), 1,300 HGVs (2.0%), 2,000 motorcycles (3.0%), and 1,800 other vehicles (2.8%) registered for the first time in Northern Ireland in 2018.
EuropeNew passenger car registrations across the European Union (minus Malta) as a whole increased by 0.1% in 2018, according to provisional figures from the European Automobile Manufacturers’ Association (ACEA). The UK remained the second largest new car market (16%) in Europe in 2018, after Germany.
During 2018
2.9 millionvehicles registered for the first time in Great Britain
NEW
WLTPThe Worldwide Harmonised Light Vehicle Test Procedure (WLTP), became mandatory for cars registered for the first time from 1 September 2018 in the European Union (EU).
Detailed new registrations data tables updated this quarter:
All vehicles types: VEH0150 to 0170
Cars: VEH0252 to 0261
Motorcycles: VEH0354 & to 0355
LGVs: VEH0452 to 0454
HGVs: VEH0554 & 0556
Buses & coaches: VEH0651 & 0654
Updated tables
Vehicle Licensing Statistics: Annual 2018 - Page 3
Vehicles and the environmentNew diesel car registrations continue to fall, contrasted by increases for petrol and alternative fuel cars.
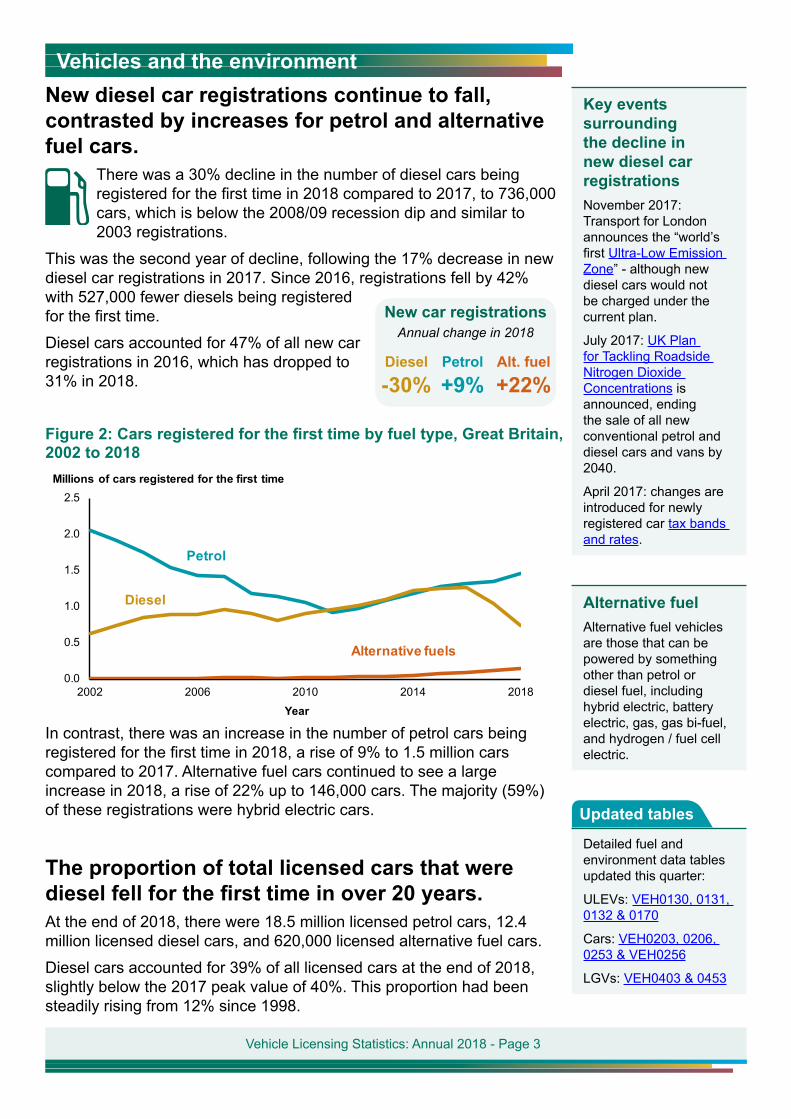
There was a 30% decline in the number of diesel cars being registered for the first time in 2018 compared to 2017, to 736,000 cars, which is below the 2008/09 recession dip and similar to 2003 registrations.
This was the second year of decline, following the 17% decrease in new diesel car registrations in 2017. Since 2016, registrations fell by 42% with 527,000 fewer diesels being registered for the first time.
Diesel cars accounted for 47% of all new car registrations in 2016, which has dropped to 31% in 2018.
Figure 2: Cars registered for the first time by fuel type, Great Britain, 2002 to 2018
0.0
0.5
1.0
1.5
2.0
2.5
2002 2006 2010 2014 2018
Millions of cars registered for the first time
Year
Petrol
Diesel
Alternative fuels
In contrast, there was an increase in the number of petrol cars being registered for the first time in 2018, a rise of 9% to 1.5 million cars compared to 2017. Alternative fuel cars continued to see a large increase in 2018, a rise of 22% up to 146,000 cars. The majority (59%) of these registrations were hybrid electric cars.
The proportion of total licensed cars that were diesel fell for the first time in over 20 years.At the end of 2018, there were 18.5 million licensed petrol cars, 12.4 million licensed diesel cars, and 620,000 licensed alternative fuel cars.
Diesel cars accounted for 39% of all licensed cars at the end of 2018, slightly below the 2017 peak value of 40%. This proportion had been steadily rising from 12% since 1998.
New car registrationsAnnual change in 2018
Diesel
-30%Petrol
+9%Alt. fuel
+22%
Key events surrounding the decline in new diesel car registrationsNovember 2017: Transport for London announces the “world’s first Ultra-Low Emission Zone” - although new diesel cars would not be charged under the current plan.
July 2017: UK Plan for Tackling Roadside Nitrogen Dioxide Concentrations is announced, ending the sale of all new conventional petrol and diesel cars and vans by 2040.
April 2017: changes are introduced for newly registered car tax bands and rates.
Alternative fuelAlternative fuel vehicles are those that can be powered by something other than petrol or diesel fuel, including hybrid electric, battery electric, gas, gas bi-fuel, and hydrogen / fuel cell electric.
Detailed fuel and environment data tables updated this quarter:
ULEVs: VEH0130, 0131, 0132 & 0170
Cars: VEH0203, 0206, 0253 & VEH0256
LGVs: VEH0403 & 0453
Updated tables
Vehicle Licensing Statistics: Annual 2018 - Page 4
Ultra low emission vehicles continue to increase their share of new registrations in the UK to 2.1%.
In 2018, 63,992 ULEVs were registered for the first time in the United Kingdom, up 20% on 2017 and 53% on 2016. ULEVs accounted for 2.1% of all new vehicle registrations - up from 1.7% one year previously and 1.2% two years previously.
The majority (76%) of these ULEVs were eligible for plug-in grants. New registrations of ULEVs in 2018 included 47,422 cars and 1,248 light goods vehicles that were eligible for these grants.
The changes to the plug-in car grant in October 2018 removed all previously eligible plug-in hybrid models from the grant. As a result, only 41% of ULEVs were eligible for plug-in grants during 2018 Q4, compared to 89% during the first three quarters of 2018.
Nevertheless, because the changes happened late in the year, there were 4% more plug-in grant eligible ULEVs registered for the first time in 2018 compared with 2017.
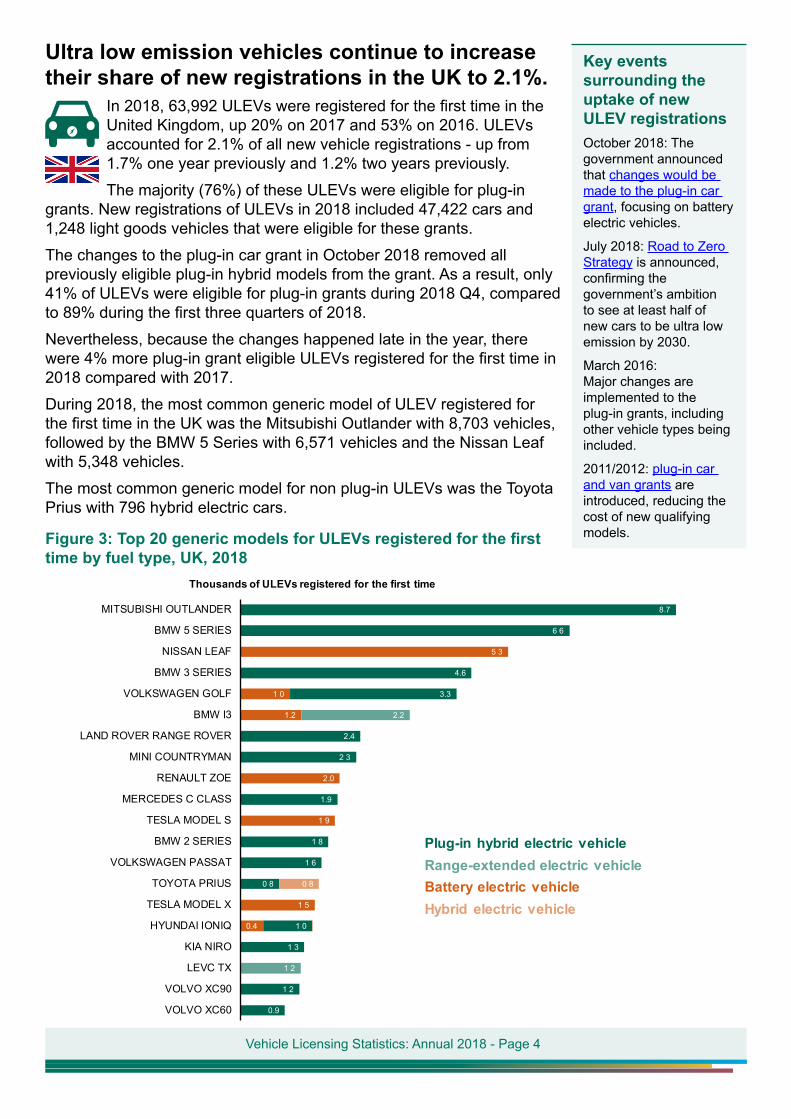
During 2018, the most common generic model of ULEV registered for the first time in the UK was the Mitsubishi Outlander with 8,703 vehicles, followed by the BMW 5 Series with 6,571 vehicles and the Nissan Leaf with 5,348 vehicles.
The most common generic model for non plug-in ULEVs was the Toyota Prius with 796 hybrid electric cars.
Figure 3: Top 20 generic models for ULEVs registered for the first time by fuel type, UK, 2018
Key events surrounding the uptake of new ULEV registrationsOctober 2018: The government announced that changes would be made to the plug-in car grant, focusing on battery electric vehicles.
July 2018: Road to Zero Strategy is announced, confirming the government’s ambition to see at least half of new cars to be ultra low emission by 2030.
March 2016: Major changes are implemented to the plug-in grants, including other vehicle types being included.
2011/2012: plug-in car and van grants are introduced, reducing the cost of new qualifying models.
0.4
1 5
1 9
2.0
1.2
1 0
5 3
1 2
2.2
0.9
1 2
1 3
1 0
0 8
1 6
1 8
1.9
2 3
2.4
3.3
4.6
6 6
8.7
0 8
VOLVO XC60
VOLVO XC90
LEVC TX
KIA NIRO
HYUNDAI IONIQ
TESLA MODEL X
TOYOTA PRIUS
VOLKSWAGEN PASSAT
BMW 2 SERIES
TESLA MODEL S
MERCEDES C CLASS
RENAULT ZOE
MINI COUNTRYMAN
LAND ROVER RANGE ROVER
BMW I3
VOLKSWAGEN GOLF
BMW 3 SERIES
NISSAN LEAF
BMW 5 SERIES
MITSUBISHI OUTLANDER
Thousands of ULEVs registered for the first time
Plug-in hybrid electric vehicleRange-extended electric vehicleBattery electric vehicleHybrid electric vehicle
Vehicle Licensing Statistics: Annual 2018 - Page 5
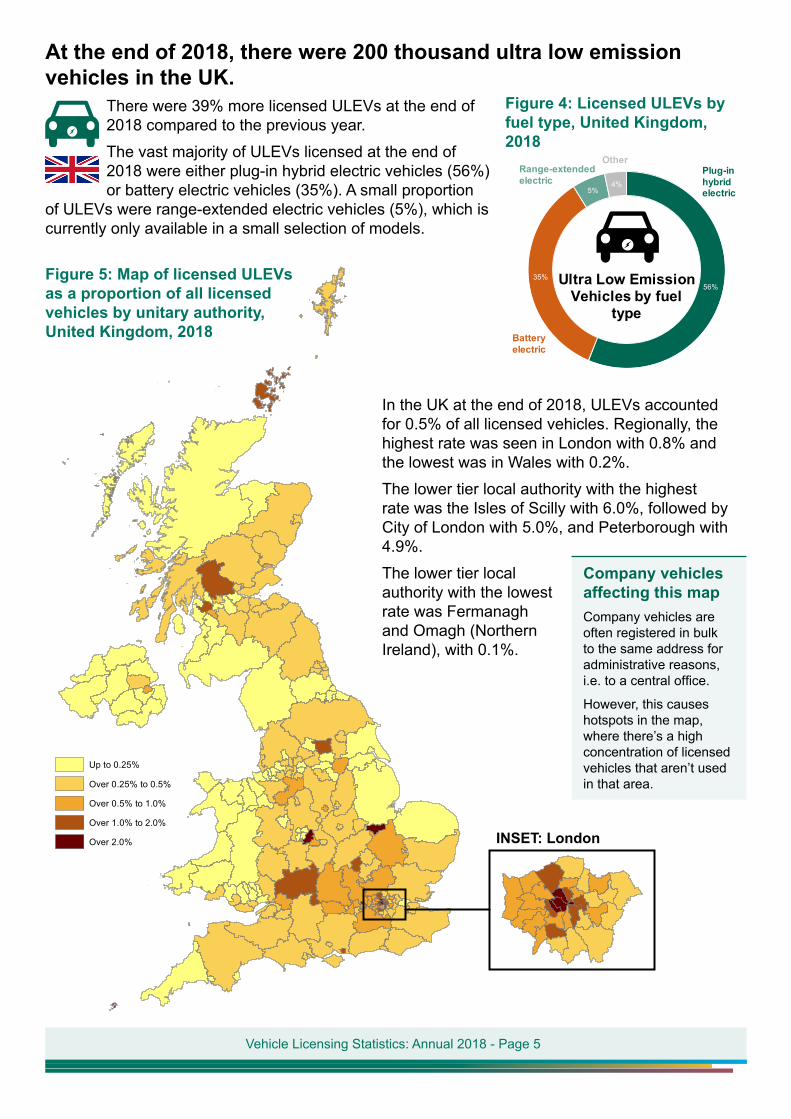
At the end of 2018, there were 200 thousand ultra low emission vehicles in the UK.
There were 39% more licensed ULEVs at the end of 2018 compared to the previous year.
The vast majority of ULEVs licensed at the end of 2018 were either plug-in hybrid electric vehicles (56%) or battery electric vehicles (35%). A small proportion
of ULEVs were range-extended electric vehicles (5%), which is currently only available in a small selection of models.
Figure 5: Map of licensed ULEVs as a proportion of all licensed vehicles by unitary authority, United Kingdom, 2018
56%35%
5%4%
Ultra Low Emission Vehicles by fuel
type
Other
Battery electric
Plug-in hybrid electric
Range-extended electric
Figure 4: Licensed ULEVs by fuel type, United Kingdom, 2018
Up to 0.25%
Over 0.25% to 0.5%
Over 0.5% to 1.0%
Over 1.0% to 2.0%
Over 2.0%
In the UK at the end of 2018, ULEVs accounted for 0.5% of all licensed vehicles. Regionally, the highest rate was seen in London with 0.8% and the lowest was in Wales with 0.2%.
The lower tier local authority with the highest rate was the Isles of Scilly with 6.0%, followed by City of London with 5.0%, and Peterborough with 4.9%.
The lower tier local authority with the lowest rate was Fermanagh and Omagh (Northern Ireland), with 0.1%.
Company vehicles affecting this mapCompany vehicles are often registered in bulk to the same address for administrative reasons, i.e. to a central office.
However, this causes hotspots in the map, where there’s a high concentration of licensed vehicles that aren’t used in that area.
INSET: London
Vehicle Licensing Statistics: Annual 2018 - Page 6
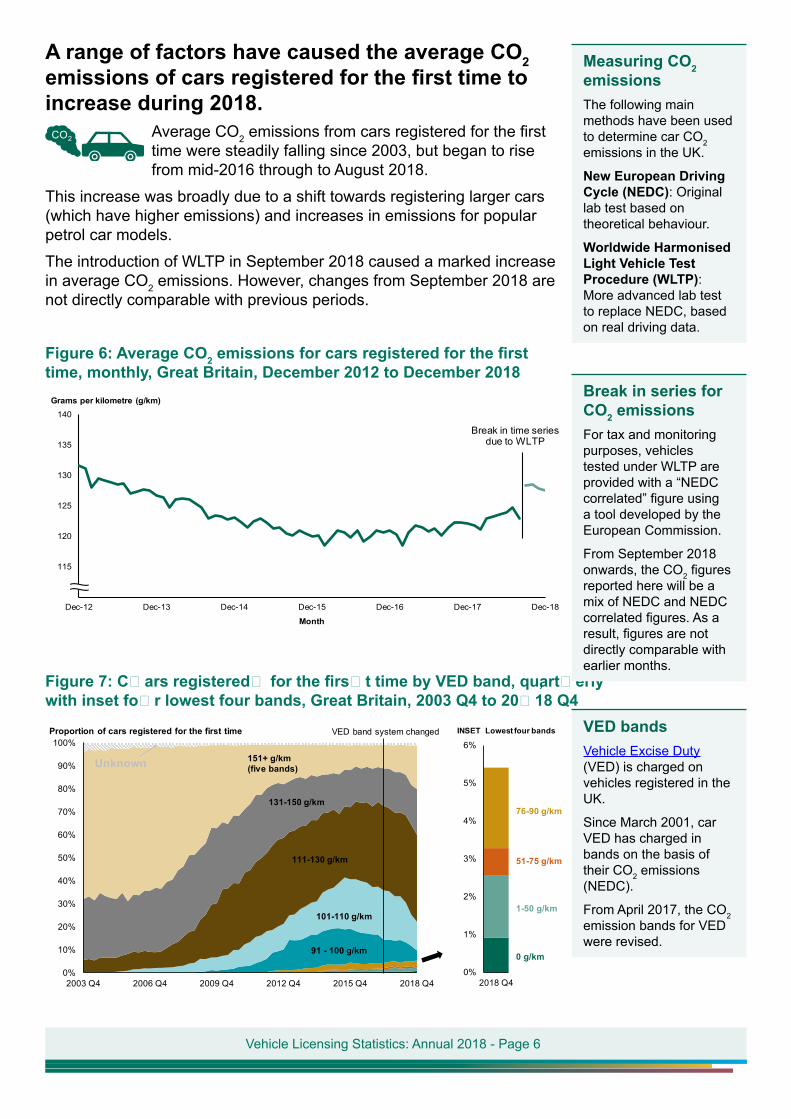
A range of factors have caused the average CO2 emissions of cars registered for the first time to increase during 2018.
Average CO2 emissions from cars registered for the first time were steadily falling since 2003, but began to rise from mid-2016 through to August 2018.
This increase was broadly due to a shift towards registering larger cars (which have higher emissions) and increases in emissions for popular petrol car models.
The introduction of WLTP in September 2018 caused a marked increase in average CO2 emissions. However, changes from September 2018 are not directly comparable with previous periods.
Figure 6: Average CO2 emissions for cars registered for the first time, monthly, Great Britain, December 2012 to December 2018
115
120
125
130
135
140
Dec-12 Dec-13 Dec-14 Dec-15 Dec-16 Dec-17 Dec-18
Grams per kilometre (g/km)
Month
Break in time series due to WLTP
Figure 7: Cars registered for the first time by VED band, quarterly, with inset for lowest four bands, Great Britain, 2003 Q4 to 2018 Q4
0%
10%
20%
30%
40%
50%
60%
70%
80%
90%
100%
2003 Q4 2006 Q4 2009 Q4 2012 Q4 2015 Q4 2018 Q4
Proportion of cars registered for the first time VED band system changed
Unknown
101-110 g/km
111-130 g/km
131-150 g/km
151+ g/km (five bands)
91 - 100 g/km
0%
1%
2%
3%
4%
5%
6%
2018 Q4
INSET Lowest four bands
0 g/km
1-50 g/km
51-75 g/km
76-90 g/km
Measuring CO2 emissionsThe following main methods have been used to determine car CO2 emissions in the UK.
New European Driving Cycle (NEDC): Original lab test based on theoretical behaviour.
Worldwide Harmonised Light Vehicle Test Procedure (WLTP): More advanced lab test to replace NEDC, based on real driving data.
Break in series for CO2 emissionsFor tax and monitoring purposes, vehicles tested under WLTP are provided with a “NEDC correlated” figure using a tool developed by the European Commission.
From September 2018 onwards, the CO2 figures reported here will be a mix of NEDC and NEDC correlated figures. As a result, figures are not directly comparable with earlier months.
VED bandsVehicle Excise Duty (VED) is charged on vehicles registered in the UK.
Since March 2001, car VED has charged in bands on the basis of their CO2 emissions (NEDC).
From April 2017, the CO2 emission bands for VED were revised.
Vehicle Licensing Statistics: Annual 2018 - Page 7
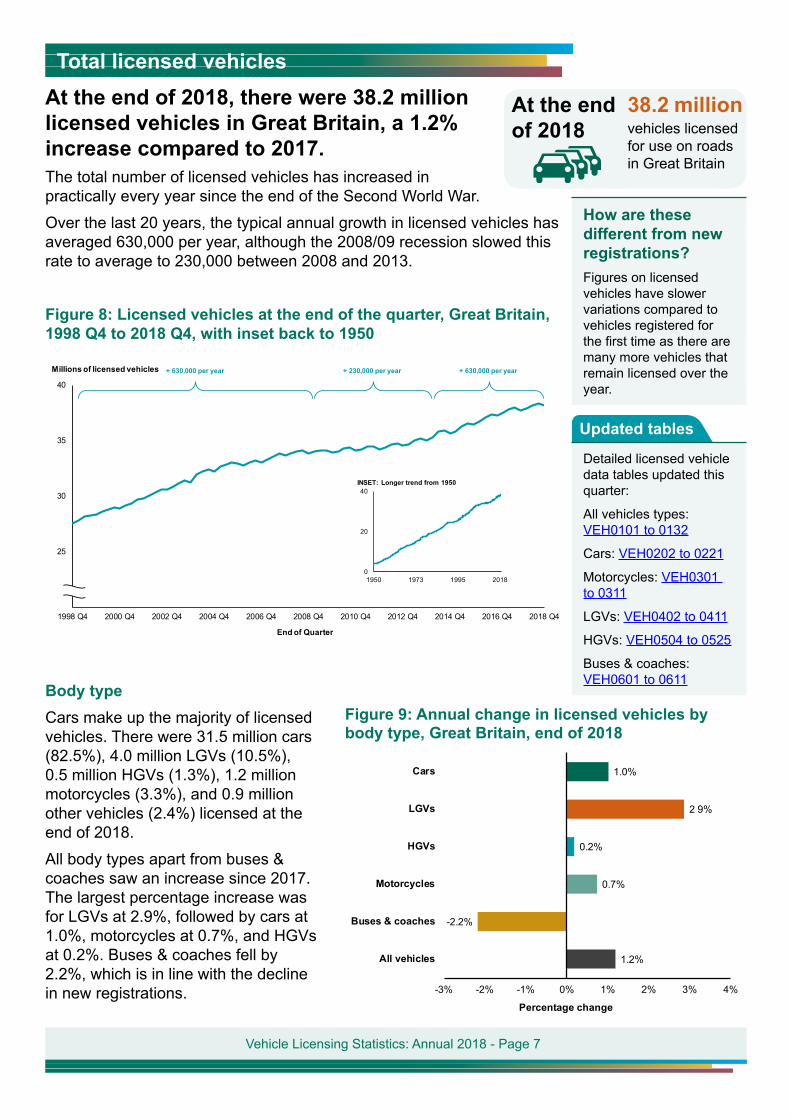
Total licensed vehiclesAt the end of 2018, there were 38.2 million licensed vehicles in Great Britain, a 1.2% increase compared to 2017.The total number of licensed vehicles has increased in practically every year since the end of the Second World War.
Over the last 20 years, the typical annual growth in licensed vehicles has averaged 630,000 per year, although the 2008/09 recession slowed this rate to average to 230,000 between 2008 and 2013.
Figure 8: Licensed vehicles at the end of the quarter, Great Britain, 1998 Q4 to 2018 Q4, with inset back to 1950
25
30
35
40
1998 Q4 2000 Q4 2002 Q4 2004 Q4 2006 Q4 2008 Q4 2010 Q4 2012 Q4 2014 Q4 2016 Q4 2018 Q4
Millions of licensed vehicles
End of Quarter
+ 630,000 per year + 230,000 per year + 630,000 per year
0
20
40
1950 1973 1995 2018
INSET: Longer trend from 1950
Body typeCars make up the majority of licensed vehicles. There were 31.5 million cars (82.5%), 4.0 million LGVs (10.5%), 0.5 million HGVs (1.3%), 1.2 million motorcycles (3.3%), and 0.9 million other vehicles (2.4%) licensed at the end of 2018.
All body types apart from buses & coaches saw an increase since 2017. The largest percentage increase was for LGVs at 2.9%, followed by cars at 1.0%, motorcycles at 0.7%, and HGVs at 0.2%. Buses & coaches fell by 2.2%, which is in line with the decline in new registrations.
Figure 9: Annual change in licensed vehicles by body type, Great Britain, end of 2018
1.0%
2 9%
0.2%
0.7%
-2.2%
1.2%
-3% -2% -1% 0% 1% 2% 3% 4%
Cars
LGVs
HGVs
Motorcycles
Buses & coaches
All vehicles
Percentage change
At the end of 2018
38.2 millionvehicles licensed for use on roads in Great Britain
How are these different from new registrations?Figures on licensed vehicles have slower variations compared to vehicles registered for the first time as there are many more vehicles that remain licensed over the year.
Detailed licensed vehicle data tables updated this quarter:
All vehicles types: VEH0101 to 0132
Cars: VEH0202 to 0221
Motorcycles: VEH0301 to 0311
LGVs: VEH0402 to 0411
HGVs: VEH0504 to 0525
Buses & coaches: VEH0601 to 0611
Updated tables
Vehicle Licensing Statistics: Annual 2018 - Page 8
Northern IrelandAt the end of 2018, there were 1.2 million licensed vehicles in Northern Ireland, which is an increase of 1.9% compared to the previous year.
The distribution of vehicles by body type was broadly similar to Great Britain. There were 980,000 cars (82.6%), 120,000 LGVs (10.0%), 24,000 HGVs (2.1%), 22,000 motorcycles (1.9%), and 40,000 other vehicles (3.4%) licensed at the end of 2018 in Northern Ireland.
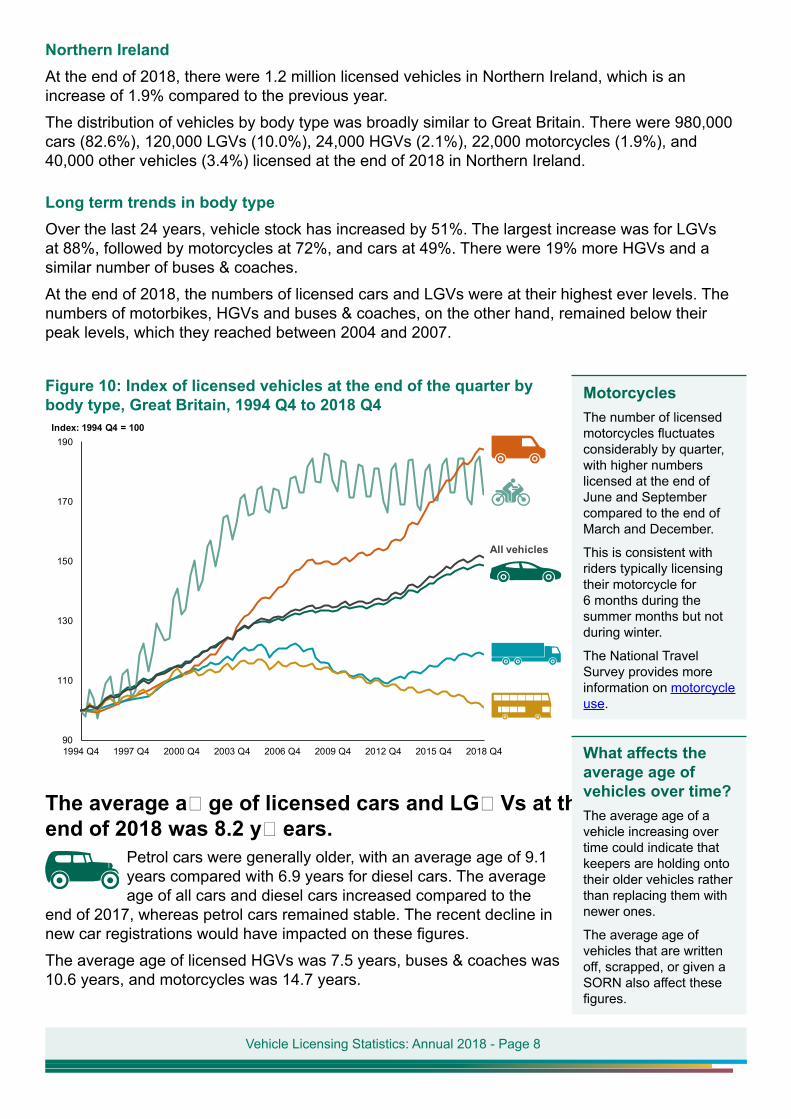
Long term trends in body typeOver the last 24 years, vehicle stock has increased by 51%. The largest increase was for LGVs at 88%, followed by motorcycles at 72%, and cars at 49%. There were 19% more HGVs and a similar number of buses & coaches.
At the end of 2018, the numbers of licensed cars and LGVs were at their highest ever levels. The numbers of motorbikes, HGVs and buses & coaches, on the other hand, remained below their peak levels, which they reached between 2004 and 2007.
Figure 10: Index of licensed vehicles at the end of the quarter by body type, Great Britain, 1994 Q4 to 2018 Q4
90
110
130
150
170
190
1994 Q4 1997 Q4 2000 Q4 2003 Q4 2006 Q4 2009 Q4 2012 Q4 2015 Q4 2018 Q4
Index: 1994 Q4 = 100
All vehicles
The average age of licensed cars and LGVs at the end of 2018 was 8.2 years.
Petrol cars were generally older, with an average age of 9.1 years compared with 6.9 years for diesel cars. The average age of all cars and diesel cars increased compared to the
end of 2017, whereas petrol cars remained stable. The recent decline in new car registrations would have impacted on these figures.
The average age of licensed HGVs was 7.5 years, buses & coaches was 10.6 years, and motorcycles was 14.7 years.
MotorcyclesThe number of licensed motorcycles fluctuates considerably by quarter, with higher numbers licensed at the end of June and September compared to the end of March and December.
This is consistent with riders typically licensing their motorcycle for 6 months during the summer months but not during winter.
The National Travel Survey provides more information on motorcycle use.
What affects the average age of vehicles over time?The average age of a vehicle increasing over time could indicate that keepers are holding onto their older vehicles rather than replacing them with newer ones.
The average age of vehicles that are written off, scrapped, or given a SORN also affect these figures.
Vehicle Licensing Statistics: Annual 2018 - Page 9
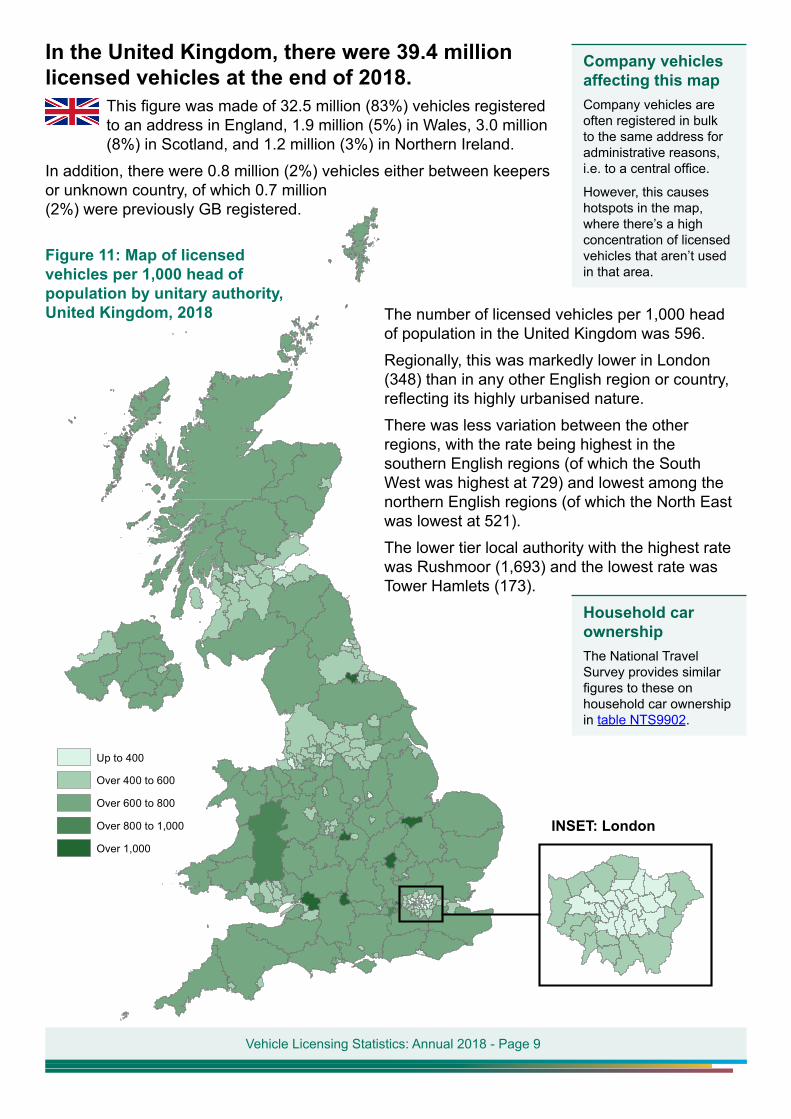
In the United Kingdom, there were 39.4 million licensed vehicles at the end of 2018.
This figure was made of 32.5 million (83%) vehicles registered to an address in England, 1.9 million (5%) in Wales, 3.0 million (8%) in Scotland, and 1.2 million (3%) in Northern Ireland.
In addition, there were 0.8 million (2%) vehicles either between keepers or unknown country, of which 0.7 million (2%) were previously GB registered.
Figure 11: Map of licensed vehicles per 1,000 head of population by unitary authority, United Kingdom, 2018
Up to 400
Over 400 to 600
Over 600 to 800
Over 800 to 1,000
Over 1,000
The number of licensed vehicles per 1,000 head of population in the United Kingdom was 596.
Regionally, this was markedly lower in London (348) than in any other English region or country, reflecting its highly urbanised nature.
There was less variation between the other regions, with the rate being highest in the southern English regions (of which the South West was highest at 729) and lowest among the northern English regions (of which the North East was lowest at 521).
The lower tier local authority with the highest rate was Rushmoor (1,693) and the lowest rate was Tower Hamlets (173).
Company vehicles affecting this mapCompany vehicles are often registered in bulk to the same address for administrative reasons, i.e. to a central office.
However, this causes hotspots in the map, where there’s a high concentration of licensed vehicles that aren’t used in that area.
Household car ownershipThe National Travel Survey provides similar figures to these on household car ownership in table NTS9902.
INSET: London
Vehicle Licensing Statistics: Annual 2018 - Page 10
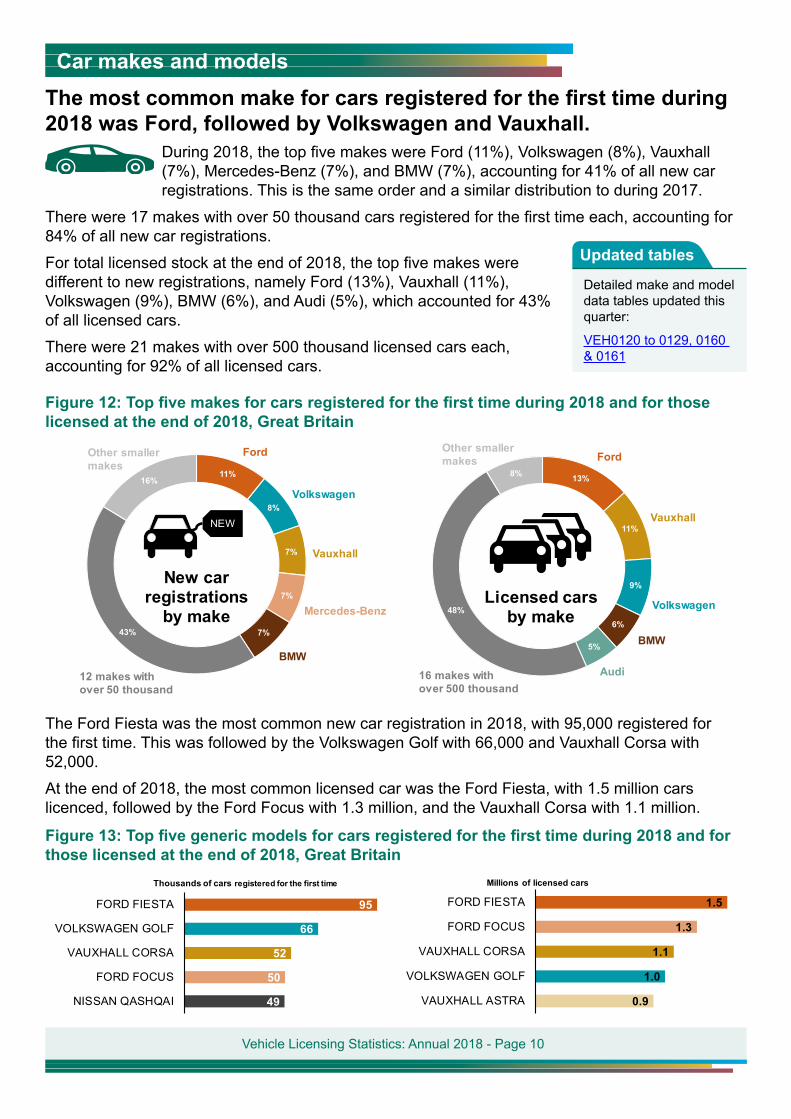
Car makes and modelsThe most common make for cars registered for the first time during 2018 was Ford, followed by Volkswagen and Vauxhall.
During 2018, the top five makes were Ford (11%), Volkswagen (8%), Vauxhall (7%), Mercedes-Benz (7%), and BMW (7%), accounting for 41% of all new car registrations. This is the same order and a similar distribution to during 2017.
There were 17 makes with over 50 thousand cars registered for the first time each, accounting for 84% of all new car registrations.
For total licensed stock at the end of 2018, the top five makes were different to new registrations, namely Ford (13%), Vauxhall (11%), Volkswagen (9%), BMW (6%), and Audi (5%), which accounted for 43% of all licensed cars.
There were 21 makes with over 500 thousand licensed cars each, accounting for 92% of all licensed cars.
Figure 12: Top five makes for cars registered for the first time during 2018 and for those licensed at the end of 2018, Great Britain
11%
8%
7%
7%
7%43%
16%
New car registrations
by make
Ford
Volkswagen
Mercedes-Benz
Other smaller makes
Vauxhall
BMW
12 makes with over 50 thousand
13%
11%
9%
6%
5%
48%
8%
Licensed cars by make
Ford
Vauxhall
Volkswagen
BMW
Audi
Other smaller makes
16 makes with over 500 thousand
The Ford Fiesta was the most common new car registration in 2018, with 95,000 registered for the first time. This was followed by the Volkswagen Golf with 66,000 and Vauxhall Corsa with 52,000.
At the end of 2018, the most common licensed car was the Ford Fiesta, with 1.5 million cars licenced, followed by the Ford Focus with 1.3 million, and the Vauxhall Corsa with 1.1 million.
Figure 13: Top five generic models for cars registered for the first time during 2018 and for those licensed at the end of 2018, Great Britain
49
50
52
66
95
NISSAN QASHQAI
FORD FOCUS
VAUXHALL CORSA
VOLKSWAGEN GOLF
FORD FIESTA
Thousands of cars registered for the first time
0.9
1.0
1.1
1.3
1.5
VAUXHALL ASTRA
VOLKSWAGEN GOLF
VAUXHALL CORSA
FORD FOCUS
FORD FIESTA
Millions of licensed cars
Detailed make and model data tables updated this quarter:
VEH0120 to 0129, 0160 & 0161
Updated tables
Vehicle Licensing Statistics: Annual 2018 - Page 11
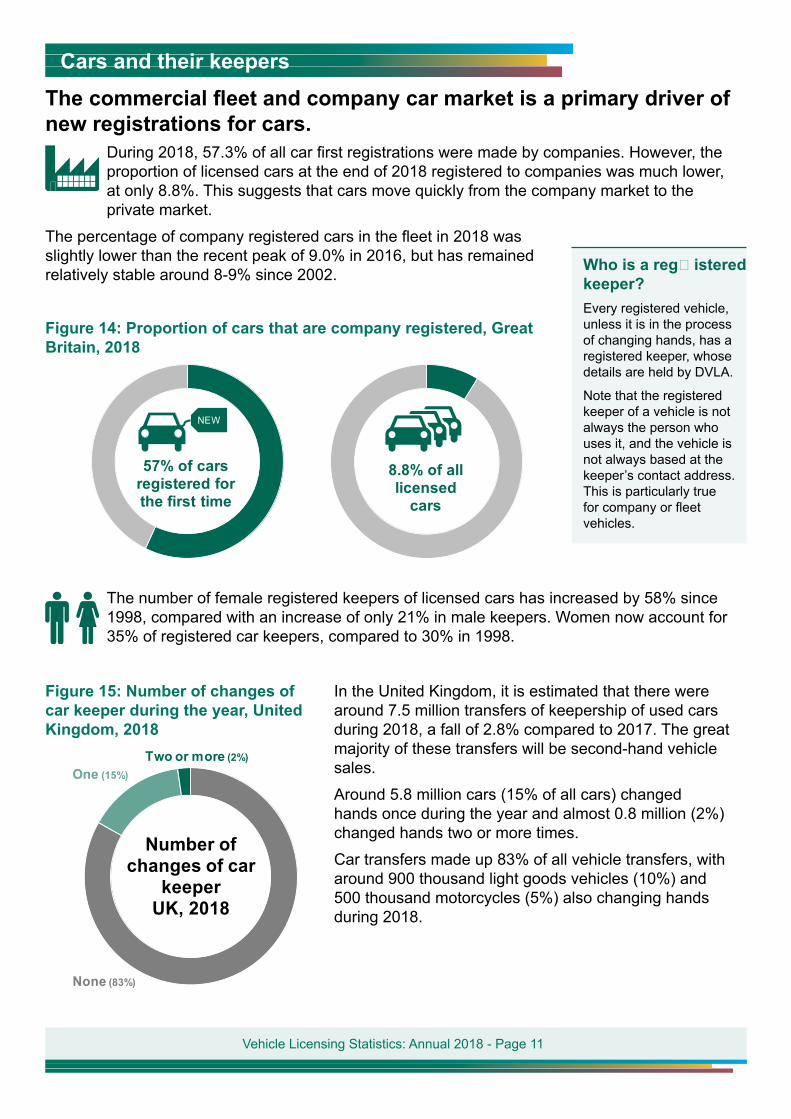
Cars and their keepersThe commercial fleet and company car market is a primary driver of new registrations for cars.
During 2018, 57.3% of all car first registrations were made by companies. However, the proportion of licensed cars at the end of 2018 registered to companies was much lower, at only 8.8%. This suggests that cars move quickly from the company market to the private market.
The percentage of company registered cars in the fleet in 2018 was slightly lower than the recent peak of 9.0% in 2016, but has remained relatively stable around 8-9% since 2002.
Figure 14: Proportion of cars that are company registered, Great Britain, 2018
57% of cars registered forthe first time
8.8% of all licensed
cars
The number of female registered keepers of licensed cars has increased by 58% since 1998, compared with an increase of only 21% in male keepers. Women now account for 35% of registered car keepers, compared to 30% in 1998.
In the United Kingdom, it is estimated that there were around 7.5 million transfers of keepership of used cars during 2018, a fall of 2.8% compared to 2017. The great majority of these transfers will be second-hand vehicle sales.
Around 5.8 million cars (15% of all cars) changed hands once during the year and almost 0.8 million (2%) changed hands two or more times.
Car transfers made up 83% of all vehicle transfers, with around 900 thousand light goods vehicles (10%) and 500 thousand motorcycles (5%) also changing hands during 2018.
Figure 15: Number of changes of car keeper during the year, United Kingdom, 2018
Number of changes of car
keeperUK, 2018
None (83%)
One (15%)Two or more (2%)
Who is a registered keeper?Every registered vehicle, unless it is in the process of changing hands, has a registered keeper, whose details are held by DVLA.
Note that the registered keeper of a vehicle is not always the person who uses it, and the vehicle is not always based at the keeper’s contact address. This is particularly true for company or fleet vehicles.
Vehicle Licensing Statistics: Annual 2018 - Page 12
Background notesAbout these statisticsAlmost all the statistics in the vehicle licensing statistics series are derived by Department for Transport statisticians from extracts of the Driver and Vehicle Licensing Agency (DVLA) vehicle database. The main purpose of the database is to administer vehicle registration and licensing records in the United Kingdom.
For further information, please see the detailed technical notes. There is also a Statement of Administrative Sources for the DVLA vehicles database.
A separate note on users and uses of these statistics is available from the vehicles statistics information web page.
Request for feedbackWe welcome any feedback on these statistics, to ensure future releases best meet user needs. Feedback can be provided by email to [email protected].
Strengths and weaknesses of the dataThe DVLA database can be regarded as being virtually complete in terms of the number of vehicles registered for the first time, licensed vehicles and vehicles with a SORN (Statutory Off-Road Notification). However, there may be some errors in some of the specific details of individual vehicles.
The Department for Transport estimates that under 2% of the vehicles records have an inaccuracy in one of the variables used for the statistics published. Other factors to consider in interpreting these statistics include:
► Changes in legislation;
► Revisions to the series;
► Seasonal variation which affects some vehicle types;
► Foreign registered vehicles may also use UK roads without being registered with DVLA;
► Vehicle excise duty evasion.
Most of these factors will only have a marginal effect for most uses of the data.
GeographyIn July 2014, vehicle and registration services for Northern Ireland were centralised at DVLA, where these services for Great Britain were already administered. This created a single vehicle register for the United Kingdom, in place of separate registers for Great Britain and Northern Ireland.
As a result of these changes, the coverage of the vehicle licensing statistics tables was expanded to cover UK as well as GB where practical. Because of the greater availability of GB time series data, this statistical release will continue to focus mainly on GB rather than UK results for now. For further information, please see the detailed technical notes.
Vehicle Licensing Statistics: Annual 2018 - Page 13
National StatisticsAll of the statistics published in this series are National Statistics, apart from the exceptions listed on the collection page. Vehicles statistics were assessed by the UK Statistics Authority and confirmed as National Statistics in April 2012.
National Statistics are produced to the high professional standards set out in the Code of Practice for Statistics. They undergo regular quality assurance reviews to ensure that they meet customer needs. They are produced free from any political interference.
Details of ministers and officials who receive pre-release access to these statistics up to 24 hours before release can be found in the pre-release access list.
Next releaseVehicle Licensing statistical releases are published quarterly. The next release is due in June 2019. The Quarter 4 release for each calendar year is accompanied by a larger set of data tables and more detailed commentary.
Any updates to these plans will be advertised via the DfT statistical publications schedule.
Release of DfT Statistics publicationsTo hear more about DfT statistics publications as they are released, please follow us on Twitter via our @DfTstats account: https://www.twitter.com/DfTstats. TWITTER, TWEET, RETWEET and the Twitter logo are trademarks of Twitter, Inc. or its affiliates.