Embed Size (px)
Citation preview

ArticlesDOI: 10.1038/s41559-017-0328-y
© 2017 Macmillan Publishers Limited, part of Springer Nature. All rights reserved.
1 Sino-French Institute for Earth System Science, College of Urban and Environmental Sciences, Peking University, Beijing 100871, China. 2 Key Laboratory of Alpine Ecology and Biodiversity, Institute of Tibetan Plateau Research, Chinese Academy of Sciences, Beijing 100085, China. 3 Center for Excellence in Tibetan Earth Science, Chinese Academy of Sciences, Beijing 100085, China. 4 Centre of Excellence GCE (Global Change Ecology), Department of Biology, University of Antwerp, Universiteitsplein 1, B-2610 Wilrijk, Belgium. 5 Laboratoire des Sciences du Climat et de l’Environnement, CEA CNRS UVSQ, Gif-sur-Yvette 91191, France. 6 Department of Earth and Environment, Boston University, Boston, MA 02215, USA. 7 CREAF, Cerdanyola del Vallès, Barcelona, 08193 Catalonia, Spain. 8 CSIC, Global Ecology Unit CREAF-CSIC-UAB, Bellaterra, Barcelona, 08193 Catalonia, Spain. *e-mail: [email protected]
The climatic system of the Earth is experiencing substantial warming, which has raised concerns about the impacts on terrestrial ecosystems1. In situ observations, manipulative
experiments as well as satellite-derived data have all indicated that vegetation productivity is sensitive to temperature change in north-ern high latitudes2–6.
Vegetation can adjust to climate change through relatively fast mechanisms (for example, adjustment of phenology or physiol-ogy7,8) and through slower mechanisms (for example, phenotypic and genotypic adaptations, changes in community composition8). If the climate changes slowly and vegetation has sufficient time to adjust, it can be expected that warming would result in a north-ward shift of structure and function of vegetation in the Northern Hemisphere. In reality, temperature acclimation and adaptation of plants9, as well as limited resource availability, such as nitrogen10, may prevent vegetation productivity change from keeping the same rate as the rapid climate warming. By contrast, CO2 fertilization effects and regional nitrogen deposition may amplify the greening trend induced by warming temperature11,12. Unfortunately, knowl-edge about the rate at which vegetation responds to ongoing tem-perature change is still limited. Specifically, it is not known whether and to what extent change in the spatial displacement of vegetation productivity isolines during recent decades matches the northward motion of temperature isolines.
The concept of the velocity of change13 offers the opportunity to directly compare the ongoing change in the spatial patterns of temperature and productivity. This concept was first developed for climate impact research to compare the displacement rate of a
forcing variable (for example, temperature) with that of an affected variable (for example, the occurrence of a given species) by con-verting them into the same units13–19 (for example, km yr−1). The velocity of change in a geospatial variable is the ratio of its tem-poral change to its local geographical gradient15–17,20,21. Imagine, for instance, that the mean spring temperature has increased by 0.3 °C over 30 years. At the same location, a 1 °C temperature spatial gra-dient is observed across a 100 km distance with a south-to-north decrease in temperature. The velocity of spring temperature change is therefore 1 km yr−1 for this example (temporal trend of 0.3 °C over 30 years, divided by the spatial gradient of 1 °C over 100 km).
Similarly, within the boundaries of a biome, we can calculate the velocity of change in vegetation productivity (also in km yr−1). For each local cell, plant productivity changes in response to changes in the ambient environmental conditions; and these responses are through changes in phenology or physiology of plant individuals (in situ) or changes in community composition (for example, shrub expansion). Such changes in productivity for each of the multiple pixels in a region eventually appear as the movement of produc-tivity isolines at a regional scale (Supplementary Fig. 1a). In this case, the velocity of productivity change indicates a displacement in the isolines of this variable due to changes in productivity in response to climate change for multiple pixels in a certain region (Supplementary Fig. 1b). That is, the concept of velocity here quan-tifies how the spatial pattern of vegetation productivity changes in response to environmental changes during the study period, with different speeds and directions for each pixel. For a certain loca-tion with a south-to-north decrease in vegetation productivity, a
Velocity of change in vegetation productivity over northern high latitudesMengtian Huang1, Shilong Piao 1,2,3*, Ivan A. Janssens4, Zaichun Zhu 1, Tao Wang2,3, Donghai Wu1, Philippe Ciais1,5, Ranga B. Myneni6, Marc Peaucelle5,7, Shushi Peng1, Hui Yang1 and Josep Peñuelas 7,8
Warming is projected to increase the productivity of northern ecosystems. However, knowledge on whether the northward dis-placement of vegetation productivity isolines matches that of temperature isolines is still limited. Here we compared changes in the spatial patterns of vegetation productivity and temperature using the velocity of change concept, which expresses these two variables in the same unit of displacement per time. We show that across northern regions (> 50° N), the average velocity of change in growing-season normalized difference vegetation index (NDVIGS, an indicator of vegetation productivity; 2.8 ± 1.1 km yr−1) is lower than that of growing-season mean temperature (TGS; 5.4 ± 1.0 km yr−1). In fact, the NDVIGS velocity was less than half of the TGS velocity in more than half of the study area, indicating that the northward movement of productivity iso-lines is much slower than that of temperature isolines across the majority of northern regions (about 80% of the area showed faster changes in temperature than productivity isolines). We tentatively attribute this mismatch between the velocities of productivity and temperature to the effects of limited resource availability and vegetation acclimation mechanisms. Analyses of ecosystem model simulations further suggested that limited nitrogen availability is a crucial obstacle for vegetation to track the warming trend.
NATuRe eCologY & eVoluTIoN | www.nature.com/natecolevol

© 2017 Macmillan Publishers Limited, part of Springer Nature. All rights reserved. © 2017 Macmillan Publishers Limited, part of Springer Nature. All rights reserved.
Articles Nature ecology & evolutioN
northward velocity of vegetation productivity of 1 km yr−1 over the past 30 years would indicate that the current productivity of a cer-tain ecosystem has increased from its value 30 years ago to a higher value today equal to the past productivity of another ecosystem that is 30 km (1 km yr−1 × 30 years) south of the target ecosystem. The comparison between the velocities of change in vegetation produc-tivity and temperature then makes it possible to identify whether the movement of productivity isolines is in the same direction of the movement of temperature isolines and/or whether the displacement of productivity isolines is faster or slower than that of temperature isolines. Then we can address the question of whether and to what extent changes in the spatial pattern of vegetation productivity dur-ing recent decades have matched the displacement of temperature isolines (Supplementary Information section 1.1).
In this study, we mapped the vector (both velocity and direction) of change in vegetation productivity, which was calculated using the satellite-derived long-term NDVI. The NDVI dataset covers the period of 1982–2011 and was analysed for velocity in the region north of 50° N, where vegetation productivity responds mainly to temperature changes22,23. Productivity velocities were then com-pared to the velocities of temperature change (see Methods). To minimize the covariate effects of other environmental variables, our analyses focused only on the overlap of natural ecosystems (defined following the International Geosphere–Biosphere Program; see Methods and Supplementary Fig. 2) and ecosystems where produc-tivity is temporally positively (P < 0.1) correlated with temperature during the study period (see Methods and Supplementary Fig. 3). This study area represents about 76% of the vegetated area (annual mean NDVI > 0.1) across the northern high latitudes.
Results and discussionWe first calculated the distribution of the velocities and their directions for the sum of the April–October growing-season (GS) NDVI (NDVIGS) and growing-season mean temperature (TGS) over the last 30 years (see Methods). The average NDVIGS velocity was 2.8 ± 1.1 km yr−1 across the study area. Large NDVIGS velocities (> 10 km yr−1) were found in eastern Europe, northeastern and western Siberia, whereas low values (< 1 km yr−1) were found in central and eastern Canada as well as western Siberia (Fig. 1a). In 89% of the study area, the directions of NDVIGS vectors were from regions with higher NDVIGS values to those with lower values, with the majority of the study area (55%) showing a northward move-ment (Fig. 1c). On average, the TGS velocity across the study area (5.4 ± 1.0 km yr−1) was nearly twice the velocity of NDVIGS. The largest TGS velocities (> 10 km yr−1) were observed in northern central and eastern Siberia, parts of Europe, as well as eastern and northeastern Canada, whereas low values (< 1 km yr−1) were only found in southwestern Canada (Fig. 1b). Northward TGS vectors were observed in 71% of the study area (Fig. 1d).
Comparing the vectors of NDVIGS and TGS (see Methods), we found that 91% of the study area showed a positive ratio between the velocities of projected NDVIGS vectors and the velocities of the TGS vectors (VN:VT ratio) (blue colour in Fig. 1e). This suggests that in these regions, vegetation productivity corresponds to the direc-tion of temperature change during the study period. Among these regions, about 98% of the area show positive trends in both NDVIGS and TGS, that is, vegetation productivity has increased where tem-perature warmed. Only a few regions in western Canada with a pos-itive VN:VT ratio show a decreasing NDVIGS as a result of decreasing TGS during the study period (Supplementary Fig. 4). Larger NDVIGS velocities (projected along the TGS velocities) than TGS velocities occur in 20% of the whole study area, mainly in eastern Europe, northeastern and southern Siberia as well as parts of western Canada (Fig. 1e). In about half of the study area, the VN:VT ratio is lower than 0.5, in particular in northern Europe, central Siberia and northeastern Canada. Similar results are also obtained when using
NDVIGS
km yr–11 5 10 >20
TGS
km yr–11 5 10 >20
Ratio between projectedNDVIGS and TGS velocity
<–1–0
.5 –0.1 0 0.1 0.5 >1 –10
0 –1–0
.01 00.01 1
100
0
10
20
30
Ratio between projectedNDVIGS and TGS velocity
Perc
enta
ge (%
)
N NEE
SESSWWNW
a b
c d
e
Vel
ocity
Dire
ctio
nRa
tio
Fig. 1 | The velocity of NDVIgS and TgS from 1982 to 2011 over northern high latitudes (north of 50° N). a, The spatial pattern of the velocity of the vector of change in NDVIGS. b, The spatial pattern of the velocity of the vector of change in TGS. c, The spatial pattern of the direction of the vector of change in NDVIGS. d, The spatial pattern of the direction of the vector of change in TGS. e, The comparison between the velocity of the NDVIGS vector after projecting along the spatial gradient of TGS and the velocity of the TGS vector (see Methods). The growing season is defined as from April to October. The velocity was calculated as the ratio between the 30-year temporal trend and the spatial gradient over the 30-year means (see Methods). The velocities shown in a and b are the original velocities without projecting the NDVIGS vectors along the temperature gradient. c,d, N, NE, E, SE, S, SW, W and NW refer to northward, northeastward, eastward, southeastward, southward, southwestward, westward and northwestward, respectively. e, The ratio between the velocity of NDVIGS along the spatial gradient of TGS and the velocity of TGS was calculated after projecting the NDVIGS vector along the spatial gradient of TGS for each pixel (see Methods). A blue colour (positive ratio) indicates that the change in the spatial pattern of NDVIGS was directionally consistent with the direction of the change in the spatial pattern of TGS, whereas a red colour (negative ratio) indicates that the former was inconsistent with the direction of the latter. Note that only gridded pixels covered by natural vegetation (defined following the International Geosphere–Biosphere Program based on a MODIS land cover classification; Supplementary Fig. 2) with annual mean NDVI value larger than 0.1 are shown here.
NATuRe eCologY & eVoluTIoN | www.nature.com/natecolevol
© 2017 Macmillan Publishers Limited, part of Springer Nature. All rights reserved. © 2017 Macmillan Publishers Limited, part of Springer Nature. All rights reserved.
ArticlesNature ecology & evolutioN
different climate-forcing datasets, when choosing different grow-ing-season definitions (May–September or April–September) or when NDVIGS velocities were compared with those of mean annual temperature (Supplementary Fig. 5 and Methods).
Overall, the largest VN:VT ratios are found in relatively warmer regions (Supplementary Fig. 6; R = 0.89, P < 0.01). Several possible reasons may explain this phenomenon. First, the ubiquitous CO2 fertilization effect, which can amplify the warming-induced positive trend of productivity11, is expected to be relatively stronger at higher temperature24,25. Second, larger VN:VT ratios in warmer regions may arise from larger nitrogen availability, either from increased soil nitrogen mineralization or from additional nitrogen that is depos-ited in ecosystems in most of the warmer temperate regions of the Northern Hemisphere26,27. In addition, the lower VN:VT ratios found in colder climates may be associated with background limitations induced by the presence of permafrost (Supplementary Fig. 7). Permafrost constrains the development of roots and slows down the decomposition of soil organic matter, thereby limiting mineral nitrogen and phosphorus availability for plants28.
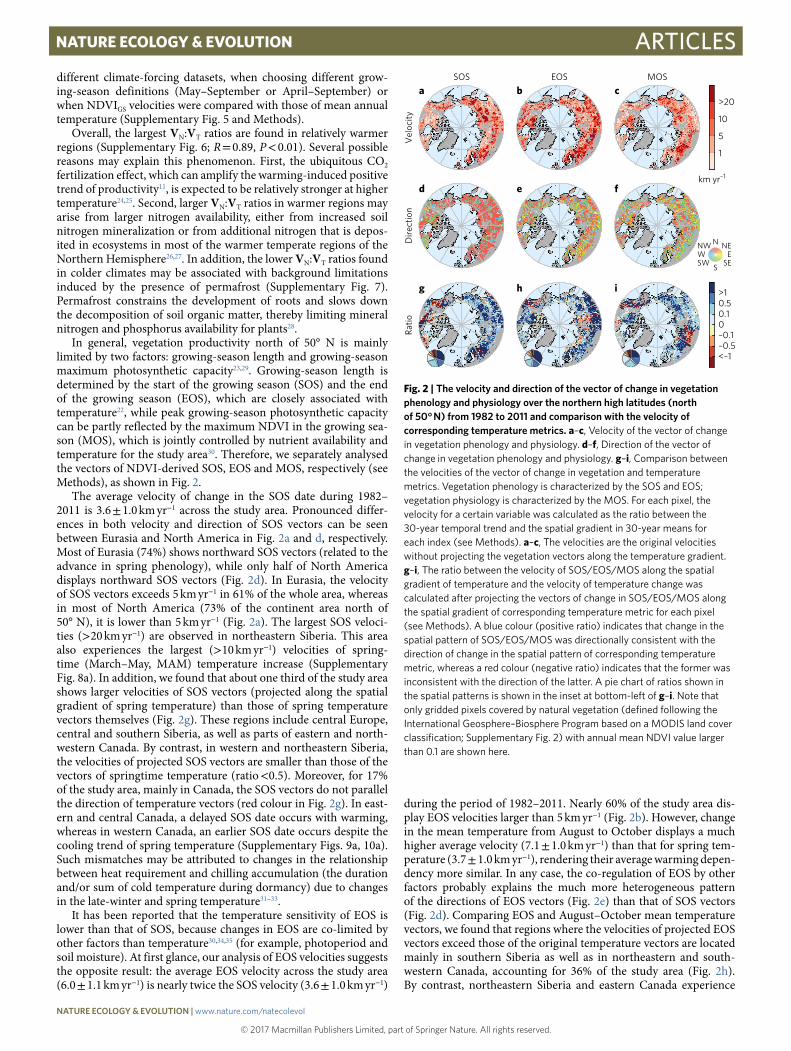
In general, vegetation productivity north of 50° N is mainly limited by two factors: growing-season length and growing-season maximum photosynthetic capacity23,29. Growing-season length is determined by the start of the growing season (SOS) and the end of the growing season (EOS), which are closely associated with temperature22, while peak growing-season photosynthetic capacity can be partly reflected by the maximum NDVI in the growing sea-son (MOS), which is jointly controlled by nutrient availability and temperature for the study area30. Therefore, we separately analysed the vectors of NDVI-derived SOS, EOS and MOS, respectively (see Methods), as shown in Fig. 2.
The average velocity of change in the SOS date during 1982–2011 is 3.6 ± 1.0 km yr−1 across the study area. Pronounced differ-ences in both velocity and direction of SOS vectors can be seen between Eurasia and North America in Fig. 2a and d, respectively. Most of Eurasia (74%) shows northward SOS vectors (related to the advance in spring phenology), while only half of North America displays northward SOS vectors (Fig. 2d). In Eurasia, the velocity of SOS vectors exceeds 5 km yr−1 in 61% of the whole area, whereas in most of North America (73% of the continent area north of 50° N), it is lower than 5 km yr−1 (Fig. 2a). The largest SOS veloci-ties (> 20 km yr−1) are observed in northeastern Siberia. This area also experiences the largest (> 10 km yr−1) velocities of spring-time (March–May, MAM) temperature increase (Supplementary Fig. 8a). In addition, we found that about one third of the study area shows larger velocities of SOS vectors (projected along the spatial gradient of spring temperature) than those of spring temperature vectors themselves (Fig. 2g). These regions include central Europe, central and southern Siberia, as well as parts of eastern and north-western Canada. By contrast, in western and northeastern Siberia, the velocities of projected SOS vectors are smaller than those of the vectors of springtime temperature (ratio < 0.5). Moreover, for 17% of the study area, mainly in Canada, the SOS vectors do not parallel the direction of temperature vectors (red colour in Fig. 2g). In east-ern and central Canada, a delayed SOS date occurs with warming, whereas in western Canada, an earlier SOS date occurs despite the cooling trend of spring temperature (Supplementary Figs. 9a, 10a). Such mismatches may be attributed to changes in the relationship between heat requirement and chilling accumulation (the duration and/or sum of cold temperature during dormancy) due to changes in the late-winter and spring temperature31–33.
It has been reported that the temperature sensitivity of EOS is lower than that of SOS, because changes in EOS are co-limited by other factors than temperature30,34,35 (for example, photoperiod and soil moisture). At first glance, our analysis of EOS velocities suggests the opposite result: the average EOS velocity across the study area (6.0 ± 1.1 km yr−1) is nearly twice the SOS velocity (3.6 ± 1.0 km yr−1)
during the period of 1982–2011. Nearly 60% of the study area dis-play EOS velocities larger than 5 km yr−1 (Fig. 2b). However, change in the mean temperature from August to October displays a much higher average velocity (7.1 ± 1.0 km yr−1) than that for spring tem-perature (3.7 ± 1.0 km yr−1), rendering their average warming depen-dency more similar. In any case, the co-regulation of EOS by other factors probably explains the much more heterogeneous pattern of the directions of EOS vectors (Fig. 2e) than that of SOS vectors (Fig. 2d). Comparing EOS and August–October mean temperature vectors, we found that regions where the velocities of projected EOS vectors exceed those of the original temperature vectors are located mainly in southern Siberia as well as in northeastern and south-western Canada, accounting for 36% of the study area (Fig. 2h). By contrast, northeastern Siberia and eastern Canada experience
SOS EOS MOS
km yr–1
1
5
10
>20
<–1–0.5–0.100.10.5>1
N NEE
SESSWWNW
Vel
ocity
Dire
ctio
nRa
tio
a b c
d fe
g h i
Fig. 2 | The velocity and direction of the vector of change in vegetation phenology and physiology over the northern high latitudes (north of 50° N) from 1982 to 2011 and comparison with the velocity of corresponding temperature metrics. a–c, Velocity of the vector of change in vegetation phenology and physiology. d–f, Direction of the vector of change in vegetation phenology and physiology. g–i, Comparison between the velocities of the vector of change in vegetation and temperature metrics. Vegetation phenology is characterized by the SOS and EOS; vegetation physiology is characterized by the MOS. For each pixel, the velocity for a certain variable was calculated as the ratio between the 30-year temporal trend and the spatial gradient in 30-year means for each index (see Methods). a–c, The velocities are the original velocities without projecting the vegetation vectors along the temperature gradient. g–i, The ratio between the velocity of SOS/EOS/MOS along the spatial gradient of temperature and the velocity of temperature change was calculated after projecting the vectors of change in SOS/EOS/MOS along the spatial gradient of corresponding temperature metric for each pixel (see Methods). A blue colour (positive ratio) indicates that change in the spatial pattern of SOS/EOS/MOS was directionally consistent with the direction of change in the spatial pattern of corresponding temperature metric, whereas a red colour (negative ratio) indicates that the former was inconsistent with the direction of the latter. A pie chart of ratios shown in the spatial patterns is shown in the inset at bottom-left of g–i. Note that only gridded pixels covered by natural vegetation (defined following the International Geosphere–Biosphere Program based on a MODIS land cover classification; Supplementary Fig. 2) with annual mean NDVI value larger than 0.1 are shown here.
NATuRe eCologY & eVoluTIoN | www.nature.com/natecolevol

© 2017 Macmillan Publishers Limited, part of Springer Nature. All rights reserved. © 2017 Macmillan Publishers Limited, part of Springer Nature. All rights reserved.
Articles Nature ecology & evolutioN
very strong warming during August–October (Supplementary Fig. 10b), but the EOS vectors in these regions show generally lower velocity than in southeastern Siberia (Fig. 2b), resulting in a smaller ratio (< 0.5) of EOS to autumn temperature change velocities (Fig. 2h). In parts of central Siberia and western Canada, we even observe an advanced EOS date with warming temperature (red colour in Fig. 2h). This mismatch between the vectors of EOS and temperature change may be partly explained by the decreased solar radiation in these regions35. Because it has been suggested that increases in solar radiation suppress the accumulation of abscisic acid and subsequently slow the speed of leaf senescence36, the decrease in solar radiation may have resulted in advanced EOS dates despite the warming temperature.
On average, the northern high latitudes exhibit an average MOS velocity of 3.1 ± 1.0 km yr−1 over the past three decades, which is lower than that of the summer (June to July) tempera-ture (4.2 ± 1.1 km yr−1). MOS velocities larger than 10 km yr−1 are found in eastern Europe, northeastern Siberia and northeastern Canada, whereas values lower than 1 km yr−1 mainly appear in the southern part of central Siberia, as well as in central and eastern Canada (Fig. 2c). Comparison between the velocity of MOS vec-tors (projected along the spatial gradient of summer temperature) and that of summer temperature vectors (Fig. 2i) show that larger MOS than temperature change velocities mainly occur in eastern Europe, northeastern Siberia, as well as in western and northeastern Canada, accounting for one third of the area where changes in MOS are consistent with the direction of the temperature change (blue colour in Fig. 2i). In northwestern Europe and southern Siberia, however, MOS velocities are generally less than half of the summer temperature velocities. Because northern ecosystems are strongly temperature-limited37, the slower velocities of projected MOS vec-tors compared to summer temperature velocities may be partly attributed to the fact that photosynthesis at the peak of the grow-ing season is constrained, because low-temperature-induced nutri-ent limitations do not allow the development of dense canopies38. Interestingly, we found larger MOS velocities in shrub and tundra ecosystems (3.4 ± 1.0 km yr−1 on average) (vegetation types from the International Geosphere–Biosphere Program; Supplementary Fig. 2) than in other vegetation types. In addition, the ratio of velocities of projected MOS vectors to summer temperature velocities is highest in shrub and tundra ecosystems (Supplementary Table 1). Warming-induced tall shrub and tree expansion39 may be respon-sible for the larger MOS velocities in shrub and tundra ecosystems than in other terrestrial ecosystems.
Land surface models are used to project future responses of eco-systems to climate change and to analyse the contribution of differ-ent driving factors40. We therefore examined the vectors of change in vegetation productivity using simulated net primary productivity (NPP) from five process-based land surface models (CLM4.5, LPJG, OCN, ORCHIDEE and VEGAS; see Methods and Supplementary Table 2). Our results show that the ensemble model-mean of change in annual NPP displays an average velocity of 4.0 ± 1.3 km yr−1 (± standard deviation across models). The highest NPP velocity values (> 10 km yr−1) are found in southern and northeastern Siberia (Supplementary Fig. 11a). We next compared the velocities of sim-ulated NPP with those of NDVIGS after projecting both NPP and NDVIGS vectors along the spatial gradient of TGS (see Methods). The results show that, on average, about 60% of the study area (rang-ing from 47% to 70% across different models) show higher veloci-ties of simulated NPP than of NDVIGS. Furthermore, we examined the NPP velocities using a satellite-derived terrestrial NPP prod-uct (GIMMS3g NPP; see Methods); these velocities display spatial patterns that are consistent with those of the NDVIGS vectors (for both velocity and direction), albeit with generally a lower velocity across the study area (Supplementary Fig. 12). Compared with the GIMMS3g NPP, the model-simulated NPP shows a larger velocity
in about 71% (ranging from 61% to 81%) of the study area. This mismatch regarding the increase in productivity under warm-ing between model- and satellite-based estimates may partly be explained by the limited availability of nitrogen in these regions41, which is suggested to prevent changes in vegetation productivity from adequately tracking the warming trend, but are not accounted for in some of the models42. Interestingly, we found that the two models with nitrogen limitations and nitrogen deposition taken into consideration (CLM4.5 and OCN) both produce lower NPP velocities (1.7 ± 1.0 km yr−1 and 2.0 ± 1.1 km yr−1 for CLM4.5 and OCN, respectively) than those without a coupled nitrogen cycle (3.5 ± 1.0 km yr−1, 2.9 ± 1.1 km yr−1 and 4.7 ± 1.2 km yr−1 for LPJG, ORCHIDEE and VEGAS, respectively) (Supplementary Table 3). Similar results are also observed for gross primary productivity (GPP; Supplementary Table 3 and Supplementary Fig. 13).
In summary, in this study we have applied the concept of velocity to remotely sensed NDVI fields and compared the NDVI velocity to that of temperature in northern (predominantly temperature-limited) ecosystems north of 50° N. The average velocity of change in NDVIGS (2.8 ± 1.1 km yr−1) over the study area is only about half of that in TGS (5.4 ± 1.0 km yr−1). The ratio between NDVIGS and TGS velocities, that is, the ratio of sensitivities of productivity to tem-perature across space and in time (Supplementary Information sec-tion 2.1) is less than 0.5 in about half of the study area. Our analyses therefore combined time and space and to some extent challenged the space-for-time substitution hypothesis43 as applied in several studies using spatial gradients to back-cast temporal changes44. Moreover, such a mismatch between productivity and temperature velocities suggests a disequilibrium between ecosystem function and climate. This may be owing to the prevalence of background spatial limitations by other factors limiting vegetation productivity, such as soil moisture and nutrients10, which also correspond to veg-etation acclimation to the ongoing warming9, as well as the transient limitations in the rate of adjustment of plant response to the warm-ing rate in different seasons. In addition, differences in the magni-tudes of the SOS, EOS and MOS velocities suggest that the seasonal profile of vegetation growth has strongly reshaped over time, which may have a substantial impact on the ecosystem carbon budget at high latitudes.
MethodsData. The monthly air temperature dataset used in this study is the CRU TS 3.22 climate dataset obtained from Climatic Research Unit (CRU) for the period from January 1982 to December 2011 (http://www.cru.uea.ac.uk/cru/data/hrg/). We also used WATCH Forcing Data Methodology to ERA-Interim data with a temporal resolution of 3 hours (WFDEI)45. The third generation Global Inventory Monitoring and Modeling System Normalized Difference Vegetation Index (GIMMS NDVI3g) dataset from the Advanced Very High Resolution Radiometer (AVHRR) sensors was downloaded from http://ecocast.arc.nasa.gov/data/pub/gimms/3g.v0/. The dataset has a 15-day temporal frequency from July 1981 to December 2011 with a spatial resolution of 8 km (ref. 46). Only positive NDVI values from January 1982 to December 2011 were used in this study. We also used a 16-day NDVI dataset retrieved using observations from the Terra Moderate Resolution Imaging Spectroradiometer (MODIS) (MODIS NDVI) from February 2000 to July 2012 with a spatial resolution of 1 km (ref. 47) to test the robustness of the analyses conducted with the GIMMS NDVI3g data. A 30-year (1982–2011) satellite-derived terrestrial NPP dataset presented in a recent study48, which was calculated using the GIMMS leaf area index (LAI) and the fraction of photosynthetically active radiation absorbed by the vegetation (FPAR) based on the MODIS NPP algorithm48, was also used. Note that the spatial structures of the error in the surfaces of NDVI and temperature may be different owing to different approaches to obtain gridded datasets. For example, the NDVI differences between neighbouring cells obtained from composite AVHRR images may be more contrasted than those of climate data being obtained by interpolation of station data or reanalysis with numerical weather prediction models. To reduce the effect of fine-scale spatial structure in the errors on each surface, all the data have been regridded into a common 1° × 1° grid. A mask is applied whereby grid cells with an annual mean NDVI less than 0.1 are excluded to remove areas with very low ecosystem productivity. Vegetation types were defined following the International Geosphere–Biosphere Program based on a MODIS land cover classification
NATuRe eCologY & eVoluTIoN | www.nature.com/natecolevol
© 2017 Macmillan Publishers Limited, part of Springer Nature. All rights reserved. © 2017 Macmillan Publishers Limited, part of Springer Nature. All rights reserved.
ArticlesNature ecology & evolutioN
(http://webmap.ornl.gov/wcsdown/wcsdown.jsp?dg_id= 10011_1) and were used to further remove hardly natural and non-natural vegetation lands.
Satellite-derived indexes of vegetation productivity. The maximum NDVI value at each bimonthly time step was used to calculate monthly NDVI in order to minimize the effects of atmospheric water vapour, non-volcanic aerosols and cloud cover46. The NDVIGS was calculated as the sum of monthly NDVI values from April to October. The growing season defined as May to September and April to September were also used for the robustness test. Note that over the northern high latitudes, calculating NDVIGS with a predefined period is to some extent challenging in the boreal regions, because of the effect of snow. Therefore, we calculated the percentage of the study area with possible snow effects using the quality flag information of the GIMMS NDVI3g datasets46. To be specific, when regridding the original 8 km (≈ 1/12 degree) monthly data into 1° × 1° gridded monthly data, a 1° × 1° pixel is considered to be affected by snow in this month if less than 70% of pixels within a 12 × 12 pixel window have a flag value of 1 or 2 (good value). For each year, a pixel is then considered to be affected by snow if more than 2 months during the predefined growing season (for example, April–October) is affected by snow. Finally, we defined regions with snow effects as pixels with more than 9 years showing snow effects during the study period. The results show that regions affected by snow are mainly located in Alaska, northern Europe and parts of eastern Siberia, accounting for only 12% of the study area (red colour in Supplementary Fig. 14).
Two phenological indexes were derived from the GIMMS NDVI3g dataset: the SOS (day of year (DOY)) and EOS (DOY). The SOS date was calculated as the averaged SOS date estimated by four different methods: timesat, spline, HANTS (harmonic analysis of time series) and polyfit49–51. The EOS date was obtained from the averaged EOS estimated by four different methods: HANTS, polyfit, double logistic and piecewise logistic35. For each year during the period of 1982–2011, the MOS was calculated as the peak NDVI value among monthly NDVI values during the growing season, which was defined based on the month when the SOS and EOS date occurred.
Model-simulated ecosystem productivity. We used NPP and GPP outputs from 1982 to 2011 from five process-based land surface models: CLM4.5, LPJG, OCN, ORCHIDEE and VEGAS (see model list in Supplementary Table 2). All models were run based on the TRENDY inter-comparison protocol during the period of 1901–2010 using the same observed climate drivers from CRU-NCEP v.4 (ftp.cdc.noaa.gov), rising atmospheric CO2 from the combination of ice core records and atmospheric observations, and land use change from the Hyde database (http://dgvm.ceh.ac.uk/node/21). NPP and GPP from all five models were resampled into 1° × 1° grids.
The vector of change. The vector of change in a certain variable takes both velocity and direction into consideration. For each pixel, the velocity was defined as the ratio between the 30-year temporal trend and the spatial gradient of the 30-year means13,14,16,52. The temporal trend was calculated using a least squares linear regression for each grid51. The spatial gradient was calculated using a 3 × 3 grid cell neighborhood based on the average maximum technique13. Following ref. 13, to convert cell height in latitudinal degrees to km, we used 111.325 km per degree. To convert cell width in longitudinal degrees to km, we used
π .
ycos
180111 325
in which y is the latitude of the pixel in degrees. We also added a uniformly distributed random noise to each pixel to decrease the incidence of flat spatial gradients that cause infinite velocity values13. For temperature, a random noise from − 0.05 to 0.05 °C was used; for NDVIGS and MOS, a random noise from −0.005 to 0.005 was used; for the SOS and EOS, a random noise from − 0.05 to 0.05 DOY was used; for NPP and GPP, a random noise from − 0.5 to 0.5 gC m−1 yr−1 was used. The direction of each vector was determined from the orientation of the spatial gradient, together with the direction of change in a particular variable14. For example, if the temperature showed a positive trend during the study period, then the direction of the temperature vector is towards areas that used to be cooler. Therefore, assuming a south-to-north decrease in temperature over the study area, then a northward (that is, along the spatial gradient) temperature vector indicates a warming temperature during the study period. Similarly, a northward NDVIGS vector refers to an increase in NDVIGS during the study period. A northward SOS vector is evidence for an earlier trend in SOS date, whereas for EOS, a northward vector is evidence for a delayed EOS date during the study period. A northward MOS vector is associated with a positive trend in MOS at the local pixel during the study period.
We compared the velocity of change in NDVIGS derived from the GIMMS NDVI3g with the one obtained from the MODIS NDVI during 2001–2011. The processing of MODIS NDVI datasets is based on spectral bands that are specifically designed for vegetation monitoring and take state-of-the-art navigation, atmospheric correction, reduced geometric distortions and improved
radiometric sensitivity into consideration47. The MODIS NDVI is considered to be an improvement on the NDVI product derived from the AVHRR sensors47,53, but it also has the disadvantage of a shorter time span compared to the GIMMS NDVI3g. Generally, the NDVIGS velocity from MODIS NDVI shows a similar spatial pattern to that from GIMMS NDVI3g, even though larger values of the former than the latter in parts of central, northern and northeastern Canada were found (Supplementary Fig. 15).
Analysis. This study covered regions where vegetation productivity was temporally significantly (P < 0.1) correlated with temperature from 1982 to 2011. Assuming a linear relationship between vegetation productivity and temperature, the strength (correlation) of the linkage between the two variables was determined by the Pearson's correlation coefficient between the time series of NDVIGS and growing-season mean temperature, that is, between the time series of the sum of monthly NDVI during April–October and the mean temperature during April–October. To compare the vectors of vegetation productivity and temperature velocities, for each grid cell, we calculated the ratio between the velocity of vegetation productivity (VV) along the spatial gradient of temperature (VV′) and the velocity of temperature (VT). Here VV′ was computed as the velocity of the vegetation vector after projecting it along the spatial gradient of temperature, which can expressed as = × −′V V A Acos( )V V T V where AT and AV are the vector angle (in radians) for the metrics of temperature and vegetation productivity, respectively. The sign of the ratio between VV′ and VT was determined from the directions of both vectors. For a given pixel, a positive ratio is observed if the vector of change in vegetation productivity has the same direction as the vector of temperature change, suggesting that the change in the spatial pattern of vegetation productivity was directionally consistent with the pattern of temperature. A negative ratio indicates that the directional change in the spatial patterns of the two variables were in opposite directions. The NDVIGS vector was compared with the vector of growing-season mean temperature with different definitions of the growing season: April to October, May to September and April to September. Comparisons of the vector of NDVIGS and that of the mean annual temperature were also presented. Because the timing of vegetation phenology is associated with the temperature of the preceding 0–3 months35,54, here the vector of change in the SOS and EOS date were compared with that of the change in mean temperature during March to May and August to October, respectively. The vector of change in MOS was compared with that of the change in mean temperature during June and July. Note that because it has been well recognized that increasing spring temperature (that is, a positive trend in temperature) tends to result in an earlier SOS date (that is, negative trend in SOS date) in most of northern ecosystems during the past three decades55, regions where the change in vegetation productivity were consistent with warming trend refer to those with a negative trend in SOS date during the study period. The vectors of change in satellite-derived NPP, as well as model-simulated annual NPP and GPP were calculated using the same methods as calculating NDVIGS vectors, and compared with the vector of change in growing-season (April–October) mean temperature.
Data availability. The CRU TS 3.22 climate datasets are available from CRU (http://www.cru.uea.ac.uk/cru/data/hrg/). The WFDEI meteorological forcing datasets are available at ftp://rfdata:[email protected]. The AVHRR GIMMS NDVI3g datasets are available at http://ecocast.arc.nasa.gov/data/pub/gimms/3g.v0/. The MODIS NDVI datasets are available from the NASA Earth Observing System Data and Information System at https://e4ftl01.cr.usgs.gov/MOLT/. The satellite-derived NPP dataset is available from W. K. Smith48. The satellite-derived vegetation-type data is available at https://webmap.ornl.gov/wcsdown/dataset.jsp?ds_id= 10011&startPos= 10&maxRecords= 10&orderBy= category_name&bAscend= true. Model outputs were generated by Dynamic Global Vegetation Model (DGVM) groups, and are available from Stephen Stich ([email protected]) or Pierre Friedlingstein ([email protected]) upon request.
Received: 7 December 2016; Accepted: 29 August 2017; Published: xx xx xxxx
References 1. Rosenzweig, C. et al. in Climate Change 2007: Impacts, Adaptation and
Vulnerability (eds Parry, M. L. et al.) 79–131 (Cambridge Univ. Press, Cambridge, 2007).
2. Elmendorf, S. C. et al. Plot-scale evidence of tundra vegetation change and links to recent summer warming. Nat. Clim. Change 2, 453–457 (2012).
3. Buitenwerf, R., Rose, L. & Higgins, S. I. Three decades of multi-dimensional change in global leaf phenology. Nat. Clim. Change 5, 364–368 (2015).
4. Vitasse, Y., Porté, A. J., Kremer, A., Michalet, R. & Delzon, S. Responses of canopy duration to temperature changes in four temperate tree species: relative contributions of spring and autumn leaf phenology. Oecologia 161, 187–198 (2009).
5. Wolkovich, E. M. et al. Warming experiments underpredict plant phenological responses to climate change. Nature 485, 494–497 (2012).
NATuRe eCologY & eVoluTIoN | www.nature.com/natecolevol

© 2017 Macmillan Publishers Limited, part of Springer Nature. All rights reserved. © 2017 Macmillan Publishers Limited, part of Springer Nature. All rights reserved.
Articles Nature ecology & evolutioN
6. Wu, Z., Dijkstra, P., Koch, G. W., Peñuelas, J. & Hungate, B. A. Responses of terrestrial ecosystems to temperature and precipitation change: a meta-analysis of experimental manipulation. Glob. Change Biol. 17, 927–942 (2011).
7. Peñuelas, J. & Filella, I. Responses to a warming world. Science 294, 793–795 (2001).
8. Peñuelas, J. et al. Evidence of current impact of climate change on life: a walk from genes to the biosphere. Glob. Change Biol. 19, 2303–2338 (2013).
9. Hikosaka, K., Ishikawa, K., Borjigidai, A., Muller, O. & Onoda, Y. Temperature acclimation of photosynthesis: mechanisms involved in the changes in temperature dependence of photosynthetic rate. J. Exp. Bot. 57, 291–302 (2006).
10. Way, D. A. & Oren, R. Differential responses to changes in growth temperature between trees from different functional groups and biomes: a review and synthesis of data. Tree Physiol. 30, 669–688 (2010).
11. Zhu, Z. et al. Greening of the Earth and its drivers. Nat. Clim. Change 6, 791–795 (2016).
12. Thomas, R. Q., Canham, C. D., Weathers, K. C. & Goodale, C. L. Increased tree carbon storage in response to nitrogen deposition in the US. Nat. Geosci. 3, 13–17 (2010).
13. Loarie, S. R. et al. The velocity of climate change. Nature 462, 1052–1055 (2009). 14. Ackerly, D. et al. The geography of climate change: implications for
conservation biogeography. Divers. Distrib. 16, 476–487 (2010). 15. Burrows, M. T. et al. The pace of shifting climate in marine and terrestrial
ecosystems. Science 334, 652–655 (2011). 16. Burrows, M. T. et al. Geographical limits to species-range shifts are suggested
by climate velocity. Nature 507, 492–495 (2014). 17. Diffenbaugh, N. S. & Field, C. B. Changes in ecologically critical terrestrial
climate conditions. Science 341, 486–492 (2013). 18. Dobrowski, S. Z. et al. The climate velocity of the contiguous United States
during the 20th century. Glob. Change Biol. 19, 241–251 (2013). 19. Sandel, B. et al. The influence of Late Quaternary climate-change velocity on
species endemism. Science 334, 660–664 (2011). 20. Bi, J., Xu, L., Samanta, A., Zhu, Z. & Myneni, R. Divergent Arctic–boreal
vegetation changes between North America and Eurasia over the past 30 years. Remote Sens. 5, 2093–2112 (2013).
21. LoPresti, A. et al. Rate and velocity of climate change caused by cumulative carbon emissions. Environ. Res. Lett. 10, 095001 (2015).
22. Lucht, W. et al. Climatic control of the high-latitude vegetation greening trend and Pinatubo effect. Science 296, 1687–1689 (2002).
23. Myneni, R. B., Keeling, C. D., Tucker, C. J., Asrar, G. & Nemani, R. R. Increased plant growth in the northern high latitudes from 1981 to 1991. Nature 386, 698–702 (1997).
24. Hickler, T. et al. CO2 fertilization in temperate FACE experiments not representative of boreal and tropical forests. Glob. Change Biol. 14, 1531–1542 (2008).
25. Schimel, D., Stephens, B. B. & Fisher, J. B. Effect of increasing CO2 on the terrestrial carbon cycle. Proc. Natl Acad. Sci. USA 112, 436–441 (2015).
26. Granath, G. et al. Photosynthetic performance in Sphagnum transplanted along a latitudinal nitrogen deposition gradient. Oecologia 159, 705–715 (2009).
27. Livingston, N. J., Guy, R. D., Sun, Z. J. & Ethier, G. J. The effects of nitrogen stress on the stable carbon isotope composition, productivity and water use efficiency of white spruce (Picea glauca (Moench) Voss) seedlings. Plant Cell Environ. 22, 281–289 (1999).
28. Kimball, J. S. et al. Recent climate-driven increases in vegetation productivity for the western Arctic: evidence of an acceleration of the northern terrestrial carbon cycle. Earth Interact. 11, 1–30 (2007).
29. Xia, J. et al. Joint control of terrestrial gross primary productivity by plant phenology and physiology. Proc. Natl Acad. Sci. USA 112, 2788–2793 (2015).
30. Forkel, M. et al. Codominant water control on global interannual variability and trends in land surface phenology and greenness. Glob. Change Biol. 21, 3414–3435 (2015).
31. Fu, Y. H. et al. Declining global warming effects on the phenology of spring leaf unfolding. Nature 526, 104–107 (2015).
32. Laube, J. et al. Chilling outweighs photoperiod in preventing precocious spring development. Glob. Change Biol. 20, 170–182 (2014).
33. Zhang, X., Tarpley, D. & Sullivan, J. T. Diverse responses of vegetation phenology to a warming climate. Geophys. Res. Lett. 34, L19405 (2007).
34. Barichivich, J. et al. Large-scale variations in the vegetation growing season and annual cycle of atmospheric CO2 at high northern latitudes from 1950 to 2011. Glob. Change Biol. 19, 3167–3183 (2013).
35. Liu, Q. et al. Temperature, precipitation, and insolation effects on autumn vegetation phenology in temperate China. Glob. Change Biol. 22, 644–655 (2016).
36. Gepstein, S. & Thimann, K. V. Changes in the abscisic acid content of oat leaves during senescence. Proc. Natl Acad. Sci. USA 77, 2050–2053 (1980).
37. Nemani, R. R. et al. Climate-driven increases in global terrestrial net primary production from 1982 to 1999. Science 300, 1560–1563 (2003).
38. Melillo, J. M. et al. Soil warming, carbon–nitrogen interactions, and forest carbon budgets. Proc. Natl Acad. Sci. USA 108, 9508–9512 (2011).
39. Frost, G. V. & Epstein, H. E. Tall shrub and tree expansion in Siberian tundra ecotones since the 1960s. Glob. Change Biol. 20, 1264–1277 (2014).
40. Sitch, S. et al. Evaluation of the terrestrial carbon cycle, future plant geography and climate–carbon cycle feedbacks using five dynamic global vegetation models (DGVMs). Glob. Change Biol. 14, 2015–2039 (2008).
41. Fisher, J. B., Badgley, G. & Blyth, E. Global nutrient limitation in terrestrial vegetation. Glob. Biogeochem. Cycles 26, GB1014 (2012).
42. Smith, N. G. & Dukes, J. S. Plant respiration and photosynthesis in global-scale models: incorporating acclimation to temperature and CO2. Glob. Change Biol. 19, 45–63 (2013).
43. Likens, G. Long-term Studies in Ecology (Springer, New York, 1989). 44. Jung, M. et al. Global patterns of land–atmosphere fluxes of carbon dioxide,
latent heat, and sensible heat derived from eddy covariance, satellite, and meteorological observations. J. Geophys. Res. Biogeosci. 116, G00J07 (2011).
45. Weedon, G. P. et al. The WFDEI meteorological forcing data set: WATCH Forcing Data methodology applied to ERA-Interim reanalysis data. Water. Resour. Res. 50, 7505–7514 (2014).
46. Pinzon, J. E. & Tucker, C. J. A non-stationary 1981–2012 AVHRR NDVI3g time series. Remote Sens. 6, 6929–6960 (2014).
47. Huete, A. et al. Overview of the radiometric and biophysical performance of the MODIS vegetation indices. Remote Sens. Environ. 83, 195–213 (2002).
48. Smith, W. K. et al. Large divergence of satellite and Earth system model estimates of global terrestrial CO2 fertilization. Nat. Clim. Change 6, 306–310 (2016).
49. Cong, N. et al. Changes in satellite-derived spring vegetation green-up date and its linkage to climate in China from 1982 to 2010: a multimethod analysis. Glob. Change Biol. 19, 881–891 (2013).
50. Piao, S., Fang, J., Zhou, L., Ciais, P. & Zhu, B. Variations in satellite-derived phenology in China’s temperate vegetation. Glob. Change Biol. 12, 672–685 (2006).
51. White, M. A. et al. Intercomparison, interpretation, and assessment of spring phenology in North America estimated from remote sensing for 1982–2006. Glob. Change Biol. 15, 2335–2359 (2009).
52. Zheng, B., Chenu, K. & Chapman, S. C. Velocity of temperature and flowering time in wheat-assisting breeders to keep pace with climate change. Glob. Change Biol. 22, 921–933 (2016).
53. Fensholt, R. & Proud, S. R. Evaluation of earth observation based global long term vegetation trends—comparing GIMMS and MODIS global NDVI time series. Remote Sens. Environ. 119, 131–147 (2012).
54. Piao, S. et al. Leaf onset in the Northern Hemisphere triggered by daytime temperature. Nat. Commun. 6, 6911 (2015).
55. Jeong, S., Ho, C.-H., Gim, H.-J. & Brown, M. E. Phenology shifts at start vs. end of growing season in temperate vegetation over the Northern Hemisphere for the period 1982–2008. Glob. Change Biol. 17, 2385–2399 (2011).
AcknowledgementsThis study was supported by National Natural Science Foundation of China (41530528), and the 111 Project (B14001). I.A.J., P.C. and J.P. were supported by the European Research Council Synergy grant SyG-2013-610028 IMBALANCE-P.
Author contributionsS.Pi. designed research; M.H. performed analysis; and all authors contributed to the interpretation of the results and the writing of the paper.
Competing interestsThe authors declare no competing financial interests.
Additional informationSupplementary information is available for this paper at doi:10.1038/s41559-017-0328-y.
Reprints and permissions information is available at www.nature.com/reprints.
Correspondence and requests for materials should be addressed to S.P.
Publisher’s note: Springer Nature remains neutral with regard to jurisdictional claims in published maps and institutional affiliations.
NATuRe eCologY & eVoluTIoN | www.nature.com/natecolevol


![Global Data Sets of Vegetation Leaf Area Index (LAI)3g and ...sites.bu.edu/cliveg/files/2013/11/zaichun-zhu-msp-01.pdfDifference Vegetation Index (NDVI), and LAI or FPAR [18,19]. These](https://img.pdfslide.net/doc/110x75/5fffc62a82c7412439057c05/global-data-sets-of-vegetation-leaf-area-index-lai3g-and-sitesbueduclivegfiles201311zaichun-zhu-msp-01pdf.jpg)