Embed Size (px)
Citation preview
Report No. 8588yVE
VenezuelaA Review of the 1990-1993 Public SectorInvestment Program(In Two Volumes) Volume IIDecember 20, 1990Latin American and Caribbean RegionCountry Oepartment IIICountry Operations Division I
FOR OFFICIAL USE ONLY
Document of the World Bank
This document has a resticted distribution and may be used by recipientsonly in the perforinance of their official duties. Its contents may not otherwisebe disclosed without World Bank authorization.
Pub
lic D
iscl
osur
e A
utho
rized
Pub
lic D
iscl
osur
e A
utho
rized
Pub
lic D
iscl
osur
e A
utho
rized
Pub
lic D
iscl
osur
e A
utho
rized
CURRENCY NOUIVALENTS
currency Unit - Bolivar
fxchange Rate as of December 31, 1989
US$l - Bs.43
Weiahts and Measures
Metric System
GOVERNMENT OF VENEZUELA FISCAL YEAR
January 1 - December 31
This report is based on the findings of a World Bank public Rectorinvestment review mission that visited Venezuela in December 198... Themission comprised Kazuko Uchimura (LA3C1, Mission Leader), Eduardo Wallentin(LA3C1, macro-framework, planning), Jaime Porras (consultant, budget), RubenSuarez (consultant, educati','i and health), Julio Linares (LA3IE, housing),Christian Gomez (IDS, roads.; Jose Baigorria (LATIE, railways), Axel Peuker(YP, railways), Carlos Hurtado (consultant, railways), Eduardo Bitran(consultant, railways), Chris Ousey (consultant, urban transport), AlanHarding (LATIN, ports), Hernan Garcia (LATIE, power), Tom Joyce (consultant,natural gas) and Mayra Zermeno (LA3C1, aluminum and steel). Ricardo Hausmannand Gustavo Marquez (consultants) prepared background papers on planning andsocial sector expenditures, respectively. Vicente Ferrer, who led a separateagriculture sector mission in October 1989 contributed the chapter onagriculture. Laura Santalla typed and compiled the successive drafts.
FOR OFFICIAL USE ONLY
PRINCIPAL AC S AM) TEM USED IN THE REPORT
ALCASA Caroni Alnlnulm(Aluminlo del Caroni)
AMTC Metropolitan Pubilc Transportation Authorities(Autorldades Metropolltanas del Transporte Publico)
ASRH Autonomous Service for Rural How ing(Serviclo Autonomo de Vlvnda Rural)
BANDAWRO Agricultural Development Bank(anco de Desarrollo Agricola)
BANAP Natlonal Savings and Loans Bank(Banco Naclonal de Ahorros y Prestamos)
INTERALLMINA Interamerican Alzninum Company(Interamericana de Alumina)
BAUXIVEN Bauxite of Venezuela(Bauxita Venezolana)
CADAFE Development and Cooperation for Electrical Power Company(Companla Anonima de Desarrollo y Fomento Electrico)
CAMETRO Caracas Metro Company(Companla del Metro de Caracas)
CENDES Center for Development Studies(Centro de Estudios para el Desarrollo)
COMEXAGRO Agricultural Commodities Marketing and Export Company(Compania Agricola de Mercado y Exortacion)
CONARE Natlonal Reforestation Company(Compania Nacional de Reforestaclon)
CORDIPLAN Ministry of Coordination and Plaming(Ministerlo de Planificaclon y Coordinacion)
COVENIN Venezuelan Industrlal Standards Commission(Comislon Venezolana de Regulaclones ndustriales)
CLUA Metropolitan Urban Commission(Comision Metropolltana Urbana)
CVG QGayana Regional Corporation(Corporaclon Venezolana de Guayana)
CSB Simon Bolivar Centre(Centro Simon Bolivar)
DINCA National Department of Administrative Accounting(DePartamento Naclonal de Contadurla Administrativa)
nGSVT Road Transportation Bureau(Oficina de Transporte por Carretera)
EDELCA Caronl Electric Company(Electrificacion del Caronl)
FCA Agricultural Credit Fund(Fondo de Credito Agricola)
FEDE Foundation for Educational Buildings and Infrastructure(Fundacion de Edificaciones y Dotaciones Educativas)
FGMA Gran Mariscal do Ayacucho Foundation(Fundacion Gran Mariscal de Ayacucho)
FEDESP Foundation for Special Education(Fundaclon paraEducaclon Especial)
FESILVEN Venezuela Ferrosillcon Company(Venezolana de Ferrosiliclo)
FERROMINERA Orlnoco Iron Ore Company(Ferrominera Orlnoco)
FIMA Founoatlon for the Maintenance of Public HealthInfrastructure
(Fundaclon para el Mantenlmlento de la Infraestructurade Salud Publica)
FONDEFRU Fruit Development Fund(Fondo para el Desarrollo Fruticola)
FONAIAP National Fund for Agricultural Research(Fondo Naclonal para Investigaclon Agricola)
FONCAFE Natlonal Coffee Fund(Fondo Naclonal del Cafe)
FONCACAO National Cacao Fund(Fondo Nacional del Cacao)
FIV Venezuela Investment Fund(Fondo do Inversiones de Venezuela)
FONOUR Foundation for Urban Developmient(Fundaclon para el Desarrollo Urbano)
This document has a restricted distribution and may be used by recipients only in the performanceof their official duties. Its contents may not otherwise be disclosed without World Bank authorization.
2
IAN tlonal Agrarian kistitute(Instituto Naclonal Agricoh)
INAVI NatWna Ho¢ tste(ntltuto Nacklnai de Vlvlenda)
INAUC Autbotus fstituti of the Universlty Hospitalof Caracas
(instituto AutonQo del Hospital de la Universidadde Caracas)
INAGER National ititute of Geriatrics and Gerontology(hntituto Naclonai de Gerlatria y Gerontotogla)
ICAP Agricultural and LtAestock CredIt ttute(Instituto de Credlto Agricola y Gantadero)
INH tIonal institute of Hygene(Instltuto Naclonal de NIglene)
INN National nstitute of lutritlon(Instituto Naclonal de Nutr!clon)
INCE NatIonal institute of Educational Assstancs(instltuto Natlonal de Cooperaclon Edulativa)
PSAME kistitute for the Provision of Health Careand Social Assistance for the EWloyees ofthe Ministry of Education
(instituto para la Provislon del Culdado de laSalud y Asistencla Soclal para Empleados delMInisteric de Ekcaclon)
MARNR Ministry of Enviroment and Natural Resources(MInisterlo del Amblente y Reousos Naturales)
-uTC Ministry of Trarsportation and Cownications(Ministerio de Transporte y Coaunlcaclones)
MINDUR Ministry of Urban Develoment(MInisterlo de Desarrollo Urbano)
MSAS MInistry of Health(Ministerlo de SaIt)
OCEPRE Central Budget Offlce(Oficina Central de Presipuesto)
OCEI Central Statistical Office(Oficina Central de Estadistica)
OCG Office of the Controller General(Oflcina del Contralor General)
D PI Office of Coordination of lntergoverrmental Programs(Oflcina de Coordinacion de Programas
Intergbenamnmtaies)OM>U kni~lh~clpal OffIce of Urban Piainhg
(Oflcina tiiclpal de Pianificaclon Urbana)OPSIS Operational Off Ice for the Intercomected System
(Oficina de Operaces de Sistemas Interconectados)PO;SA Venezuela Petroleum Company
(Petroleos de Venezla)SAFORVEN Venelan Automous Forestry Service
(Serviclo Venzolano Autonoo Forestal)soR Sldenry of Orinoco
(Siderutrgla del Orlnoco)StAp Savhns and Loan System
(Sistema d Ahorro y Prestamo)VENAA Aluwih of Venezuela
(Venezolana de Alumtnilo)
TABLE OF CONTENTS
(In two volumes) Volume II Page
CHAPTER SIX: PUBLIC INVESTMENT IN RAILWAYS AND PORTS 1
A. Railways 1Background 1Volume of Railway Traffic 1Operational Performance 3Railway Investment Program 4Passenger Railway Line--Caracas-Cua 7Cargo and Passenger Railways--South
Oriental-Center 10Cargo Railway Line-South Occidental 15Other Investments 16
B. Ports 17Sectoral Org4nization 17Sectoral Performance 19Sectoral Issues 21Government Policies 21Public Investment Program 22Recommendations for Ports Investment
Program 24
CHAPTER SVENt INVESTMENT IN URBAN TRANSPORTATION 25
A. Background 25Urban Road Network in Caracas 25The Vehicle Fleet 26The Modal Split 27Average Venicle Speeds 28Accident Rates 29Transport in the Marginal Areas ofthe City 31
B. Institutional Framework 31Central Government 31State Government 32Municipal Government 32Public Investment by Three Levels
of Government 34Cost Recovery in Urban Transportation 34
2
C. Organization of Public Transportationin Caracas 35
Por Puesto 35Regular Buses 37Metro 40Metrobus 42
D. Traffic Systems Management 42Bus Regulation and Coordination 42Taxi Regulation 43Traffic Enforcement 43
E. Public Sector Investment 43Public Sector Planning of UrbanTransport Investment 43
1990-1993 Investment Program inUrban Roads 44
Proposed CAMETRO Investment 1990-1993 44General Assessment of CAMETRO's Proposals 46
CHAPTER EIGHT: AGRICULTURE SECTOR PUBLIC INVESTMENT PROGRAM 50
A. Background 50Structure of Agriculture in Venezuela 50Institutional Framework 50
B. Sector Policies and Performance 51
C. Public Investment Program 53Level and Trends in Public SectorAgricultural Expenditure, 1979-1989 53
Composition of Public Sector AgriculturalExpenditure 54
Budget Allocation by Type of Expenditure 57Budget Allocation by Subsector 1984-1989 59Sufficiency of Budgetary Allocations 60Level of Self-Financing 61The Proposed Investment Program, 1990-1993 63Mission's Comments 66
3
CHAPTER NINE: POWER SECTOR INVESTMENT PROGRAM 68
A. Sector Organization 68
B. Demand Projections 70Methodology 70Assumptions 71Results 72An Alternative Demand Scenario 72Recommendations 76
C. Sector Expansion Plan 80Generation 80Transmission 83
D. Sector Investment Program 83
E. Pricing Policies (44Background 84Existing Electricity Price Levels 87Price Structure 88Evolution of Prices 88Recommendations 8P
CHAPTER TEN: INVESTMENTS IN NATTTAL GAS 89
A. Background 89Introduction 89Sectoral Organization 90
B. Supply and Production Capability 92Natural Gas Reserves 92Natural Gas Production and Gas-Oil Ratio 92
C. Development Program for Natural Gas 94Trends During 1984-1988 94Expansion of the High-PressurePipeline Network 96
Expansion of the Urban DistributionNetworks 96
D. Investment Requirements 97Room for Potential Investment Savings 103Issues to be Considered 105
E. Pricing Policies 106
4
CHAPTER ELEVENs ALUMINUM AND STEEL 111
A. Introduction 111
B. Aluminum 111Introduction 111Demand and Supply Trends and Outlook 113Prices, Costs, and Commercial PolicyIssues 117
Investment Review 121
C. Steel 128Introduction 128Demand and Supply Trends and Outlook 129Price, Cost, and Commercial Policy Issues 133Investment Review 136
TABLES:
Table VI.1 FERROCAR Traf tic in '000 Tons 2Table VI.2 FERROCAR Traffic Projections in Tom-Km and
Passenger-Km 2Table VI.3 FERROCAR Traffic Projections by Commodity 3Table VI.4 Railway Investment Program 6Table VI.5 Maritime Foreign Trade, 1988 18Table VI.6 INP Port Traffic 18Table VI.7 INP Ports-Cargo Handling Productivity 19Table VI.8 Conference Surcharges at Venezuelan Ports,
June 1989 20Table VI.9 INP Investment Program - 1990-1993 23
Table VII.1 Vehicles in Circulation, 1988 26Table VII.2 Modal Distribution of Traffic in Caracas 27Table VII.3 Categories of Accidents 29Table VII.4 Urban Bus Transport 38Table VII.5 Selected Indicators for Bus Operations 39
Table VIII.1 Major Categories of Agricultural SectorBudgetary Allocation 54
Table VIII.2 Budgetary Allocation to Agirucltural Sector 56Table VIII.3 Agriculture by Type of Expenditure 1989 57Table VIII.4 Ministry of Agriculture Budget by Type
of Expenditure 58Table VIII.5 Budgetary Allocations by Subsectors 59Table VIII.6 Budgetary Allocations by Subsectors
and Entities 62
5
Table VIII.7 CORDIPLAN: Investment PragraTr, 1990-1993 63ATable VIII.8 Ministry of Agriculture: Investment Plan
1990-1993 65
Table IX.1 Electricity Demand Projections (GWh) 73Table IX.2 Residential Sector Electricity Demand (GWh) 75Table IX.3 Residential Sector Electricitv Demand (GWh) 76Table IX.4 Industrial Electricity Demand in Guayana (GWM) 77Table IX.5 Estimated System Losses (1) by Utility
(2) OPSIS Estimates by mid 1989 78Table IX.6 Estimate of System Losses (1) by Utility
(2) Mission's Estimates 78Table IX.7 Electricity Demand (GWh) 79Table IX.8 Investment Program of the National Utilities 85Table IX.9 Revised Investment Program of the National
Utilities 86Table IX.10 Total Investment Requirements of the
Private-owned Utilities 86Table IX.11 1989 Average Electricity Price by Entity 87Table IX.12 1989 Average Prices by End Use 87Table IX. 13 Expected 1590-1993 Evolution Prices 88
Table X.1 Natural Gas Sector Activities 91Table X.2 Projected Natural Gas Demand, Base Case 96Table X.3 Petroleum Sector Investment, 1990-1993 99Table X.4 Potential Investment Requirements 103Table X.5 Natural Gas Sector Invgestment Schedule 105Table X.6 Natural Gas Prices 106Table X.7 Cost of Natural Gas Production 107
Table XI.1 World Primary Aluminum Consumption,Production and Price: 1982-89 114
Table XI.2 Aluminum - World Production, Consumption,Prices: 1990-2000 114
Table XI.3 Aluminum Sector Production and Sales 116Table XI.4 Aluminum Sector - Projected Production 122Table XI.5A ALCASA Investment Program - Expansion Plan I 122Table XI.5B ALCASA Invest.ment Program - Expansion Plan II 123Table XI.6 Aluminum Sector Financial Indicators 124Table XI.7 ALCASA Investment Program - Expansion
Plans I and II, Financing Plan 125Table XI.8 INTERALUMINA Investment Program -
Alumina Expansion 126Table XI.9 INTERALUMINA Investment Program - Alumina
Expansion Plan Financing 126Table XI.10 BAUXIVEN Investment Program - Use of Funds 128Table XI.11 Steel and Iron Ore: World Production,
Consumption and Prices, 1990-2000 129Table XI.12 Production, Imports, Exports and Domestic
Consumption of Steel Products 130
6
Table XI.13 Domestic Consumption of Steel by Type ofProduct 131
Table XI.14 Steel Sector Production and Sales 132Table XI.15 Domestic and Export Prices of Steel Products 135Table XI.16 Steel Sector Financial Indicators by Firm 137Table XI.17 FESILVEN investment Program - Use of Funds 139Table XI.18 FESILVEN Investment Program Financing Plan 139Table XI.19 SIDOR Tubes Plant Investment Project
Financing Plan 141
FIGURES:
Figure 1. Natural Gas Consumption 90Figure 2. Natural Gas Availability 94Figure 3. Use by Consuming Sector 95
MAPS:
Existing and Proposed Railroad Network 5City of Caracas, Major Areas of Informal Housing 30Metropolitan Area of Caracas Regional Context 33Caracas Metro, Existing Network and Proposed Extensions 45National Electric Interconnected System 81Natural Gas Pipelines 98Corporacion Venezolana de Guayana 112Relief Map of Venezuela 142
Chapter 6
Public Investment in Railways and Ports
A. Railways
Background
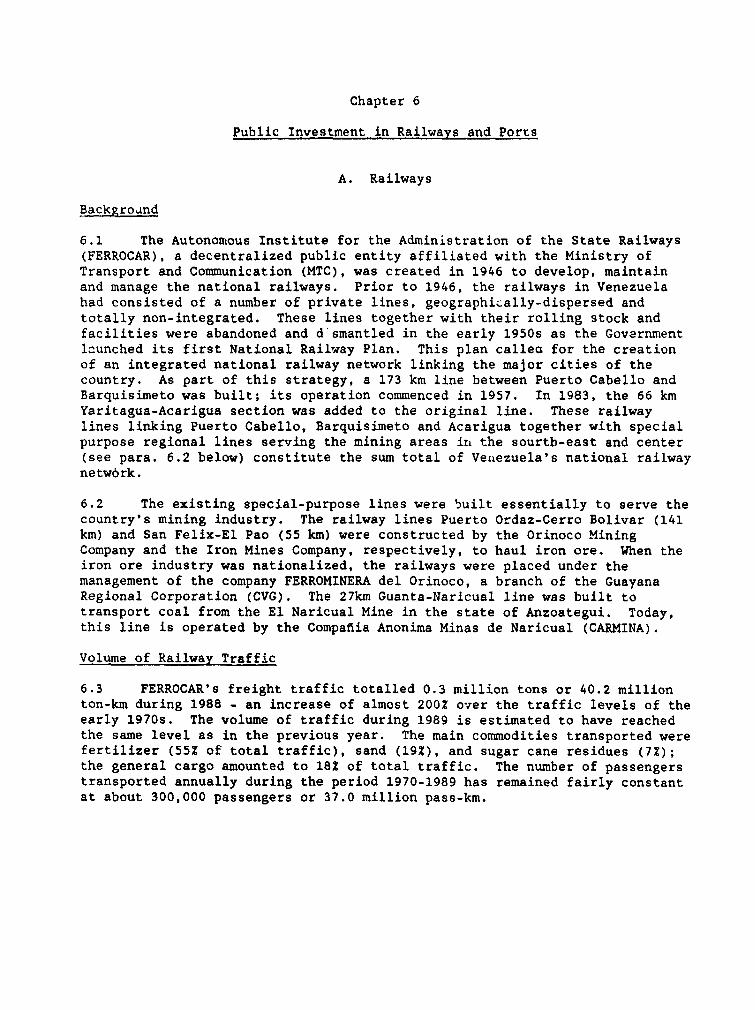
6.1 The Autonotous Institute for the Administration of the State Railways(FERROCAR), a decentralized public entity affiliated with the Ministry ofTransport and Communication (MTC), was created in 1946 to develop, maintainand manage the national railways. Prior to 1946, the railways in Venezuelahad consisted of a number of private lines, geographically-dispersed andtotally non-integrated. These lines together with their rolling stock andfacilities were abandoned and d'smantled in the early 1950s as the Governmentlaunched its first National Railway Plan. This plan callea for the creationof an integrated national railway network linking the major cities of thecountry. As part of this strategy, a 173 km line between Puerto Cabello andBarquisimeto was built; its operation commenced in 1957. In 1983, the 66 kmYaritagua-Acarigua section was added to the original line. These railwaylines linking Puerto Cabello, Barquisimeto and Acarigua together with specialpurpose regional lines serving the mining areas it, the sourtb-east and center(see para. 6.2 below) constitute the sum total of VeLaezuela's national railwaynetwork.
6.2 The existing special-purpose lines were built essentially to serve thecountry's mining industry. The railway lines Puerto Ordaz-Cerro Bolivar (141km) and San Felix-El Pao (55 km) were constructed by the Orinoco MiningCompany and the Iron Mines Company, respectively, to haul iron ore. When theiron ore industry was nationalized, the railways were placed under themanagement of the company FERROMINERA del Orinoco, a branch of the GuayanaRegional Corporation (CVG). The 27km Guanta-Naricual line was built totransport coal from the El Naricual Mine in the state of Anzoategui. Today,this line is operated by the Compaflia Anonima Minas de Naricual (CARMINA).
Volume of Railway Traffic
6.3 FERROCAR's freight traffic totalled 0.3 million tons or 40.2 millionton-km during 1988 - an increase of almost 2002 over the traffic levels of theearly 1970s. The volume of traffic during 1989 is estimated to have reachedthe same level as in the previous year. The main commodities transported werefertilizer (55Z of total traffic), sand (19Z), and sugar cane residues (7X);the general cargo amounted to 182 of total traffic. The number of passengerstransported annually during the period 1970-1989 has remained fairly constantat about 300,000 passengers or 37.0 million pass-km.
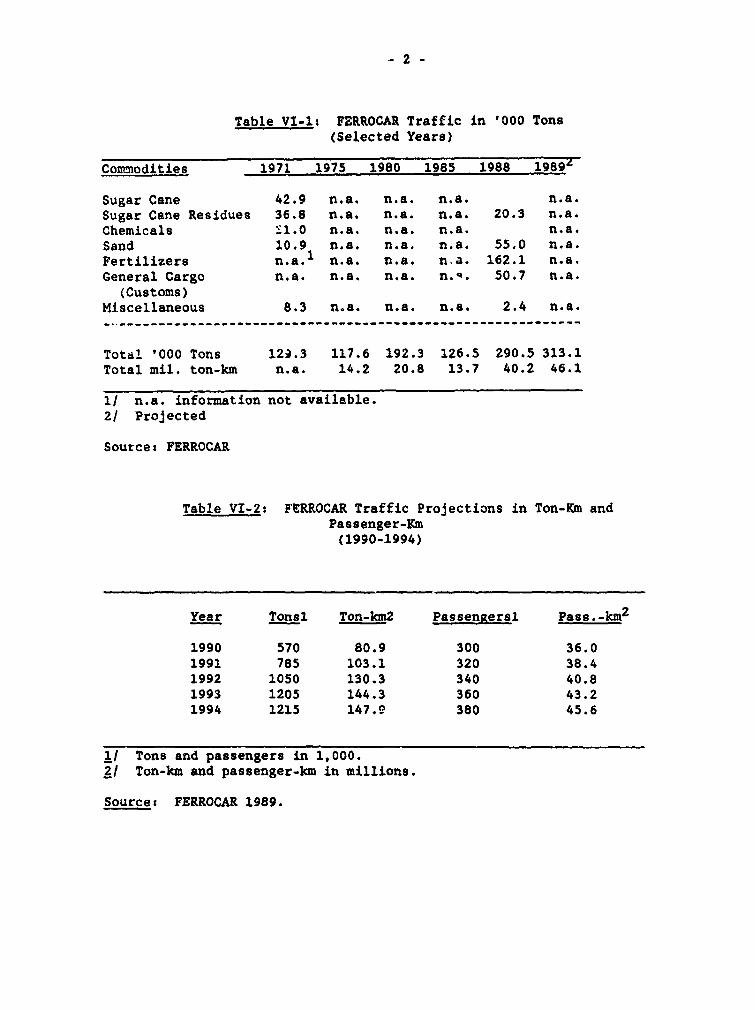
Table VI-I: FERROCAR Traffic in '000 Tons(Selected Years)
Commodities 1971 1975 1980 1985 1988 1989
Sugar Cane 42.9 n.a. n.a. n.a. n.a.Sugar Cane Residues 36.8 n.a. n.a. n.a. 20.3 n.a.Chemicals S1.0 n.a. n.a. n.a. n.a.Sand 10.9 n.a. n.a. n.a. 55.0 n.a.Fertilizers n.a.1 n.a. n.a. n.a. 162.1 n.a.General Cargo n.a. n.a. n.a. n.e. 50.7 n.a.
(Customs)Miscellaneous 8.3 n.a. n.a. n.a. 2.4 n.a.
Total '000 Tons 129.3 117.6 192.3 126.5 290.5 313.1Total mil. ton-km n.a. 14.2 20.8 13.7 40.2 46.1
1/ n.a. information not available.2/ Projected
Source: FERROCAR
Table VI-2: PERROCAR Traffic Projections in Ton-Km andPassenger-Km(1990-1994)
Year Tonsl Ton-km2 Passen_ersl Pass.-km2
1990 570 80.9 300 36.01991 785 103.1 320 38.41992 1050 130.3 340 40.81993 1205 144.3 360 43.21994 1215 147.9 380 45.6
1/ Tons and passengers in 1,000.2/ Ton-km and passenger-km in millions.
Source: FERROCAR 1989.
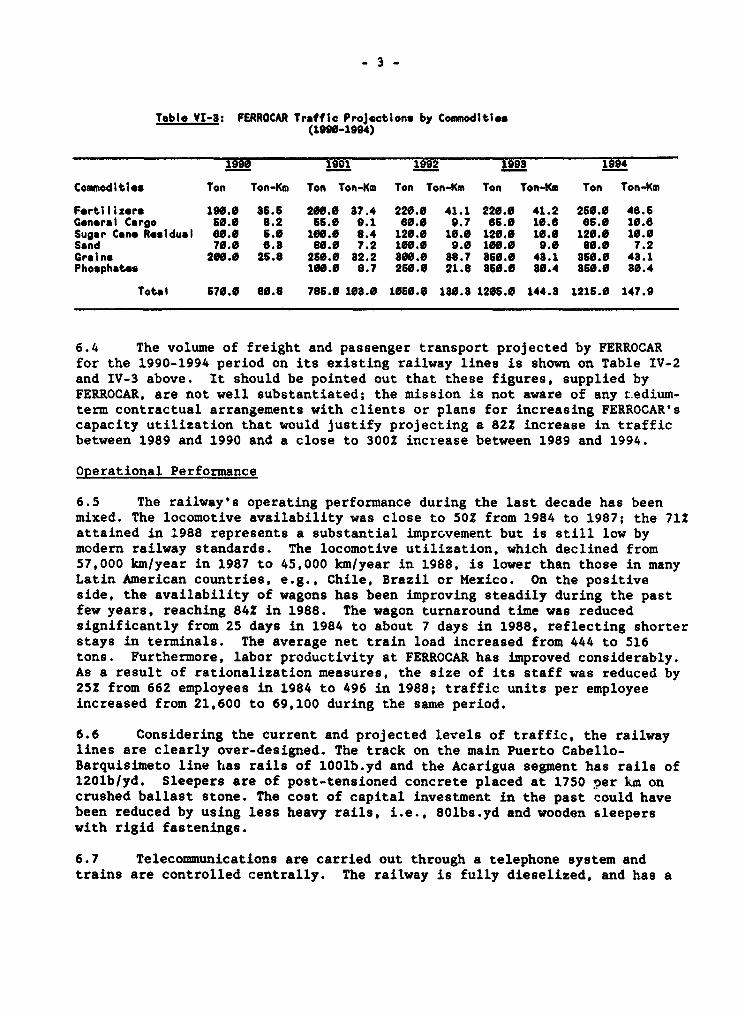
Table VI-3: FERROCAR Traffic Projections by Commodities(100-1994)
1990 1901 1992 1993 1994
Commodities Ton Ton-Km Ton Ton-Km Ton Ton-Km Ton Ton-Km Ton Ton-Km
Fertilizers 190.0 85.6 200.0 37.4 220.0 41.1 220.0 41.2 260.0 46.6General Cargo 560.0 8.2 65.0 9.1 6o.o 9.7 65.0 10.6 66.0 10.6Sugar Can. Residual 69.0 6.0 100.0 8.4 120.0 10.0 120.0 10.0 120.0 10.0Sand 70.0 0.8 80.0 7.2 100.0 9.0 166.0 9.0 60.0 7.2Groins 200.0 26.8 250.0 82.2 800.0 88.7 850.0 48.1 856.6 48.1Phosphates 100.0 8.7 260.0 21.8 380.0 80.4 860.0 86.4
Total 670.0 80.8 786.0 103.0 1060.0 186.3 1206.0 144.8 1216.0 147.9
6.4 The volume of freight and passenger transport projected by FERROCARfor the 1990-1994 period on its existing railway lines is shown on Table IV-2and IV-3 above. It should be pointed out that these figures, supplied byFERROCAR, are not well substantiated; the mission is not aware of any t.edium-term contractual arrangements with clients or plans for increasing FERROCAR'scapacity utilization that would justify projecting a 82Z increase in trafficbetween 1989 and 1990 and a close to 3002 increase between 1989 and 1994.
Operational Performance
6.5 The railway's operating performance during the last decade has beenmixed. The locomotive availability was close to 50Z from 1984 to 1987; the 712attained in 1988 represents a substantial imprGvement but is still low bymodern railway standards. The locomotive utilization, which declined from57,000 km/year in 1987 to 45,000 km/year in 1988, is lower than those in manyLatin American countries, e.g., Chile, Brazil or Mexico. On the positiveside, the availability of wagons has been improving steadily during the pastfew years, reaching 842 in 1988. The wagon turnaround time was reducedsignificantly from 25 days in 1984 to about 7 days in 1988, reflecting shorterstays in terminals. The average net train load increased from 444 to 516tons. Furthermore, labor productivity at FERROCAR has improved considerably.As a result of rationalization measures, the size of its staff was reduced by252 from 662 employees in 1984 to 496 in 1988; traffic units per employeeincreased from 21,600 to 69,100 during the same period.
6.6 Considering the current and projected levels of traffic, the railwaylines are clearly over-designed. The track on the main Puerto Cabello-Barquisimeto line has rails of lOOlb.yd and the Acarigua segment has rails of1201b/yd. Sleepers are of post-tensioned concrete placed at 1750 Der km oncrushed ballast stone. The cost of capital investment in the past could havebeen reduced by using less heavy rails, i.e., 80lbs.yd and wooden sleeperswith rigid fastenings.
6.7 Telecommunications are carried out through a telephone system andtrains are controlled centrally. The railway is fully dieselized, and has a
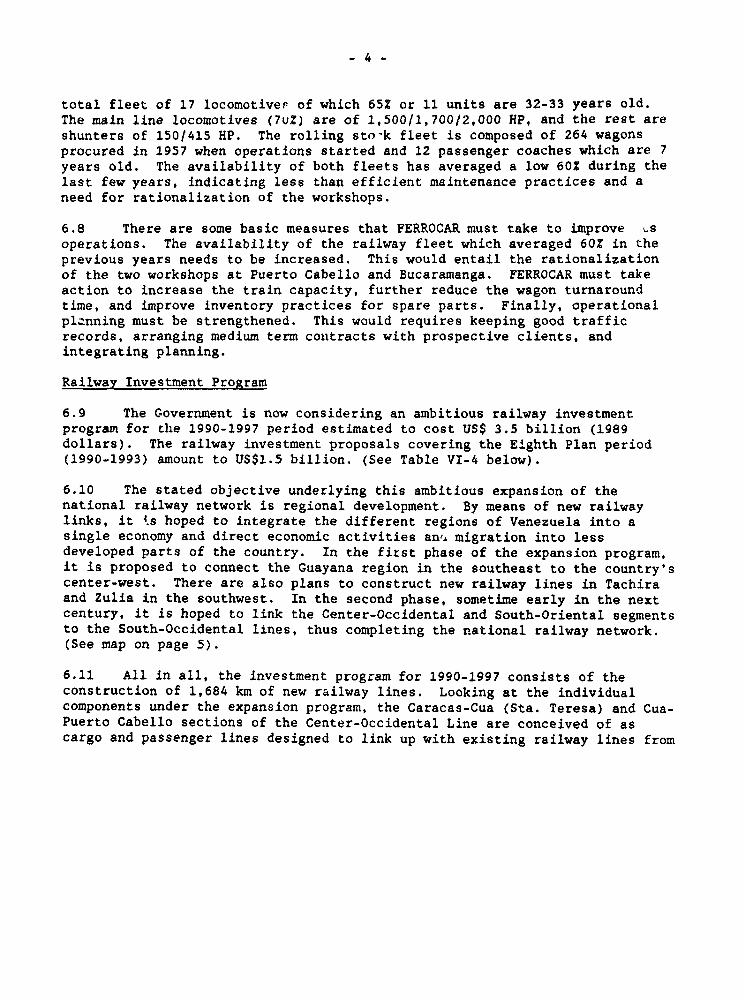
total fleet of 17 locomotiver of which 65Z or 11 units are 32-33 years old.The main line locomotives (7uZ) are of 1,500/1,700/2,000 HP, and the rest areshunters of 150/415 HP. The rolling sto-k fleet is composed of 264 wagonsprocured in 1957 when operations started and 12 passenger coaches which are 7years old. The availability of both fleets has averaged a low 60% during thelast few years, indicating less than efficient maintenance practices and aneed for rationalization of the workshops.
6.8 There are some basic measures that FERROCAR must take to improve usoperations. The availability of the railway fleet which averaged 60% in theprevious years needs to be increased. This would entail the rationalizationof the two workshops at Puerto Cabello and Bucaramanga. FERROCAR must takeaction to increase the train capacity, further reduce the wagon turnaroundtime, and improve inventory practices for spare parts. Finally, operationalplanning must be strengthened. This would requires keeping good trafficrecords, arranging medium term contracts with prospective clients, andintegrating planning.
Railway Investment Program
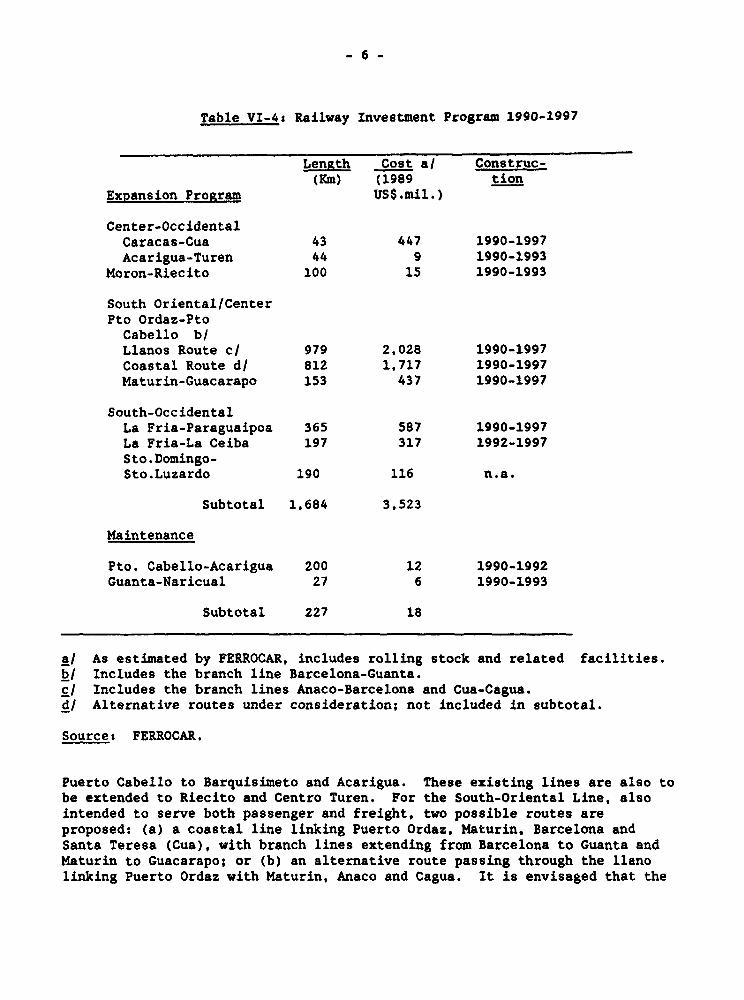
6.9 The Government is now considering an ambitious railway investmentprogram for the 1990-1997 period estimated to cost US$ 3.5 billion (1989dollars). The railway investment proposals covering the Eighth Plan period(1990-1993) amount to US$1.5 billion. (See Table VI-4 below).
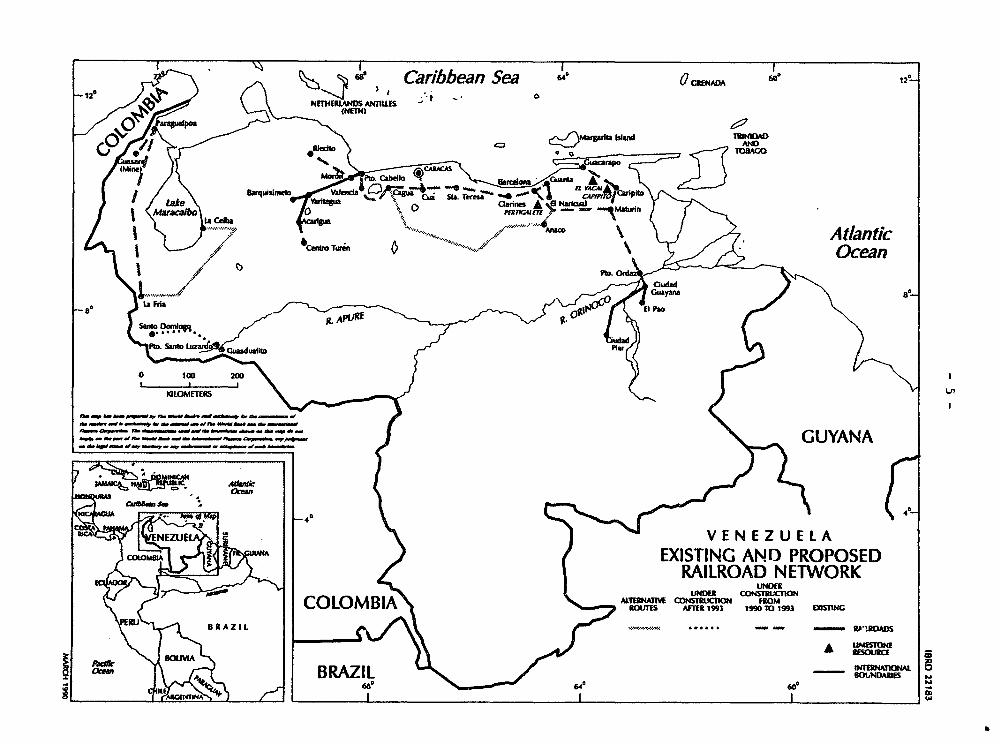
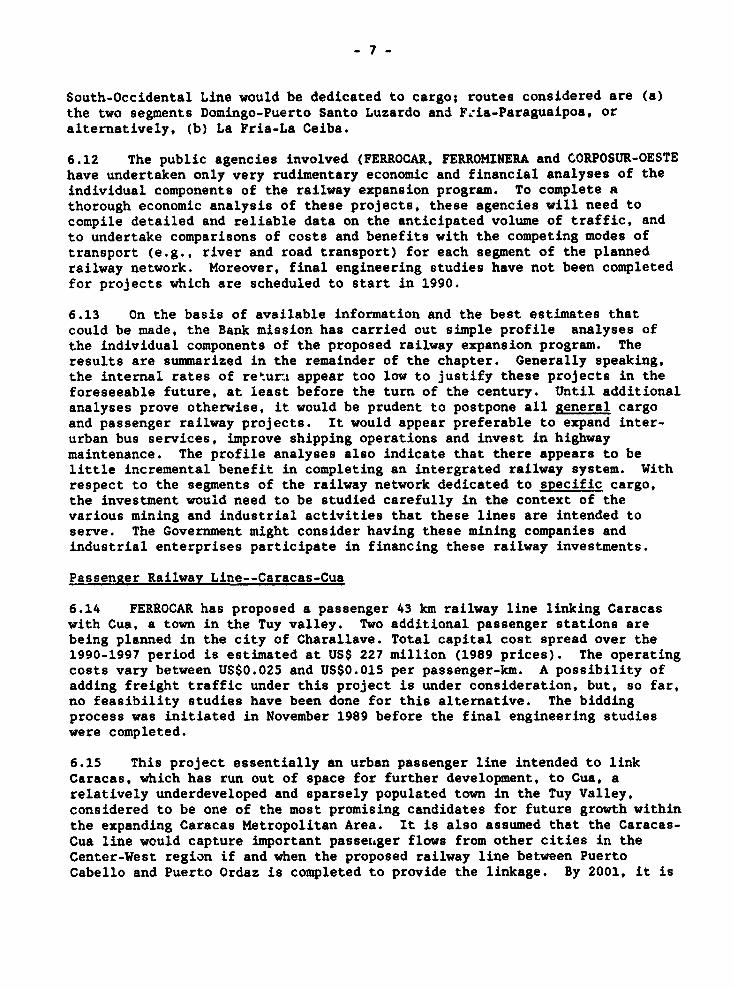
6.10 The stated objective underlying this ambitious expansion of thenational railway network is regional development. By means of new railwaylinks, it 4.s hoped to integrate the different regions of Venezuela into asingle economy and direct economic activities anc migration into lessdeveloped parts of the country. In the first phase of the expansion program,it is proposed to connect the Guayana region in the southeast to the country'scenter-west. There are also plans to construct new railway lines in Tachiraand Zulia in the southwest. In the second phase, sometime early in the nextcentury, it is hoped to link the Center-Occidental and South-Oriental segmentsto the South-Occidental lines, thus completing the national railway network.(See map on page 5).
6.11 All in all, the investment program for 1990-1997 consists of theconstruction of 1,684 km of new railway lines. Looking at the individualcomponents under the expansion program, the Caracas-Cua (Sta. Teresa) and Cua-Puerto Cabello sections of the Center-Occidental Line are conceived of ascargo and passenger lines designed to link up with existing railway lines from
Caribbean Sea 6aR ot2°
I . -tL - - I
43 ~ ~ XITIGAND POOE
'IT 199 90 T 'O 19 Ocean
a U Fft fti UMB
}~~~~~~~~~~~~~~ I
_e*___wn.__*____ _ w[ \ GUYANA
AM rg 40
. -4 S a_-ff ~~VENEZUELA
2 / ~~~~~~~~~~~EXISTING AND PROPOSED
~~~~~~~~~~~~~~~~~~~~~~~~~LEtO3) CONSIIN FOMBB>^SE,,\~~~~~~~C LM ROTE AM 199 199 M 1993 t S1NG
+W HK~~BAZIlt ...... -- _ _ b%(m
'< 1 > N\ v ~~~~~~~~~~~~~~~~~~~~~~~~~~~~~~~A uxerw8 . ~~~~~~~~~~~~~~~~~~~~~~~~~~~~~~~~~~~~RS o AZIL 64 6°'
W
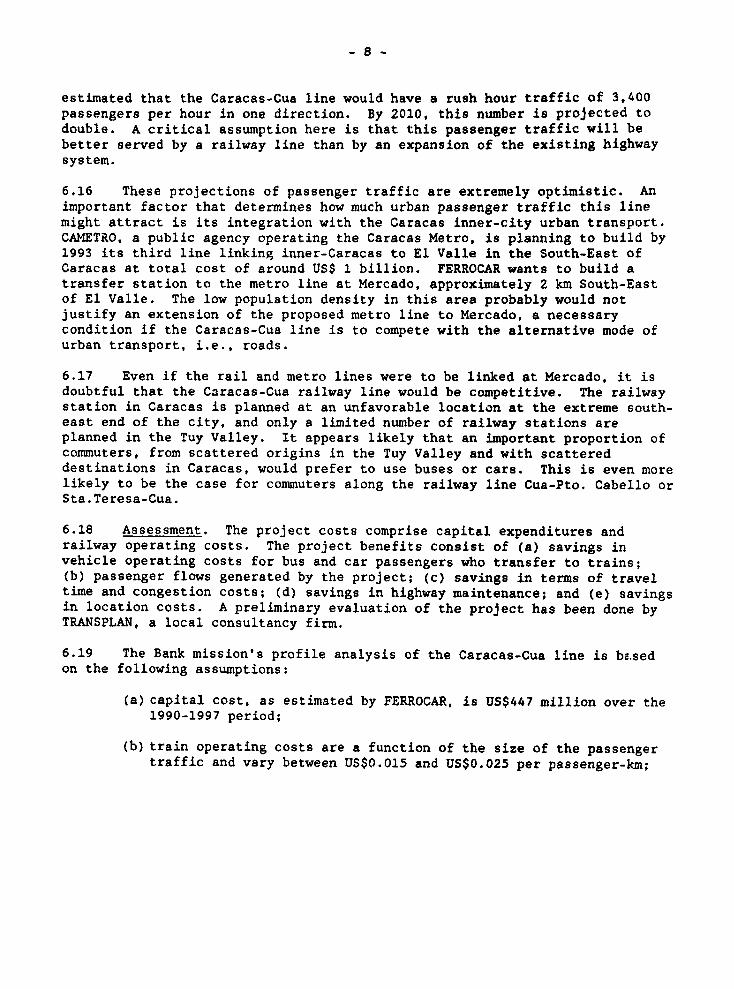
- 6 -
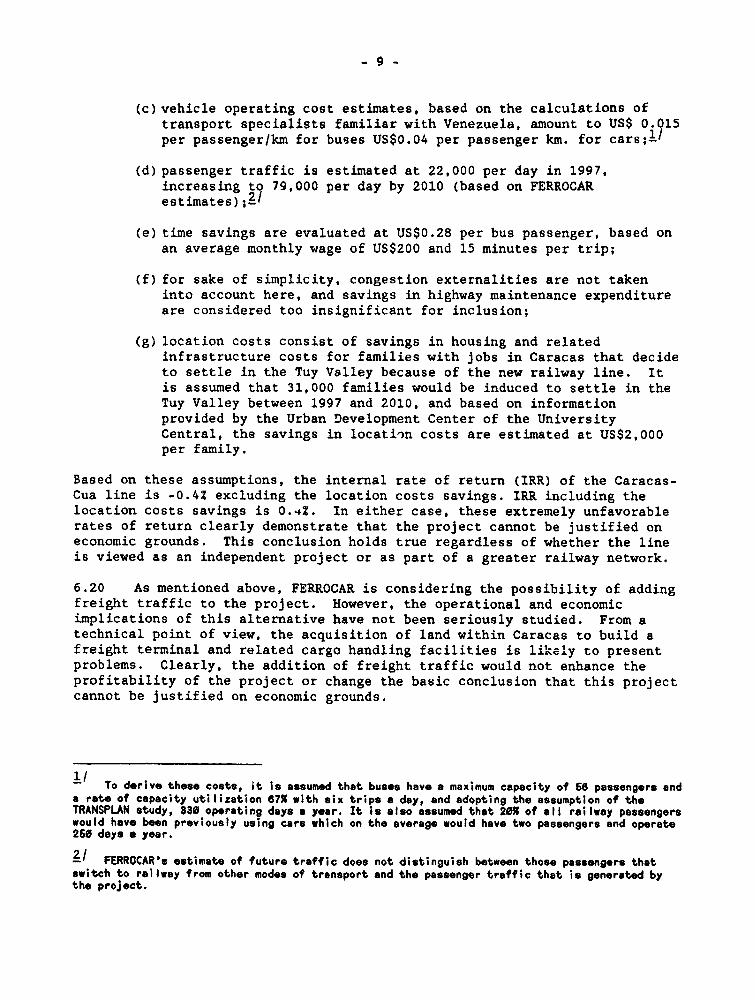
Table VI-4s Railway Investment Program 1990-1997
LenRth Cost a/ Construc-(Km) (1989 tion
Expansion Program USS.mil.)
Center-OccidentalCaracas-Cua 43 447 1990-1997Acarigua-Turen 44 9 1990-1993
Moron-Riecito 100 15 1990-1993
South Oriental/CenterPto Ordaz-PtoCabello b/Llanos Route c/ 979 2,028 1990-1997Coastal Route d/ 812 1,717 1990-1997Maturin-Guacarapo 153 437 1990-1997
South-OccidentalLa Fria-Paraguaipoa 365 587 1990-1997La Fria-La Ceiba 197 317 1992-1997Sto.Domingo-Sto.Luzardo 190 116 n.a.
Subtotal 1,684 3,523
Maintenance
Pto. Cabello-Acarigua 200 12 1990-1992Guanta-Naricual 27 6 1990-1993
Subtotal 227 18
a/ As estimated by FERROCAR, includes rolling stock and related facilities.bI Includes the branch line Barcelona-Guanta.c/ Includes the branch lines Anaco-Barcelona and Cua-Cagua.d/ Alternative routes under consideration; not included in subtotal.
Source: FERROCAR.
Puerto Cabello to Barquisimeto and Acarigua. These existing lines are also tobe extended to Riecito and Centro Turen. For the South-Oriental Line, alsointended to serve both passenger and freight, two possible routes areproposed: (a) a coastal line linking Puerto Ordaz, Maturin, Barcelona andSanta Teresa (Cua), with branch lines extending from Barcelona to Guanta andMaturin to Guacarapo; or (b) an alternative route passing through the llanolinking Puerto Ordaz with Maturin, Anaco and Cagua. It is envisaged that the
- 7 -
South-Occidental Line would be dedicated to cargo; routes considered are (a)the two segments Domingo-Puerto Santo Luzardo and F,ia-Paraguaipoa, oralternatively, (b) La Fria-La Ceiba.
6.12 The public agencies involved (FERROCAR, FERROMINERA and CORPOSUR-OESTEhave undertaken only very rudimentary economic and financial analyses of theindividual components of the railway expansion program. To complete athorough economic analysis of these projects, these agencies will need tocompile detailed and reliable data on the anticipated volume of traffic, andto undertake comparisons of costs and benefits with the competing modes oftransport (e.g., river and road transport) for each segment of the plannedrailway network. Moreover, final engineering studies have not been completedfor projects which are scheduled to start in 1990.
6.13 On the basis of available information and the best estimates thatcould be made, the Bank mission has carried out simple profile analyses ofthe individual components of the proposed railway expansion program. Theresults are summarized in the remainder of the chapter. Generally speaking,the internal rates of returu appear too low to justify these projects in theforeseeable future, at least before the turn of the century. Until additionalanalyses prove otherwise, it would be prudent to postpone all general cargoand passenger railway projects. It would appear preferable to expand inter-urban bus services, improve shipping operations and invest in highwaymaintenance. The profile analyses also indicate that there appears to belittle incremental benefit in completing an intergrated railway system. Withrespect to the segments of the railway network dedicated to specific cargo,the investment would need to be studied carefully in the context of thevarious mining and industrial activities that these lines are intended toserve. The Government might consider having these mining companies andindustrial enterprises participate in financing these railway investments.
Passenger Railway Line--Caracas-Cua
6.14 FERROCAR has proposed a passenger 43 km railway line linking Caracaswith Cua, a town in the Tuy valley. Two additional passenger stations arebeing planned in the city of Charallave. Total capital cost spread over the1990-1997 period is estimated at US$ 227 million (1989 prices). The operatingcosts vary between US$0.025 and US$O.015 per passenger-km. A possibility ofadding freight traffic under this project is under consideration, but, so far,no feasibility studies have been done for this alternative. The biddingprocess was initiated in November 1989 before the final engineering studieswere completed.
6.15 This project essentially an urban passenger line intended to linkCaracas, which has run out of space for further development, to Cua, arelatively underdeveloped and sparsely populated town in the Tuy Valley,considered to be one of the most promising candidates for future growth withinthe expanding Caracas Metropolitan Area. It is also assumed that the Caracas-Cua line would capture important passexAger flows from other cities in theCenter-West region if and when the proposed railway line between PuertoCabello and Puerto Ordaz is completed to provide the linkage. By 2001, it is
estimated that the Caracas-Cua line would have a rush hour traffic of 3,400passengers per hour in one direction. By 2010, this number is projected todouble. A critical assumption here is that this passenger traffic will bebetter served by a railway line than by an expansion of the existing highwaysystem.
6.16 These projections of passenger traffic are extremely optimistic. Animportant factor that determines how much urban passenger traffic this linemight attract is its integration with the Caracas inner-city urban transport.CAMETRO, a public agency operating the Caracas Metro, is planning to build by1993 its third line linking inner-Caracas to El Valle in the South-East ofCaracas at total cost of around US$ 1 billion. FERROCAR wants to build atransfer station to the metro line at Mercado, approximately 2 km South-Eastof El Valle. The low population density in this area probably would notjustify an extension of the proposed metro line to Mercado, a necessarycondition if the Caracas-Cua line is to compete with the alternative mode ofurban transport, i.e., roads.
6.17 Even if the rail and metro lines were to be linked at Mercado, it isdoubtful that the Caracas-Cua railway line would be competitive. The railwaystation in Caracas is planned at an unfavorable location at the extreme south-east end of the city, and only a limited number of railway stations areplanned in the Tuy Valley. It appears likely that an important proportion ofcommuters, from scattered origins in the Tuy Valley and with scattereddestinations in Caracas, would prefer to use buses or cars. This is even morelikely to be the case for commuters along the railway line Cua-Pto. Cabello orSta.Teresa-Cua.
6.18 Assessment. The project costs comprise capital expenditures andrailway operating costs. The project benefits consist of (a) savings invehicle operating costs for bus and car passengers who transfer to trains;(b) passenger flows generated by the project; (c) savings in terms of traveltime and congestion costs; (d) savings in highway maintenance; and (e) savingsin location costs. A preliminary evaluation of the project has been done byTRANSPLAN, a local consultancy firm.
6.19 The Bank mission's profile analysis of the Caracas-Cua line is be.sedon the following assumptions:
(a) capital cost, as estimated by FERROCAR, is US$447 million over the1990-1997 period;
(b) train operating costs are a function of the size of the passengertraffic and vary between US$0.015 and US$0.025 per passenger-km;
- 9 -
(c)vehicle operating cost estimates, based on the calculations oftransport specialists familiar with Venezuela, amount to US$ 0.015per passenger/km for buses US$0.04 per passenger km. for cars;l/
(d)passenger traffic is estimated at 22,000 per day in 1997,increasing to 79,000 per day by 2010 (based on FERROCARestimates);21
(e) time savings are evaluated at US$0.28 per bus passenger, based onan average monthly wage of US$200 and 15 minutes per trip;
(f) for sake of simplicity, congestion externalities are not takeninto account here, and savings in highway maintenance expenditureare considered too insignificant for inclusion;
(g) location costs consist of savings in housing and relatedinfrastructure costs for families with jobs in Caracas that decideto settle in the Tuy Valley because of the new railway line. Itis assumed that 31,000 families would be induced to settle in theTuy Valley between 1997 and 2010, and based on informationprovided by the Urban Development Center of the UniversityCentral, the savings in location costs are estimated at US$2,000per family.
Based on these assumptions, the internal rate of return (IRR) of the Caracas-Cua line is -0.4Z excluding the location costs savings. IRR including thelocation costs savings is 0.4Z. In either case, these extremely unfavorablerates of return clearly demonstrate that the project cannot be justified oneconomic grounds. This conclusion holds true regardless of whether the lineis viewed as an independent project or as part of a greater railway network.
6.20 As mentioned above, FERROCAR is considering the possibility of addingfreight traffic to the project. However, the operational and economicimplications of this alternative have not been seriously studied. From atechnical point of view, the acquisition of land within Caracas to build afreight terminal and related cargo handling facilities is li'kely to presentproblems. Clearly, the addition of freight traffic would not enhance theprofitability of the project or change the basic conclusion that this projectcannot be justified on economic grounds.
-/ To derive these costs, it is assumed that buses have a maximum capacity of 56 passengers anda rate of capacity utilization 67X with six trips a day, and adopting the assumption of theTRANSPLAN study, 330 operating days a year. It is also assumed that 20% of all railway passengerswould have been previously using cars which on the average would have two passengers and operate260 days a year.
- FERROCAR's estimate of future traffic does not distinguish between those passengers thatswitch to railway from other modes of transport and the passenger traffic that is generated bythe project.
- 10 -
6.21 The extension of the inter-city bus service, which has proven to be anefficient mode of transportation in other Latin American countries, appears tobe a more favorable alternative. Assuming a capacity of 56 passengers perbus, the rush hour demand predicted for 2001 would be fewer than 70 buses perhour. In 2010, demand would increase to 130 buses per hour. This flow couldbe fully accommodated by a bus service if an exclusive lane for buses werecreated.
CarRo and Passenger Railways--South Oriental-Center
6.22 A cargo and passenger railway line South Oriental proposed by FERROCARis intended to link Guayana with the coastal and central regions. There aretwo alternative routes proposed. CVG favors the coastal route from PuertoOrdaz through Maturin and Barcelona to Cua, whereas FERROCAR prefers the routepassing through the llanos, the interior of the country, linking a railwayline from Puerto Ordaz through Maturin and Anaco to Cagua with another linethat connects Puerto Cabello with Cua. The llanos proposal also includes abranch line Anaco-Barcelona, and both proposals include a branch line fromBarcelona to Guanta. intended to connect the Guayana-Center line to the coalrailway Guanta-Naricual. The proposed coastal and the llanos routes measure812 km and 979 km, respectively. The Guayana-Center line is intended totransport steel, aluminum, paper, beverages and general cargo from south tonorth, and recycled steel, beverages, other minerals, general cargo and, ifthe coastal route is adopted, limestone from north to south.
6.23 Another section of the South Oriental railway line, which can also bestudied as an independent project, is the Puerto Ordaz-Maturin-Guacarapo line.This proposed line is intended for transporting export iron ore to a deep seawater port (to be constructed at some future date) in the north, and if thecoastal route were to be rejected, for carrying limestone to the south. Boththe Maturin-Guacarapo branch and the segment Puerto Ordaz-Cagua or,alternatively, Puerto Ordaz-Cua, would fall under the jurisdiction of CVG,while the segment Cua-Puerto Cabello would be managed by FERROCAR.
6.24 Pto. Ordaz-Maturin-Guacarapo. The principal beneficiaries of thisline are the CVG companies, in particular FERROMINERA. Currently, FERROMINERAexports around 13 million tons of iron ore. FERROMINERA's current expansionplan would allow the company to increase its iron ore exports to at least 19million tons. Since 1989, when FERROMINERA obtained a 10 year lease for theuse of a transfer station with a capacity of 15 million tons per year,FERROMINERA has been able to use larger ships to export iron ore. (Out oftotal iron ore exports, around 8 million tons can be transported in ships witha capacity of over 60 thousand tons). If the Pto.Ordaz-Guacarapo railway linewere to be built, it would capture the iron ore traffic passing through thetransfer station--a potential flow of 8.5 million tons of iron in 1998.According to very ambitious projections by FERROMINERA, this traffic wouldcontinue to grow at a rate of 7.3Z per year after 1997.
6.25 Limestone is an important input in the operations of CVG companies inGuayana. By 1998, annual limestone flows to Guayana are projected to reach1.3 million by 1998, growing at a rate of 3Z per year. Large limestone fields
- 11 -
are located around Barcelonia, Caripito and Guacarapo. Currently, limestone istransported by trucks from mines close to Barcelona. However, the choice ofthe field to be exploited depends crucially on the costs of transportation.Should the Puerto Ordaz-Guacarapo railway line materialize, the mostprofitable option would be to exploit the limestone fields close to Caripitoand to transport the limestone by rail. An alternative option, according toSIDOR, is to develop the fields close to Guacarapo, El Yacal and El Yaque.The limestone extracted from these fields would need to be transported firstby cable or a special train over a distance of 15 km to a specialized port,and then shipped to Guayana. For this. the corresponding facilities woulaneed to be constructed.
6.26 Assessment. In this section, the segment Puerto Ordaz-Maturin-Guacarapo is evaluated both as an individual project and part of the networkGuayana-Center. As an independent project, the capital expenditures for thePto. Ordaz-Maturin-Guacarapo segment amount to US$798 million. As part of theline Pto. Ordaz-Pto. Cabello, capital expenditures for the branch Maturin-Guacarapo are estimated at US$ 437 million. The operating costs are assumedto be US$0.015 per ton-km.
6.27 As indicated earlier, this railway section is assumed to capture thetraffic in iron ore exports amounting to around 8.5 million in 1998. Thebenefits generated by the project are the savings in the marginal transferoperating costs incurred by shipping these iron ore exports to the sea.According to CVG officials, these marginal costs do not exceed US$7 per ton ofiron ore transported. This estimate has also been confirmed by a World Banktransport specialist. The annual limestone flows to Guayana are projected toincrease to 1.3 million by 1998, growing at 3? annually. With this railwayline completed, CVG is likely to exploit the limestone fields close toCaripito and to transport the limestone by train. Assuming an increase ingasoline and diesel prices to international levels, the cost of shippinglimestone extracts from fields close to Guacarapo would be the relevantmeasure of project benefit. Port investments necessary for this operationwould be in the neighborhood of US$50 million, and total transport costs wouldamount to around US$9 per ton.
6.28 Given these alternatives and the flows of limestone and iron ore asdescribed above, a profile analysis of the railway line Pto.Ordaz-Maturin-Guacarapo yields an internal rate of return of 2.57Z. As part of Guayana-Center railway network, the segment Maturin-Guacarapo yields an internal rateof return of 3.46Z. In either case, investment in Pto.Ordaz-Maturin-Guacarapocannot be justified on economic ground at this time. Instead, it would appearpreferable to explore the shipping alternative. If the demand projections byFERROMINERA prove accurate, a railway project might be warranted around theturn of the century.
6.29 Pto. Ordaz-Maturin-Pto. Cabello. In this section, the profileanalysis focuses on the coastal route which links Guayana to the Center, Pto.Ordaz-Maturin-Barcelona-Cua-Pto. Cabello. The capital expenditures for thisproject, if designed exclusively as a cargo railway line, amount to US$ 1.72billion. Operating costs vary between US$0.015 and US$0.035 per ton-km.
- 12 -
Preliminary studies by TRANSPLAN demonstrate that the coastal route is farmore cost-effective than the llanos route Pto. Ordaz-Maturin-Anaco-Cagua witha branch line from Anaco to Barcelona. Whereas both railway lines havesimilar expected operating costs, capital expenditures for the Ilanos routeexceeds those for the coastal route by US$ 300 million, or 202. In addition,the llanos route would not allow the railway to -apture of the important cargotraffic between Caracas and Barcelona.
6.30 To quantify cargo flows on the line Pto.Ordaz-Maturin-Pto.Cabello, itis useful to define three nodes -Guayana, Barcelona, and the Center- and toproject the volume of freight traffic between these nodes. Apart from generalcargo and various minerals, the most important items of freight traffic onthis route are steel and aluminum that move between Guayana and the Center,and limestone and soda that move between Guayana and Barcelona. Other itemsinclude beverages, recycled steel, paper and petrochemicals. Venezuela's mainproducer of steel products, SIDOR, is located in Guayana. Its domestic salesin 1988 amounted to 2.1 million tons in 1988 out of total sales of 2.8 milliontons. According to CVG officials and World Bank analysts, the restructuringof SIDOR will reduce significantly the nwuber of product lines and the volumeof output, and increase sharply the share of exports in total SIDORproduction. Thus, we project SIDOR's total production at approximately twomillion tons in 1998, growing at 3Z per annum thereafter, with a share ofdomestic sales maintained at 45Z.
6.31 The modal distribution of this flow depends on the cost diff.,entialsand risk considerations: SIDOR is not willing to rely on only one mode toavoid becoming vulnerable to labor disputes. In 1988, 25% of its domesticallysold products were transported by ship, even though the cost of this modeexceeded trucking costs by 15-30Z. With the increase of diesel prices tointernational levels, this relative cost pattern will be reversed: trulckingcost will increase to US$0.045 per ton-km, exceeding shipping costs by 50-80%.In view of this cost differential and the transport diversification policiesadopted by SIDOR described above, it is assumed that 60? of the domesticallysold steel would be shipped at a cost of US$ 16 to Barcelona and US$20 to theCenter by 1998. If this railway line were to be built, the railway mode wouldhave a US$20 cost advantage over shipping. Accordingly, it is assumed thatrailway would capture 60X of SIDOR's domestic steel flows. This scenarioassumes that SIDOR continues its diversification policies and that PDVSAstarts production of tubes in Zulia, which will not be served by railway.
6.32 The country's main aluminum producing companies, ALCASA and VENALUM,are also located in Guayana. In 1987, these firms sold 185,000 tins in thedomestic market, of which 98,000 tons were consumed within Guayana, 71,000tons transported to the Center and 16,000 tons sent to the Barcelona area.Under ALCASA's and VENALUM's current expansion plans, their domestic salesoutside Guayana will increase to around 200,000 tons by 1998. The Bank staffregard this estimate as overly optimistic, if not unrealistic. Nonetheless,for the purpose of analysis here, these domestic sales figures were used. Forlack of better information, we simply assumed a 3X annual growth in the seleof aluminum products after 1998. Currently, aluminum for domestic consumptionis transported principally by trucks. With diesel prices increasing to
- 13 -
international le% , ALCASA would have a strong incentive to coordinate itstransportation poli.y with SIDOR to make use of SIDOR's shipping capacity. Itis therefore assumed tha-, by 1997, 502 of domestically sold aluminum thatleaves Guayana would be transportei by ships. Should thi3 railway segment bebuilt, it can be expected to capture 70% of the flows for domestic consumptionleaving Guayana.
6.33 Currently, around 800,000 tons of limestone are transported by trucksfrom the Barcelona area to Guayana. By 1998, over 1.3 million tons will beconsumed in Guayana. With this railway segment completed, it is assumed thatthis entire flow would be transported by train. The relevant factor toconsider in estimating the benefits of the railway project is the cost ofshipping limestone from fields close to Guacarapo to Guayana as describedabove. Another traffic component of great importance is the general cargo.In 1987, 1.2 million tons of general cargo were transported by truck betweenPuerto Ordaz, Barcelona and the Center. We assume that this flow will increaseto over 5 million tons by 1998, and grow at a rate of 32 thereafter. If thisrailway line were to be built, it can be expected to capture 302 of this flow.
6.34 Finally, there are several investment projects that need to beconsidered in evaluating the Puerto Ordaz-Puerto Cabello railway line. First,it is planned to establish a pulp and paper plant in Guayana with a capacityof 400,000 tons, of which 150,000 tons will be transported to the Center. Inthe absence of railways, we assume that 60% of this flow will be transportedby truck and 40% by ships. It is assumed that railway could capture 80% ofthis flow. Second, a petrochemical project is under review for the Barcelonaarea. For the purpose of our analysis here, it is assumed that by 1997, thisnew petrochemical complex would generate flows of 130,000 tons of caustic sodato the aluminum plants in Guayana and 100,000 tons of other petrochemicalproducts to the Center. It is also expected that these flows would betransported by trucks. It is assumed here that the railway line, if built,could capture 100X of the soda flows and 8O0 of the other petrochemicals.
6.35 The Guayana-Center railway is supposed to transport both cargo andpassengers. However, the investment figures provided by FERROCAR -- US$ 1.7billion for the coastal route, and US$ 2 billion for the lianos route-- do notinclude the cost of infrastructure or equipment required to accommodatepassenger traffic. The information of the potential passenger traffic is alsosketchy. TRANSPLAN has provided FERROCAR three origin-destination matrices,estimating railway passenger flows for Venezuela for the years 1995, 2005 and2010. According to these estimates, in the year 2005, 136,000 passengers willtravel daily between Guayana and the regions South-West of Puerto Cabello; by2010, the traffic will increase to 437,000 passengers. These estimates--whichdo not include the flows within the Center region between Puerto Cabello,Caracas, and Sta. Teresa-- would imply passenger traffic would be growing at26% per year, an unlikely scenario. The flows within the Center region areassumed to increase to 250,000 passengers per day in 2005, jumping to 473,000passengers per day in 2010. This highly optimistic demand estimate contrastssharply with the experience of passenger railway services in other LatinAmerican countries.
- 14 -
6.36 Assessment. A profile analysis of the Puerto Ordaz-Maturin-Barcelona-Puerto Cabello railway line dedicated to cargo traffic yields an internal rateof return of 1.62Z. Thus, this investment cannot be justified on economicbrounds. An inclusion of passenger traffic in the analysis raises theinternal rate of return of the joint railway lines Puerto Ordaz-Puerto Cabelloand Caracas-Cua to 5.92. However, it should be noted that this IRR representsthe upper limit because, as seen above, it incorporates the most optimisticassumptions regarding the potential benefits of this project. The capitalcost of US$2.16 billion for this project does not even include any investmentsin infrastructure or equipment needed to operate the Puerto Ordaz-PuertoCabello segment as a passenger line. Hence, our analysis includes only theoperating costs for the passenger traffic. In addition, the passenger flowestimates are clearly too optimistic not only by international comparison butalso taking into account the poor performance of the existing passengerrailway line Puerto Cabello-Barquisimeto/Acarigua.
6.37 The experience of other countries with railways demonstrates that itis not advisable to base the justifications of a long-distance railway line onthe prospect of transferring sufficient numbers of passengers from othermodes. This is unlikely to happen. At the very minimum, one should provide amore rigorous analysis of the potential benefits of a passenger railway line.At this point in time, expansion of inter-urban bus services appear to be ofhigher priority than construction of a passenger railway line. With respectto cargo traffic, it would appear preferable to expand shipping operations andinvest in highway maintenance.
6.38 Railway Network South Oriental. The complete network South Oriental -Center links the line Puerto Ordaz-Maturin-Barcelona-Puerto Cabello with thebranch line Maturin-Guacarapo as well as the line Caracas-Cua segment ifpassenger transport is considered. Generally-speaking, the traffic flows tobe handled by this network correspond to the sum total of all the flowsconsidered under the individual projects described above. However, thelimestone traffic would originate in the area of Barcelona only if thisnetwork were to be built. Alternatively, the limestone traffic couldoriginate in the area of Guacarapo and be transported by ship. As a cargorailway line, total investment cost of the joint railway lines Puerto Ordaz-Puerto Cabello and Maturin-Guacarapo adds up to US$ 2.15 billion. Theinternal rate of return of this project is 2.06Z. Disregarding infrastructureinvestment requirements for the line Puerto Ordaz-Puerto Cabello dedicated topassenger transport, capital expenditures for the combined cargo and passengerrailway lines Puerto Ordaz-Puerto Cabello/Haturin-Guacarapo/Caracas-Cur add upto US$ 2.6 billion. As explained in the previous section, the analysis of thepotential benefits of the inclusion of passenger traffic is still at apreliminary phase. A profile analysis indicates that the internal rate ofreturn for this project is 5.62 and represents an upper limit. To conclude,the analysis of the network South Oriental-Center in its entirety does notchange the recommendations given with respect to its individual segments.Prom an economic point of view, advancing the construction of a railwaynetwork for Venezuela cannot be justified at this point in time. Instead, anexpansion of bus services for passengers and shipping operations for cargo,and better maintenance of highways appear to be preferable options.
- 15 -
Cargo Railway Line-South Occider.tal
6.39 The regional development corporation for the southwest region,CORPuSUROESTE, has proposed two major railway projects in the state ofTachira. One is intended to link the phosphate and coal mines of Monte Frescowith one of the ports in the north via La Fria. The other project is intendedto link Monte Fresco with PL-. Stos. Luzardo north of Guasdalito, at the Apureriver. The second project is premised upon the Government undertaking theOrinoco-Apure river navigation project. To judge the prospects of theseprojects, it is important to realize that currently less than 100,000 tons ofcargo are being transported between Tachira and Zulia, and less than 200,000tons via the Orinoco between Tachira and Guayana. The railway projects thuscan only be justified in the context of the future exploitation of phosphateand coal mines in the Monte Fresco area. The analysis below assumes that allmining projects would be realized as planned by CORPOSUROESTE. It should benoted, however, that most of these projects are still at a very preliminarystage of evaluation and may not be implemented in the foreseeable future.Horeover, there are competing projects in the states of Zulia (for coal) andFalcon (phosphate).
6.40 Monte Fresco-La Fria to Para-uaipoa or La Ceiba. CORPOSUROESTE hasproposed three alternative routes for connecting Monte Fresco-La Fria to aport in the North. The first proposal is to connect Monte Fresco-Le. Fria toParaguaipoa (365 km), north of Maracaibo. Capital expenditures for thisproject add up to US$ 587 million. The second proposal is to connect MonteFresco-La Fria to La Ceiba (197 km), a port on Lake Maracaibo in the state ofTrujillo. Capital expenditures for this project amount to US$ 317 million.Both routes are proposed for construction between 1992 and 1997. The thirdproposal is to connect Monte Fresco-La Fria to a line proposed by FERROCAR,Turen-Barquisimeto. Given that no information is available on this thirdoption, our evaluation focuses on the first two routes. In our evaluation, weassume that the following projects are implemented:
(a) Phosphate Mines in havay and Monte Fresco. By 1997, the MonteFresco phosphate mine is projected to produce 300,000 tons ofmicronized phosphoric rock to be sold in the domestic market. TheNavay mine is expected to produce 250,000 tons phosphoric acid and1.2 million tons of phosphoric rock for the export market. It isassumed that the railway would capture 502 of the domesticallysold phosphoric rocks from '.onte Fresco (the remainder beingtransported by road to the Orinoco river), 1002 of the rock fromNavay and 702 of the phosphoric acid.
(b) Coke Production in North-West Tachira. There are three importantcoal mines in the northwest of Tachira: Lobater, Las Adjuntas andHato de la Virgen. Currently, production is around 100,000 tons,but there are plans to increase production to 2.5 million tons by1996. In parallel to this expansion, a conversion plant toproduce 1 million tons of coke is planned. The main consumer ofthis coke will be CVG. For this analysis, it is assumed that the
- 16 -
railway Monte Fresco-Sto. Domingo-Pto. Stos. Luzaido would not bebuilt and that 1002 of the coke flow is transported by the MonteFresco-La Fria railway line.
(c) Sto.Domingo Coal Mine. CORPOSUROESTE plans to extract 1.5 milliontons of coal from a mine close to Sto. Domingo. For the purposeof our analysis, it is assumed that 50% of this coal will beexported, and that 602 of total coal extracted will be to a portin the Nortk by railway.
If all of the above projects were implemented, the Monte Fresco-La Friarailway line would transport a total f1ow of 3.5 million tons of cargo by1998. If there were no railway transport, this flow would have to betransported by trucks. If the route Monte Fresco-La Fria-La Ceiba were to bechosen, additional capital expenditures would be necessary for exporting coal.La Ceiba can only handle ships with a capacity of less than 30 thousand tons,and it would be necessary to construct a transfer station. The marginal costof the transfer operation is estimated at US$ 7 per ton.
6.41 Assessment. A profile analysis of the railway line Monte Fresco-LaFria-Paraguaipoa yields an internal rate of return of 4.532. The internalrate of return of the competing proposal Monte Fresco-La Fria-La Ceiba is9.55Z. Thus, this latter project warrants another good look provided that thevarious mining projects that this line is intended to serve actuallymaterialize. In evaluating this proposal, it might be advisable to considerthe possibility of a diesel operated railway system instead of the electricoperated system proposed by CORPOSUROESTE.
6.42 Monte Fresco-Sto.Domingo-Pto.Stos.Luzardo. In tandem with the railwayline Monte Fresco-La Fria, CORPOSUROESTE proDoses to build a railway lineMonte Fresco-Sto. Domingo-Puerto Stos. Luzardo, linking Tachira to the Apureriver. A preliminary analysis of the cargo flows between both regions wouldappear to cast doubt on the economic viability of this project, even if theMonte Fresco-La Fria did not materialize. If the latter were to be built,there would be even less justification for a railway to the Apure river. Thefreight traffic between Tachira and Guayana could easily be transported byrailway to a northern port and from there by ship to Pto. Ordaz. Moreover,the Monte Fresco-Sto. Domingo railway project is premised upon the Governmentundertaking the very ambitious Orinoco-Apure river navigation project. Wetherefore strongly recommend extreme caution; a thorough evaluation of thisproject must be undertaken before any decision is made on the project.
Other Investments
6.43 Acarigua-Turen. Capital expenditures for the railway line Acarigua-Turen (44 km) are estimated at US$ 9 million. The construction is to becompleted by 1993. US$5 million have already been allocated for 1990. Thisproject is an extension of the existing line Pto.Cabello-Acarigua. It willtransport between 500,000 and 800,000 tons of agro-industrial commoditiesannually. No economic study justifying this project has been provided, and theavailable information does not permit one to make any judgment on its economic
- 17 -
viability. It is recommended to postpone this project until completion of aneconomic evaluation.
6.44 Moron-Riecito and Guanta-Naricual. Capital expenditures for therailway Moron-Riecito (100 km) add up to US$ 15 million. The construction isscheduled for completion by 1993. US$5 million have already been allocatedfor 1990. This project is designed to serve exclusively a carbon mine inRiecito. The expenditures for maintenance and acquisition of equipment forthe railway Guanta-Naricual (27 km) amount to USS 6 million. US$1.5 millionhave already been allocated for 1990. This line is dedicated to the coal mineEl Naricual. Th"re appears to be little justification for the Government toundertake this mnd of projects form an integral part of the miningoperations. If the mining operations are profitable with the inclusion of thespecial transport investments required to haul the ores, these line should bebuilt and financed by these mining enterprises.
6.45 Pto. Cabello-Acarigua. The expenditures for the rehabilitation andmaintenance of the railway line Pto.Cabello-Acarigua (200 km) are estimated toadd up during 1990-1992 to US$12 million. US$4 million have already beenallocated for 1990. This rehabilitation/maintenance program includesreplacement of sleepers, replacement and cleaning of ballast, welding ofrails, improvements in communications, and rehabilitation of yards, stationsand structures. While there appears to be a general need for maintenancewhich had been neglected in previous years, there is not enough information topass judgement on the specifics of this program.
B. Ports
Sectoral Organization
6.46 The maritime foreign trade of Venezuela amounts to approximately 35million tons per year, excluding petroleum. The ports that handle this trademay be divided into four institutional groups:
(a)National Port Institute (INP) ports: these handle general cargo,containerized cargo and some bulks, and are located on the northcoast and in Lake Maracaibo;
(b) Guayana Regional Corporation (CVG) ports: these handle bulkmaterials and the general cargo inputs and outputs of the CVGindustries. They are located on the River Orinoco, with afloating terminal for iron-ore transference at the mouth of theri ea r;
(c)Oth'.r industrial terminals: these are "single industry" terminals,located mostly on the North coast and in Lake Maracaibo; and
(d) Petroleum ports of Lake Maracaibo, which are not considered inthis review.
- 18 -
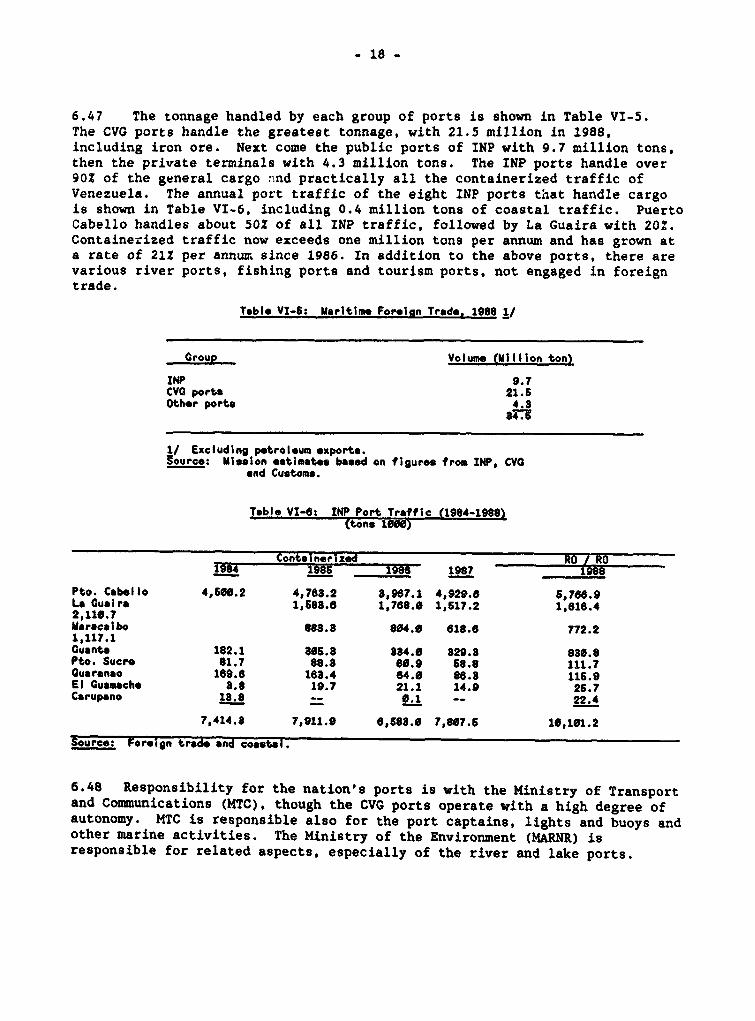
6.47 The tonnage handled by each group of ports is shown in Table VI-5.The CVG ports handle the greatest tonnage, with 21.5 million in 1988,including iron ore. Next come the public ports of INP with 9.7 million tons,then the private terminals with 4.3 million tons. The INP ports handle over902 of the general cargo nnd practically all the containerized traffic ofVenezuela. The annual port traffic of the eight INP ports that handle cargois shown in Table VI-6, including 0.4 million tons of coastal traffic. PuertoCabello handles about 50X of all INP traffic, followed by La Guaira with 20Z.Containerized traffic now exceeds one million tons per annum and has grown ata rate of 212 per annum. since 1986. In addition to the above ports, there arevarious river ports, fishing ports and tourism ports, not engaged in foreigntrade.
Table V1-S: Maritime Foroiln Trade, 1988 1/
Croup Volume (Million ton)
'NP 9.7CVG ports 21 6Other ports 4.8
1/ Excluding petroleum export.Source: Mission etimates based on figures trom INP, CVG
and Customs.
Table VI-6: INP Port Traffic (1984-1988)Ctons 1000)
Containerized RD I ROi984 1985 198B- 1987 1988
Pto. Cobello 4,650.2 4,788.2 8,967.1 4,929.6 5,760.9La Qualre 1,588.6 1,768.0 1,517.2 1,816.42,1109?Maraceibo 8638. 804.0 618.6 772.21,117.1Quanta 182.1 306.3 884.0 829.8 830.8Pto. Sucr 81.7 888 60.9 68.8 111.7Guaranao 169.8 168.4 64.0 86.8 116.9El Cuamache 8.8 19.7 21.1 14.9 25.7Carupano 18.8 -- 0.1 -- 22.4
7,414.8 7,911.9 6,568.0 7,807.5 10,101.2
Source: Foreign trsd, and coastal.
6.48 Responsibility for the nation's ports is with the Ministry of Transportand Communications (MTC), though the CVG ports operate with a high degree ofautonomy. MTC is responsible also for the port captains, lights and buoys andother marine activities. The Ministry of the Environment (MARNR) isresponsible for related aspects, especially of the river and lake ports.
- 19 -
Dredging and river control works are the responsibility of the NationalInstitute for Canals (INC), which depends on the MTC.
Sectoral Performance
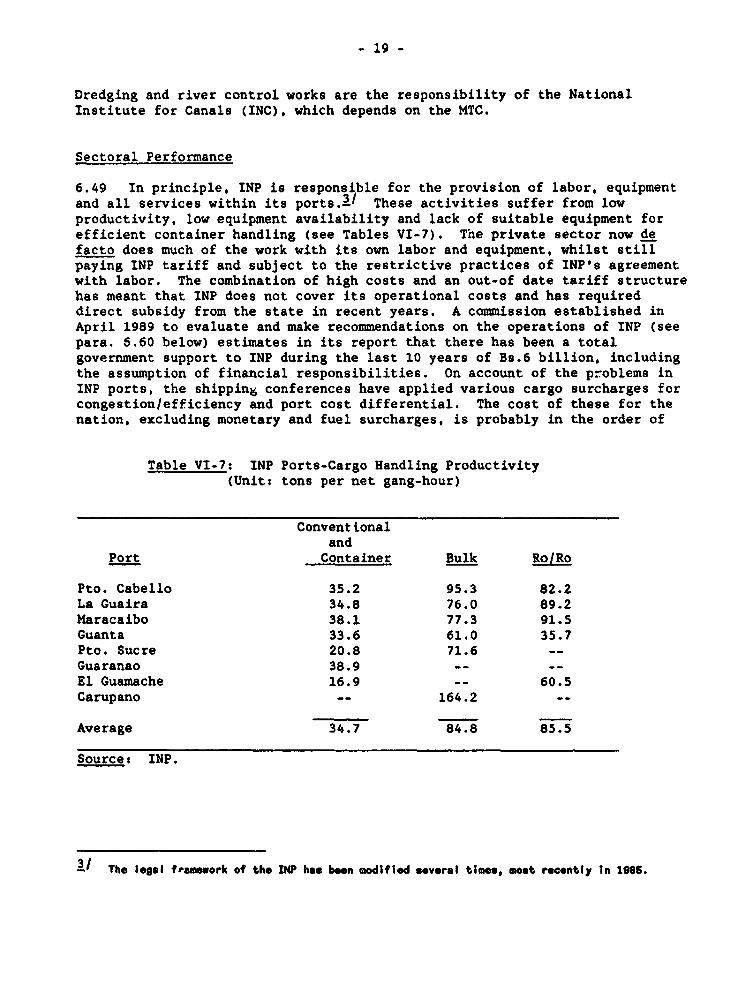
6.49 In principle, INP is responsible for the provision of labor, equipmentand all services within its ports.3/ These activities suffer from lowproductivity, low equipment availability and lack of suitable equipment forefficient container handling (see Tables VI-7). The private sector now defacto does much of the work with its own labor and equipment, whilst stillpaying INP tariff and subject to the restrictive practices of INP's agreementwith labor. The combination of high costs and an out-of date tariff structurehas meant that INP does not cover its operational costs and has requireddirect subsidy from the state in recent years. A commission established inApril 1989 to evaluate and make recommendations on the operations of INP (seepara. 6.60 below) estimates in its report that there has been a totalgovernment support to INP during the last 10 years of Bs.6 billion, includingthe assumption of financial responsibilities. On account of the problems inINP ports, the shipping conferences have applied various cargo surcharges forcongestion/efficiency and port cost differential. The cost of these for thenation, excluding monetary and fuel surcharges, is probably in the order of
Table VI-7: INP Ports-Cargo Handling Productivity(Unit: tons per net gang-hour)
Conventionaland
Port Container Bulk Ro/Ro
Pto. Cabello 35.2 95.3 82.2La Guaira 34.8 76.0 89.2Maracaibo 38.1 77.3 91.5Guanta 33.6 61.0 35.7Pto. Sucre 20.8 71.6 --
Guaranao 38.9 El Guamache 16.9 - 60.5Carupano -- 164.2 --
Average 34.7 84.8 85.5
Source: INP.
31 The legal framework of the INP has been modifiod several time, most recently In 1986.
- 20 -
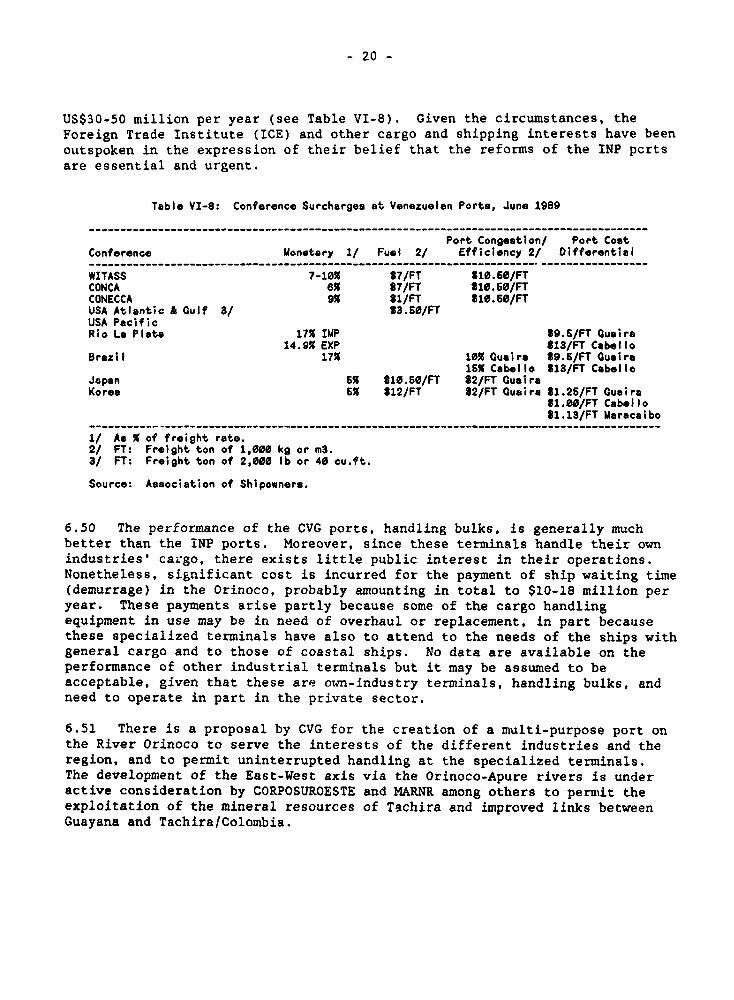
US$30-50 million per year (see Table VI-8). Given the circumstances, theForeign Trade Institute (ICE) and other cargo and shipping interests have beenoutspoken in the expression of their belief that the reforms of the INP pcrtsare essential and urgent.
Table VI-8: Conference Surcharges at Venezuelan Ports, June 1989
------------------------------------------------------------------- __--------__----------
Port Congestion/ Port CostConference Monetary 1/ Fuel 2/ Efficiency 2/ Differential------------------------------------------------------------- __--------_.-_---------------
WITASS 7-10% 87/FT 810.60/FTCONCA e% 87/FT 810.60/FTCONECCA 9% 81/FT 810.60/FTUSA Atlantic A Gulf 3/ 83.60/FTUSA PacificRio La Plata 17% IMP 89.6/FT Gusira
14.9% EXP 813/FT CabelloBrazil 17% 10% Cuaire 89.6/FT Oucire
16% Cabel lo 813/FT CabelloJapan 6% 810.60/FT 82/FT GuairaKorea 6% 812/FT 82/FT Guaira 81.26/FT Guaira
81.00/FT Cabello81.13/FT Maracaibo
1/ As X of freight rate.2/ FT: Freight ton of 1,000 kg or m3.3/ FT: Freight ton of 2,000 lb or 40 cu.ft.
Source: Association of Shipowners.
6.50 The performance of the CVG ports, handling bulks, is generally muchbetter than the iNP ports. Moreover, since these terminals handle their ownindustries' cargo, there exists little public interest in their operations.Nonetheless, significant cost is incurred for the payment of ship waiting time(demurrage) in the Orinoco, probably amounting in total to $10-18 million peryear. These payments arise partly because some of the cargo handlingequipment in use may be in need of overhaul or replacement, in part becausethese specialized terminals have also to attend to the needs of the ships withgeneral cargo and to those of coastal ships. No data are available on theperformance of other industrial terminals but it may be assumed to beacceptable, given that these are own-industry terminals, handling bulks, andneed to operate in part in the private sector.
6.51 There is a proposal by CVG for the creation of a multi-purpose port onthe River Orinoco to serve the interests of the different industries and theregion, and to permit uninterrupted handling at the specialized terminals.The development of the East-West axis via the Orinoco-Apure rivers is underactive consideration by CORPOSUROESTE and MARNR among others to permit theexploitation of the mineral resources of Tachira and improved links betweenGuayana and Tachira/Colombia.
- 21 -
Sectoral Issues
6.52 The principal issues of concern in the port sector at this time are:
(a) the improvement of the performance of the public port sector. Thisincludes three main elements: (i) the role of INP at national and atport level; (ii) the role of the private sector in port operations;and (iii) related to both of these, the future of the laboragreemen.s; and
(b) the reduction of ship waiting time in the River Orinoco.
6.53 Other issues concern the role of coastal shipping as an alternative toinvestment in railway development (see Section A above), and the role of rivertransport in the Orinoco-Apure (see paras. 6.43 and 6.63). Another importantissue relates to port development in Lake Maracaibo where the deepening of theentrance channel has had very serious environmental effects in the penetrationof salt water. The Bank's recent Venezuela Environmental Issues Paper makessome reference to this problem which the Government is presently studyingthrough the INC with technical support from the Netherlands.
Government Policies
6.54 The Government through MTC is actively addressing the issue of publicports. A mixed private/public sector commission was set up in April 1989,basically to propose alternative schemes for increased private sectorparticipation in the ports and the compensation of surplus INP labor.Following on from the work of this commission, the Government established inOctober 1989 a committee of four minister and the president of INP to define asolution to INP's problems. This committee in December 1989 received a paperprepared by the president of INP setting out the implications of two basicoptions: a continuation of present policies with gradual improvements or, thetotal restructuring of INP including a radical reduction of its work forcewith a compensation package, and the re-engagement of the minimum necessarylabor in the context of increased private sector participation. This paperhas now been considered by the Government and the second option, of radicalreform, has been adopted with the concurrence of labor unions.
6.55 There has been no clear tariff policy for the public ports. The presenttariff level is low, contributing to the financial problems of INP. Portusers currently pay less for INP tariff than they incur in the cost ofsupplementing deficiencies with their own labor and equipment. A revisedtariff schedule is now before the economic cabinet for approval.
6.56 The Government's interest in the Orinoco ports remains relativelysecondary although the creation in 1986 of a commission for River Orinoco isindicative of an increasing concern. The commission is essentially a harborauthority, concerned chiefly with shipping movement. CVG, through its generalmanager for industrial and mining activities has commissioned studies for the
- 22 -
proposed port. The results of these studies are expected this year.Transport planning within CVG has up to now been at industry level, resultingin the loss of opportunities to take advantage of economies of scale,particularly for coastal shipping. It is understood that the revisedadministrative structure for CVG will include a corporate transport planningactivity.
6.57 The concern with Orinoco-Apure development has up to now beenconcentrated mainly in MARNR and CVG. The issue is one of regional and miningdevelopment more than transport, though transport costs will play a vital rolein determining the feasibility of these developments. Some greater degree ofcoordination of the river transport aspects will be provided by a commissionestablished in November 1989 under the leadership of MTC and INC, though thecommission has not yet addressed the central problem of project feasibility.
6.58 In fact, the issues of the role of coastal shipping, particularly as analternative to railway transport, and the development of Orinoco-Apure rivertransport are key issues in the transportation sector. These questions,however, cannot be addressed fully in the present report because the necessaryeconomic technical analyses have not been completed by the relevantauthorities in Venezuela.
Public Investment Program
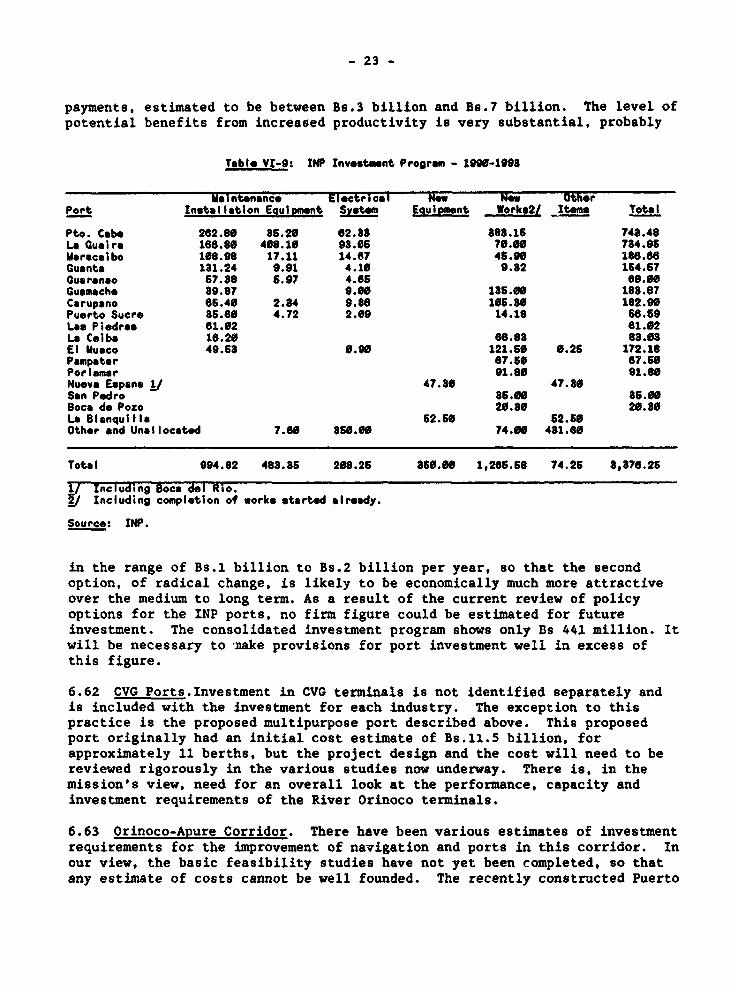
6.59 INP. The investment program of the INP has undergone a series ofmodifications. The original proposil, prepared by INP in 1988, envisaged afive year investment program of Bs.3.4 billion, as shown in Table VI-9. Themagnitud,' of the figures is not in itself unreasonable, given the total lackof maintenance in the ports during the 1980s. The proportion of "new works,dedicated to ports other than those that handle cargo--mostly fishing andtourist ports--is noteworthy.
6.6': The above program was subsequently modified, primarily by the exclusionof -;quipment items and by the inclusion of works to be funded by HTC directly(i.e., not through INP), mostly of a relatively minor nature, connected withnavigation aids and the responsibilities of the port captains. The picturethen chanRed as a result of the work of the commission established in April1989 to reconsider the Rort sector strateRy. The transfer of a largeproportion of port operations to the private sector now emerges as a strongpossibility. This would reduce public investment in equipment, and possiblyin new works, but introduce a new cost element in the payment of compensationto surplus laid-off INP labor.
6.61 Official estimates are not yet available of the total cost pictureunder radical restructuring options. Estimates made by the Bank mission inNovember 1989 suggested a total cost of Bs.4.2 billion under the continuationof present arrangements and of Bs.4.7 to 8.7 billion if private sectorparticipation is increased. The apparent paradox, of greater public spendingunder the second option, is explained by the high cost of compensation
- 23 -
payments, estimated to be between Bs.3 billion and Bs.7 billion. The level ofpotential benefits from increased productivity is very substantial, probably
Table VI-9: INP Investment Program - 1990-1993
Malntenance Electrical Now NOw OtherPort Installotion Equipment System Equipment Work*2/ Items Totel
Pto. Cabe 282.80 36.20 82.88 888.16 748.48La Cuasir 168.80 408.10 08.06 ?0.00 784.95MsracsIbo 168.98 17.11 14.67 4S.90 188.88Guants 131.24 9.91 4.10 9.82 164.67Guarenao 57.88 8.97 4.85 68.0MGuamache 89.87 9.00 136.00 188.87Carupano 65.40 2.84 9.88 106.86 182.90Puerto Sucre 8.860 4.72 2.09 14.18 66.59Los Piedras 61.62 61.02La Celba 18.20 88.68 88.08El Muaco 49.68 0.90 121.50 0.26 172.18Pampatar 87.60 67.60Porlamar 91.80 91.80Nueva Eapana y 47.80 47.80San Padro 85.00 85.00Boca de Poxo 20.80 20.30La Blanquilll 52.60 52.t0Other and Unallocated 7.60 860.00 74.00 481.60
Total 994.82 483.36 208.25 860.00 1,265.68 74.26 8,876.26
1/ Including Boca del Rio./ Including completion of works started already.
Source: INP.
in the range of Bs.l billion to Bs.2 billion per year, so that the secondoption, of radical change, is likely to be economically much more attractiveover the medium to long term. As a result of the current review of policyoptions for the INP ports, no firm figure could be estimated for futureinvestment. The consolidated investment program shows only Bs 441 million. Itwill be necessary to nake provisions for port investment well in excess ofthis figure.
6.62 CVG Ports.Investment in CVG terminals is not identified separately andis included with the investment for each industry. The exception to thispractice is the proposed multipurpose port described above. This proposedport originally had an initial cost estimate of Bs.11.5 billion, forapproximately 11 berths, but the project design and the cost will need to bereviewed rigorously in the various studies now underway. There is, in themission's view, need for an overall look at the performance, capacity andinvestment requirements of the River Orinoco terminals.
6.63 Orinoco-Apure Corridor. There have been various estimates of investmentrequirements for the improvement of navigation and ports in this corridor. Inour view, the basic feasibility studies have not yet been completed, so thatany estimate of costs cannot be well founded. The recently constructed Puerto
- 24 -
Santos Lisardo is estimated to have cost about Bs.15 million, though futureinvestment will necessarily cost much more. There are various associatedinvestments, such as the dams for river control. The whole complex ofprojects require much more serious studies before reliable cost estimates canbe made.
Recommendations for Ports Investment Program
6.64 INP Ports. On the assumption that the policy for increasedparticipation of the private sector will be adopted, the following policiesfor investment in the public ports are suggested for the next five years:
US$ Million
maintenance of installations 30-40maintenance of equipment __new works (to be reviewed) 50compensation payments 100-150
Maintenance of equipment should be self-financing through sale or leasingarrangements.
6.65 Other MTC Port Investments. This is likely to require US$10-20 millionover the five year period.
6.66 CVG Ports. For the reasons given above (para. 6.50), no reliableestimate is available but investment in the order of US$50-100 million islikely to be required for maintaining the various terminals and for the start-up of the multipurpose terminal during the five year period.
6.67 Orinoco-Apure. It would be prudent to allow a sum of around US$20million for minor improvement works over the five-year period.
Chapter 7
Investments in Urban Transportation
A. Background
7.1 In this chapter, we attempt to evaluate the public sector investmentprogram for Caracas' urban transportation in the context of some key issuesthat have emerged in the sector in recent years. Ideally, this report wouldhave covered urban transportation throughout Venezuela. In practice, thecomplexity of the situation in Caracas is such that there was littleopportunity to extend the scope of work to include other urban centers. It ishoped that some of the main conclusions would nevertheless be relevant to thesituation outside Caracas.
Urban Road Network in Caracas
7.2 In 1983 it was estimated that the urban road network of Caracas had atotal extent of 1.300kms, made up as follows:1
- 65kms of urban motorway/expressways;- llSkms of other principal roads;- 230kms of secondary roads; and- 890kms of local roads.
It seems likely that this estimate relates principally to the city's pavedroads and excludes most of the unpaved roads in the marginal areas of Caracas.
7.3 The total length of paved roads outside the marginal areas will nothave increased greatly since 1983. Thus, for example, a document produced bythe Caracas Metro Company (CAMETRO) in 1988 estimates the total length of thenetwork to be only lOOkms more than in 1983 (i.e., 1,400kms).2 The length ofspeedways under the jurisdiction of the Ministry of Transportation andCommunications (MTC) has increased from 65kms to 73kms. Other roads are theresponsibility of the States (i.e., Federal District and Miranda) or themunicipalities.
7.4 The general level of maintenance of the principal road network isgood. Some parts of the secondary network suffer from localized problems butthese are not generally serious. The major problem of road maintenance isfound in the marginal areas of the city (see para. 7.13).
1 Quoted in 'Los Vehiculos Por Puesto on el Transporte Urbano de Caracas' by Ing. Ian Thomson,Naciones Unidas-CEPAL, 1986.
2 Cited in *Proyecto de Ley Programa para la Contratecion y Financlamlento del Metro doCaraces', 1988.
- 26 -
The Vehicle Fleet
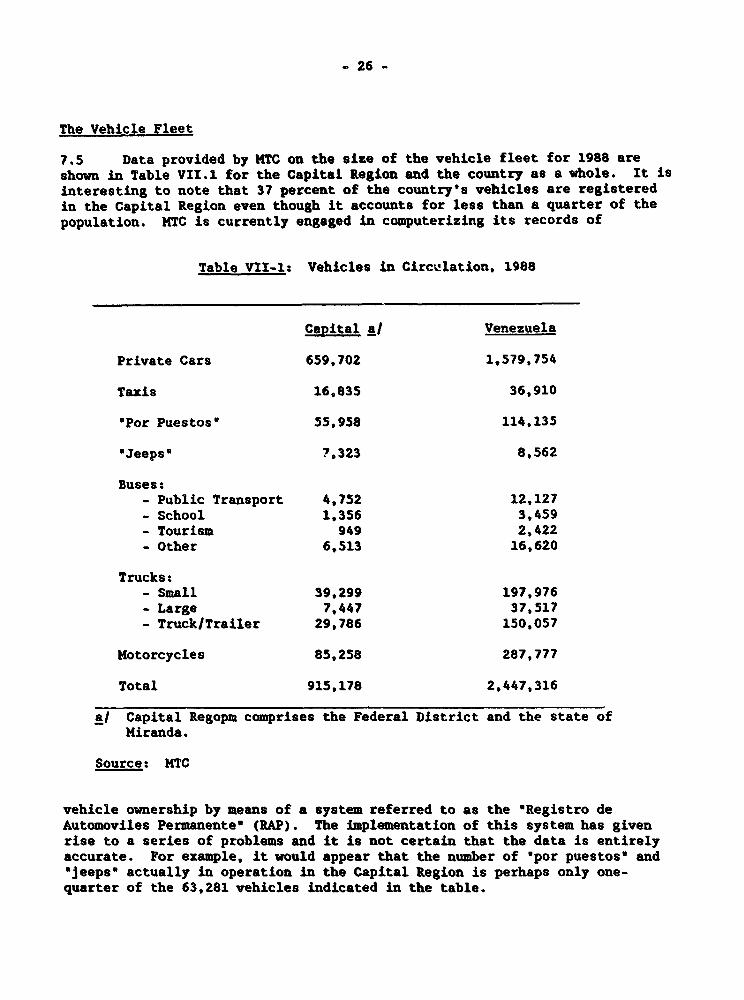
7.5 Data provided by KTC on the size of the vehicle fleet for 1988 areshown in Table VII.1 for the Capital Region and the country as a whole. It isinteresting to note that 37 percent of the country's vehicles are registeredin the Capital Region even though it accounts for less than a quarter of thepopulation. MTC is currently engaged in computerizing its records of
Table VII-Is Vehicles in Circu.-lation, 1988
Capital a/ Venezuela
Private Cars 659,702 1,579,754
Taxis 16,835 36,910
'Por Puestos' 55,958 114,135
'Jeeps' 7,323 8,562
Buses:- Public Transport 4,752 12,127- School 1,356 3,459- Tourism 949 2,422- Other 6,513 16,620
Trucks:- Small 39,299 197,976- Large 7,447 37,517- Truck/Trailer 29,786 150,057
Motorcycles 85,258 287,777
Total 915,178 2,447,316
a/ Capital Regopm comprises the Federal District and the state ofMiranda.
Source: MTC
vehicle ownership by means of a system referred to as the 'Registro deAutomoviles Permanente (RAP). The implementation of this system has givenrise to a series of problems and it is not certain that the data is entirelyaccurate. For example, it would appear that the number of 'por puestos' and"jeeps actually in operation in the Capital Region is perhaps only one-quarter of the 63,281 vehicles indicated in the table.
- 27 -
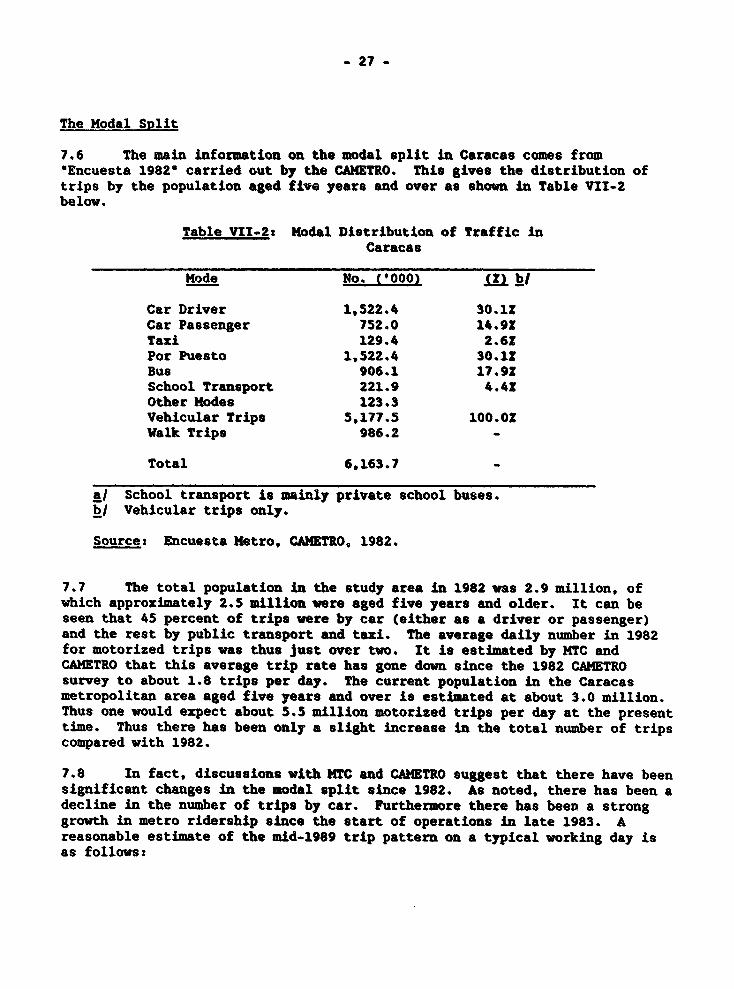
The Modal Split
7.6 The main information on the modal split in Caracas comes from*Encuesta 1982' carried out by the CAMETRO. This gives the distribution oftrips by the population aged five years and over as shown In Table VII-2below.
Table VlI-2: Modal Distribution of Traffic inCaracas
Mode No. ('000) (Z) bi
Car Driver 1,522.4 30.11Car Passenger 752.0 14.9ZTaxi 129.4 2.61Por Puesto 1,522.4 30.1ZBus 906.1 17.9SSchool Transport 221.9 4.42other Modes 123.3Vehicular Trips 5,177.5 100.01Walk Trips 986.2 -
Total 6,163.7
a/ School transport is mainly private school buses.b/ Vehicular trips only.
Sources Encuesta Metro, CAMETRO, 1982.
7.7 The total population in the study area in 1982 was 2.9 million, ofwhich approximately 2.5 million were aged five years and older. It can beseen that 45 percent of trips were by car (either as a driver or passenger)and the rest by public transport and taxi. The average daily number in 1982for motorized trips was thus just over two. It is estimated by MTC andCAMETRO that this average trip rate has gone down since the 1982 CAMETROsurvey to about 1.8 trips per day. The current population in the Caracasmetropolitan area aged five years and over is estimated at about 3.0 million.Thus one would expect about 5.5 million motorized trips per day at the presenttime. Thus there has been only a slight increase in the total number of tripscompared with 1982.
7.8 In fact, discussions with MTC and CAHETRO suggest that there have beensignificant changes in the modal split since 1982. As noted, there has been adecline in the number of trips by car. Furthermore there has been a stronggrowth in metro ridership since the start of operations in late 1983. Areasonable estimate of the mid-1989 trip pattern on a typical working day isas follows:
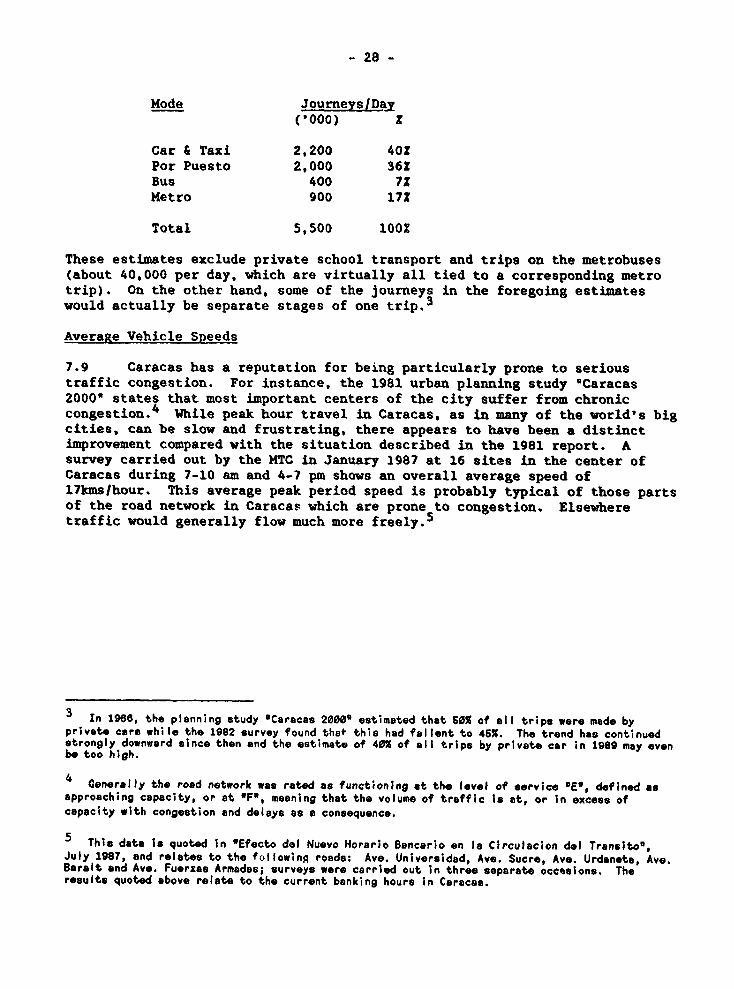
- 28 -
Mode Journeys/Day('000) Z
Car & Taxi 2,200 40?Por Puesto 2,000 362Bus 400 7ZMetro 900 17?
Total 5,500 100?
These estimates exclude private school transport and trips on the metrobuses(about 40,000 per day, which are virtually all tied to a corresponding metrotrip). On the other hand, some of the journeys in the foregoing estimateswould actually be separate stages of one trip.
Average Vehicle Speeds
7.9 Caracas has a reputation for being particularly prone to serioustraffic congestion. For instance, the 1981 urban planning study 'Caracas2000' states that most important centers of the city suffer from chroniccongestion.4 While peak hour travel in Caracas, as in many of the world's bigcities. can be slow and frustrating, there appears to have been a distinctimprovement compared with the situation described in the 1981 report. Asurvey carried out by the RTC in January 1987 at 16 sites in the center ofCaracas during 7-10 am and 4-7 pm shows an overall average speed of17kms/hour. This average peak period speed is probably typical of those partsof the road network in Caracas which are prone to congestion. Elsewheretraffic would generally flow much more freely.5
3 In 1966, the planning study 'Caracas 2000' estimated that 60% of all trips were made byprivate cars while the 1982 survey found that this had fallent to 4SX The trend has continuedstrongly downward since then and the estimate of 40% of all trips by private car in 1989 may evenbe too high.
4 Cenonerally the road network was rated as functioning at the level of service DE", defined asapproaching capacity, or at *F', meaning that the volume of traffic Is at, or in excess ofcapacity with congestion and delays as a consequence.
S This data is quoted in *Efecto del Nuevo Horario Bancario en la Circulacion del Transito,July 1987, and relates to the following roads: Ave. Universidad, Ave. Sucre, Ave. Urdaneta, Ave.Barelt and Ave. Fuerzas Armadas; surveys were carried out in three separate occasions. Theresults quoted above relate to the current banking hours in Caracas.
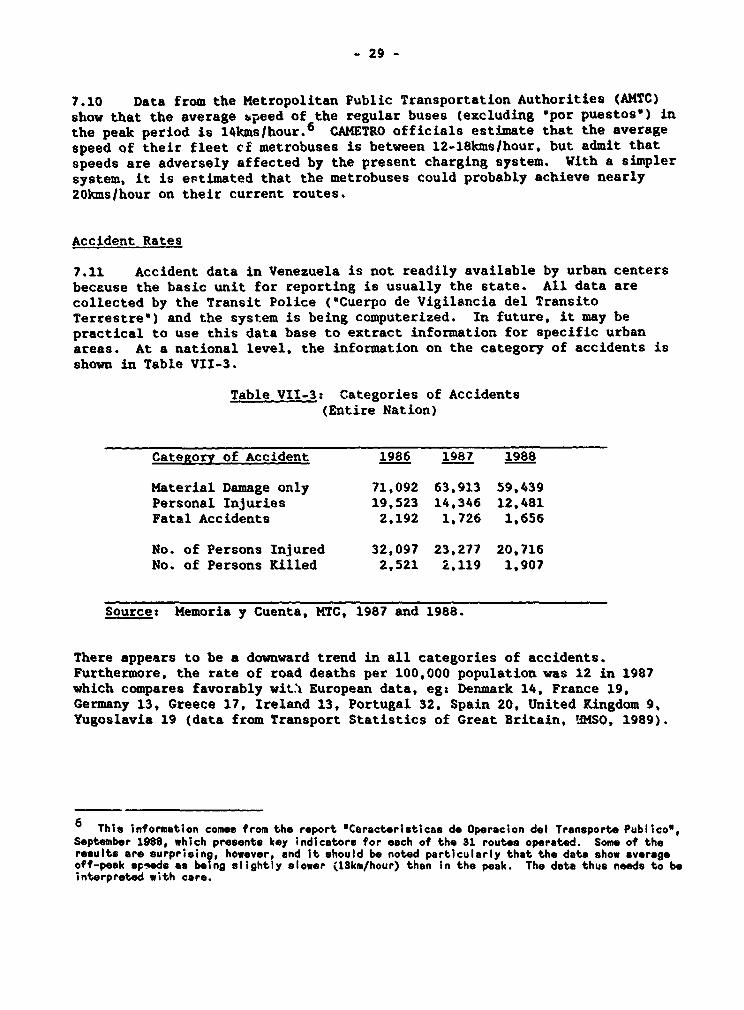
- 29 -
7.10 Data from the Metropolitan Public Transportation Authorities (AMTC)show that the average speed of the regular buses (excluding 'por puestos') inthe peak period is 14kms/hour.6 CAMETRO officials estimate that the averagespeed of their fleet cf metrobuses is between 12-18kms/hour, but admit thatspeeds are adversely affected by the present charging system. With a simplersystem, it is estimated that the metrobuses could probably achieve nearly20kmslhour on their current routes.
Accident Rates
7.11 Accident data in Venezuela is not readily available by urban centersbecause the basic unit for reporting is usually the state. All data arecollected by the Transit Police ('Cuerpo de Vigilancia del TransitoTerrestre') and the system is being computerized. In future, it may bepractical to use this data base to extract information for specific urbanareas. At a national level, the information on the category of accidents isshown in Table VII-3.
Table VII-3: Categories of Accidents(Entire Nation)
Category of Accident 1986 1987 1988
Material Damage only 71,092 63,913 59,439Personal Injuries 19,523 14,346 12,481Fatal Accidents 2,192 1,726 1,656
No. of Persons Injured 32,097 23,277 20,716No. of Persons Killed 2,521 2,119 1,907
Source: Hemoria y Cuenta, MTC, 1987 and 1988.
There appears to be a downward trend in all categories of accidents.Furthermore, the rate of road deaths per 100,000 population was 12 in 1987which compares favorably wit.x European data, eg: Denmark 14, France 19,Germany 13, Greece 17, Ireland 13, Portugal 32, Spain 20, United Kingdom 9,Yugoslavia 19 (data from Transport Statistics of Great Britain, HfMSO, 1989).
6 This information comes from the report 'Caracteristicas de Operacion del Transporte Publico',September 1988, which presents key indicators for each of the 31 routes operated. Some of theresults are surprising, however, and it should be noted particularly that the data show averageoff-peak speeds as being slightly slower (13km/hour) than In the peak. The data thus needs to beinterpreted with care.
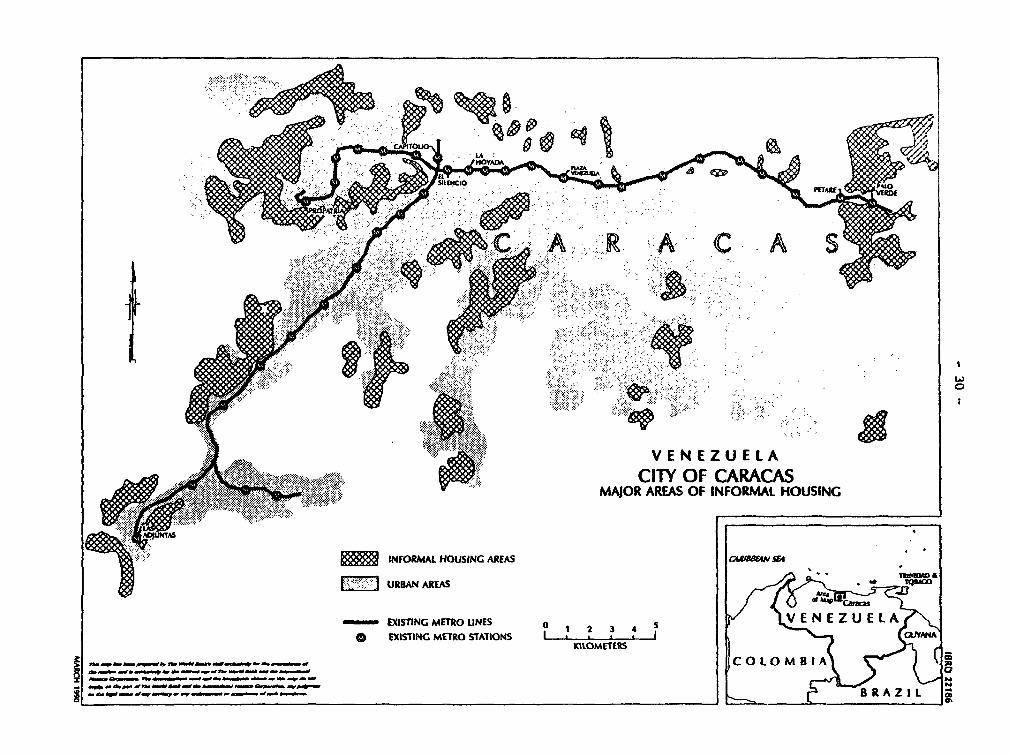
LA ~ ~ VNZUL
MAJR RES OOF INCFORRMAL HOUSINGl
.s: ORINFO HOUSING RE.AA
S~~~~~~~E URBA AREAS
m EXISTNG METRO UNES ° 1 2 3 4 5<eNEZUEEA
*> EXCISTING METRO STATIONS I ii I(KILOMETERS A
flas __ * _ _ _ v -- (
__ _ _ _ _ _ _ _ _ _ _ _ _ _ _ _ _ _ _ _ _ _ _ _ _ _ _ _ _ _ _ _ _ _ _ _ _ _ _ _ _ __ ____n__*_________ 0%
~~~~~~~~~... ._.. . k..
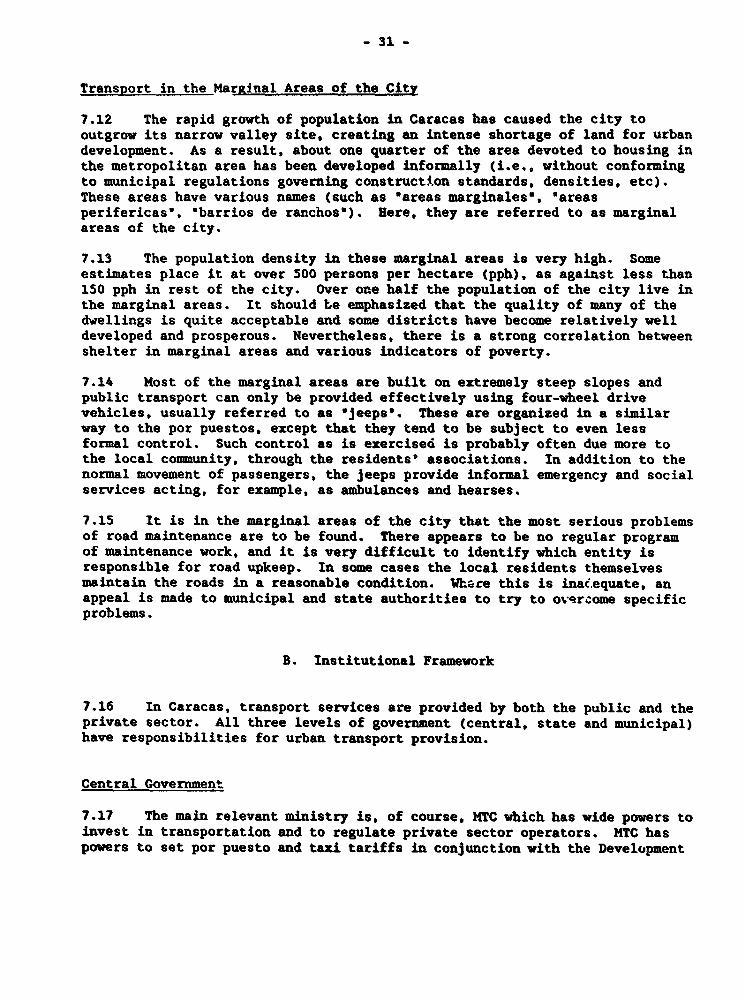
- 31 -
Transport in the Marginal Areas of the City
7.12 The rapid growth of population in Caracas has caused the city tooutgrow its narrow valley site, creating an intense shortage of land for urbandevelopment. As a result, about one quarter of the area devoted to housing inthe metropolitan area has been developed informally (i.e., without conformingto municipal regulations governing construction standards, densities, etc).These areas have various names (such as *areas marginaless, 'areasperifericas', *barrios de ranchos'). Here, they are referred to as marginalareas of the city.
7.13 The population density in these marginal areas is very high. Someestimates place it at over 500 persons per hectare (pph), as against less than150 pph in rest of the city. Over one half the population of the city live inthe marginal areas. It should be emphasized that the quality of many of thedwellings is quite acceptable and some districts have become relatively welldeveloped and prosperous. Nevertheless, there is a strong correlation betweenshelter in marginal areas and various indicators of poverty.
7.14 Most of the marginal areas are built on extremely steep slopes andpublic transport can only be provided effectively using four-wheel drivevehicles, usually referred to as 'jeeps'. These are organized in a similarway to the por puestos, except that they tend to be subject to even lessformal control. Such control as is exercised is probably often due more tothe local community, through the residents' associations. In addition to thenormal movement of passengers, the jeeps provide informal emergency and socialservices acting, for example, as ambulances and hearses.
7.15 It is in the marginal areas of the city that the most serious problemsof road maintenance are to be found. There appears to be no regular programof maintenance work, and it is very difficult to identify which entity isresponsible for road upkeep. In some cases the local residents themselvesmaintain the roads in a reasonable condition. Vhore this is inacequate, anappeal is made to municipal and state authorities to try to overcome specificproblems.
B. Institutional Framework
7.16 In Caracas, transport services are provided by both the public and theprivate sector. All three levels of government (central, state and municipal)have responsibilities for urban transport provision.
Central Government
7.17 The main relevant ministry is, of course, MTC which has wide powers toinvest in transportation and to regulate private sector operators. MTC haspowers to set por puesto and taxi tariffs in conjunction with the Development
- 32 -
Ministry. It is understood that the Development Ministry normally approvesMTC's decisions in this area.
7.18 There are a number of semi-autonomous institutions under MTC. Themost important in terms of investment in urban transport is CAMETRO. Anotheragency for which MTC is responsible is the Transit Police ('Cuerpo deVigilancia del Transito Terrestre').
7.19 Another agency having powers in the general area of urban transport isthe Ministry of Urban Development (MINDUR). It is authorized to plan thedevelopment of the urban road network in coordination with MTC. MINDUR isempowered to manage small road projects in urban areas. Some MINDUR projects,including small scale road works, are undertaken through agreement with theCentro Simon Bolivar (CSB). The Ministry of Interior is involved indirectlythrough its relationship with the state governments.
State Government
7.20 The state governments in Venezuela invest substantial amounts ontransport, mostly through what is known as the Situado Coordinado, i.e., jointprograms financed by transfers and undertaken by means of an agreement betweeneach state and the MTC. Small amounts, mostly dedicated to road maintenance,are also spent out of the State government's own budget. (See paras. 7.26-7.28).
7.21 Metropolitan Caracas has now outgrown the Federal District and atleast half of its area, including most of the districts which are growingfastest, are located in the neighboring state of Miranda. These two statescomprise the Capital Region. The regional planning authority for this regionis called ORCOPLAN and reports to the two states. However, it is concernedmore with physical planning than with transport.
Municipal Government
7.22 Municipal activity in the area of urban transport has been fairlylimited up to the present, being concerned mainly with bus regulation. Themunicipalities could have exercised more initiative in other aspects of urbantransport (traffic management, for example) but have lacked the budget. thetechnical skills and, perhaps, the interest to pursue these matters. Thepowers of municipal governments have increased significantly on January 1,1990 when the 'Ley Organica de Regimen de los Municipiosu went into effect.Theoretically. municipalities now have the power to regulate all forms ofpublic transport and to institute traffic management measures. Furthertransfer of powers to the municipalities is envisaged under the *Ley deTransferencia de Competencia' which is likely to be passed by Congress in thenear future.
VENEZUELA
CARIBBEAN SEA METROPOLITAN AREA OF CARACASREGIONAL CONTEXT
_ < ~LIORL
W TUY MEDIOOoBARLOBARLOVENTO
METROPOLITAIN __ _ BARLOVENTO __ _SUB-REGION SUB-REGION
Bw-REREGION BOUNDARY METROPOLITAN AREA OF CARACAS (AMC)
- SUB-REGION BOUNDARY EL AUIIA NATIONAL PARK 4e30j- C4SffA54
wA"C STATE BOUNDARIES PROTECTION ZONE (GREEN BELT)
, 70 20 30 40 So
Approalmat Scale
> - -,, , - S* - C O L O M B I A
_ - ~ 6; _W__tv- -s--- _ .. 6B R A L - . I
- 34 -
7.23 In Caracas, two municipalities currently make up the main metropolitanarea: Libertador (in the Federal District) and Sucre (in Miranda). Sucre isto be divided into two new municipalities (referred to, respectively, asSucre, or sometimes Petare, and Baruta). Other municipalities around the cityare rapidly urbanizing and becoming part of metropolitan Caracas.
7.24 The Metropolitan Urban Commission (CMU) is under the joint control ofthe Municipal Councils of Libertador and Sucre and is assisted in its tasks bythe Municipal Office of Urban Planning (OMPU) providing technical support onurban planning and related transport matters. In addition, the MetropolitanTransport Authority (AMTC) has an advisory role in bus regulation. However,the municipality of Sucre has never ratified its part of the initial agreementto set up AMTC and both the authority and budget of AMTC have suffered as aconsequence. This is unfortunate considering that metropolitan transportauthorities have often functioned well in other countries.
Public Investment by Three Levels of Government
7.25 Urban transport investment in Venezuela is, in principle, undertakenby central, state and municipal governments. In practice. there are onlythree significant sources of funds for urban transport investment, viz: (a)MTC's own budget; (b) spending by autonomous agencies (in particular CAMETRO);(c) coordinated programs, which are joint investments by the MTC andgovernments of individual states (para. 7.21).
7.26 By Constitution, a fixed percentage of ordinary current revenues mustbe allocated to the states. This is organized by the Interior Ministry and isreferred to as the aSituado Constitucional'. The states are obliged to ensurethat half of this money is applied to investment through agreements signedwith federal entities such as MTC. Within MTC, these programs are handledthrough the Office for the Coordination of Intergovernmental Programs (OMCPI).
7.27 State governments invest some of their ordinary budgetary revenues onroads. However, there are many competing claims on states' budgets andgenerally little is available for more than minor road maintenance. Thesecomments generally apply to municipal governments, though a few municipalities(for example, Sucre) are able to raise substantial amounts through localtaxes. Even so there, is little evidence to suggest that Sucre investssignificantly in any form of urban transport.
Cost Recovery in Urban Transportation
7.28 License Fees. There are two annual licence fees, one national and theother municipal, for the use of vehicles on the public road. The national feeis set at Bs.300 annually, flat rate for all types of vehicles. The municipalfee is payable every three months and the level of charge is set at thediscretion of the mnicipality. Typical figures range from a low of, say,Bs.30.00 to around Bs.130.00 in the Libertador and Sucre (i.e., MetropolitanCaracas), and perhaps even more in some municipalities. Thus licence fees arelow and do not produce significant revenues for the public sector.
- 35 -
7.29 Fuel Taxes. It is reported that taxes on gasoline raised Bs.5,444.6million in 1988, while taxes on diesel brought in an additional Bs.3.7million.
7.30 Vehicle Taxes. At the present time, private cars entail a purchasetax of two percent for up to Bs.240,000. For more expensive vehicles, it isnecessary to pay three percent on the value in excess of this figure. Onpublic Transport vehicles and vehicles used to transport cargo. a flat tax of1.5 percent of their purchase value is imposed. It is likely that these taxeswill be replaced by a flat-rate value-added tax in the future. This isexpected to be set initially at 10 percent.
7.31 Fares. The principal publicly owned passenger transport facility inCaracas is the metrolmetrobus. In 1988 CAMETRO's total operational revenuewas Bs.634 million, and in 1988 fare revenue is expected to total aboutB9.1,000 million.
7.32 Customs Duties. Customs duties of 50& are imposed on fully built-upvehicles; ckd vehicles and spare parts entail variable duties which are lessthan 50 percent. Most imported vehicles are assembled in Venezuela.
C. Organization of Public Transportation in Caracas
7.33 Public transportion in the Caracas Metropolitan Area consistsprincipally of buses (including regular buses, 'por puestos' and Metrobusservices) and the Metro.
Por Puesto
7.34 Organization. The term spor puestog refers to paratransit, or"jitney", services. Por puestos are usually driven by the owner of thevehicle. By a law of 1962, no one is allowed to own more than one vehicle,though the opposite situation, more than one driver per vehicle, is permitted.
7.35 Por puestos originated as shared taxis. The 32-seat minibus is themaximum-size vehicle permitted; above this size the vehicle would be legallyclassified as a bus. The average number of seats for those vehicles in theFederal District and Miranda which receive the Government fuel subsidy is 17.4seats per vehicle. This, however, includes the 12 seat-jeeps which provideservices in the marginal areas. The most common vehicle in Caracas for theregular por puestos is the 32-seat minibus.
7.36 According to MTC data on vehicle registration, there are 55,950 porpuestos in the Capital Region (43,625 in the Federal District and 12,333 inthe State of Miranda). On the other hand, total number of vehicles in theState of Miranda and the Federal District registered with the MTC to obtainsubsidized fuel amounts is just under 15,000 vehicles. It is consideredunlikely that vehicles which are used regularly to transport passengers wouldfail to apply for this subsidy. Thus the figure of 15,000 for active porpuestos is certainly more plausible.
- 36 -
7.37 MTC requires that por puestos operate on specified routes. Thevehicles on each route form an association and these in turn form a nationalorganization known as the *Central Unica de Asociaciones de Venezuela*. Thisassociation functions as the drivers'union. It is also the principal organthrough which the Government attempts to regulate the por puestos.Nonetheless, the por puesto system is naturally fragmented and difficult tocontrol. From January 1990 on, the power to regulate por puestos passedformally to the municipalities.
7.38 Revenues. Costs and Subsidies. Unlike fares on the regular buses, porpuesto fares are graduated according to the distance travelled. The minimumfare is Bs.3.00. Over this amount, it is believed that fares typicallyaverage around Bs.1.00 per kilometre. Out of the total of 15,000 por puestosoperating throughout the Capital Region, probably fewer than half of theseoperate wholly within the city area. The rest would be on longer distanceroutes within the AMC (eg, to Los Teques, Guatire/ Guarenas, etc) or evenfurther afield.
7.39 In urban areas, it is estimated that each por puesto carries about 400passengers/day. Thus on a typical working day, there would be about twomillion trips in Caracas made by por puestos. Until recently, the por puestofleet had teen growing fast in terms of the number of vehicles and, even moreso, seat capacity. It would appear that this trend has now stopped; there maybe a tendency for the fleet to decline if scrapped vehicles are not replaced.
7.40 As mentioned earlier, a wide variety of vehicles are used as porpuestos. It is estimated that operating costs would be Bs.5.25 per kilometerfor the 24 seat vehicle and Bs.6.13 per kilometer for the 32-seat vehicle.The breakdown of these costs is as follows:
Vehicle: 24 Seat (Gasoline) 32 Seat (Diesel)
Depreciation and Interest 622 77ZOther Fixed Costs 72 6XFuel 152 32Tyres 8Z 72Maintenance 82 72
Total 1002 1002
7.41 It should be noted that gasoline comprises only 15 percent ofestimated operating costs. In the case of diesel powered vehicles, fuelrepresents only three percent of the per kilometer cost. Nevertheless, theissue of fuel price continues to be extremely sensitive because fuel isperceived as having a greater weight in total costs than it actually has. Indiscussions with the por puesto drivers union, a figure of Bs.300 per day wasestimated for the fuel cost of typical petrol driven vehicle. However, evenif the union's figure is correct, the effect of even two-or three-foldincrease in fuel prices should not affect fares significantly. Thisconclusion is reinforced when it is remembered that the proportion of diesel
- 37 -
vehicles in the fleet has been increasing rapidly. It may be that Governmentassistance to the por puesto drivers to help phase out gasoline drivenvehicles and substitute diesel vehicles could help to make fuel prices a lesssensitive issue for the por pu¢sto drivers.
7.42 The average por puesto trip would not exceed five kilometres and couldbe less. The average fare would be about Bs.5.00. Total revenue wouldtypically be about Bs.10 million on a working day.
7.43 The total number of por puesto vehicles in Venezuela receiving thefuel subsidy is around 60,000. Por puesto subsidies began in June 1989. Thesubsidies were introduced to compensate drivers for the loss of revenue due tothe half-price student fare scheme. In its current form, each por puestoroute's association nominates a gas station and provides HTC with a list ofits members and their vehicles. The MTC arranges for free gasoline to beprovided to accredited members up to a spepcified limit in accordance with thetype of vehicle. The subsidy averages about Bs.2,000 month. It is estimatedthat this scheme would cost Bs.1,400 million per year.
7.44 Unfortunately, there is no mechanism that relates the distribution offree fuel to the number of students carried. It is not surprising that therecontinue to be reports of students having difficulty obtaining their right totravel at half fare. The scheme will likely be reformulated in the nearfuture, although it is not yet known what procedure will be adopted.
7.45 Assessment of Por Puesto Operations. The success of the por puestosystem is due largely to the fact that each driver is responsible for his ownvehicle. Thus, a driver take greater care of his por puesto than would atypical bus driver. From the passenger's point of view, the por puesto systemhas the advantage of excellent frequencies, a high density route coverage,convenience (no formal bus stops) and a reasonable level of comfort. However,there are negative features, including: greater disruption to other trafficthan is caused by normal buses; fares that are higher than those of buses,infrequent services in late evenings and on public holidays; and as mentionedearlier difficult to regulate.
Reaular Buses
7.46 Organization. Regular bus services in Caracas are provided by privatecompanies. Until 1975, regular bus operations have shown an upward trend.During most of the 1980s the bus companies have been squeezed, by increasingcosts and falling patronage one one hand and, by controlled fares which havenot increased in line with inflation on the other. It is generally acceptedthat their financial position is now in a critical state.
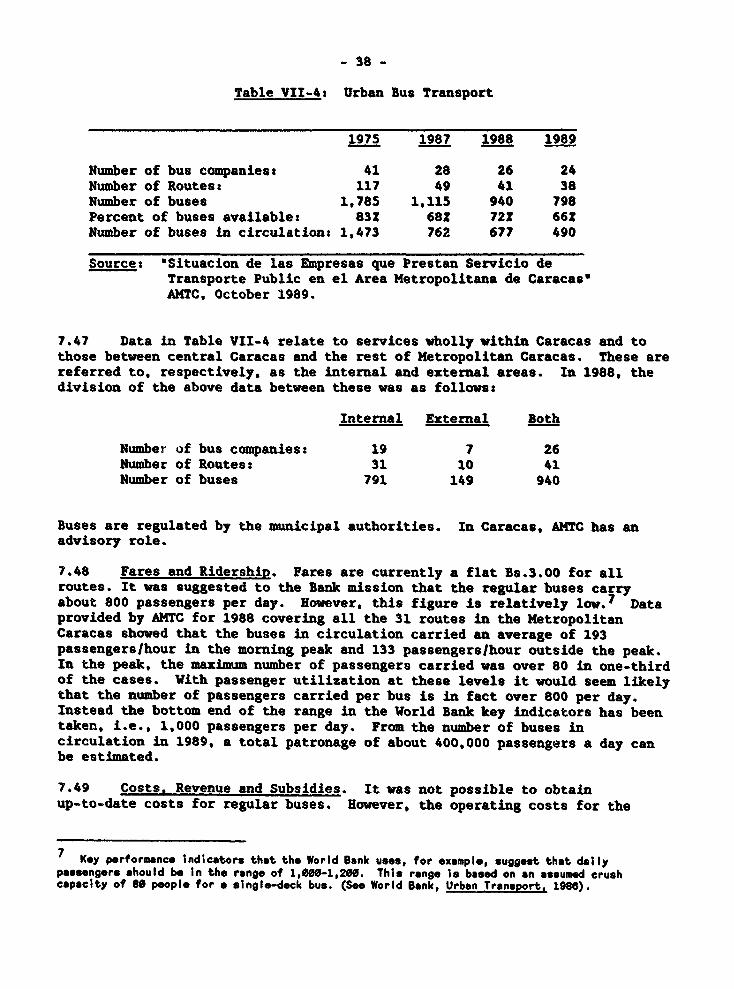
- 38 -
Table VII-4: Urban Bus Transport
1975 1987 1988 1989
Number of bus companiest 41 28 26 24Number of Routes: 117 49 41 38Number of buses 1,785 1,115 940 798Percent of buses availables 83? 682 722 66SNumber of buses in circulation: 1,473 762 677 490
Source: Situacion de las Empresas que Prestan Servicio deTransporte Public en el Area Metropolitana de Caracas'AMTC, October 1989.
7.47 Data in Table VII-4 relate to services wholly within Caracas and tothose between central Caracas and the rest of Metropolitan Caracas. These arereferred to, respectively, as the internal and external areas. In 1988, thedivision of the above data between these was as follows:
Internal External Both
Number of bus companies: 19 7 26Number of Routes: 31 10 41Number of buses 791 149 940
Buses are regulated by the municipal authorities. In Caracas, AMTC has anadvisory role.
7.48 Fares and Ridership. Fares are currently a flat Bs.3.00 for allroutes. It was suggested to the Bank mission that the regular buses carryabout 800 passengers per day. However, this figure is relatively low.7 Dataprovided by AMTC for 1988 covering all the 31 routes in the MetropolitanCaracas showed that the buses in circulation carried an average of 193passengers/hour in the morning peak and 133 passengerslhour outside the peak.In the peak, the maximum number of passengers carried was over 80 in one-thirdof the cases. With passenger utilization at these levels it would seem likelythat the number of passengers carried per bus is in fact over 800 per day.Instead the bottom end of the range in the World Bank key indicators has beentaken, i.e., 1,000 passengers per day. From the number of buses incirculation in 1989, a total patronage of about 400,000 passengers a day canbe estimated.
7.49 Costs. Revenue and Subsidies. It was not possible to obtainup-to-date costs for regular buses. However, the operating costs for the
7 Key performance Indicators that the World Bank uses, for example, suggest that dailypassengers should be in the range of 1,000-1,200. This range is based on an assumed crushcapacity of so people for a single-deck bus. (See World Bank, Urban Transport. 1988).
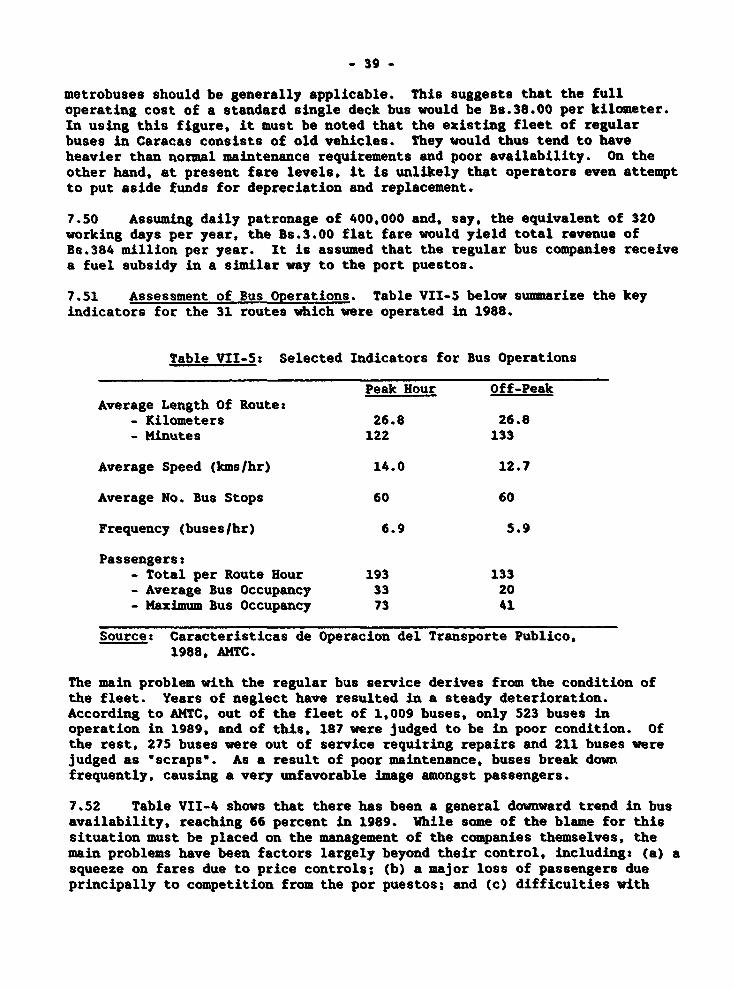
- 39 -
metrobuses should be generally applicable. This suggests that the fulloperating cost of a standard single deck bus would be Bs.38.00 per kilometer.In using this figure, it must be noted that the existing fleet of regularbuses in Caracas consists of old vehicles. They would thus tend to haveheavier than normal maintenance requirements and poor availability. On theother hand, at present fare levels, it is unlikely that operators even attemptto put aside funds for depreciation and replacement.
7.50 Assuming daily patronage of 400,000 and, say, the equivalent of 320working days per year, the Bs.3.00 flat fare would yield total revenue ofBs.384 million per year. It is assumed that the regular bus companies receivea fuel subsidy in a similar way to the port puestos.
7.51 Assessment of Bus Operations. Table VII-5 below summarize the keyindicators for the 31 routes which were operated in 1988.
Table VII-5: Selected Indicators for Bus Operations
Peak Hour Off-PeakAverage Length Of Routet
- Kilometers 26.8 26.8- Minutes 122 133
Average Speed (kms/hr) 14.0 12.7
Average No. Bus Stops 60 60
Frequency (buses/hr) 6.9 5.9
Passengers:- Total per Route Hour 193 133- Average Bus Occupancy 33 20- Maximum Bus Occupancy 73 41
Source: Caracteristicas de Operacion del Transporte Publico,1988, AMTC.
The main problem with the regular bus service derives from the condition ofthe fleet. Years of neglect have resulted in a steady deterioration.According to AMTC, out of the fleet of 1,009 buses, only 523 buses inoperation in 1989, and of this, 187 were judged to be in poor condition. ofthe rest, 275 buses were out of service requiring repairs and 211 buses werejudged as 'scraps. As a result of poor maintenance, buses break downfrequently, causing a very unfavorable image amongst passengers.
7.52 Table VII-4 shows that there has been a general downward trend in busavailability, reaching 66 percent in 1989. While some of the blame for thissituation must be placed on the management of the companies themselves, themain problems have been factors largely beyond their control, including: (a) asqueeze on fares due to price controls; (b) a major loss of passengers dueprincipally to competition from the por puestos; and (c) difficulties with
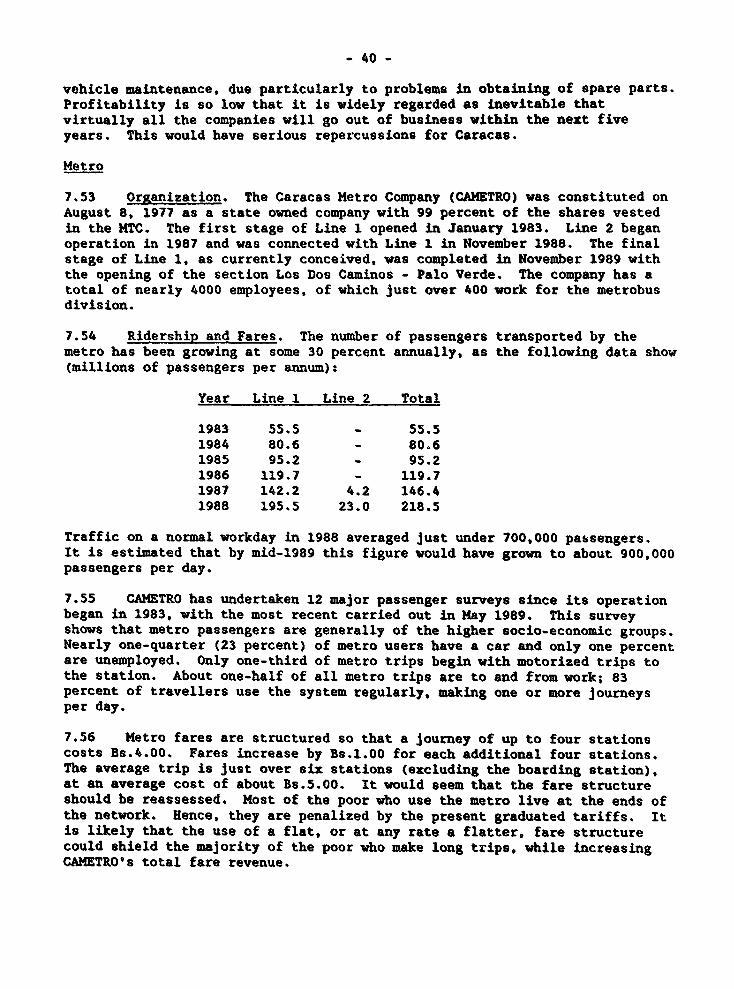
- 40 -
vehicle maintenance, due particularly to problems in obtaining of spare parts.Profitability is so low that it is widely regarded as inevitable thatvirtually all the companies will go out of business within the next fiveyears. This would have serious repercussions for Caracas.
Metro
7.53 Organization. The Caracas Metro Company (CAMETRO) was constituted onAugust 8, 1977 as a state owned company with 99 percent of the shares vestedin the MTC. The first stage of Line 1 opened in January 1983. Line 2 beganoperation in 1987 and was connected with Line 1 in November 1988. The finalstage of Line 1, as currently conceived, was completed in November 1989 withthe opening of the section Los Dos Caminos - Palo Verde. The company has atotal of nearly 4000 employees, of which just over 400 work for the metrobusdivision.
7.54 Ridership and Fares. The number of passengers transported by themetro has been growing at some 30 percent annually, as the following data show(millions of passengers per annum):
Year Line 1 Line 2 Total
1983 55.5 - 55.51984 80.6 - 80.61985 95.2 - 95.21986 119.7 - 119.71987 142.2 4.2 146.41988 195.5 23.0 218.5
Traffic on a normal workday in 1988 averaged just under 700,000 passengers.It is estimated that by mid-1989 this figure would have grown to about 900,000passengers per day.
7.55 CAMETR0 has undertaken 12 major passenger surveys since its operationbegan in 1983, with the most recent carried out in May 1989. This surveyshows that metro passengers are generally of the higher socio-economic groups.Nearly one-quarter (23 percent) of metro users have a car and only one percentare unemployed. Only one-third of metro trips begin with motorized trips tothe station. About one-half of all metro trips are to and from work; 83percent of travellers use the system regularly, making one or more journeysper day.
7.56 Metro fares are structured so that a journey of up to four stationscosts Bs.4.00. Fares increase by Bs.1.00 for each additional four stations.The average trip is just over six stations (excluding the boarding station),at an average cost of about Bs.5.00. It would seem that the fare structureshould be reassessed. Most of the poor who use the metro live at the ends ofthe network. Hence, they are penalized by the present graduated tariffs. Itis likely that the use of a flat, or at any rate a flatter, fare structurecould shield the majority of the poor who make long trips, while increasingCAMETRO's total fare revenue.
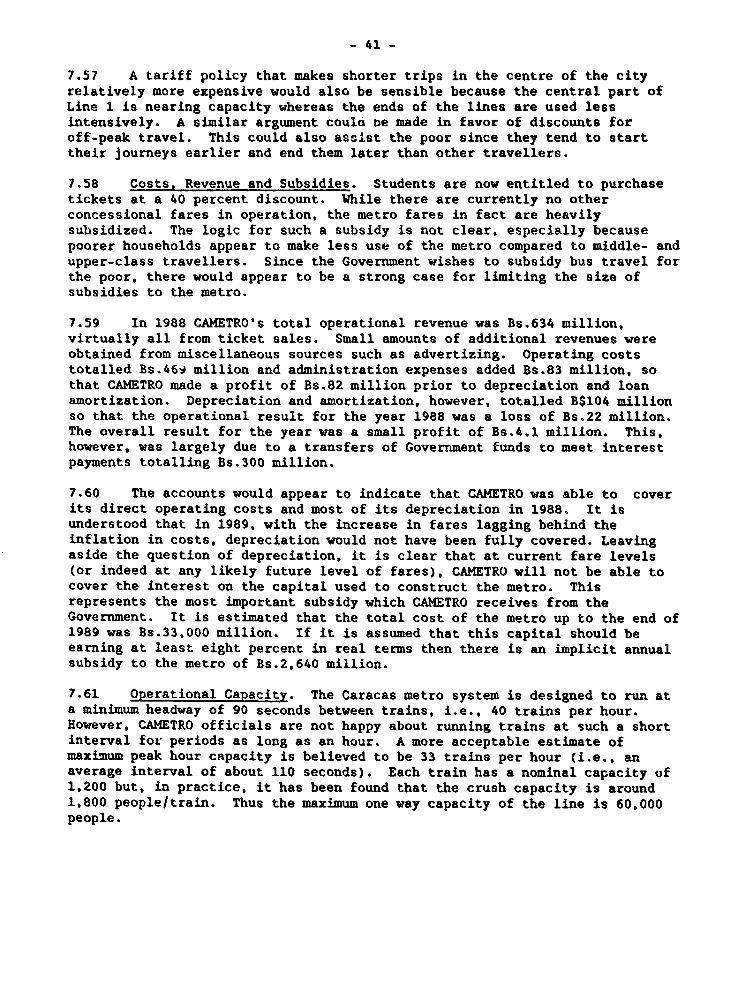
- 41 -
7.57 A tariff policy that makes shorter trips in the centre of the cityrelatively more expensive would also be sensible because the central part ofLine 1 is nearing capacity whereas the ends of the lines are used lessintensively. A similar argument could De made in favor of discounts foroff-peak travel. This could also assist the poor since they tend to starttheir journeys earlier and end them later than other travellers.
7.58 Costs. Revenue and Subsidies. Students are now entitled to purchasetickets at a 40 percent discount. While there are currently no otherconcessional fares in operation. the metro fares in fact are heavilysubsidized. The logic for such a subsidy is not clear, especially becausepoorer households appear to make less use of the metro compared to middle- andupper-class travellers. Since the Government wishes to subsidy bus travel forthe poor, there would appear to be a strong case for limiting the size ofsubsidies to the metro.
7.59 In 1988 CAMETRO's total operational revenue was Bs.634 million,virtually all from ticket sales. Small amounts of additional revenues wereobtained from miscellaneous sources such as advertizing. Operating coststotalled Bs.469 million and administration expenses added Bs.83 million, sothat CAMETRO made a profit of Bs.82 million prior to depreciation and loanamortization. Depreciation and amortization, however, totalled B$104 millionso that the operational result for the year 1988 was a loss of Bs.22 million.The overall result for the year was a small profit of Bs.4.1 million. This.however, was largely due to a transfers of Government funds to meet interestpayments totalling Bs.300 million.
7.60 The accounts would appear to indicate that CAMETRO was able to coverits direct operating costs and most of its depreciation in 1988. It isunderstood that in 1989. with the increase in fares lagging behind theinflation in costs. depreciation would not have been fully covered. Leavingaside the question of depreciation, it is clear that at current fare levels(or indeed at any likely future level of fares), CAMETRO will not be able tocover the interest on the capital used to construct the metro. Thisrepresents the most important subsidy which CAMETRO receives from theGovernment. It is estimated that the total cost of the metro up to the end of1989 was Bs.33,000 million. If it is assumed that this capital should beearning at least eight percent in real terms then there is an implicit annualsubsidy to the metro of Bs.2.640 million.
7.61 Operational Capacity. The Caracas metro system is designed to run ata minimum headway of 90 seconds between trains, i.e., 40 trains per hour.However, CAMETRO officials are not happy about running trains at such a shortinterval for periods as long as an hour. A more acceptable estimate ofmaximum peak hour capacity is believed to be 33 trains per hour (i.e., anaverage interval of about 110 seconds). Each train has a nominal capacity of1,200 but, in practice, it has been found that the crush capacity is around1,800 people/train. Thus the maximum one way capacity of the line is 60,000people.
- 42 -
Metrobus
7.62 Organization. Metrobuses are organized as a separate division withinCAMETRO (called Gerencia Ejecutiva de Transporte Superficiai). The firstmetrobuses were put into operation in October 1987. At this time one of theprincipal functions of the fleet was to provide a service between the stationsLa Paz - Capitolio/El Silencio while the final section of Line 2 wasconstructed. CAMETRO currently operates a fleet of 125 buses which performcollection and distribution functions for metro passengers.
7.63 Fares and Ridership. Fares are a flat Bs.5.00 on all routes and givethe right to four stations on the metro (i.e., they include a metro ride worthBs.4.00). According to CAMETRO, the ridership is approximately 41,000passengers on a normal work day. CAMETRO estimate that the operating cost perpassenger is about Bs.15. It is clear, that at current fares, the metrobusdoes not even come close to covering its direct operating costs. It is arguedthat passenger occupancies should increase over time and that this will reducethe per passenger cost. However, without increasing fares, it will bedifficult to eliminate the need for subsidies.
7.64 Assessment of ORerations. Metrobuses currently operate on six routeswithin Caracas plus a longer routes to Guatire/Guarenas. Services areprovided from 6.00 hrs to 23.00 hrs. The total staff of the metrobusdivision is just over 400, with 250 operators and 165 others (including themaintenance division. This is just over three persons per bus which is deemedextremely good by normal standards.8 Metrobuses are achieving over 90 percentavailability which is also considered good. Bus passenger occupancies for thefleet in circulation are low at just over 500 passengers per working day(compared with the range of 1,000 - 1,200 quoted inpara. 7.49 above).
D. Traffic Systems Management
Bus Regulation and Coordination
7.65 Buses are regulated by the municipalities. Regulation of the porpuestos up to January 1990 had been exercised by the MTC (with fares beingregulated jointly by the MTC and the Ministry of Development). The powers ofthe MTC are now being transferred to the niunicipal authorities. It is hopedthat the regulation of both buses and por puestos by the same authority willmake for an equality of treatment that has been lacking in the past. Inparticular the opportunity will now exist to set tariff policies on acomparable basis.
8 See key indicators of performance In World Bank, Urban Transport, 1988.
- 43 -
Taxi Resulation
7.66 The power to regulate of taxis, like that of the por puestos, has beenexercised by the MTC but is to be transferred to the municipalities. Itshould be noted that there are now plans to reintroduce meters in taxis and totighten up other aspects of tazi operation.
Traffic Enforcement
7.67 Traffic enforcement is the responsibility of the Transit Policecreated in 1956, and attached to NTC. The officers of the Transit Police aredrawn from the National Guard. In general enforcement is an area which islargely neglected in Venezuela. The Transit Police currently has a force of4,000 personnel, only two-thirds of the nuaber ten years ago. Pay isextremely low (Bs.5,200 per month) and the corps has been generally starved offunds so that it is poorly equipped. Reportedly, there has been no moneyavailable for spending on uniforms for five years and some 70 percent of thecorps's vehicles are currently out of comission.
7.68 Traffic enforcement is also made difficult in Venezuela because theTransit Law (ley de transito) is outdated. Proposals to remedy this problemhas been submitted to Congress on a number of occasions but a thoroughoverhaul of the law has not been achieved. This situation is unfortunatebecause many of the most promising options for improving urban transport inCaracas are unworkable without an efficient system of enforcement. Thisincludes parking policies, bus priority measures and many other types oftraffic management schemes. Not only are such policies often extremelyeffective but they are generally inexpensive to implement. The Transit Policehas prepared proposals to strengthen the corps, including increasing the payscale and improving the conditions of its members and purchasing newequipment. Such measures could mike an important contribution to theimplementation of urban transport policies and could, in addition, beself-financing through increased collection of traffic penalties.
S. Public Sector Investment
Public Sector Plannint of Urban TransDort Investment
7.69 The fragmentation of responsibilities between different levels ofgovernment and various related autonomous agencies inhibits effective planningof urban transport investment. The investment allocation between differentmodes and between geographical areas appears to be ad hoc. The setting ofpriorities through a sequence of national, regional and local plans is notwell developed. The use of costibenefit analysis as a means of allocatingfunds between competing projects is not applied in any unifo'm orcomprehensive fashion.
7.70 In many urban areas, an overall framework for the road network isprovided Ly the urban development plans which are prepared by HINDUR as partof the process of establishing zoning ordinances. However, the purpose of
- 44 -
these plans is to establish a pattern for long term physical development ofeach town. Road networks are shown for areas which may not be developed formany years. Thus, these plans are not well suited to the task of settingshort term priorities. Equally important, MINDUR plans are not concerned withthe management of either the existing road network or the development ofpublic transport.
1990-1993 Investment Program in Urban Roads
7.71 The CORDIPLAN document showing planned investments for the period1990-1993 indicates that only Bs.1,500 million is available for urbantransport. This is significantly lower than historical levels (especially ifinflation since 1986 is taken into account) and is understood to reflect apolicy of reducing significantly new road building in urban areas. Theproposed investment over the period thus relates principally to the completionof projects which have already been started.
Proposed CAMETRO Investment 1990-1993
7.72 In August 1968, legislation was passed by Congress authorizingCAMETRO to proceed with a series of investments. However, the exchange rateadjustments and inflation have effectively made this legislation obsolete.CAMETRO is therefore in the pricess of revising the law. The presentproposals for the period 1990 - 1993 at current prices are as follows:
Bs. millionLine 3 17,000Lines 1 & 2 3,000Metrobus 4,000Other 2,000
Total 26,000
These investments are briefly discussed in the following sections.
7.73 Line 3. The main project proposed by CAMETRO for the period 1990-1993 is investment in what is usually referred to as Line 3. However, thisproposed line is intended to be only a connecting spur which will join Line 1with a future Line 3 on a different alignment. This is shown on the map onpage 45.
7.74 The proposal involves the construction of 5.6 kms of new tracksrunning south-west from the existing station at Plaza Venezuela and four newstations. The last station on the new line will be called El Valle and fromhere it is planned to run a special metrobus line to the Hipodrime which wouldserve the rest of the valley. It is hoped that the metrobus could use areserved right of way for most of this journey in order to provide a highstandard of service.
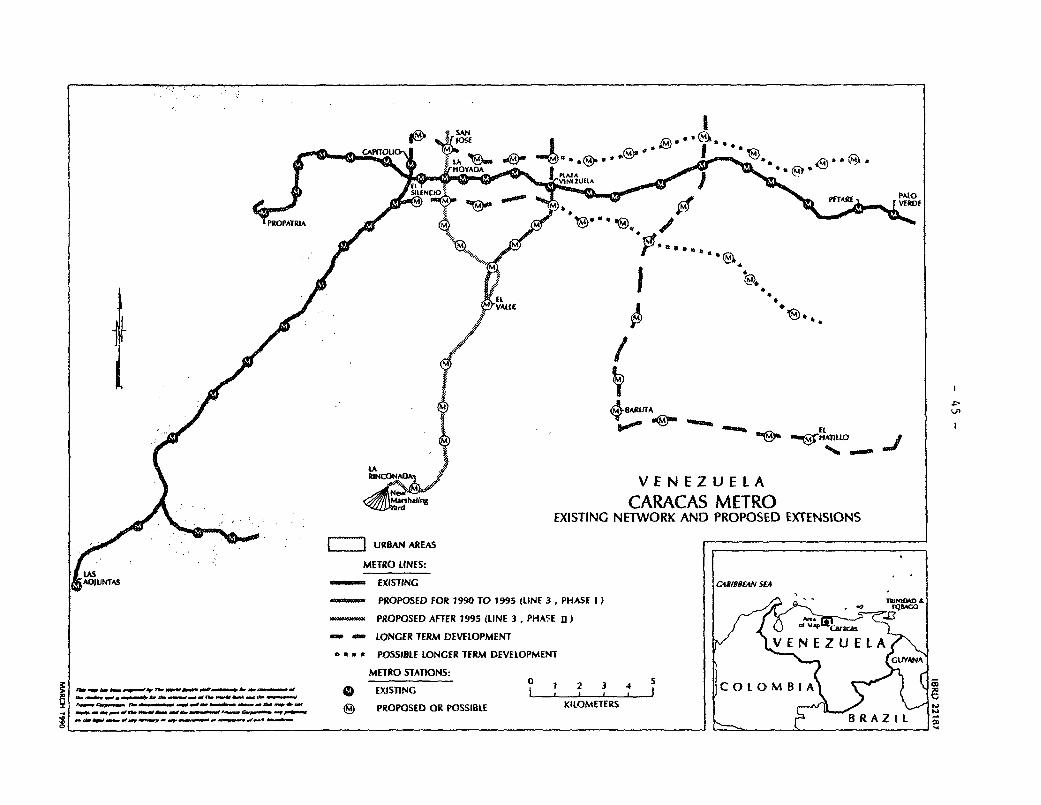
e~ 1CAPITOLI
48AAUTA UJ
\ V E N VENEZUELA
1 .Lurdhling CARACAS METROEXISTING NETWORK AND PROPOSED EXTENSIONS
l] |URBAN AREAS ___ ._ _
METRO LINES:
CS^DIUNTAS - EXISTING C49R180N £64
- -- PROPOSED FOR 1990 TO 1995 (LINE 3, PHASE I) Th, ¢ Tll £
~ - PROPOSED AFTER 1995 (LINE 3, PHA5E 11) .2- - LONGER TERIM DEVELOPMENT VENEZUE LA
a s a POSSIBLE LONGER TERM DEVELOPMENT GLJYA
METRO STATIONS:0 1 2 ~3 4
* < 5t EXISTING t C O LO M B I A
_ _'. X-<t-w__J~ - PROPOSED OR POSSIBLE KILOMETERS- ___#,- e __ * __ A BZIL
- 46 -
7.75 Another attractive feature of this line is that peak hour flows arelikely to be well balanced in both directions. iumediately upon completion,the first part of Line 3 is expected to have over 300,000 passengers per day,rising to over 600,000 by the year 2005.
7.76 This first section Line 3 will be able to operate using themarshalling yard for Line 1 which will help to reduce construction costs, aswill the fact that the design of the new Line 3 is to more economicalstandards than those adopted for the present Lines 1 and 2. For example,trains will consist of six carriages rather than seven and the design of thestations involves a number of economies.
7.77 Lines 1 and 2. CAMETRO plans to invest Bs.3,000 million in Lines 1and 2 over the period 1990-1993. This relates mainly to the purchase ofrolling stock, consisting of 43 new units (equivalent to approximately sixadditional trains) mainly for Line 1. It is reported that some minor items,such as improvements to metro stations, are also intended.
7.78 The daily demand on Line 1 is already nearly one million passengersand is expected to reach 1.2 million passengers in 1992. It is understoodthat the existing rolling stock will not be sufficient to meet this level ofdemand. If this is the case, an evaluation of this investment would be likelyto show a good economic rate of return. If it is assumed that most of thepeak hour passengers carried by the new rolling stock would otherwise be lostto the metro, it is quite likely that this investment could earn an acceptablefinancial return even at the present low fares. The fares currently coveraverage operating costs. However, the marginal cost of operating theadditional trains would be less than the overall average cost. Hence theadditional fare revenue could be attributed directly to the new rolling stock.
7.79 Metro Buses. CAMETRO's investment proposals for the period 1990-1993include the acquisition of some 600 new buses, together with somecomplementary investments, at a cost of Bs.4,000 million. This would bringtheir total fleet up to 725. At this stage CAMETRO would be likely to havesubstantially more buses in circulation than the combined fleet of all theother private bus companies in Caracas (i.e., excluding por puestos).
7.80 Other Investments. The 'Other* item in the proposed 1990-1993 budgetlisted at the beginning of this section relates mainly to studies for a newmetro route in the south east of Caracas; this was not requested by CAMETRO,but was inserted at the insistence of Congress.
General Assessment of CAMETRO's ProPosais
7.81 It is not possible with the information available to make a properassessment of the economic viability of CAMETRO's proposed investments.
Iowever, we hope to point out some key issues which should be investigated inmore detail before such investment is undertaken. The proposals may bedivided into the following categories of expendituret
- 47 -
- further investment in Lines 1 and 2;- investment in new lines;- studies;- investment in the metrobus system.
7.82 Further Investment in Lines 1 and 2. Passenger demand on theexisting network has been growing at about 302 p.a, and it is certain thatparts of the present network will reach saturation in the near future. Asstated earlier, projects which can provide additional capacity in such asituation are a priori likely to be justified economically.
7.83 Investment in Line 3. CAMETRO have the following plans for the longterm development of new metro liness
- construction of the first phase of Line 3 between Plaza Venezuela anda new station at El Valle; this is really a spur which will connectLines 1 and 3;
- construction of Line 3 proper, between stations at La Rinconada andSan Jose, connecting with the new station at El Valle;
- construction of one or more new lines to serve the southeast ofCaracas;
- extension of Line 2 to provide a parallel route to the north of thepresent Line 1;
- construction of a link between Lines 1 and 2 (joining the stations ofPlaza Venezuela and Capuchinos);
- extension of Line 2 from the terminal station at Las Adjuntas to LosTeques.
The proposed routes are shown on the Map on page 45. At the present timefinancing is being sought only for the first of these, i.e., Phase 1 of Line3. The remaining projects represent CAMETRO's long term development proposalsand no action is likely until 1995 at the earliest.
7.84 It is difficult to judge the economic feasibility of any of theseprojects because there is no up to date transport plan for Caracas which canprovide the necessary context for such an evaluation. At a minimum, such aplan should give: (a) an overall forecast growth in travel demand over thenext ten years, and (b) an assessment of how the existing transport networkcould to handle the forecast demand.
7.85 The most likely do nothing' scenario is that as soon as the economybegins to grow again there would be an accompanying increase in car ownershipand use. This in turn would certainly result in the severe traffic congestionwhich Caracas has already experienced. However, such a scenario should not beused as a basis for the economic assessment of metro projects. No attempt hasyet been made to assess what capacity could be provided in surface transport
- 48 -
using a judicious mixture of traffic management and improvements in publictransport. It is likely that such measures could provide enough capacity toallow investment in new metro lines to be delayed for some years. This wouldentail more studies.
7.86 A reference has already been made to the fact that the budgetaryallocations for studies pertain to the new metro line serving the south eastof Caracas. This was not requested by CAMETRO but was inserted at theinsistence of Congress. It was considered premature to undertake engineeringstudies for a route that at the present time serves low density residentialsuburbs. Instead a study will be commissioned to determine how the metronetwork should develop in future. This study is likely to show that increasesin capacity in the central parts of the city produce a much higher return thando new lines in the periphery. Engineering studies would only need to beprepared for parts of the network to be developed in the near future.
7.87 Metrobus Network Expansion. At the present time CAMETRO operates afleet of 125 buses. It is expected to take delivery of 50 new units duringthe first half of 1990 and plans to increase the fleet to a total of 725 busesby 1993. At the present time, the metrobuses are highly subsidized. There isa strong likelihood that the expansion of the metrobus network will make iteven more difficult for the private sector to survive. CAMETRO would likelyfind itself obliged to extend its operations still further as private sectorcompanies go out of business. This would place a very heavy financial burdenon CAMETRO. The Government risks entering into a potentially open-endedcommitment to subsidize a major part of the bus operation of Caracas.
7.88 It is considered that metrobuses should not receive more subsidy fromthe Government than that received by the private sector operators. Such apolicy would require CAMETRO to increase its fares substantially; this in turnwould have an impact on ridership and on the choice of routes where it canoperate successfully. It should be remembered that although CAMETRO hasproven itself competent in the purely operational aspects of its busoperations, it has not been able to get its passenger load factors to asatisfactory level. The attainment of this objective will become still moredifficult if tariffs are increased. As a result it may well be necessary tomake fundamezLtal adjustments to its operating strategy.
7.89 Under the circumstances, it is important to rethink both the pricingand the organization of the metrobus system. A combination of the followingmeasures might be considered: (a) increasing fares; (b) moving away from aflat fare to one which is proportional to either the length of the route or tothe length of each passenger's actual journey; (c) seeking lower cost optionson routes where it is desired to limit fare increases; and (d) putting someservices out to private contract as an alternative to increasing the CAMETROfleet.
7.90 It is recommended that after CAMETRO takes delivery of the 50 buseswhich it currently has on order, no further expansion of the fleet shouldoccur until after the impact of tariff increases has been evaluated.
- 49 -
7.91 To summarize, the conclusions on CAMETRO's proposed investments areas followss
- there is likely to be a strong case for the purchase of additionalrolling stock for Lines 1 and 2;
- at present fare levels it will not be possible for CAMETRO to earn acommercially acceptable rate of return on its proposed investment inphase 1 of a new Line 3;
- it is difficult to assess the economic justification for phase 1 ofLine 3 in the absence of an overall study of transport needs ofCaracas over, say, the next ten years;
- OAMETRO should limit its program of expansion of the metrobus fleetuntil it is sure that they can be operated with subsidies no greaterthan those received by the private sector operators (see para. 7.87);
- the budget for studies should not be used for detailed engineeringinvestigations until a logical program of long term development ofthe network has been drawn up (see para. 7.88).
It should be noted that the commercial viability of CAMETRO's proposedinvestments would be enhanced if fares were increased. It is likely that thepoor could to some extent be shielded from the eff3ct of such an increase ifthe fare structure were flattened.
Chapter 8
Public Expenditures in Agriculture
A. Background
Structure of Agriculture in Venezuela I
8.1. Agriculture and agroindustry contribute 15Z-20? of non-petroleum GDP andsome 15? of non-petroleum exports in 1988. Though the rural population (2.4million) accounts for only 13? total population, Venezuela has a strongagricultural tradition. The potential for expanding Venezuela's agricultureis underscored by the abundance of land resources. Of the country's 92million ha., about one-half is suitable for agriculture but only 31 millionha. are being used. Climatic and physical characteristics of the country addto the productive potential. The country lies within the tropical zone buthas widely varying altitudes, temperatures and rainfall and a long coast lirne.
8.2 Given the abundance of land, an extensive form of agriculturaldevelopment has taken place, resulting in a relatively small number ofholdings, about 400,000, with an average farm size of about 80 ha. It shouldbe noted, however, that the size distribution is highly skewed. Some 60? ofthe farms are 10 ha. or smaller; together, these account for only 2? of totalfarm area. Small holdings are concentrated in hilly Andean regions andproduce coffee, cacao and vegetables. In the irrigated areas, small holderscommonly cultivate rice. Large farmers (those with farms of over 500 ha.)mostly produce livestock.
Institutional Framework
8.3 The public interventions in the agriculture sector revolve around theMinistry of Agriculture (MAC), the Ministry of Environment and RenewableResources (MARNR), and their respective autonomous agencies.
8.4 MAC has overall responsibility for sectoral policy development andplanning. It is also responsible for directly providing support services andproductive infrastructure, inter alia, research and extension, irrigation,plant and animal health. Complementing the Ministry in the provision ofagricultural support services are a number of autonomous agencies that includethe following:
- National Agrarian Institute (IAN), responsible for roral developmentin agrarian reform areas;
- National Fund for Agricultural Research (FONAIAP);
For detailI, see World Bonk, Venezuela: Agricultural Sector Review (Report No. 0839-VE), GreenCover Report, March 19, 1990.
- 51 -
- Agricultural Training Institute (INAGRO);- Foundation for Training and Applied Research for the Agrarian Reform
(CIARA);- Agricultural Storage Company (ADAGRO), responsible for storage of
surplus commodities;- Agricultural Commodities Marketing and Export Company (COMEXAGRO),
responsible for buying and selling surplus commodities and forimporting on behalf of the Government; and
- National Coffee Fund (FONCAFE) and National Cacao Fund (FONCACAO) andFruit Development Fund (FONDEFRU), responsible for the extension andmarketing of these commodities.
FONCAFE and FONCACAO also provide credit and exercise monopoly over the exportof coffee and cacao. In addition, there are three financial institutions,i.e., the Agricultural and Livestock Credit Institute (ICAP) which providecredit to small producers; the Agricultural Credit Fund (FCA), a second-tierbank providing long-term agricultural credit; and the Agricultural DevelopmentBank (BANDAGRO) which lends primarily to medivm- and larger-scale farmers.
8.5 MARNR is responsible for the construction and management of multipurposedams that can be used for irrigation. This ministry also oversees thedevelopment and management of the forestry sector, through the VenezuelanAutonomous Forestry Service (SAFORVEN) and the National Forestry Council(CONFAFOR). The National Reforestation Company (CONARE) is a public sectotentity responsible for plantations and is authorized to enter into jointventures with private enterprises and other agencies of the Government.
B. Sector Policies and Performance
8.6 Venezuela's agricultural policies have shifted frequently in the past,reflecting the philosophy and political platforms of the succesiveadministrations. In general, however, and certainly up to 1984, the policieswere aimed at maintaining low prices for locally produced agricultural goods.This had the effect of lowering profitability of agricultural andagroindustrial activities and reducing the area under cultivation. Themacroeconomic policy of controlling the exchange rate at overvalued levelsfurther depressed the sector.
8.7 Then, during the Lusinchi administration (1984-1988), agriculturalgrowth became a key policy objective. The Government's strategy was toincrease substantially budgetary allocations for productive infrastructure andsupport services while strictly controlling imports and exports ofagricultural products. The Government tried simultaneously to maintain highproducer prices/profits and keep consumer prices low and stable. The keyassumptions underlying this strategy was that (a) farmers would respond to theimproved services and price/profit incentives by increasing supply; and (b)the increased supply of agricultural commodities would lower prices toconsumers even without (or with reduced) access to imports or the salutaryeffects of external competition. The critical element was the availability ofbudgetary resources in sufficient amounts to finance increased supportservices and to provide the necessary subsidies to maintain price/profit
- 52 -
incentives. These policies entailed enormous subsidies. In 1987 alone,agricultural subsidies amounted to Bs.13.8 billion, equivalent to one-third ofagricultural value-added and 2% of GDP.
8.8 These policies also shielded agriculture and agroindustries frominternational competition. By 1988, 30% of agroindustrial tariff positionswere prohibited from import, 402 required licenses, and another 122 requiredhealth/sanitary permits. Only 9% of tariff items were freely importable.Similarly, 202 of agricultural items were prohibited from import, 382 requiredprior licenses and another 36% required health permits, leaving only 5Z freelyimportable. In this setting, the Government determined the domestic prices ofagricultural and agroindustrial products by manipulating licensing, foreignexchange allocations and by directly fixing prices.
8.9 Not surprisingly, during 1984-1988, the agricultural sector achieved anaverage annual growth rate of 6.32 during 1984-1988, significantly above theaverage annual GDP growth of 4.2Z. Accompanying this growth, self-sufficiencyalso increased. Agricultural imports dropped by about 502 during this period,and agricultural exports also remained low. Even the traditional exports ofcoffee and cocoa fell, and Venezuela did not meet its quota underinternational agreements. Furthermore, the price control and multipleexchange rate system resulted in large quantities of food and agriculturalinputs being smuggled out of the country. It is estimated that as much as 20-35% of the consumption of products such as fertilizers, meat, poultry, edibleoils, powdered milk and corn meal had been sold as contraband during thisperiod.
8.10 Clearly, this agricultural development strategy was not sustainable. Theagricultural trade and pricing policies pursued during the period resulted inan expansion of agricultural output based on subsidies and administrativediscretion rather than sound economic fundamentals. The allocation ofresources favored the production of import-competing crops (sorghum, maize,some oil seeds) in which the country did not have a clear advantage anddiscriminated against crops, such as rice, which were potentially exportable.The efforts of the Government to expand productive capacity through increasedbudgetary spending also proved ineffective. While agricultural outputexpanded more rapidly than the overall economy, the expansion was undertakenlargely by bringing marginal land into production and by intensive use orfertilizers.
8.11 The administration of President Carlos Andres Perez which took office inFebruary 1989 adopted a package of economic measures aimed at redressingmacroeconomic and external imbalances, including trade liberalization,reducing regulations and in general allowing for a greater influence of marketforces. In the context of agriculture, the unification and floating of theexchange rate was probably the single most important measure for reducing thedistortions that had built up over the years. The new Government also tookseveral measures directly affecting the agricultural/food sector: (a) increasein fertilizer prices to the public, thereby reducing the subsidy level frommore than 902 of the cost of the product to about 50Z; (b) elimination ofsubsidies for corn meal and animal feed, leaving powdered milk as the onlyfood product subsidized; (c) phased removal of quantitative restrictions; (d)
- 53 -
progressive reduction and simplification of tariffs on the importation ofmanufactured products; (e) elimination of tariff exoneration for manufacturedproducts; (f) limiting the coverage of quantitative import restrictions to nomore than 152 of domestically manufactured products (reducing to 52 bySeptember 1990); (g) reduction of maximum ad-valorem tariffs for all importsto 50% by March 1990, and 10Z-20% by 1993; and (h) linking agriculturalinterest rates to the market by setting commercial bank rates on agriculturalloans at 7% points below each bank's general lending rate.
8.12 These policy reforms in general, and the unification of the exchangerate in particular, have begun to yield results with resources starting to bereallocated towards those tradeable commodities which can be producedrelatively efficiently in the country. Productivity increases have beenobserved in 1989 in commodities such as rice, cotton and some oil seeds.
C. Public Expenditure Program
8.13 One of the limiting factors of agricultural development in Venezuela isthe relatively low productivity of the sector. Despite the unconstrainedresource environment in the 1980s, it appears that public sector expendituresin agriculture have not helped to increase the efficiency of the productiveinfrastructure or significantly improve agricultural productivity. Thecrucial questions is whether low productive results from inadequate budgetaryallocations to the sector, innapropiate selection of investment projects, orpoor implementation capacity on the part of sector institutions. To date, nodetailed analysis of agricultural public sector expenditures has been done.The following paragraphs attempt to shed some light on the level, trend andcomposition of sector expenditures, as well as on the efficiency ofexpenditures and the institutional capacity of the agencies involved. Thesection also reviews the proposed investment program 1990-1993 and makesrecommendations on those proposals.
Level and Trends in Public Sector Agricultural Expenditure, 1979-1989
8.14. The Central Government expenditure in the agricultural sector, throughthe Ministry of Agriculture and Livestock (MAC), semi-autonomous entities("organismos adscritos") and other entities increased by an average of about10% per year in nominal terms but declined by almost 6% per annum in realterms (using the GDP deflator) during 1984-1988. Furthermore, the share ofagriculture in public sector expenditure declined from 6.1% in 1979 to 4.2% in1988 (and to 2.1X in 1989 on the basis of the budget law approved by Congress,i.e. not including the additional appropriations made during the year). Over1984-1988, the growth rate of agricultural value added was 6.3% per annum inreal terms. The share of agriculture in total GDP increased from about 6.9%in 1984 to 7.31 in 1986 but declined slightly in 1987 and 1988. However, asmentioned earlier, there were substantial subsidies--as high as 2% of GDP.
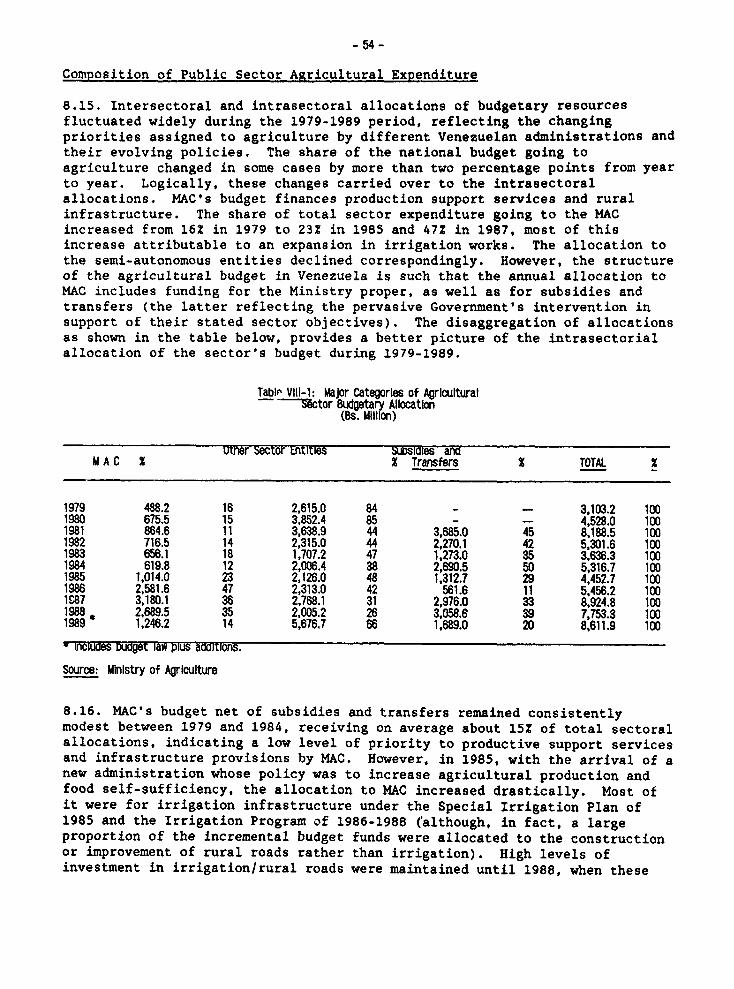
- 54-
Composition of Public Sector Agricultural Expenditure
8.15. Intersectoral and intrasectoral allocations of budgetary resourcesfluctuated widely during the 1979-1989 period, reflecting the changingpriorities assigned to agriculture by different Venezuelan administrations andtheir evolving policies. The share of the national budget going toagriculture changed in some cases by more than two percentage points from yearto year. Logically, these changes carried over to the intrasectoralallocations. MAC's budget finances production support services and ruralinfrastructure. The share of total sector expenditure going to the MACincreased from 16S in 1979 to 23X in 1985 and 47Z in 1987. most of thisincrease attributable to an expansion in irrigation works. The allocation tothe semi-autonomous entities declined correspondingly. However, the structureof the agricultural budget in Venezuela is such that the annual allocation toMAC includes funding for the Ministry proper, as well as for subsidies andtransfers (the latter reflecting the pervasive Government's intervention insupport of their stated sector objectives). The disaggregation of allocationsas shown in the table below, provides a better picture of the intrasectorialallocation of the sector's budget during 1979-1989.
Tabi" VlI-1: Major Categories of Agriculturalsctor Budgetary Allocation
(Bs. Miliont)
utner sector itities nuIs:aMes anaM A C X X Transfers X TOTAL X
1979 488.2 16 2,615.0 84 - - 3,103.2 1001980 675.5 15 3,852.4 85 - - 4,528.0 1001981 864.6 11 3,638.9 44 3,685.0 45 8,188.5 1001982 716.5 14 2,315.0 44 2,270.1 42 5,301.6 1001983 656.1 18 1,707.2 47 1,273.0 35 3,636.3 1001984 619.8 12 2,006.4 38 2,690.5 50 5,316.7 1001985 1,014.0 23 2,126.0 48 1,312.7 29 4,452.7 1001986 2,581.6 47 2,313.0 42 561.6 11 5,456.2 1001C87 3,180.1 38 2,768.1 31 2,976.0 33 8,924.8 1001988 2,689.5 35 2,005.2 26 3,058.6 39 7,753.3 1001989 1,246.2 14 5,676.7 66 1,689.0 20 8,611.9 100
- inciLaes ouget iaw piLs awitions.
Source: Ministry of Agriculture
8.16. MAC's budget net of subsidies and transfers remained consistentlymodest between 1979 and 1984, receiving on average about 15? of total sectoralallocations, indicating a low level of priority to productive support servicesand infrastructure provisions by MAC. However, in 1985, with the arrival of anew administration whose policy was to increase agricultural production andfood self-sufficiency, the allocation to MAC increased drastically. Most ofit were for irrigation infrastructure under the Special Irrigation Plan of1985 and the Irrigation Program of 1986-1988 (although, in fact, a largeproportion of the incremental budget funds were allocated to the constructionor improvement of rural roads rather than irrigation). High levels ofinvestment in irrigationlrural roads were maintained until 1988, when these
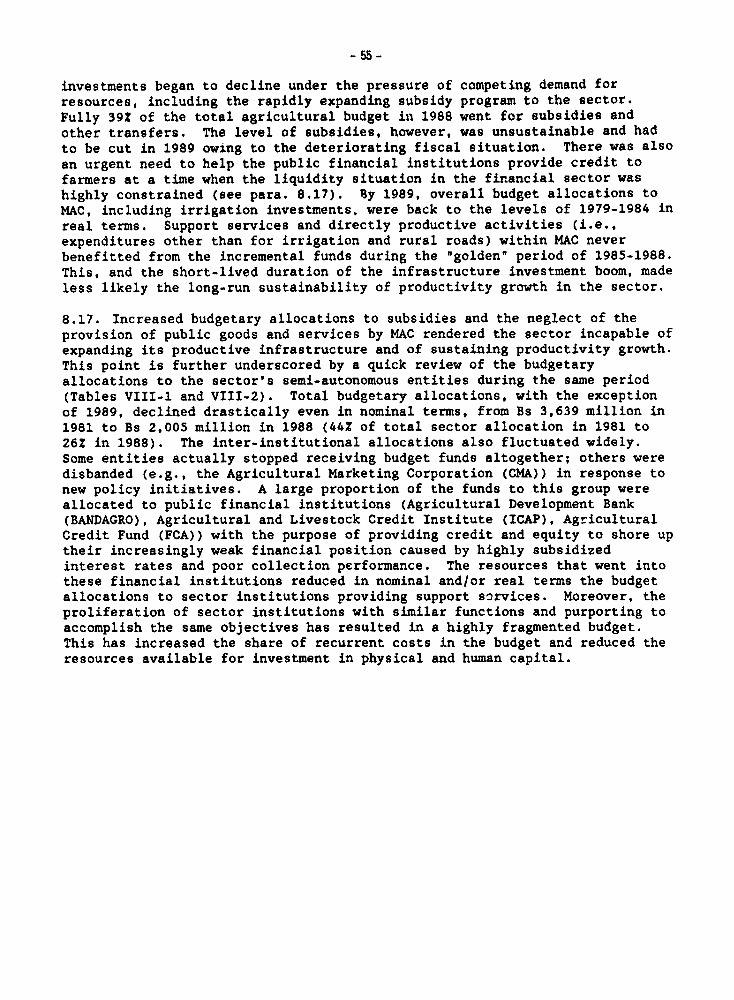
-55 -
investments began to decline under the pressure of competing demand forresources, including the rapidly expanding subsidy program to the sector.Fully 392 of the total agricultural budget in 1988 went for subsidies andother transfers. The level of subsidies, however, was unsustainable and hadto be cut in 1989 owing to the deteriorating fiscal situation. There was alsoan urgent need to help the public financial institutions provide credit tofarmers at a time when the liquidity situation in the financial sector washighly constrained (see para. 8.17). By 1989, overall budget allocations toMAC, including irrigation investments, were back to the levels of 1979-1984 inreal terms. Support services and directly productive activities (i.e..expenditures other than for irrigation and rural roads) within MAC neverbenefitted from the incremental funds during the "golden' period of 1985-1988.This, and the short-lived duration of the infrastructure investment boom, madeless likely the long-run sustainability of productivity growth in the sector.
8.17. Increased budgetary allocations to subsidies and the neglect of theprovision of public goods and services by MAC rendered the sector incapable ofexpanding its productive infrastructure and of sustaining productivity growth.This point is further underscored by a quick review of the budgetaryallocations to the sector's semi-autonomous entities during the same period(Tables VIII-1 and VIII-2). Total budgetary allocations, with the exceptionof 1989, declined drastically even in nominal terms, from Bs 3,639 million in1981 to Bs 2,005 million in 1988 (442 of total sector allocation in 1981 to26? in 1988). The inter-institutional allocations also fluctuated widely.Some entities actually stopped receiving budget funds altogether; others weredisbanded (e.g., the Agricultural Marketing Corporation (CMA)) in response tonew policy initiatives. A large proportion of the funds to this group wereallocated to public financial institutions (Agricultural Development Bank(BANDAGRO), Agricultural and Livestock Credit Institute (ICAP), AgriculturalCredit Fund (FCA)) with the purpose of providing credit and equity to shore uptheir increasingly weak financial position caused by highly subsidizedinterest rates and poor collection performance. The resources that went intothese financial institutions reduced in nominal and/or real terms the budgetallocations to sector institutions providing support sorvices. Moreover, theproliferation of sector institutions with similar functions and purporting toaccomplish the same objectives has resulted in a highly fragmented budget.This has increased the share of recurrent costs in the budget and reduced theresources available for investment in physical and human capital.
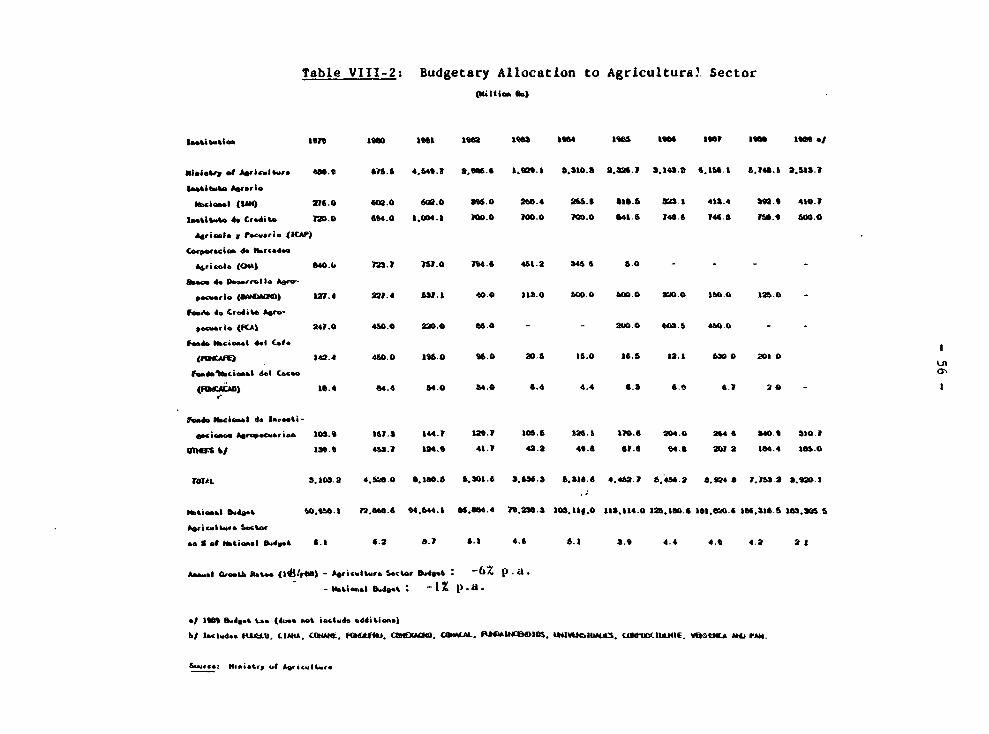
Table VIII-2: Budgetary Allocation to Agricultural Sector
(H1i~ I Is)
1""Satica son im Oft I%is i
,,,oiX ebr eo el A& ie 1Wrs s *
mbeiam-. (1MG) 216.0 603.0 60.o0 316.0 260.4 265. 6 46.6 NA.a 413.4 392.e 410.1
I1.5sk. 4. Cwdi%. 120.0 4.0 1,4.01 10.0 100.0 MA0.0 41.6 140.6 144.6 Isc., 0oo.o
CArp"Oraiefa de IsC.40
44Srio.l (04k) GWA. M..1 151.0 .7 6 461.2 346 * 6.0 - - 5. 0
*ar ar,a dlm) 1.4 :211.4 531.5 40.0 113.0 50.0 M0o.* IW0 5.O 125.0
fewb 4. Cg.di%b be'.-
V.c.. la (KA) 241.0 450.0 226.0 66.0 - - 2W.0 603.5 45.0
f064, Gbcio*l 441 N..
142.4 450.0 Is6.0 6.0 20.6 15.0 l6.s 1..1 O w 0 201 0
famd.ibriw 4.1 Cocoa CT
(1RCAf) 16.4 04.4 54.0 34.0 6.4 4.4 6. 6.0 6.1 20 a
t ldo I,i
ci_eo.e AO ib 105.0 161.5 144.1 .9.1 106.6 D.a 10.6 20O4.0 264 6 340.6 310.1
am"S it* a13.6 43.7 14. 41.1 42.2 41.6 61.6 W4.e 2W 2 a 4.4 166.0
TWiAL 3.103.2 4.53W. 0 6.5.5.6 5,301.6 Z.&M6.3 6.16.6 .4W42.7 6S.45.2 S.24 * X.M.3 3.mWt.I
bki...I b.da4k WSW.1 12.6a.6 64.544.1 85.-6.4.4 16.230.) 50.114.0 113.1.14.0 125.1.60.6 10i.M.6 30.6.46.5 .03.206.
ASficosto- Ssotor
*. of #tgam.l Isg.*& 6.5 4.2 5.1 6.1 4.6 6.1 3.6 4.4 4.6 44. 2 A
b. 1 ^Oresi no4.. (54k"30 - IaeewI. S". 1 .4e6. -6% p.a.-Wm. Obiu- be.4 : '. -12 p . a.
.} 1606 S- 4L. ("a.. not imclw4o %dditimi.
b1 1.. lo.. .. tiA4J. LIAM. CC*e. fkW#e.UG. CtMl)U1. CUSM.. 8141AU45CI0*.M5.VUI4". UItIE, VWMA AND 1MG.
5_a..r. 3-SOistrg of ArsC4.i ''e
- 57 -
Budget Allocation by Type of Expenditure
8.18. The conclusions in the previous section are supported by an analysis ofthe 1989 agriculture sector budget by type of expenditure. Table VIII-3 showsthat of the total budget allocation for the sector of Bs 8,612 million in1989, 34Z were for current expenditures, 201 for subsidies and transfers (e.g.subsidies to fertilizer and transfers to a large number of programs), and 352for financial 'investments" (direct credit subsidies and equity support topublic sector agricultural financial institutions). Only 11% were spent inphysical capital investment.
Table VIII-3: Agriculture by Type of Expenditure 1989
Type of MAC X Other X SubsIdles X Total X
Expenditure Entitles & Transfers
Current Expenditure 1,126.7 90 1,785.9 31 - 2,912.6 34
Investment Expenditure 119.6 10 8386.9 15 - 956.5 11
Subsidies & Transfer - - - 1,689.0 100 1,689.0 20
Financial Investments - - 3,054.0 54 - - 3,054.0 35
GRAND TOTAL 1,246.3 100 5,676.8 100 1,689.0 100 8,612.1 100
Source: MAC.
8.19. The breakdown of the 1989 budget by type of expenditure does notdepart from historical trends (despite the economic crisis and ensuing fiscalrestraint). MAC's expenditure pattern during the period 1979-1989(Table VIII-4) confirms that while current expenditures have not fluctuatedgreatly, investment expenditures have traditionally borne the brunt of policyand priority changes and that with the exception of the 1986-1988 period,physical capital investment has represented a small share of total expenditureof MAC. However, the definitJon of investment expenditure in Venezuela isvery narrow, including only physical capital investment. It excludes humancapital formation which in the case of the agricultural sector is important(for example, in the case of training for research staff, extension agents,etc.). Nevertheless, the evidence clearly supports the view that totalinvestment in the sector is inadequate and that the long-term effects of theinsufficient budgetary allocations for physical capital investment are likelyto be detrimental.
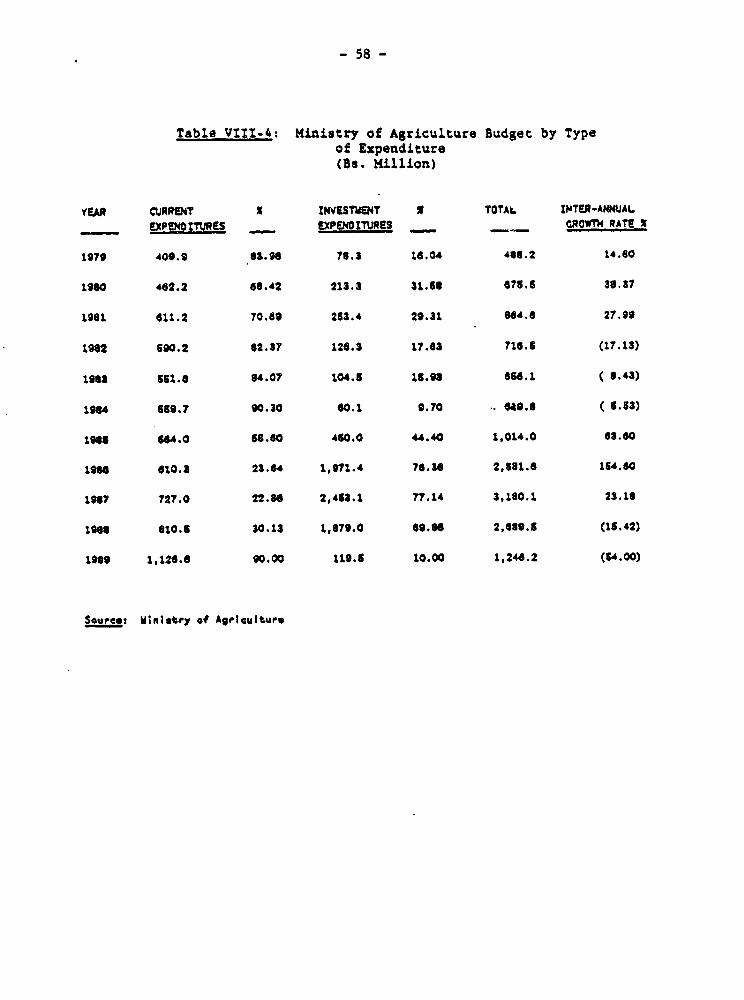
- 58 -
Table V111-4: Hinistry of Agriculture Budget by Typeof Expenditure(Bs. million)
YEhR CURRENT x INVESTMENT x TOTAL INTER-ANNUAL- ExPeNOI URLS - EXPENOTURES _ _ CROWTh RATM X
1979 400.9 63.96 78.3 16.04 408.2 14.60
1980 462.2 48.42 213.3 31.6C 675.1 38.37
1961 611.2 70.69 253.4 29.31 864.6 27.99
1982 560.2 62.37 126.3 17.63 716.6 (17.13)
1963 151.0 64.07 104.5 1S.9" 666.1 ( 6.43)
1964 659.7 90.30 00.1 9.70 *. $40.8 ( 6.63)
M91e 644.0 s8.60 460.0 44.40 1,014.0 63.60
l966 610.3 23.64 1,971.4 76.34 2,581.0 164.60
196" 727.0 22.66 2,453.1 77.14 3,180.1 23.18
t96 610.6 30.13 1,679.0 69.66 2,669.6 (15.42)
1"99 1,126.6 90.00 119.1 10.00 1,244.2 (64.00)
Sourest Ministry of Agriculturo
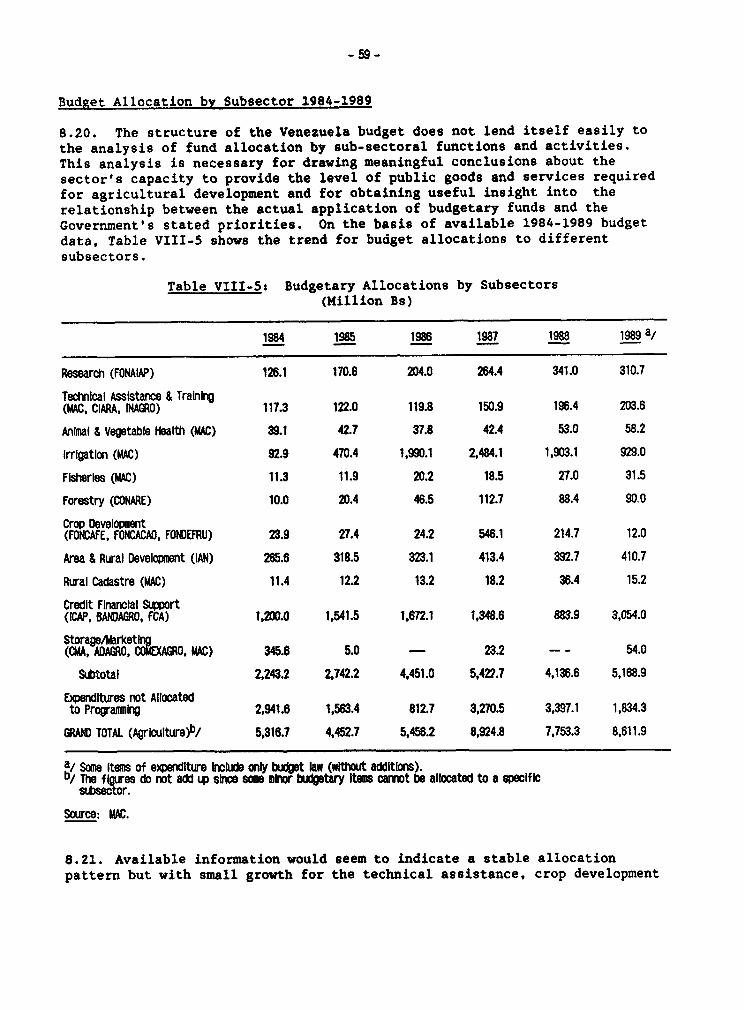
- 59-
Budget Allocation bX Subsector 1984-1989
8.20. The structure of the Venezuela budget does not lend itself easily tothe analysis of fund allocation by sub-sectoral functions and activities.This analysis is necessary for drawing meaningful conclusions about thesector's capacity to provide the level of public goods and services requiredfor agricultural development and for obtaining useful insight into therelationship between the actual application of budgetary funds and theGovernment's stated priorities. On the basis of available 1984-1989 budgetdata, Table VIII-5 shows the trend for budget allocations to differentsubsectors.
Table VIII-5 Budgetary Allocations by Subsectors(Million Bs)
1984 1985 1986 1987 1988 1989 a/
Research (FONAIAP) 126.1 170.6 204.0 264.4 341.0 310.7
Technical Assistance & Training(MAC, CIARA, INAGRO) 117.3 122.0 119.8 150.9 196.4 203.6
Anhial & Vegetable Health (MAC) 39.1 42.7 37.8 42.4 53.0 58.2
Irrlgation (MAC) 92.9 470.4 1,990.1 2,484.1 1,903.1 929.0
Fisheries (MAC) 11.3 11.9 20.2 18.5 27.0 31.5
Forestry (CONARE) 10.0 20.4 48.5 112.7 88.4 90.0
Crop Development(FONCAFE, FONCACAO, FONDEFRU) 23.9 27.4 24.2 548.1 214.7 12.0
Area & Rural Development (IAN) 265.6 318.5 323.1 413.4 392.7 410.7
Rural Cadastre (MAC) 11.4 12.2 13.2 18.2 36.4 15.2
Credit Financial &Wport((CAP, BANDAGRO, FCA) 1,200.0 1,541.5 1,672.1 1,348.6 883.9 3,054.0
Storage/Markethm(CMA, ADAGRO, COWLXGRO, MAC) 345.6 5.0 - 23.2 -- 54.0
Subtotal 2,243.2 2,742.2 4,451.0 5,422.7 4,136.6 5,168.9
Expenditures not Allocatedto Programmng 2,941.6 1,563.4 812.7 3,270.5 3,397.1 1,834.3
GRAWM TOTAL (Agriculture)b/ 5,316.7 4,452.7 5,456.2 8,924.8 7,753.3 8,611.9
a/ Some Items of ewenditure Incde only bWdet law (without addtlons).b,/ The flUres do not add up scW some ubior budgetary Itens camot be allocated to a specific
sbsector.
Source: MAC.
8.21. Available information would seem to indicate a stable allocationpattern but with small growth for the technical assistance, crop development
-60 -
and forestry. Research and irrigation have received by far the largest sharesof incremental budget funds, the former with the support of an IDB loan.(Forestry also received external support accounting for he considerableincrease in budget funds in absolute terms). The sub-sectors from whichbudget funds have been diverted (at least when comparing 1984 and 1988) areprimarily credit/financial support and storage/marketing. By 1988, however,fully 47Z of the sector allocations were still budgeted for subsidie/transfersnot in direct support of the provision of public sector goods and services.
8.22. Our preliminary conclusion from the data is that, in general, theoverall budgetary allocations to each subsector, particularly in the area ofirrigation infrastructure, research and technology transfer, appear to besatisfactory in absolute terms and do not include any major white elephants.However, the level of execution has been low, suggesting that attention mustbe paid in the future to strengthening the institutional capacity to design,evaluate and implement projects and programs. Much more work would berequired to substantiate the subsector expenditure trends suggested by the1984-88 data. For purposes of the limited analysis undertaken here, all thefunds are considered equally valuable in terms of their effects onstrengthening the services provided. But it is obvious that a bolivar spenton technical assistance or research may have a very different effect on thesubsector depending on whether it is spent in the field by an extension agent,transferring technology, or by a bureaucrat in headquarters.
Sufficiency of Budgetary Allocations
8.23. The conclusion with respect to the inadequacy of budgetary allocations,however, skirts around two critical questions. First, one needs to askwhether the budget allocations to the sector are demand- or supply-driven,i.e., whether the allocation reflects the absorptive capacity of the sector orthe supply limitations imposed by external factors such as competition withother sectors for limited budgetary resources. Second, it is necessary to askwhat should the appropriate level of funding should be for the existinginstitutional environment.
8.24. The hypothesis of supply-side budgetary limitations could be discountedon the basis of the declared policy intentions of past administrations.Certainly since 1984, the stated policy of the Government, as reflected inbudgetary allocations, has been to increase, in real terms, the volume ofresources going to agriculture (although its share of total national budgetdeclined slightly) and the volume of funds for physical capital investment(i.e., irrigation). It is also well known that the intersectoral allocationof resources in Venezuela are not made on the basis of the rate of returnanalysis. Therefore, it is unlikely, that whatever budget deprivation (ifany) that the sector may have suffered resulted from rational budgetarydecision-making. But the aggregated nature of the data available and thelimited knowledge of the sector provides no basis to support or refute thehypothesis of supply-side limitations. And without further information on theabsorptive capacity of the sector (see below), it is impossible to determinewhat should be the appropriate level of budget allocations to the sector.
- 61 -
8.25. One should rather test the alternative hypothesis that, given thepresent institutional environment, the sector could effectively absorb moreresources. The efficiency of the use of additional resources is, of course, alarge issue that would require more detailed field analysis. Available dataon actual and committed (versus budgeted) sector expenditure points to seriousabsorptive capacity limitations in the sector. Total execution of recurrentcost expenditures was acceptable, ranging from 872 in 1987 to 962 in 1986,Not unexpectedly, execution was 100% for subsidies and transfers. However,the figures for execution of physical capital investments, particularly civilworks in the irrigation and rural roads subsectors, were very low; in 1985,actual expenditures and actual committments accounted for only 9X of budgetedfunds. The year 1985 corresponded to the first year of the big expansion ofinvestment in irrigation and the lud figure could be attributed to delays inengineering design and contracting and other gearing up difficulties.However, even by 1988, actual expenditures plus commitments were only 35Z oftotal amounts budgeted. Available evidence for 1989 would seem to indicatethat the record of physical capital investment execution by the semi-autonomous entities has not been good either (although more analysis would berequired to confirm this view). The results appear to indicate seriousimplementing deficiencies on the part of most of the sector's institutions andthe need for institutional strengthening before budgetary allocations can besignificantly increased either from internal or external sources.
Level of Self-Financing
8.26. In general, most of the semi-autonomous public sector institutions inthe sector are heavily dependent on budget allocations for the financing oftheir operations with limited funds originating from their own revenues (TableVIII-6). Only the storage/marketing public sector entities (ADAGRO,COMEXAGRO) are financially self-sufficient (but provide little general fiscalrevenue). Available field evidence suggests that FONAIAP, the researchinstitution could recover a much larger proportion of its costs through thesale of its services and products (including seeds). The financial situationof the Commodity Funds (coffee, cacao, fruits) should also be improvedsubstantially so that they can be independent of budgetary support (or nearlyso). The area where the greatest improvement should occur is in irrigation,where the Government recovers no capital costs and only about 10% of operationand maintenance costs. This is one of the areas recommended for furtherstudy.
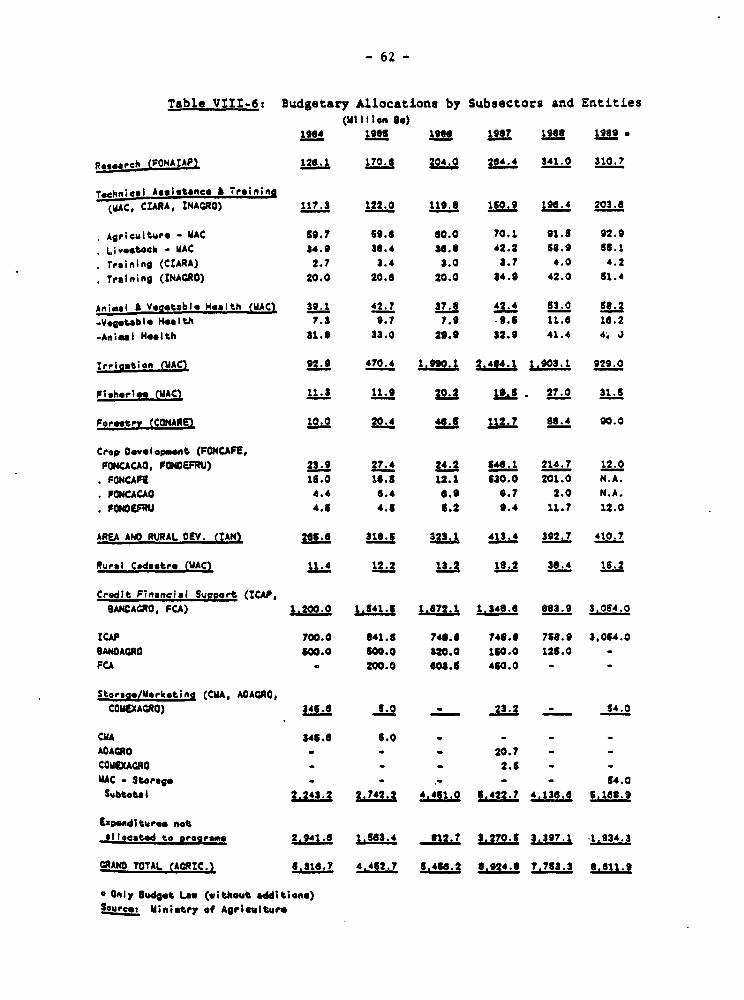
- 62 -
Table VtII-6: Budgetary Allocations by Subsectors and Entities(MillIon so)
1964 t9ols E ;1967 l968 l99 s
Res"ar l (FONA?AP 126.1 170.0 204.0 204.4 341.0 310.7
.echn;cei Aggiatflce * Tra;ninp(MAC, CLARA, INACRO) 117.3 122.0 119.6 160.9 190.4 203.6
AgrICultUre - MAC 60.7 69.6 00.0 70.1 91.6 92.9. vst.cCk - MAC 34.9 36.4 30.6 42.2 61.9 65.1
rrgining (ClARA) 2.7 3.4 3.0 3.7 4.0 4.2
Trfinirg (INACRO) 20.0 20.6 20.0 34.9 42.0 61.4
Animal A Vegetable Health (MAC) 39.1 42.7 37.6 42.4 63.0 66.2.Vegetable Health 7.3 0.7 7.9 .9.6 11.6 10.2-Ansmal Helth 31.6 33.0 29.9 32.9 41.4 4. 03
Irrigation (MAC) 92.9 470.4 1-990.1 2.404.1 1.903.1 929.0
Fisheriee (MAC) 11.3 11.9 20.2 Z - 27.0 31.6
Foroetry (CONARE) 10.0 20.4 46.6 X12.t 60.4 90.0
Cro-op DoeapIemt (FONCAFE,FONCACAO, FOMOEPRU) 23.9 27.4 34,3 S46.1 214.7 12.0FONCAF! 15.0 16.6t 12.1 S30.0 201.0 N.A.PONCACAO 4.4 0.4 0.9 4.7 2.0 N.A.
. FONOEFRU 4.6 4.5 6.2 9.4 11.7 12.0
AREA ANO RURAL OEV. (TANI 2f5.6 316.5 323. 4L3.4 392.7 410.7
Rural Csdastre (MAC) 11.4 12.2 16.2 36.4 15.2
Credit Financial Suooort (ZCAP,OANCACRO, FCA) 1,200.0 1.541.5 1.672.1 1.348.S 063.9 3.064.0
ICAP 700.0 41.5 740.6 748.6 758.9 3,054.0
ANDOACRO 500.0 010.0 820.0 160.0 126.0 -
FCA - 200.0 60.6 460.0 - -
Storae*/varketind (CUA. ADACRO,
COMEXACRO) 346 6. * 23.2 - 64.0
CUA 346.6 5.0 - - -
AOACRO - - - 20.7 -_COMEXACRO - - 2.6 - -
MAC - Storag - -4.0
Subtotal 2.243.2 2.742.2 4.461.0 ,.422.? 4.130.6 5.168.9
Expenditures not*llocated to groorama 2,941.S 1.583.4 6t2.7 3.2t70. 3,397.1 -1.34.3
CRAND TOTAL (ACRIC.) S3186.t 4.452.7 5.4SJ.2 S.924.S1t 7. t3.3 0.611.9
* Only Budget Law (without aditionee)SoUrUe: Ministry of AgricUlture
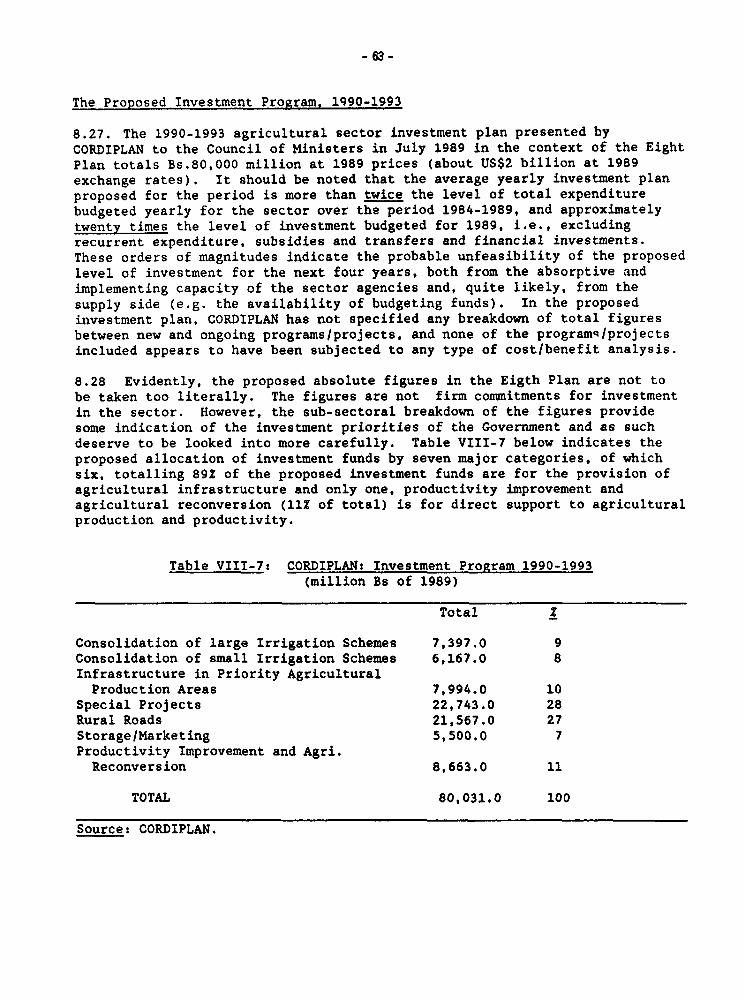
- 63 -
The Proposed Investment Program, 1990-1993
8.27. The 1990-1993 agricultural sector investment plan presented byCORDIPLAN to the Council of Ministers in July 1989 in the context of the EightPlan totals Bs.80,000 million at 1989 prices (about US$2 billion at 1989exchange rates). It should be noted that the average yearly investment planproposed for the period is more than twice the level of total expenditurebudgeted yearly for the sector over the period 1984-1989, and approximatelytwenty times the level of investment budgeted for 1989, i.e., excludingrecurrent expenditure, subsidies and transfers and financial investments.These orders of magnitudes indicate the probable unfeasibility of the proposedlevel of investment for the next four years, both from the absorptive andimplementing capacity of the sector agencies and, quite likely, from thesupply side (e.g. the availability of budgeting funds). In the proposedinvestment plan, CORDIPLAN has not specified any breakdown of total figuresbetween new and ongoing programs/projects, and none of the programqIprojectsincluded appears to have been subjected to any type of cost/benefit analysis.
8.28 Evidently, the proposed absolute figures in the Eigth Plan are not tobe taken too literally. The figures are not firm commitments for investmentin the sector. However, the sub-sectoral breakdown of the figures providesome indication of the investment priorities of the Government and as suchdeserve to be looked into more carefully. Table VIII-7 below indicates theproposed allocation of investment funds by seven major categories, of whichsix, totalling 89Z of the proposed investment funds are for the provision ofagricultural infrastructure and only one, productivity improvement andagricultural reconversion (11? of total) is for direct support to agriculturalproduction and productivity.
Table VIII-7: CORDIPLAN: Investment Program 1990-1993(million Bs of 1989)
Total Z
Consolidation of large Irrigation Schemes 7,397.0 9Consolidation of small Irrigation Schemes 6,167.0 8Infrastructure in Priority AgriculturalProduction Areas 7,994.0 10
Special Projects 22,743.0 28Rural Roads 21,567.0 27Storage/Marketing 5,500.0 7Productivity Improvement and Agri.Reconversion 8,663.0 11
TOTAL 80,031.0 100
Source: CORDIPLAN.
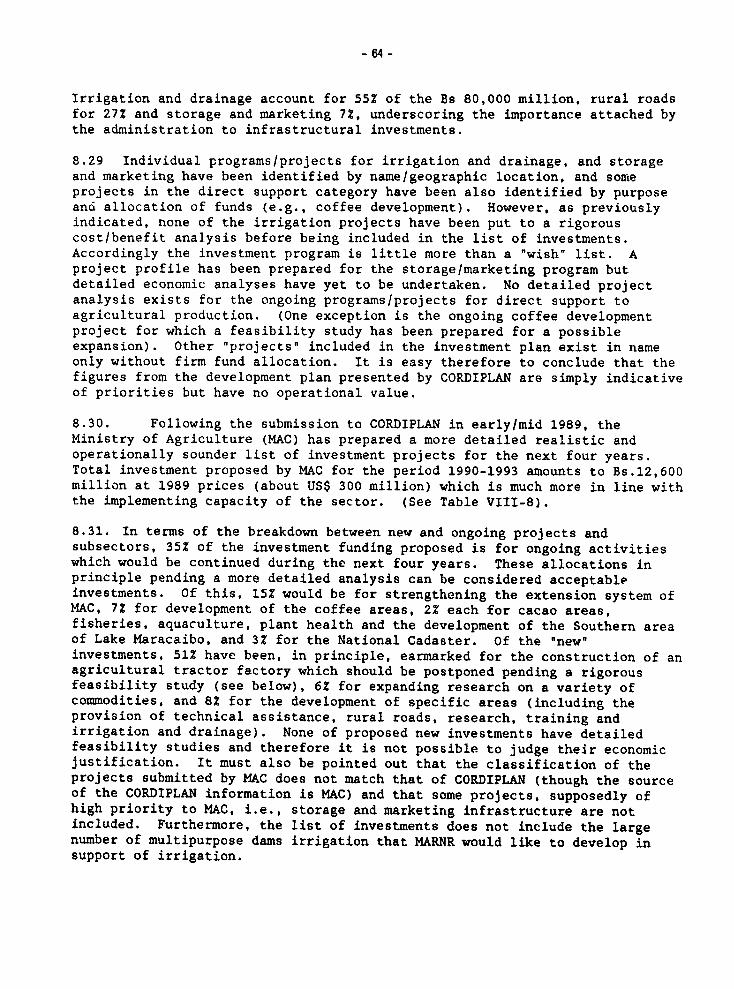
- 64 -
Irrigation and drainage account for 55Z of the Bs 80,000 million, rural roadsfor 27? and storage and marketing 72, underscoring the importance attached bythe administration to infrastructural investments.
8.29 Individual programs/projects for irrigation and drainage, and storageand marketing have been identified by name/geographic location, and someprojects in the direct support category have been also identified by purposeand allocation of funds (e.g., coffee development). However, as previouslyindicated, none of the irrigation projects have been put to a rigorouscost/benefit analysis before being included in the list of investments.Accordingly the investment program is little more than a "wish" list. Aproject profile has been prepared for the storage/marketing program butdetailed economic analyses have yet to be undertaken. No detailed projectanalysis exists for the ongoing programs/projects for direct support toagricultural production. (One exception is the ongoing coffee developmentproject for which a feasibility study has been prepared for a possibleexpansion). Other "projects' included in the investment plan exist in nameonly without firm fund allocation. It is easy therefore to conclude that thefigures from the development plan presented by CORDIPLAN are simply indicativeof priorities but have no operational value.
8.30. Following the submission to CORDIPLAN in early/mid 1989, theMinistry of Agriculture (MAC) has prepared a more detailed realistic andoperationally sounder list of investment projects for the next four years.Total investment proposed by MAC for the period 1990-1993 amounts to Bs.12,600million at 1989 prices (about US$ 300 million) which is much more in line withthe implementing capacity of the sector. (See Table VIII-8).
8.31. In terms of the breakdown between new and ongoing projects andsubsectors, 35% of the investment funding proposed is for ongoing activitieswhich would be continued during the next four years. These allocations inprinciple pending a more detailed analysis can be considered acceptableinvestments. Of this, 15% would be for strengthening the extension system ofMAC, 7% for development of the coffee areas, 2% each for cacao areas,fisheries, aquaculture, plant health and the development of the Southern areaof Lake Maracaibo, and 3% for the National Cadaster. Of the "new"investments, 512 have been, in principle, earmarked for the construction of anagricultural tractor factory which should be postponed pending a rigorousfeasibility study (see below), 6Z for expanding research on a variety ofcommodities, and 82 for the development of specific areas (including theprovision of technical assistance, rural roads, research, training andirrigation and drainage). None of proposed new investments have detailedfeasibility studies and therefore it is not possible to judge their economicjustification. It must also be pointed out that the classification of theprojects submitted by MAC does not match that of CORDIPLAN (though the sourceof the CORDIPLAN information is MAC) and that some projects, supposedly ofhigh priority to MAC, i.e., storage and marketing infrastructure are notincluded. Furthermore, the list of investments does not include the largenumber of multipurpose dams irrigation that MARNR would like to develop insupport of irrigation.
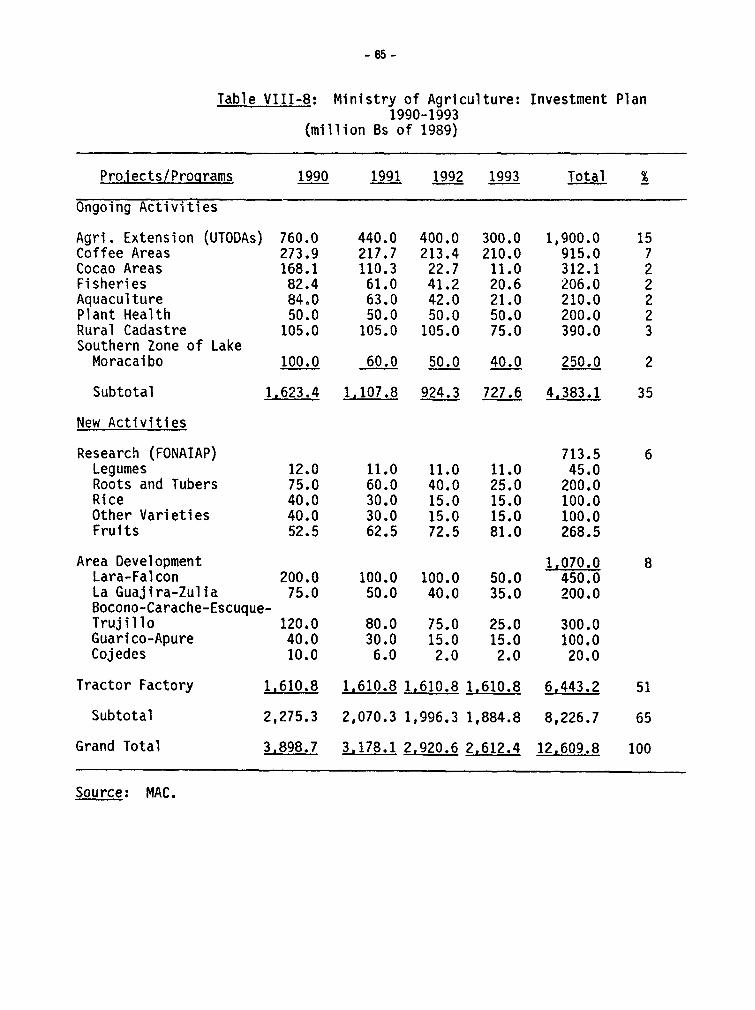
Table VIII-8: Ministry of Agriculture: Investment Plan1990-1993
(million Bs of 1989)
Prolects/Proprams 1990 1991 1992 1993 Total X
Ongoing Activities
Agri. Extension (UTODAs) 760.0 440.0 400.0 300.0 1,900.0 15Coffee Areas 273.9 217.7 213.4 210.0 915.0 7Cocao Areas 168.1 110.3 22.7 11.0 312.1 2Fisheries 82.4 61.0 41.2 20.6 206.0 2Aquaculture 84.0 63.0 42.0 21.0 210.0 2Plant Health 50.0 50.0 50.0 50.0 200.0 2Rural Cadastre 105.0 105.0 105.0 75.0 390.0 3Southern Zone of LakeMoracaibo 100.0 60.0 50.0 40.0 250.0 2
Subtotal 1,623.4 1,107.8 924.3 727.6 4,383.1 35
New Activities
Research (FONAIAP) 713.5 6Legumes 12.0 11.0 11.0 11.0 45.0Roots and Tubers 75.0 60.0 40.0 25.0 200.0Rice 40.0 30.0 15.0 15.0 100.0Other Varieties 40.0 30.0 15.0 15.0 100.0Fruits 52.5 62.5 72.5 81.0 268.5
Area Development 1,070.0 8Lara-Falcon 200.0 100.0 100.0 50.0 450.0La Guajira-Zulia 75.0 50.0 40.0 35.0 200.0Bocono-Carache-Escuque-Trujillo 120.0 80.0 75.0 25.0 300.0Guarico-Apure 40.0 30.0 15.0 15.0 100.0Cojedes 10.0 6.0 2.0 2.0 20.0
Tractor Factory 1.610.8 1,610.8 1,610.8 1,610.8 6.443.2 51
Subtotal 2,275.3 2,070.3 1,996.3 1,884.8 8,226.7 65
Grand Total 3,898.7 3.178.1 2,920.6 2,612.4 12,609.8 100
Source: MAC.
- 68 -
Mission's Comments
8.32. In view of the "shocks" suffered by the sector in 1989 due to therecent liberalization measures, the sector authorities are conscious of thepolitical need to be perceived as assisting the agricultural producers torecover the pre-1989 production and income levels. This may be reflectedfirstly in short-term policy measures in regard to prices and subsidies forthe early part of 1990 which may not be fully consistent with the overallliberalization policy nor with the sector authorities, own long-term policyintentions. Secondly, this political concern is also likely to be reflectedin budget allocations for investments in 1990 which, as in the past, cannotdemonstrably reflect an adequate use of resources in terms of theircontribution to overall sector production and growth. The dynamics of thisprocess is such, that the criteria for an investment program in 1990 mustnecessarily take these pressures into consideration. In this regard, theinvestment program in 1990 should be concentrated in ongoing activities, mostof which are unlikely to result in serious misallocations of resources (orcreate additional ones). The investment program to strengthen agriculturalextension and the development of coffee and cacao areas development is likelyto be constrained in any case by the limited absorptive capacity of theentities responsible for implementation, mostly due to the institutionalweakness of the department in MAC handling extension and of FONCAFE andFONCACAO, the institutions managing development in the coffee and cacao areasrespectively. Of the new projects proposed (Table VIII-8), the tractorfactory should be dropped and the area development in Guarico-Apure andCojedes postponed until detailed feasibility studies have been carried out.According to MAC, IFAD has shown interest in assisting finance the areadevelopments in Lara-Falcon, La Guajira-Zulia, and Bocono-Carache-Escuque-Trujillo. This assistance should ensure that the projects would be carefullyassessed before large scale investments take place. The expansion of theresearch projects into well defined commodities (fruits, legumes, roots andtubers and rice) could proceed since they are commodities in which Venezuelahas, prima facie, comparative advantage.
Chapter 9
Power Sector Investment Program
A. Sector Organization
9.1 The organization of the power sector in Venezuela is extremelycomplex, involving a large number of institutions having overlappingresponsibilities without a clearly defined regulatory framework. There arefour Government-owned public utility companies (referred to in the report asnational utilities) and seven private power companies. The national utilitiesconsist of the following:
- CADAFE ("Compania Anonima de Desarrollo y Fomento Electrico"),organized in 1957 through the merger of a number of small utilitycompanies to implement the National Electrification Plan;
- EDELCA ("C.V.G. Electrificacion del Caroni, C.A."), organized in1963 with the main purpose of developing the hydropotential ofthe Caroni river, on which the Guri dam is located;
- ENELVEN ("C.A. Energia Electrica de Venezuela") operates in thewestern part of the country, in the area surrounding Maracaibo;and
- ENELBAR ("C.A. Energia Electrica de Barquisimeto") servesexclusively the city of Barquisimeto.
Of the seven private power companies, the most important is EdC ("C.A. LaElecticidad de Caracas") which supplies electricity to Caracas and is ..heparent company of three other smaller private companies, CALEV, EELEGGUA andCALEY. The others are ELEVAL, ELEBOL, and CALIFE, all very small entities.
9.2 Under the current institutional arrangement -which is still evolving-several Government agencies are in charge of guiding and regulating the powercompanies. The Ministry of Energy and Mines (MEM) has an overallresponsibility for formulating the country's energy policies and serving asthe sector's principal regulatory agency. However, lacking the necessaryauthority and technical capacity to discharge its responsibilities, theministry has never played a very dominant role. MEN's authority has beenundermined further by the requirement that all national utilities reportdirectly to the Venezuelan Investment Fund (FIV), their majority shareholder.1
In addition, EDELCA which operates within the Guyana region, must report tothe Guayana Regio-al Corporation (CVG) though CVG is only a minorityshareholder of LJELCA.
1 FIV was created In 1974 as an *utonomous Institution responsible for Investing thecountry's oil revenues Into various dove-opment projects within Venezuela. It has providedfunding for the power sector both through loans and equity investment, In the process becomingthe virtual owner of three major public utilities companies, CADAFE, EDELCA and ENELVEN. InNovember 1989, however, Its relationship to the power companies changed as FIV was liquidated andtransformed Itself Into an agency for promoting privatization of public enterprises.
- 68 -
9.3 The Ministry of Development is responsible for approving power tariffadjustments. With the establishment of the Tariff Committee in March 1989, itis expected that the Ministry's review and approval of power tariff changeswould in the future be based on the Committee's recommendations.2 TheMinistry of Environment and Natural Resources (MARNR) is in charge ofoverseeing the environmental aspects of power sector investments and forplanning the development of hydro resources. The Congress has also had somesay on the sector's financing since it has to authorize the companies'investment programs and their financing plans, including the amounts to beprovided through long-term borrowing, equity contributions from FIV andinternal resources. The lack of clarity with respect to the role andresponsibilities of these "supervisory agencies" has been a constant source ofconflict within the sector.
9.4 The absence of an adequate legal/institutional framework has impairedthe sector performance ir. the following way:
(a) investments in capacity expansion have generally not followed theleast-cost principles;
(b) tariffs structure is inappropriate; and
(c) lack of financial discipline and inadequate incentives forefficiency improvements.
Though the first two problems affect all the public utilities, the third oneis particularly relevant for CADAFE.3
9.5 As mentioned earlier, the lack of adequate coordination within theenergy sector hinders the efficient use of resources. The long termoptimization of resources within the energy sector should take into accountthe supply and pricing of fuel oil and particularly gas for power generation.As referred to earlier, the Government has lately taken initiatives which mayaffect the legal/institutional framework of the power sector. They include:
(a) Issuing a decree to create the Tariff Committee. The decreeprovides broad guidelines for tariff setting, recognizing theright of power utilities to obtain "a maximum' rate of return on
2 The Tariff Committee is an independent body the main purpose of which is: (a) toadminister the principles for tariff setting, (b) define the target maimum rate of return forelectricity companies, (c) review tariff adjustment requests presented by the power companies,and (d) recommend to the Government possible tariff adjustments. The Committee hasrepresentatives from the Ministry of Development, Ministry of Energy and Mines, CORDIPLAN, FIV,CVG and CAVEINEL.
A thorough assessment of the institutional capacity and operating conditions of theGovernment-owned public utilities is outside the scope of this report. However, Bank mission'sImpression was that the performance indicators of EDELCA, ENELVEN and ENELBAR were maintainedwithin the normal ranges of efficiency, while CADAFE's performance seemed to fall outside ofthese ranges.
- 69 -
revalued assets. Additionally, the Tariff Commission is takinginitial steps to prepare a study which will define the costs ofservice on the basis of long run marginal cost principles.
(b) Change in the role of FIV. This raises uncertainties regardingwhich institution(s) would oversee the national utilitiesoperations in the future. As the major shareholder of theGovernment-owned utilities, FIV has had influence over theutilities' investment programs.
(c) Reorganization of CADAFE. The basic idea behind CADAFE'sreorganization appears to be to improve its operationalefficiency through regionalization. CADAFE would be convertedinto a number of regional distribution companies, aservice/support company, a generation/transmission company, and,possibly, a management company.
9.6 In order to bring electricity rates to reasonable levels, it would beimportant to preserve the autonomy of the Tariff Committee in line with thespirit of the decree. This requires a strong political commitments from theGovernment and the necessary decisive actions from the Committee itself toreview and to approve as appropriate tariff schedules presented by theGovernment-owned and private utilities for its consideration.
9.7 The idea of reorganizing the sector has been discussed for years butno action had been taken in the past. Any serious attempt at reorganizat ionwould have implied making difficult political decisions, for which there wasno pressing need because the public utilities were managing to get by withinthe existing institutional framework. The situation is quickly changing,however. On the one hand, it is likely that FIV might transfer ownership ofthe national utilities to other institutions such as the MEM or the Ministryof Development. On the other hand, the creation of several regional companiesas a result of the regionalization of CADAFE would increase the need forsupervisory institution to oversee the sectors development and operations.This has brought to the foreground the idea of creating a holding company forthe sector.
9.8 The need for a holding company is not a widespread perception amongmanagers of the national utilities. Moreover the creation of a holdingcompany per se may not be a panacea for all of the sector's problems. Thecoordination among power utilities for expanding generation and transmissioncapacity could be improved without a holding company--as it was done in thepast with the "Plan Anzola". The sector's financial difficulties stem frompricing policy problems totally unrelated to the holding company issue.Moreover, CADAF7's operational inefficiencies seem to derive from politicalinterference and the lack of accountability which would not necessarily beresolved by the creation of a holding company or by regionalization. Thus, themeasures needed for resolving the sector's basic problems should be analyzedunder two scenarios, with and without a 'holding company".
9.9 The creation of a "holding company" may contribute substantially toresolving the sector's organizational problems of the sector. However, this
- 70 -
approach would require the Government to address explicitly some thornypolitical questions:
(a) Should EDELCA be left "inf or "out" the holding company? WillCVG be reluctant to relinquish its control over EDELCA? In sucha case, would a holding company make sense without EDELCA?
(b) With CADAFE likely to be split into several regional companies,should CADAFE have its own holding company inside of, andreporting to, the sector holding company? Or should the newregional companies report directly to the holding company?
(c) a holding company would necessarily centralize some activitiescurrently undertaken individually by each of the nationalutilities such as planning. Should the holding company absorbthe staff of the national utilities currently carrying out thesetasks?
9.10 The sector should be equally able to perform well without a holdingcompany, provided the fundamental issue of sector coordination is resolved.Coordination among power companies is particularly important with reference tothe sector expansion plan. The current arrangement for ensuring coordinationthrough the Planning Committee of the Operational Office for the Inter-Connected System (OPSIS) is not satisfactory. While OPSIS is owned jointly bythe four national utilities and EdC, it has no decision making powers. Suchcoordination should ideally be provided by CORDIPLAN or by MEM. Presently,these two institutions are tooo weak technically to play the role ofsupervising the sector development. Nor.theless, the creation of a small groupfor planning -including financial planning- for the sector might be a simplersolution than the creation of a holding company.
B. Demand Projections
9.11 Demand projections for the National Interconnected System (NIS), whichinclude most of the country's consumption centers, are prepared by OPSISPlanning Committee with the participation of the national utilities (CADAFE,EDELCA and ENELVEN) and EdC. The current demand projections prepared by OPSISresult in an overall energy demand growth of 6.12 p.a. for the period 1990-2000. It is based on 5.32 p.a. increase for the residential sector, 6.62 p.a.increase for the industrial sector, mainly due to a strong increase of the CVGindustrial demand, 7.72 p.a. increase for the commercial sector and 3.22 p.a.increase for the miscellaneous (other) sector. The projections assume thatthe gross generation will grow at a 6.12 p.a. rate, from 54,600 Gwh/year in1990 to 104,300 GWh/year in 2000.
Methodology
9.12 The Planning Committee makes use of an econometric model applied toeach class of consumers. For the residential sector, projections are based on
- 71 -
a correlation between the per-household consumption and private consumption inthe national accounts. To obtain electricity consumption, the number ofhouseholds is estimated on the basis of population growth and to the coveragegoals expressed in percentages of the population served. Attempts have beenmade to calculate the price elasticity of consumption with little success.The commercial consumption is projected on the basis of its correlation withpopulation, private consumption and commercial electricity prices. For theindustrial sector, the heavy industry sub-sector of the Guayana area isseparated out, and projections for this sub-sector are based on the expecteddemand increase defined for each major consumer group on the basis of itsindividual expansion plans, while the light and miscellaneous industry iscorrelated to the industrial value added and to the industrial electricityprice. Finally demand projections foar a group of other consumers, i.e.,government, transportation, irrigation, etc., are correlated with publicconsumption.
Assumptions
9.13 The implicit elasticities in the projections of residential demandappear out of range. The long run income elasticity of demand is almost 7,meaning that an increase of 10% in household income would raise residentialconsumption by 701. This degree of responsiveness of electricity consumptionto income changes is clearly an overestimate. The implicit price elasticityof demand is also clearly out of range. The projections imply that anincrease of 10X in the residential rates would reduce consumption by more than1OZ. Such price elasticities are not in line with observed market behavior inVenezuela. The implicit elasticities suggest either an error in thecalculations or in the projected values of the explanatory variables.
9.14 The implicit elasticities in the projections of the industrialconsumption (excluding EDELCA's market) are more in line with expected values.The degree of response of industrial consumption co changes in industrialvalue added is 1.3, while the long run price elasticity of industrialconsum.ption is -0.2.
9.15 Gross generation is estimated on the basis of aggregate consumptionand average losses--including plant consumption--for each sub-system. This isequal to assuming that the system configuration--in terms of hydro/thermal mixand transmission/distribution losses--will not change in the future. Themis.ion recommends that this be altered to assume that (a) the system mix israpidly evolving to a predominantly hydro system, and (b) projections shouldtake into account a badly needed loss reduction program. A more adequateapproach would be to plan the expansion on the basis of net energyrequirements on the demand side (consumption plus distribution losses) and thenet energy delivered to the network on the supply side (gross generation lessplant consumption, less transmission losses). This would require a detailedreview of demand projection methodologies and procedures, including theconsideration of alternative scenarios and appropriate projections of economicand price variables.
- 72 -
Results
9.16 Table IX-1 presents a summary prepared by the mission on the basis ofdata provided by the Planning Committee and shows the demand projectionsprepared by OPSIS as of mid 1989. Adjustments have been made to reflectactual 1989 consumption which resulted substantially lower than the projectedby mid 1989 (2Z p.a. actual growth as compared with 6Z p.a. projected). Theyresult in an overall energy demand growth of 6.1Z p.a. for the period 1990-2000. It is composed of 5.32 p.a. increase for the residential sector, 6.62p.a. increase for the industrial sector mainly due to a strong increase of theCVG demand, 7.7Z p.a. increase for the commercial sector and 3.2Z p.a.increase of the miscellaneous (other) sector. The projections assume that thegross generation will grow at a 6.12 p.a. rate, from 54,600 Gwh/year in 1990to 104,300 GWh/year in 2000.
9.17 The demand projections should be reviewed and revised taking intoaccount the following observations:
(a) Industrial consumption of the Guayana area seems to beoverestimated because it include potential demand from someindustrial projects that may not materialize.
(b) The projected level of losses is assumed to remain constant at avery high level (27Z) for the period 1990-2000, which impliesthat no serious efforts to reduce the current level would betaken. (Actually, as there is a substantial increase in highvoltage sales, the above assumption implies that losses atdistribution level would continue to increase).
(c) The projected demand should but does not reflect the impact ofconservation effort yet to be put in place. Though efforts madeby the Planning Committee to estimate price electicities from theeconometric model have not borne useful results, the tariffincreases in nominal terms approved by the Government for 1989-1990 --and possible further tariff actions required to improvethe sector finances--are likely to result in reduction in thelevel of consumption.
An Alternative Demand Scenario
9.18 The mission reviewed OPSIS projections and produced revisedestimates which take into account: (a) the need to conserve energy in theresidential sector through pricing and other conservation policies, (b) a moremodest, though still uncertain, projection of the Guayana region demand basedon the targeted the production of 1.3 million tons/year of aluminum by the
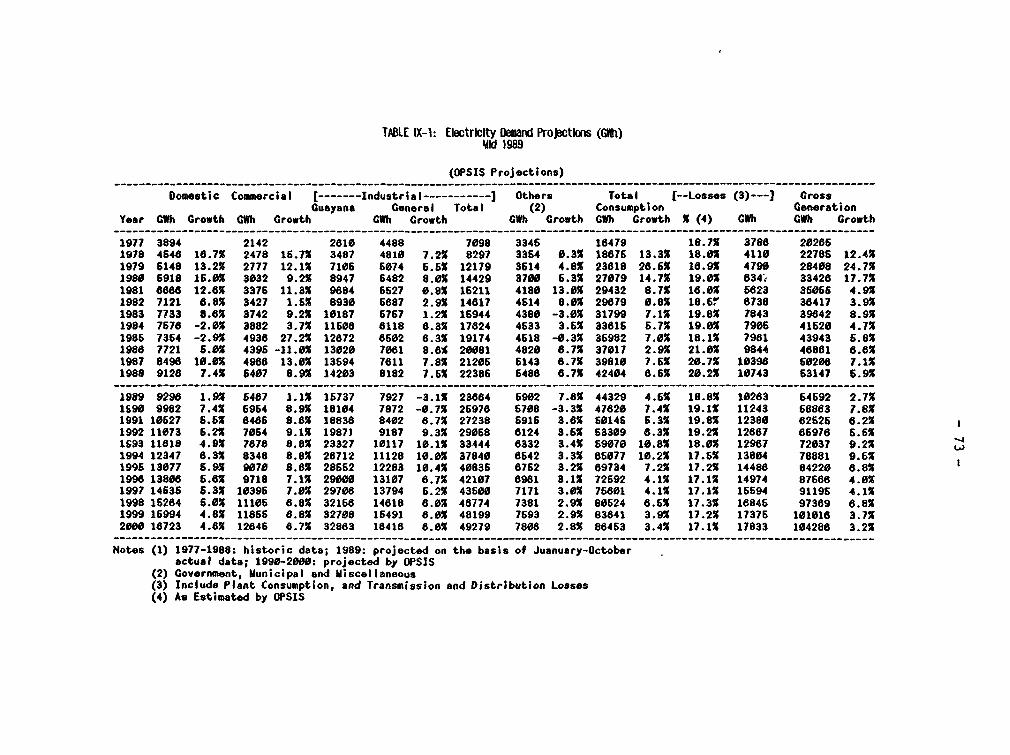
TABLE IX-1: Electricity Demand Project"rs (Gfl)Mid 1989
(OPSIS Projections)--------------------------------------------------------- __------------------__-----------------------------------_--------
Domestic Commercial [-------Industrial…----------- Others Total t--Losses (3)---] CrossGuayana General Total (2) Consumption Generation
Year CWh Growth CWh Growth CWh Growth CWh Growth CWh Growth X (4) CWh CWh Growth------------------------------------------------------------------ __---------__--------------------------------------------
1977 3894 2142 2810 4488 7098 3346 18479 18.7X 3788 202861978 4648 18.7% 2478 16.7% 3487 4810 7.2% 8297 3354 0.3% 18676 13.3% 18.0% 4110 22786 12.4%1979 6148 13.2% 2777 12.1X 7106 5074 6.6X 12179 3514 4.8% 23818 28.6% 16.9% 4790 28408 24.7%1980 6918 16.0% 3032 9.2% 8947 6482 8.0% 14429 3700 6.3X 27079 14.7% 19.0% 834i 33428 17.7X1981 8886 12.8% 3375 11.3% 9884 6527 0.8% 16211 4180 13.0% 29432 8.7% 18.0% 6823 36065 4.9X1982 7121 6.8% 3427 1.6% 8930 5887 2.9% 14817 4514 8.0% 29879 0.8X 18.65 8738 38417 3.9X1983 7733 8.6% 3742 9.2% 10187 6757 1.2% 16944 4380 -3.0% 31799 7.1% 19.8% 7843 39842 8.9X1984 7678 -2.0X 3882 3.7% 11608 8118 8.3% 17824 4633 3.6% 33815 6.7% 19.0X 7906 41520 4.7%1985 7364 -2.9% 4938 27.2% 12872 8502 6.3% 19174 4618 -0.3% 35982 7.0% 18.1X 7981 43943 5.8%1988 7721 6.0% 4396 -11.0% 13020 7081 8.8% 20081 4820 8.7% 37017 2.9% 21.0X 9844 46881 8.8%1987 8498 10.0% 4988 13.0% 13694 7811 7.8% 21206 6143 8.7% 39810 7.5% 20.7% 10398 60208 7.1%1988 9128 7.4% 5407 8.9% 14203 8182 7.6% 22386 5488 6.7% 42404 8.6% 20.2% 10743 63147 6.9X
------------------------------------------------------------------ __---------__--------------------------------------------
1989 9290 1.9X 6487 1.1X 16737 7927 -3.1X 23884 6902 7.6% 44329 4.6X 18.8% 10283 64692 2.7%1590 9982 7.4% 6964 8.9% 18104 7872 -0.7% 25978 6708 -3.3% 47820 7.4% 19.1% 11243 68863 7.8X1991 10527 S.6X 8485 8.8X 18838 8402 8.7X 27238 6916 3.8% 50146 6.3% 19.8% 12380 62625 8.2%1992 11073 5.2% 7054 9.1% 19871 9187 9.3% 29058 6124 3.6% 63309 6.3X 19.2X 12687 66976 6.6%1693 11818 4.9% 7878 8.8% 23327 10117 10.1% 33444 6332 3.4% 69070 10.8% 18.0% 12987 72037 9.2%1994 12347 8.3% 8348 8.8% 28712 11128 10.0% 37840 8642 3.3% 865077 10.2% 17.6% 13804 78881 9.6%1996 13077 6.9% 9070 8.8% 28652 12283 10.4% 40835 8762 3.2% 69734 7.2% 17.2% 14486 84220 8.8%1998 13808 6.8% 9718 7.1% 29000 13107 6.7% 42107 6981 3.1% 72692 4.1% 17.1% 14974 87656 4.0%1997 14636 6.3X 10395 7.0X 29708 13794 5.2% 43600 7171 3.0% 76801 4.1% 17.1% 15694 91196 4.1%1998 16284 5.0% 11105 8.8% 32168 14818 8.0% 48774 7381 2.9% 80524 8.5X 17.3% 18846 97369 6.8%1999 16994 4.8% 11866 8.8X 32708 16491 8.0% 48199 7593 2.9% 83841 3.9% 17.2% 17376 101018 3.7%2000 18723 4.6% 12646 8.7X 32883 18416 8.0% 49279 7808 2.8% 88463 3.4% 17.1X 17833 104288 3.2X
----------------------------------------------------------------- __----------__--------------------------------------------
Notes (1) 1977-1988: historic data; 1989: projected on the basis of Juanuary-Octoberactual data; 1990-2000: projected by OPSIS
(2) Government, Municipal and Miscellaneous(3) Include Plant Consumption, and Transmission and Distribution Losses(4) As Estimated by OPSIS
- 74 -
year 2000, and (c) the implementation of a loss reduction programfor CADAFE and the continuation of the current ENELVEN's lossreduction program. The review included the following steps:
(i) Projections of Residential consumption. Table 1X-2 shows OPSISprojections for the residential sector. It is nioted that: (i) thedomestic consumption both, in terms of energy consumed per householdand in per capita consumption show sharp increases in the period1990-2000. Consumption per household is assumed to grow from 3300Kwh/year in 1990 to 4120 KWh/year in 2000. The mission revised theseprojections on the basis of a correlation analysis making use of the1970-1988 data on per capita income, average residential rates andconsumption per household as well as CORDIPLAN projected data forper capita private consumption and OPSIS tariff projections. Theseestimat's are shown in Table IX-3. They assume a more plausibleincrease irom 3300 KWh/year in 1990 to 3660 KWh/year in 2000. Thesefigures are assumed to make allowances for part of the currentenergy theft.
(ii) Industrial Consumption. A review of actual and projected consumptionof the industrial Guayana is presented in Table IX-4. Projects areclassified as either "ongoing", "new' or "possible". The baselineconsumption correspond to the projected consumption of the ongoingprojects. A medium scenario includes in addition new proposedprojects, mainly the expansion of existing plants and two totallynew aluminum plants (Alisa and Aldanca). Finally a high scenariowould include all potential projects.
(iii) System Losses. A review od losses by each utility's system ispresented in Table IX-5. The extremely high loss level for CADAFEsystem (29Z for 1989) needs proper attention from the sector. Itwould not be appropriate to plan the generation expansion assumingthat almost one of every three KWh input in CADAFE system would belost. A serious effort must be made by CADAFE to reduce losses toacceptable levels. Similarly ENELVEN has a high level of losses (222for 1989) which ENELVEN is addressing through a loss reduction plan.The mission estimated that losses could be reduced to 202 in CADAFEsystem and to 182 in ENELVEN system by 2000, as reflected in TableIX-6. Though part of the energy accounted for as losses is actualconsumption --mainly in the residential sector-- and consequentlypart of the loss reduction would potentially increase consumption,it is assumed that this energy consumption is already included theper-household rates.
9.19 The mission's scenario is shown in Table IX-7. The results of thisscenario show that total demand is likely to growth at 6.0 p.a. while grossgeneration requirements would grow at 5.22 p.a. from 545,000 GWh/year in 1989to 98,000 GWh/year in 2000. Compared with the Planning Committee'sprojections, this reduced demand scenario assumes practically a two year lagin gross energy generation by 1998.
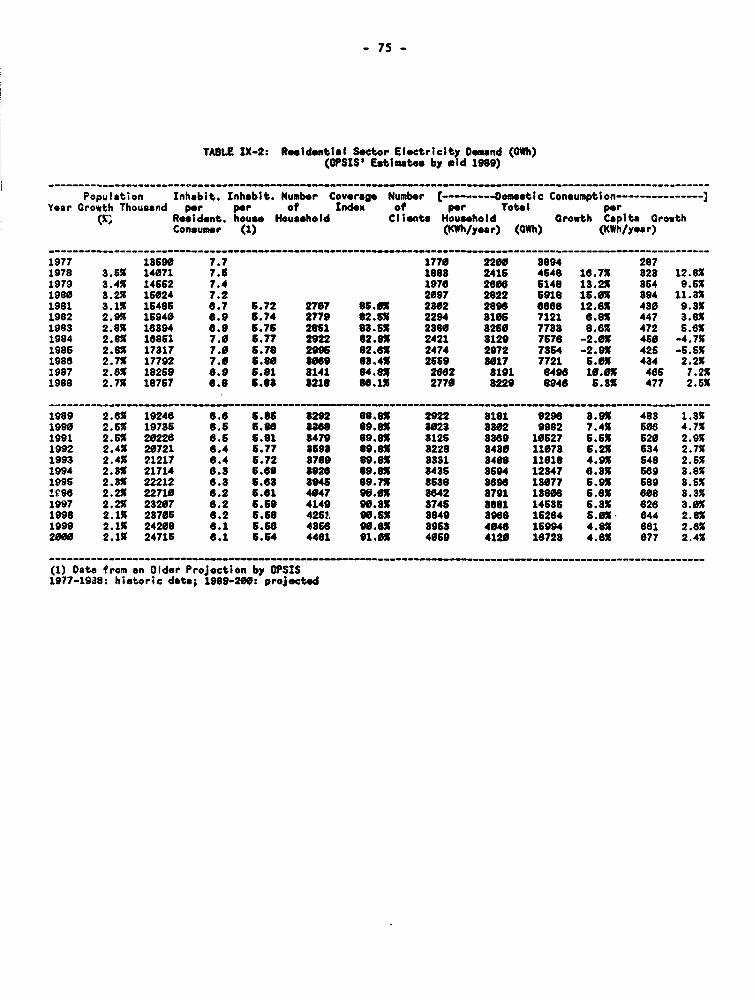
- 75 -
TABLE IX-2: Residential Soctor Electricity Dooand (GWh)(OPSIS' Estimates by oid 1909)
------------- -- ---------- - --- - ---- ----- - --- - -----------------------------------------------
Population Inhabit. Inhabit. Number Coverago Number C --- DDometic Consumpti on----------Year Growth Thousand per per of Indox of per Total per
QC, Resident. house Housohold Clients Household Growth Capita GrowthConsumer (1) (KWh/year) (GWh) (KWh/year)
1977 13690 7.7 1770 2200 8894 2871978 3.65 14071 7.6 18sa 2415 4646 16.7i 823 12.8%1979 3.40 14662 7.4 1976 2660 5146 13.25 364 9.531980 3.2X 15024 7.2 2097 2822 s518 15.0% 894 11.3X1981 8.1% 15486 6.7 6.72 2707 86.03 2302 2896 6666 12.63 480 9.3%1982 2.93 16940 6.9 5.74 2779 62.55 2294 8105 7121 6.85 447 3.831983 2.8% 16394 6.9 5.75 2861 08.55 2380 8250 7738 8.63 472 s.631984 2.83 18861 7.0 5.77 2922 62.9x 2421 8129 7676 -2.0X 450 -4.731986 2.83 17317 7.0 5.78 2995 82.63 2474 2972 7864 -2.95 425 -5.631988 2.7X 17792 7.0 6.8o s0o9 63.4x 2659 6017 7721 5.0X 484 2.2%1987 2.8x 18259 6.9 5.81 3141 84.sx 2862 8191 8496 16.03 465 7.2X1988 2.7% 18767 6.0 5.88 8216 66.13 2770 8229 946 S.3X 477 2.6X
1989 2.63 19246 6.6 5.66 8292 68.8x 2922 816 9296 8.93 483 1.831990 2.65 19736 6.5 5.8 8866 69.8x 3028 8802 9982 7.43 606 4.731991 2.65 20228 8.5 5.61 3479 09.8x 8126 8369 10527 6.65 520 2.931992 2.43 20721 6.4 5.77 8698 69.8s 8228 8430 11073 5.25 534 2.731993 2.43 21217 6.4 5.72 8709 69.8x 8331 8466 11618 4.9X 648 2.6X1994 2.3X 21714 6.8 6.68 3826 69.6x 8453 8694 12347 6.85 569 3.8%1996 2.3X 22212 6.8 5.68 8946 89.75 as38 8696 18077 5.9x S89 3.6Xif96 2.25 22710 6.2 5.61 4647 60.03 3842 8791 13806 5.6x 6e0 3.331997 2.23 23207 6.2 5.69 4149 90.83 8745 8681 14636 5.3x 626 3.031998 2.13 23705 6.2 6.66 4265. 9w.55 3849 3896 15264 S.03 644 2.S%1999 2.1X 24208 6.1 5.56 4866 90.8% 3958 4046 15994 4.6x 861 2.ex2000 2.1X 24715 6.1 5.64 4461 91.0X 4059 4120 16728 4.6x 677 2.43
- -- -- -- -- -- -- -- -- -- -- __- _-- -- - -- - - - _- - - - - - - - - -__- - -_ - - -__- - -
(1) Data from an Older Projection by OPSIS1977-1938: historic dots; 1989-200: projected
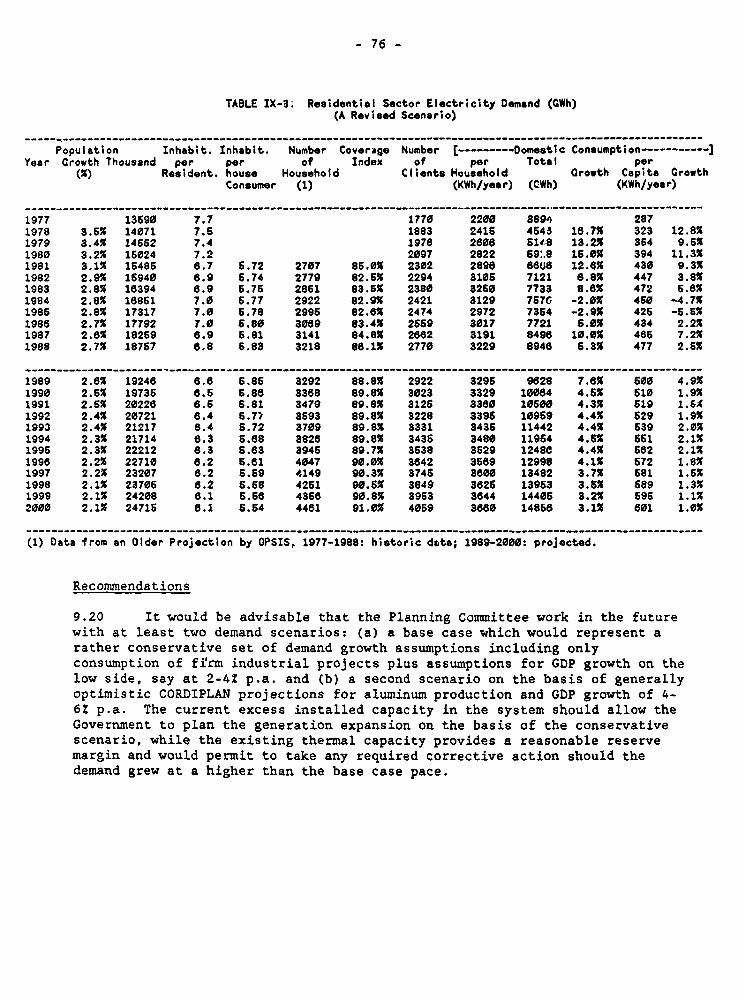
- 76 -
TABLE IX-3; Residential Sector Electricity Demand (GWh)(A Revised Scenario)
---- _----______--------------_------___-_--------_-___-----__----------------__-----------------------------
Population Inhabit. Inhabit. Number Coverage Number [---------Domestic Consumption-----------JYear Growth Thousand per per of Index of per Total per
(%) Resident, house Household Clients Household Growth Capita GrowthConsumer (1) (KWh/year) (CWh) (KWh/year)
----------------------------------------------------------- __----------------__----..------------------------
1977 13690 7.7 1770 2200 8894 2871978 3.6% 14071 7.6 1883 2416 4643 16.7% 323 12.8%1979 3.4% 14562 7.4 1978 2608 S1d8 13.2% 364 9.5%1980 3.2% 15024 7.2 2097 2822 69%8 16.0% 394 11.3%1981 3.1% 15485 8.7 6.72 2707 86.0% 2302 2898 68U8 12.8% 430 9.3%1982 2.9% 16940 8.9 6.74 2779 82.5% 2294 8105 7121 6.8% 447 3.8%1983 2.8% 18394 6.9 6.75 2861 83.5x 2380 3260 7733 8.6% 472 5.e%1984 2.8% 18861 7.0 6.77 2922 82.9% 2421 3129 7670 -2.0X 460 -4.7X1985 2.8% 17317 7.0 6.78 2995 s2.8% 2474 2972 7354 -2.9% 426 -5.5%1986 2.7X 17792 7.0 5.80 3069 83.4% 2659 3017 7721 6.0% 434 2.2%1987 2.8% 18269 8.9 6.81 3141 84.8% 2682 3191 8496 10.0% 486 7.2%1988 2.7% 18767 6.8 5.83 3218 86.1% 2770 3229 8946 5.3% 477 2.6%
1989 2.6% 19248 6.6 5.85 3292 88.8% 2922 3296 9828 7.8X 600 4.9%1990 2.5% 19735 8.6 5.88 3368 89.8% 3023 3329 10084 4.5% S10 1.9%1991 2.6% 20226 8.5 6.81 3479 89.8x 3126 3380 10500 4.3% 519 1.SA1992 2.4% 20721 6.4 6.77 3693 89.8% 3228 3396 10969 4.4% 629 1.9%1993 2.4% 21217 6.4 6.72 3709 89.8% 3331 3435 11442 4.4% 539 2.0%1994 2.3% 21714 8.3 6.68 3826 89.8% 3436 3480 11964 4.6% 661 2.1%1996 2.3% 22212 8.3 5.63 3946 89.7% 3638 3629 1248e 4.4% 682 2.1%1996 2.2% 22710 6.2 6.81 4047 90.O% 3842 3569 12998 4.1% 672 1.8%1997 2.2% 23207 8.2 6.69 4149 90.3% 3746 3800 13482 3.7% S5l 1.6%1998 2.1% 23706 6.2 6.68 4261 90.S% 3849 3626 13953 3.S% 589 1.3%1999 2.1% 24208 6.1 5.58 4356 90.8% 3963 3644 14406 3.2% 695 1.1%2000 2.1X 24715 8.1 5.54 4461 91.0% 4059 3880 148b8 3.1% 601 1.0%
(1) Data from an Older Projection by OPSIS, 1977-1988: historic data; 1989-2000: projected.
Recommendations
9.20 It would be advisable that the Planning Committee work in the futurewith at least two demand scenarios: (a) a base case which would represent arather conservative set of demand growth assumptions including onlyconsumption of fi!rm industrial projects plus assumptions for GDP growth on thelow side, say at 2-4% p.a. and (b) a second scenario on the basis of generallyoptimistic CORDIPLAN projections for aluminum production and GDP growth of 4-62 p.a. The current excess installed capacity in the system should allow theGovernment to plan the generation expansion on the basis of the conservativescenario, while the existing thermal capacity provides a reasonable reservemargin and would permit to take any required corrective action should thedemand grew at a higher than the base case pace.
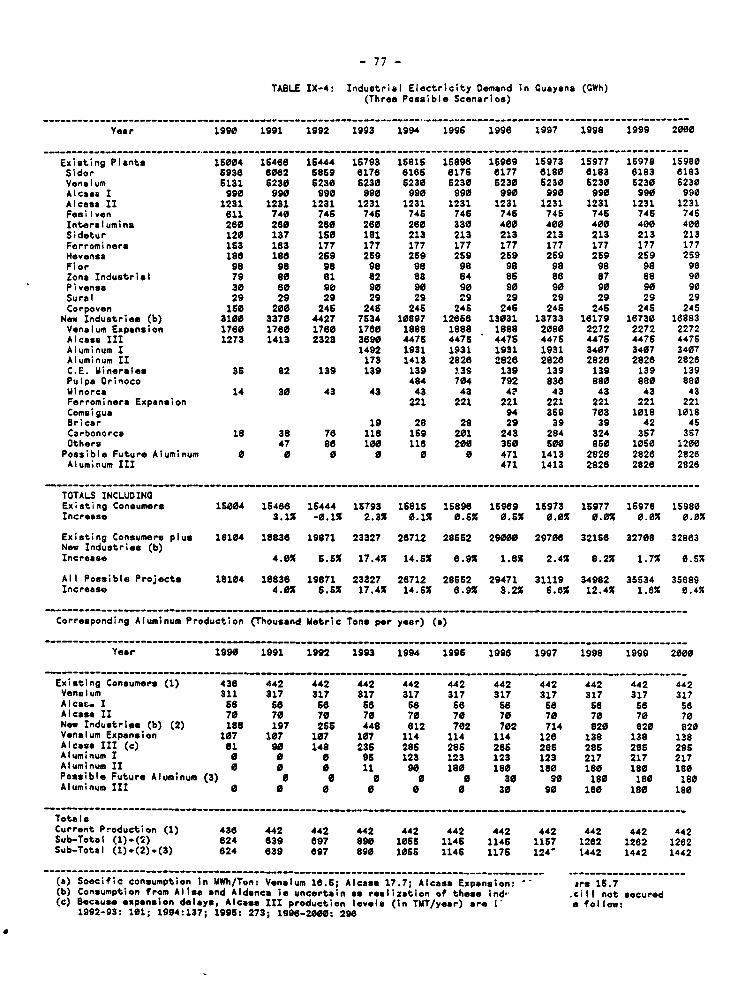
- 77 -
TABLE IX-4- Industrial Electricity Oemend in Cuaysns (GWh)(Three Possible Scenarios)
_____________.____________________________________________________..______________________________________________
Year 1990 1991 1992 1993 1994 1996 1996 1997 1998 1999 2000
Existing Plants 15004 16466 16444 16793 16816 15896 16969 15973 15977 15978 15980Sidor 6936 6082 6869 6176 a665 6176 6177 6l80 6183 6183 8183Venulum 6131 5230 6230 6230 6230 6230 6230 6230 6230 6230 5230Alcasa I 990 990 990 990 990 990 990 990 990 990 990Alcass 1I 1231 1231 1231 1231 1231 1231 1231 1231 1231 1231 1231Feeilven 6ll 740 746 746 746 746 746 746 745 746 746Interalumina 260 260 260 260 260 330 460 400 400 400 400Sidetur 120 137 150 181 213 213 213 213 213 213 213Forrominers 163 163 177 177 177 177 177 177 177 177 177Hevensa 186 188 269 269 269 259 259 259 259 269 259Fior 98 98 98 98 98 98 98 98 98 98 98Zone Industrial 79 80 81 82 83 84 85 86 87 88 90Pivense 30 60 90 90 90 90 90 90 90 90 90Sural 29 29 29 29 29 29 29 29 29 29 29Corpoven 150 200 246 246 246 246 246 246 246 245 245
New Industries (b) 3100 3370 4427 7534 10897 12668 13031 13733 16179 16730 18883Venalum Expansion 1760 1760 1760 17eO 1888 1888 188 2080 2272 2272 2272Alcass III 1273 1413 2323 3690 4476 4475 4476 4475 4476 4475 4475Aluminum I 1492 1931 1931 1931 1931 3407 3407 3407Aluminum II 173 1413 2826 2826 2826 2826 2826 2826C.E. Mineroles 36 82 139 139 139 ?39 139 139 139 139 139Pulps Orinoco 484 704 792 836 880 880 880Minorca 14 30 43 43 43 43 4? 43 43 43 43Ferrominero Expansion 221 221 221 221 221 221 221Comsigua 94 369 703 1018 1018Bricar 19 28 28 29 39 39 42 45Carbonorea 18 38 76 118 159 201 243 284 324 357 367Others 47 88 100 116 200 360 600 850 1050 1200Possible Future Aluminum 0 0 0 0 471 1413 2026 2826 2826Aluminum III 471 1413 2826 2826 2826
TOTALS INCLUOINCExisting Consumers 15004 15466 16444 15793 1581S 15896 16989 15973 15977 16978 15980Increase 3.1% -0.1% 2.3K 0.1% 0.6O% 0.K 0.0% 0.0% 0.0% 0.0%
Existing Consumers plus 18104 18836 19871 23327 26712 28662 29000 29706 32156 32708 32883New Industries (b)Increase 4.0% 6.6X 17.4% 14.6% 6.9% 1.8K 2.4% 8.2X 1.7% 0.5%
All Possible Projects 18104 18836 19871 23327 26712 28662 29471 31119 34982 35534 35689Increase 4.0% 5.5X 17.4% 14.5X 6.9% 3.2X 6.6% 12.4K 1.6% 0.4X
----------------------------------------------------------
Corresponding Aluminum Production (Thousand Metric Tons per year) (a)
…--------- ------ --------------- --------------------- --…- -…- ------
Year 1990 1991 1992 1993 1994 1996 1998 1997 1998 1999 2000
------------------------- ---------------------------- --
Existing Consumers (1) 436 442 442 442 442 442 442 442 442 442 442Venslum 311 317 317 317 317 317 317 317 317 317 317Alca.. I 8 56 56 66 58 658 5 6se se 58 58Alcasa II 70 70 70 70 70 70 70 70 70 70 70New Industrios (b) (2) 188 197 255 448 612 702 702 714 820 820 820Venalum Expansion 107 107 107 107 114 114 114 126 138 138 138Alcase III (c) 81 90 148 236 286 286 286 286 286 286 285Aluminum I a 0 0 96 123 123 123 123 217 217 217Aluminum IT 0 0 0 11 90 180 180 SO 180 180 180Possible Future Aluminum (3) 0 0 0 0 0 30 S9 180 180 180Aluminum III 0 0 0 0 0 0 30 90 180 180 180
---------------------------------------- -- ------- -----------
TotalsCurrent Production (1) 436 442 442 442 442 442 442 442 442 442 442Sub-Total (1).(2) 824 839 897 890 1066 1146 1146 1157 1262 1262 1262Sub-Total (1)e(2)*(3) 624 839 697 890 1066 1146 1176 124- 1442 1442 1442
(a) Soecific consumption in MWh/Ton: Venalum 16.6; Alcass 17.7; Alcesa Expansion: ers 16.7(b) Consumption from Aliss and Aldonco is uncertain as realization of these ind cill not secured(c) Because expansion delayse Alcoaa III production levels (in TMT/year) are I e follow:
1992-93: 101; 1994:137; 1996: 273; 1996-2000: 296
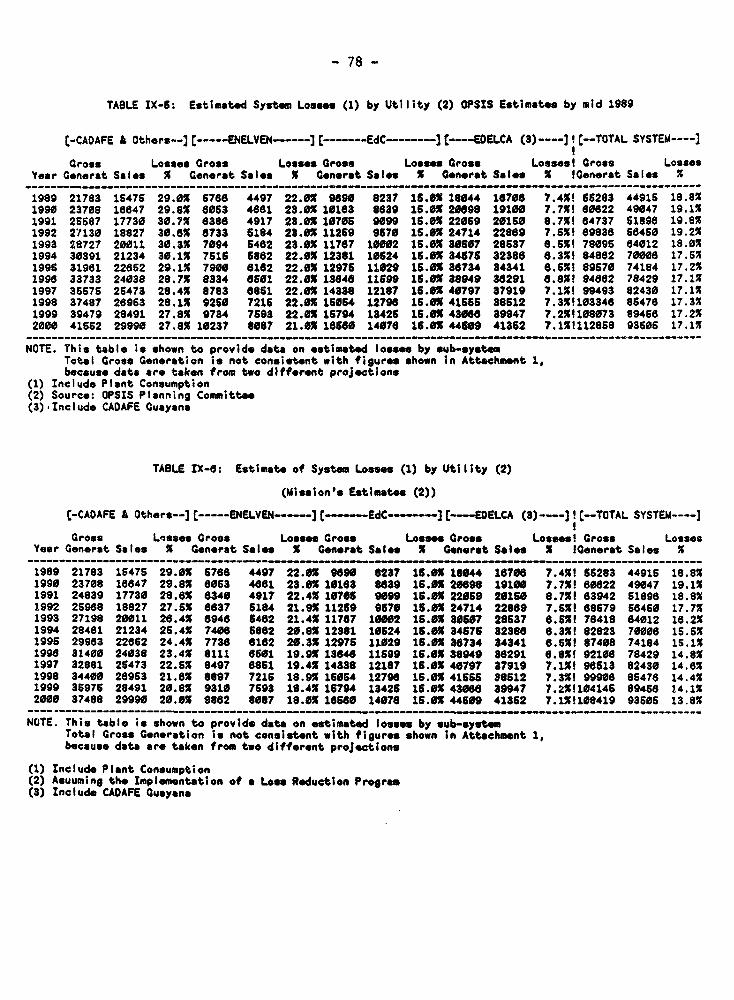
- 78 -
TABLE IX-5: Estimated System Losse (1) by UtIiIty (2) OPSIS Estimates by mid 1989
(-CADAFE A Others--] -----ENELVEN--] [-----EdC--- ---- ][----EDELCA (3)----) !E--TOTAL SYSTEM ----]
Gross Losses Gross Losses Gross Losses arose Losses! Gross LossesYear Generat Sales X Generat Sales X Generat Sales X Cenerat Sal-s X IGenerat Salos %
1989 21783 16475 29.0% 6768 4497 22.0% 9090 6237 16.01 16044 16706 7.4% 65283 44915 18.8%1990 23708 16847 29.8% 6053 4861 23.0% 10163 8639 16.01 20698 19100 7.7%! 80822 49047 19.1%1991 25687 17730 30.7% 8386 4917 23.01 10706 9099 1.0% 22069 20150 8.7%! 64737 61898 19.8%1992 27130 18827 30.8% 8733 6184 23.01 11259 9670 15.01 24714 22689 7.SX! s8938 58460 19.2%1993 28727 20011 30.3% 7094 6482 23.0% 11767 10002 15.0% 30607 28637 6.5%! 78095 64012 18.0%1994 30391 21234 30.1% 7515 6882 22.0% 12361 10624 15.0% 34676 32388 6.3%! 84882 70008 17.5%1996 31961 22862 29.1% 7900 8182 22.0% 12976 11029 16.01 36734 34341 8.6%! 89670 74184 17.2%1998 33733 24038 28.7% 8334 6501 22.0% 13848 11699 IS.0X 38949 38291 8.8%! 94s82 78429 17.1%1997 36575 25473 28.4% 8783 e061 22.0% 14336 12187 15.01 40797 37919 7.1%! 99493 82430 17.1%1998 37487 26963 28.1% 9260 7216 22.0% 15054 12790 16.0% 41656 38512 7.3%1103348 86478 17.3%1999 39479 28491 27.8% 9734 7593 22.0X 15794 13425 15.01 43066 39947 7.2%1108073 89468 17.2%2000 41662 29990 27.81 10237 8087 21.01 16560 14078 15.0X 44609 41362 7.1X!112858 93560 17.1%
---- - -- -- -- -- -- ------ - - - - - - -- -- -- -- -- - -- - -- - -- - -- -- - -- - - -- - -- - - -- - - -- -- -- -- -- -- -- -- -- -- -- -- -
NOTE. This table is shown to provide data on estimated losses by sub-systemTotal Gross Generation is not consistent with figures shown In Attachment 1,because data are taken from two different projections
(1) Include Plant Consumption(2) Source: OPSIS Planning Committee(3).Includ. CAOAFE Cuay.na
TABLE IX-G: Estimate of System Losse" (1) by Utility (2)
(Mission's Estimates (2))
(-CADAFE A Others--]t-----ENELVEN----] --- EdC-----3 t--EDELCA (3)----)] (--TOTAL SYSTEM----)
Gross Losses Gross Losses Gross Losses Gross Lossesl Gross LossesYear Generat Sales X Generat Sales X Generat Sales X Generat Sales 1 IGenerat Sales %
1989 21783 1547S 29.0x 6786 4497 22.0X 9s90 6237 15.01 18044 18708 7.41! 56283 44915 18.8%1990 23708 18847 29.8% 8063 4881 23.0X 10163 6639 15.01 20690 19100 7.7X! 80622 49047 19.1%1991 24839 17730 28.6% 8340 4917 22.4% 10706 9099 15.01 22069 20150 8.7%! 83942 51898 18.8%1992 2S968 18827 27.5X 6837 6184 21.9X 11259 9670 15.0X 24714 22669 7.5%! e8679 58460 17.7%1993 27198 20011 28.4% 8948 5462 21.4% 11787 10002 15.0X 30507 28637 6.5S% 76418 64012 16.2%1994 28481 21234 26.4% 7408 5882 20.81 12381 10524 15.0% 34676 32368 8.3%! 82823 70006 15.5%1995 29963 22652 24.4% 7736 612 20.3X 12975 11029 16.01 38734 34341 6.5%! 87408 74184 15.1%199s 31400 24038 23.4X 8111 8501 19.9% 13646 11599 16.0% 36949 38291 6.8%! 92100 78429 14.8%1997 32881 26473 22.S% 8497 6861 19.4X 14338 12187 16.0X 40797 37919 7.1%! 98613 82430 14.8%1998 34400 28963 21.8% 6897 7216 18.9% 15604 12790 15.0% 41665 86512 7.3%! 99908 86478 14.4%1999 36976 28491 20.8% 9310 7693 18.4% 15794 13426 15.0X 4306e 39947 7.2X1104146 89458 14.1%2000 37488 29990 20.0% 9862 8087 18.0% 16560 14078 15.01 44509 41362 7.1X!108419 93606 13.8%
NOTE. This table is shown to provide data on estimated losses by sub-systemTotal Gross Generation is not consistent with figures shown in Attachment 1,because data sre taken from two different projections
(1) Include Plant Consumption(2) Asuuming the Implementation of a Loss Reduction Program(3) Tnclude CADAFE Guayana
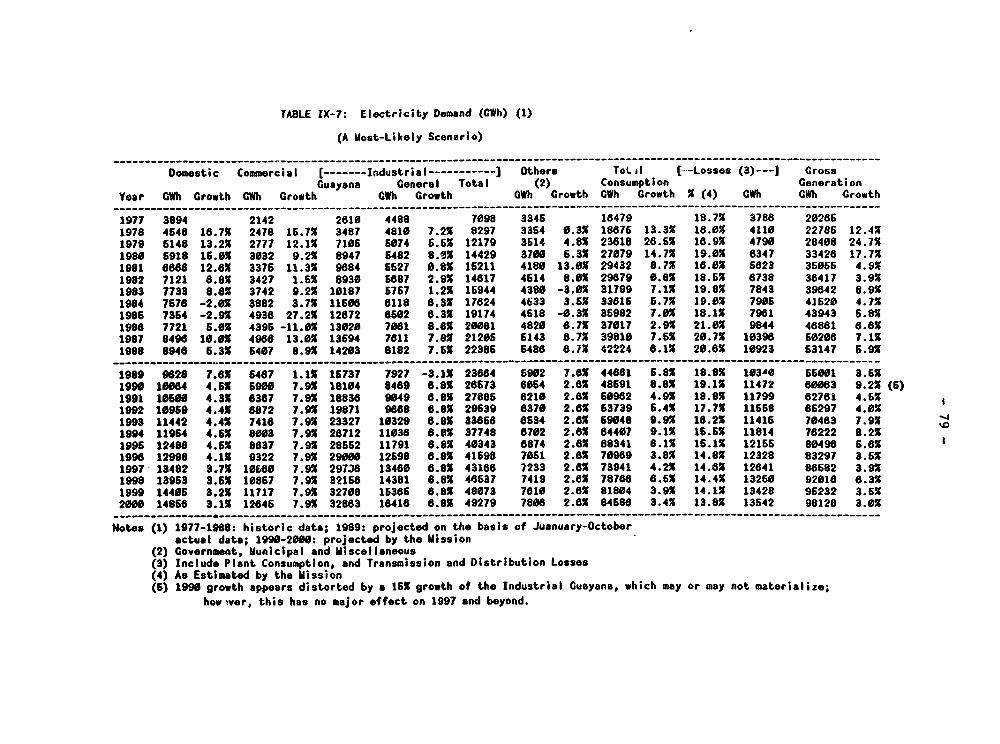
TABLE IX-7: Electricity Demand (CWh) (1)
(A Most-Likely Scenario)
Domestic Commercial [-------Industrial…----------- Others TotFl [---Losses (3)---j CrossGuayana General Total (2) Consumption Generation
Year GWh Growth GWh Growth GWh Growth GWh Growth CWh Growth % (4) CWh CWh Crowth…_____________________________________________________________________ - -_ -- _________- --- ________________________________
1977 3894 2142 2810 4488 7098 3345 18479 18.7X 3788 202861978 4648 18.7% 2478 15.7X 3487 4810 7.2% 8297 3354 0.3X 18876 13.3X 18.0X 4110 22786 12.401979 6148 13.2% 2777 12.1X 7105 6074 5.6X 12179 3614 4.8X 23618 28.6% 18.9% 4790 28408 24.7X1980 6918 16.0X 3032 9.2X 8947 6482 8.0% 14429 3700 6.33 27079 14.7X 19.0X 8347 33428 17.7%1981 6688 12.8X 3376 11.3X 9884 6627 0.83 16211 4188 13.09 29432 8.7X 18.0X 5823 35065 4.9X1982 7121 8.8% 3427 1.65 8930 5887 2.9X 14817 4614 8.03 29879 0.8X 18.5X 6738 38417 3.9X1983 7733 8.8% 3742 9.2% 10187 6767 1.23 16944 4380 -3.03 31799 7.1X 19.8% 7843 39842 8.9X1984 7678 -2.01 3882 3.7% 11608 8118 8.3X 17824 4633 3.5X 33815 5.7% 19.09 7905 41620 4.7%1986 7364 -2.9% 4938 27.23 12872 8602 6.3% 19174 4618 -0.3X 36982 7.0% 18.1X 7981 43943 5.8%1988 7721 6.03 4395 -11.OX 13020 7081 8.8X 20081 4820 8.7% 37017 2.93 21.0X 9844 46881 68.X1987 8496 10.03 4986 13.0X 13594 7611 7.83 21205 6143 8.73 39810 7.5% 20.73 10398 60208 7.1X1988 8948 6.3X 5407 8.9X 14203 8182 7.5S 22386 6488 8.7X 42224 6.1% 20.8% 10923 63147 6.9X
1989 9628 7.B% 6487 1.1% 15737 7927 -3.1X 23884 6902 7.83 44861 6.83 18.8X 10³A0 SS5O1 3.611990 10064 4.65 6900 7.9X 18104 8489 6.8% 28673 6064 2.8% 48691 8.8X 19.1X 11472 60063 9.23 (6)1991 10600 4.3X 8387 7.9X 18838 9049 8.83 27885 8210 2.8X 50982 4.93 18.83 11799 82781 4.5%1992 10959 4.4X 8872 7.9X 19871 9e88 8.8X 29539 6370 2.83 63739 5.4% 17.7X 11558 86297 4.0X1993 11442 4.4X 7418 7.9X 23327 10329 8.81 33656 6534 2.86 59048 9.9X 18.2X 11416 70483 7.9X 3J1994 11964 4.5X 8003 7.9X 28712 11036 8.8X 37748 8702 2.8X 84407 9.1% 15.5% 11814 76222 8.2X1995 12488 4.5X 8837 7.93 28562 11791 6.8% 40343 8874 2.8% 68341 6.11 16.11 12165 80498 5.611996 12998 4.1X 9322 7.9X 29000 12598 8.81 41698 7061 2.63 70989 3.8X 14.8X 12328 83297 3.6%1997 13482 3.7X 10080 7.93 29TJO 13480 6.8X 43188 7233 2.6X 73941 4.2X 14.83 12841 86582 3.9%1998 13963 3.61 10867 7.9X 32168 14381 8.8X 46537 7419 2.ex 78768 6.6X 14.4% 13250 92016 8.331999 14406 3.2X 11717 7.93 32708 15366 6.8X 48073 7810 2.81 81804 3.9X 14.1X 13428 95232 3.6X2000 14868 3.1X 12846 7.9X 32883 18418 6.83 49279 78086 2.83 84686 3.4X 13.8X 13542 98128 3.0X
Notes (1) 1977-1988: historic data; 1989: projected on the basis of Juanuary-Octoberactual data; 1990-2000: projected by the Mission
(2) Government, Municipal and Miscellaneous(3) Include Plant Consumption, and Transmission and Distribution Losses(4) As Estimated by the Mission(6) 1990 growth appears distorted by a 165 growth of the Industrial Cuayana, which may or may not materialize;
howiver, this has no major effect on 1997 and beyond.
- 80 -
margin and would permit to take any required corrective action should thedemand grew at a higher than the base case pace.
9.21 The non-technical losses, because they are significant, affect thelevel of future energy requirements and financial sales revenue. Thus, thefollowing aspects merit a more careful review: the combined effect ofalternative non-technical loss reduction program, the number and social statusof consumers benefiting from these non-technical losses, the nature and theimpact on billed consumption over time of these programs, the evolution ofaverage consumption after passing from a non-billed situation to one whereconsumption is paid for, and the incorporation schedule of illegal users.Only after these factors are duly understood and reflected in the studies canthe sector improve demand projections.
C. Sector Expansion Plan
Generation
9.22 The task of preparing expansion plans for the NIS at generation levelis also undertaken by the Planning Committee of OPSIS. The role of OPSIS inthis matter has been mainly to coordinate the individual expansion programs ofthe national utilities and EdC. During 1988 such coordination effortsimproved, and the Planning Committee undertook a few studies designed todefine a least cost expansion program for the whole sector. (Nonetheless,such a plan is taken by the utilities only as a reference, and investmentprograms of ut lity companies are not consistent with the sector least ccstplan).
9.23 The methodologies for generation expansion planning rely onmathematical models (mainly WASP III and WIGPLAN) which, though state-of-the-art tools, are not fully applicable to the particular features of theVenezuelan NIS. It was also noted that economic parameters and criteria usedfor the studies were not consistent with the country's current economicconditions. The combination of the above factors are likely to lead tomisleading conclusions.
9.24 The mission recommends improving the methodological approach by: (a)adopting generation expansion models capable of optimizing the operation ofmulti-annual reservoirs and to represent the main generation and consumptioncenters in multi nodal way, (b) improving the evaluation of thegeneration/transmission reliability level and the definition of the optimumthermal generation levels in the central area compatible with such reliabilitylevel, and (c) using economic parameters consistent with the country'seconomic conditions such as a discount rate which would reflect moreadequately the country's scarcity of financial resources and pricing fuels attheir opportunity costs.
9.25 The mission did not obtain a single set of consistent results becausethe data was under review at the time. An expansion planning exerciseperformed in mid-1989 was based on demand projections which needed updating to
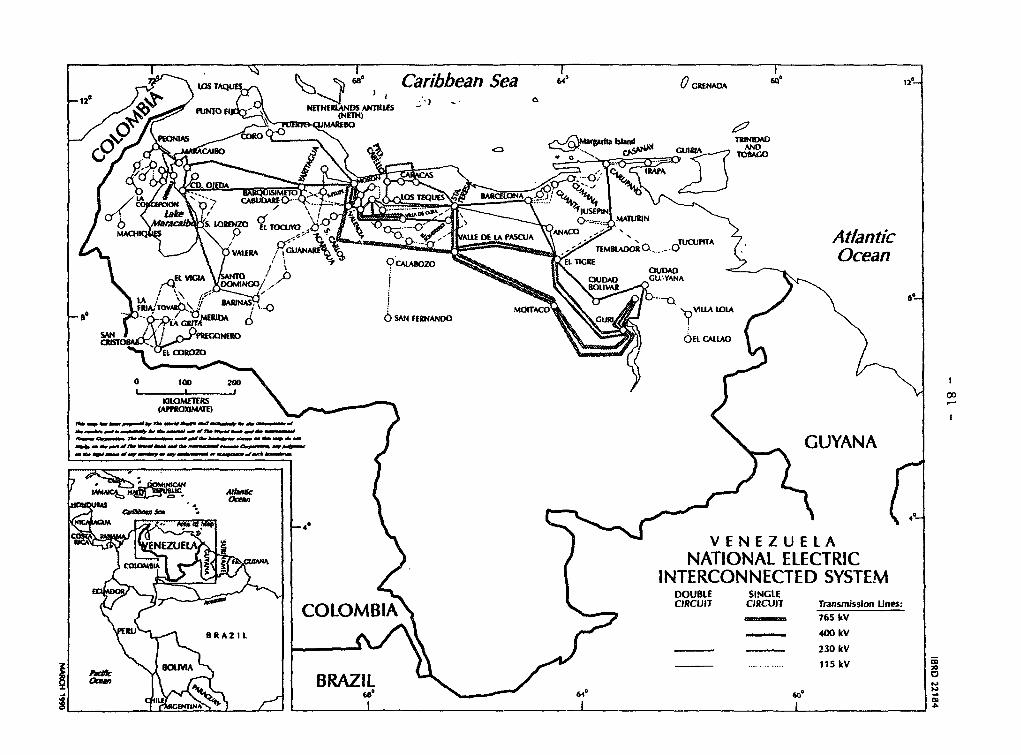
,W\taS TA \ 6Me Caribbean Sea b0 GENA2A 12
-12 T/QEg t * <^xu&, RSnNTO flJ ¢W& ER Ps ANUtLS
pa ax srp8 'EMOIEBf
/a * M 4 JO VAEI - glWlT- -Oann
SAN A/_(>-PiNERO \ i i OiNERCONNCE SYTE
MARO E S
O~~~~~~~~~~~~~~~~~~~~~~~~~~~~~~~~~~~0 kV a \o
-#~~~~----~s G_I JA\GUAN
0 I. T O C L o1 1 5
A4ERA9 NAZIL E.L--RI
ttt-Q VICAA 'IO OUDA60 60 DOANA
tA I BARI _
~~~~0 24 0 BL | +fuR g ; AP1K MATE
- 82 -
reflect the actual consumption for 1989 which was much lower than the forecast(i.e., 2? actual increase as compared with 6X forecast). Additionally, thePlanning Committee was assuming that CADAFE would complete the Uribante-Caparocomplex, a proposition now highly doubtful. In the short and medium term, theresults of the Planning Committee's studies show that the current installedcapacity plus the addition of Macagua II in 1995 or 1996 would supply thedemand with adequate reliability until 1997. The following recommendedadditions are the two remaining plant of the Bajo Caroni development(Caruachi, to be commissioned by 1997 and Tocoma, to be commissioned by 1999).These are clearly the most viable project candidates.
9.26 Though the mission did not review in detail. The results of thesystem operation simulation for the expansion plan as proposed by the PlanningCommittee, a quick review of the expected system's reserve margin and energybalances shows that, even for the Planning Committee's demand scenario, thenext two additions to the current installed capacity may be characterized astoo early. This may result inter alia from the combined factors of: (a) usinga low discount rate, which tends to favor hydro projects instead of higherreliance in generation from existing thermal facilities, (b) using fuel priceshigher than their economic costs, (c) application of not totally suitableplanning models, and (d) use of reliability levels for thermal plants whichreflect rather current unsatisfactory levels than usually reached standards.It is recommended that these results be carefully reviewed. Moreover, themission estimates that under a more modest demand scenario: the completion ofCaruachi and Tocoma could be delayed by two years. Their postponement is avalid option which would result in sizeable savings in investments whileproving the opportunity to improve planning procedures.
9.27 The utilization ratio of thermal facilities, specially Planta Centro,is expected to increase in the period 1990-1994 and continue to be high in theremaining of the century. Thus there is a need to improve their operatingconditions and increase their reliability to normally expected values. Theimproved reliability levels should, in turn, be reflected in the expansionplanning process. The review of gas availability and costs for powergeneration show that in the short term the conversion of two additional unitsat Planta Centro to burn gas is economically justified, with a very high rateof return. Also, gas transmission expansions to permit the conversion for theremaining two units appear justified.
9.28 Over the medium and long term, expansion planning for generationfacilities may be distorted because gas availability for power is uncertain.There is a serious lack of coordination between the oil and gas companies andthe electric utilities when it comes to projecting the production and costs offuels. There is an urgent need for a careful review of these aspects as wellas issues related to fuels priority of usage and internal prices given thatafter the Bajo Caroni development is complete, the next power installationsare likely to be thermal based,
9.29 Another consideration which is becoming increasingly important inplanning generation expansion is the need to protect the environment. Inparticular the Caroni river basin (including the Gran Sabana area isenvironmentally fragile. In view of the soil characteristics this basin which
- 83 -
appear unsuited for agricultural and forestry exploitation, its natural useshould be hydroenergy production. Yet it is necessary to protect the basinfrom an increasingly serious problem of illegal mining and possibly to limitsettlement to a minimum level. CVG and EDELCA are working on preparing amaster plan for watershed management, but EDELCA has at its disposal limitedresources and will require external support to implement such a plan.
Transmission
9.30 The degree of coordination for transmission expansion planning islower than for generation expansion, but the design of transmission projectsis coordinated at the engineering level. Important works intended to removecurrent transmission bottlenecks are being implemented. The issue of theexpansion of the transmission network in the medium term is being addressed topermit a better use of hydro energy and to increase system reliability.Though the mission did not review in detail the transmission expansion plan ofthe national utilities, our general impression is that they are consistentwith the planned generation expansion. A revised transmission plan would beneeded when a revised generation plan is produced.
9.31 An important problem which has not been fully addressed by the sectoris the evaluation of the future overall reliability of the system. Thedevelopment of the lower Caroni projects --Guri, Macagua I and II, Caruachiand Tocoma-- are expected to increase substantially the dependence of thecentral zone on energy generated in the Guayana area and transported throughthe corresponding transmission system. Though this system will be strong --three 750 KV and two 400 KV lines-- a certain degree of local thermalgeneration is needed in the central area to provide security of supply in caseof electrical contingencies. As this local generation may be expensive, athorough evaluation of the optimum system reliability levels and the operatingrules to reach them is required.
D. Sector Investment Program
9.32 The sector's investment requirements are presented first, as estimatedby each utility (Table IX-8). For the national utilities, investmentrequirements for the period 1990-1995 amount to about US$ 5,780 million; ofwhich US$ 2,920 correspond to CADAFE, US$ 2,580 million to EDELCA, US$ 215million to ENELVEN and US$ 60 million to ENELBAR. Investments are likely to beheavily concentrated in generationitransmission works (852), while only about8Z are to be reserved for distribution works. Private UtIlities would requireinvestments of about US$ 460 million of which USS 115 correspond to EdC.
- 84 -
9.33 In the mission's view, some of the investments being considered by thesector are not justified. This report also attempts to present a lowerinvestment scenario, based on assumptions of lower demand and exclusion ofclearly uneconomic projects. The main investment affected would be: (i)CADAFE's Uribante-Caparo complex would be discontinued, (ii) EDELCA's Caruachiand Tocoma would be delayed by two years in relation to their originalschedule,4 (iii) ENELVEN's Combined Cycle plant would be delayed beyond thehorizon of this projection, and (iv) EdC's thermal expansion would bepostponed. The revised scenario is presented in Table IX-9 for the nationalutilities and in Table IX-10 for the private utilities. Total investmentrequirements of the national utilities would amount to about US$ 4,210million, of which US$ 2,000 million would be for CADAFE, US$ 2,580 million forEDELCA, US$ 121 million for ENELVEN and US$ 60 million for ENELBAR. Theprivate utilities would require investment for US$ 244 million. Apart fromthe reduction of the investment levels, the allocation of investments would bebetter balanced ir the above scenario (about 18% would be dedicated fordistribution works). A detailed review of the transmission investment programof CADAFE is also recommended. The CADAFE program is currently supposed torequire US$ 1230 million in the period 1990-1993 or about 302 of the totalinvestments of the national utilities.
9.34 The national utilities together showed financing deficits in 1988 and1989. Thei5 combined financial forecast for the 1989-1993 period indicatesthat the debt service requirements are covered only 1.2 times, and netinternal funds account for only five percent of total investment requirements.Equity capital increases by the Government and FIV are projected to financeabout 142 of the investment requirements.
9.35 Given the anticipated financial difficulties, the sector should planits expansion under a robust scenario, one which would bo. less vulnerableunder demand conditions that deviate from planning assumptions. The primaryconcern should be avoid committing unnecessary works. In this sense, it wouldbe advisable to wait until firm implementation ccnditions are in place for thenew aluminum plants before initiating generation plants to supply suchpotential demand. However, because the implementation period of hydroprojects is longer than the industrial projects, the minimum investmentsrequired to complete field studies and designs should be maintained in orderto be able to start construction of the projects as soon as demand projectionsare firmed up. Transmission facilities to be implemented by CADAFE shouldalso be secured to avoid transmission bottlenecks.
E. Pricing Policies
Background
9.36 The electricity pricing policies of the past have resulted in
unsatisfactory rate levels and distorted tariff structures. The consequences
4 EDELCA rescheduled Caruschi on the basis for discussions held with the Bank. Thisreport's updated figures consider this rescheduling.
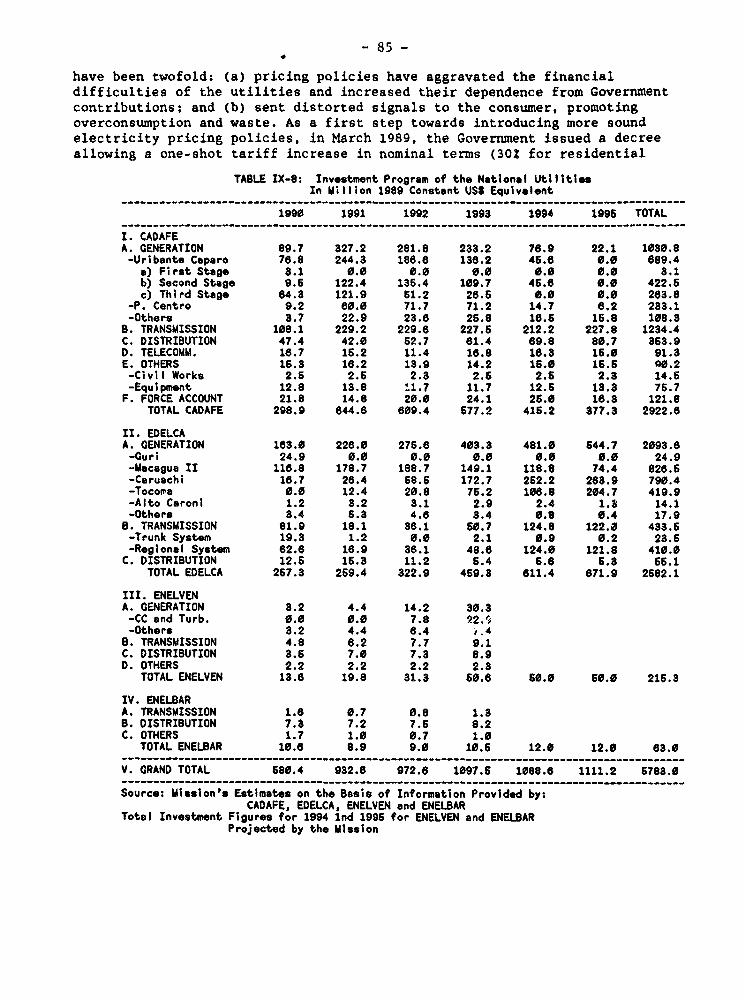
- 85 -
have been twofold: (a) pricing policies have aggravated the financialdifficulties of the utilities and increased their dependence from Governmentcontributions; and (b) sent distorted signals to the consumer, promotingoverconsumption and waste. As a first step towards introducing more soundelectricity pricing policies, in March 1989, the Government issued a decreeallowing a one-shot tariff increase in nominal terms (302 for residential
TABLE IX-9: Investment Program of the National UtilitiesIn Million 1989 Constant US9 Equivalent
-------------------------------------------------------------- __------------- _-----------
1990 1991 1892 1993 1994 1996 TOTAL
I. CADAFEA. GENERATION 89.7 327.2 281.8 238.2 76.9 22.1 1030.8-Uribante Caparo 78.8 244.3 186.6 136.2 45.6 0.0 689.4a) First Stage 3.1 0.0 0.0 0.0 0.0 0.0 3.1b) Second Stage 9.6 122.4 136.4 109.7 46.6 0.0 422.6c) Third Stage 64.3 121.9 61.2 26.6 0.0 0.0 283.8
-P. Centro 9.2 60.0 71.7 71.2 14.7 8.2 233.1-Others 3.7 22.9 23.6 26.8 16.5 15.8 108.3
B. TRANSMISSION 108.1 229.2 229.6 227.6 212.2 227.8 1234.4C. DISTRIBUTION 47.4 42.0 62.7 61.4 69.8 80.7 363.9D. TELECOMM. 16.7 15.2 11.4 16.8 16.3 15.0 91.3E. OTHERS 15.3 16.2 13.9 14.2 15.0 16.6 90.2-Civil Works 2.6 2.6 2.3 2.6 2.6 2.3 14.5-Equipment 12.8 13.8 :.1.7 11.7 12.6 13.3 75.7
F. FORCE ACCOUNT 21.8 14.8 20.0 24.1 26.0 18.3 121.8TOTAL CADAFE 298.9 644.6 809.4 577.2 416.2 377.3 2922.6
II. EDELCAA. GENERATION 163.0 226.0 276.6 403.3 481.0 644.7 2093.8-Gurn 24.9 0.0 0.0 0.0 0.0 0.0 24.9-Macague II 116.8 178.7 188.7 149.1 118.8 74.4 826.6-Caruachi 16.7 26.4 58.6 172.7 262.2 263.9 790.4-Tocona 0.0 12.4 20.8 76.2 106.8 204.7 419.9-Alto Caroni 1.2 3.2 3.1 2.9 2.4 1.3 14.1-Others 3.4 6.3 4.6 3.4 0.8 0.4 17.9
S. TRANSMISSION 81.9 18.1 36.1 50.7 124.8 122.0 433.6-Trunk System 19.3 1.2 0.0 2.1 0.9 0.2 23.6-Regional System 82.8 16.9 36.1 48.6 124.0 121.8 410.0C. DISTRIBUTION 12.6 15.3 11.2 5.4 6.8 5.3 66.1
TOTAL EDELCA 267.3 269.4 322.9 469.3 611.4 671.9 2682.1
III. ENELVENA. GENERATION 3.2 4.4 14.2 30.3-CC and Turb. 0.0 0.0 7.8 22.9-Others 3.2 4.4 8.4 .4B. TRANSMISSION 4.8 6.2 7.7 9.1C. DISTRIBUTION 3.5 7.0 7.3 8.9D. OTHERS 2.2 2.2 2.2 2.3
TOTAL ENELVEN 13.6 19.8 31.3 60.6 50.0 50.0 216.3
IV. ENELBARA. TRANSMISSION 1.6 0.7 0.8 1.3B. DISTRIBUTION 7.3 7.2 7.6 8.2C. OTHERS 1.7 1.0 0.7 1.0
TOTAL ENELBAR 10.6 8.9 9.0 10.5 12.0 12.0 63.0
V. GRAND TOTAL 580.4 932.6 972.8 1097.6 1088.8 1111.2 6783.0
Source: Mission's Estimates on the Basis of Information Provided by:CADAFE, EDELCA, ENELVEN and ENELBAR
Total Investment Figures for 1994 Ind 1996 for ENELVEN and ENELBARProjected by the Mission
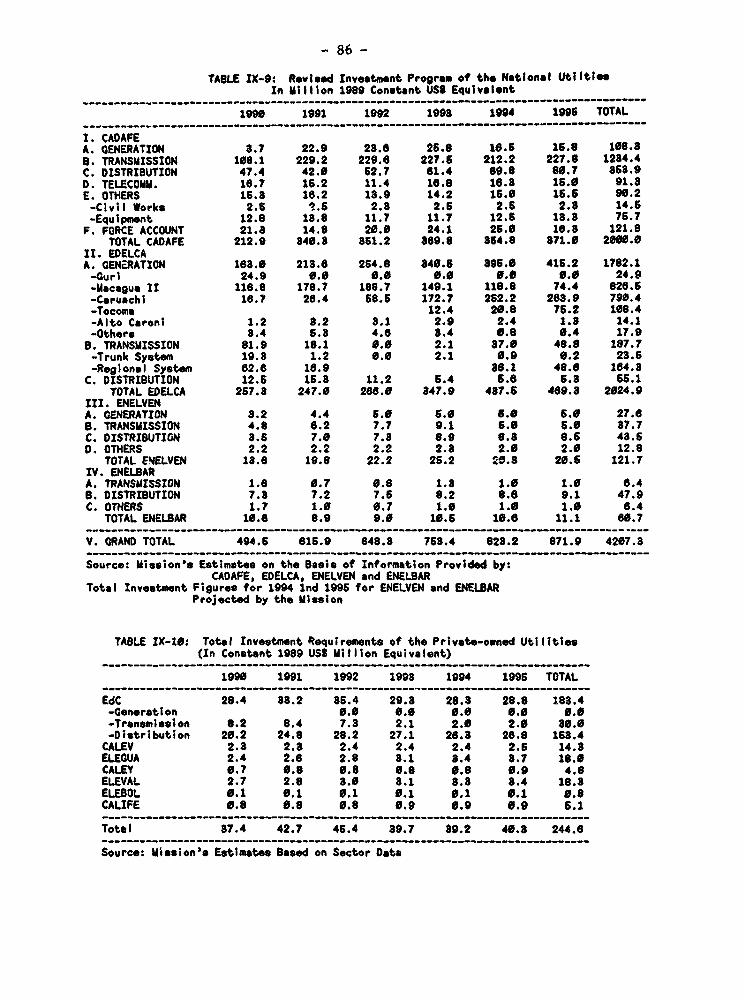
- 86 -
TAOLE IX-9: Revised Investment Program of tho Natlonal UtiltiesIn Million 1989 Conobant US8 Equivslent
-------------------------------------------------------------- __----_-_------__-----------
1990 1991 1992 1998 1994 1995 TOTAL------------------------------------------------------------------ __---------__-----------
I. CADAFEA. GENERATION 8.7 22.9 28.0 26.8 16.6 15.6 166.8B. TRANSMISSION 108.1 229.2 229.0 227.6 212.2 227.6 1284.4C. DISTRIBUTION 47.4 42.0 S2.7 61.4 69.s 80.7 858.9D. TELECOMM. 16.7 16.2 11.4 16.6 16.8 16.0 91.8E. OTHERS 15.8 16.2 18.9 14.2 16.0 15.6 90.2-Civil Works 2.6 ?.S 2.8 2.6 2.6 2.8 14.6-Equipment 12.6 18.6 11.7 11.7 12.6 18.8 76.7F. FORCE ACCOUNT 21.a 14.6 20.0 24.1 26.0 16.8 121.8
TOTAL CADAFE 212.9 840.8 861.2 a89.8 854.6 871.0 200.0II. ECELCAA. GENERATION 168.0 218.6 264.8 840.5 865.0 415.2 1782.1-curl 24.9 0.0 0.0 0.0 0.0 0.0 24.9-Uscagus U 116.6 178.7 188.7 149.1 116.6 74.4 626.6-Caruachl 16.7 28.4 68.6 172.7 252.2 268.9 790.4-Tocomn 12.4 20.8 75.2 108.4-Alto Caroni 1.2 8.2 8.1 2.9 2.4 1.8 14.1-Others 8.4 5.8 4.6 8.4 0.8 0.4 17.9B. TRANSMISSION 61.9 18.1 0.0 2.1 87.0 48.6 187.7-Trunk System 19.8 1.2 0.0 2.1 0.9 0.2 28.6-Regional System 62.6 18.9 86.1 46.8 164.8
C. DISTRIBUTION 12.6 15.8 11.2 5.4 6.6 5.8 56.1TOTAL EDELCA 257.8 247.0 268.0 847.9 487.6 469.8 2024.9
III. ENELVENA. GENERATION 8.2 4.4 6.0 6.0 6.0 5.0 27.6B. TRANSMISSION 4.8 6.2 7.t 9.1 6.0 6.0 87.7C. DISTRIBUTION 8.5 7.0 7.8 8.9 6.8 8.6 48.6D. OTHERS 2.2 2.2 2.2 2.8 2.0 2.0 12.8
TOTAL E4ELVEN 18.8 19.8 22.2 26.2 20.8 20.6 121.7IV. ENELBARA. TRANSMISSION 1.8 0.7 0.6 1.8 1.0 1.0 8.4B. DISTRIBUTION 7.8 7.2 7.6 6.2 8.6 9.1 47.9C. OTHERS 1.7 1.6 0.7 1.0 1.6 1.0 6.4
TOTAL ENELBAR 16.6 8.9 9.0 10.5 10.6 11.1 60.7
V. GRAND TOTAL 494.6 615.9 648.8 768.4 628.2 671.9 4207.8
Source: Mission's Estimates on the Basis of Information Provided by:CADAFE, EDELCA, ENELVEN and ENELBAR
Total Investment Figures for 1994 Ind 1996 for ENELVEN and ENELBARProjected by the Mission
TABLE IX-10: Total Investment Requirements of the Private-owned Utilities(In Constant 1989 US: Million Equivalent)
--------------------------------------------------------- __------------------_
1990 1991 1992 1998 1994 1996 TOTAL
EdC 26.4 88.2 86.4 29.8 28.3 28.8 188.4-Generation 0.0 0.0 0.0 6.0 0.6-Transmission 6.2 6.4 7.8 2.1 2.0 2.0 86.6-Distribution 20.2 24.6 28.2 27.1 26.3 26.8 165.4CALEV 2.8 2.8 2.4 2.4 2.4 2.6 14.8ELEGUA 2.4 2.6 2.6 8.1 8.4 8.7 16.0CALEY 0.7 0.8 0.6 0.8 0.8 0.9 4.8ELEVAL 2.7 2.8 8.0 8.1 8.8 8.4 16.8ELEBOL 0.1 0.1 0.1 0.1 0.1 0.1 0.8CALIFE 60. 0.8 0.8 0.9 0.9 0.9 6.1
Total 87.4 42.7 45.4 39.7 89.2 46.8 244.6
Source: Mission's Estimates Based on Sector Data
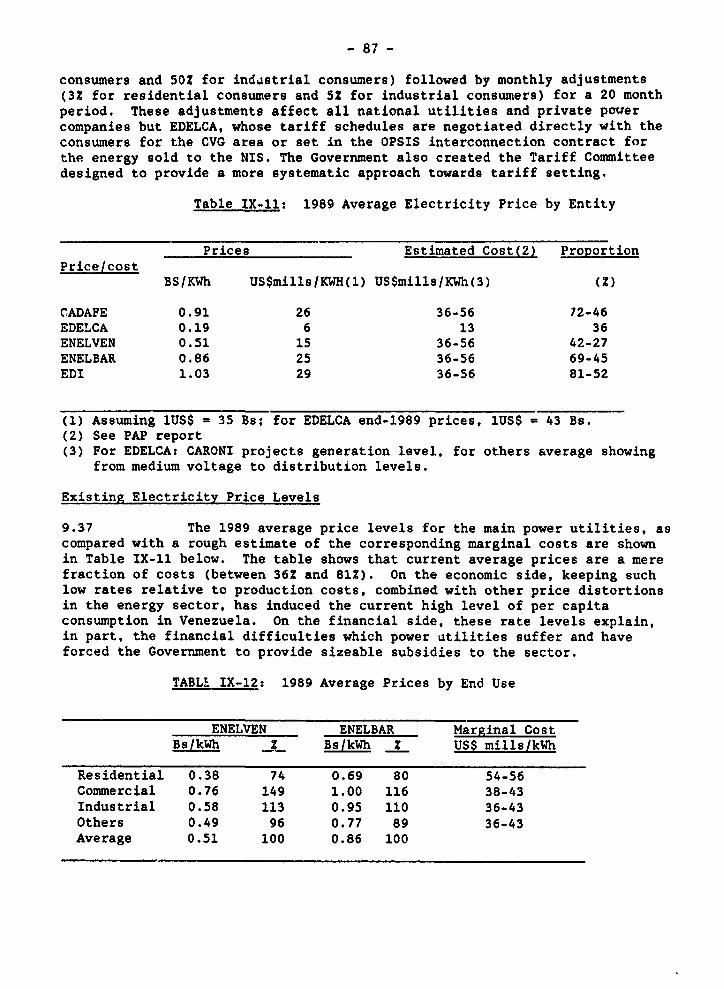
- 87 -
consumers and 502 for indastrial consumers) followed by monthly adjustments(3Z for residential consumers and 52 for industrial consumers) for a 20 monthperiod. These adjustments affect all national utilities and private powercompanies but EDELCA, whose tariff schedules are negotiated directly with theconsumers for the CVG area or set in the OPSIS interconnection contract forthe energy sold to the NIS. The Government also created the Tariff Committeedesigned to provide a more systematic approach towards tariff setting.
Table IX-l1: 1989 Average Electricity Price by Entity
Prices Estimated Cost(2) ProportionPrice/cost
BS/KWh US$mills/KWH(l) US$mills/KWh(3) (Z)
C-ADAFE 0.91 26 36-56 72-46EDELCA 0.19 6 13 36ENELVEN 0.51 15 36-56 42-27ENELBAR 0.86 25 36-56 69-45EDI 1.03 29 36-56 81-52
(1) Assuming lUS$ = 35 Bs; for EDELCA end-1989 prices, lUS$ = 43 Bs.(2) See PAP report(3) For EDELCA: CARONI projects generation level, for others average showing
from medium voltage to distribution levels.
Existing Electricity Price Levels
9.37 The 1989 average price levels for the main power utilities, ascompared with a rough estimate of the corresponding marginal costs are shownin Table IX-ll below. The table shows that current average prices are a merefraction of costs (between 362 and 81?). On the economic side, keeping suchlow rates relative to production costs, combined with other price distortionsin the energy sector, has induced the current high level of per capitaconsumption in Venezuela. On the financial side, these rate levels explain,in part, the financial difficulties which power utilities suffer and haveforced the Government to provide sizeable subsidies to the sector.
TABLE IX-12: 1989 Average Prices by End Use
ENELVEN ENELBAR Marginal CostBs/kWh ? Bs/kWh 2 USS mills/kWh
Residential 0.38 74 0.69 80 54-56Commercial 0.76 149 1.00 116 38-43Industrial 0.58 113 0.95 110 36-43Others 0.49 96 0.77 89 36-43Average 0.51 100 0.86 100
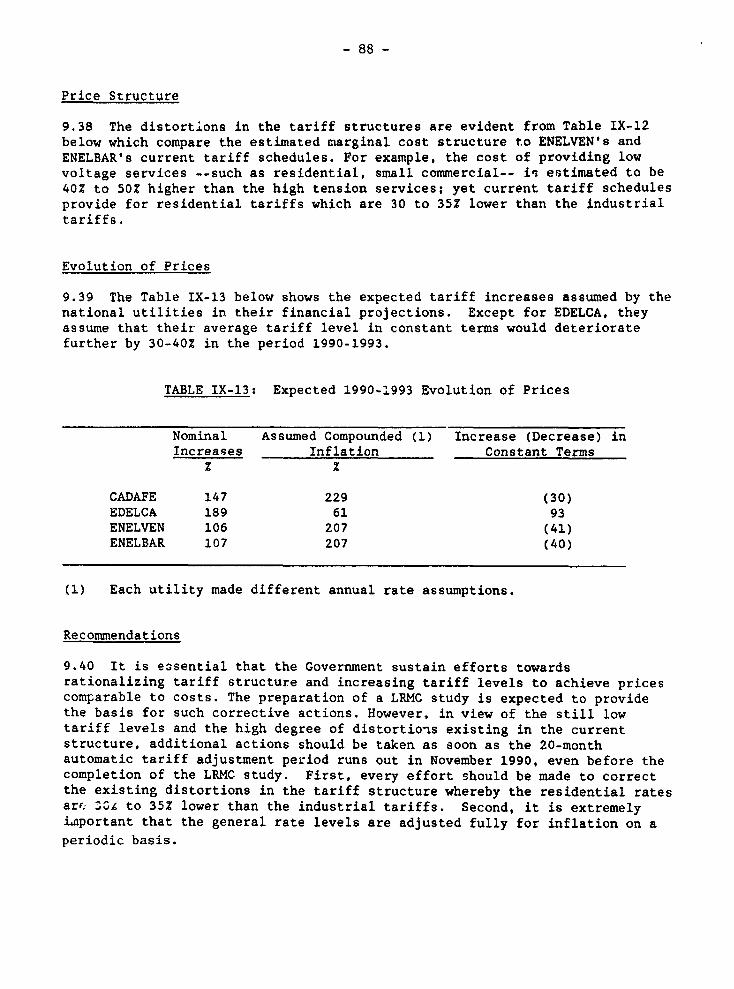
- 88 -
Price Structure
9.38 The distortions in the tariff structures are evident from Table IX-12below which compare the estimated marginal cost structure to ENELVEN's andENELBAR's current tariff schedules. For example, the cost of providing lowvoltage services --such as residential, small commercial-- in estimated to be40% to 50Z higher than the high tension services; yet current tariff schedulesprovide for residential tariffs which are 30 to 35Z lower than the industrialtariffs.
Evolution of Prices
9.39 The Table IX-13 below shows the expected tariff increases assumed by thenational utilities in their financial projections. Except for EDELCA, theyassume that their average tariff level in constant terms would deterioratefurther by 30-40Z in the period 1990-1993.
TABLE IX-13: Expected 1990-1993 Evolution of Prices
Nominal Assumed Compounded (1) Increase (Decrease) inIncreases Inflation Constant Terms
z z
CADAFE 147 229 (30)EDELCA 189 61 93ENELVEN 106 207 (41)ENELBAR 107 207 (40)
(1) Each utility made different annual rate assumptions.
Recommendations
9.40 It is e3sential that the Government sustain efforts towardsrationalizing tariff structure and increasing tariff levels to achieve pricescomparable to costs. The preparation of a LRMC study is expected to providethe basis for such corrective actions. However, in view of the still lowtariff levels and the high degree of distortio-is existing in the currentstructure, additional actions should be taken as soon as the 20-monthautomatic tariff adjustment period runs out in November 1990, even before thecompletion of the LRMC study. First, every effort should be made to correctthe existing distortions in the tariff structure whereby the residential ratesare. 3z to 35Z lower than the industrial tariffs. Second, it is extremelyi.nportant that the general rate levels are adjusted fully for inflation on aperiodic basis.
Chapter 10
Investments in Natural Gas
A. Background
Introduction
10.1 Natural gas plays a limited role in the energy economy of Venezueladespite a national policy to encourage its use. It is used as an industrialfuel and to generate electricity, to replace exportable fuels in theresidential/commercial sector; and may become an important fuel in thetransport sector. The public sector investment in natural gas will be smallcompared to total investment in the petroleum sector. Nonetheless, givenits interrelationship with other sectors, its long term availability andprices will affect other components of the public sector investment program.
10.2 The present chapter reviews the investment program of the Government-owned natural gas production, transportation and distribution companies fromthe standpoint od meeting anticipated market requirements, and to recommendany changes which might be required. It deals with:
- Supply and production capacity, including the development programfor associated and non-associated gas.
- Expansion of the high-pressure pipeline network and urbandistribution networks.
- The investment required for the expansion program and thatrequired for converting fuel oil customers to natural gas anddeveloping new markets.
- Plans for exporting products derived from natural gas andliquefied natural gas.
- The method of financing the investment program including sourcesof funds.
- Pricing policies for natural gas and competitive fuel pricestructure which could affect substitution.
- Opportunities for potential investment savings.
10.3 Venezuela is fortunate in possessing a large hydrocarbon resourcebase to meet internal needs and provide a large expo -able surplus of crudeoil and refined products. In 1988 oil production was 692 million barrels andgross natural gas production -- including reinjected gas and losses -- was38.5 billion cubic meters (1.36 trillion cubic feet). Approximately one-thirdof the gas was reinjected into the oil fields to maintain pressure and
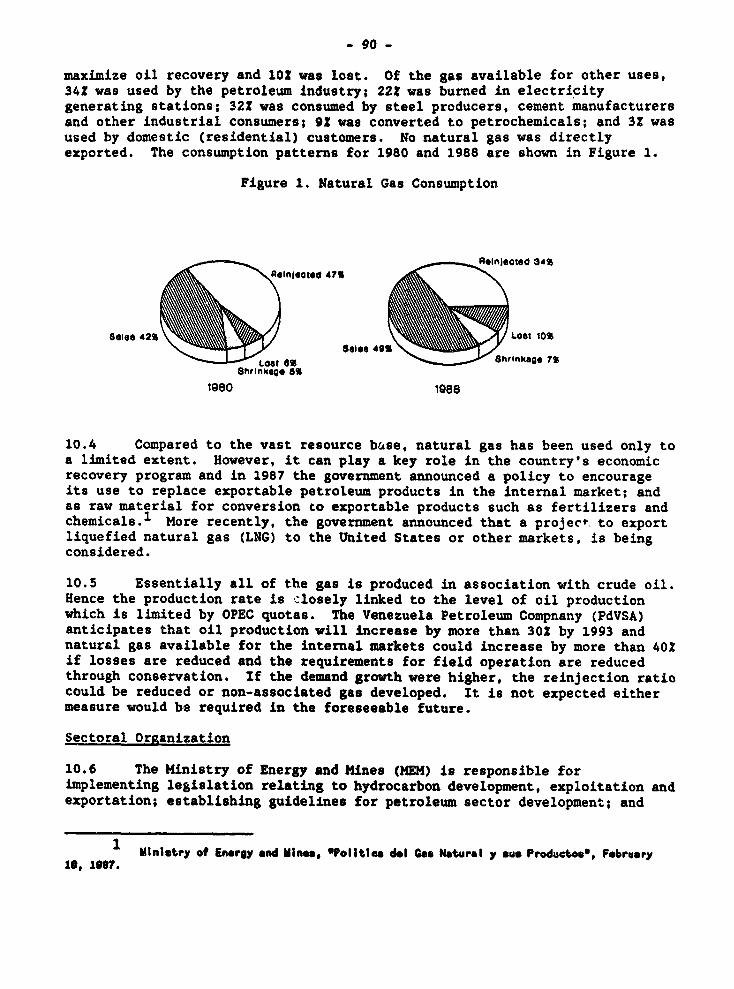
- 90 -
maximize oil recovery and 102 was lost. Of the gas available for other uses,342 was used by the petroleum industry; 22t was burned in electricitygenerating stations; 321 was consumed by steel producers, cement manufacturersand other industrial consumers; 91 was converted to petrochemicals; and 3Z wasused by domestic (residential) customers. No natural gas was directlyexported. The consumption patterns for 1980 and 1988 are shown in Figure 1.
Figure 1. Natural Gas Consumption
R*6nMeSMe0 34%~~InI.o:1nJW0 471 h l ka e7
8s1,8 4216 Lost io%Soles 401
Shrinftsge 81 ~ ~ ~ ~ ~~inag ?
1980 1988
10.4 Compared to the vast resource base, natural gas has been used only toa limited extent. However, it can play a key role in the country's economicrecovery program and in 1987 the government announced a policy to encourageits use to replace exportable petroleum products in the internal market; andas raw material for conversion to exportable products such as fertilizers andchemicals.' More recently, the government announced that a project to exportliquefied natural gas (LNG) to the United States or other markets, is beingconsidered.
10.5 Essentially all of the gas is produced in association with crude oil.Hence the production rate is closely linked to the level of oil productionwhich is limited by OPEC quotas. The Venezuela Petroleum Compnany (PdVSA)anticipates that oil production will increase by more than 30Z by 1993 andnatural gas available for the internal markets could increase by more than 402if losses are reduced and the requirements for field operation are reducedthrough conservation. If the demand growth were higher, the reinjection ratiocould be reduced or non-associated gas developed. It is not expected eithermeasure would be required in the foreseeable future.
Sectoral Organization
10.6 The Ministry of Energy and Mines (MEM) is responsible forimplementing legislation relating to hydrocarbon development, exploitation andexportation; establishing guidelines for petroleum sector development; and
1 Ministry of Energy and Mines, 'Politite del XI. Natural y *u* Produces, Februory1B, 1f97.
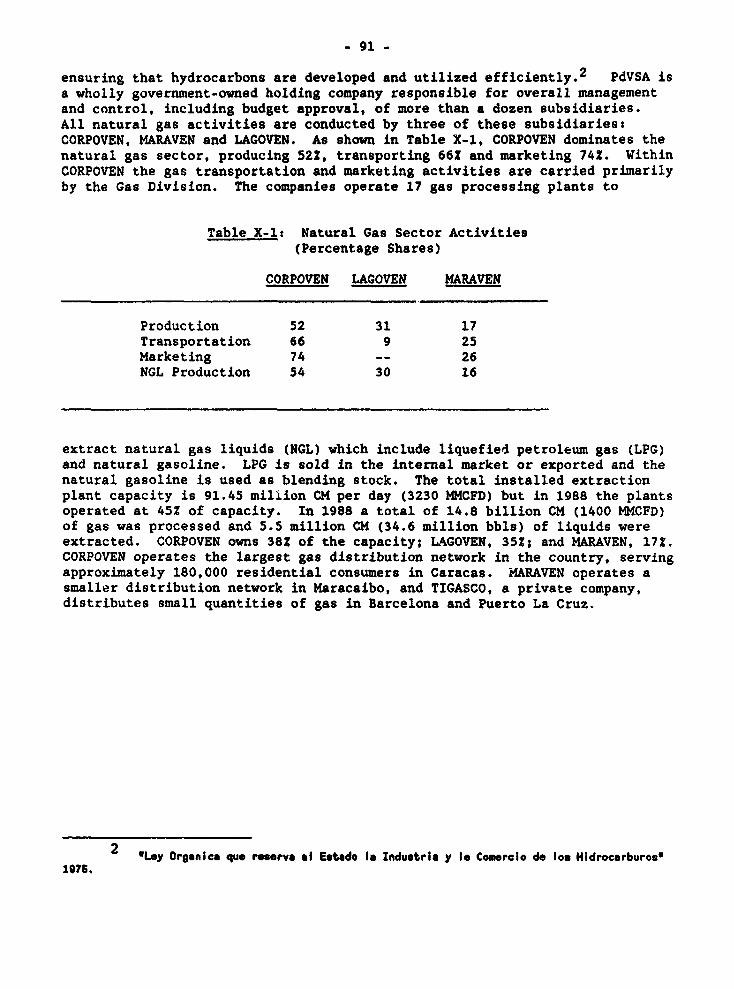
- 91 -
ensuring that hydrocarbons are developed and utilized efficiently.2 PdVSA isa wholly government-owned holding company responsible for overall managementand control, including budget approval, of more than a dozen subsidiaries.All natural gas activities are conducted by three of these subsidiaries:CORPOVEN. MARAVEN and LAGOVEN. As shown in Table X-1, CORPOVEN dominates thenatural gas sector, producing 522, transporting 66S and marketing 74Z. WithinCORPOVEN the gas transportation and marketing activities are carried primarilyby the Gas Division. The companies operate 17 gas processing plants to
Table X-1: Natural Gas Sector Activities(Percentage Shares)
CORPOVEN LAGOVEN MARAVEN
Production 52 31 17Transportation 66 9 25Marketing 74 -- 26NGL Production 54 30 16
extract natural gas liquids (NGL) which include liquefied petroleum gas (LPG)and natural gasoline. LPG is sold in the internal market or exported and thenatural gasoline is used as blending stock. The total installed extractionplant capacity is 91.45 million CM per day (3230 MHCFD) but in 1988 the plantsoperated at 45Z of capacity. In 1988 a total of 14.8 billion CM (1400 MKCFD)of gas was processed and 5.5 million CM (34.6 million bbls) of liquids wereextracted. CORPOVEN owns 382 of the capacity; LAGOVEN, 35?; and MARAVEN, 172.CORPOVEN operates the largest gas distribution network in the country, servingapproximately 180,000 residential consumers in Caracas. MARAVEN operates asmaller distribution network in Maracaibo, and TIGASCO, a private company,distributes small quantities of gas in Barcelona and Puerto La Cruz.
2 Lay Organics quo reserva al Estado la Industria y le Comrclo do los Hidrocarburos'1976.
- 92 -
B. Supply and Production Capability
Natural Gas Reserves
10.7 Total proved reserves of natural gas, as of December 31, 1988, areestimated to be 3,010 billion CM (106 trillion CF), of which 882 areassociated gas. The total volume of proved reserves would be more thanadequate to meet the short term and long term requirements. In most countriesa reserve/production ratio of 15 years would be considered sufficient. InVenezuela the R/P ratio is 111 years. While the reserves are vast, theiravailability should be put into proper context; some of the reserves probablywill not be available for the internal market for several decades.Approximately one-third of the reserves are associated with extra-heavy crudeoil. However, PdVSA plans to increase production of lighter crude oils whichhave a higher export value. Therefore, the gas associated with extra-heavycrude oil probably will not be available for at least two or three decades.The non-associated reserves which are estimated at 365 billion CM (13 TCF)probably will be reserved for export because, by law, associated gas cannot beexported. The LNG export project, if it is implemented, must utilize non-associated gas and, tentatively, the reserves in the Monagas region have beenset aside for the project. These reserves could support two LNG projects ofthe size now being considered. In terms of gross reserves, there is no doubtthat proved reserves are sufficient to meet any reasonable projected demandsfor the next two decades and probubly well beyond. Even if the presentestimates turned out to be highly overstated, it is estimated that there areadditional 3,500 billion CM (123 TCF) of probable and possible reserves yet tobe discovered.
Natural Gas Production and Gas-Oil Ratio
10.8 Natural gas availability will be closely linked to the level of crudeoil production. If OPEC quotas were cut, production of associated gas wouldalso drop unless the losses were reduced or the reinjection rate were cutback. Some non-associated gas could be produced but additional investmentwould be required to develop the fields. Hence its economic cost would behigher than that of associated gas. Therefore, so long as associated gassupplies are adequate to meet internal needs, non-associated gas product'-onwill be very limited, and it will not play a significant role in the in._ernalsupply system.
10.9 PdVSA anticipates that both the oil production and the gas-oil-ratio(GOR) will increase. The GOR will increase as more light crude oil isproduced and field consumption and losses decline. PdVSA has projected thatreinjection, which now accounts for 34% of gross production, will decline to24% by 1993. No official projections of loss reduction were available, but areasonable target would be a 20% reduction by 1993. Based on these factors,gas available for internal requirements could be increased from the 1988 levelof 31.3 CM/bbl, to 37.9 CM/bbl in 1993 even if the GOR, based on grossproduction, were to stay constant.
- 93 -
10.10 PdVSA's policy is to maintain surplus oil production capacity, i.e.,the actual production capacity is well above the OPEC quota. This providesflexibility to shut some wells for maintenance and would allow PdVSA toincrease production quickly if quotas were suddenly increased. The investmentprogram for the 1989 - 1993 period is intended to increase oil productioncapacity from 2.7 million barrels per day (BPD) to 2.96 million BPD. Theactual level of production is projected to increase from 1.8 million BPD in1989 to 2.4 million BPD in 1993, in effect reducing the excess capacity from33Z in 1989 to 19Z in 1993. However, these are only projections and theactual oil production level will be set by OPEC quotas which in turn depend onmany exogenous factors such as world economic growth, energy prices andgeopolitical conditions. Although the course ot oil prices and OPEC quotas isuncertain, MARAVEN has projected the level of oil production for threescenarios:
- A "business as usual" scenario based on continuation of currentOPEC policies and gradually increasing production quotas.
- A scenario under which prices are held down and productionrapidly increases.
- A scenario under which prices increase rapidly until 1992 butfall suddenly because of over-production by OPEC members.
MARAVEN considers the 'business as usual" scenario as the most likely and thebest basis for medium term planning. They project a production rate of 2.3million BPD Jn 1993, based on international prices in the range of $16 -18/bbl. MALUVEN now believes that the projected production rate should beincreased to reflect price increases in 1989. Their BAU projection comparesclosely with PdVSA's projection of 2.4 million BPD and should be aconservative estimate on which to base the rate of gas production. Figure 2shows the estimated level of net gas production, i.e. gas available for theinternal market including extractable liquids if the overall GOR is unchangedand if it increases by 2% per year until 1993.
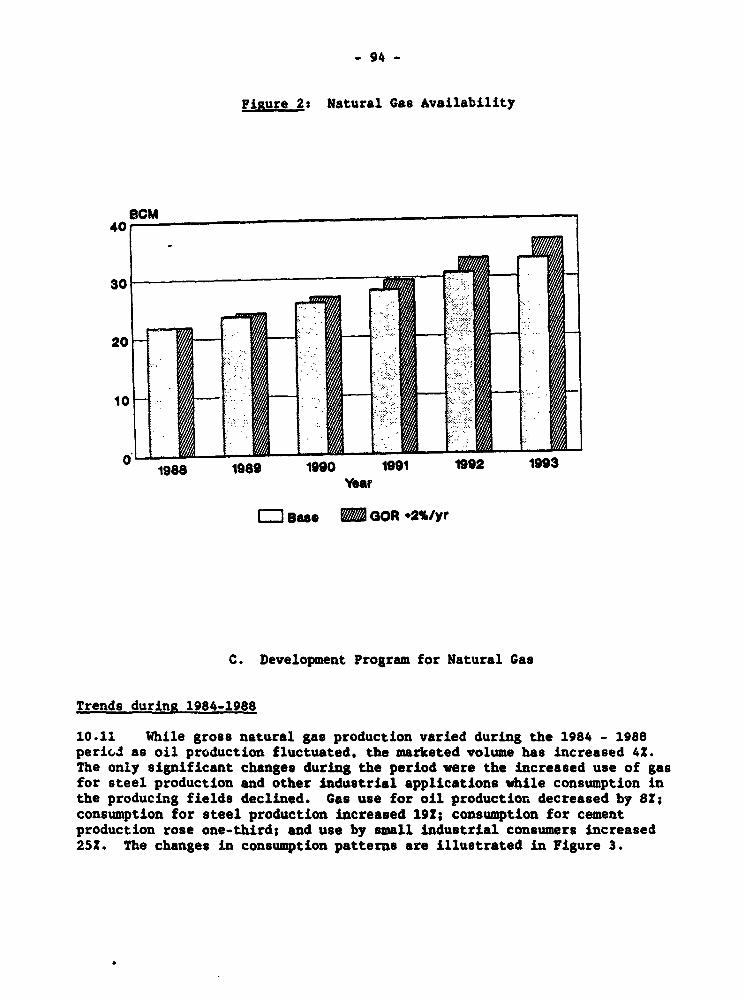
- 94 -
Figure 2: Natural Gas Availability
8Cm40
30
10
1988 1989 1990 1091 1992 1993Year
l Bao M GOR 2%/yr
C. Development Program for Natural Gas
Trends durina 1984-1988
10.11 While gross natural gas production varied during the 1984 - 1988perio as oil production fluctuated, the marketed volume has increased 4Z.The only significant changes during the period were the Increased use of gasfor steel production and other industrial applications while consumption inthe producing fields declined. Gas use for oil production decreased by 8Z;consumption for steel production increased 19S; consumption for cementproduction rose one-third; and use by small industrial consumers increased25Z. The changes in consumption patterns are illustrated in Figure 3.
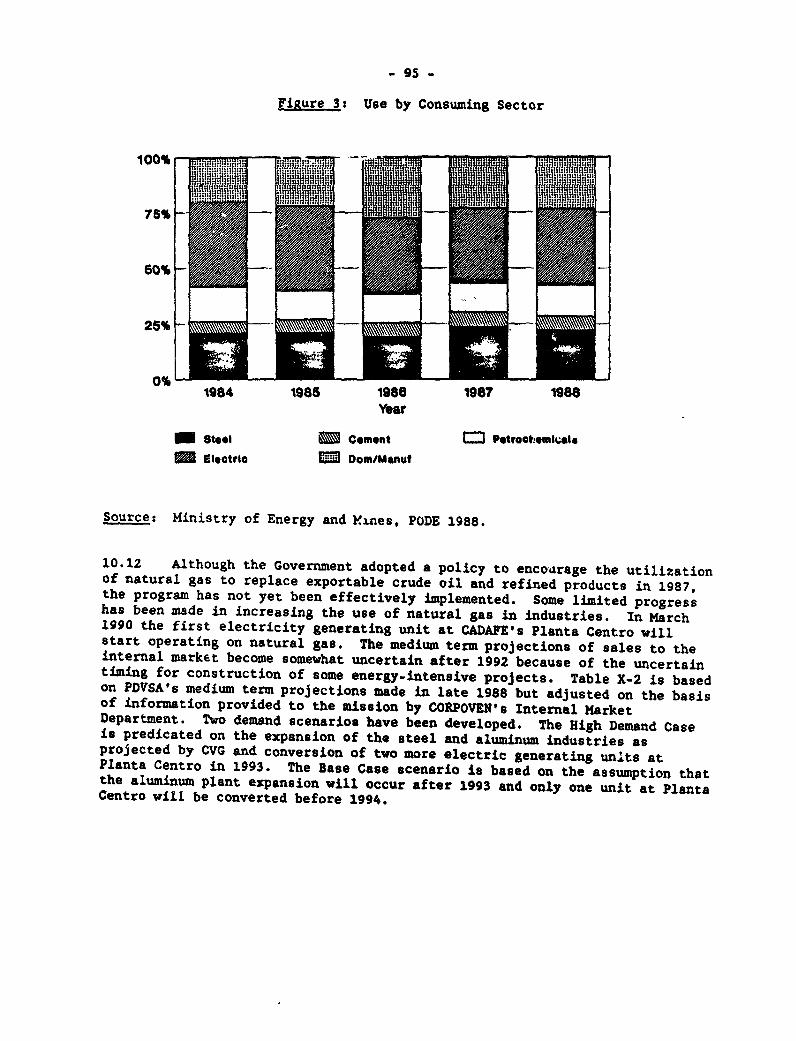
- 95 -
FiRure 3: Use by Consuming Sector
100% i--g F
60% _
0%1984 1985 1986 1987 1988
Year
teel *1 Cement = PtrooI!emkv:l.
Electric Em Dom/Manut
Source: Ministry of Energy and Fines, PODE 1988.
10.12 Although the Government adopted a policy to encourage the utilizationof natural gas to replace exportable crude oil and refined products in 1987,the program has not yet been effectively implemented. Some limited progresshas been made in increasing the use of natural gas in industries. In March1990 the first electricity generating unit at CADAFE's Planta Centro willstart operating on natural gas. The medium term projections of sales to theinternal market become somewhat uncertain after 1992 because of the uncertaintiming for construction of some energy-intensive projects. Table X-2 is basedon PDVSA's medium term projections made in late 1988 but adjusted on the basisof information provided to the mission by CORPOVEN's Internal MarketDepartment. Two demand scenarios have been developed. The High Demand Caseis predicated on the expansion of the steel and aluminum industries asprojected by CVG and conversion of two more electric generating un'ts atPlanta Centro in 1993. The Base Case scenario is based on the assumption thatthe aluminum plant expansion will occur after 1993 and only one unit at PlantaCentro will be converted before 1994.
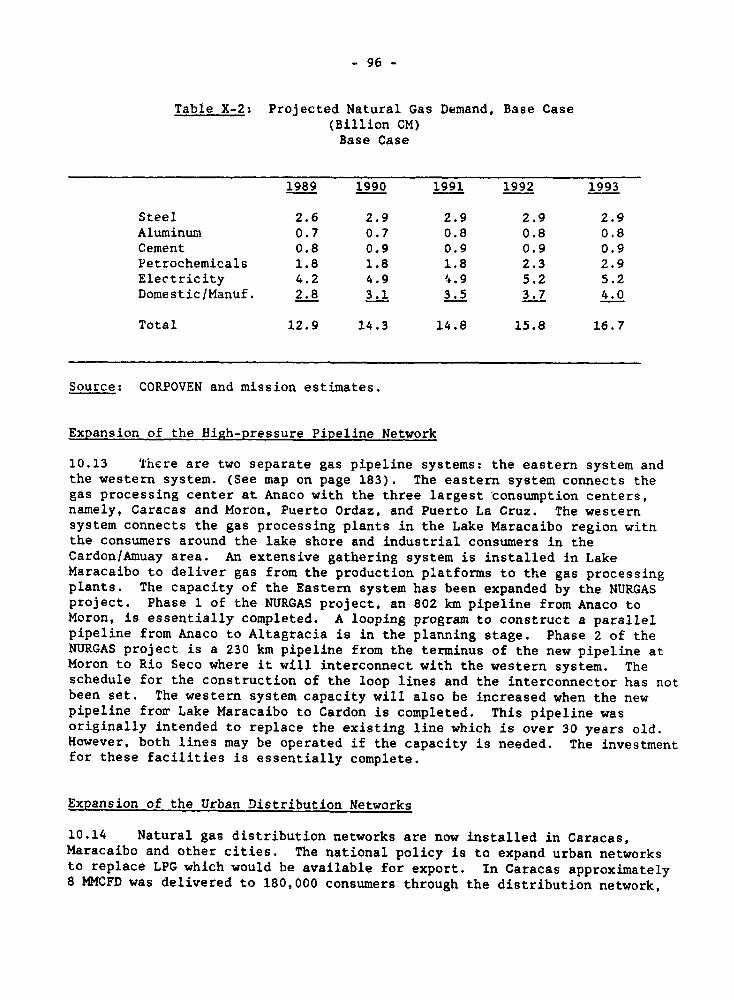
- 96 -
Table X-2: Projected Natural Gas Demand, Base Case(Billion CM)Base Case
1989 1990 1991 1992 1993
Steel 2.6 2.9 2.9 2.9 2.9Aluminum 0.7 0.7 0.8 0.8 0.8Cement 0.8 0.9 0.9 0.9 0.9Petrochemicals 1.8 1.8 1.8 2.3 2.9Electricity 4.2 4.9 4.9 5.2 5.2Domestic/Manuf. 2.8 3.1 3.5 3.7 4.0
Total 12.9 14.3 14.8 15.8 16.7
Source: CORPOVEN and mission estimates.
Expansion of the High-pressure Pipeline Network
10.13 There are two separate gas pipeline systems: the eastern system andthe western system. (See map on page 183). The eastern system connects thegas processing center at Anaco with the three largest consumption centers,namely, Caracas and Moron, Puerto Ordaz, and Puerto La Cruz. The westernsystem connects the gas processing plants in the Lake Maracaibo region witnthe consumers around the lake shore and industrial consumers in theCardon/Amuay area. An extensive gathering system is installed in LakeMaracaibo to deliver gas from the production platforms to the gas processingplants. The capacity of the Eastern system has been expanded by the NURGASproject. Phase 1 of the NURGAS project, an 802 km pipeline from Anaco toMoron, is essentially completed. A looping program to construct a parallelpipeline from Anaco to Altagracia is in the planning stage. Phase 2 of theNURGAS project is a 230 km pipeline from the terminus of the new pipeline atMoron to Rio Seco where it will interconnect with the western system. Theschedule for the construction of the loop lines and the interconnector has notbeen set. The western system capacity will also be increased when the newpipeline fror Lake Maracaibo to Cardon is completed. This pipeline wasoriginally intended to replace the existing line which is over 30 years old.However, both lines may be operated if the capacity is needed. The investmentfor these facilities is essentially complete.
Expansion of the Urban Distribution Networks
10.14 Natural gas distribution networks are now installed in Caracas,Maracaibo and other cities. The national policy is to expand urban networksto replace LPG which would be available for export. In Caracas approximately8 MMCFD was delivered to 180,000 consumers through the distribution network,
- 97 -
and in Maracaibo sales averaged 4 MMCFD. The average consumption for allcustomers, both residential and commercial, was 38 cubic meters per month,Residential consumers use gas primarily for cooking and some water heating butthe consumption per household is very low and may not justify construction ofa distribution network. Nevertheless, CORPOVEN expects the private sector toinstall and expar.d distribution networks in Valencia, Barquesimito, Maracayand other cities.
10.15 CORPOVEN marketing officials think that the revenue could beincreased by selling gas for additional uses such as air-conditioning. Whilegas-fired air-conditioning is economical for new multi-family dwellings, itsuse in individual residences or as a retrofit system in existing buildings isvery questionable. In order to increase total revenues the distributor wouldhave to set the commercial tariff at a level higher than the LRF3 or the fullyallocated cost of supplying the gas. The 'excess" revenue generated by thecommercial customers would then be used to subsidize the residentialcustomers. Other uses would be limited. Commercial clothes drying and foodprocessing would increase the commercial sales, but few residential customerswould be able to use these appliances. One potential market which has notbeen considered is cogeneration of electricity and thermal energy. Commercialand small industrial customers may have the requisite balance of electricaland thermal load to make such a system economical. But until electric energyprices are raised to the LRMC, there will be no incentive for consumers toinvest in cogeneration equipment.
10.16 The distribution networks are expected to expand most rapidly inCaracas and cities which will be attached to the high pressure pipelinesystem. The network in Maracaibo is old and will require rehabilitation, butnew customer attachments will be limited. The rate of growth of thedistribution networks will depend primarily on the impetus provided by thegovernment. Programs to reduce the initial cost, such as loans to high-incomeconsumers and subsidies to lower-income users would accelerate systemexpansion. Based on an 82 per year growth rate, the investment would be inthe range of $10 million annually. CORPOVEN expects this investment will beprovided by the private sector, but unless changes are made to assure thedistributors an attractive return on investment, the investment will probablyhave to be made by CORPOVEN.
D. Irvestment Requirements
10.17 The Nationalization Law of 1975 reserves to the state all activitiesfor producing, transporting, and commercializing petroleum and wet naturalgas. Since then, almost all of the investment in the natural gas sector wasprovided by PdVSA or its subsidiaries. The private sector made smallinvestments in the distribution networks and several joint public/privateventures to convert natural gas to chemicals are under consideration. The1990-93 investment plan includes Bs.384 billion for the petroleum sector. Asoriginally proposed, PdVSA would provide 100Z of the investment inexploration, production, fertilizer plants and internal market development.The private sector would provide 802 of the investment required for newrefining facilities, 35Z of the petrochemical sector investment (total
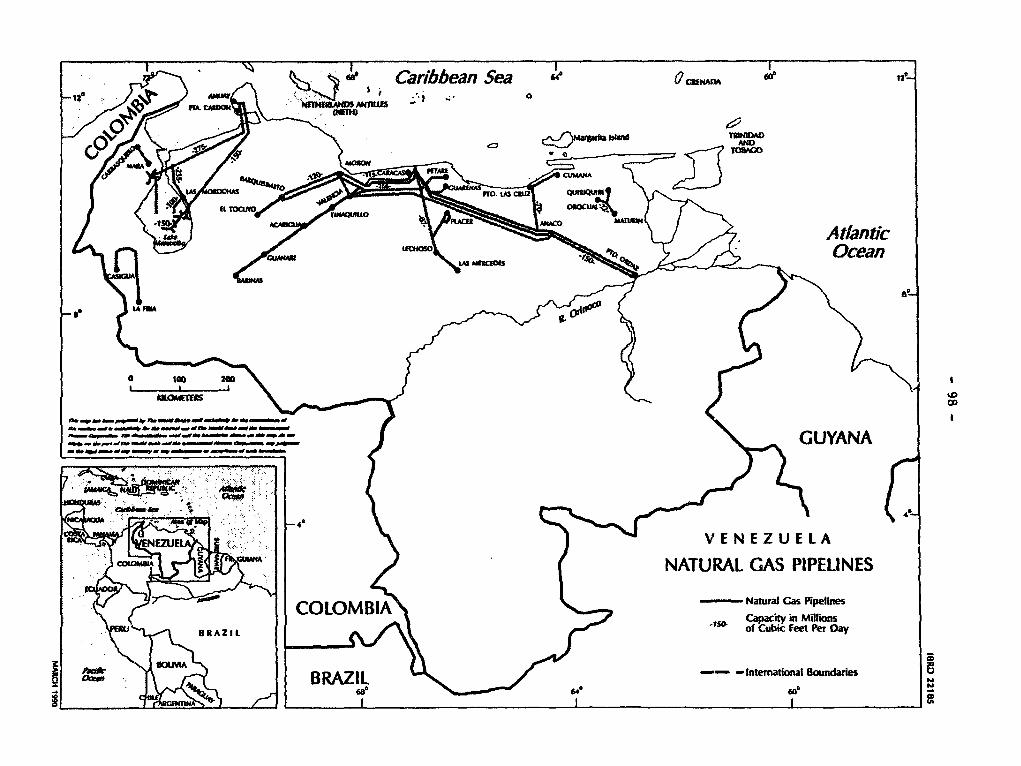
fz 4e % Caribbean Sea O ONc
FM~~~~~~~~~~~~~~~~~~~~~~~~~~~~~~~~~~~~~~~~~~~a
ILOA*1US to~~~~~~~~~~~~~~~~~TCA
MAUNAUA GA PPLNS
/ 7 6/ t1 >7. ~~~~~~~~~~~~~~~~~Atlantic
Cpat n M Ocean
1~~~~~~~~~~~~~~~~~~~~~~~~~~' of Cubi lee Je a
LA Mm IA
eio I 64 6 r
OD
_a, " v _ _S s o |~~~~GYAN7. * - _ _ n _ * v*f
X R _4e 9 > ~~V E NEZ U ELA. 2< < / ( ~~~~~~~~~NATURAL GAS PIPELINES
N < \ > Capac'Ry~~~~~~~CLO in MwilrKms<'< } 0RAZlt \& J '79> of ~~~~~~~~~~~~~~~~~~45- CwbZc fee Per Day_
8 > 2 BRAZIL k 91.11AA -Inteaionl Boundaries
X W > Y I I . .. B
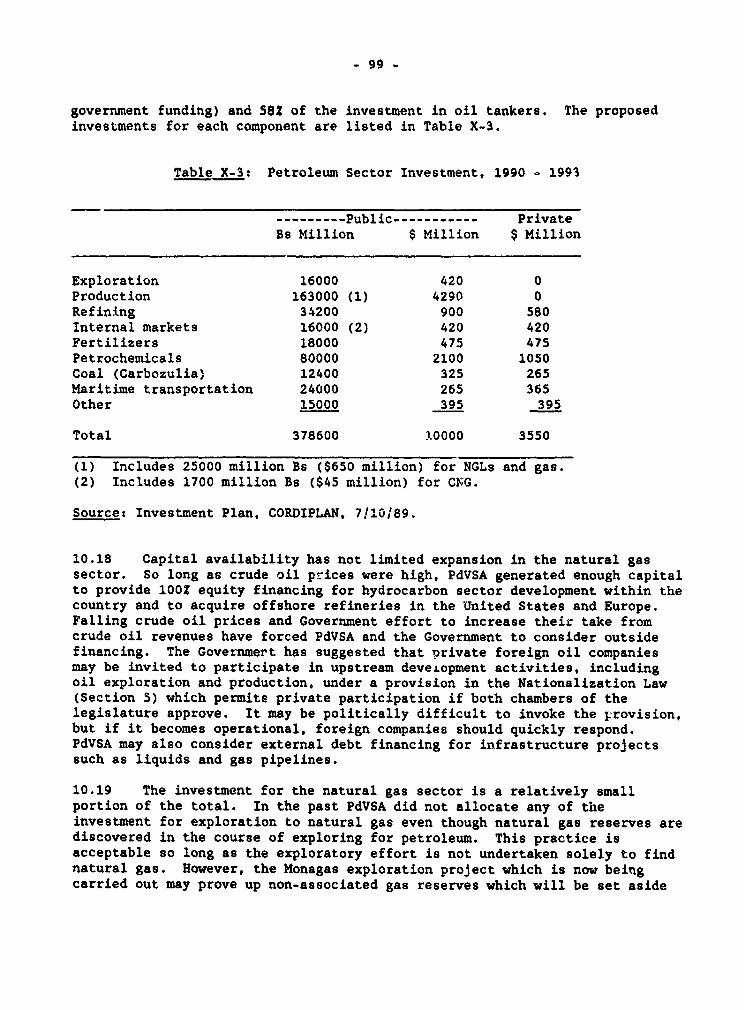
- 99 -
government funding) and 582 of the investment in oil tankers. The proposedinvestments for each component are listed in Table X-3.
Table X-3: Petroleum Sector Investment, 1990 - 1993
---------Public----------- PrivateBs Million $ Million $ Million
Exploration 16000 420 0Production 163000 (1) 4290 0Refining 34200 900 580Internal markets 16000 (2) 420 420Fertilizers 18000 475 475Petrochemicals 80000 2100 1050Coal (Carbozulia, 12400 325 265Maritime transportation 24000 265 365Other 15000 395 395
Total 378600 10000 3550
(1) Includes 25000 million Bs ($650 million) for NGLs and gas.(2) Includes 1700 million Bs ($45 million) for CKG.
Source: Investment Plan, CORDIPLAN, 7!1/G:89.
10.18 Capital availability has not limited expansion in the natural gassector. So long as crude oil prices were high, PdVSA generated enough capitalto provide 1002 equity financing for hydrocarbon sector development within thecountry and to acquire offshore refineries in the United States and Europe.Falling crude oil prices and Government effort to increase their take fromcrude oil revenues have forced PdVSA and the Government to consider outsidefinancing. The Governmert has suggested that private foreign oil companiesmay be invited to participate in upstream deveiopment activities, includingoil exploration and production, under a provision in the Nationalization Law(Section 5) which permits private participation if both chambers of thelegislature approve. It may be politically difficult to invoke the provision,but if it becomes operational, foreign companies should quickly respond.PdVSA may also consider external debt financing for infrastructure projectssuch as liquids and gas pipelines.
10.19 The investment for the natural gas sector is a relatively smallportion of the total. In the past PdVSA did not allocate any of theinvestment for exploration to natural gas even though natural gas reserves arediscovered in the course of exploring for petroleum. This practice isacceptable so long as the exploratory effort is not undertaken solely to findnatural gas. However, the Monagas exploration project which is now beingcarried out may prove up non-associated gas reserves which will be set aside
- 100 -
for the LNG export project. The cost of this exploration should be allocatedto the LNG project if it is realized. Furthermore, most of the investment inproduction facilities is regarded as a petroleuw sector investment. PdVSA.reported that the budgeted investment for production facilitiec of BS.163billion includes approximately Bs.25 billion for "gas and NGL" which includesthe investment for field facilities such as gas gathering, treatment,reinjection and extraction of natural gas liquids.
10.20 The investment for gathering lines and reinjection equipment isconsidered as a cost of maintaining petroleum production. The basis on whichthe cost of natural gas liquids extraction plants has not been clearly definedbut conventional industry practice is to allocate the investment cost to theliquids extraction costs. If more rigorous cost allocation procedures wereapplied, the cost of that portion of the gas gathering system, which isrequired to supply residue gas for the internal market, should be allocated tothe gas production cost. A comprehensive cost allocation study would beuseful in developing the LRMC for residue gas -- And natural gas liquids-- but the impact on the LRMC of residue gas would be very small.
10.21 In 1989 PdVSA adopted new accounting rules for gas produced from"high GOR" wells. If a well produces more than 11,300 cubic feet of gas perbarrel of liquids, operating costs, including workovers and maintenance arecharged to fae gas production cost. This standard could also be applied tothe capital investment made in production facilities, including the cost ofdrilling and completing the wells. The accounting would be somewhat morecomplicated but it would make it possible to better calculate the true LRMC ofgas production.
10.22 The component of the investment plan which is identifiable as beingsolely related to the natural gas sector is the Bs.1,700 million allocated toimplement a program to substitute compressed natural gas (CING) for gasoline inthe transportation sector. CORPOVEN, responsiblefor implementing implementingthe program has identified a target market of high usage gasoline-fueledvehicles in locales adjacent to the pipelines. The total anticipated marketis 60,000 vehicles out of the national vehicle population of 2 million. Theyestimate 40,000 vehicles will be converted by the end of 1993 and 285refueling stations will. have been built. CORPOVEN's plans is to invest Bs.3.6billion while the private sector is expected to invest approximately Bs.l.Sbillion to Bs.2 billion in conversion equipment. Under the projected scheduleCNG vehŽiles would consume approximately 400 million CM of natural gas in 1995and would substitute 2.5 million barreis of gasoline. CORPOVEN plans toprovide the investment required for the infrastructure of fueling stations andvehicle conversion centers while the vehicle owners will pay for the vehicleconversion kits. The rate of CNG acceptance in the marketplace will bedetermined, in large part, by the price differential between gasoline and CNG.The CNG project is not likely to proceed as scheduled unless the CNG priceand/or the cost of converting vehicles is heavily subsidized.
10.23 In addition to the projects included in the investment programn,several other projects have been proposed by PdVSA affiliates. The largerprojects include:
- 101 -
Expansion of the Anaco - Puerto La Cruz pipeline. The capacityof the pipeline will have to increased to provide natural gas forthe proposed methanol plant at Puerto La Cruz. COPPOVENestimates that a pipeline which would increase capacity by 8.5million CM per day would require investment of Bs.1.5 billion.The proposed 690,000 ton per year methanol plant would requireonly about one-third of the increased capacity so this expansionwould provide enough gas to feed the proposed ammonia plant plusother industrial applications. If the CORPOVEN plan isimplemented, the long run marginal cost of transporting gas fromAnaco to Puerto La Cruz will depends heavily on the rate of loadbuild up. Assuming the methanol plant would start up in 1994;the ammonia plant in 1995; and the throughput would build overthe next four year to full pipeline capacity, the LRMC isestimated to be Bs.O.099/CM ($0.074/MCF). The schedule for themethanol plant is not yet fixed but to avoid delaying themethanol plant, construction should begin at least two yearsprior to the start-up date. In the past PdVSA has provided fullequity financing for projects of this type. It is expected thisproject also will be self-financed.
The East-West interconnection. This interconnection betweenMoron and Rio Seco was to be built as part of the NURGAS projectbut construction has been delayed because there was no immediateneed PdVSA and CORPOVEN are preparing a gas balance analysiswhich will determine when the interconnection will be required.The cost is not included in the current budget but CORPOVENexpects a 30 inch diameter 230 kilometer pipeline would berequired. Based on the estimated cost of the Anaco-Puerto Ordazpipeline, the cost would be approximately $130 - 150 million,depending on the compressor station requirements. The pipelinecould be totally financed by PDVSA but CORPOVEN has expressedinterest in external financing from the World Bank or othersources.
Expansion of the NURGAS capacity. The NURGAS system throughputis expected to increase gradoally as the requirements of theindustrial sector grow and more commercial and residentialconsumers are attached to the distribution networks. Whencommissioned in early 1990, the pipeline should have sufficientcapacity to meet these requirements for the next five yearsincluding the 5 million CM per day allocated to CADAFE's PlantaCentro. The peak demand for each unit is 2.8 million CM per dayso the allocation is sufficient for two units. If the otherunits are converted, system capacity will have to be increased.CORPOVEN is considering a plan to increase the gas processingcapacity at Anaco to 11 - 14 million CM per day. This wouldrequire investment of Bs.2000 million which is not included inthe current program. The cost of these facilities should beallocated to the NGLs produced. Pipeline capacity could beincreased by 210 MMCFD by investing Bs.900 million in compressionstations. This cost is not '.ncluded in the budget. The short
- 102 -
run marginal cost (SRMC) of increasing capacity by installingcompressors would be less than if the pipeline were looped. TheSRMC based n installing compressors is estimated to be Bs.0.155/CM ($0.115/MCF) but if the pipeline were looped the SRMC wouldbe Bs.0.635/CM ($0.475,MCF). However, the economic cost ofproviding additional gas to Planta Centro should not be based onthe SRMC. Both projects probably would be financed frominternally generated funds although CORPOVEN has indicated someinterest in seeking World Bank funds for this type of project.
- MARAVEN has proposed construction of a gas processing p-ant inLake Maracaibo. The purpose is to recover NGLs and to provideadditional residue gas for industrial markets and electricitygeneration. If MARAVEN is able to buy a used plant and installit on an existing platform, the investment may be as low asBs.250 million. On the other hand, if they have to buy a newplant or install a new platform, the cost could be much higher.Construction could start as early as 1991. At present, MARAVENanticipates the project would be internally funded but externaldebt sources are being considered.
10.24 A number of smaller projects are also scheduled. Service lateralswill be extended to industrial consumers in the central region. Centralworkshops and service centers will be built at several locations. Theinvestment required for natural gas related projects which are underconsideration but not yet included in the budget is listed in Table X-4.
10.25 Additional public sector investment will be required to convertelectric generating stations from fuel oil to natural gas. The economicanalyses of converting additional units at Planta Centro which are presentedin the chapter on the power sector indicate that the economic rate of returnwould be very high. It is estimated the cost of converting the four units atPlanta Centro still operating on fuel oil would be Bs.1800 million. ENELVENhas conducted a feasibility study to convert 440 mw of capacity at RamonLaguna station. They estimate the conversion program could be completed intwo years at a cost of about Bs.350 million.
10.26 A project to export liquefied natural gas is under consideration. Inthe late 1960s the international oil companies which, at that time, controlledoil and gas development negotiated unsuccessfully with U.S. utilities toestablish an export trade. Nationalization and increased availability ofindigenous gas in the United States ended any consideration of LNG trade forover a decade. With the resurgence of interest in the LNG trade, PdVSA hasjoined with Shell, Mitsubishi and other organization to assess the feasibilityof a 20 million CM per day LNG export project. The investment would be in therange of Bs.80 billion which probably would be project financed. PdVSA wouldprovide some portion of the equity but most of the funds would be provided byexternal debt financing and supplier credits.
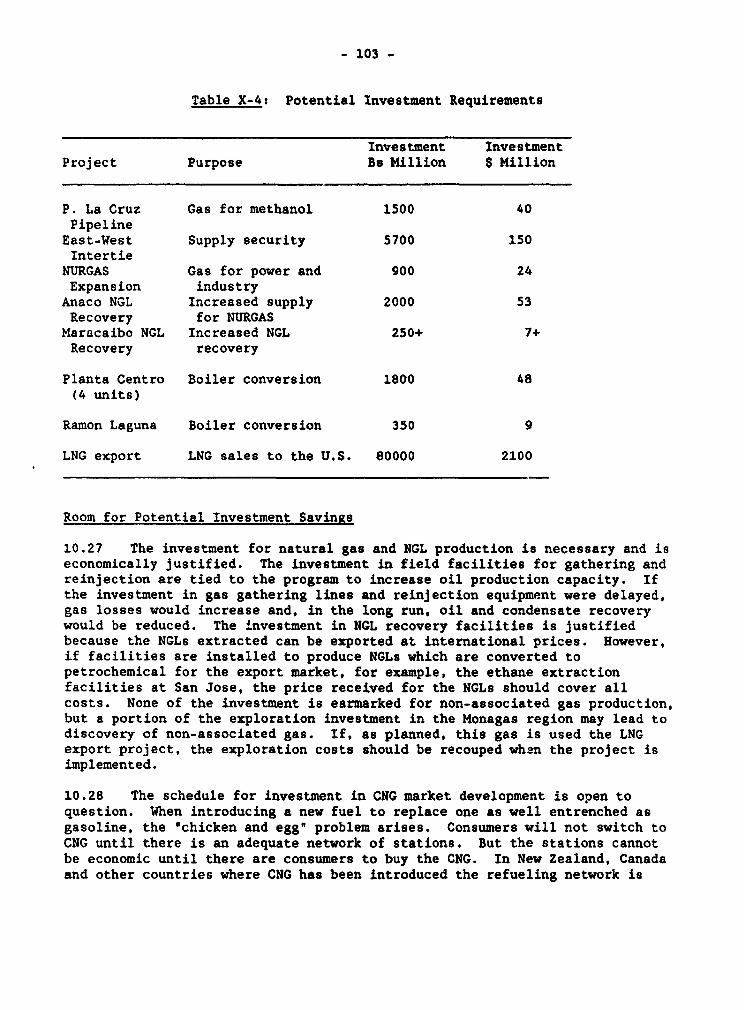
- 103 -
Table X-4: Potential Investment Requirements
Investment InvestmentProject Purpose Bs Million $ Million
P. La Cruz Gas for methanol 1500 40PipelineEast-West Supply security 5700 150Intertie
NURGAS Gas for power and 900 24Expansion industryAnaco NGL Increased supply 2000 53Recovery for NURGASMaracaibo NGL Increased NGL 250+ 7+Recovery recovery
Planta Centro Boiler conversion 1800 48(4 units)
Ramon Laguna Boiler conversion 350 9
LNG export LNG sales to the U.S. 80000 2100
Room for Potential Investment Savings
10.27 The investment for natural gas and NGL production is necessary and iseconomically justified. The investment in field facilities for gathering andreinjection are tied to the program to increase oil production capacity. Ifthe investment in gas gathering lines and reinjection equipment were delayed,gas losses would increase and, in the long run, oil and condensate recoverywould be reduced. The investment in NGL recovery facilities is justifiedbecause the NGLs extracted can be exported at international prices. However,if facilities are installed to produce NGLs which are converted topetrochemical for the export market, for example, the ethane extractionfacilities at San Jose, the price received for the NGLs should cover allcosts. None of the investment is earmarked for non-associated gas production,but a portion of the exploration investment in the Monagas region may lead todiscovery of non-associated gas. If, as planned, this gas is used the LNGexport project, the exploration costs should be recouped when the project isimplemented.
10.28 The schedule for investment in CNG market development is open toquestion. When introducing a new fuel to replace one as well entrenched asgasoline, the 'chicken and egg" problem arises. Consumers will not switch toCNG until there is an adequate network of stations. But the stations cannotbe economic until there are consumers to buy the CNG. In New Zealand, Canadaand other countries where CNG has been introduced the refueling network is
- 104 -
usually ahead of the market and the same situation is very likely to occur inVenezuela. However, until gasoline prices are raised to international levels,few vehicles will be converted. Unless gasoline prices are substantiallyincreased in the near future and maintained at close to international prices,it is probably not advisable to start construction of the CNG refuelingstations. The construction schedule could be delayed until the gasoline priceis increased.
10.29 The investment schedule for projects which are not included in theinvestment plan depends, to a large extent, on the schedule for constructionof the consuming plant. The tentative investment schedule is reviewed below:
- Anaco/Puerto Las Cruz pipeline expansion. CORPOVEN will notproceed with the engineering design studies for this projectuntil a firm commitment to buy the gas for the methanol plant isreceived. Design and construction will require 30 months so itwould be possible to initiate the design and engineering work in1990. If the methanol plant owners sign a contact to commencepaying fixed charges on a date certain, CORPOVEN could reduce therisk of starting construction before plans are completed. Itcould be possible to start construction in 1991 for 1993deliveries.
- East-west interconnection. PDVSA indicated that the pipelinewill not be considered until the Monagas exploration program iscompleted and a gas balance is prepared. It will be at least twoyears before the construction could begin. The project wouldrequire two to three years to complete.
- NURGAS expansion and expansion of the NGL facilities at Anaco.The timetable for these projects will be set by the requirementsfor additional gas in the central-east region. If more than twounits at Planta Centro are converted from fuel oil to naturalgas, additional capacity would be required. CADAFE has evaluatedthe feasibility of converting the second unit but has notallocated the funds. Unless the schedule for conversion of theadditional units at Planta Centro is accelerated, it does notappear the expansion program would be required until 1994 or1995. The processing plant could be built in about 18 monthswhile the compressors could be installed in 12 months after theengineering and procurement is complete.
- The investment schedule for the construction of the NGL recoveryplant in Lake Maracaibo will be controlled by the timetable fordeveloping the high GOR fields. MARAVEN will propose thatengineering design and procurement commence in 1990 with themajor portion of the expenditure occurring in 1991. This is afeasible schedule and there is no reason to postpone it.
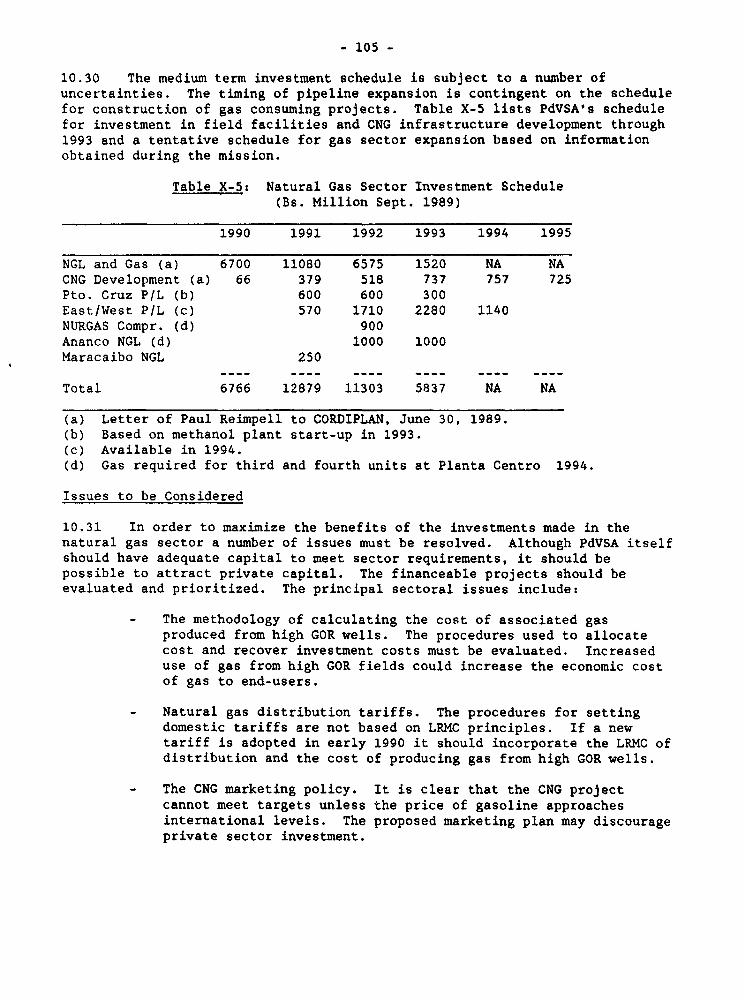
- 105 -
10.30 The medium term investment schedule is subject to a number ofuncertainties. The timing of pipeline expansion is contingent on the schedulefor construction of gas consuming projects. Table X-5 lists PdVSA's schedulefor investment in field facilities and CNG infrastructure development through1993 and a tentative schedule for gas sector expansion based on informationobtained during the mission.
Table X-5: Natural Gas Sector Investment Schedule(Bs. Million Sept. 1989)
1990 1991 1992 1993 1994 1995
NGL and Gas (a) 6700 11080 6575 1520 NA NACNG Development (a) 66 379 518 737 757 725Pto. Cruz P/L (b) 600 600 300East/West P/L (c) 570 1710 2280 1140NURGAS Compr. (d) 900Ananco NGL (d) 1000 1000Maracaibo NGL 250
Total 6766 12879 11303 5837 NA NA
(a) Letter of Paul Reimpell to CORDIPLAN, June 30, 1989.(b) Based on methanol plant start-up in 1993.(c) Available in 1994.(d) Gas required for third and fourth units at Planta Centro 1994.
Issues to be Considered
10.31 In order to maximize the benefits of the investments made in thenatural gas sector a number of issues must be resolved. Although PdVSA itselfshould have adequate capital to meet sector requirements, it should bepossible to attract private capital. The financeable projects should beevaluated and prioritized. The principal sectoral issues include:
- The methodology of calculating the cost of associated gasproduced from high GOR wells. The procedures used to allocatecost and recover investment costs must be evaluated. Increaseduse of gas from high GOR fields could increase the economic costof gas to end-users.
- Natural gas distribution tariffs. The procedures for settingdomestic tariffs are not based on LRMC principles. If a newtariff is adopted in early 1990 it should incorporate the LRMC ofdistribution and the cost of producing gas from high GOR wells.
- The CNG marketing policy. It is clear that the CNG projectcannot meet targets unless the price of gasoline approachesinternational levels. The proposed marketing plan may discourageprivate sector investment.
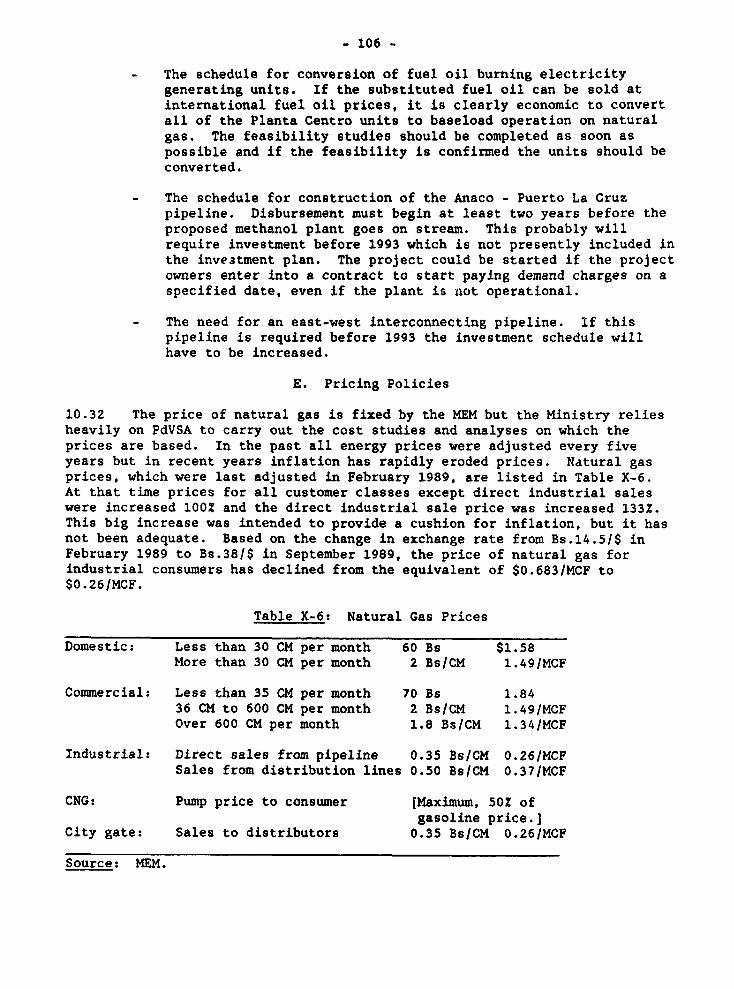
- 106 -
- The schedule for conversion of fuel oil burning electricitygenerating units. If the substituted fuel oil can be sold atinternational fuel oil prices, it is clearly economic to convertall of the Planta Centro units to baseload operation on naturalgas. The feasibility studies should be completed as soon aspossible and if the feasibility is confirmed the units should beconverted.
- The schedule for construction of the Anaco - Puerto La Cruzpipeline. Disbursement must begin at least two years before theproposed methanol plant goes on stream. This probably willrequire investment before 1993 which is not presently included inthe inveatment plan. The project could be started if the projectowners enter into a contract to start paying demand charges on aspecified date, even if the plant is not operational.
- The need for an east-west interconnecting pipeline. If thispipeline is required before 1993 the investment schedule willhave to be increased.
E. Pricing Policies
10.32 The price of natural gas is fixed by the MEM but the Ministry reliesheavily on PdVSA to carry out the cost studies and analyses on which theprices are based. In the past all energy prices were adjusted every fiveyears but in recent years inflation has rapidly eroded prices. Natural gasprices, which were last adjusted in February 1989, are listed in Table X-6.At that time prices for all customer classes except direct industrial saleswere increased 10OZ and the direct industrial sale price was increased 133Z.This big increase was intended to provide a cushion for inflation, but it hasnot been adequate. Based on the change in exchange rate from Bs.14.5/$ inFebruary 1989 to Bs.38/$ in September 1989, the price of natural gas forindustrial consumers has declined from the equivalent of $0.683/MCF to$0.26/MCF.
Table X-6: Natural Gas Prices
Domestic: Less than 30 CM per month 60 Bs $1.58More than 30 CM per month 2 Bs/CM 1.49/MCF
Commercial: Less than 35 CM per month 70 Bs 1.8436 CM to 600 CM per month 2 Bs/CM 1.49/MCFOver 600 CM per month 1.8 Bs/CM 1.34/MCF
Industrial: Direct sales from pipeline 0.35 Bs/CM 0.26/MCFSales from distribution lines 0.50 Bs/CM 0.37/MCF
CNG: Pump price to consumer [Maximum, 50% ofgasoline price.]
City gate: Sales to distributors 0.35 Bs/CM 0.26/MCF
Source: MEM.
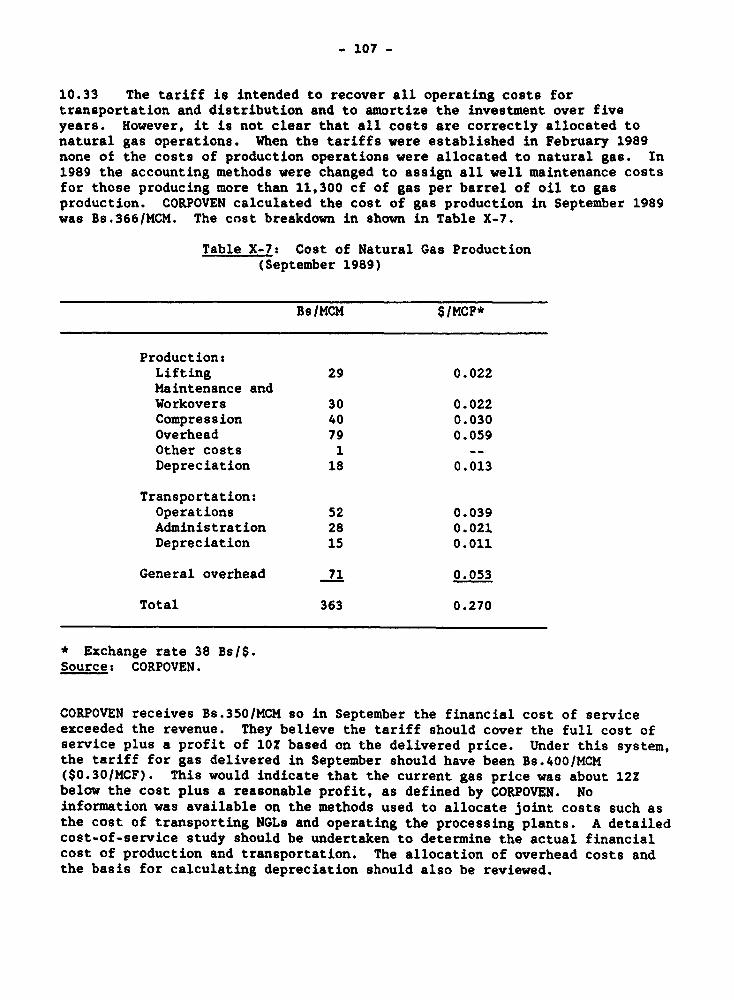
- 107 -
10.33 The tariff is intended to recover all operating costs fortransportation and distribution and to amortize the investment over fiveyears. However, it is not clear that all costs are correctly allocated tonatural gas operations. When the tariffs were established in February 1989none of the costs of production operations were allocated to natural gas. In1989 the accounting methods were changed to assign all well maintenance costsfor those producing more than 11,300 cf of gas per barrel of oil to gasproduction. CORPOVEN calculated the cost of gas production in September 1989was Bs.366/MCM. The cost breakdown in shown in Table X-7.
Table X-7t Cost of Natural Gas Production(September 1989)
Bs/MCN S/MCF*
Production:Lifting 29 0.022Maintenance andWorkovers 30 0.022Compression 40 0.030Overhead 79 0.059Other costs 1 --Depreciation 18 0.013
Transportation:Operations 52 0.039Administration 28 0.021Depreciation 15 0.011
General overhead 71 0.053
Total 363 0.270
* Exchange rate 38 Bs/$.Source: CORPOVEN.
CORPOVEN receives Bs.350/MCM so in September the financial cost of serviceexceeded the revenue. They believe the tariff should cover the full cost ofservice plus a profit of 10? based on the delivered price. Under this system,the tariff for gas delivered in September should have been Bs.400/MCM($0.30/MCF). This would indicate that the current gas price was about 12?below the cost plus a reasonable profit, as defined by CORPOVEN. Noinformation was available on the methods used to allocate joint costs such asthe cost of transporting NGLs and operating the processing plants. A detailedcost-of-service study should be undertaken to determine the actual financialcost of production and transportation. The allocation of overhead costs andthe basis for calculating depreciation should also be reviewed.
- 108 -
10.34 A single "postage stamp' tariff is applied in all parts of thecountry. PdVSA is evaluating a geographically differentiated tariff whichwould establish different tariffs for three or four regions. A number oftechniques have been used to establish zone tariffs:
- The MCF-mile (or cubic meter - kilometer) method which allocatesthe total costs on the basis of the volume transported and thedistance from the supply source to the point of sale.
- The regional method which establishes a single tariff for allsales within a geographically defined region.
- The mileage method which sets a toll charge based on the distancegas is transported.
Given that the gas system in Venezuela is readily divided into five systemswhich operate independently, the regional method appears to be the logicalchoice. The systems are the Anaco/Puerto Ordaz system, the Anaco/Puerto LaCruz system, the Anaco/Caracas/Moron system, the Maracaibo system, and theMaracaibo/Cardon system. It may be appropriate to sub-divide theAnaco/Caracas and Caracas/Moron systems but the principles of cost-basedtransportation tariffs >,ould still apply. A detailed cost of service and costallocation study would be required to establish the tariffs for each system.
10.35 The differential between the city gate price, Bs.350/MCM ($0.26/MCF)and the price to domestic users, Bs.2000/MCM ($1.49/MCF) should cover alloperating costs and recoup the distributor's investment. The averageresidential customer consuming less than 30 CM per month, most pay the minimummonthly bill Bs.60 ($1.58). There are no tariff studies to substantiate thecharges, but they appear to be low. Tariff studies recently conducted inColombia showed that the fixed costs for meter reading, billing, customerservice etc., are approximately $1.00 per month. The fixed charge must alsoamortize the investment in general system facilities, feeder mains andstructures. The revenue available to amortize investment, approximately $0.58per month, would amortize $50. In several Latin American countries,investments made by the distributor in gate stations, feeder mains, officesand other common facilities range from $150 to $300 per customer. So long asthe tariff is this low, there will be no incentive for the private sector toinvest in gas distribution systems unless they are subsidized or the customerpays essentially all of the capital investment via a connection charge. Thepricing structure of fuels which compete with natural gas is another factorwhich will slow natural gas use in the domestic sector. The price of LPG todomestic consumers varies slightly depending on the size of the LPG bottle,but the average price is approximately Bs.4/kg ($2.20/MMBtu). The monthlybill for the average customer would be Bs.33, which is just slightly above theminimum monthly bill of gas consumers. If they were required to pay theconnection charge, there would be a strong disincentive to switch to naturalgas. The economic value of LPG, based on the 1988 fob export price -$9.68/bbl - plus the distribution margin of $13.51/bbl, is equivalent to anLPG opportunity value of Bs.9.5/kg. Therefore, if the LPG price were set at
- 109 -
international levels, the natural gas price could be set a level which wouldbe much more likely to attract both consumers and private sector investors.
10.36 Industrial consumers pay Bs.0.5/liter ($0.35/MMBtu) for heavy fueloil and the price of natural gas sold directly from the high pressure pipelineto industrial consumers is $0.26/MMBtu. Accordingly, there would probably besufficient incentive for many large industrial consumers to invest inconversion burners. However, industrial consumers who receive gas via thedistribution network pay slightly more than the price of fuel oil. Hence theonly incentive to switch to gas would be operational or technical improvementsin the industrial process. In 1988 the fob export price received for highsulfur heavy fuel oil was $9.64/bbl ($1.60/MMBtu). This indicates that ifheavy fuel oil prices were set at international levels, the price ofindustrial gas could be increased significantly while still providing anincentive for the consumer to convert his equipment.
10.37 Natural gas used as feedstock for petrochemical and fertilizerdestined for the internal market is sold at the industrial price. When gas isused as feedstock for export products, the price is negotiated with themanufacturer. The government has sought to ensure that Venezuelanpetrochemicals are competitive in international markets by negotiating gasprices low enough to produce petrochemicals at competitive prices. Pricingformula which would allow the gas supplier (or the Government) to share infuture price increases have been proposed. The options for the supplier tocapture a share of future profits should be further evaluated beforeadditional gas is committed to export projects.
10.38 The LNG project poses special problems. Non-associated gas will beused so all exploration and development costs should be recaptured through theprice charged for the gas. Project financing will probably be used to raisethe money. Therefore, so it would be possible to treat it as an enclaveproject. The gas would all be developed and produced by the project owners;there would be no sale of gas from CORPOVEN to the project. A pricing issuemight arise if the project had to buy gas from CORPOVEN. That issue should bedealt with when the contract for assignment of gas reserves is negotiated.
10.39 The pricing Rtructure for compressed natural gas which will be usedas vehicle fuel requires further analysis even though the impact on gasconsumption will be relatively low CORPOVEN estimates that, by 1993 CNG saleswill be approximately 600,000 CM/day (7 BCF per year) or about 12 of totalsales. Nevertheless, CNG will replace more than a million barrels ofgasoline, which when valued at the 1988 export fob price would generate $25 inforeign exchange. CORPOVEN's market development program is based on theassumption that the pump (retail) price of CNG will never be more than 50X ofthe gasoline price. When gasoline prices are near international prices, e.g.$0.60 - $0.70/gal, the user would save $0.30 - $0.35/gallon and conversion ofhigh mileage vehicles such as taxis and buses would be economic. However, ifgasoline prices are only $0.25 - $0.30/gallon, as is the case now, conversionwould not be economic. Therefore, the plan's success depends on increasinggasoline prices to near international levels or subsidizing vehicle conversioncosts. The latter would be costly and would largely negate the purpose of the
- 110 -
program. CORPOVEN calculates the rate of return on the CNG project is 462.3The benefits are calculated as the value of the exported gasoline. Thismethod of calculating the IRR disguises the inherent subsidization ofrefueling stations operators. CORPOVEN and other PdVSA affiliates couldcross-subsidize the operating costs at their stations. However, which privatecompanies are expected to operate 752 of the stations would have to bedirectly subsidized.
3 Proyecto ONCA Aspect*. Sobr, *I Plan Mdian* Plato, CORPOVEN, S.A., OCrencla Generalde Nercadoo Nacion.l, November 1989.
Chapter 11
Aluminum and Steel
A. Introduction
11.1 Venezuela's alimunum and steel industries are the most visiblelegacies of the inward looking policies and the state-led massiveindustrialization strategy that have shaped the country's economic developmentsince the 1950s. These two industries, along with the power sector under DVGcontrol, have provided economic sustenance to the entire region of Guayana.However? between 1989 and 1990, the economic environment changed drasticallyfor the two industries. Under the new economic program of the Perezadministration, the CVG companies are no longer entitled to the importprotection, export ir:entives and central Government subsidies that they usedto enjoy. Moreover, the international price of primary aluminum is expectedto decline during the 1990s and the world marked prospects for steel productsare no promising. On the domestic front, the central Government is no longerable to allocate budgetary resources to finance the expansion programs of DVGcompan.es. The economic circumstances have forced the Government to undertakea serious reassessment of public investment in general, and the Government'scontribution to the investment by CVG firms in particular.
B. Aluminum
Introduction
11.2 There are four major processing stages in the aluminum industry:bauxite mining, alumina r-_fining, aluminum smelting, and aluminum fabricating.The last three activities have been carried out in Venezuela for severalyears, and bauxite mining was started more recently.
11.3 The process of producing primary aluminum begins with the mining ofthe bauxite ore, normally by open pit methods. The ore requires littletreatment, aside from drying and crushing, before it is processed intoalumina. Alumina plants, like are based on the Bayer process which extractshe aluminum oxide from the ore. The bauxite feed, which cannot be changedeasily due to its composition, especially with respect to impurities likesilica, will determine what quantity is required to produce a ton of alumina.The ratio of bauxite to alumina can be as high as 3 to 1, with an average of2.3 to 1. The next step is smelting the alumina. The smelters consist of aseries of reduction-cells, in which the alumina is electrolytically reduced.About 1.95 tons of alumina is required per ton of aluminum metal.
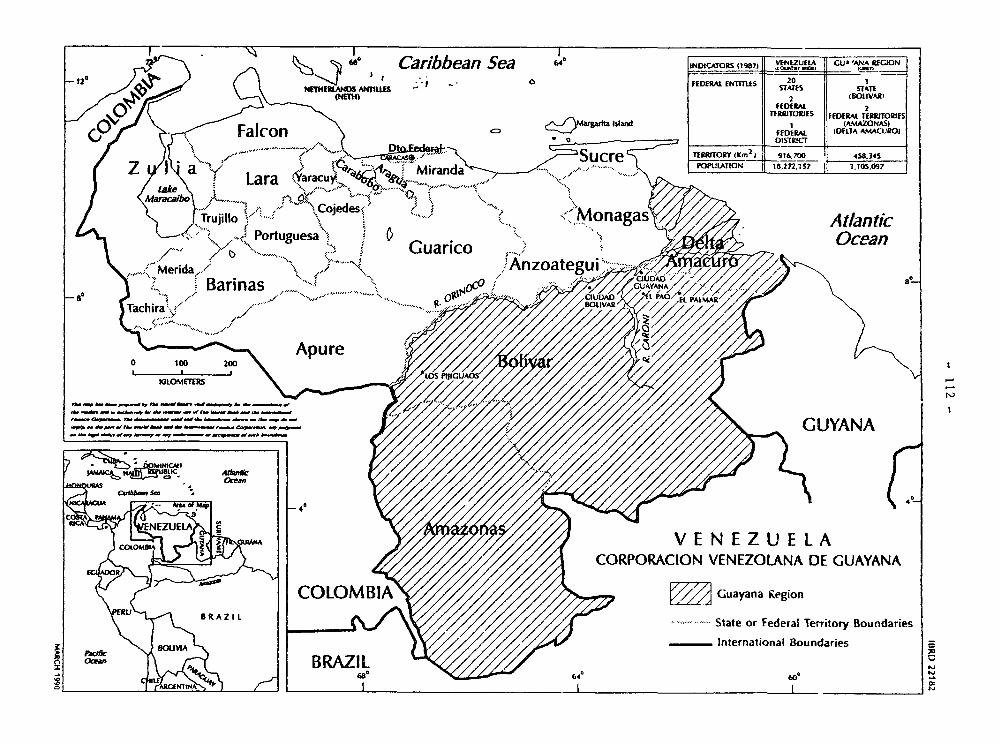
-e )-) < Caribbean Sea 64D INDICATORS (19t71 VEZUELA CU' 'ANA REGIONNUNERLANDS AKLE.S oFEDERAL
ENTTLES STATES STATEii ~ ~~~~~~~~~~~N)2 (BOIIVARI
TERRTORIES FEDERAL TERRITOES
--/ yo fEDERAl (AmAZONAS)Falcon fEDQRJC I (DELIA AMACI20l
S ucre TERRIORY (1Cm2
I 916.700 1-4583z I a> L.ara 4aracu ~~~~~~~~~ Miranda / ~~~~POPULATION TC.2ThIS tIo.s
MaracaTh Lara n,Yarac/ *. \ClojeAt X , iMonagas Atlanticn Portuguesa1n
RftCI/// m .~ Guaricon'4ierida / - a Anzoateguit
B e8' / Barinas t41 .cA
Tachira
4"<'
CORPORACION VENEZOLANA DE GUAYANA
BRAZIL ~~~~~~~~~~~~~~~~~~~~~State or federal Territory Boundaries
International BoundariesPW*~~~~~~~~~~~~~~~~~~~~~~~~~~~~~
oa%w B~~~~~~~~~~~~~~~~~~~~~~~~~~~~~~~~~~~~~~~~~~~~~~~~~~~~~~~~~~~~~~~~~~~~~~~~~~~~~~~~~~~~~~~~~~~~.
6e 64_ _ __6k-
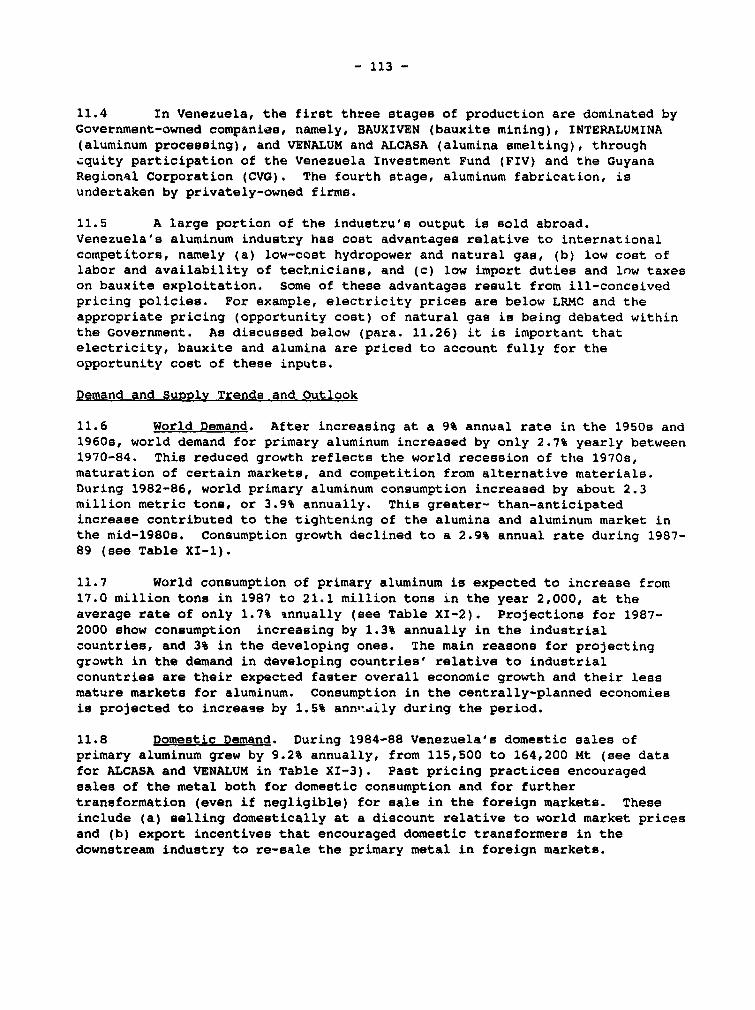
- 113 -
11.4 In Venezuela, the first three stages of production are dominated byGovernment-owned companieas, namely, BAUXIVEN (bauxite mining), INTERALUMINA(aluminum processing), and VENALUM and ALCASA (alumina smelting), throughcquity participation of the Venezuela Investment Fund (FIV) and the GuyanaRegional Corporation (CVG). The fourth stage, aluminum fabrication, isundertaken by privately-owned firms.
11.5 A large portion of the industru's output is sold abroad.Venezuela's aluminum industry has cost advantages relative to internationalcompetitors, namely (a) low-cost hydropower and natural gas, (b) low cost oflabor and availability of technicians, and (c) low import duties and low taxeson bauxite exploitation. Some of these advantages result from ill-conceivedpricing policies. For example, electricity prices are below LRMC and theappropriate pricing (opportunity cost) of natural gas is being debated withinthe Government. As discussed below (para. 11.26) it is important thatelectricity, bauxite and alumina are priced to account fully for theopportunity cost of these inputs.
Demand and Supply Trends and Outlook
11.6 World Demand. After increasing at a 9% annual rate in the 1950s and1960s, world demand for primary aluminum increased by only 2.7% yearly between1970-84. This reduced growth reflects the world recession of the 1970s,maturation of certain markets, and competition from alternative materials.During 1982-86, world primary aluminum consumption increased by about 2.3million metric tons, or 3.9% annually. This greater- than-anticipatedincrease contributed to the tightening of the alumina and aluminum market inthe mid-1980s. Consumption growth declined to a 2.9% annual rate during 1987-89 (see Table XI-1).
11.7 World consumption of primary aluminum is expected to increase from17.0 million tons in 1987 to 21.1 million tons in the year 2,000, at theaverage rate of only 1.7% innually (see Table XI-2). Projections for 1987-2000 show consumption increasing by 1.3% annually in the industrialcountries, and 3% in the developing ones. The main reasons for projectinggrowth in the demand in developing countries' relative to industrialconuntries are their expected faster overall economic growth and their lessmature markets for aluminum. Consumption in the centrally-planned economiesis projected to increase by 1.5% annl'dily during the period.
11.8 Domestic Demand. During 1984-88 Venezuela's domestic sales ofprimary aluminum grew by 9.2% annually, from 115,500 to 164,200 Mt (see datafor ALCASA and VENALUM in Table XI-3). Past pricing practices encouragedsales of the metal both for domestic consumption and for furthertransformation (even if negligible) for sale in the foreign markets. Theseinclude (a) selling domestically at a discount relative to world market pricesand (b) export incentives that encouraged domestic transformers in thedownstream industry to re-sale the primary metal in foreign markets.
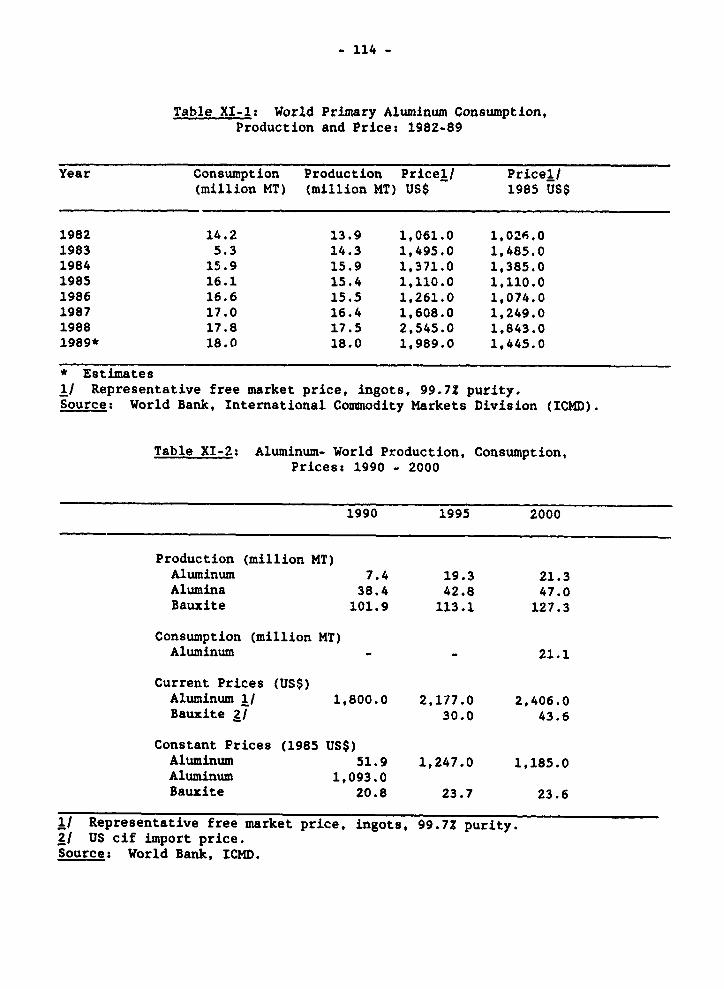
- 114 -
Table XI-1: World Primary Aluminum Consumption,Production and Prices 1982-89
Year Consumption Production Pricel/ Pricel/(million MT) (million MT) USS 1985 US$
1982 14.2 13.9 1,061.0 1,026.01983 5.3 14.3 1,495.0 1,485.01984 15.9 15.9 1,371.0 1,385.01985 16.1 15.4 1,110.0 1,110.01986 16.6 15.5 1,261.0 1,074.01987 17.0 16.4 1,608.0 1,249.01988 17.8 17.5 2,545.0 1,843.01989* 18.0 18.0 1,989.0 1,445.0
* Estimates1/ Representative free market price, ingots, 99.7Z purity.Source: World Bank, International Commodity Markets Division (ICMD).
Table XI-2: Aluminum- World Production, Consumption,Prices: 1990 - 2000
1990 1995 2000
Production (million MT)Aluminum 7.4 19.3 21.3Alumina 38.4 42.8 47.0Bauxite 101.9 113.1 127.3
Consumption (million MT)Aluminum - - 21.1
Current Prices (USS)Aluminum 1/ 1,800.0 2,177.0 2,406.0Bauxite 2/ 30.0 43.6
Constant Prices (1985 USS)Aluminum 51.9 1,247.0 1,185.0Aluminum 1,093.0Bauxite 20.8 23.7 23.6
1/ Representative free market price, ingots, 99.7? purity.2/ US cif import price.Source: World Bank, ICMD.
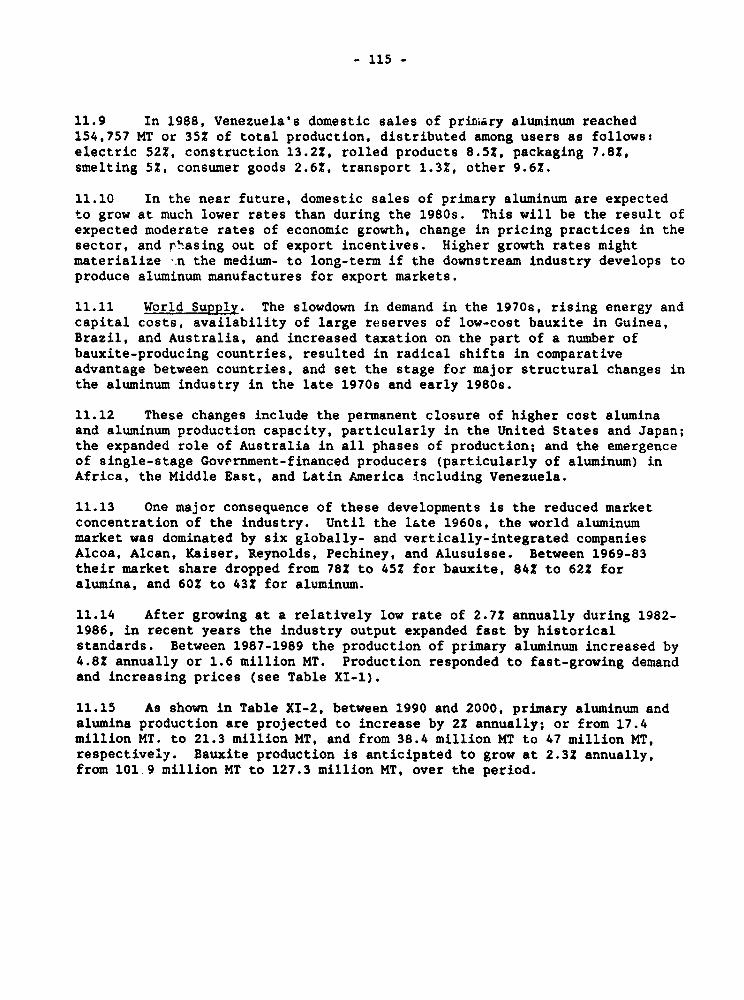
- 115 -
11.9 In 1988, Venezuela's domestic sales of primary aluminum reached154,757 MT or 352 of total production, distributed among users as follows:electric 522, construction 13.22, rolled products 8.52, packaging 7.82,smelting 52, consumer goods 2.62, transport 1.32, other 9.62.
11.10 In the near future, domestic sales of primary aluminum are expectedto grow at much lower rates than during the 1980s. This will be the result ofexpected moderate rates of economic growth, change in pricing practices in thesector, and r!.asing out of export incentives. Higher growth rates mightmaterialize .n the medium- to long-term if the downstream industry develops toproduce aluminum manufactures for export markets.
11.11 World Supply. The slowdown in demand in the 19709, rising energy andcapital costs, availability of large reserves of low-cost bauxite in Guinea,Brazil, and Australia, and increased taxation on the part of a number ofbauxite-producing countries, resulted in radical shifts in comparativeadvantage between countries, and set the stage for major structural changes inthe aluminum industry in the late 1970s and early 1980s.
11.12 These changes include the permanent closure of higher cost aluminaand aluminum production capacity, particularly in the United States and Japan;the expanded role of Australia in all phases of production; and the emergenceof single-stage Government-financed producers (particularly of aluminum) inAfrica, the Middle East, and Latin America including Venezuela.
11.13 One major consequence of these developments is the reduced marketconcentration of the industry. Until the late 1960s, the world aluminummarket was dominated by six globally- and vertically-integrated companiesAlcoa, Alcan, Kaiser, Reynolds, Pechiney, and Alusuisse. Between 1969-83their market share dropped from 782 to 452 for bauxite, 842 to 622 foralumina, and 602 to 432 for aluminum.
11.14 After growing at a relatively low rate of 2.72 annually during 1982-1986, in recent years the industry output expanded fast by historicalstandards. Between 1987-1989 the production of primary aluminum increased by4.82 annually or 1.6 million MT. Production responded to fast-growing demandand increasing prices (see Table XI-1).
11.15 As shown in Table XI-2, between 1990 and 2000, primary aluminum andalumina production are projected to increase by 22 annually; or from 17.4million MT. to 21.3 million MT, and from 38.4 million MT to 47 million MT,respectively. Bauxite production is anticipated to grow at 2.32 annually,from 101 9 million MT to 127.3 million MT, over the period.
- 116 -
Table XI-3: Aluminum Sector Production and Sales(Thousand MT)
Firm/Activity 1984 1985 1986 1987 1988
VENALUMProduction 267.1 281.8 295.5 304.0 312.5Domestic sales 54.2 66.0 95.1 104.8 92.0Exports 129.5 244.4 201.3 215.8 206.0
ALCASAProduction 119.8 122.6 125.8 126.2 130.9Domestic sales 61.5 74.8 80.2 80.0 72.2Exports 49.1 52.3 48.9 45.4 48.6
INTERALUMINAProduction 1,141.8 1,109.8 1,268.7 1,360.0 1,284.0Domestic sales 768.8 775.7 809.7 864.4 885.2Exports 371.4 359.1 501.8 517.0 366.8
BAUXIVENProductior - - - 245.2 521.5Domestic sales ^ - - 134.2 253.3Exports - - - 0.0 0.0
Source: Corporaci6n Venezolana de Guayana (CVG), also available on theAnnual Reports.
11.16 Domestic Supply. In Venezuela, the CVG aluminum sector includesfour companies: BAUXIVEN, INTERALUMINA, VENALUM, and ALCASA; all but BAUXIVENare in Ciudad Guayana (see map on page 112). Venezuela's aluminum industry iscomparatively new among world producers. The oldest company, ALCASA, startedoperations in 1965. Historical data (1984-1988) on total production, domesticsales, and exports of the Venezuelan firms are shown in Table XI-3.
11.17 BAUXIVEN is a 10OZ state-owned company mining bauxite in LosPijiguaos (see map on page 112). The company started production in 1987 witha total output of 245,000 tons, its main objective is to supply INTERALUMINA'sbauxite needs. In 1988 INTERALUMINA bought 250,000 tons from BAUXIVEN, andthe figure is estimated at 500,000 tons for 1989.
11.18 INTERALUMINA, the alumina producer, was created in 1977 and startedoperations in 1983. In 1989 the company had a rated capacity of 1 million MT,and produced 1.285 million MT. Its major domestic buyers are VENALUM andALCASA that purchased most of the 1.08 million MT sold domestically, whileforeign producers bought 205,000 MT that year. As of end 1988, INTERALUMINAhad a total capital stock of Bs.3.7 million of which 87X is held by the FIV,11.5Z by the CVG, and 1.5% by Swiss Aluminum.
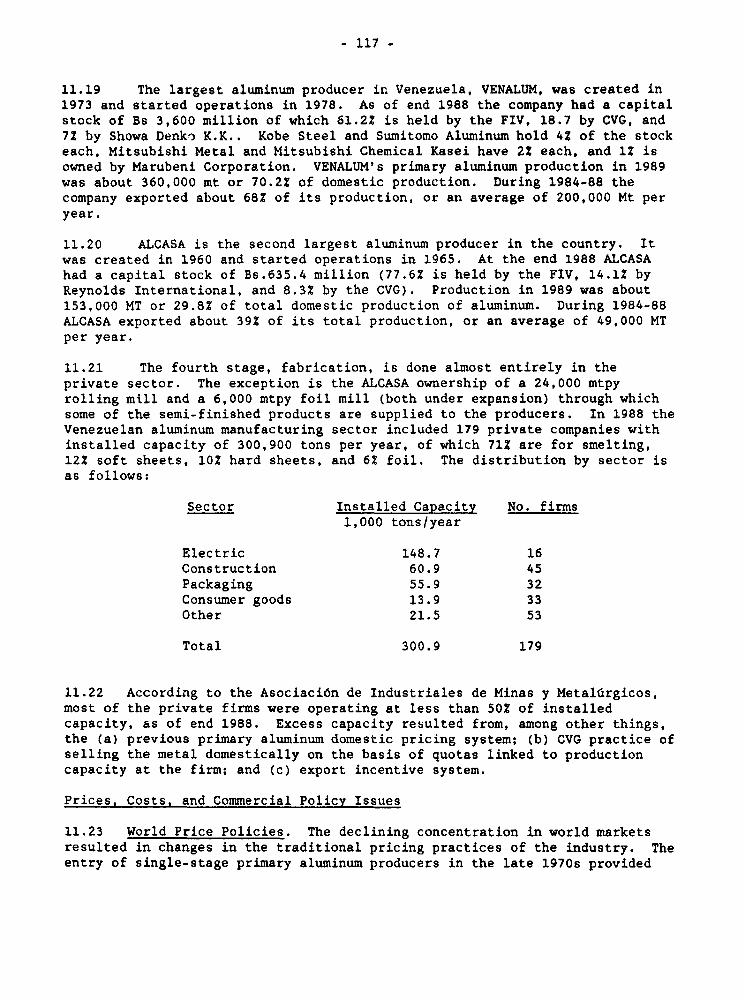
- 117 -
11.19 The largest aluminum producer is Venezuela, VENALUM, was created in1973 and started operations in 1978. As of end 1988 the company had a capitalstock of Bs 3,600 million of which 61.22 is held by the FIV, 18.7 by CVG, and7Z by Showa Denko K.K.. Kobe Steel and Sumitomo Aluminum hold 4Z of the stockeach, Mitsubishi Metal and Mitsubishi Chemical Kasei have 22 each, and 12 isowned by Marubeni Corporation. VENALUM's primary aluminum production in 1989was about 360,000 mt or 70.2X of domestic production. During 1984-88 thecompany exported about 68? of its production, or an average of 200,000 Mt peryear.
11.20 ALCASA is the second largest aluminum producer in the country. Itwas created in 1960 and started operations in 1965. At the end 1988 ALCASAhad a capital stock of Bs.635.4 million (77.62 is held by the FIV, 14.1? byReynolds International, and 8.32 by the CVG). Production in 1989 was about153,000 MT or 29.82 of total domestic production of aluminum. During 1984-88ALCASA exported about 391 of its total production, or an average of 49,000 MTper year.
11.21 The fourth stage, fabrication, is done almost entirely in theprivate sector. The exception is the ALCASA ownership of a 24,000 mtpyrolling mill and a 6,000 mtpy foil mill (both under expansion) through whichsome of the semi-finished products are supplied to the producers. In 1988 theVenezuelan aluminum manufacturing sector included 179 private companies withinstalled capacity of 300,900 tons per year, of which 712 are for smelting,12X soft sheets, 1OZ hard sheets, and 62 foil. The distribution by sector isas follows:
Sector Installed Capacity No. firms1,000 tons/year
Electric 148.7 16Construction 60.9 45Packaging 55.9 32Consumer goods 13.9 33Other 21.5 53
Total 300.9 179
11.22 According to the Asociaci6n de Industriales de Minas y Metaldrgicos,most of the private firms were operating at less than 502 of installedcapacity, as of end 1988. Excess capacity resulted from, among other things,the (a) previous primary aluminum domestic pricing system; (b) CVG practice ofselling the metal domestically on the basis of quotas linked to productioncapacity at the firm; and (c) export incentive system.
Prices, Costs, and Commercial Policy Issues
11.23 World Price Policies. The declining concentration in world marketsresulted in changes in the traditional pricing practices of the industry. Theentry of single-stage primary aluminum producers in the late 1970s provided
- 118 -
sufficient volume for the introduction of aluminum ingot trading at the LondonMetal Exchange (LME) in 1979, and at the New York Commodities Exchange (COMEX)in 1984. The reference price gradually replaced the traditional producer-pricing system.
11.24 Although alumina is not traded on commodity exchanges, its pricingpractices have changed as well. It is now usually sold under medium- or long-term contracts with prices linked to the free market metal price, normally 10-122 of the LME price. Bauxite is traded internationally under medium- tolong-term contracts and there is a small spot market.
11.25 Table XI-1 shows the international price of primary aluminumincreasing in current and constant (1985) terms during the 1980s. From 1990to 2000 production is expected to grow faster than demand, and the aluminumprice anticipated to increase in nominal but to decline in real terms. Thesame trend is expected for the world alumina price, as it is linked to the LMEprimary aluminum price. The price of bauxite is forecast to increase innominal and real terms (see Table XI-2).
11.26 Pricing Policies in Venezuela. Before April 1, 1989, the aluminumdomestic market pricing structure for aluminum consisted of fixed prices formaterials processed and consumed in Venezuela and discounted world marketprices for materials further processed for export. Moreover, price revisionsrequired Government approval. The substantial price differential betweenprices in domestic and export markets adversely affected the profitability ofthe CVG primary aluminum producers, led to distortions in the allocation ofthe metal among the various markets, and encouraged the CVG to follow adistortionary quota allocation system among private domestic users andexporters of primary aluminum.
11.27 As part of a significant economic adjustment in early 1989, thepricing policies of the state-owned enterprises were revised. In many casesthe revision included price decontrol. The aluminum sector was part of thisprocess and as a result most prices now reflect export opportunity cost,although further changes are recommended in some cases.
11.28 The differentiated price system for primary aluminum was replaced by asystem that follows the LME price for metal, with automatic quarterlyrevisions. Although there is a price discount of 52 for domestic sales, thenew pricing system is much less distortionary than the one it replaced.Alumina for domestic users is priced on the basis of a cost-plus formula,compensating INTERALUMINA for all costs incurred (indexed to domesticinflation) and with a profit element of 62 of the international price ofaluminum at the LME. This formula does not give any incentive to the producerto reduce costs through efficiency gains; moreover, it results in differentalumina prices for the domestic and foreign markets. To account fully for theexport opportunity cost of the alumina, a unified price system based on thenew international price practice i.e. l0-121 of the primary aluminum LME pricemust be adopted.
- 119 -
11.29 At the end of 1989, BAUXIVEN was selling bauxite to INTERALUHINA atUS$ 30.5 cif per ton (Bs.40 per US$). When compared to the average cif importprice of bauxite in Venezuela of US$40. the difference amounts to a 312 costadvantage to INTERALUMINA. Venezuela's major foreign suppliers of bauxite areBrazil, Guayana, Sierra Leone, and Australia. Due to its location in LosPijiguaos far from the coast, BAUXIVEN is not likely to export profitablygiven current transport facilities (see map on page 112). Therefore, theopportunity cost of the domestic bauxite is the average import price, takinginto consideration the differences in transport costs.
11.30 With tnat criterion the current price seems reasonable, but it must beemphasized that changes in the international price of bauxite should bereviewed all times and the domestic price revised accordingly. BAUXIVEN'sprice should not be higher than INTERALUMINA's cif import price plus tariffs,or lower than an average international price of bauxite plus domestictransport cost.
11.31 Cost Comparisons. In 1987, Worldwide operating costs for primaryaluminum production ranged between US$670-1,600, with an average of US$1,015per ton produced. ALCASA's data for the third-quarter of 1989 show an averagecost of production of US$1,160 (Bs.40 per US$). Variations in smelters'operating costs result from input price differences, mainly of energy and rawmaterials. Raw materials comprise petroleum, coke, pitch, and variouschemicals used as electrolytes, but the price of alumina is the largest costcomponent among the material inputs.
11.32 In 1987, worldwide alumina input cost per ton of aluminum variedbetween US$199-417, with an average of US$314 in 1987. At the end of 1989,INTERALUMINA sold alumina to ALCASA and VENALUM at US$245 per ton, or aboutUS$490 per ton of aluminum (Bs.40 per US$). Energy/power cost varied fromUS$69 to US$562 with a world average of US$281 per ton. Several factorscontribute to this variation: different energy sources like hydro, fossilfuel, and nuclear; and varying plant and infrastructure efficiencies.Hydropower is the predominant power source of aluminum.
11.33 Operating costs for alumina vary between US$76-200 per ton, with anaverage of US$134 per ton in 1987. Bauxite, fuel, and labor are the majorcomponents. Bauxite costs range between US$11-80 per ton of alumina, themajor factors in the variance are the bauxite production taxes charged in somecountries, and trans,ortation. For INTERALUMINA bauxite, caustic soda, andgas prices are the major components; its bauxite cost (average US$40 per ton)is at the upper limit by international comparison. The firm's cost ofproduction in the third quarter of 1989 was US$170 per ton (Bs.40 per US$).
11.34 Venezuela's aluminum industry has many cost advantages with respect toits international competitors, namely, (a) low cost hydropower, and naturalgas; (b) overall labor cost are cheaper in Venezuela than in Europe and NorthAmerica, and (c) greater availability of technicians more the new Africancompetitors; and (d) low import duties and low taxes on bauxite exploitationare also cost advantages for the Venezuelan aluminum firms.
- 120 -
11.35 Some of the cost advantages of the industry result from ill-conceivedpricing policies. For example, electricity prices are below LRMC, and theappropriate pricing (opportunity cost) for r.atural gas is under analysis. Thecost disadvantages of the industry are high transportation costs on importedbauxite, managerial inefficiencies, and high financial costs.
11.36 INTERALUMINA's, and ALCASA's 1989 domestic currency operating costsincreased significantly with respect to the 1988 level. (No information isavailable on VENALUM.) This was due to higher international prices of causticsoda, imported inputs priced at the free and much higher exchange rate, andhigher electricity tariffs. The current power contracts between EDELCA andthe aluminum companies cover 1988-1992, with rates based on a specific minimumfor each year and with a linkage to the LME metal price. These rates arestill lower than the world average for the industry and also lower than LRMCin Venezuela.
11.37 In dollar terms 1989 operating costs declined for INTERALUMINA, andALCASA. This is because the depreciation of the Bolivar more than offsets theincreases in domestic prices of imported and other inputs. In the future,cost reductions are likely to come from bauxite from BAUXIVEN priced lowerthan imports, and lower price of alumina to the primary aluminum producers asit is linked to the LME aluminum price. Cost increases will result fromhigher electricity and gas tariffs as they approach their LRMC levels; theirimpact will be more severe on primary aluminum producers. However, it is verylikely that even after those adjustments, Venezuela will still be a low energycost country by international standards.
11.38 Commercial Policy. Pro. ious pricing and trade practices--likedifferentiated prices of primary aluminum for domestic and export markets, andexp-irt incentives-- resulted in US countervailing duties against Venezuelanexporters of aluminum manufactures. (See US Department of Commerce,International Trade Administration, C-307-702). The pricing system waschanged in April 1, 1989.
11.39 In March 1989, significant changes in the trade and exchange regimetook place in Venezuela. The exchange rate was unified and is now market-determined, and exchange controls were abolished. The new unified ratestarted at Bs.39-40 per USS (but soon fell to Bs.35-36), compared to theprevious official rate of Bs.14.5. The exchange rate unification resulted ina significant Bolivar depreciation. Moreover, import duty exonerations wereeliminated, tariff rates reduced to a maximum 80Z, and quantitative restraintsare being phased out.
11.40 As a result of this process, the industry's imports of raw materials,machinery, and equipment face no quantitative restraints. Tariffs are higherthan before as exonerations were abolished, but still are nevertheless low at5X for machinery and equipment, and 1I for intermediate inputs.
11.41 Export subsidies still apply to the industry's sales in foreignmarkets on less distortionary basis than before. While the incentive varied
- 121 -
according to the domestic value added at the firm level in the past, now theCVG firms receive 302 of their fob export price as an export subsidy. Firmsin the downstream industry are also entitled to the 301 export incentive.This incentive--a negotiable certificate that can be used towards payment ofnational taxes--discourages the CVG firms from selling domestically; andpromotes the use of non-market practices by the CVG. It is a source ofconflict between public and private sector firms. The incentive is expectedto be phased out in 1990.
11.42 Policy Recommendations. First, alumina should be priced in thedomestic market at 10-12X of the LME primary aluminum price. Second,BAUXIVEN's price should not be higher than INTERALUMINA's cif import priceplus tariffs, or lower than the average international price of bauxite plusdomestic transport cost. Third, electric power rates should be set at LRMC tofully account for the opportunity cost of the input. Fourth, the economicrationale for the export incentives should be reassessed, considering amongother things their distortionary impact.
Investment Review
11.43 VENALUM and ALCASA. VENALUM's expansion plan includes a fifthreduction line, increasing capacity by 176,000 mtpy in 1990. Ninety-fivepercent of the cells were in operation in the fall of 1989, and fullproduction capacity was expected by the end of that year. Total cost of theproject is estimated at Bs.11,142 million. Significant cost over-runsresulted from the devaluations of the Bolivar during the completion of theproject. These were financed out of the firm's cash-flow. During 1990-91VENALUM will allocate Bs.1,600-1,800 million to modernize the plant's existingcells. It will also expand its river port, the coke storage facility, and thecoal plant. These three projects to be financed with the firm's own resourcesamount to about Bs.900 million.
11.44 ALCASA's investment program for 1986-91 includes two expansion plans.The first one (see Table XI-5.A) comprises increase of the primary aluminumproduction capacity (reduction plant's fourth line), fabricating expansion(rolling plant), a-ad a new anodes plant (CARBONORCA). The fourth line willadd 90,000 mtpy to existing capacity; the expansion of the aluminum rollingcapacity at the Guayana plant will increase capacity from 24,000 mtpy to60,000 mtpy. The cost of this undertaking is estimated at Bs 17,512 million,over 1986-90. The largest cost component is direct investment expenses, withthe biggest allocation to the reduction plant.
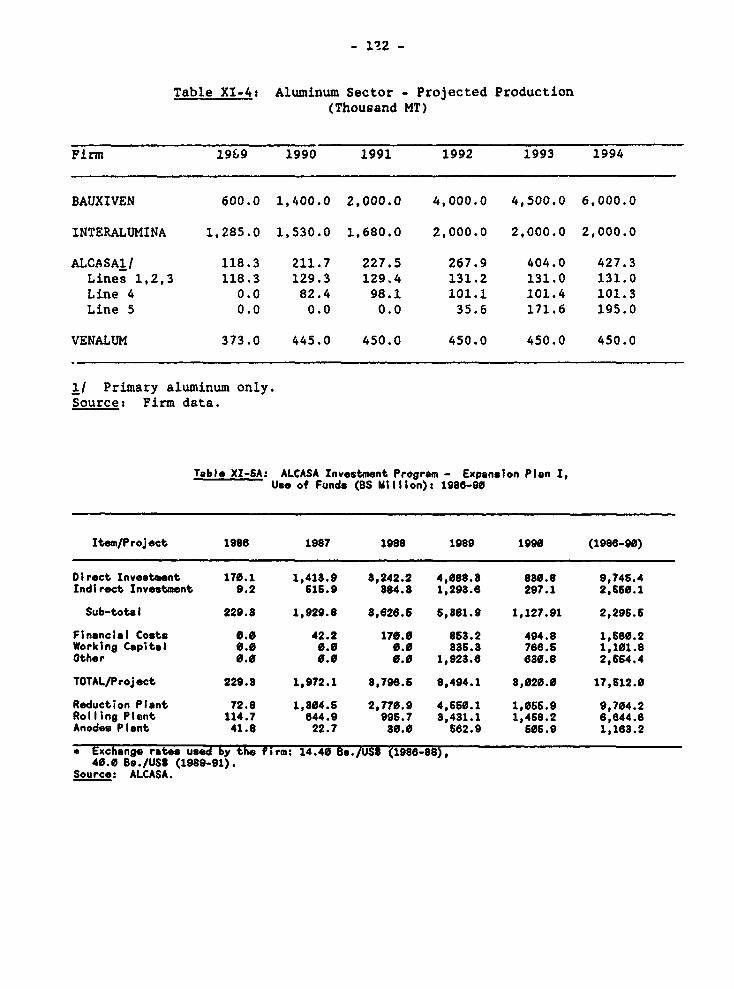
- 12 -
Table XI-4: Aluminum Sector - Projected Production(Thousand MT)
Firm 1969 1990 1991 1992 1993 1994
8AUXIVEN 600.0 1,400.0 2,000.0 4,000.0 4,500.0 6,000.0
INTERALUMINA 1,285.0 1,530.0 1,680.0 2,000.0 2,000.0 2,000.0
ALCASAl/ 118.3 211.7 227.5 267.9 404.0 427.3Lines 1,2,3 118.3 129.3 129.4 131.2 131.0 131.0Line 4 0.0 82.4 98.1 101.1 101.4 101.3Line 5 0.0 0.0 0.0 35.6 171.6 195.0
VENALUM 373.0 445.0 450.0 450.0 450.0 450.0
I/ Primary aluminum only.Source: Firm data.
Table XI-SA: ALCASA Investment Program - Expansion Plan I,Use of Funds (BS Million): 1986-90
Item/Project 1986 1987 1988 1989 1990 (1988-96)
Direct Investment 170.1 1,413.9 8,242.2 4,088.8 880.8 9,?45.4Indirect Investment 9.2 616.9 884.8 1,293.6 297.1 2,550.1
Sub-total 229.8 1,929.8 8,626.5 6,861.9 1,127.91 2,295.6
Financial Costs 0.0 42.2 170.0 583.2 494.8 1,680.2Working Capital 0.0 0.0 0.0 835.8 768.5 1,101.8Other 0.0 0.0 0.0 1,928.8 680.8 2,664.4
TOTAL/Project 229.8 1,972.1 3,798.6 6,494.1 8,020.0 17,612.0
Reduction Plant 72.8 1,304.5 2,770.9 4,560.1 1,066.9 9,704.2Rolling Plant 114.7 644.9 995.7 3,431.1 1,468.2 6,844.8Anodes Plant 41.8 22.7 80.0 582.9 506.9 1,163.2
e Exchange rates used by the firm: 14.40 85./US$ (1986-88),40.0 Bs./USS (1989-91).
Source: ALCASA.
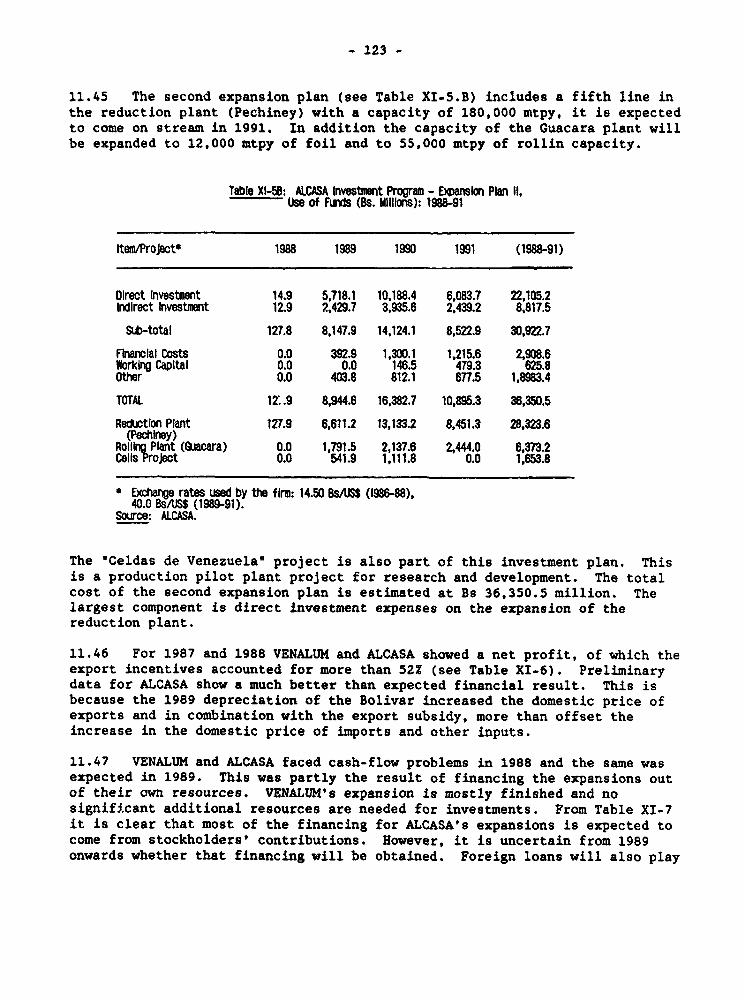
- 123 -
11.45 The second expansion plan (see Table XI-5.B) includes a fifth line inthe reduction plant (Pechiney) with a capacity of 180,000 mtpy, it is expectedto come on stream in 1991. In addition the capacity of the Guacara plant willbe expanded to 12,000 mtpy of foil and to 55,000 mtpy of rollin capacity.
Table XI-58: AICASA Investment Program - Expansion Plan II,JUse of Funds (Bs. Mllibs): 198SI
Item/ProJect* 1988 1989 1990 1991 (198891)
Dlrect Investment 14.9 5,718.1 10,188.4 6,083.7 22,105.2Indirect Investment 12.9 2,429.7 3,935.6 2,439.2 8,817.5
Sub-total 127.8 8,147.9 14,124.1 8,522.9 30,922.7
FinancIal Costs 0.0 392.9 1,300.1 1,215.6 2,908.6Working Capital 0.0 0.0 146.5 479.3 625.8Other 0.0 403.8 812.1 677.5 1,8983.4
TOTAL 12:.9 8,944.6 16,382.7 10,895.3 36,350.5
Reduction Plant 127.9 6,611.2 13,133.2 8,451.3 28,323.6(Pechiney)
Rollng Plant (Quacara) 0.0 1,791.5 2,137.6 2,444.0 6,373.2Cells Project 0.0 541.9 1,111.8 0.0 1,653.8
* Exchange rates used by the flrm: 14.50 Bs/JSS (1988-88),40.0 BsIUSS (1989-91).
SOLrce: ALCASA.
The "Celdas de Venezuela" project is also part of this investment plan. Thisis a production pilot plant project for research and development. The totalcost of the second expansion plan is estimated at Bs 36,350.5 million. Thelargest component is direct investment expenses on the expansion of thereduction plant.
11.46 For 1987 and 1988 VENALUM and ALCASA showed a net profit, of which theexport incentives accounted for more than 52Z (see Table XI-6). Preliminarydata for ALCASA show a much better than expected financial result. This isbecause the 1989 depreciation of the Bolivar increased the domestic price ofexports and in combination with the export subsidy, more than offset theincrease in the domestic price of imports and other inputs.
11.47 VENALUM and ALCASA faced cash-flow problems in 1988 and the same wasexpected in 1989. This was partly the result of financing the expansions outof their own resources. VENALUM's expansion is mostly finished and nosignificant additional resources are needed for investments. From Table XI-7it is clear that most of the financing for ALCASA's expansions is expected tocome from stockholders' contributions. However, it is uncertain from 1989onwards whether that financing will be obtained. Foreign loans will also play
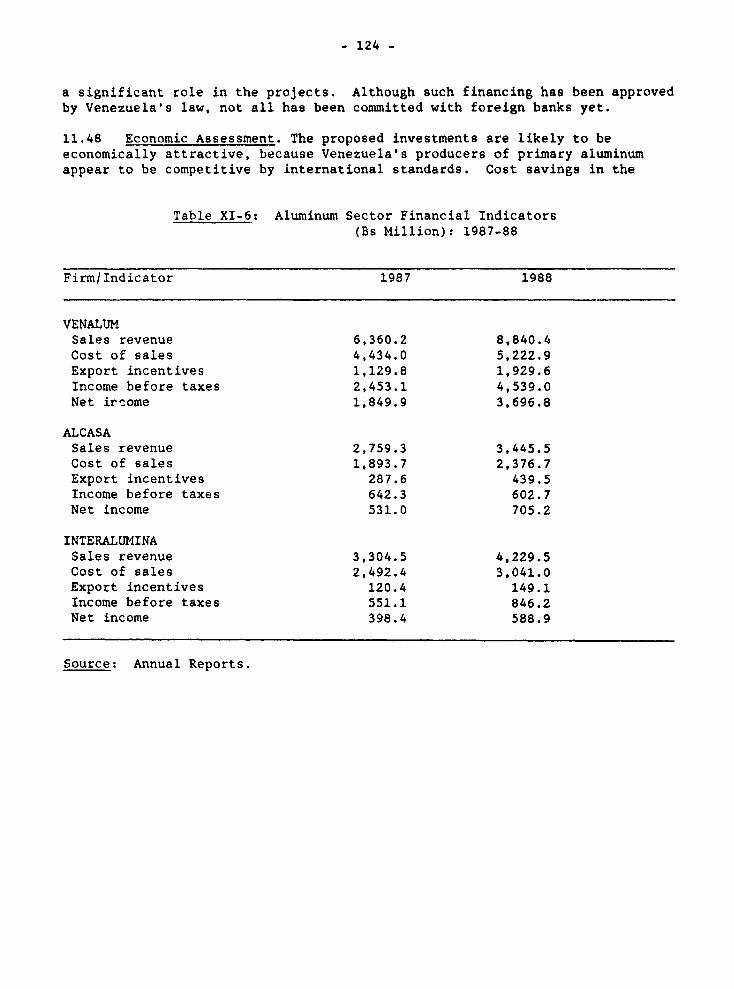
- 124 -
a significant role in the projects. Although such financing has been approvedby Venezuela's law, not all has been committed with foreign banks yet.
11.48 Economic Assessment. The proposed investments are likely to beeconomically attractive, because Venezuela's producers of primary aluminumappear to be competitive by international standards. Cost savings in the
Table XI-6: Aluminum Sector Financial Indicators(Bs Million): 1987-88
Firm/Indicator 1987 1988
VENALUMSales revenue 6,360.2 8,840.4Cost of sales 4,434.0 5,222.9Export incentives 1,129.8 1,929.6Income before taxes 2,453.1 4,539.0Net ircome 1,849.9 3,696.8
ALCASASales revenue 2,759.3 3,445.5Cost of sales 1,893.7 2,376.7Export incentives 287.6 439.5Income before taxes 642.3 602.7Net income 531.0 705.2
INTERALUMINASales revenue 3,304.5 4,229.5Cost of sales 2,492.4 3,041.0Export incentives 120.4 149.1Income before taxes 551.1 846.2Net income 398.4 588.9
Source: Annual Reports.
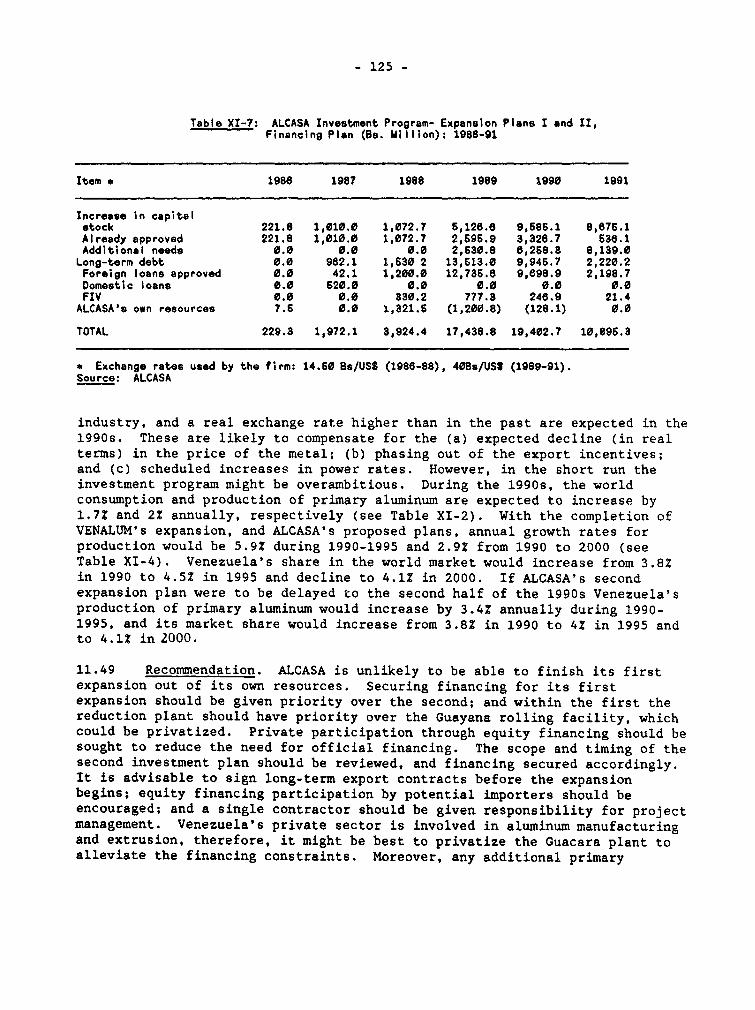
- 125 -
Table XI-?: ALCASA Investment Program- Expansion Plane I and II,Financing Plan (Ba. Million): 1986-91
Item a 1986 1987 l988 1989 1990 1991
Increase in capitalstock 221.8 1,010.0 1,072.7 6,128.6 9,685.1 8,876.1Already approved 221.8 1,010.0 1,072.7 2,696.9 3,328.7 638.1Additional needs 0.0 0.0 0.0 2,530.8 8,258.8 8,139.0Long-term debt 0.0 962.1 1,630 2 13,613.0 9,945.7 2,220.2Foreign loans approved 0.0 42.1 1,200.0 12,736.6 9,898.9 2,198.7Domestic loans 0.0 520.0 0.0 0.0 0.0 0.0FIV 0.0 0.0 330.2 777.3 248.9 21.4ALCASA's own resources 7.6 0.0 1,321.6 (1,200.8) (128.1) 0.0
TOTAL 229.3 1,972.1 3,924.4 17,438.8 19,402.7 10,896.3
* Exchange rates used by the firm: 14.50 Bs/US8 (1986-88), 40Bs/USS (1989-91).Source: ALCASA
industry, and a real exchange rate higher than in the past are expected in the1990s. These are likely to compensate for the (a) expected decline (in realterms) in the price of the metal; (b) phasing out of the export incentives;and (c) scheduled increases in power rates. However, in the short run theinvestment program might be overambitious. During the 1990s, the worldconsumption and production of primary aluminum are expected to increase by1.72 and 21 annually, respectively (see Table XI-2). With the completion ofVENALUM's expansion, and ALCASA's proposed plans, annual growth rates forproduction would be 5.92 during 1990-1995 and 2.92 from 1990 to 2000 (seeTable XI-4). Venezuela's share in the world market would increase from 3.8Zin 1990 to 4.5% in 1995 and decline to 4.12 in 2000. If ALCASA's secondexpansion plan were to be delayed to the second half of the 1990s Venezuela'sproduction of primary aluminum would increase by 3.4Z annually during 1990-1995, and its market share would increase from 3.8% in 1990 to 4% in 1995 andto 4.1% in 2000.
11.49 Recommendation. ALCASA is unlikely to be able to finish its firstexpansion out of its own resources. Securing financing for its firstexpansion should be given priority over the second; and within the first thereduction plant should have priority over the Guayana rolling facility, whichcould be privatized. Private participation through equity financing should besought to reduce the need for official financing. The scope and timing of thesecond investment plan should be reviewed, and financing secured accordingly.It is advisable to sign long-term export contracts before the expansionbegins; equity financing participation by potential importers should beencouraged; and a single contractor should be given responsibility for projectmanagement. Venezuela's private sector is involved in aluminum manufacturingand extrusion, therefore, it might be best to privatize the Guacara plant toalleviate the financing constraints. Moreover, any additional primary
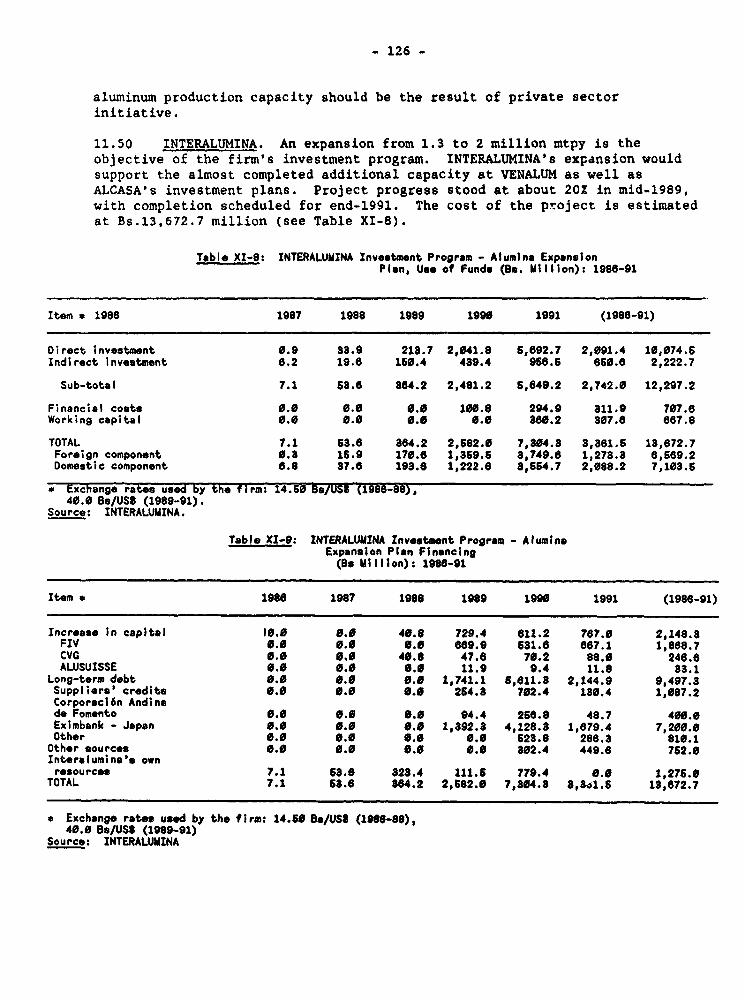
- 126 -
aluminum production capacity should be the result of private sectorinitiative.
11.50 INTERALUMINA. An expansion from 1.3 to 2 million mtpy is theobjective of the firm's investment program. INTERALUMINA's expansion wouldsupport the almost completed additional capacity at VENALUM as well asALCASA's investment plans. Project progress stood at about 202 in mid-1989,with completion scheduled for end-1991. The cost of the project is estimatedat Bs.13,672.7 million (see Table XI-8).
Tuble XI-8: INTERALUUINA Investment Program - Alumina ExpansionPlan, Use of Funds (Bn. Million): 1986-91
Item * 1986 1987 1988 1989 1990 1991 (1986-91)
Direct investment 0.9 83.9 218.7 2,041.8 6,692.7 2,091.4 10,074.6Indirect investment 6.2 19.6 160.4 489.4 956.5 650.6 2,222.7
Sub-total 7.1 65.6 864.2 2,481.2 5,649.2 2,742.0 12,297.2
Financial costs 0.0 0.0 0.0 100.8 294.9 811.9 707.6Working capital 0.0 0.0 0.0 0.0 860.2 307.6 667.6
TOTAL 7.1 53.6 864.2 2,582.0 7,304.8 8,861.5 13,672.7Foreign component 0.3 15.9 170.6 1,359.5 8,749.6 1,273.8 6,569.2Domestic component 6.8 87.6 193.8 1,222.6 8,654.7 2,088.2 7,103.5
C Exchange rates used by the firm: 14.60 Ba/USI (1986-88),40.0 Be/US$ (1989-91).
Source: INTERALUMINA.
Table XI-9: INTERALUMINA Investment Program - AluminsExpansion Plan Financing(Be Million): 1986-91
Item a 1986 1987 1986 1989 1990 1991 (1986-91)
Increase in capital 10.0 0.0 40.8 729.4 611.2 767.0 2,148.8FIV 0.0 0.0 0.0 669.9 531.6 667.1 1,888.7CVC 0.0 0.0 40.8 47.6 70.2 88.0 246.8ALUSUISSE 0.0 0.0 0.0 11.9 9.4 11.8 33.1
Long-term debt 0.0 0.0 0.0 1,741.1 6,611.3 2,144.9 9,497.8Suppliers' credits 0.0 0.0 0.0 254.8 702.4 130.4 1,087.2Corporaci6n Andinade Fomento 0.0 0.0 0.0 94.4 268.8 48.7 400.0Eximbank - Japan 0.0 0.0 0.0 1,892.8 4,128.8 1,679.4 7,200.0Other 0.0 0.0 0.0 0.0 623.8 286.3 810.1
Other sources 0.0 0.0 0.0 0.0 302.4 449.6 762.0Inter.lumina's ownresources 7.1 58.6 828.4 111.5 779.4 0.0 1,276.0
TOTAL 7.1 58.6 344.2 2,582.0 7,804.8 8,84l.5 13,672.7
* Exchange rates used by the firm: 14.50 8./US$ (1996-88),40.0 B/US$ (1989-91)
Source: INTERALUMINA
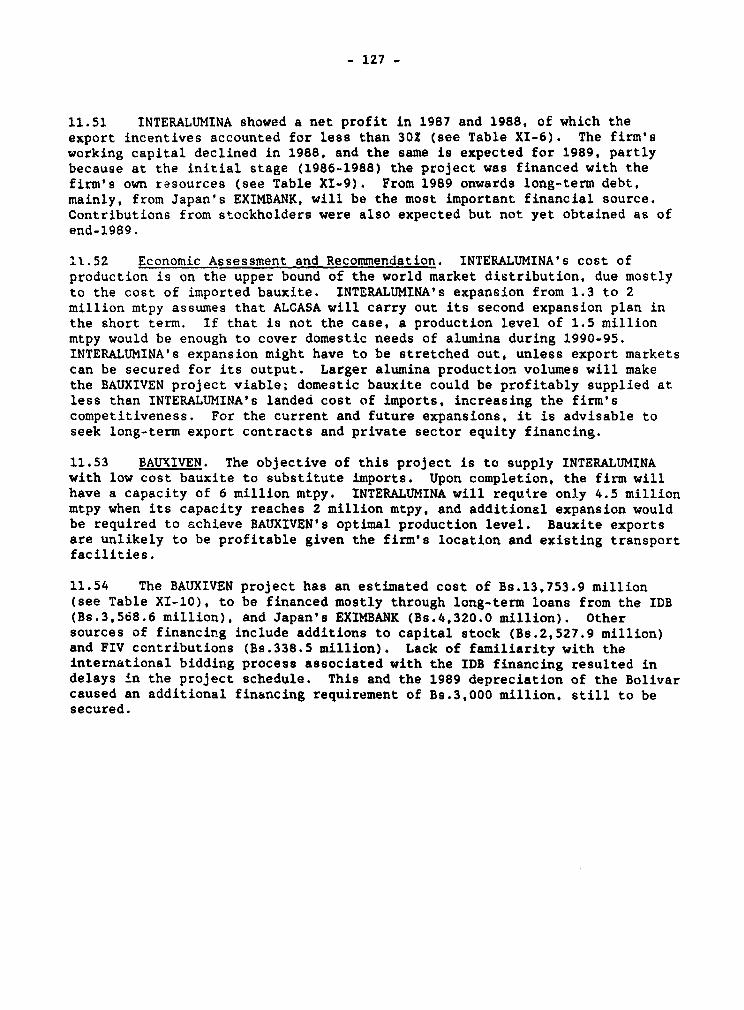
- 127 -
11.51 INTERALUMINA showed a net profit in 1987 and 1988, of which theexport incentives accounted for less than 302 (see Table XI-6). The firm'sworking capital declined in 1988, and the same is expected for 1989, partlybecause at the initial stage (1986-1988) the project was financed with thefirm's own resources (see Table XI-9). From 1989 onwards long-term debt,mainly, from Japan's EXIMBANK, will be the most important financial source.Contributions from stockholders were also expected but not yet obtained as ofend-1989.
11.52 Economic Assessment and Recommendation. INTERALUMINA's cost ofproduction is on the upper bound of the world market distribution, due mostlyto the cost of imported bauxite. INTERALUMINA's expansion from 1.3 to 2million mtpy assumes that ALCASA will carry out its second expansion plan inthe short term. If that is not the case, a production level of 1.5 millionmtpy would be enough to cover domestic needs of alumina during 1990-95.INTERALUMINA's expansion might have to be stretched out, unless export marketscan be secured for its output. Larger alumina production volumes will makethe BAUXIVEN project viable; domestic bauxite could be profitably supplied atless than INTERALUMINA's landed cost of imports, increasing the firm'scompetitiveness. For the current and future expansions, it is advisable toseek long-term export contracts and private sector equity financing.
11.53 BAUYIVEN. The objective of this project is to supply INTERALUMINAwith low cost bauxite to substitute imports. Upon completion, the firm willhave a capacity of 6 million mtpy. INTERALUMINA will require only 4.5 millionmtpy when its capacity reaches 2 million mtpy, and additional expansion wouldbe required to achieve BAUXIVEN's optimal production level. Bauxite exportsare unlikely to be profitable given the firm's location and existing transportfacilities.
11.54 The BAUXIVEN project has an estimated cost of Bs.13,753.9 million(see Table XI-10), to be financed mostly through long-term loans from the IDB(Bs.3,568.6 million), and Japan's EXIMBANK (Bs.4,320.0 million). Othersources of financing include additions to capital stock (Bs.2,527.9 million)and FIV contributions (Bs.338.5 million). Lack of familiarity with theinternational bidding process associated with the IDB financing resulted indelays in the project schedule. This and the 1989 depreciation of the Bolivarcaused an additional financing requirement of Bs.3,000 million, still to besecured.
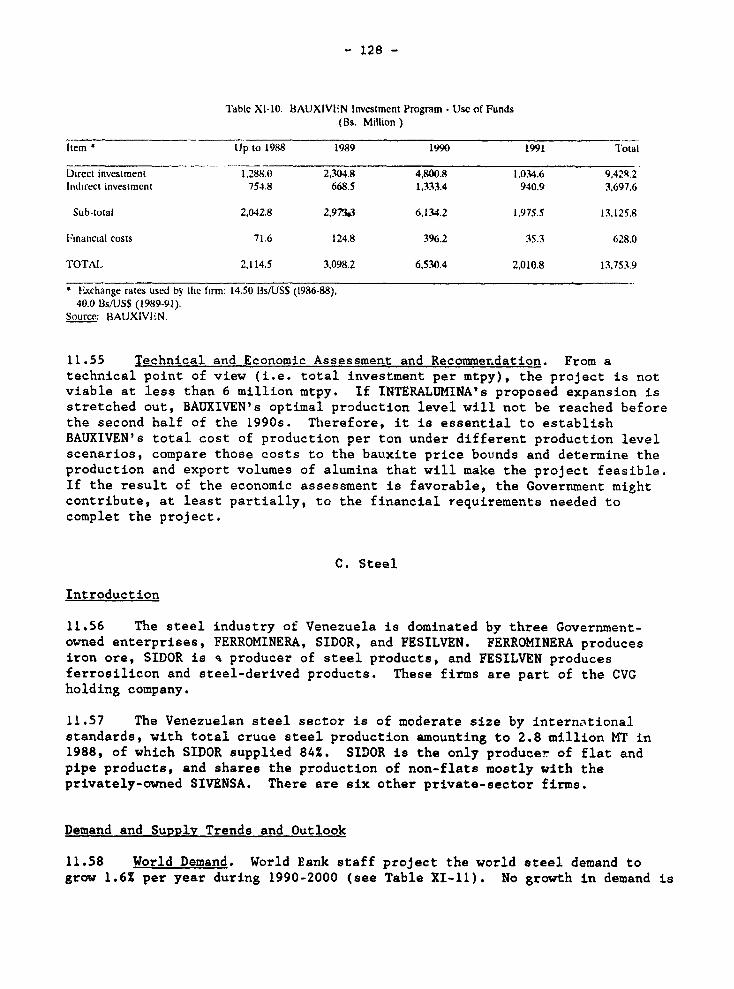
- 128 -
Table Xl-10. 1bAUXIVEN lnvestment Program - Use of Funds(Bs. Million)
Item 'Up to 1988 1989 1990 1991 Total
Direct investment 1,288.0 2,304.8 4,800.8 1.034.6 9,42'.2Indirect investment 754.8 668.5 1,333.4 940.9 3,697.6
Sub-total 2.042.8 2,9W3 6,134.2 1,975.5 13,125.8
Financial costs 71.6 124.8 396.2 35.3 628.0
TOTAL 2,114.5 3,098.2 6,530.4 2,010.8 13,753.9
F-xchange rates used by the firm: 14.50 Bs/US$ (1986-88),40.0 B3s/US$ (1989-91).
Source: BAUXIVEN.
11.55 Technical and Economic Assessment and Recommer.dation. From atechnical point of view (i.e. total investment per mtpy), the project is notviable at less than 6 million mtpy. If INTERALUMINA's proposed expansion isstretched out, BAUXIVEN's optimal production level will not be reached beforethe second half of the 1990s. Therefore, it is essential to establishBAUXIVEN's total cost of production per ton under different production levelscenarios, compare those costs to the bauxite price bounds and determine theproduction and export volumes of alumina that will make the project feasible.If the result of the economic assessment is favorable, the Government mightcontribute, at least partially, to the financial requirements needed tocomplet the project.
C. Steel
Introduction
11.56 The steel industry of Venezuela is dominated by three Government-owned enterprises, FERROMINERA, SIDOR, and FESILVEN. FERROMINERA producesiron ore, SIDOR is A producer of steel products, and FESILVEN producesferrosilicon and steel-derived products. These firms are part of the CVGholding company.
11.57 The Venezuelan steel sector is of moderate size by internationalstandards, with total cruce steel production amounting to 2.8 million MT in1988, of which SIDOR supplied 84%. SIDOR is the only producer of flat andpipe products, and shares the production of non-flats mostly with theprivately-owned SIVENSA. There are six other private-sector firms.
Demand and Supplv Trends and Outlook
11.58 World Demand. World Eank staff project the world steel demand togrow 1.6% per year during 1990-2000 (see Table XI-11). No growth in demand is
- 129 -
non-market economies' demands are projected to increase annually by 3.4? and1.2Z, respectively.
11.59 Domestic Demand. Demand for steel in Venezuela had changed closelywith the level of economic activity. Consumption of steel products grew at7.8X annually during the 1970s, reaching a peak at 2.7 million MT in 1978 whenimports accounted for 62.3% of domestic demand. During the 1980s domesticconsumption declined at a 1.5% annual rate. By 1983 it was only 1.2 millionMT. Imports accounted for an average 21.4Z of domestic consumption, anddeclined at a 18.8Z annual rate (this was partly the result of SIDOR's
Table XI-11. Steel and Iron Ore: World Production,Consumption and Prices, 1990-2000
1990 1996 2000
Crude steel production andapparent consumption (million MT) 778.8 861.1 908.4
Iron ore production andapparent consumption (million MT) 607.4 817.0 680.6
Steel prices (US8 per ton)1/Cold rolled sheets 498.7 535.1 622.3Hot rolled sheets 396.7 438.6 627.0
Iron ore price (US8 per ton)2/ 27.6 28.1 38.6
Steel prices (1986 US8 per ton)3/Cold rolled sheets 326.8 292.4 276.4Hot rolled sheets 281.0 238.5 233.1
Iron ore price (1986 US8 per ton)3/ 23.0 18.0 1r.7
1/ Japan, fob.2/ Spot sinter fines of Brazilian ore, cif German ports, 66% MC content.3/ Deflated by US GNP deflator.Source: World Bank, ICMD.
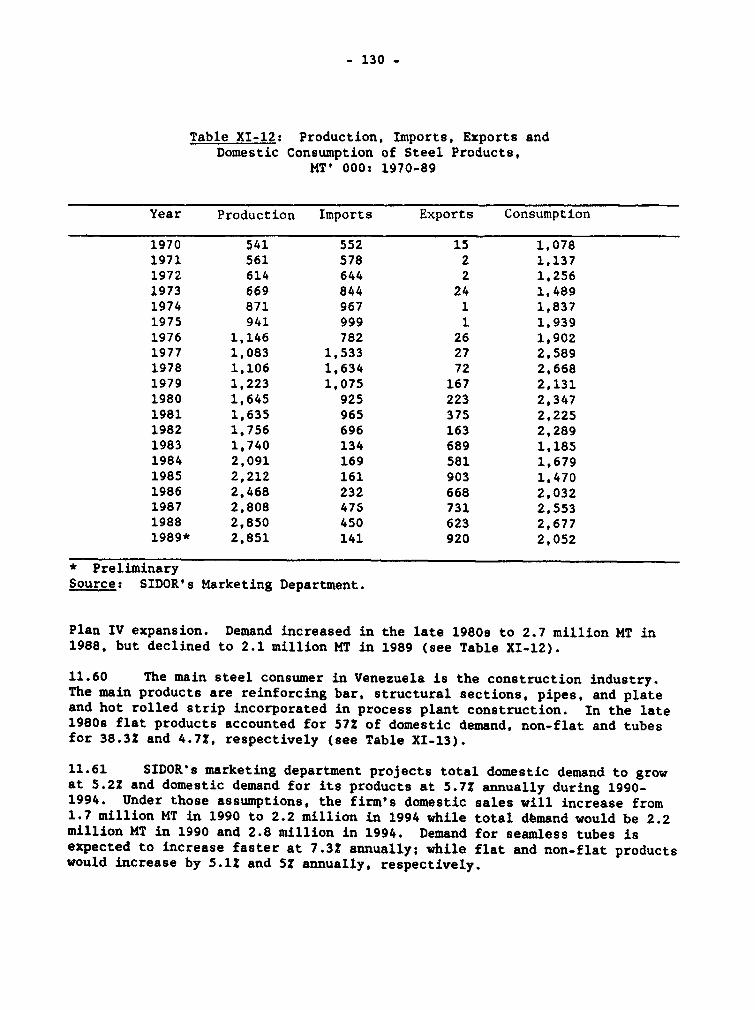
- 130 -
Table XI-12: Production, Imports, Exports andDomestic Consumption of Steel Products,
MT' 000: 1970-89
Year Production Imports Exports Consumption
1970 541 552 15 1,0781971 561 578 2 1,1371972 614 644 2 1,2561973 669 844 24 1,4891974 871 967 1 1,8371975 941 999 1 1,9391976 1,146 782 26 1,9021977 1,083 1,533 27 2,5891978 1,106 1,634 72 2,6681979 1,223 1,075 167 2,1311980 1,645 925 223 2,3471981 1,635 965 375 2,2251982 1,756 696 163 2,2891983 1,740 134 689 1,1851984 2,091 169 581 1,6791985 2,212 161 903 1,4701986 2,468 232 668 2,0321987 2,808 475 731 2,5531988 2,850 450 623 2,6771989* 2,851 141 920 2,052
* PreliminarySource: SIDOR's Marketing Department.
Plan IV expansion. Demand increased in the late 1980s to 2.7 million MT in1988, but declined to 2.1 million MT in 1989 (see Table XI-12).
11.60 The main steel consumer in Venezuela is the construction industry.The main products are reinforcing bar, structural sections, pipes, and plateand hot rolled strip incorporated in process plant construction. In the late1980s flat products accounted for 57Z of domestic demand, non-flat and tubesfor 38.3Z and 4.7Z, respectively (see Table XI-13).
11.61 SIDOR's marketing department projects total domestic demand to growat 5.2Z and domestic demand for its products at 5.7Z annually during 1990-1994. Under those assumptions, the firm's domestic sales will increase from1.7 million MT in 1990 to 2.2 million in 1994 while total dbmand would be 2.2million MT in 1990 and 2.8 million in 1994. Demand for seamless tubes isexpected to increase faster at 7.3? annually; while flat and non-flat productswould increase by 5.12 and 5? annually, respectively.
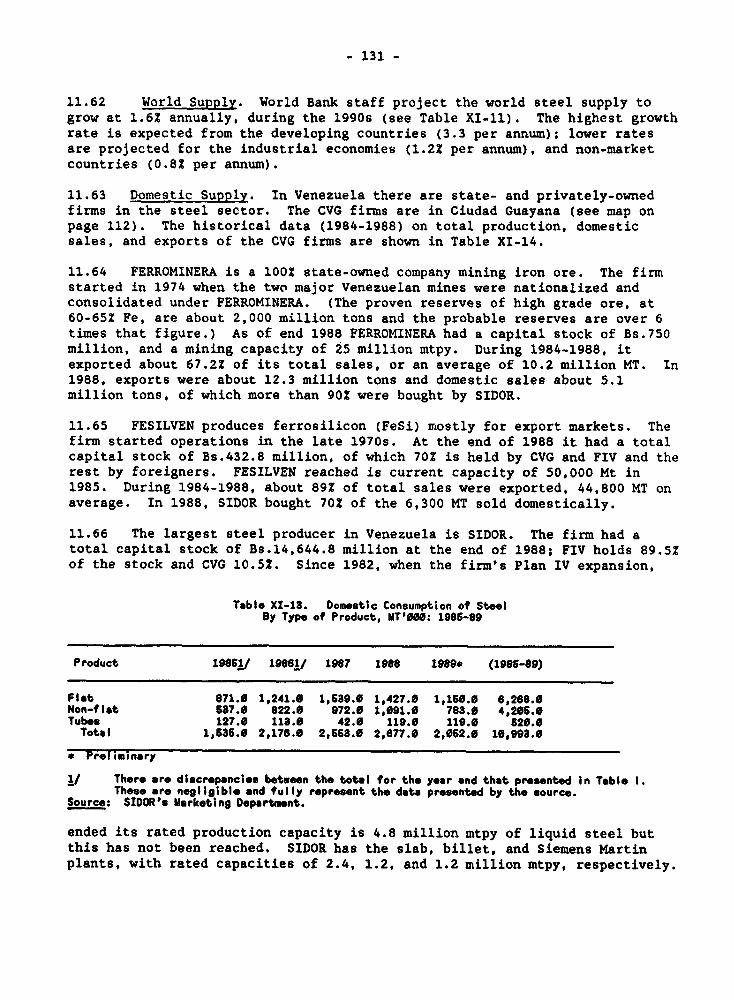
- 131 -
11.62 World Supply. World Bank staff project the world steel supply togrow at 1.6Z annually, during the 1990s (see Table XI-l1). The highest growthrate is expected from the developing countries (3.3 per annum); lower ratesare projected for the industrial economies (1.2Z per annum), and non-marketcountries (0.82 per annum).
11.63 Domestic Supply. In Venezuela there are state- and privately-ownedfirms in the steel sector. The CVG firms are in Ciudad Guayana (see map onpage 112). The historical data (1984-1988) on total production, domesticsales, and exports of the CVG firms are shown in Table XI-14.
11.64 FERROMINERA is a 1002 state-owned company mining iron ore. The firmstarted in 1974 when the two major Venezuelan mines were nationalized andconsolidated under PERROMINERA. (The proven reserves of high grade ore, at60-65Z Fe, are about 2,000 million tons and the probable reserves are over 6times that figure.) As of end 1988 FERROMINERA had a capital stock of Bs.750million, and a mining capacity of 25 million mtpy. During 1984-1988, itexported about 67.22 of its total sales, or an average of 10.2 million MT. In1988, exports were about 12.3 million tons and domestic sales about 5.1million tons, of which more than 902 were bought by SIDOR.
11.65 FESILVEN produces ferrosilicon (FeSi) mostly for export markets. Thefirm started operations in the late 1970s. At the end of 1988 it had a totalcapital stock of Bs.432.8 million, of which 70Z is held by CVG and FIV and therest by foreigners. FESILVEN reached is current capacity of 50,000 Mt in1985. During 1984-1988, about 892 of total sales were exported, 44,800 MT onaverage. In 1988, SIDOR bought 702 of the 6,300 MT sold domestically.
11.66 The largest steel producer in Venezuela is SIDOR. The firm had atotal capital stock of Bs.14,644.8 million at the end of 1988; FIV holds 89.52of the stock and CVG 10.52. Since 1982. when the firm's Plan IV expansion,
Table XI-13. Domestic Consumption of SteelBy Type of Product, MT'O0: 1986-09
Product 1985j/ 19861/ 1987 1988 1989. (198S-89)
Flat 871.0 1,241.0 1,539.0 1,427.0 1,160.0 6,268.0Non-flat 587.0 822.0 972.0 1,091.0 783.0 4,205.0Tubes 127.0 113.0 42.0 119.0 119.0 620.0
Total 1,536.0 2,176.0 2,665.0 2,677.0 2,062.0 10,993.0
* Preltiminry
y There are discrepancies between the total for the year and that presented In Table l.These are negligible and fully represent the date presented by tho source.
Source: SIDOR's Marketing Department.
ended its rated production capacity is 4.8 million mtpy of liquid steel butthis has not been reached. SIDOR has the slab, billet, and Siemens Martinplants, with rated capacities of 2.4, 1.2, and 1.2 million mtpy, respectively.
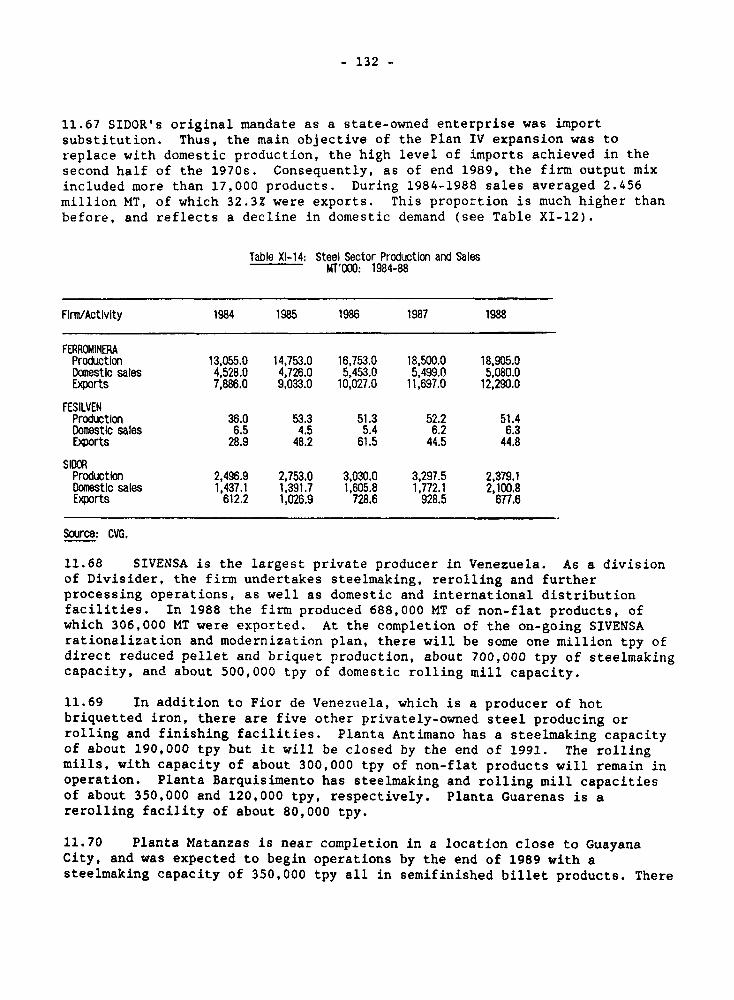
- 132 -
11.67 SIDOR's original mandate as a state-owned enterprise was importsubstitution. Thus, the main objective of the Plan IV expansion was toreplace with domestic production, the high level of imports achieved in thesecond half of the 1970s. Consequently, as of end 1989, the firm output mixincluded more than 17,000 products. During 1984-1988 sales averaged 2.456million MT, of which 32.3Z were exports. This proportion is much higher thanbefore, and reflects a decline in domestic demand (see Table XI-12).
Table XI-14: Steel Sector Production and SalesMTOOO: 1984-88
Flrm/Activity 1984 1985 1986 1987 1988
FERROMINERAProduction 13,055.0 14,753.0 16,753.0 18,500.0 18,905.0Domestic sales 4,528.0 4,726.0 5,453.0 5,499.0 5,080.0Exports 7,886.0 9,033.0 10,027.0 11,697.0 12,290.0
FESILVENProduction 36.0 53.3 51.3 52.2 51.4Domestic sales 6.5 4.5 5.4 6.2 6.3Exports 28.9 48.2 61.5 44.5 44.8
SIDORProduction 2,496.9 2,753.0 3,030.0 3,297.5 2,379.1Domestic sales 1,437.1 1,391.7 1,605.8 1,772.1 2,100.8Exports 612.2 1,026.9 728.6 928.5 677.6
Source: CVG.
11.68 SIVENSA is the largest private producer in Venezuela. As a divisionof Divisider, the firm undertakes steelmaking, rerolling and furtherprocessing operations, as well as domestic and international distributionfacilities. In 1988 the firm produced 688,000 MT of non-flat products, ofwhich 306,000 MT were exported. At the completion of the on-going SIVENSArationalization and modernization plan, there will be some one million tpy ofdirect reduced pellet and briquet production, about 700,000 tpy of steelmakingcapacity, and about 500,000 tpy of domestic rolling mill capacity.
11.69 In addition to Fior de Venezuela, which is a producer of hotbriquetted iron, there are five other privately-owned steel producing orrolling and finishing facilities. Planta Antimano has a steelmaking capacityof about 190,000 tpy but it will be closed by the end of 1991. The rollingmills, with capacity of about 300,000 tpy of non-flat products will remain inoperation. Planta Barquisimento has steelmaking and rolling mill capacitiesof about 350,000 and 120,000 tpy, respectively. Planta Guarenas is arerolling facility of about 80,000 tpy.
11.70 Planta Matanzas is near completion in a location close to GuayanaCity, and was expected to begin operations by the end of 1989 with asteelmaking capacity of 350,000 tpy all in semifinished billet products. There
- 133 -
are no rolling mills at this facility but a direct reduced iron plant of600,000 tpy capacity is scheduled to start in September 1990. Planta Valenciais a further-processing plant.
Price, Cost, and Commercial Policy Issues
11.71 World Prices. As shown in Table XI-11, the international price ofSIDOR's major products are expected to decline in real terms during the 1990s.The same is forecasted for the world price of iron ore.
11.72 Pricing Policies in Venezuela. The significant domestic priceliberalization that took place in the country in early 1989, has not beenfully implemented in the steel sector. As of end 1989, steel sector producersreceived different domestic and fob export prices for the same product; andprice differentials applied in their sales to state- and privately-ownedcompanies. Significant price policy changes are expected in 1990.
11.73 Between 1975-87 FERROMINERA sold iron ore to SIDOR and SIVENSA at thesame price. In 1988 prices were upwardly adjusted for SIVENSA only and aprice gap between the two buyers was then established. In April 1989, theprices for SIVENSA were adjusted again while the adjustment for SIDOR was totake place gradually. At the end of 1989, FERROMINERA was selling to SIDORand SIVENSA at Bs.200 and 250 per ton, respectively; or at US$5 and US$6.25,respectively (Bs.40 per US$). The 1989 fob export price was on average US$12,within a range of US$8-16. A proposal has been made to change gradually thedomestic price of iron ore towards the fob export price during 1990.
11.74 FESILVEN sells to SIDGR on a cost-recovery basis. For 1989 the firmestimates an average fob export price of US$650, while the price to SIDORwould be US$525 (Bs.40 per US$). No information was made available to compareprices among FESILVEN's domestic buyers.
11.75 By mid-1989, domestic steel prices were liberalized for both publicand private steel producers. Before this price deregulation, there were twoprice control regimes applicable to SIDOR: (a) a system for steel productsrelated to canning of basic foodstuffs, supervised by the Central Bank, and(b) a system of price authorizations on remaining steel products. SIDORcommunicated to the Development Ministry its proposed price increases, andafter 60 days it could increase them automatically if the Ministry had noobjections.
11.76 Historical differences between international and domestic prices ofsteel products are diffici;lt to assess because: (a) no data have been madeavailable to distinguish between prices of imnort-competing and exported steelproducts; and (b) the significant overvaluation of the Bolivar previous to theunification of the exchange rate in early 1989 distorted the US$ equivalent ofdomestic prices. On the one hand, domestic prices for import competing goodswere likely to be higher than the international price as a result of the traderegime. On the other hand, there might have been limits to that differentialthrough the Government imposed domestic price controls.- The domestic pricesof exported products were likely to be lower than otherwise as a result of theovervaluation of the bolivar.
- 134 -
11.77 While many other controlled prices were liberalized on April 1 1989,SIDOR was not authorized to increase its domestic prices before July 1989. Atthe end of 1989, most of its product groups had domestic prices at least ashigh as the corresponding fob export price. However, this was not the casefor the most important flat products, hot and cold rolled sheets of whichSIDOR is the only producer. The domestic cif prices of imports were higherthan the domestic ones for all groups, and there was up to a 40? differentialin tubes and cold rolled sheets (see Table X1-15). The data indicate thatwhere SIDOR is the only producer, protection was high and the firm supplieddomestically at less than opportunity cost. Effective January 15, 1990, thedomestic price of cold rolled sheets increased by 30?, hot rolled sheets andtubes by 20?, re-bar products by 142, and wire rod by 7Z.
11.78 Cost and Technological Aspects. Venezuelan steel producers benefitfrom low-cost, high quality basic material inputs, such as iron ore, gas, andelectricity. This gives the industry a significant by advantage in theproduction of direct reduced iron the basic material input for steelmaking.However the cost advantages are partly the result of government policiespricing inputs below opportunity cost. For example, the companies pay lessthan the estimated marginal cost of generating hydroelectricity. Theappropriate opportunity cost for natural gas is under study. Iron ore issupplied to steel producers at less than the fob export price.
11.79 FERROMINERA's 1989 average cost of production was Bs 200. Thecompany has produced at less than capacity since the mid-1970s. Firmutilization was at a record low in 1983 at less than 10 million Mt, butincreased to reach a peak at 19 million mt in 1988. Labor productivity hasvaried with capacity utilization; it was at a 1.7 ton per man-hour record lowin 1983, increasing to 2.6 ton per man-hour in 1988.
11.80 Taxes on mining operations are a major concern. Previous Bankmissions indicated the incidence of very high mining taxes in Venezuela byinternational standard. At the end of 1989, FERROMINERA's staff stated thatthe company's tax rate on gross income was 60Z. The 1988 implicit tax rate onincome was 20? as shown in its Annual Report. The corresponding figure for1987 was 55?, and no information is available to account for the significantchange. For the CVG aluminum firms studied in this chapter, the 1988 implicitrate is 25? on average.
11.81 The major cost components of FESILVEN's production are electricenergy, iron ore, and imported coke, coal, and quartz. In 1988, the companyreported an average cost of Bs.8,990 per ton of FeSi, 38? higher than in 1987.The average cost of production in domestic currency is expected to be muchhigher in 1989 than before. This will be the result of the macroeconomicmeasures (higher prices) effective in early 1989 and increases in the domesticprice of imported inputs as a result of the Bolivar depreciation. Capacity
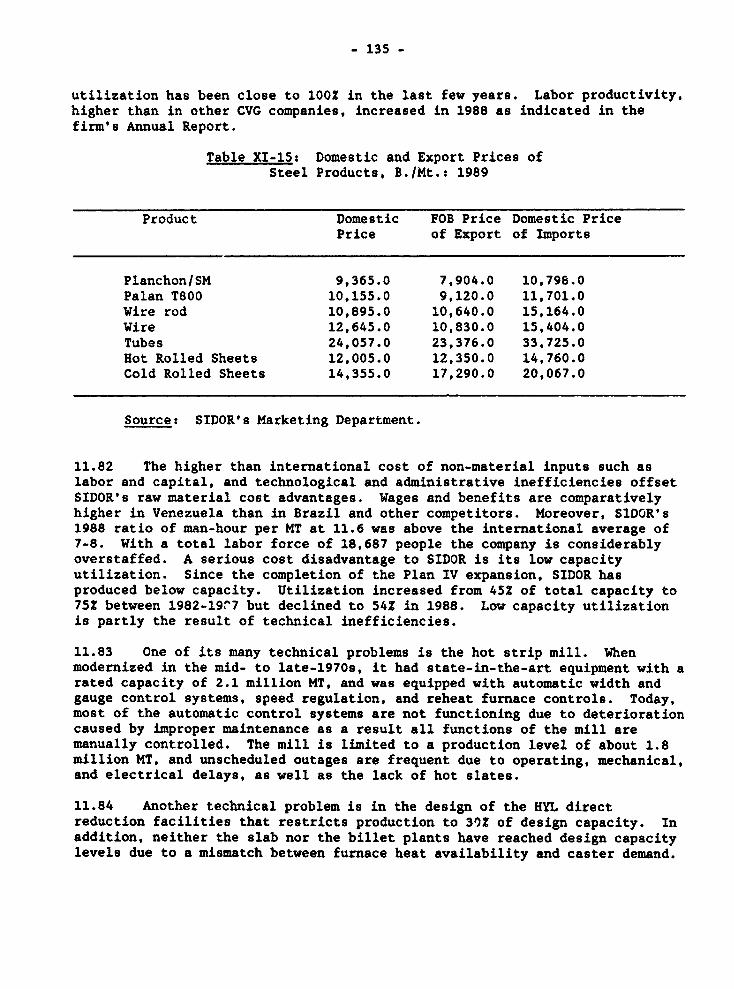
- 135 -
utilization has been close to 10OZ in the last few years. Labor productivity,higher than in other CVG companies, increased in 1988 as indicated in thefirm's Annual Report.
Table XI-15: Domestic and Export Prices ofSteel Products, B./Mt.: 1989
Product Domestic FOB Price Domestic PricePrice of Export of Imports
Planchon/SM 9,365.0 7,904.0 10,798.0Palan T800 10,155.0 9,120.0 11,701.0Wire rod 10,895.0 10,640.0 15,164.0Wire 12,645.0 10,830.0 15,404.0Tubes 24,057.0 23,376.0 33,725.0Hot Rolled Sheets 12,005.0 12,350.0 14,760.0Cold Rolled Sheets 14,355.0 17,290.0 20,067.0
Source: SIDOR's Marketing Department.
11.82 The higher than international cost of non-material inputs such aslabor and capital, and technological and administrative inefficiencies offsetSIDOR's raw material cost advantages. Wages and benefits are comparativelyhigher in Venezuela than in Brazil and other competitors. Moreover, SlDOR's1988 ratio of man-hour per MT at 11.6 was above the international average of7-8. With a total labor force of 18,687 people the company is considerablyoverstaffed. A serious cost disadvantage to SIDOR is its low capacityutilization. Since the completion of the Plan IV expansion, SIDOR hasproduced below capacity. Utilization increased from 45Z of total capacity to75Z between 1982-19^7 but declined to 54Z in 1988. Low capacity utilizationis partly the result of technical inefficiencies.
11.83 One of its many technical problems is the hot strip mill. Whenmodernized in the mid- to late-1970s, it had state-in-the-art equipment with arated capacity of 2.1 million MT, and was equipped with automatic width andgauge control systems, speed regulation, and reheat furnace controls. Today,most of the automatic control systems are not functioning due to deteriorationcaused by improper maintenance as a result all functions of the mill aremanually controlled. The mill is limited to a production level of about 1.8million MT, and unscheduled outages are frequent due to operating, mechanical,and electrical delays, as well as the lack of hot slates.
11.84 Another technical problem is in the design of the HYL directreduction facilities that restricts production to 302 of design capacity. Inaddition, neither the slab nor the billet plants have reached design capacitylevels due to a mismatch between furnace heat availability and caster demand.
- 136 -
11.85 In 1987 and 1988, the value of SIDOR's inventory was equal to 50X ofthe firm's annual sales, much higher than the corresponding figures forVENALUM (22Z) and ALCASA (35%). This is partly because there are more than17,000 products included in the SIDOR's output mix, mostly of low quality byinternational standards. Its inefficient marketing and inventory managementpractices contribute to significant cash-flow problems.
11.86 Commercial Policy. Significant changes in the trade and exchangeregime took place in Venezuela in early 1989. These changes liberalized thetrade regime and reduced the anti-export bias faced by steel producers.However, SIDOR pricing practices had been an obstacle to the implementation ofthe trade reforms. In the past, imports of steel products were subject toquantitative restrictions. Prospective importers were expected to obtain animport permit through a complex process. In those cases where SIDOR was theonly domestic producer of the product in question, the firm had completecontrol over its importation and domestic sale.
11.87 The quantitative restrictions were removed and a relatively low-tariff schedule became effective in early 1989. Tariffs range from one to 15%and most products are subject to a less than 10% rate. However, in caseswhere SIDOF is the only domestic producer, protection has been high, and thefirm has b en selling its import-competing products below opportunity cost(see Tabl XI-15). Thus, steel imports were negligible in 1989 (see TableXI-12), Lthough this is also explained by an 8% decline in GDP.
11.88 The three CVG firms in the steel sector receive 30% of their fobexport price as an export incentive. FERROMINERA and FESILVEN selldomestically below fob export price. Therefore, the CVG requires them tosupply domestic steel producers like SIDOR before they can export. SIDOR alsosells part of its output to other CVG companies and domestic buyers on apriority basis at below fob export price.
11.89 Policy Recommendations. All firms in the sector should pay theopportunity cost of inputs, including those supplied by the CVG companies.Thus, prices by FERROMINERA and FESILVEN should be unified at thecorresponding fob export price, and SIDOR should supply domestically at noless than fob export price. The current ?ricing practices are distortionary,and undermine the implementation of the trade reform. The tax regime forFERROMINERA must be revised to reduce taxes to international levels. Theeconomics of the export incentives should be reassessed, considering amongother things, the distortions they cause through the use of non-marketpractices. Technical and managerial difficulties at SIDOR should be addressedas part of an overall restructuring program.
Investment Review
11.90 FERROMINERA. The firm's investment program is not available indetail; moreover, the Eighth Plan (prepared by CORDIPLAN) exclude the firm'sproposals. FERROMINERA plans to increase the processing and shipping capacityat the port, and the processing facilities at the mines. This will result in
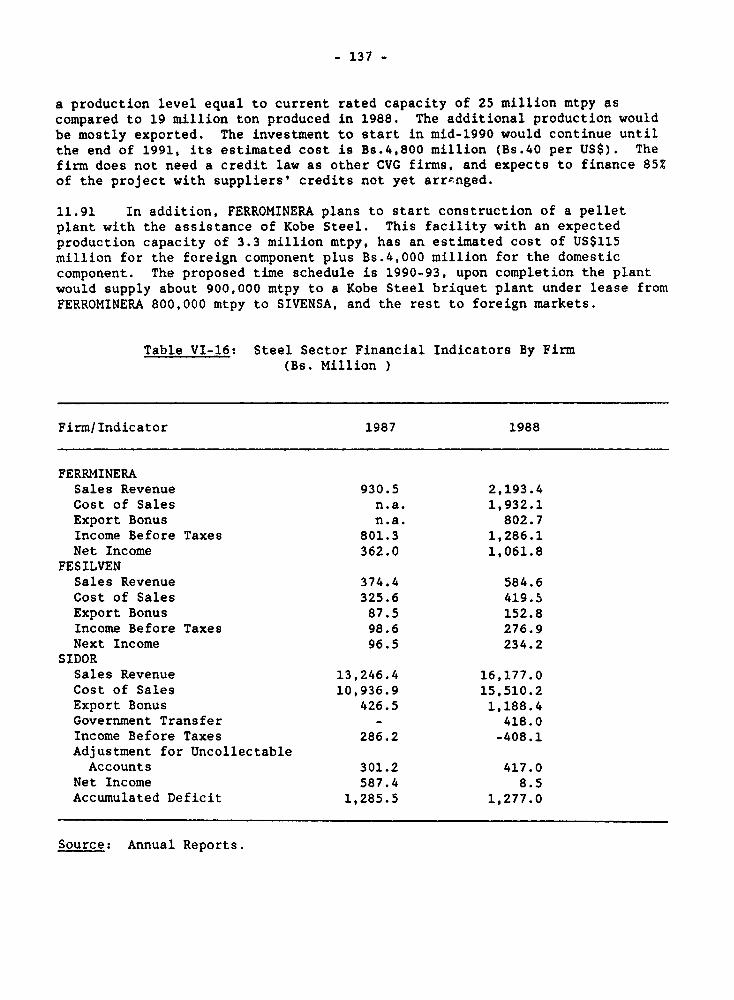
- 137 -
a production level equal to current rated capacity of 25 million mtpy ascompared to 19 million ton produced in 1988. The additional production wouldbe mostly exported. The investment to start in mid-1990 would continue untilthe end of 1991, its estimated cost is Bs.4,800 million (Bs.40 per US$). Thefirm does not need a credit law as other CVG firms, and expects to finance 85Zof the project with suppliers' credits not yet arrgnged.
11.91 In addition, FERROMINERA plans to start construction of a pelletplant with the assistance of Kobe Steel. This facility with an expectedproduction capacity of 3.3 million mtpy, has an estimated cost of US$115million for the foreign component plus Bs.4,000 million for the domesticcomponent. The proposed time schedule is 1990-93, upon completion the plantwould supply about 900,000 mtpy to a Kobe Steel briquet plant under lease fromFERROMINERA 800,000 mtpy to SIVENSA, and the rest to foreign markets.
Table VI-16: Steel Sector Financial Indicators By Firm(Bs. Million )
Firm/Indicator 1987 1988
FERRMINERASales Revenue 930.5 2,193.4Cost of Sales n.a. 1,932.1Export Bonus n.a. 802.7Income Before Taxes 801.3 1,286.1Net Income 362.0 1,061.8
FESILVENSales Revenue 374.4 584.6Cost of Sales 325.6 419.5Export Bonus 87.5 152.8Income Before Taxes 98.6 276.9Next Income 96.5 234.2
SIDORSales Revenue 13,246.4 16,177.0Cost of Sales 10,936.9 15,510.2Export Bonus 426.5 1,188.4Government Transfer - 418.0Income Before Taxes 286.2 -408.1Adjustment for UncollectableAccounts 301.2 417.0
Net Income 587.4 8.5Accumulated Deficit 1,285.5 1,277.0
Source: Annual Reports.
- 138 -
11.92 In 1987 and 1988 FERROMINERA had a positive net income of Bs.362 andBs.1,062.8 million, respectively. The firm has been selling at cost to SIDORand with a small profit to SIVENSA. Its major source of profits is exports.In 1988. the export incentives accounted for 75.6Z of net income (see TableXI-16), and the working capital of the firm increased by Bs.722 million. Thedepreciation of the bolivar in early 1989 and the export incentives are likelyto result in a large profit for the firm in 1989. As the incentives arephased out in 1990, FERROMINERA will benefit substantially from sellingdomestically at export opportunity cost.
11.93 Technical and Economic Assessment and Recommendation. On theexpansion plan, a mission that visited Venezuela in September 1989 concludedthat an investment of about US$10 per additional ton was acceptable from atechnical viewpoint. However, the estimated cost has increased since thenfrom US$70 million to US$115, and it is no longer clear whether the project isacceptable using the same criteria. The recommendation is to postpone theexpansion until the results of the proposed restructuring plan for SIDOR areavailable. FERROMINERA will then have a better assessment of it future exportcapacity. If the expansion is justified, the firm could seek importers'contributions for the investment, given that the additional production will bemostly for exports.
11.94 For the pellet plant no technical assessment has been made by Bankstaff. The production of this facility would in principle compete withSIDOR's exports. Therefore, the results of SIDOR's restructuring programshould be available before construction for a new pellet plant starts atFERROMINERA.
11.95 FESILVEN. The firm plans to increase capacity from 50,000 mtpy to90,000 mtpy of FeSi; or alternatively to 75,000 mtpy of Fesi plus 13,500 ofmetallic siliceous. The project started in 1988 and will continue until theend of 1992. When completed, 90Z of the FeSi production will be exported. Ifmetallic siliceous is included in the output mix, about 10,000 mtpy will beexported, and the rest supplied to ALCASA and VENALUM. The estimated cost ofthe project is Bs.5,200 million, of which Bs.2,016 million is the cost ofmachinery and equipment (see Table XI-17).
11.96 FESILVEN had a net income of Bs.96.5 and 234.2 million in 1987 and1988, respectively. The company sells at cost to SIDOR and gets a profit fromexports. The export incentives accounted for 65.2Z of net income in 1988 (seeTable XI-16). The firm's working capital increased by Bs.11.4 million in 1987and by Bs.22.1 million in 1988. The Bolivar depreciation of early 1989 andthe export incentives will be to the firm advantage in 1989. However, thedepreciation increasing the domestic price of imports combined with a declinein the international price of FESILVEN's exports and the expansion expensesmight result in cash-flow problems for the company in 1989.
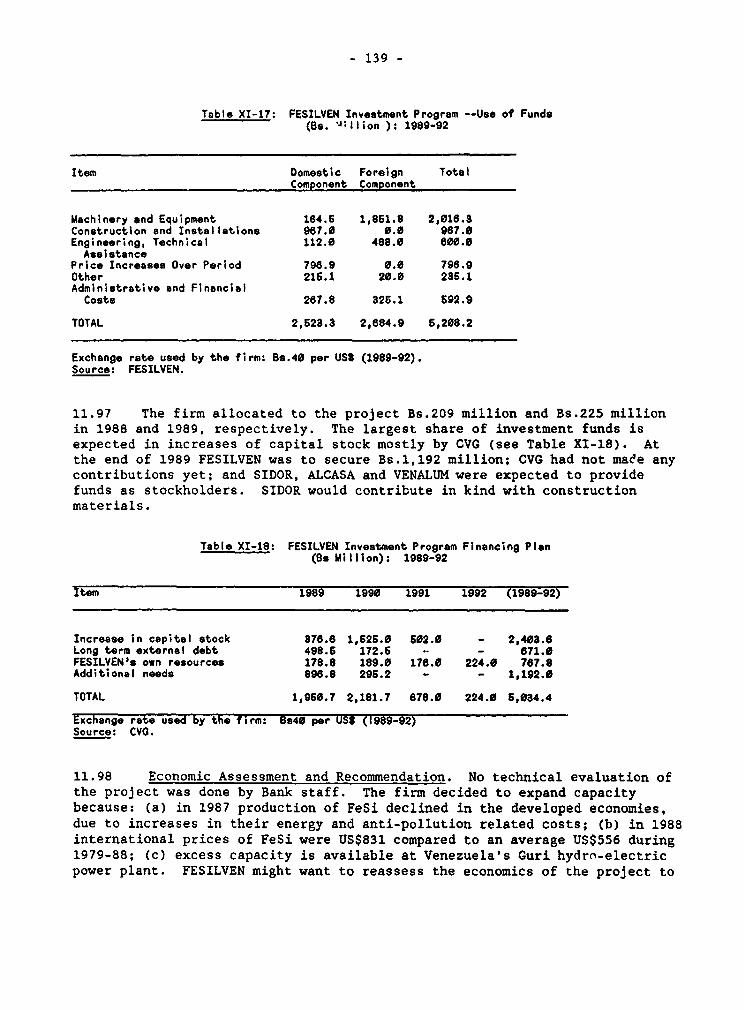
- 139 -
Table XI-17: FESILVEN Investment Program --Use of Funds(B.. M llion ): 1989-92
Item Domestic Foreign TotalComponent Component
Machinery and Equipment 164.6 1,861.8 2,016.3Construction and Installations 967.0 0.0 9e7.0Engineering, Technical 112.0 488.0 800.0Assistance
Price Increases Over Period 796.9 0.0 798.9Other 216.1 20.0 236.1Administrative and FinancialCosts 267.8 326.1 692.9
TOTAL 2,523.3 2,684.9 6,208.2
Exchange rate used by the firm: Bs.40 per US$ (1989-92).Source: FESILVEN.
11.97 The firm allocated to the project Bs.209 million and Bs.225 millionin 1988 and 1989, respectively. The largest share of investment funds isexpected in increases of capital stock mostly by CVG (see Table XI-18). Atthe end of 1989 FESILVEN was to secure Bs.1,192 million; CVG had not maee anycontributions yet; and SIDOR, ALCASA and VENALUM were expected to providefunds as stockholders. SIDOR would contribute in kind with constructionmaterials.
Table XI-18: FESILVEN Investment Program Financing Plan(Bs Million): 1989-92
Item 1989 1990 1991 1992 (1989-92)
Increase in capital stock 378.6 1,626.0 602.0 - 2,403.6Long term external debt 498.5 172.6 - - 671.0FESILVEN's own resources 178.8 189.0 176.0 224.0 767.8Additional needs 896.8 295.2 - - 1,192.0
TOTAL 1,960.7 2,181.7 878.0 224.0 6,034.4
Exchange rate used by the firm: 6s40 per US8 (1989-92)Source: CVG.
11.98 Economic Assessment and Recommendation. No technical evaluation ofthe project was done by Bank staff. The firm decided to expand capacitybecause: (a) in 1987 production of FeSi declined in the developed economies,due to increases in their energy and anti-pollution related costs; (b) in 1988international prices of FeSi were US$831 compared to an average US$556 during1979-88; (c) excess capacity is available at Venezuela's Guri hydro-electricpower plant. FESILVEN might want to reassess the economics of the project to
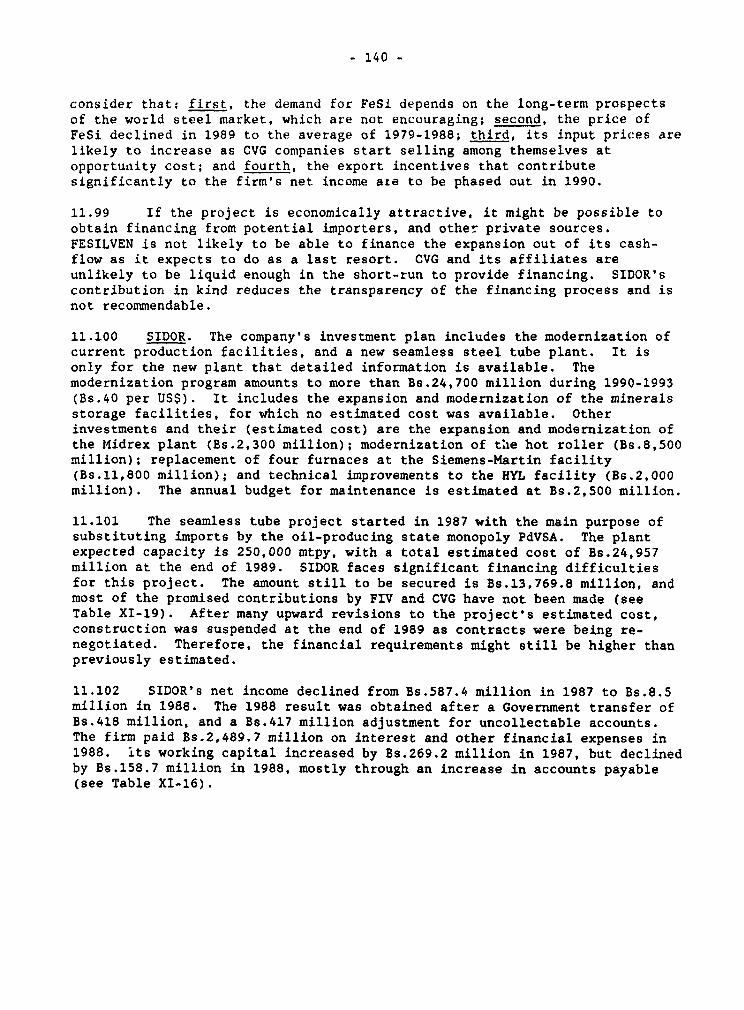
- 140 -
consider that: first, the demand for FeSi depends on the long-term prospectsof the world steel market, which are not encouraging; second, the price ofFeSi declined in 1989 to the average of 1979-1988; third, its input prices arelikely to increase as CVG companies start selling among themselves atopportunity cost; and fourth, the export incentives that contributesignificantly to the firm's net income ate to be phased out in 1990.
11.99 If the project is economically attractive, it might be possible toobtain financing from potential importers, and other private sources.FESILVEN is not likely to be able to finance the expansion out of its cash-flow as it expects to do as a last resort. CVG and its affiliates areunlikely to be liquid enough in the short-run to provide financing. SIDOR'scontribution in kind reduces the transparency of the financing process and isnot recommendable.
11.100 SIDOR. The company's investment plan includes the modernization ofcurrent production facilities, and a new seamless steel tube plant. It isonly for the new plant that detailed information is available. Themodernization program amounts to more than Bs.24,700 million during 1990-1993(Bs.40 per US$). It includes the expansion and modernization of the mineralsstorage facilities, for which no estimated cost was available. Otherinvestments and their (estimated cost) are the expansion and modernization ofthe Midrex plant (Bs.2,300 million); modernization of tile hot roller (Bs.8,500million); replacement of four furnaces at the Siemens-Martin facility(Bs.11,800 million); and technical improvements to the HYL facility (Bs.2,000million). The annual budget for maintenance is estimated at Bs.2,500 million.
11.101 The seamless tube project started in 1987 with the main purpose ofsubstituting imports by the oil-producing state monopoly PdVSA. The plantexpected capacity is 250,000 mtpy, with a total estimated cost of Bs.24,957million at the end of 1989. SIDOR faces significant financing difficultiesfor this project. The amount still to be secured is Bs.13,769.8 million, andmost of the promised contributions by FIV and CVG have not been made (seeTable XI-19). After many upward revisions to the project's estimated cost,construction was suspended at the end of 1989 as contracts were being re-negotiated. Therefore, the financial requirements might still be higher thanpreviously estimated.
11.102 SIDOR's net income declined from Bs.587.4 million in 1987 to Bs.8.5million in 1988. The 1988 result was obtained after a Government transfer ofBs.418 million, and a Bs.417 million adjustment for uncollectable accounts.The firm paid Bs.2,489.7 million on interest and other financial expenses in1988. its working capital increased by Bs.269.2 million in 1987, but declinedby Bs.158.7 million in 1988, mostly through an increase in accounts payable(see Table XI-16).
- 141 -
Table XI-19: SIDOR Tubes Plant Investment ProjetFinancing Plan (8.. Million), 1988-91
Item Domestic Foreign TotalComponent Component
Capital stock Increases (FIV)1/ 1,076.4 - 1,075.4Long-term loans 10,111.8 10,111.8Additional requirements 11,100.1 2,669.7 13,789.8
Capital stock (CVG)2/ 857.6 - 867.6Long-term loans - 700.0 700.0SIDOR's own resources 293.7 961.8 1,246.6
Other 10,448.9 1,017.9 11,466.8
TOTAL 12,175.6 12,781.6 24,957.0
1/ The FIV hias given SIDOR only 8s967.0 million as of end 1989.i/ This amount has been approved in a credit law, but not made available
to SIDOR as of end 1989.Source: SIDOR's Project Development Department.
11.103 As shown in Table XI-16, SIDOP had an accumulated deficit both in1987 and 1988, mostly the result of its external debt. According to CVG, asof end 1989, SIDOR's total external debt is US$1.5 billion. The Plan IVexpansion was to be financed with Central Government funds. Since theseresources were not available, foreign borrowing was used instead. SIDOR nowexpects the Central Government to take over the debt.
11.104 SIDOR's economic prospects for 1989 are not good. Because of itscomparatively low exports, the Bolivar depreciation and the export incentivesare not of significance to the firm. Moreover, while domestic pricesincreased sharply for most products after April 1 1989, those of SIDOR's mostimportant products remained controlled until July 1, and below opportunitycost as of end 1989. The firm expects to receive a Government transfer, topartially compensate for the financial implications of the domestic pricepractices imposed on it.
11.105 Recommendation. SIDOR's investment program should be evaluated inthe context of an overall restructuring program that will set the pace for asector development strategy. The program's objective would be to prepare thefirm to realize its relative comparative advantage in world markets. Therestructuring study should include: (a) cost estimates of SIDOR productionpricing inputs at opportunity cost; and under different assumptions onefficiency gains as a result of managerial, modernization, and expansionproposals. (b) Domestic demand projections of steel products based on fobexport price for exportables, and on international average plus transport costfor import-competing goods. (c) Proposed list of produrts that SIDOR caneconomically supplied domestically and in foreign markets. (d) Investmentpriorities based on those findings, optimal time schedule for the investmentprogram, and assessment of financing alternatives. (e) Implications for otherfirm in the sector like FERROMINERA and SIDOR's private sector competitors.

MAP SECTION
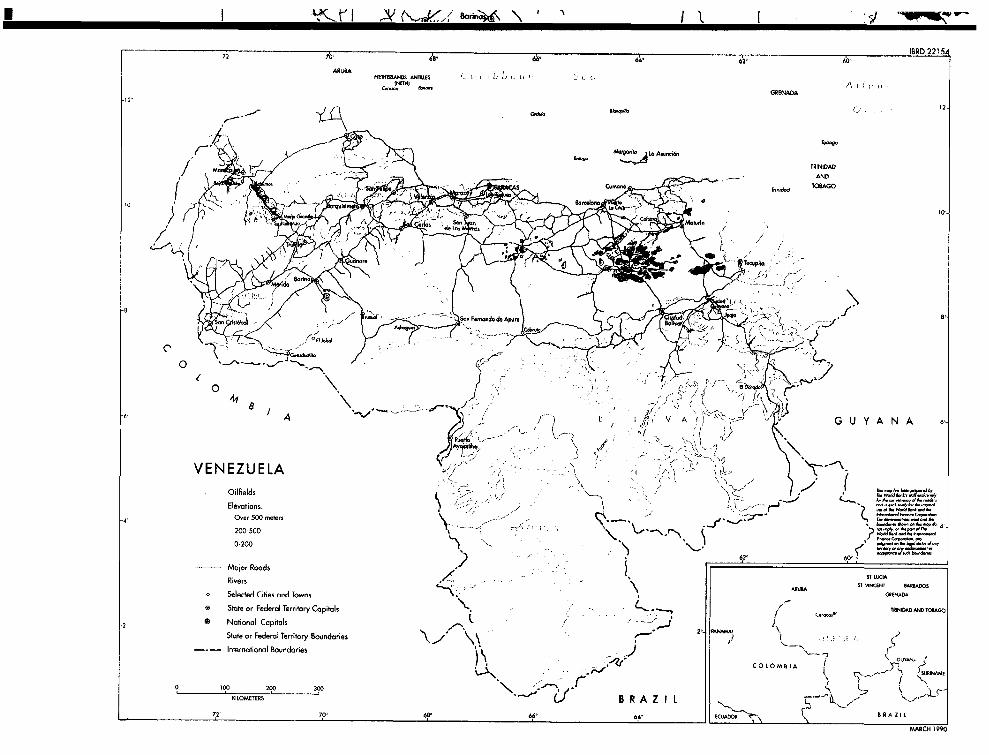
< | e r 0 > 8onnwj \ 1 ;b \~~~~~~~ i -
*2 74 6rs ee ,0 - IBRD 22154
ARVEA NWllRInSw= ANITILES I
12' 0N-.lF5I 4 GRENADA
-12' ~~~ , hd ,,, *1 12-
TRINIDAD
C~~~~~-.6 ~~~~~~TOBAGO
-10~~~~~~~~~~~~~~~~~~~~~~~~~~~~~~~~~~~~~~~~~~~~~~~~~~~~~~~~~~~~~~~~~~~~~~~~~~~~~~~~~~~~0
~~~~~~~~~~~~v ~ ~ ~ ~ ~ ~~~~~B
8~~~~ \1 A 5 '' - * E/24 /
v A G U Y A N A 6'
r, ,, '.,-' s'6 ,, -,'- L\
VENEZUELA -&Olfields S - * ,
Elevaihons. k -/ -- r s d
0.-.er 500 meters ' , --.. J -
200-500 ' ? ; \;
0-200 1 ,
-- MMior Roads - ST
Riuers / ST Co- B
o Selected Cities and Towns * BREN, DA
® State or Federal Territory Capitals -, TR NIDADADTOBAGO
-2 * National Capitals , 2^ j - )
State or Federal Territory Boundaries '\y \\ ,
-- - International Boundaries j' - J
COLOMBIA r0 I00 200 300
KILOMETERS ( B R A Z I L s._. 7'
72 70 6s `e0'4 \ B R A Z, I MARCH 1990