Embed Size (px)
Citation preview
1
Venture-Backed Capital
Investment in the Clean-Technology Industry
in the United States
Emanuel Shachmurove, Esquire And
Dr. Yochanan Shachmurove Department of Economics
The City College of the City University of New York, and Department of Economics
The University of Pennsylvania
Abstract The increased importance of environmental considerations and clean-tech technology cannot be
exaggerated. This paper studies the number of deals and real investment in the Clean-Technology industry
of the United States that are backed by venture capital. The effects of macroeconomic variables are
investigated. This paper further explores the effects of location and geography on investment and the
number of deals in this industry using a unique dataset for the years 1995 through 2009, quarter 1. The
results confirm the significance of geography in determining Clean-Technology investment and number of
deals. This paper is aimed at explaining investment in the clean-tech industry.
Key Words: Venture Capital; Clean-Technology Industry; Economic Geography; Location; Environmental
Economics; Industrial Sector.
JEL Classification: C12, D81, D92, E22, G12, G24, G3, M13, M21, O16, O3
C L M . E C O N O M Í A Nº 15 TEMAS ACTUALES DE ECONOMÍA Y MEDIO AMBIENTE
The research leading to this paper has been partially supported by the Ewing Marion Kauffman Foundation and the Shwager Fund at The City College of The City University of New York, and by a grant from PSC-CUNY. All remaining errors are ours. We would like to thank Tucker Wood of the University of Pennsylvania for his excellent research assistance. We also would like to thank Jose Maria Montero Lorenzo for his encouragements. All remaining errors are ours.

2
3
1. Introduction
The increased importance of environmental considerations and clean-tech
technology cannot be exaggerated. For example, The Time (2009) issues a special
annual report on what the magazine calls the Heroes of the Environment paying tribute to
the leaders, entrepreneurs, scientists and activists who are working to help the planet. It
seems that the idea of “Let’s go green” has become a metaphor for all the evil or good we
encounter in the world. The United Nations publishes a Special Climate Change Issue in
order to “protect succeeding generations…” (UN Chronicle, 2009).
Cristina Narbona Ruiz, the Spanish Ambassador to the OECD and the former
Minister of the Environment in Spain, sees the environment as the central issue, indeed
the pillar of human welfare. In the current economic system, she sees greed and
wastefulness rather than responsibility and prudence. She observes that social
inequalities and what she called the systematic destruction of the Earth’s ecosystem have
escalated. According to her, the lack of regulation and insufficient public oversight are the
main causes of the current and projected state of the environment.
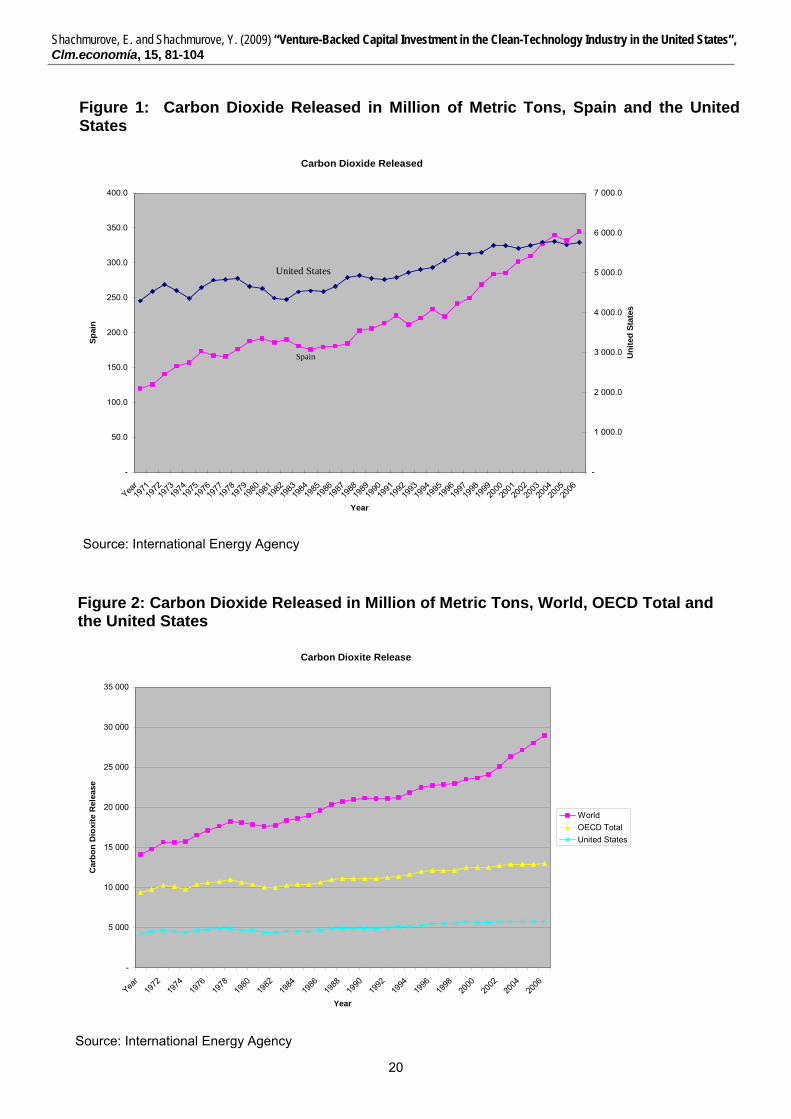
Figures 1 and 2 exhibit the trend in Carbon Dioxide released to the atmosphere in
million of metric tons from the year 1971 until 2007, the last year that data are available
through the International Energy Agency. Figure 1 presents the data for Spain and the
United States. Figure 2 shows the data for the world, OECD total, and the United States.
Ruiz (2009) cites the United Nations Intergovernmental Panel on Climate Change,
which estimates that by 2020 more than 400 million Africans will be severely affected by
global warming. She also reports that almost 80 percent of the World’s fishing grounds are
already exhausted or on the brink of depletion due to overfishing. Ruiz (2009) raises
awareness of the threats to public health from air, water and ground pollution, particularly in
the poorest countries and developing economies. She presents statistics that show that one
million people die each year in China solely from pollution-related causes (see also, the World
Bank, 2007). Scarce drinking water and inadequate sewage treatment is the number one
cause of disease in the world (see, for example, the United Nations Environmental Program,
2003 and the World Water Assessment Program, WWAP, 2007).
Shachmurove, E. and Shachmurove, Y. (2009) “Venture-Backed Capital Investment in the Clean-Technology Industry in the United States”, Clm.economía, 15, 81-104
4
This anticipation of favorable government policies and the resulting diversion of
resources to investment in clean-tech industry are echoed also in the more popular
media. For example, The Economist (Nov. 6, 2008) argues that governments will likely
support the Clean-tech sector, as related public policy provides stimulus for the economy,
while simultaneously addressing global climate change. The publication however warns
that recent decreases in oil prices and stalling credit markets have slowed aggregate
venture capital investment, including investment in the Clean-tech sector.
Additionally, The Economist (May 1, 2008) cites a lack of entrepreneurial talent and
stagnation in the development of new technologies as major impediments to stimulate Clean-
tech investment. However, the article predicts that the current recession will only result in a
short depression in Clean-tech investment. The Economist (Nov. 6, 2008) points out that
many orders of wind turbines and solar panels have been placed on hold until the national
economy recuperates. Hence, the drop in clean energy investment is anticipated to be largely
temporary. Furthermore, other countries that pollute heavily such as The United Arab
Emirates and China are investing hundreds of millions of dollars in environmentally friendly
projects. The need for clean technologies to replace processes based on limited fossil fuel
energy will still be present after the economic crisis subsides.
This paper studies venture capital investment activity in the Clean-tech sector of
the United States during the period 1995 to 2009, Quarter 1 (2009Q1). The Clean-tech
sector encompasses those firms that actively incorporate environmental concerns into
their products and services. The sector contains environmentally progressive companies
from many different traditional, functionality-based industries such as software, energy,
telecommunications, etc. The data are taken from The MoneyTree Survey, which is a
collaborative effort among PricewaterhouseCoopers, Thomson Venture Economics and
the National Venture Capital Association in order to keep track of investment activity
backed by venture capitalists in the clean-tech sector.
This paper examines the effects of various macroeconomic variables known to
affect investment in general and applies these measures to the study of investment in the
Clean-tech sector which is backed by venture capital. Accordingly, the venture capital
data are augmented by the Consumer Price Index (CPI), Nominal Gross Domestic
Product (NGDP), and the Real Gross Domestic Product (RGDP). As for U.S. interest
Shachmurove, E. and Shachmurove, Y. (2009) “Venture-Backed Capital Investment in the Clean-Technology Industry in the United States”, Clm.economía, 15, 81-104
5
rates the papers uses three, five and 10-year interest rates and the Federal Fund interest
rate. To consider expectations with regards to future prospects of the economy, the
Consumer Confidence Index is used.
A long-run perspective is taken in order to explore temporal dynamic movements
in Clean-tech venture capital investment. These trends in Clean-tech investment are
compared with trends in the aggregate investment in the venture capital market.
Additionally, an attempt is made to investigate the importance of the location of the clean-
tech investment. This line of research on the importance of geography is motivated by
the work of the 2008 Nobel Laureate, Paul Krugman (Krugman, 2009), among others.
The data used in this paper is further stratifies to venture capital investment in nineteen
regions in the United States.
Statistical as well as graphical methods are used to ascertain the dynamic nature
of the data. Pearson correlation coefficients and regression parameter estimates are
used to explore how different variables affect the Clean-tech venture capital market. Both
investments in dollars and number of deals are analyzed in order to provide a robust
check for the findings of this paper.
The statistical findings lead to several conclusions. First, large scale venture
capital investment and number of deals in the Clean-tech industry is relatively new and
has increased dramatically since the beginning of 2006. Thus, even in the period when
aggregate venture capital activity is decreasing, Clean-tech is undergoing an increase in
investment. Clean-tech investment is only weakly associated with aggregate national
venture capital investment and tends to follow its own independent path over the period.
Despite the recent economic crises, Clean-tech investment increased throughout 2008.
Only recently, in 2009Q1, has the current global recession caught up to the Clean-tech
industry, decreasing venture capital investment activity directed to the sector.
The remainder of the paper is organized into the following part. Part II presents a
brief literature review. Part III introduces the data. Part IV describes the empirical results.
Part V concludes .
Shachmurove, E. and Shachmurove, Y. (2009) “Venture-Backed Capital Investment in the Clean-Technology Industry in the United States”, Clm.economía, 15, 81-104
6
2. Literature Review
Since 2004, the Organization for Economic Development and Co-Operation
(OECD) has been regularly publishing its costs of inaction on environmental policy, see
for example the recent publications (OECD 2008A, 2008B). The World Bank has
adopted the methodology used by the OECD to more countries (see, World Bank, 2006,
2007). The call for increased use of cleaner technology is echoed in the U.K. Stern
Review (Stern, 2006, 2008, Nordhaus, 2007a, 2007b, and Weitzman, 2007). The Stern
team, as they are famously called, is based at the U.K. Department of Energy and
Climate Change.
Chichilnisky and Sheeran (2009) vividly detail the path to Kyoto, Copenhagen and
beyond. Chichilnisky (2009) and Chichilnisky and Eisenberger (2009a, 2009b) offer
some financial innovations to potentially end the impasse between industrial and
developing nations in implementing the Kyoto Protocol and promoting a Copenhagen
solution. World leaders are scheduled to meet in Copenhagen in December 2009 to
carve out a new global pact to replace the Kyoto Protocol. The United States is the only
major developed economy not bound by mandatory caps. At the time of this writing it
seems the meeting is unlikely to yield a binding deal.
Stiglitz, Sen and Fittoussi (2009) calls for a paradigm shift which will recognize the
right to dignified life for all the citizens and future generations of the planet. In this
respect their ongoing project suggests a new measurement of economic performance
and progress which takes into account quality of life, sustainable development and the
environment in measuring happiness of a country. In this context, see also United
Nations (2003, 2005) and the report by UNECE/OECD/Eurostat (2008). For an earlier
literature see, among others, Weitzman, (1976), Cobb and Daly (1989), Cobb and Cobb
(1994), Desai (1994) , Dasgupta, (2001), Arrow, Dasgupta, and Mäler (2003), Arrow,
Dasgupta, Goulder, Daily, Ehrlich, Heal, Levin, Mäler, Schneider, Starrett, and Walker,
(2004), Abraham and Mackie (2005), and Arrow, Dasgupta, Goulder, Mumford and
Oleson (2008).
The analysis of the Clean-tech industry is relatively new. Burtis (2004) examines a
cluster of Clean-tech firms in California, showing that both venture capital investment and
Shachmurove, E. and Shachmurove, Y. (2009) “Venture-Backed Capital Investment in the Clean-Technology Industry in the United States”, Clm.economía, 15, 81-104
7
government policy are the largest determinants in determining whether the industry
succeeds or fails. He argues that one region of the United States will likely become a
Clean-tech focal point since venture capital investment tends to be funneled into
geographical hubs that become the leaders in their relative industrial sectors. Stack
(2006) notes that energy prices, entrepreneurial talent, and technological advances are
key factors in the growth of the Clean-tech industry. He argued that the rising public
discussions about trends in global warming and depletion of natural resources are
promoting venture capitalists to invest in Clean-tech firms expecting more favorable and
supportive government policies toward a cleaner environment.
The emergence of the new economic geography can be attributed to the
pioneering works of Krugman (Krugman, 1991a, 1991b, 1998) Fujita and Krugman
(2004), and Venables (1996, 1998, 2003). Krugman (1991a) examines the uneven
economic development of different regions, emphasizing the importance of economic
geography in explaining divergent regional development. Krugman (1991b) shows that a
country can endogenously become differentiated into an industrialized “core” surrounded
by an agricultural “periphery.” Krugman (1998) discusses the emergence of the 'new
economic geography,' a new area of research that solves some areas of incongruence in
economic theory. It differs from traditional work in economic geography by incorporating
a modeling strategy that uses the same technical and mathematical tools found in the
'new trade' and 'new growth' theories.
In the context of venture capital literature, Murphy (1956) provides the pioneering
study, based on one hundred start-up firms. Others have also studied the importance of
industry choice in achieving start up success. Shachmurove A. and Shachmurove Y.
(2004) explore annualized and cumulative returns on venture-backed public companies
categorized by industry. Annual and cumulative returns of publicly traded firms who were
backed by venture capital are studied in series of papers by Shachmurove, Y. (2001),
and Shachmurove, A. and Shachmurove, Y (2004). Shachmurove, Y. (2006) examines
venture capital investment activity in the United States for the years 1996 – 2005.
Shachmurove (2007) relates issues in international trade to entrepreneurship, innovation,
and the growth mechanism of the free-market economies.
Shachmurove, E. and Shachmurove, Y. (2009) “Venture-Backed Capital Investment in the Clean-Technology Industry in the United States”, Clm.economía, 15, 81-104
8
3. Data The data on venture capital investment activity in the United States are from The
MoneyTree Survey. The survey is a quarterly study of venture capital investment activity
in the United States (U.S.), which measures cash for equity investments by the
professional venture capital community in private emerging U.S. companies. The survey
is collaboration between PricewaterhouseCoopers and the National Venture Capital
Association based upon data from Thomson Reuters. The survey is the only industry-
endorsed research of its kind. The MoneyTree Report is conceived to be the definitive
source of information on emerging companies that receive financing and the venture
capital firms that provide it. The study is considered a staple of the financial community,
entrepreneurs, government policymakers and the business press worldwide.
The survey includes the investment activity of professional venture capital firms
with or without a U.S. office, Small Business Investment Companies (SBICs), venture
arms of corporations, institutions, investment banks and similar entities whose primary
activity is financial investing. In cases where there are other participants such as angels,
corporations, and governments in a qualified and verified financing round, the entire
amount of the round is included. Qualifying transactions include cash investments by
these entities either directly or by participation in various forms of private placement. All
recipient companies are private, and may have been newly-created or spun-out of
existing companies.
The survey excludes debt, buyouts, recapitalizations, secondary purchases, Initial
Public offerings (IPOs), investments in public companies such as PIPES (private
investments in public entities), investments for which the proceeds are primarily intended
for acquisition such as roll-ups, change of ownership, and other forms of private equity
that do not involve cash such as services-in-kind and venture leasing.
The macroeconomic data include the Consumer Price Index (CPI), the Producer
Price Index (PPI), Nominal Gross Domestic Product (NGDP), and the Real Gross
Domestic Product (RGDP). The data source is the U.S. Bureau of Economic Analysis.
The three, five and 10-year interest rates and the Federal Fund interest rate are from the
Federal Reserve Statistical Release. The Consumer Confidence Index is published
Shachmurove, E. and Shachmurove, Y. (2009) “Venture-Backed Capital Investment in the Clean-Technology Industry in the United States”, Clm.economía, 15, 81-104
9
monthly by the Conference Board. The Index is constructed using the Consumer
Confidence Survey which is based on a representative sample of 5,000 U.S. households.
All the data are from 1995 to 2009, Quarter 1.
4. Empirical Results
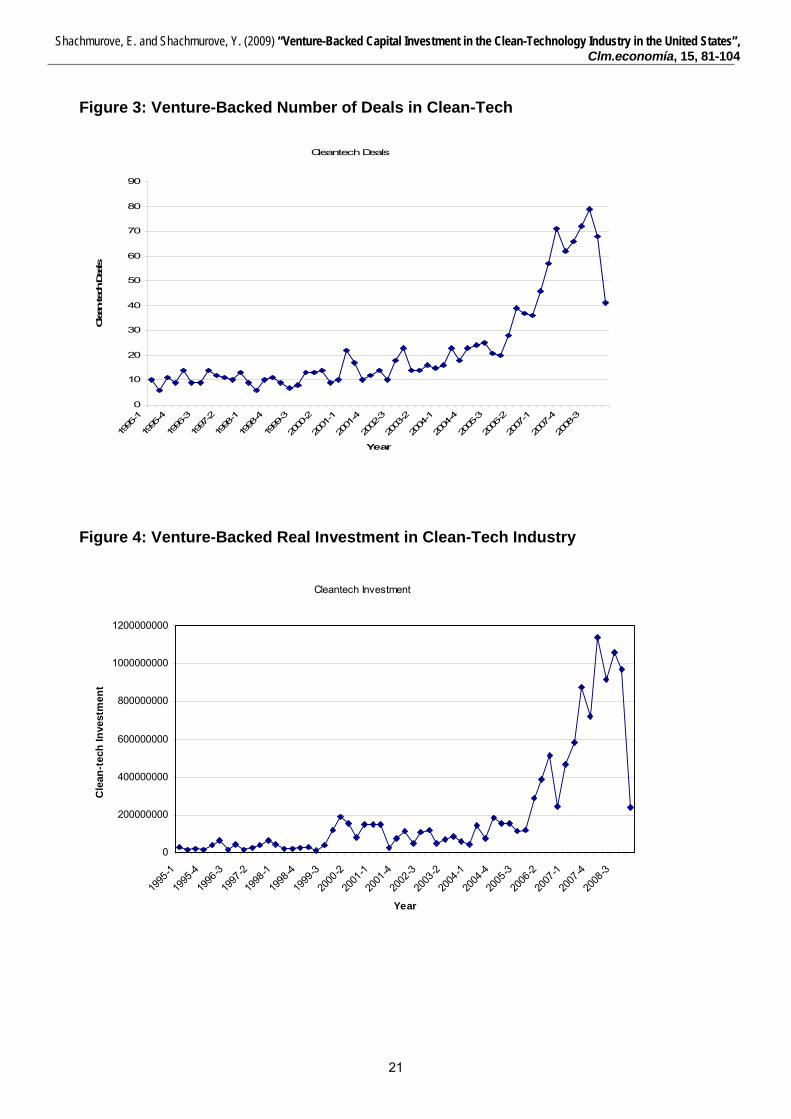
Figure 3 presents the data for the number of deals that are backed by venture
capital in the Clean-Tech industry for the period of the study, namely from 1995 until
2009, Quarter 1. Figure 4 shows real investment backed by venture capital in the Clean-
Tech Industry for the same period. As shown in the two figures, Clean-tech deals and
investment activity were roughly stable from 1995 to 2005 and then experienced a period
of rapid growth from 2005 to 2008. This increase in number of deals and investment are
unique since it took place partly during a recession. It seems that investment in Clean-
tech is more isolated from downturns in the general economy. However, Clean-tech
investment did fall in 2009Q1, indicating that the current global economic crisis may have
finally caught up to Clean-tech investment.
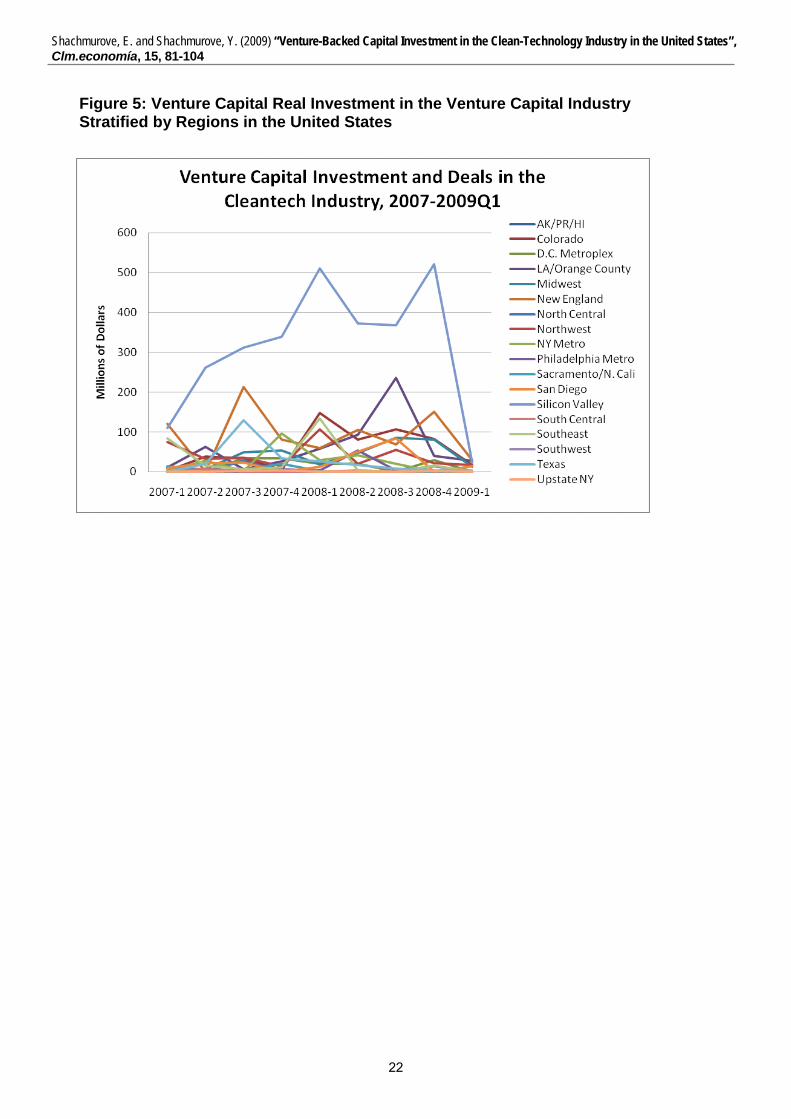
Figure 5 displays Clean-tech investment stratified by region from 2007 to 2009Q1.
Regional data for Clean-tech investment is not available before 2007. Nevertheless, the
Figure clearly shows that Clean-tech investment varies considerably by region, indicating
that region is a significant factor in determining Clean-tech investment. Silicon Valley
dominates every other region in Clean-tech investment over both the boom and bust
periods.
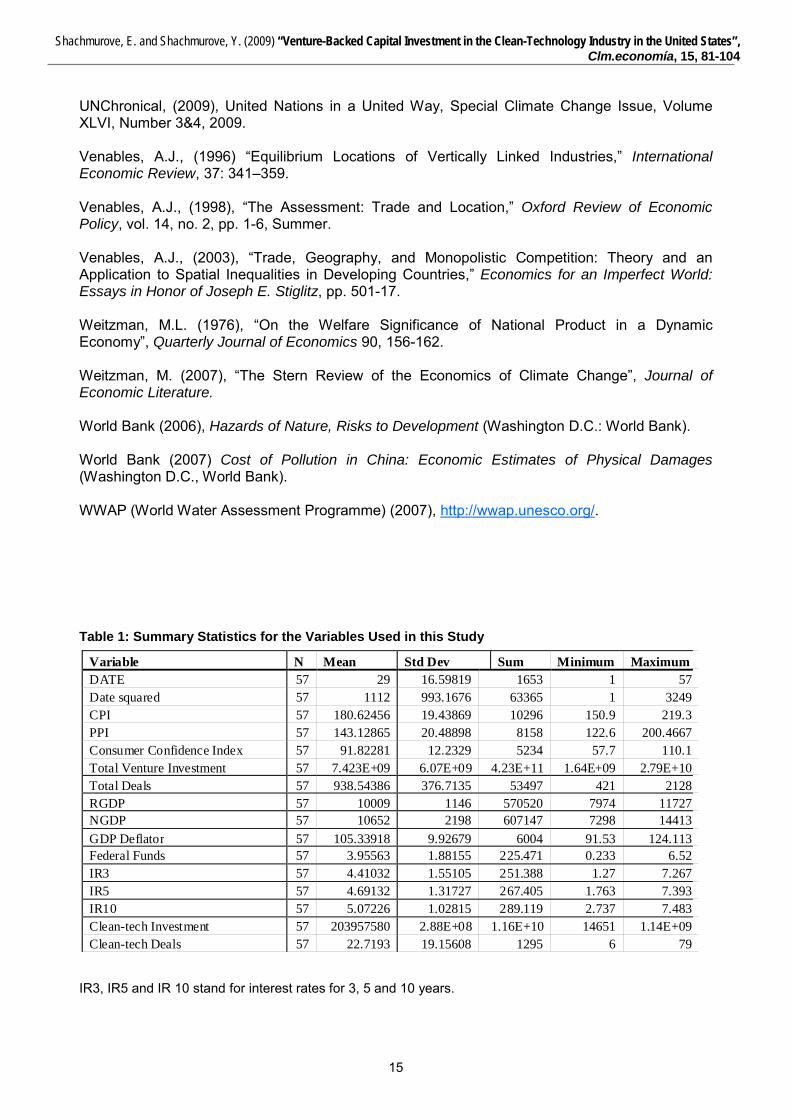
Table 1 presents summary statistics for the variables used in this study. Note that
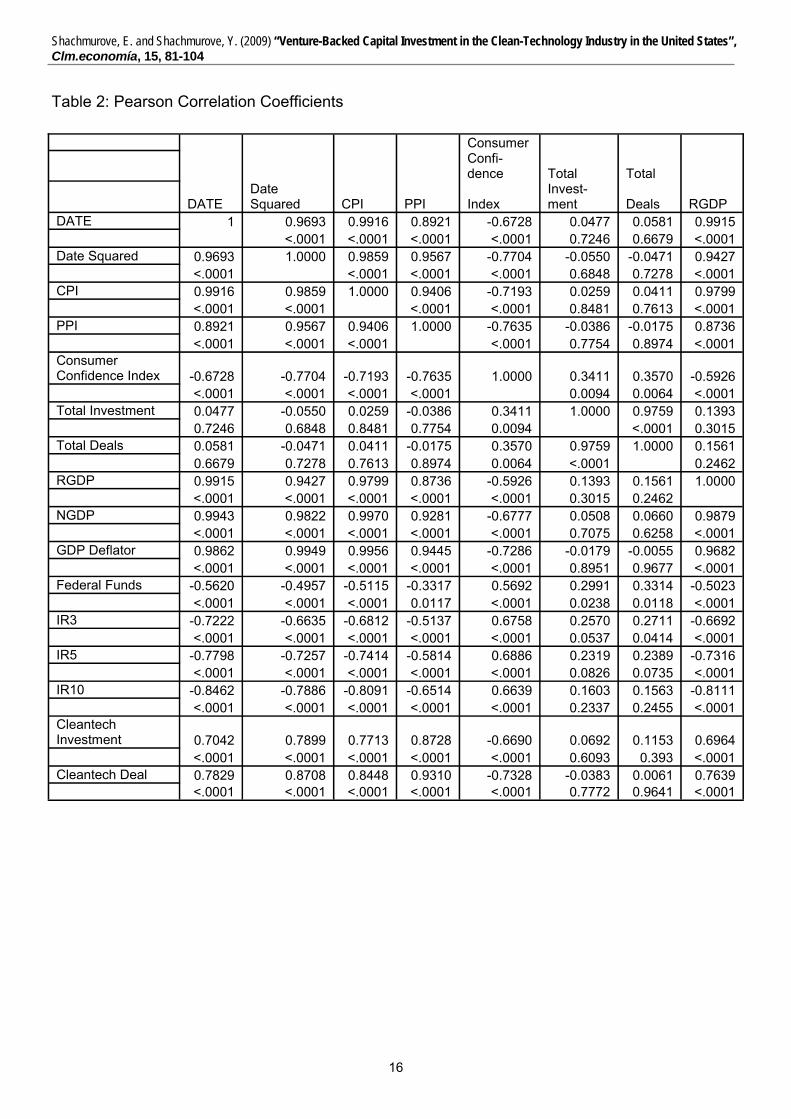
IR3, IR5 and IR 10 stand for interest rates for 3, 5 and 10 years. Table 2 presents the
Pearson Coefficients and their corresponding significant values for the variables used in
the study. Clean-tech investment and number of deals of such investment are highly
correlated, with a Pearson coefficient of 0.96. All interest rates are significantly
negatively correlated with both the Consumer Price Index and with the Producer Price
Index. It is interesting to note that whereas the Consumer Confidence Index is positively
correlated with ventured backed total investment and total deals, it is negatively
correlated with clean-tech investment and clean tech deals. As one may expect, real
Shachmurove, E. and Shachmurove, Y. (2009) “Venture-Backed Capital Investment in the Clean-Technology Industry in the United States”, Clm.economía, 15, 81-104
10
GDP is positively correlated with total investment and Clean-tech investment. However,
GDP is more strongly correlated with Clean-tech investment than U.S. aggregate venture
capital investment. Furthermore, Clean-tech investment and number of deals are
negatively correlated with all the interest rates in the study, i.e., the Federal Funds, the
three, five and ten-year interest rates. This is interesting because aggregate venture
capital investment is positively correlated with the 3-year interest rate, indicating that total
investment and Clean-tech investment have fundamental differences over the period
1995 to 2009Q1.
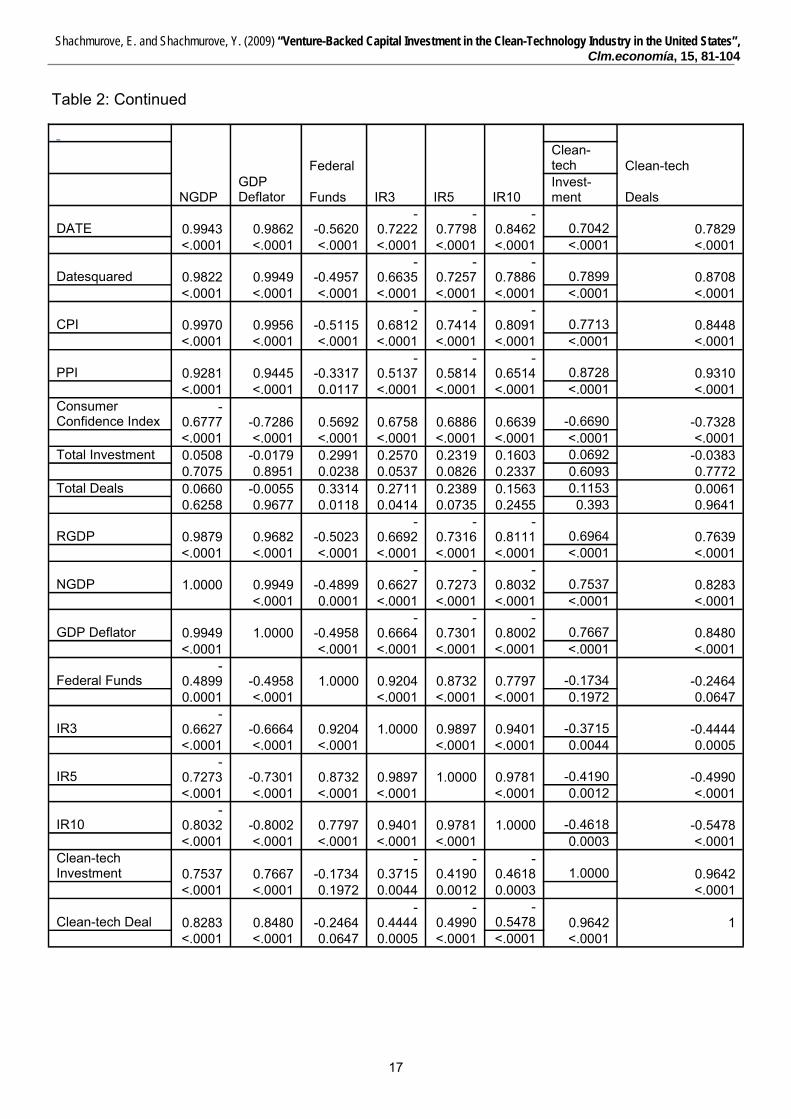
Aggregate venture capital and Clean-tech investments have a small correlation
(0.07), indicating that there is low association between the two variables. In other words,
movements in aggregate venture capital investment do not have a large effect on Clean-
tech investment. Total investment and Clean-techs deals have a small negative Pearson
coefficient (-0.04), strengthening the conclusion that Clean-tech investment has little
association with national aggregate investment over the period.
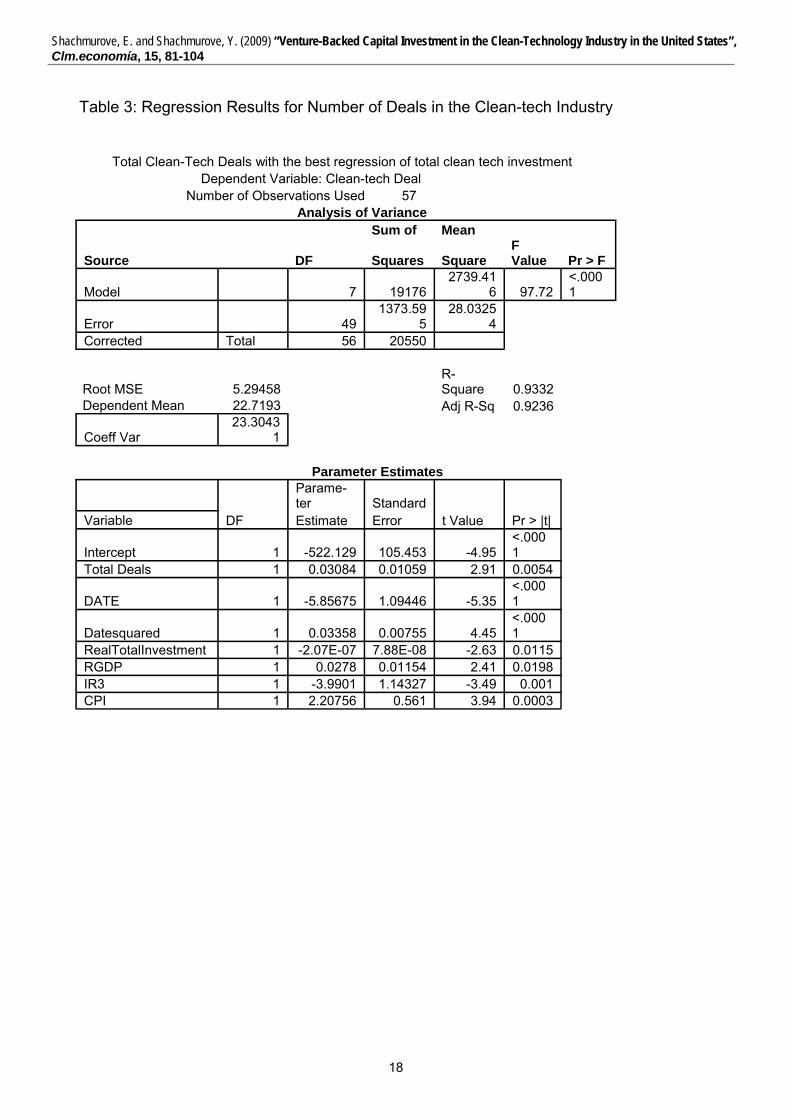
Table 3 presents the final regression results for the number of deals in the Clean-
tech industry in the United States during the period of this study, 1995 through 2009,
Quarter 1. The independent variables include in addition to a constant, date and date
squared, total ventured-backed deals, real total investment , real gross domestic product,
the three-year interest rate, and the Consumer Price index. The adjusted R2 is 0.92. All
variables are significant with below 0.02 levels.
As expected, aggregate venture-backed deals positively affects the number of
deals in the clean-tech industry. As may be expected, real GDP has a positive parameter
coefficient. Despite the recent rise in Clean-tech investment during the recession year of
2008, number of deals in the Clean-tech industry is still positively associated with GDP
over the period. The 3-year interest rate has a negative parameter coefficient. The date-
trend variable has a negative coefficient, while the date-trend squared has a positive
coefficient. The parabolic nature of the number of deals in the clean-tech industry could
cause a positive association with the square of the date variable; since number of deals
in the Clean-tech industry is better estimated with a quadratic time trend than with only
the trend variable present (see Figures 3 and 4). The rapid increase in the number of
Clean-tech deals from 2006 to 2008 broke its previous approximately linear trend. The
Shachmurove, E. and Shachmurove, Y. (2009) “Venture-Backed Capital Investment in the Clean-Technology Industry in the United States”, Clm.economía, 15, 81-104
11
regular date variable is strictly linear, and thus may be a weaker determinant of number
of deals in the Clean-tech industry. To strengthen this conclusion, the residual plot of the
date (available upon request) shows larger residual values near the end of the period
than does the trend-squared residual plot.
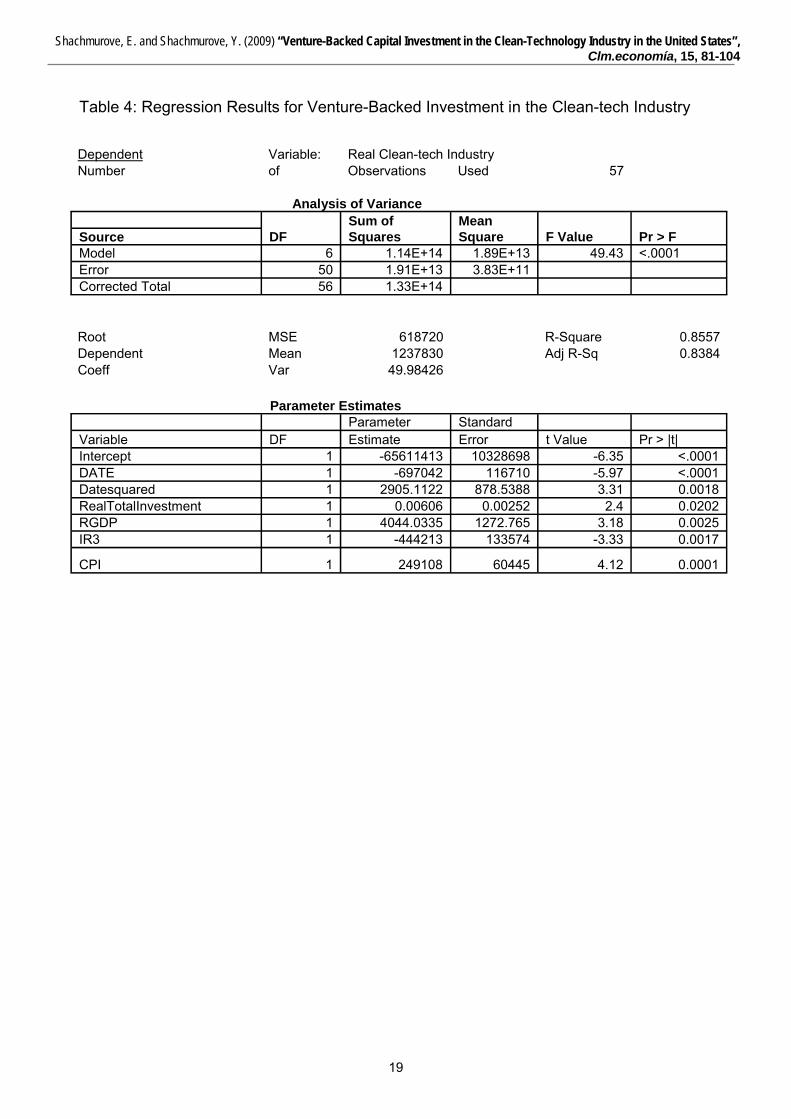
Table 4 presents the regression results for real Clean-tech investment which is
backed by venture capital for the period 1995 through 2009, Quarter 1. The variables
found to affect this variable are, in addition to a constant, date and date squared, are real
total investment by venture backed capital, real GDP, the three-year interest rate and the
CPI. All variables are statistically significant at or below 0.02. It is interesting to note that
once one uses regression analysis, real total investment backed by venture capital is
positively affecting investment in real clean tech industry. The same is true with real
Gross Domestic Product, although one notes that the coefficient of this variable is huge
relative to the former variable. As one may expect from the previous result with regards
to the three-year interest rate, its effect is negative on venture backed real investment in
the clean-tech industry. Also, the positive affect of the consumer price index is interesting
because it points out the phenomenon that an increase in the CPI attracts more
investment. It represents expectations about future favorable condition in the economy
above and beyond the positive affect of current real GDP.
5. Conclusions
The increased importance of environmental considerations and clean-tech
technology cannot be exaggerated. This paper studies the number of deals and real
investment in the Clean-Technology industry of the United States that are backed by
venture capital. The effects of macroeconomics variables are investigated. The dataset
for this part spans from 1995 until 2009, Quarter 1. This paper further explores the
effects of location and geography on investment and number of deals in this industry
using a unique dataset for the years 2007 through 2009, Quarter 1. The results confirm
the significance of geography in determining Clean-Technology investment and number
of deals.
The number of deals in the Clean-tech industry is significantly affected by total
ventured-backed deals, real total investment, real gross domestic product, the three-year
Shachmurove, E. and Shachmurove, Y. (2009) “Venture-Backed Capital Investment in the Clean-Technology Industry in the United States”, Clm.economía, 15, 81-104
12
interest rate, and the Consumer Price index. Real investment in the Clean-tech industry
is affected by real total investment by venture backed capital, real GDP, the three-year
interest rate and the CPI.
Future research will be directed in obtaining more comprehensive regional data for
the clean-tech industry. This paper is taking the first few steps in the direction of
explaining investment in the clean-tech industry.
References Abraham K. and C. Mackie, eds. (2005), beyond the Market Designing Nonmarket Accounts for the United States, National Academy of Sciences, Washington D.C. Arrow, K.J., Dasgupta, P. And Mäler, K.G. (2003) “Evaluating projects and assessing sustainable development in imperfect economies”, Environmental and Resources Economics, 26: 647-685. Arrow, K.J., Dasgupta, P., Goulder, L., Daily, G., Ehrlich, P., Heal, G., Levin, S., Mäler,K.G., Schneider, S., Starrett, D . and Walker, B.(2004) “Are We Consuming Too Much?”, The Journal of Economic Perspectives, 18 (3): 147-172 Arrow, K.J., Dasgupta, P., Goulder, L.H., Mumford, K. and Oleson, K. (2008) “China, the U.S., and Sustainability: Perspectives Based on Comprehensive Wealth”, Working Paper No. 313, Stanford Center for International Development, Stanford University. Behrens, K., (2005), “Market Size and Industry Location: Traded vs. Non-traded Goods,” Journal of Urban Economics, vol. 58, no. 1, pp. 24-44, July. Burtis, P. (2006), “Creating Clean-tech Clusters: 2006 Update,” Environmental Entrepreneurs. Chichilnisky, Graciela (2009), “Financial Innovations and Carbon Markets,” UNChronicle, Volume XLVI, Number 3&4, pp. 63-69. Chichilnisky, Graciela and Eisenberger, Peter, (2009a), “How Air Capture Could Help to Promote a Copenhagen Solution,” Nature, Vol. 495, 25 June 2009. Chichilnisky, Graciela and Eisenberger, Peter, (2009b), “Energy Security, Economic Development and Global Warming: Addressing Short and Long Term Challenges,” International Journal of Green Economics. Chichilnisky, Graciela and Sheeran, A. Kristen, (2009), Saving Kyoto: An Insider Guide to How it Works, Why it Matters and What it Means for the Future, New Holland Publishers (UK) Ltd. Clean Tech in China. The Economist July 19, 2007. Cobb, J. and Daly, H. (1989) For the Common Good, Redirecting the Economy Toward Community, the Environment and a Sustainable Future, Boston, Beacon Press.
Shachmurove, E. and Shachmurove, Y. (2009) “Venture-Backed Capital Investment in the Clean-Technology Industry in the United States”, Clm.economía, 15, 81-104
13
Cobb, C.W. and Cobb, J. (1994) The Green National Product, Lanham, University Press of America. Dasgupta, P. (2001) “Valuing Objects and Evaluating Policies in Imperfect Economies”, The Economic Journal, 111: C1-C29. Desai, M. (1994) “Greening the HDI?” in The New Economic Foundation (Eds) Accounting for change, MacGillivray. Fujita M., and Krugman P., (2004), “The New Economic Geography: Past, Present and the Future,” Papers in Regional Science, vol. 83, no. 1, pp. 139-64, January. Gathering Clouds. The Economist Nov. 6, 2008. Krugman P. (1999), Geography and Trade. Gaston Eyskens Lecture Series, Cambridge, Mass. and London: MIT Press, and Louvain, Belgium: Louvain University Press, pp. xi, 142. Krugman, Paul, (1991), “Increasing Returns and Economic Geography,” Journal of Political Economy, vol. 99, no. 3, pp. 483-99, June. Krugman, Paul, (1995), “Innovation and Agglomeration: Two Parables Suggested by City-Size Distributions,” Japan and the World Economy, vol. 7, no. 4, pp. 371-90, November. Krugman, Paul, (1998), “What's New about the New Economic Geography?” Oxford Review of Economic Policy, vol. 14, no. 2, pp. 7-17, Summer. Krugman, Paul, (2009), "The Increasing Returns Revolution in Trade and Geography," American Economic Review, vol. 99, no. 3, June, pp. 561-71 Masdar Plan. The Economist Dec. 4, 2008. Midelfart, K.H., Overman, H., Venables, A.J., (2003), “Monetary Union and the Economic Geography of Europe,” Journal of Common Market Studies, vol. 41, no. 5, pp. 847-68, December. Murphy, T. (1956), A Business of Your Own, New York: McGraw-Hill. Nordhaus, W.D. (2007A), “The Challenge of Global Warming: Economic Models and Environmental Policy” Yale University, Department of Economics Discussion Paper (http://nordhaus.econ.yale.edu/dice_mss_072407_all.pdf). Nordhaus,W.J. (2007B) “The Stern Review of the Economics of Climate Change”, Journal of Economic Literature. OECD, Organization for Economic Development and Co-Operation (2008), OECD Key Environmental Indicators. OECD, Organization for Economic Development and Co-Operation (2008), “COSTS OF INACTION ON ENVIRONMENTAL POLICY CHALLENGES: SUMMARY REPORT [ENV/EPOC(2007)16/FINAL] Meeting of the Environment Policy Committee (EPOC) at Ministerial Level Environment and Global Competitiveness 28-29 April. OECD (2008), OECD Environmental Outlook to 2030, OECD, Paris.
Shachmurove, E. and Shachmurove, Y. (2009) “Venture-Backed Capital Investment in the Clean-Technology Industry in the United States”, Clm.economía, 15, 81-104
14
Ruiz, Narbona Cristina, “A Stronger, Cleaner and Fairer Economy: Towards a New Paradigm,” OECD Observer, No 273, June 2009, pp. 30-31. Seeking New Entrepreneurs. The Economist May 1, 2008. Shachmurove, Emanuel and Shachmuorove, Yochanan (2009), “The Rise of Clean-technology Venture Capital Market in the United States, 1995-2008,” Polish Journal of Environmental Studies, Volume 18 (forthcoming) Shachmurove, Yochanan (2007), “Innovation and Trade: Introduction and Comments,” in Eytan Sheshinski, Robert J. Strom and William J. Baumol (eds.), Entrepreneurship, Innovation, and the Growth Mechanism of the Free-Enterprise Economies, Princeton University Press, pages 247 -260. Shachmurove, Yochanan (2006), “An Excursion into the Venture Capital Industry Stratified by Locations and Industries 1996-2005,” The Journal of Entrepreneurial Finance and Business Ventures, vol. 11, no. 3, pp. 79 – 104, December. Shachmurove, Yochanan (2001), “Annualized Returns of Venture-Backed Public Companies Categorized by Stage of Financing,” Journal of Entrepreneurial Finance, Volume 6, Number 1, Pages 44 - 58. Shachmurove, Amir and Shachmurove, Yochanan, (2004), “Annualized and Cumulative Returns on Venture-Backed Public Companies Categorized by Industry,” The Journal of Entrepreneurial Finance and Business Ventures, Volume 9, Issue Number 3, December, pp. 41-60. Stack, J., (2006), “Cleantech Venture Capital: How Public Policy Has Stimulated Private Investment,” Environmental Entrepreneurs, May. Stern, N. (2006) “The Economics of Climate Change: The Stern Review”, H.M. Treasury, U.K. Stern, N. (2008) “The economics of climate change”, American Economic review, Papers and Proceedings, 2008. Stiglitz, Joseph E., Sen, Amartya, and Fitoussi, Jean-Paul (2009), “Report by the Commission on the Measurement of Economic Performance and Social Progress,” available at www.stiglitz-sen-fitoussi.fr.
Time (2009), “Special Report: Heroes of the Environment,’” October 5. UNEP (UN Environmental Programme) (2003), “Groundwater and its Susceptibility to Degradation: A Global Assessment of the Problem and Options for Management” http://www.unep.org/DEWA/water/GroundWater/groundwater_report.asp) USEPA (1999), “The Benefits and Costs of the Clean Air Act 1990 to 2010”, EPA Report to Congress, Report EPA-410-R-99-001, November. UNECE/OECD/Eurostat (2008) “Report on measuring sustainable development: statistics for sustainable development, commonalities between current practice and theory”, Working Paper ECE/CES/2008/29. United Nations (2003), Handbook of National Accounting: Integrated Environmental and Economic Accounting 2003. United Nations (2005) Living Beyond Our Means: Natural Assets and Human Well-being.
Shachmurove, E. and Shachmurove, Y. (2009) “Venture-Backed Capital Investment in the Clean-Technology Industry in the United States”, Clm.economía, 15, 81-104
15
UNChronical, (2009), United Nations in a United Way, Special Climate Change Issue, Volume XLVI, Number 3&4, 2009. Venables, A.J., (1996) “Equilibrium Locations of Vertically Linked Industries,” International Economic Review, 37: 341–359. Venables, A.J., (1998), “The Assessment: Trade and Location,” Oxford Review of Economic Policy, vol. 14, no. 2, pp. 1-6, Summer. Venables, A.J., (2003), “Trade, Geography, and Monopolistic Competition: Theory and an Application to Spatial Inequalities in Developing Countries,” Economics for an Imperfect World: Essays in Honor of Joseph E. Stiglitz, pp. 501-17. Weitzman, M.L. (1976), “On the Welfare Significance of National Product in a Dynamic Economy”, Quarterly Journal of Economics 90, 156-162. Weitzman, M. (2007), “The Stern Review of the Economics of Climate Change”, Journal of Economic Literature. World Bank (2006), Hazards of Nature, Risks to Development (Washington D.C.: World Bank). World Bank (2007) Cost of Pollution in China: Economic Estimates of Physical Damages (Washington D.C., World Bank). WWAP (World Water Assessment Programme) (2007), http://wwap.unesco.org/. Table 1: Summary Statistics for the Variables Used in this Study
IR3, IR5 and IR 10 stand for interest rates for 3, 5 and 10 years.
Shachmurove, E. and Shachmurove, Y. (2009) “Venture-Backed Capital Investment in the Clean-Technology Industry in the United States”, Clm.economía, 15, 81-104
Variable N Mean Std Dev Sum Minimum MaximumDATE 57 29 16.59819 1653 1 57Date squared 57 1112 993.1676 63365 1 3249CPI 57 180.62456 19.43869 10296 150.9 219.3PPI 57 143.12865 20.48898 8158 122.6 200.4667Consumer Confidence Index 57 91.82281 12.2329 5234 57.7 110.1Total Venture Investment 57 7.423E+09 6.07E+09 4.23E+11 1.64E+09 2.79E+10Total Deals 57 938.54386 376.7135 53497 421 2128RGDP 57 10009 1146 570520 7974 11727NGDP 57 10652 2198 607147 7298 14413GDP Deflator 57 105.33918 9.92679 6004 91.53 124.113Federal Funds 57 3.95563 1.88155 225.471 0.233 6.52IR3 57 4.41032 1.55105 251.388 1.27 7.267IR5 57 4.69132 1.31727 267.405 1.763 7.393IR10 57 5.07226 1.02815 289.119 2.737 7.483Clean-tech Investment 57 203957580 2.88E+08 1.16E+10 14651 1.14E+09Clean-tech Deals 57 22.7193 19.15608 1295 6 79
16
Shachmurove, E. and Shachmurove, Y. (2009) “Venture-Backed Capital Investment in the Clean-Technology Industry in the United States”, Clm.economía, 15, 81-104
Table 2: Pearson Correlation Coefficients
Consumer
Confi-dence Total Total
DATE Date Squared CPI PPI Index
Invest-ment Deals RGDP
DATE 1 0.9693 0.9916 0.8921 -0.6728 0.0477 0.0581 0.9915 <.0001 <.0001 <.0001 <.0001 0.7246 0.6679 <.0001 Date Squared 0.9693 1.0000 0.9859 0.9567 -0.7704 -0.0550 -0.0471 0.9427 <.0001 <.0001 <.0001 <.0001 0.6848 0.7278 <.0001 CPI 0.9916 0.9859 1.0000 0.9406 -0.7193 0.0259 0.0411 0.9799 <.0001 <.0001 <.0001 <.0001 0.8481 0.7613 <.0001 PPI 0.8921 0.9567 0.9406 1.0000 -0.7635 -0.0386 -0.0175 0.8736 <.0001 <.0001 <.0001 <.0001 0.7754 0.8974 <.0001 Consumer Confidence Index -0.6728 -0.7704 -0.7193 -0.7635 1.0000 0.3411 0.3570 -0.5926 <.0001 <.0001 <.0001 <.0001 0.0094 0.0064 <.0001 Total Investment 0.0477 -0.0550 0.0259 -0.0386 0.3411 1.0000 0.9759 0.1393 0.7246 0.6848 0.8481 0.7754 0.0094 <.0001 0.3015 Total Deals 0.0581 -0.0471 0.0411 -0.0175 0.3570 0.9759 1.0000 0.1561 0.6679 0.7278 0.7613 0.8974 0.0064 <.0001 0.2462 RGDP 0.9915 0.9427 0.9799 0.8736 -0.5926 0.1393 0.1561 1.0000 <.0001 <.0001 <.0001 <.0001 <.0001 0.3015 0.2462 NGDP 0.9943 0.9822 0.9970 0.9281 -0.6777 0.0508 0.0660 0.9879 <.0001 <.0001 <.0001 <.0001 <.0001 0.7075 0.6258 <.0001 GDP Deflator 0.9862 0.9949 0.9956 0.9445 -0.7286 -0.0179 -0.0055 0.9682 <.0001 <.0001 <.0001 <.0001 <.0001 0.8951 0.9677 <.0001 Federal Funds -0.5620 -0.4957 -0.5115 -0.3317 0.5692 0.2991 0.3314 -0.5023 <.0001 <.0001 <.0001 0.0117 <.0001 0.0238 0.0118 <.0001 IR3 -0.7222 -0.6635 -0.6812 -0.5137 0.6758 0.2570 0.2711 -0.6692 <.0001 <.0001 <.0001 <.0001 <.0001 0.0537 0.0414 <.0001 IR5 -0.7798 -0.7257 -0.7414 -0.5814 0.6886 0.2319 0.2389 -0.7316 <.0001 <.0001 <.0001 <.0001 <.0001 0.0826 0.0735 <.0001 IR10 -0.8462 -0.7886 -0.8091 -0.6514 0.6639 0.1603 0.1563 -0.8111 <.0001 <.0001 <.0001 <.0001 <.0001 0.2337 0.2455 <.0001 Cleantech Investment 0.7042 0.7899 0.7713 0.8728 -0.6690 0.0692 0.1153 0.6964 <.0001 <.0001 <.0001 <.0001 <.0001 0.6093 0.393 <.0001 Cleantech Deal 0.7829 0.8708 0.8448 0.9310 -0.7328 -0.0383 0.0061 0.7639 <.0001 <.0001 <.0001 <.0001 <.0001 0.7772 0.9641 <.0001
17
Shachmurove, E. and Shachmurove, Y. (2009) “Venture-Backed Capital Investment in the Clean-Technology Industry in the United States”,
Clm.economía, 15, 81-104
Table 2: Continued
Federal Clean-tech Clean-tech
NGDP GDP Deflator Funds IR3 IR5 IR10
Invest-ment Deals
DATE 0.9943 0.9862 -0.5620 -
0.7222 -
0.7798 -
0.8462 0.7042 0.7829 <.0001 <.0001 <.0001 <.0001 <.0001 <.0001 <.0001 <.0001
Datesquared 0.9822 0.9949 -0.4957 -
0.6635 -
0.7257 -
0.7886 0.7899 0.8708 <.0001 <.0001 <.0001 <.0001 <.0001 <.0001 <.0001 <.0001
CPI 0.9970 0.9956 -0.5115 -
0.6812 -
0.7414 -
0.8091 0.7713 0.8448 <.0001 <.0001 <.0001 <.0001 <.0001 <.0001 <.0001 <.0001
PPI 0.9281 0.9445 -0.3317 -
0.5137 -
0.5814 -
0.6514 0.8728 0.9310 <.0001 <.0001 0.0117 <.0001 <.0001 <.0001 <.0001 <.0001 Consumer Confidence Index
-0.6777 -0.7286 0.5692 0.6758 0.6886 0.6639 -0.6690 -0.7328
<.0001 <.0001 <.0001 <.0001 <.0001 <.0001 <.0001 <.0001 Total Investment 0.0508 -0.0179 0.2991 0.2570 0.2319 0.1603 0.0692 -0.0383 0.7075 0.8951 0.0238 0.0537 0.0826 0.2337 0.6093 0.7772 Total Deals 0.0660 -0.0055 0.3314 0.2711 0.2389 0.1563 0.1153 0.0061 0.6258 0.9677 0.0118 0.0414 0.0735 0.2455 0.393 0.9641
RGDP 0.9879 0.9682 -0.5023 -
0.6692 -
0.7316 -
0.8111 0.6964 0.7639 <.0001 <.0001 <.0001 <.0001 <.0001 <.0001 <.0001 <.0001
NGDP 1.0000 0.9949 -0.4899 -
0.6627 -
0.7273 -
0.8032 0.7537 0.8283 <.0001 0.0001 <.0001 <.0001 <.0001 <.0001 <.0001
GDP Deflator 0.9949 1.0000 -0.4958 -
0.6664 -
0.7301 -
0.8002 0.7667 0.8480 <.0001 <.0001 <.0001 <.0001 <.0001 <.0001 <.0001
Federal Funds -
0.4899 -0.4958 1.0000 0.9204 0.8732 0.7797 -0.1734 -0.2464 0.0001 <.0001 <.0001 <.0001 <.0001 0.1972 0.0647
IR3 -
0.6627 -0.6664 0.9204 1.0000 0.9897 0.9401 -0.3715 -0.4444 <.0001 <.0001 <.0001 <.0001 <.0001 0.0044 0.0005
IR5 -
0.7273 -0.7301 0.8732 0.9897 1.0000 0.9781 -0.4190 -0.4990 <.0001 <.0001 <.0001 <.0001 <.0001 0.0012 <.0001
IR10 -
0.8032 -0.8002 0.7797 0.9401 0.9781 1.0000 -0.4618 -0.5478 <.0001 <.0001 <.0001 <.0001 <.0001 0.0003 <.0001 Clean-tech Investment 0.7537 0.7667 -0.1734
-0.3715
-0.4190
-0.4618 1.0000 0.9642
<.0001 <.0001 0.1972 0.0044 0.0012 0.0003 <.0001
Clean-tech Deal 0.8283 0.8480 -0.2464 -
0.4444 -
0.4990 -
0.5478 0.9642 1 <.0001 <.0001 0.0647 0.0005 <.0001 <.0001 <.0001
18
Shachmurove, E. and Shachmurove, Y. (2009) “Venture-Backed Capital Investment in the Clean-Technology Industry in the United States”, Clm.economía, 15, 81-104
Table 3: Regression Results for Number of Deals in the Clean-tech Industry
Total Clean-Tech Deals with the best regression of total clean tech investment Dependent Variable: Clean-tech Deal Number of Observations Used 57 Analysis of Variance Sum of Mean
Source DF Squares Square F Value Pr > F
Model 7 19176 2739.41
6 97.72 <.0001
Error 49 1373.59
5 28.0325
4 Corrected Total 56 20550
Root MSE 5.29458 R-Square 0.9332
Dependent Mean 22.7193 Adj R-Sq 0.9236
Coeff Var 23.3043
1 Parameter Estimates
Parame-ter Standard
Variable DF Estimate Error t Value Pr > |t|
Intercept 1 -522.129 105.453 -4.95 <.0001
Total Deals 1 0.03084 0.01059 2.91 0.0054
DATE 1 -5.85675 1.09446 -5.35 <.0001
Datesquared 1 0.03358 0.00755 4.45 <.0001
RealTotalInvestment 1 -2.07E-07 7.88E-08 -2.63 0.0115 RGDP 1 0.0278 0.01154 2.41 0.0198 IR3 1 -3.9901 1.14327 -3.49 0.001 CPI 1 2.20756 0.561 3.94 0.0003
19
Shachmurove, E. and Shachmurove, Y. (2009) “Venture-Backed Capital Investment in the Clean-Technology Industry in the United States”,
Clm.economía, 15, 81-104
Table 4: Regression Results for Venture-Backed Investment in the Clean-tech Industry
Dependent Variable: Real Clean-tech Industry Number of Observations Used 57 Analysis of Variance Sum of Mean Source DF Squares Square F Value Pr > F Model 6 1.14E+14 1.89E+13 49.43 <.0001 Error 50 1.91E+13 3.83E+11 Corrected Total 56 1.33E+14 Root MSE 618720 R-Square 0.8557 Dependent Mean 1237830 Adj R-Sq 0.8384 Coeff Var 49.98426 Parameter Estimates Parameter Standard Variable DF Estimate Error t Value Pr > |t| Intercept 1 -65611413 10328698 -6.35 <.0001 DATE 1 -697042 116710 -5.97 <.0001 Datesquared 1 2905.1122 878.5388 3.31 0.0018 RealTotalInvestment 1 0.00606 0.00252 2.4 0.0202 RGDP 1 4044.0335 1272.765 3.18 0.0025 IR3 1 -444213 133574 -3.33 0.0017
CPI 1 249108 60445 4.12 0.0001
20
Shachmurove, E. and Shachmurove, Y. (2009) “Venture-Backed Capital Investment in the Clean-Technology Industry in the United States”, Clm.economía, 15, 81-104
Figure 1: Carbon Dioxide Released in Million of Metric Tons, Spain and the United States
Carbon Dioxide Released
-
50.0
100.0
150.0
200.0
250.0
300.0
350.0
400.0
Year19
7119
7219
7319
7419
7519
7619
7719
7819
7919
8019
8119
8219
8319
8419
8519
8619
8719
8819
8919
9019
9119
9219
9319
9419
9519
9619
9719
9819
9920
0020
0120
0220
0320
0420
0520
06
Year
Spai
n
-
1 000.0
2 000.0
3 000.0
4 000.0
5 000.0
6 000.0
7 000.0
Uni
ted
Stat
es
Spain
United States
Source: International Energy Agency
Figure 2: Carbon Dioxide Released in Million of Metric Tons, World, OECD Total and the United States
Carbon Dioxite Release
-
5 000
10 000
15 000
20 000
25 000
30 000
35 000
Year
1972
1974
1976
1978
1980
1982
1984
1986
1988
1990
1992
1994
1996
1998
2000
2002
2004
2006
Year
Car
bon
Dio
xite
Rel
ease
WorldOECD TotalUnited States
Source: International Energy Agency
21
Shachmurove, E. and Shachmurove, Y. (2009) “Venture-Backed Capital Investment in the Clean-Technology Industry in the United States”,
Clm.economía, 15, 81-104
Figure 3: Venture-Backed Number of Deals in Clean-Tech
Cleantech Deals
0
10
20
30
40
50
60
70
80
90
1995
-1
1995
-4
1996
-3
1997
-2
1998
-1
1998
-4
1999
-3
2000
-2
2001
-1
2001
-4
2002
-3
2003
-2
2004
-1
2004
-4
2005
-3
2006
-2
2007
-1
2007
-4
2008
-3
Year
Clean
-tec
h Dea
ls
Figure 4: Venture-Backed Real Investment in Clean-Tech Industry
Cleantech Investment
0
200000000
400000000
600000000
800000000
1000000000
1200000000
1995
-1
1995
-4
1996
-3
1997
-2
1998
-1
1998
-4
1999
-3
2000
-2
2001
-1
2001
-4
2002
-3
2003
-2
2004
-1
2004
-4
2005
-3
2006
-2
2007
-1
2007
-4
2008
-3
Year
Cle
an-t
ech
Inve
stm
ent
22
Shachmurove, E. and Shachmurove, Y. (2009) “Venture-Backed Capital Investment in the Clean-Technology Industry in the United States”, Clm.economía, 15, 81-104
Figure 5: Venture Capital Real Investment in the Venture Capital Industry Stratified by Regions in the United States