Embed Size (px)
Citation preview
VentureSource
Europe -- 3Q 2014
VentureSource
2
The following report presents Dow Jones VentureSource’s quarterly findings for
European venture capital fundraising, investment, and liquidity. The included charts and
graphs offer a comprehensive view of the trends currently affecting the venture capital
market.
Highlights for 3Q 2014 include:
European venture capital fundraising declined from 2Q 2014 but managed to exceed 3Q 2013 levels;
Venture capital investment into European companies improved for the second consecutive quarter to
reach highest quarterly investment figure since 3Q 2001;
As merger and acquisition (M&A) activity stayed flat, exits via initial public offerings (IPOs) fell short of
2Q 2014 levels but remained comfortably above those of 3Q 2013.
To view Dow Jones VentureSource’s U.S. data for 3Q 2014 , please click here.

VentureSource
FUNDRAISING
3
3Q'11 4Q'11 1Q'12 2Q'12 3Q'12 4Q'12 1Q'13 2Q'13 3Q'13 4Q'13 1Q'14 2Q'14 3Q'14
Amount Raised (€B) € 0.42 € 2.17 € 0.98 € 1.18 € 0.76 € 1.19 € 0.76 € 1.03 € 0.50 € 1.81 € 0.69 € 1.04 € 0.60
Number of Funds 10 36 17 21 15 29 15 17 10 37 23 20 15
0
5
10
15
20
25
30
35
40
€ 0.00
€ 0.50
€ 1.00
€ 1.50
€ 2.00
€ 2.50 European VC Fundraising (2011 – 2014) Based on multiple closings
European Venture Capital Fundraising Declines in 3Q 2014
A total of 15 European venture capital funds accumulated €600 million during 3Q 2014, a decrease of 42% in
euros raised and 25% in the number of funds with closings from 2Q 2014.
Despite a decline in fundraising from 2Q 2014 levels, the number of funds with closings during 3Q 2014
increased by 50% compared with the same period last year while euros raised increased by 20%.
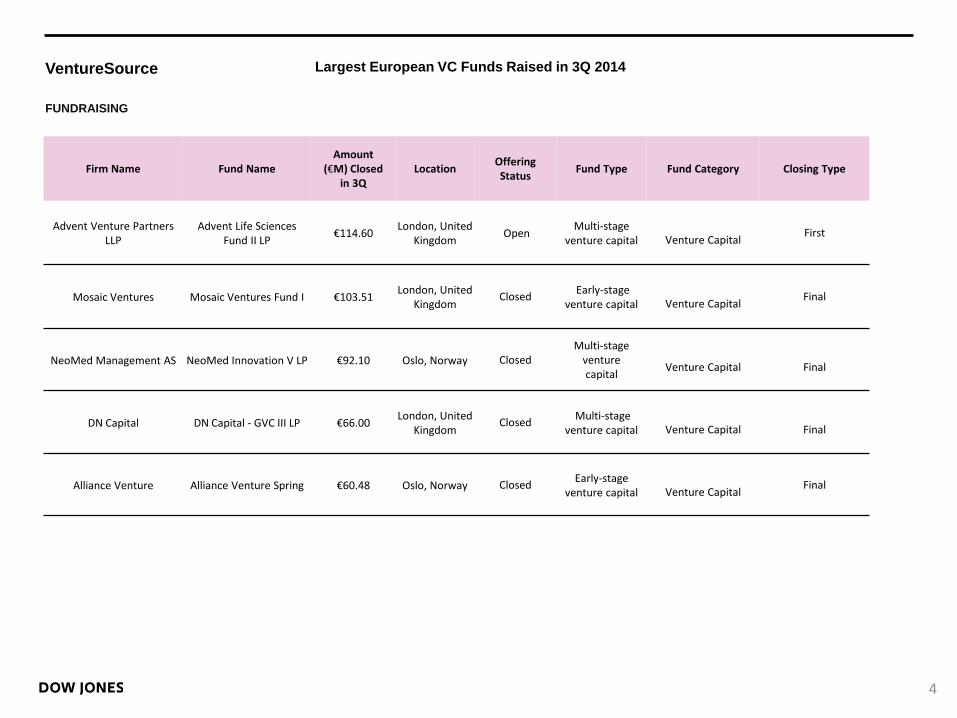
The largest fund of the quarter was Advent Venture Partners’ Life Sciences II LP fund, which raised €114.6
million, accounting for 19% of the total amount raised for 3Q 2014.
VentureSource
FUNDRAISING
4
Largest European VC Funds Raised in 3Q 2014
Firm Name Fund Name Amount
(€M) Closed in 3Q
Location Offering Status
Fund Type Fund Category Closing Type
Advent Venture Partners LLP
Advent Life Sciences Fund II LP
€114.60 London, United
Kingdom Open
Multi-stage venture capital
Venture Capital
First
Mosaic Ventures Mosaic Ventures Fund I €103.51 London, United
Kingdom Closed
Early-stage venture capital
Venture Capital
Final
NeoMed Management AS NeoMed Innovation V LP €92.10 Oslo, Norway Closed Multi-stage
venture capital
Venture Capital
Final
DN Capital DN Capital - GVC III LP €66.00 London, United
Kingdom Closed
Multi-stage venture capital
Venture Capital
Final
Alliance Venture Alliance Venture Spring €60.48 Oslo, Norway Closed Early-stage
venture capital
Venture Capital Final
VentureSource
FINANCING
5
Equity Financings into Europe –
based, VC-backed Companies
(2011 – 2014)
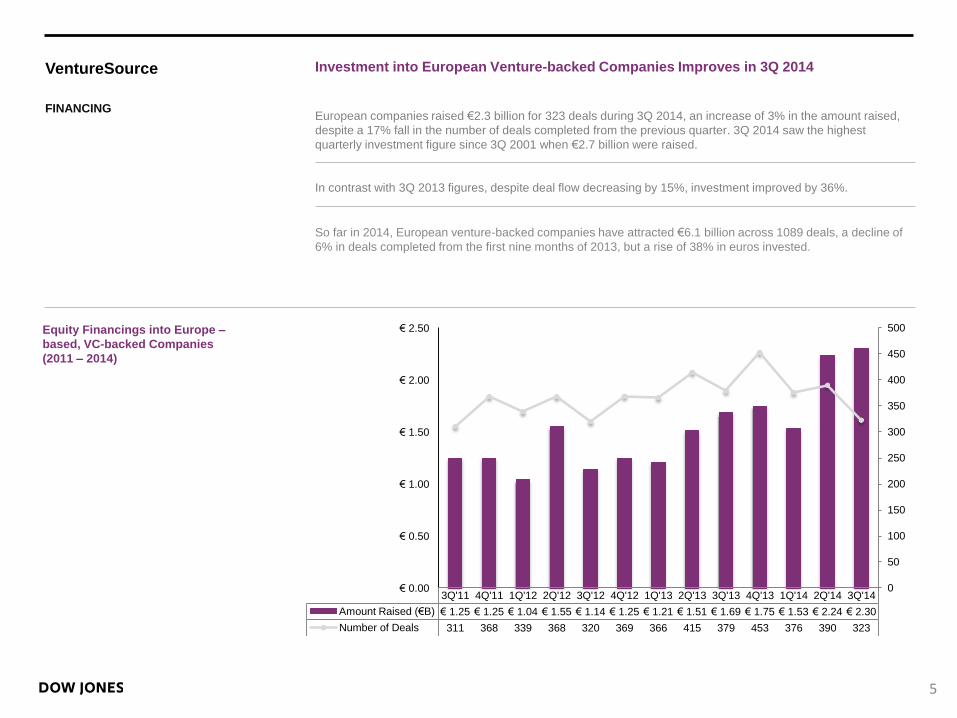
Investment into European Venture-backed Companies Improves in 3Q 2014
European companies raised €2.3 billion for 323 deals during 3Q 2014, an increase of 3% in the amount raised,
despite a 17% fall in the number of deals completed from the previous quarter. 3Q 2014 saw the highest
quarterly investment figure since 3Q 2001 when €2.7 billion were raised.
In contrast with 3Q 2013 figures, despite deal flow decreasing by 15%, investment improved by 36%.
So far in 2014, European venture-backed companies have attracted €6.1 billion across 1089 deals, a decline of
6% in deals completed from the first nine months of 2013, but a rise of 38% in euros invested.
3Q'11 4Q'11 1Q'12 2Q'12 3Q'12 4Q'12 1Q'13 2Q'13 3Q'13 4Q'13 1Q'14 2Q'14 3Q'14
Amount Raised (€B) € 1.25 € 1.25 € 1.04 € 1.55 € 1.14 € 1.25 € 1.21 € 1.51 € 1.69 € 1.75 € 1.53 € 2.24 € 2.30
Number of Deals 311 368 339 368 320 369 366 415 379 453 376 390 323
0
50
100
150
200
250
300
350
400
450
500
€ 0.00
€ 0.50
€ 1.00
€ 1.50
€ 2.00
€ 2.50
VentureSource
FINANCING
6
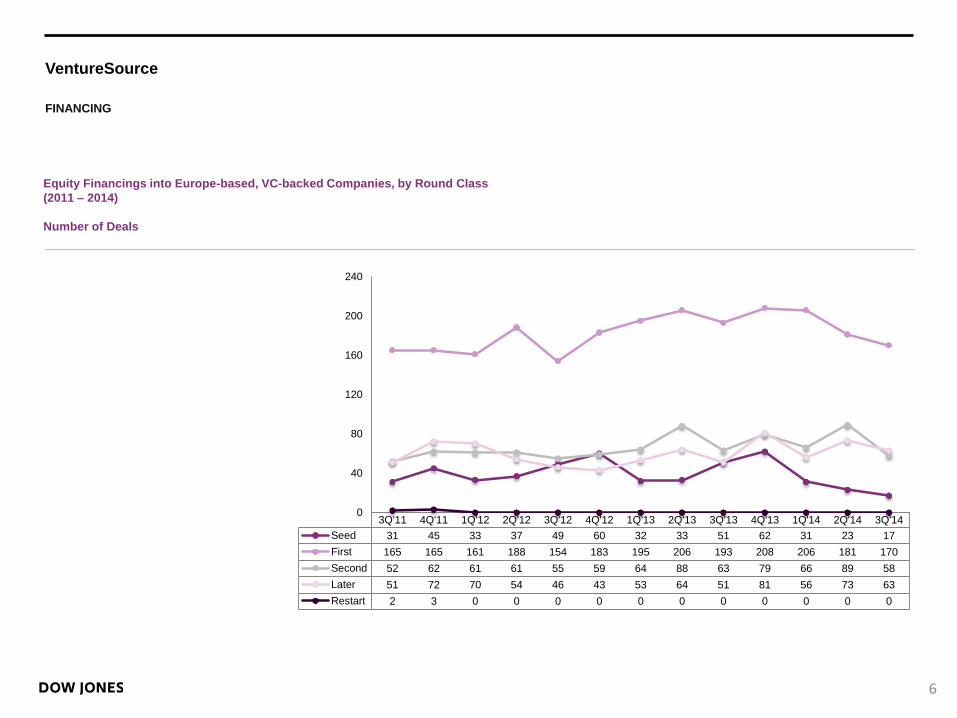
Equity Financings into Europe-based, VC-backed Companies, by Round Class
(2011 – 2014)
Number of Deals
3Q'11 4Q'11 1Q'12 2Q'12 3Q'12 4Q'12 1Q'13 2Q'13 3Q'13 4Q'13 1Q'14 2Q'14 3Q'14
Seed 31 45 33 37 49 60 32 33 51 62 31 23 17
First 165 165 161 188 154 183 195 206 193 208 206 181 170
Second 52 62 61 61 55 59 64 88 63 79 66 89 58
Later 51 72 70 54 46 43 53 64 51 81 56 73 63
Restart 2 3 0 0 0 0 0 0 0 0 0 0 0
0
40
80
120
160
200
240

VentureSource
FINANCING
7
3Q'11 4Q'11 1Q'12 2Q'12 3Q'12 4Q'12 1Q'13 2Q'13 3Q'13 4Q'13 1Q'14 2Q'14 3Q'14
Seed € 21 € 22 € 16 € 22 € 13 € 25 € 19 € 13 € 19 € 23 € 17 € 18 € 9
First € 574 € 420 € 298 € 523 € 286 € 445 € 399 € 414 € 461 € 359 € 432 € 554 € 501
Second € 214 € 355 € 263 € 257 € 300 € 300 € 239 € 481 € 696 € 388 € 318 € 463 € 202
Later € 326 € 603 € 448 € 673 € 530 € 449 € 542 € 577 € 456 € 924 € 642 € 1,031 € 884
Restart € 69 € 15 € 0 € 0 € 0 € 0 € 0 € 0 € 0 € 0 € 0 € 0 € 0
€ 0
€ 200
€ 400
€ 600
€ 800
€ 1,000
€ 1,200
Equity Financings into Europe-based, VC-backed Companies, by Round Class
(2011 – 2014)
Amount Raised (€M)
VentureSource
FINANCING
8
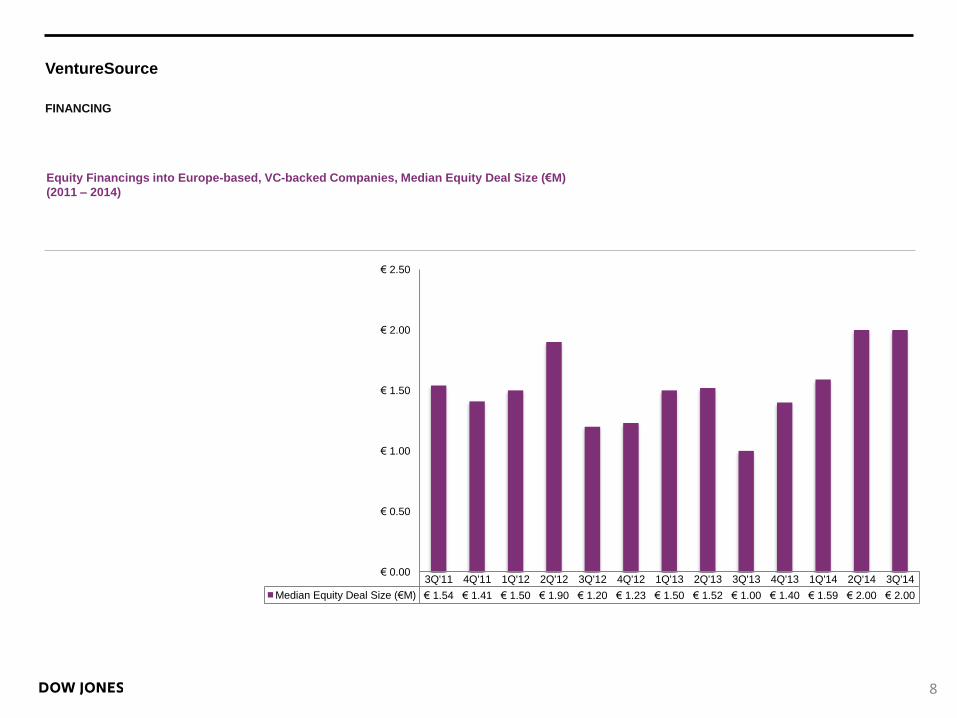
Equity Financings into Europe-based, VC-backed Companies, Median Equity Deal Size (€M)
(2011 – 2014)
3Q'11 4Q'11 1Q'12 2Q'12 3Q'12 4Q'12 1Q'13 2Q'13 3Q'13 4Q'13 1Q'14 2Q'14 3Q'14
Median Equity Deal Size (€M) € 1.54 € 1.41 € 1.50 € 1.90 € 1.20 € 1.23 € 1.50 € 1.52 € 1.00 € 1.40 € 1.59 € 2.00 € 2.00
€ 0.00
€ 0.50
€ 1.00
€ 1.50
€ 2.00
€ 2.50
VentureSource
FINANCING
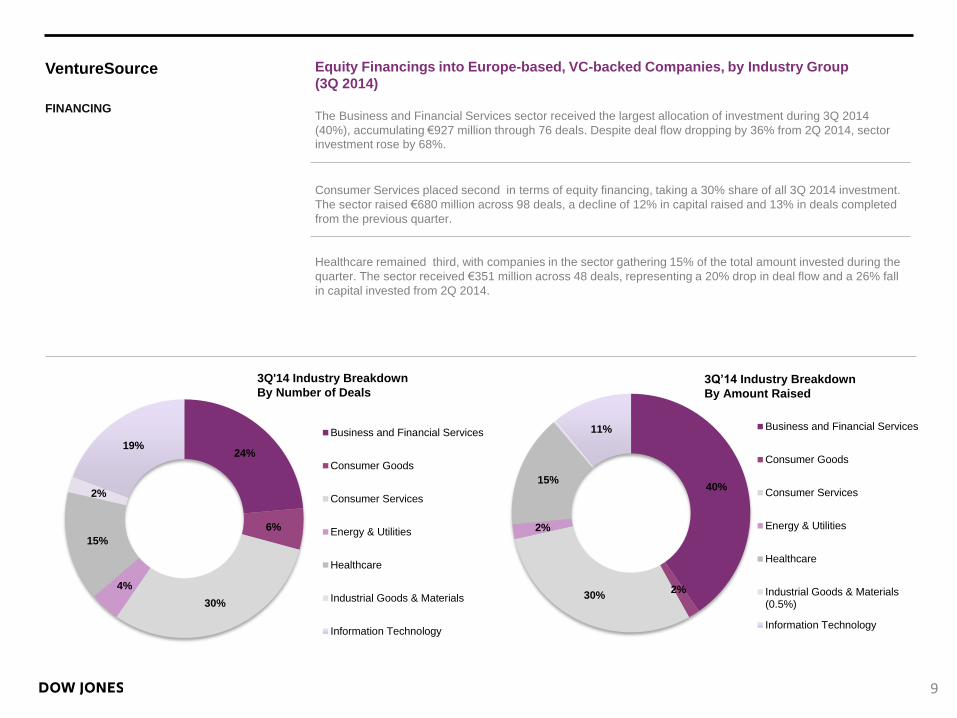
9
24%
6%
30%
4%
15%
2%
19%
Business and Financial Services
Consumer Goods
Consumer Services
Energy & Utilities
Healthcare
Industrial Goods & Materials
Information Technology
3Q'14 Industry Breakdown
By Number of Deals
Equity Financings into Europe-based, VC-backed Companies, by Industry Group
(3Q 2014)
The Business and Financial Services sector received the largest allocation of investment during 3Q 2014
(40%), accumulating €927 million through 76 deals. Despite deal flow dropping by 36% from 2Q 2014, sector
investment rose by 68%.
Consumer Services placed second in terms of equity financing, taking a 30% share of all 3Q 2014 investment.
The sector raised €680 million across 98 deals, a decline of 12% in capital raised and 13% in deals completed
from the previous quarter.
Healthcare remained third, with companies in the sector gathering 15% of the total amount invested during the
quarter. The sector received €351 million across 48 deals, representing a 20% drop in deal flow and a 26% fall
in capital invested from 2Q 2014.
40%
2% 30%
2%
15%
11% Business and Financial Services
Consumer Goods
Consumer Services
Energy & Utilities
Healthcare
Industrial Goods & Materials(0.5%)
Information Technology
3Q’14 Industry Breakdown
By Amount Raised
VentureSource
FINANCING
10
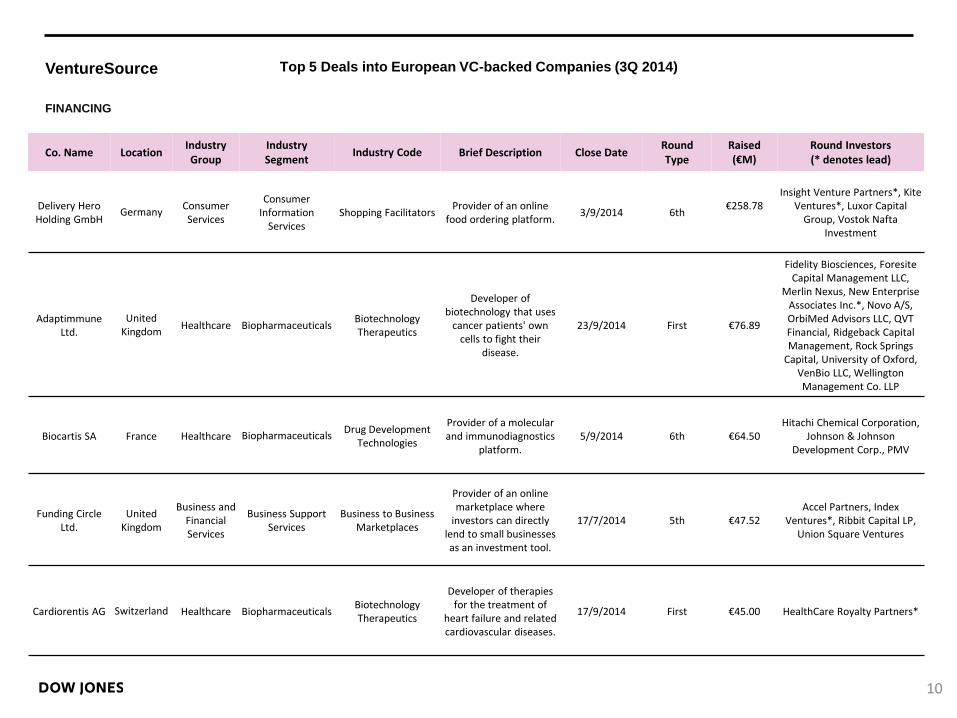
Co. Name Location Industry Group
Industry Segment
Industry Code Brief Description Close Date Round Type
Raised (€M)
Round Investors (* denotes lead)
Delivery Hero Holding GmbH
Germany Consumer Services
Consumer Information
Services Shopping Facilitators
Provider of an online food ordering platform.
3/9/2014 6th €258.78
Insight Venture Partners*, Kite Ventures*, Luxor Capital
Group, Vostok Nafta Investment
Adaptimmune Ltd.
United Kingdom
Healthcare Biopharmaceuticals Biotechnology Therapeutics
Developer of biotechnology that uses
cancer patients' own cells to fight their
disease.
23/9/2014 First €76.89
Fidelity Biosciences, Foresite Capital Management LLC,
Merlin Nexus, New Enterprise Associates Inc.*, Novo A/S, OrbiMed Advisors LLC, QVT Financial, Ridgeback Capital Management, Rock Springs
Capital, University of Oxford, VenBio LLC, Wellington Management Co. LLP
Biocartis SA France Healthcare Biopharmaceuticals Drug Development
Technologies
Provider of a molecular and immunodiagnostics
platform. 5/9/2014 6th €64.50
Hitachi Chemical Corporation, Johnson & Johnson
Development Corp., PMV
Funding Circle Ltd.
United Kingdom
Business and Financial Services
Business Support Services
Business to Business Marketplaces
Provider of an online marketplace where
investors can directly lend to small businesses as an investment tool.
17/7/2014 5th €47.52 Accel Partners, Index
Ventures*, Ribbit Capital LP, Union Square Ventures
Cardiorentis AG Switzerland Healthcare Biopharmaceuticals Biotechnology Therapeutics
Developer of therapies for the treatment of
heart failure and related cardiovascular diseases.
17/9/2014 First €45.00 HealthCare Royalty Partners*
Top 5 Deals into European VC-backed Companies (3Q 2014)

VentureSource
FINANCING
11
14
13
10
9
8
0
2
4
6
8
10
12
14
16
High-TechGruenderfonds
Management GmbH
German Startups GroupBerlin AG
Bpifrance Investment Sunstone Capital A/S Octopus Ventures Ltd.
Most Active Investors for Europe-based, VC-backed Companies by Deals Completed
(3Q 2014)
VentureSource
FINANCING
12
Amount Raised in 3Q 2014 by Country
(Top 4)
53%
23%
6%
5%
13%
Germany
United Kingdom
Switzerland
France
Rest of Europe
28%
18%
15%
7%
32% United Kingdom
Germany
France
Spain
Rest of Europe
Number of Deals in 3Q 2014 by Country
(Top 4)
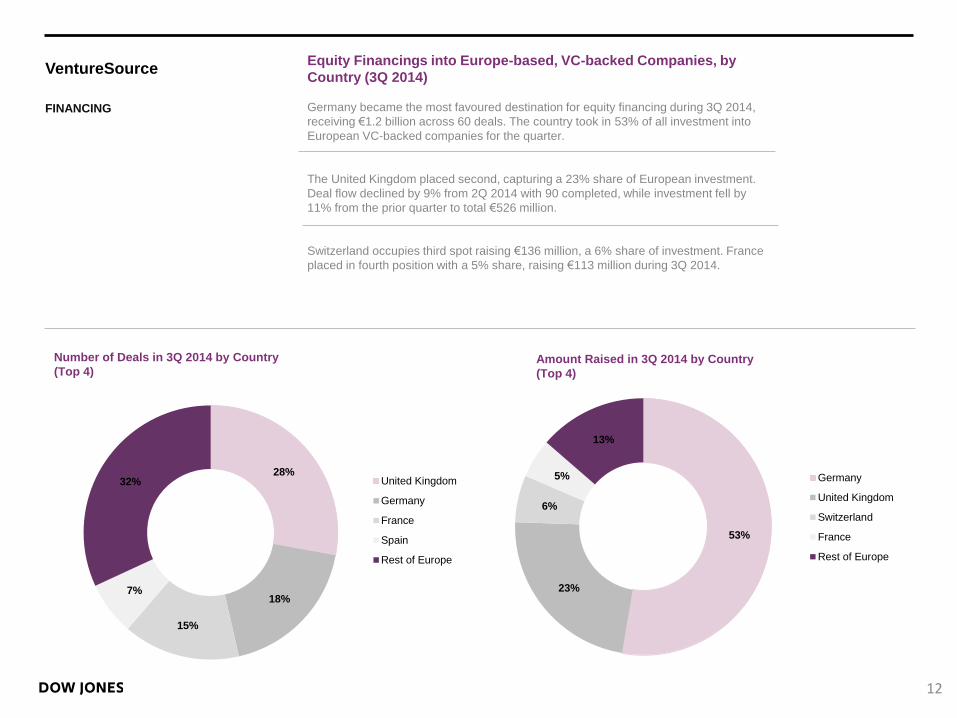
Equity Financings into Europe-based, VC-backed Companies, by
Country (3Q 2014)
Germany became the most favoured destination for equity financing during 3Q 2014,
receiving €1.2 billion across 60 deals. The country took in 53% of all investment into
European VC-backed companies for the quarter.
The United Kingdom placed second, capturing a 23% share of European investment.
Deal flow declined by 9% from 2Q 2014 with 90 completed, while investment fell by
11% from the prior quarter to total €526 million.
Switzerland occupies third spot raising €136 million, a 6% share of investment. France
placed in fourth position with a 5% share, raising €113 million during 3Q 2014.
VentureSource
LIQUIDITY
13
Exit Opportunities for European
VC – backed Companies
(2011 – 2014)
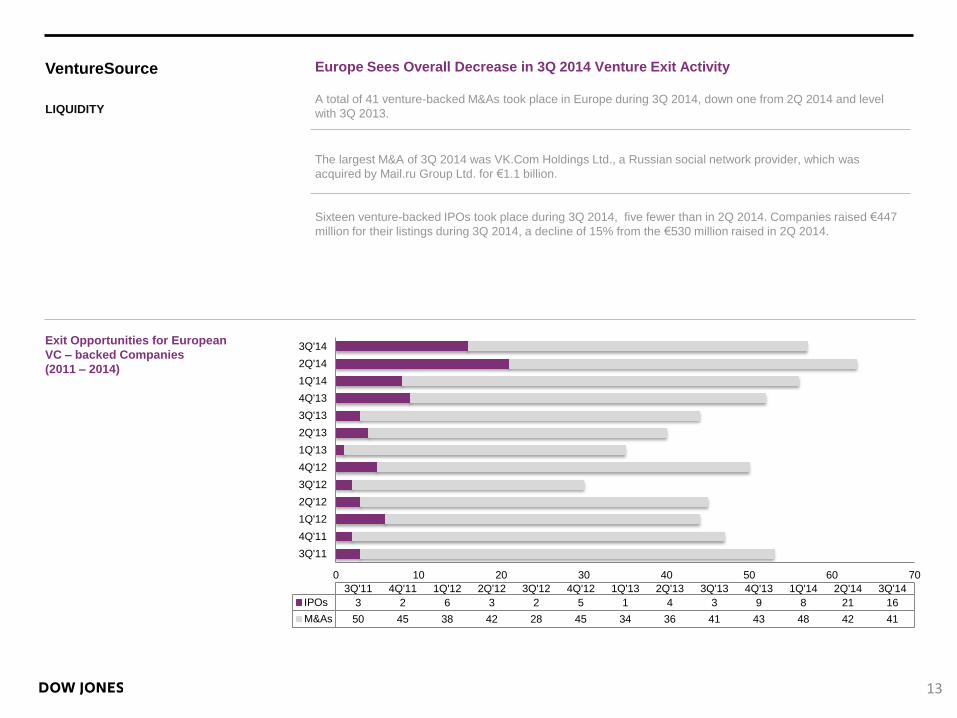
Europe Sees Overall Decrease in 3Q 2014 Venture Exit Activity
A total of 41 venture-backed M&As took place in Europe during 3Q 2014, down one from 2Q 2014 and level
with 3Q 2013.
The largest M&A of 3Q 2014 was VK.Com Holdings Ltd., a Russian social network provider, which was
acquired by Mail.ru Group Ltd. for €1.1 billion.
Sixteen venture-backed IPOs took place during 3Q 2014, five fewer than in 2Q 2014. Companies raised €447
million for their listings during 3Q 2014, a decline of 15% from the €530 million raised in 2Q 2014.
0 10 20 30 40 50 60 70
3Q'11
4Q'11
1Q'12
2Q'12
3Q'12
4Q'12
1Q'13
2Q'13
3Q'13
4Q'13
1Q'14
2Q'14
3Q'14
3Q'11 4Q'11 1Q'12 2Q'12 3Q'12 4Q'12 1Q'13 2Q'13 3Q'13 4Q'13 1Q'14 2Q'14 3Q'14
IPOs 3 2 6 3 2 5 1 4 3 9 8 21 16
M&As 50 45 38 42 28 45 34 36 41 43 48 42 41
VentureSource
LIQUIDITY
14
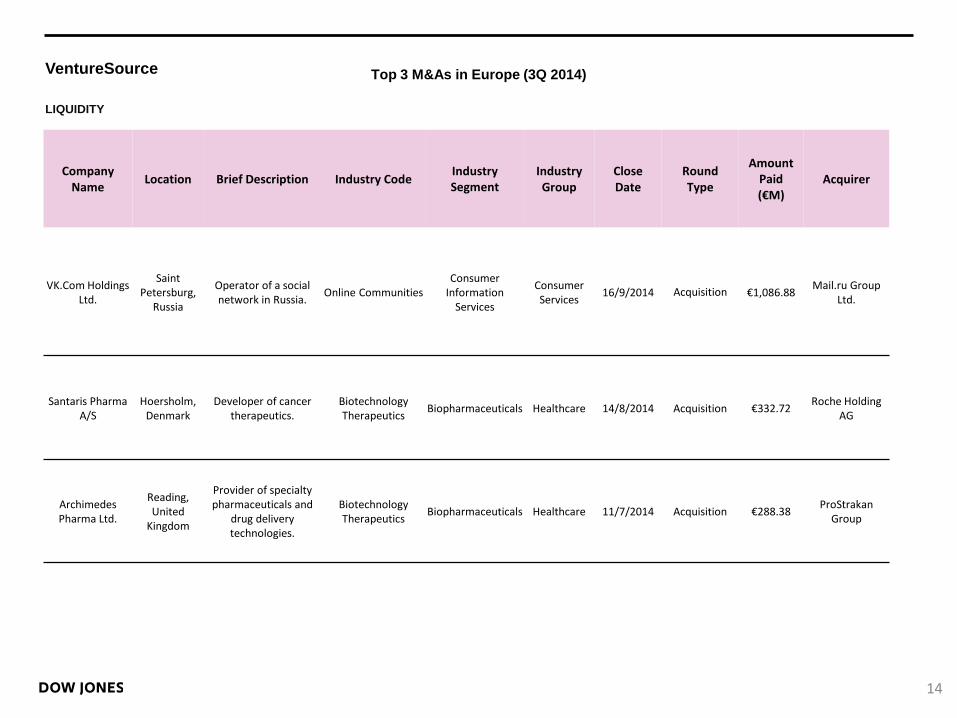
Top 3 M&As in Europe (3Q 2014)
Company Name
Location Brief Description Industry Code Industry Segment
Industry Group
Close Date
Round Type
Amount Paid (€M)
Acquirer
VK.Com Holdings Ltd.
Saint Petersburg,
Russia
Operator of a social network in Russia.
Online Communities Consumer
Information Services
Consumer Services
16/9/2014 Acquisition €1,086.88 Mail.ru Group
Ltd.
Santaris Pharma A/S
Hoersholm, Denmark
Developer of cancer therapeutics.
Biotechnology Therapeutics
Biopharmaceuticals Healthcare 14/8/2014 Acquisition €332.72 Roche Holding
AG
Archimedes Pharma Ltd.
Reading, United
Kingdom
Provider of specialty pharmaceuticals and
drug delivery technologies.
Biotechnology Therapeutics
Biopharmaceuticals Healthcare 11/7/2014 Acquisition €288.38 ProStrakan
Group
VentureSource
LIQUIDITY
15
European VC-backed IPO Activity
(2011 - 2014)
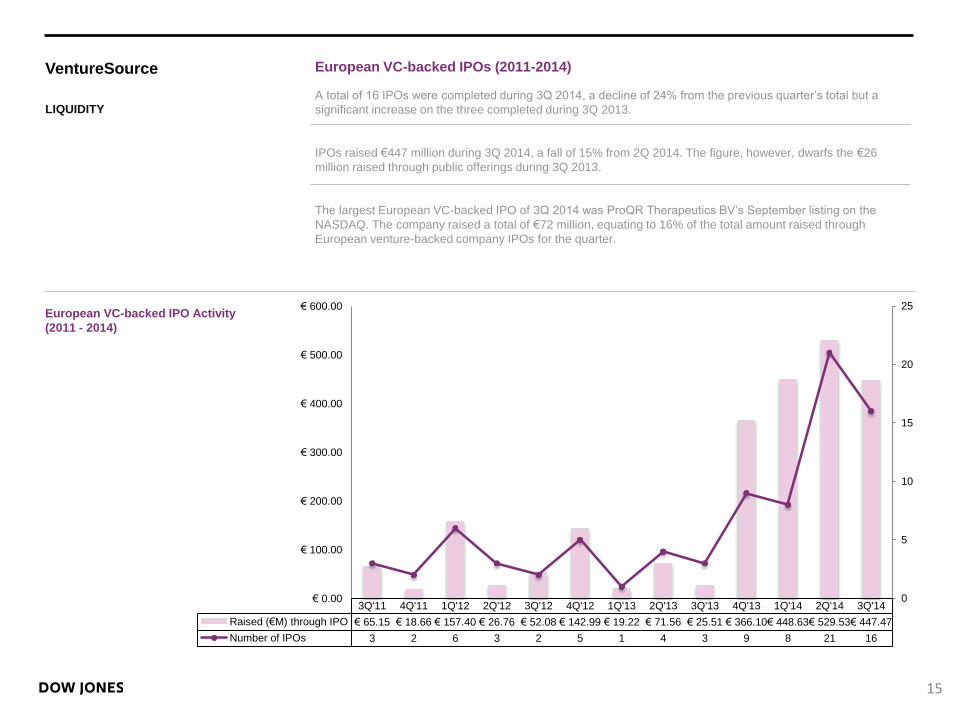
European VC-backed IPOs (2011-2014)
A total of 16 IPOs were completed during 3Q 2014, a decline of 24% from the previous quarter’s total but a
significant increase on the three completed during 3Q 2013.
IPOs raised €447 million during 3Q 2014, a fall of 15% from 2Q 2014. The figure, however, dwarfs the €26
million raised through public offerings during 3Q 2013.
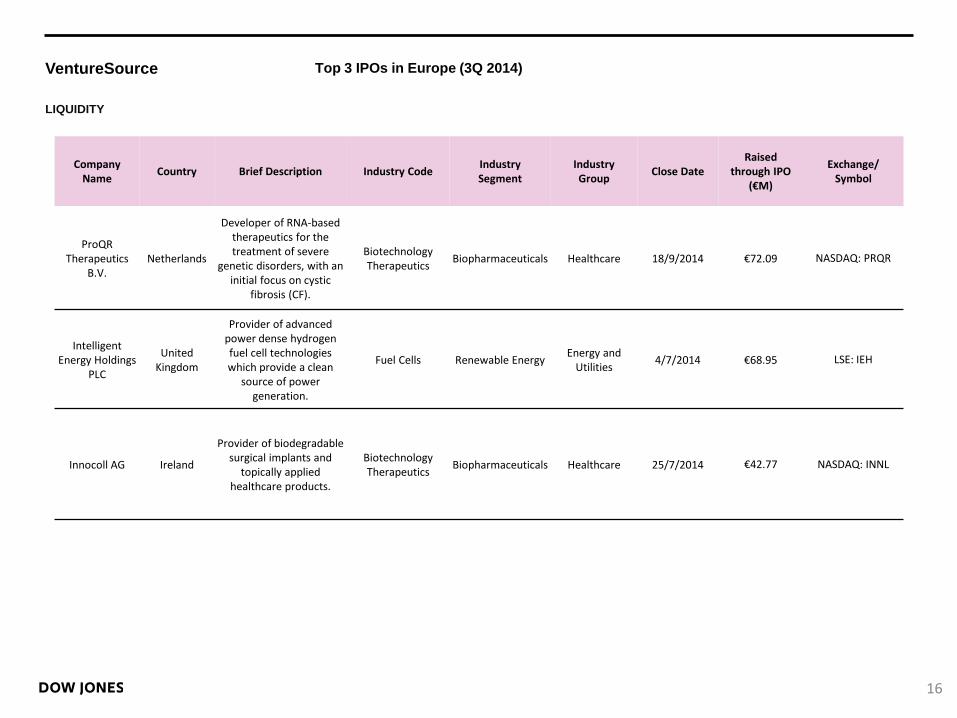
The largest European VC-backed IPO of 3Q 2014 was ProQR Therapeutics BV’s September listing on the
NASDAQ. The company raised a total of €72 million, equating to 16% of the total amount raised through
European venture-backed company IPOs for the quarter.
3Q'11 4Q'11 1Q'12 2Q'12 3Q'12 4Q'12 1Q'13 2Q'13 3Q'13 4Q'13 1Q'14 2Q'14 3Q'14
Raised (€M) through IPO € 65.15 € 18.66 € 157.40 € 26.76 € 52.08 € 142.99 € 19.22 € 71.56 € 25.51 € 366.10 € 448.63 € 529.53 € 447.47
Number of IPOs 3 2 6 3 2 5 1 4 3 9 8 21 16
0
5
10
15
20
25
€ 0.00
€ 100.00
€ 200.00
€ 300.00
€ 400.00
€ 500.00
€ 600.00
VentureSource
LIQUIDITY
16
Company Name
Country Brief Description Industry Code Industry Segment
Industry Group
Close Date Raised
through IPO (€M)
Exchange/ Symbol
ProQR Therapeutics
B.V. Netherlands
Developer of RNA-based therapeutics for the treatment of severe
genetic disorders, with an initial focus on cystic
fibrosis (CF).
Biotechnology Therapeutics
Biopharmaceuticals Healthcare 18/9/2014 €72.09 NASDAQ: PRQR
Intelligent Energy Holdings
PLC
United Kingdom
Provider of advanced power dense hydrogen fuel cell technologies which provide a clean
source of power generation.
Fuel Cells Renewable Energy Energy and
Utilities 4/7/2014 €68.95 LSE: IEH
Innocoll AG Ireland
Provider of biodegradable surgical implants and
topically applied healthcare products.
Biotechnology Therapeutics
Biopharmaceuticals Healthcare 25/7/2014 €42.77 NASDAQ: INNL
Top 3 IPOs in Europe (3Q 2014)
VentureSource
ABOUT US
Dow Jones VentureSource helps venture capitalists, corporate development executives, investment bankers and service providers find deal and partnership opportunities, perform comprehensive due diligence and examine trends in venture capital investment, fund-raising, and liquidity. It provides accurate, comprehensive data on venture-backed companies – including their investors and executives – in every region, industry and stage of development throughout the world. The investment figures included in this release are based on aggregate findings of Dow Jones' proprietary research and are contained in VentureSource. This data was collected through surveys of professional firms, interviews with company executives, and from secondary sources. These venture capital statistics cover equity investments into early stage, innovative companies and do not include companies receiving funding solely from corporate, individual, and/or government investors. Figures contained throughout the report current at time of editorial but are subject to change without notice. No statement herein is to be construed as a recommendation to buy or sell securities or to provide investment advice.
About Dow Jones
Dow Jones & Company is a global provider of news and business information, delivering content to consumers and organizations via newspapers, Web sites, apps, video, newsletters, magazines, proprietary databases, conferences, and radio. Dow Jones has produced unrivalled quality content for over 120 years and today has one of the world’s largest news-gathering operations with nearly 2,000 journalists in more than 80 bureaus, including The Wall Street Journal, America’s largest newspaper by paid circulation. Other premier brands include Barron’s, MarketWatch, DJX and Factiva. Dow Jones publishes in 13 languages and distributes content in 28 languages, combining technology with news and data to support business decision making. The company pioneered the first successful paid online news site and its industry leading innovation enables it to serve customers wherever they may be, via the Web, mobile devices, Internet-connected televisions, and tablets.
MEDIA CONTACT:
Hannah Syrocki
44 (0)20 7573 4059
17