Embed Size (px)
Citation preview

Vertex Reconstructing Neural Networks at the ZEUS
Central Tracking Detector
FermiLab, October 2000
Erez Etzion1, Gideon Dror2, David Horn1, Halina Abramowicz1
1. Tel-Aviv University, Tel Aviv, Israel.
2. The Academic College of Tel-Aviv-Yaffo, Tel Aviv, Israel.
Vertex Reconstruction FermiLab, October 2000
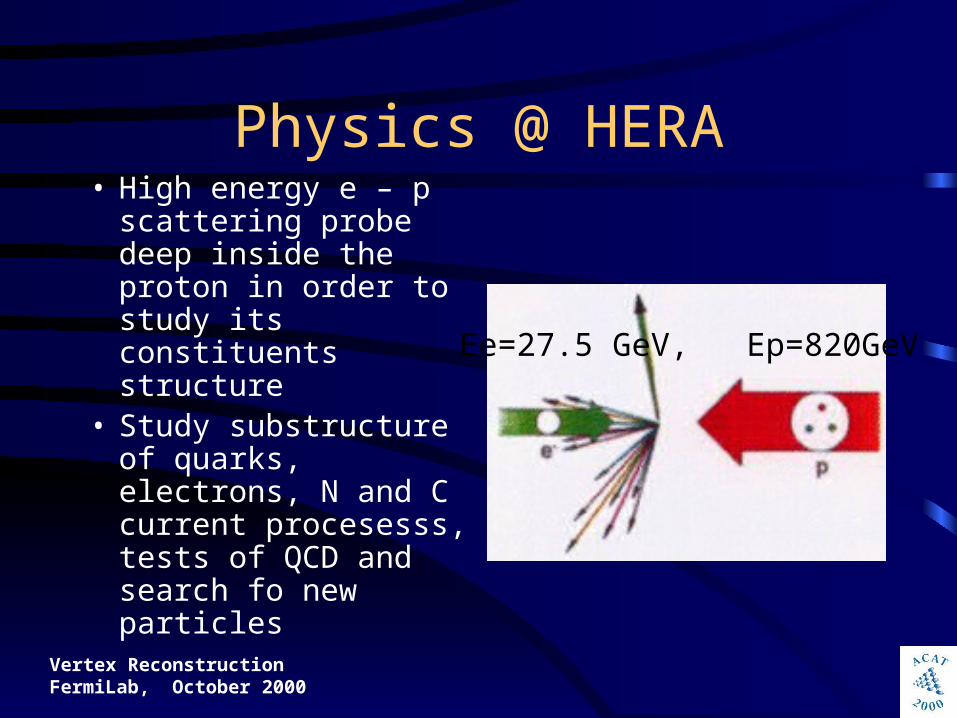
Physics @ HERA• High energy e – p
scattering probe deep inside the proton in order to study its constituents structure
• Study substructure of quarks, electrons, N and C current procesesss, tests of QCD and search fo new particles
Ee=27.5 GeV, Ep=820GeV
Vertex Reconstruction FermiLab, October 2000
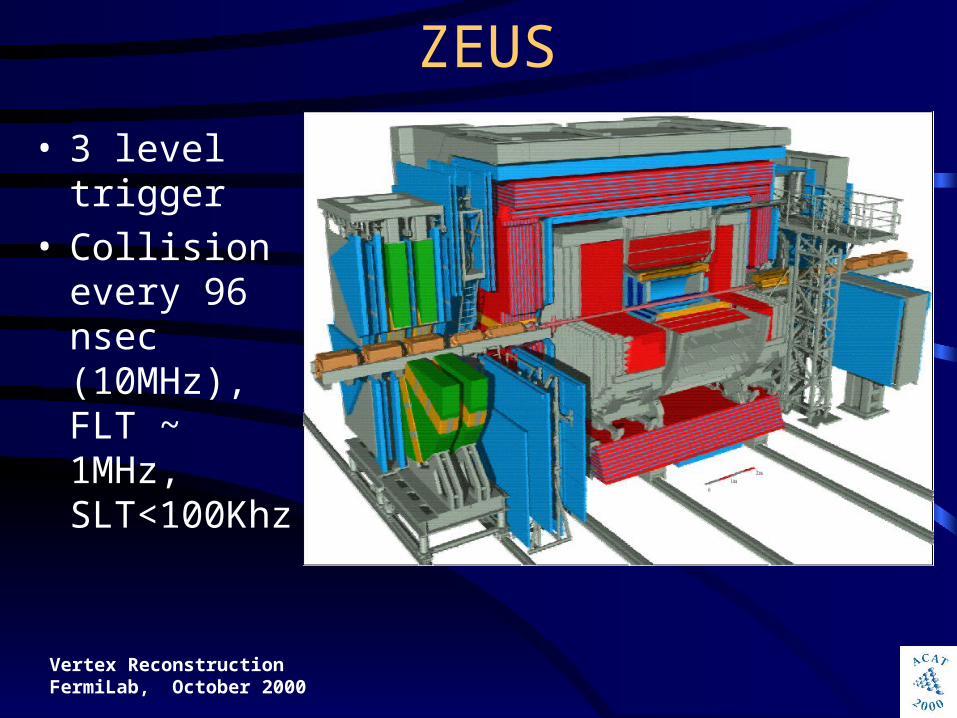
ZEUS
• 3 level trigger• Collision
every 96 nsec (10MHz), FLT ~ 1MHz, SLT<100Khz
Vertex Reconstruction FermiLab, October 2000
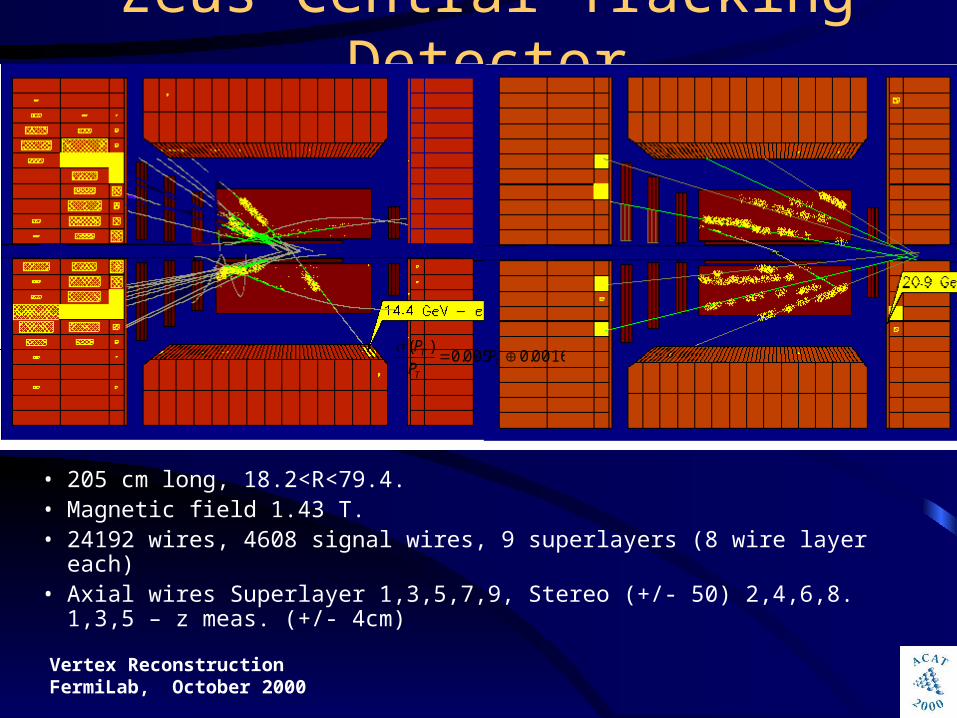
Zeus Central Tracking Detector
• 205 cm long, 18.2<R<79.4.• Magnetic field 1.43 T.• 24192 wires, 4608 signal wires, 9 superlayers (8 wire layer each)• Axial wires Superlayer 1,3,5,7,9, Stereo (+/- 50) 2,4,6,8. 1,3,5 – z meas. (+/-
4cm)
0016.0005.0)(
TT
T PP
P
Vertex Reconstruction FermiLab, October 2000
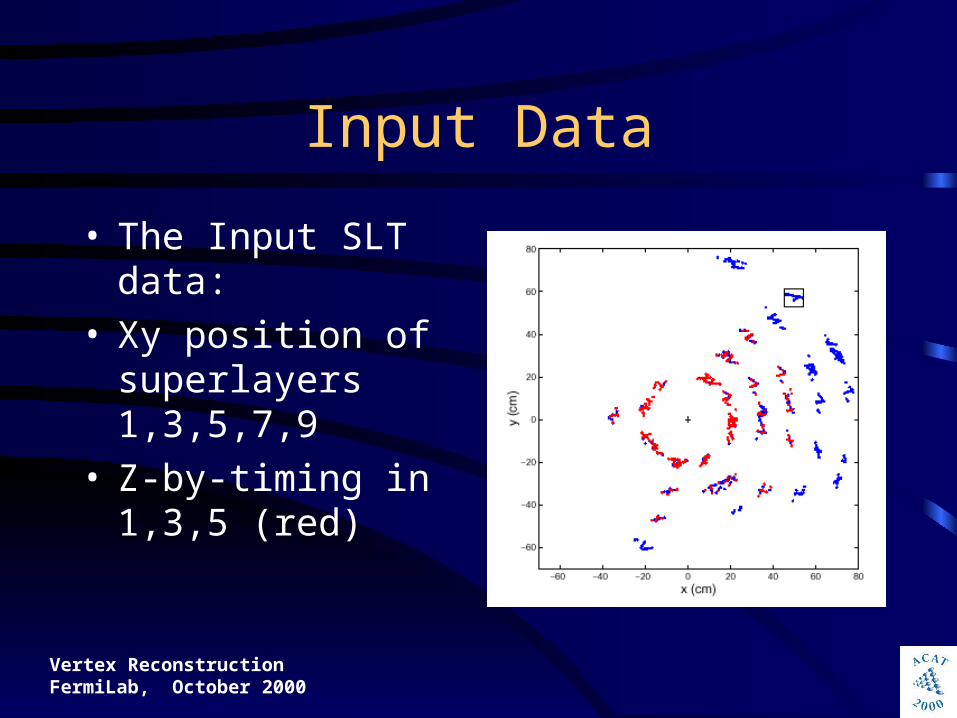
Input Data
• The Input SLT data:• Xy position of
superlayers 1,3,5,7,9• Z-by-timing in 1,3,5
(red)

Vertex Reconstruction FermiLab, October 2000
Ghost hits
Vertex Reconstruction FermiLab, October 2000
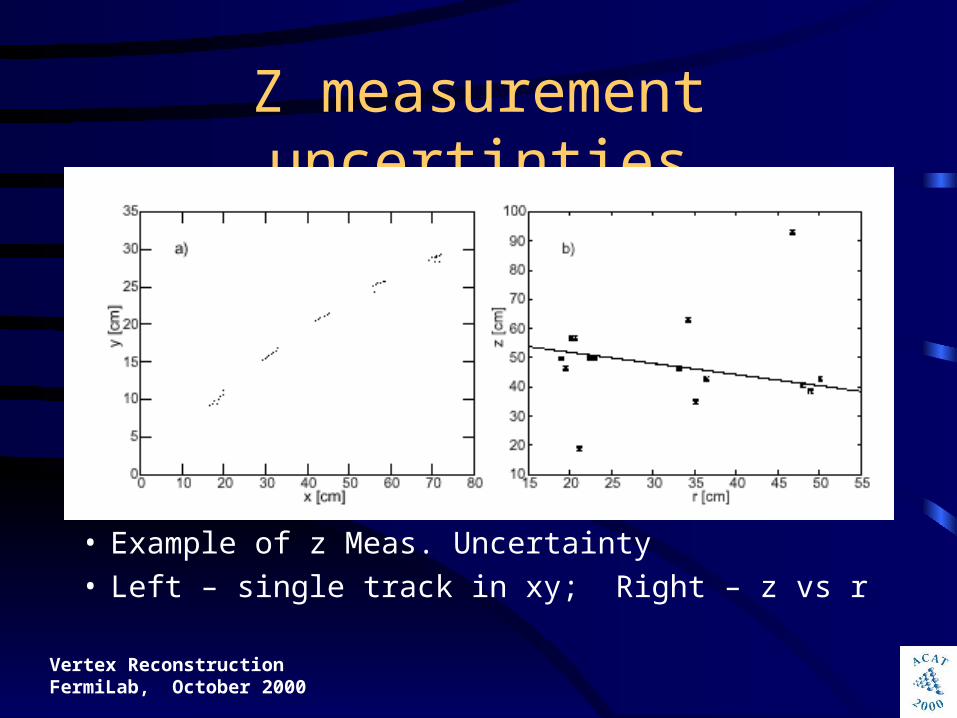
Z measurement uncertinties
• Example of z Meas. Uncertainty• Left – single track in xy; Right – z vs r

Vertex Reconstruction FermiLab, October 2000
The Network
• Based on step-wise changes in the data representation: input points ->local line segments->global arcs.
• Two parallel networks:
1. Construct arcs & correctly find some of the tracks
2. Evaluate z location of the interaction point

Vertex Reconstruction FermiLab, October 2000
Arc Identification Network• Follow the primary visual
system• Input 100000 neurons (the
retina like) cover 5000cm2
• Neuron fire when hitted in its receptive field. (xy)
• Second layer – line segment detector (XY).
• An active 2ed layer=line segment centered at XY with angle
otherwise
rrif
rrif
JVJgV PT
PT
xyXYxy
xyxyXYXY
0
215.01
25.01
,)( ,2,
Vertex Reconstruction FermiLab, October 2000
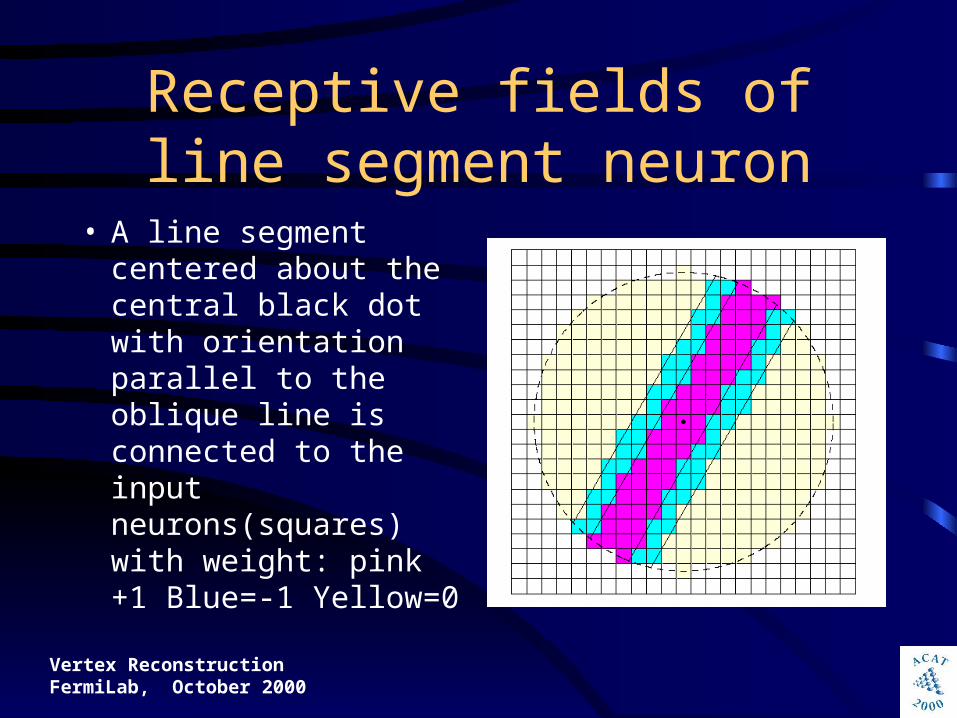
Receptive fields of line segment neuron
• A line segment centered about the central black dot with orientation parallel to the oblique line is connected to the input neurons(squares) with weight: pink +1 Blue=-1 Yellow=0

Vertex Reconstruction FermiLab, October 2000
Third layer Network• A track from the IP
project into circle in r-
• Transform the representation of local line segments into arc segments.
• A neuron is labled by I (curvature, slope and ring).
• Mapping = winner take all.

Vertex Reconstruction FermiLab, October 2000
Arc Identification last stage
• Neurons are global arc detectors.
• Detect tracks projected in z=0 plane.
• Each active neuron is equivalent in the xy plane to one arc in the plot.

Vertex Reconstruction FermiLab, October 2000
z Location Network• Similar architecture to the first net• A first layer input from the receptive field as its
corresponding neuron in the first net.• Get the mean of the z values of the points within the
receptieve field.• Second layer compute the mean value of the z of the first
layer.• The z averaging procedure is similary propagated to the
third layer.• Last layer evaluate the z value of the origin of each arc
identified by the first network by simple linear extrapolation.
• The final z estimate of the vertex is calculated by averaging the output of all active fourth layer neurons.

Vertex Reconstruction FermiLab, October 2000
z-location resolution

Vertex Reconstruction FermiLab, October 2000
Number of track found
Vertex Reconstruction FermiLab, October 2000
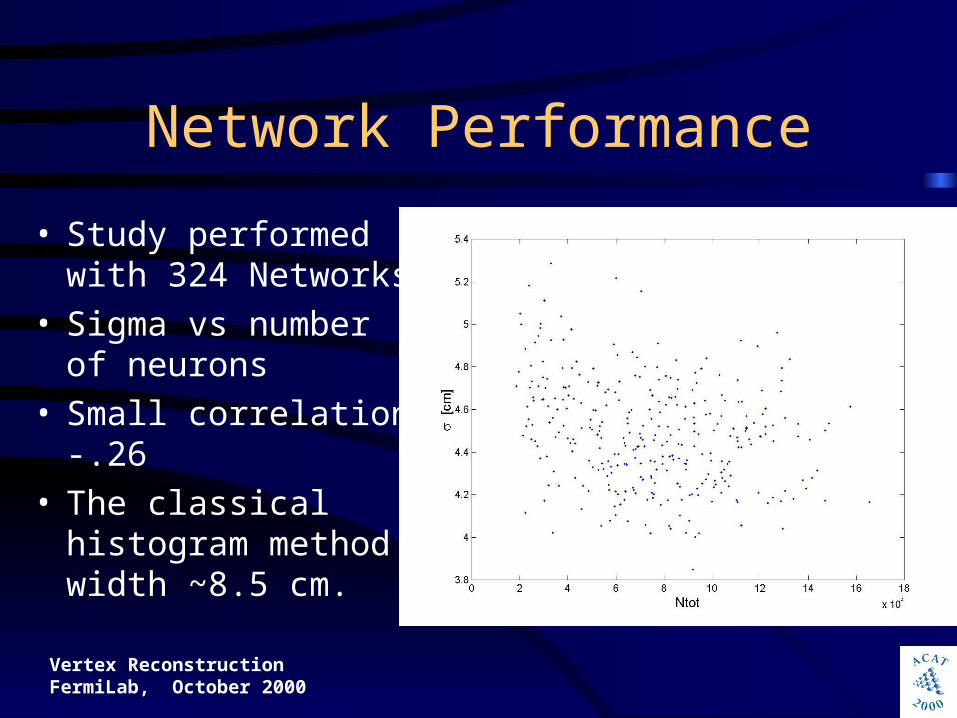
Network Performance
• Study performed with 324 Networks
• Sigma vs number of neurons
• Small correlation -.26• The classical
histogram method width ~8.5 cm.

Vertex Reconstruction FermiLab, October 2000
Network Performance (2)
• The network output width as a function of N1 and N2
• N1=# neurons in the first layer
• N2=#neurons in the third layer

Vertex Reconstruction FermiLab, October 2000
New developments and cross-checks
• Form lateral connection between 1st layer, which enabled us to reduce threshold still with good signal to noise - > reduce network size.
• Study network size –> x10 reduction. parameters: size and shape of receptive fields in 1st layer, resolution in k-theta space, range of k-values (loosing tracks with r<45 cm)

Vertex Reconstruction FermiLab, October 2000
Summary
• FF double NN for pattern identification, selecting a subset of which is simple to derive the answer.
• Fixed architecture – can be implemented in HW.• 1st NN partial tracking in xy.• The 2ed NN handles z-values of the trajectories
estimating the z arcs origin.• Performance is better than the “clasical method”.